the Creative Commons Attribution 4.0 License.
the Creative Commons Attribution 4.0 License.
 | 23 Mar 2020
Assessing Measurements of Pollution in the Troposphere (MOPITT) carbon monoxide retrievals over urban versus non-urban regions
Helen M. Worden
Merritt N. Deeter
David P. Edwards
Louisa K. Emmons
Sara Martínez-Alonso
Benjamin Gaubert
Rebecca R. Buchholz
Glenn S. Diskin
Russell R. Dickerson
Xinrong Ren
Yutaka Kondo
The Measurements of Pollution in the Troposphere (MOPITT) retrievals over urban regions have not been validated systematically, even though MOPITT observations are widely used to study CO over urban regions. Here we compare MOPITT products over urban and non-urban regions with aircraft measurements from the Deriving Information on Surface conditions from Column and Vertically Resolved Observations Relevant to Air Quality (DISCOVER-AQ – 2011–2014), Studies of Emissions and Atmospheric Composition, Clouds, and Climate Coupling by Regional Surveys (SEAC4RS – 2013), Air Chemistry Research In Asia (ARIAs – 2016), A-FORCE (2009, 2013), and Korea United States Air Quality (KORUS-AQ – 2016) campaigns. In general, MOPITT agrees reasonably well with the in situ profiles, over both urban and non-urban regions. Version 8 multispectral product (V8J) biases vary from −0.7 % to 0.0 % and version 8 thermal-infrared product (TIR) biases vary from 2.0 % to 3.5 %. The evaluation statistics of MOPITT V8J and V8T over non-urban regions are better than those over urban regions with smaller biases and higher correlation coefficients. We find that the agreement of MOPITT V8J and V8T with aircraft measurements at high CO concentrations is not as good as that at low CO concentrations, although CO variability may tend to exaggerate retrieval biases in heavily polluted scenes. We test the sensitivities of the agreements between MOPITT and in situ profiles to assumptions and data filters applied during the comparisons of MOPITT retrievals and in situ profiles. The results at the surface layer are insensitive to the model-based profile extension (required due to aircraft altitude limitations), whereas the results at levels with limited aircraft observations (e.g., the 600 hPa layer) are more sensitive to the model-based profile extension. The results are insensitive to the maximum allowed time difference criterion for co-location (12, 6, 3, and 1 h) and are generally insensitive to the radius for co-location, except for the case where the radius is small (25 km), and hence few MOPITT retrievals are included in the comparison. Daytime MOPITT products have smaller overall biases than nighttime MOPITT products when comparing both MOPITT daytime and nighttime retrievals to the daytime aircraft observations. However, it would be premature to draw conclusions on the performance of MOPITT nighttime retrievals without nighttime aircraft observations. Applying signal-to-noise ratio (SNR) filters does not necessarily improve the overall agreement between MOPITT retrievals and in situ profiles, likely due to the reduced number of MOPITT retrievals for comparison. Comparisons of MOPITT retrievals and in situ profiles over complex urban or polluted regimes are inherently challenging due to spatial and temporal variabilities of CO within MOPITT retrieval pixels (i.e., footprints). We demonstrate that some of the errors are due to CO representativeness with these sensitivity tests, but further quantification of representativeness errors due to CO variability within the MOPITT footprint will require future work.
- Article
(4345 KB) - Full-text XML
-
Supplement
(1542 KB) - BibTeX
- EndNote


Observations from the Measurements of Pollution in the Troposphere (MOPITT) instrument onboard the NASA Terra satellite have been used for retrieving total column amounts and volume mixing ratio (VMR) profiles of carbon monoxide (CO) using both thermal-infrared (TIR) and near-infrared (NIR) measurements since March 2000. Besides the TIR-only and NIR-only products, the MOPITT multispectral TIR–NIR product is also provided, which has enhanced the sensitivity to near-surface CO (Deeter et al., 2011, 2013; Worden et al., 2010). Since the start of the mission, the MOPITT CO retrieval algorithm has been improved and enhanced continuously (Worden et al., 2014). For example, the Version 6 product improvements included the reduction in both a geolocation bias and a significant latitude-dependent retrieval bias in the upper troposphere (Deeter et al., 2014). In the Version 7 products, a new strategy for radiance bias correction and an improved method for calibrating MOPITT's NIR radiances were included (Deeter et al., 2017). For the most recently released MOPITT Version 8 products, enhancements include a new radiance bias correction method (Deeter et al., 2019). Meanwhile, the MOPITT products have been extensively evaluated and validated with in situ measurements, though this has been done primarily over non-urban areas (Deeter et al., 2010, 2012, 2013, 2014, 2016, 2017, 2019; Emmons et al., 2004, 2007, 2009). In addition, MOPITT products have also been compared with ground-based spectrometric column retrievals (e.g., Buchholz et al., 2017; Hedelius et al., 2019). For the past 2 decades, MOPITT CO products have been widely used for various applications, including understanding atmospheric composition, evaluating atmospheric chemistry models, and constraining inverse analyses of CO emissions (e.g., Arellano et al., 2004, 2006, 2007; Chen et al., 2009; Edwards et al., 2006; Emmons et al., 2010; Fortems-Cheiney et al., 2011; Gaubert et al., 2016; Heald et al., 2004; Jiang et al., 2018; Kopacz et al., 2009, 2010; Kumar et al., 2012; Lamarque et al., 2012; Tang et al., 2018; Yurganov et al., 2005).
MOPITT products are particularly useful for monitoring and analyzing air pollution over urban regions because of the enhanced retrieval sensitivity to near-surface CO and the long-term record (e.g., Clerbaux et al., 2008; Girach and Nair, 2014; Jiang et al., 2015, 2018; Kar et al., 2010; Tang et al., 2019; Worden et al., 2010; Li and Liu, 2011; He et al., 2013; Aliyu and Botai, 2018; Kanakidou et al., 2011). However, the performance of MOPITT retrievals over urban regions has not yet been validated systematically. Furthermore, in situ observations of CO profiles over urban areas are limited, especially in Asia. Indeed, along with the non-urban validation exercises mentioned above, development and validation of the MOPITT retrieval algorithm relies heavily on in situ measurements over remote regions, such as measurements from the HIAPER (High‐Performance Instrumented Airborne Platform for Environmental Research) Pole-to-Pole Observations (HIPPO) and the Atmospheric Tomography Mission (ATom) campaigns (e.g., Deeter et al., 2013, 2014, 2017, 2019). Comparisons of MOPITT products to measurements with aircraft profiles during the Korea United States Air Quality (KORUS-AQ) campaign over South Korea have only recently been made in Deeter et al. (2019), but without explicitly analyzing MOPITT performance over urban regions.
In this study, we compare MOPITT Version 8 and 7 products with aircraft profiles made over urban regions (as well as non-urban regions) from campaigns including Deriving Information on Surface conditions from Column and Vertically Resolved Observations Relevant to Air Quality (DISCOVER-AQ); the Studies of Emissions and Atmospheric Composition, Clouds, and Climate Coupling by Regional Surveys (SEAC4RS); the Air Chemistry Research In Asia (ARIAs); the Aerosol Radiative Forcing in East Asia (A-FORCE); and KORUS-AQ. These campaigns are described in Sect. 2, along with a brief description of the MOPITT products and the methodology used. We present the comparisons of MOPITT products to aircraft profiles and discuss the impacts of key factors in the retrieval process on the retrieval results in Sect. 3. In Sect. 4, we discuss the sensitivities of results to the assumptions and data filters made for aircraft–satellite comparisons not only in this study but also in previous evaluation studies of MOPITT and other satellite products. Section 5 gives the conclusions of the study.
2.1 MOPITT retrievals and products
MOPITT is a nadir-sounding satellite instrument flying on the NASA Terra satellite. It uses a gas filter correlation radiometer and measures radiance at both the TIR band near 4.7 µm and the NIR band near 2.3 µm. These observations have a spatial resolution of about 22 km×22 km with satellite overpass time at approximately 10:30 and 22:30 (local time). To determine a unique CO concentration profile from the MOPITT measured radiances, an optimal estimation-based retrieval algorithm and a fast radiative transfer model are used (Deeter et al., 2003; Edwards et al., 1999). The retrieved state vector (xrtv) for optimal estimation-based retrievals can be expressed as
where xa and xtrue are the a priori state vector and the true state vector, respectively. A (which has a size of 10×10) is the retrieval averaging kernel matrix (AK) that represents the sensitivity of retrieved profiles to actual profiles and ϵ is the random error vector. Note that CO quantities in the state vector are retrieved as log10(VMR).
We focus on validating the recently released Version 8 of the MOPITT TIR, NIR, and multispectral TIR–NIR products. We also include comparisons with the MOPITT Version 7 TIR, NIR, and multispectral TIR–NIR products in the Sect. 3.1 for reference. These two versions of MOPITT products were introduced in detail in Deeter et al. (2017, 2019).
2.2 Aircraft measurements used for comparisons
Aircraft-sampled profiles of CO concentrations during the DISCOVER-AQ, SEAC4RS, ARIAs, A-FORCE, and KORUS-AQ campaigns are used for comparisons with MOPITT-retrieved profiles. DISCOVER-AQ and SEAC4RS were conducted over the US, while ARIAs, A-FORCE, and KORUS-AQ were conducted over East Asia. Locations of the aircraft profiles from these campaigns are compared with the MODIS (Moderate Resolution Imaging Spectroradiometer) Terra and Aqua Land Cover Type Climate Modeling Grid Yearly Level 3 Version 6 Global product (MCD12C1 v006) (Friedl and Sulla-Menashe, 2015) to determine if a profile was sampled over an urban or non-urban region. Specifically, for each aircraft profile, a box centered over the location of the aircraft profile (determined by averaged latitude and longitude of aircraft observations in the profile) is selected. If the urban and built-up fraction in the box is larger than 10 %, the profile is considered to be an urban profile. Overall, for each campaign, the averaged aircraft profile over urban regions has higher CO concentrations compared to that over non-urban regions, especially near the surface (see Fig. S1 in the Supplement). Profiles during ARIAs, which are sampled over Hebei province in China, are exceptional, as the averaged profile over non-urban regions has higher CO concentrations especially near the surface, indicating high CO levels in the entire study region. We note that Hebei is one of the most heavily industrialized and polluted regions, and the difference in CO profiles is driven less by urban versus rural than by synoptic and mesoscale meteorology. In addition, Hebei is an arid region and subject to strong nocturnal inversions, so the surface CO can be very high. For aircraft profiles sampled during KORUS-AQ, the CO profiles over urban and non-urban regions are similar, even though the averaged profile over urban regions has slightly higher CO concentration near the surface. This is largely due to the fact that many of the non-urban aircraft profiles are sampled over the Taehwa forest site, which is impacted by CO transported from the nearby Seoul urban region. The urban regions often have different surface parameters (e.g., surface temperature and emissivity) and usually but not always have higher CO concentrations than non-urban regions. However, the surface parameters are unlikely to impact the ultimate quality of MOPITT retrieval products (Pan et al., 1998; Ho et al., 2005). The goal of this study is to understand if MOPITT retrievals are able to represent conditions over urban regions given sampling and cloud cover. In addition, the relatively large spatial and temporal variability of CO concentrations over urban regions makes the validation even more complex. Because of the complexity of urban regions and their connection with non-urban regions nearby, we also provide analysis at high CO concentrations regardless of land cover type. Note that the comparisons include the 600 hPa layer (usually in the free troposphere). It is possible that CO concentrations at this layer are transported from other regions that are not representative of urban regions. Even so, MOPITT retrievals at the 600 hPa layer are still impacted by the CO concentrations at other layers including the surface layer (Eq. 1). Therefore, the comparisons at 600 hPa is necessary.
The campaigns and profiles are summarized in the Table 1 and Fig. 1. During DISCOVER-AQ, SEAC4RS, and KORUS-AQ, CO concentrations were measured by the NASA Differential Absorption Carbon monOxide Measurement (DACOM), whereas during ARIAs and A-FORCE, CO concentrations were measured by Picarro G2401-m and Aero-Laser GmbH AL5002, respectively. Note that the primary goal of DISCOVER-AQ was to provide aircraft observation methodologies for satellite validation (e.g., Lamsal et al., 2014). There are 121 profiles over four urban regions from DISCOVER-AQ, making it particularly useful for the goal of this study. Because of this, our results are heavily driven by aircraft profiles from DISCOVER-AQ. Even though there are only two profiles sampled over urban regions, the A-FORCE campaign obtained 45 profiles in total sampled over East Asia during spring 2009, winter 2013, and summer 2013. The seasonal and spatial coverage of the dataset makes it representative of the region. The ARIAs campaign provides 19 profiles and three of these were sampled over Chinese urban regions. Few previous studies have validated MOPITT products over China (e.g., Hedelius et al., 2019), so aircraft profiles from ARIAs have also been included in this study.
Table 1in situ datasets of CO used for MOPITT products validation in this study.
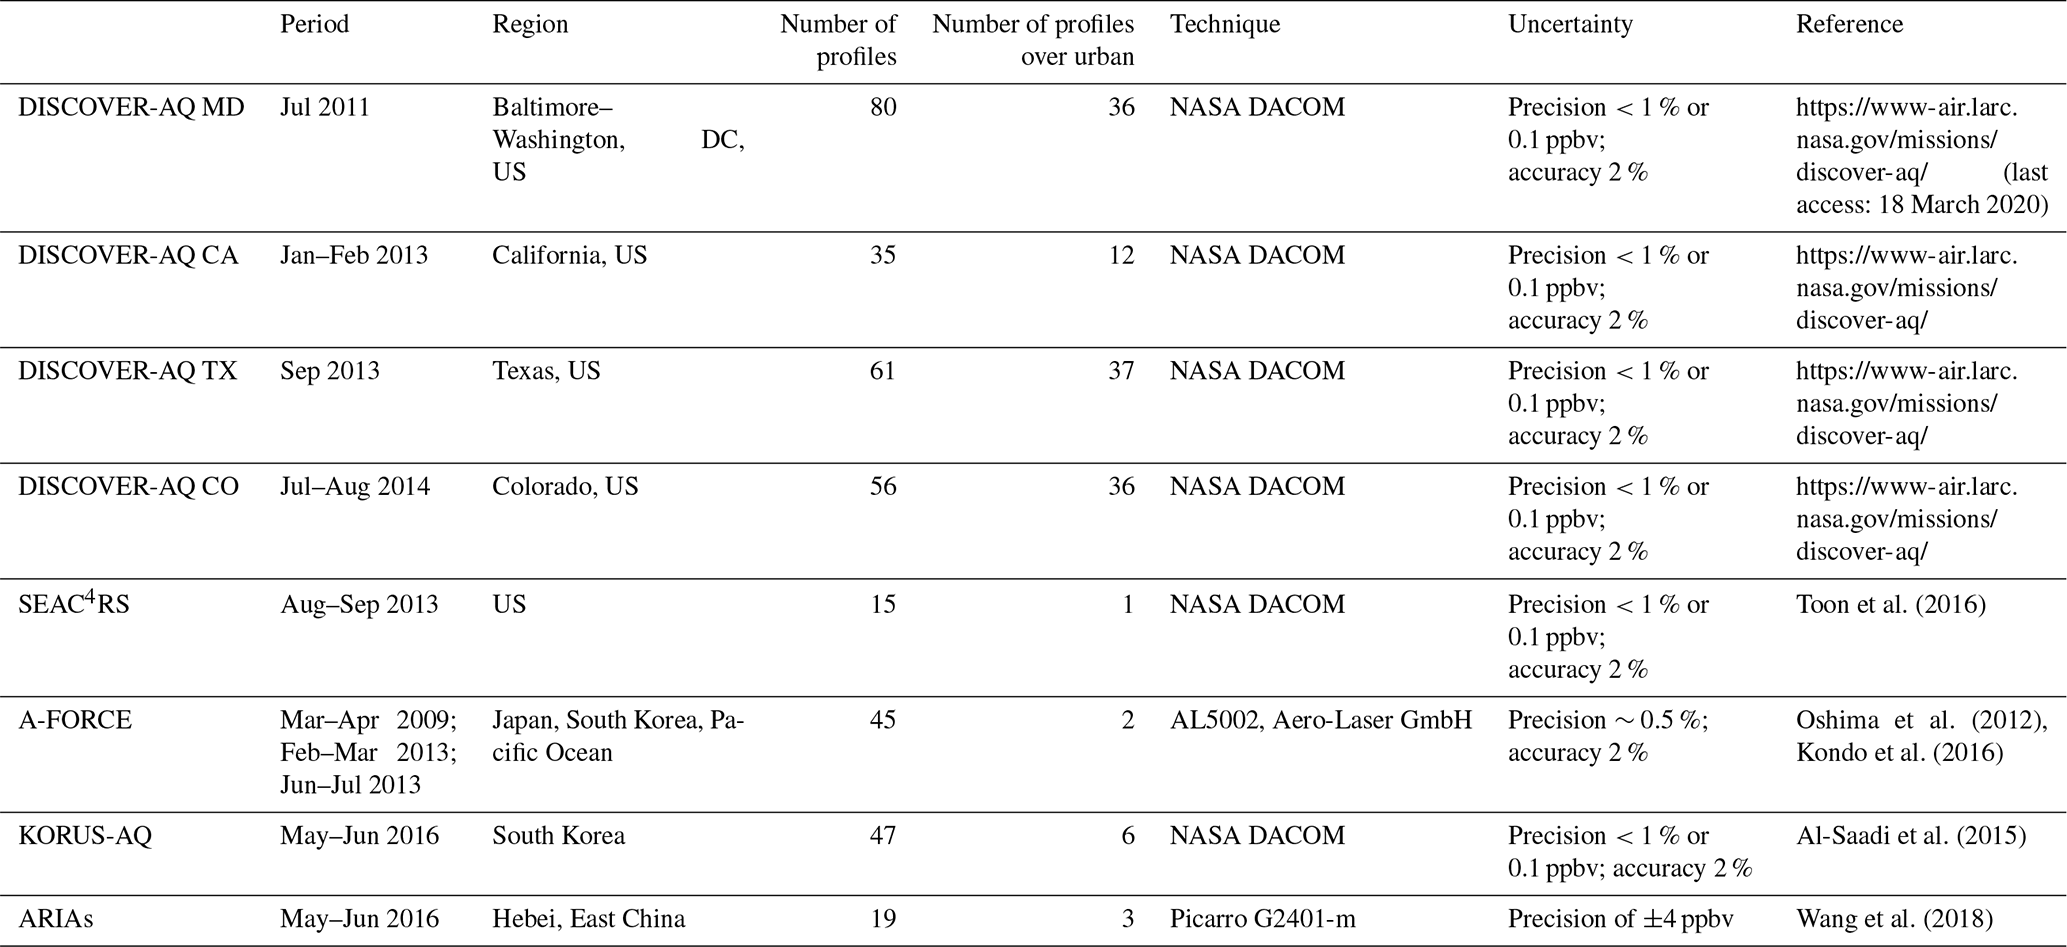
The CO scale used for SEAC4RS and DISCOVER-AQ MD, TX, and CA is WMO-CO-X2004, while the CO scale used for ARIAs and KORUS-AQ is WMO-CO-X2014A.
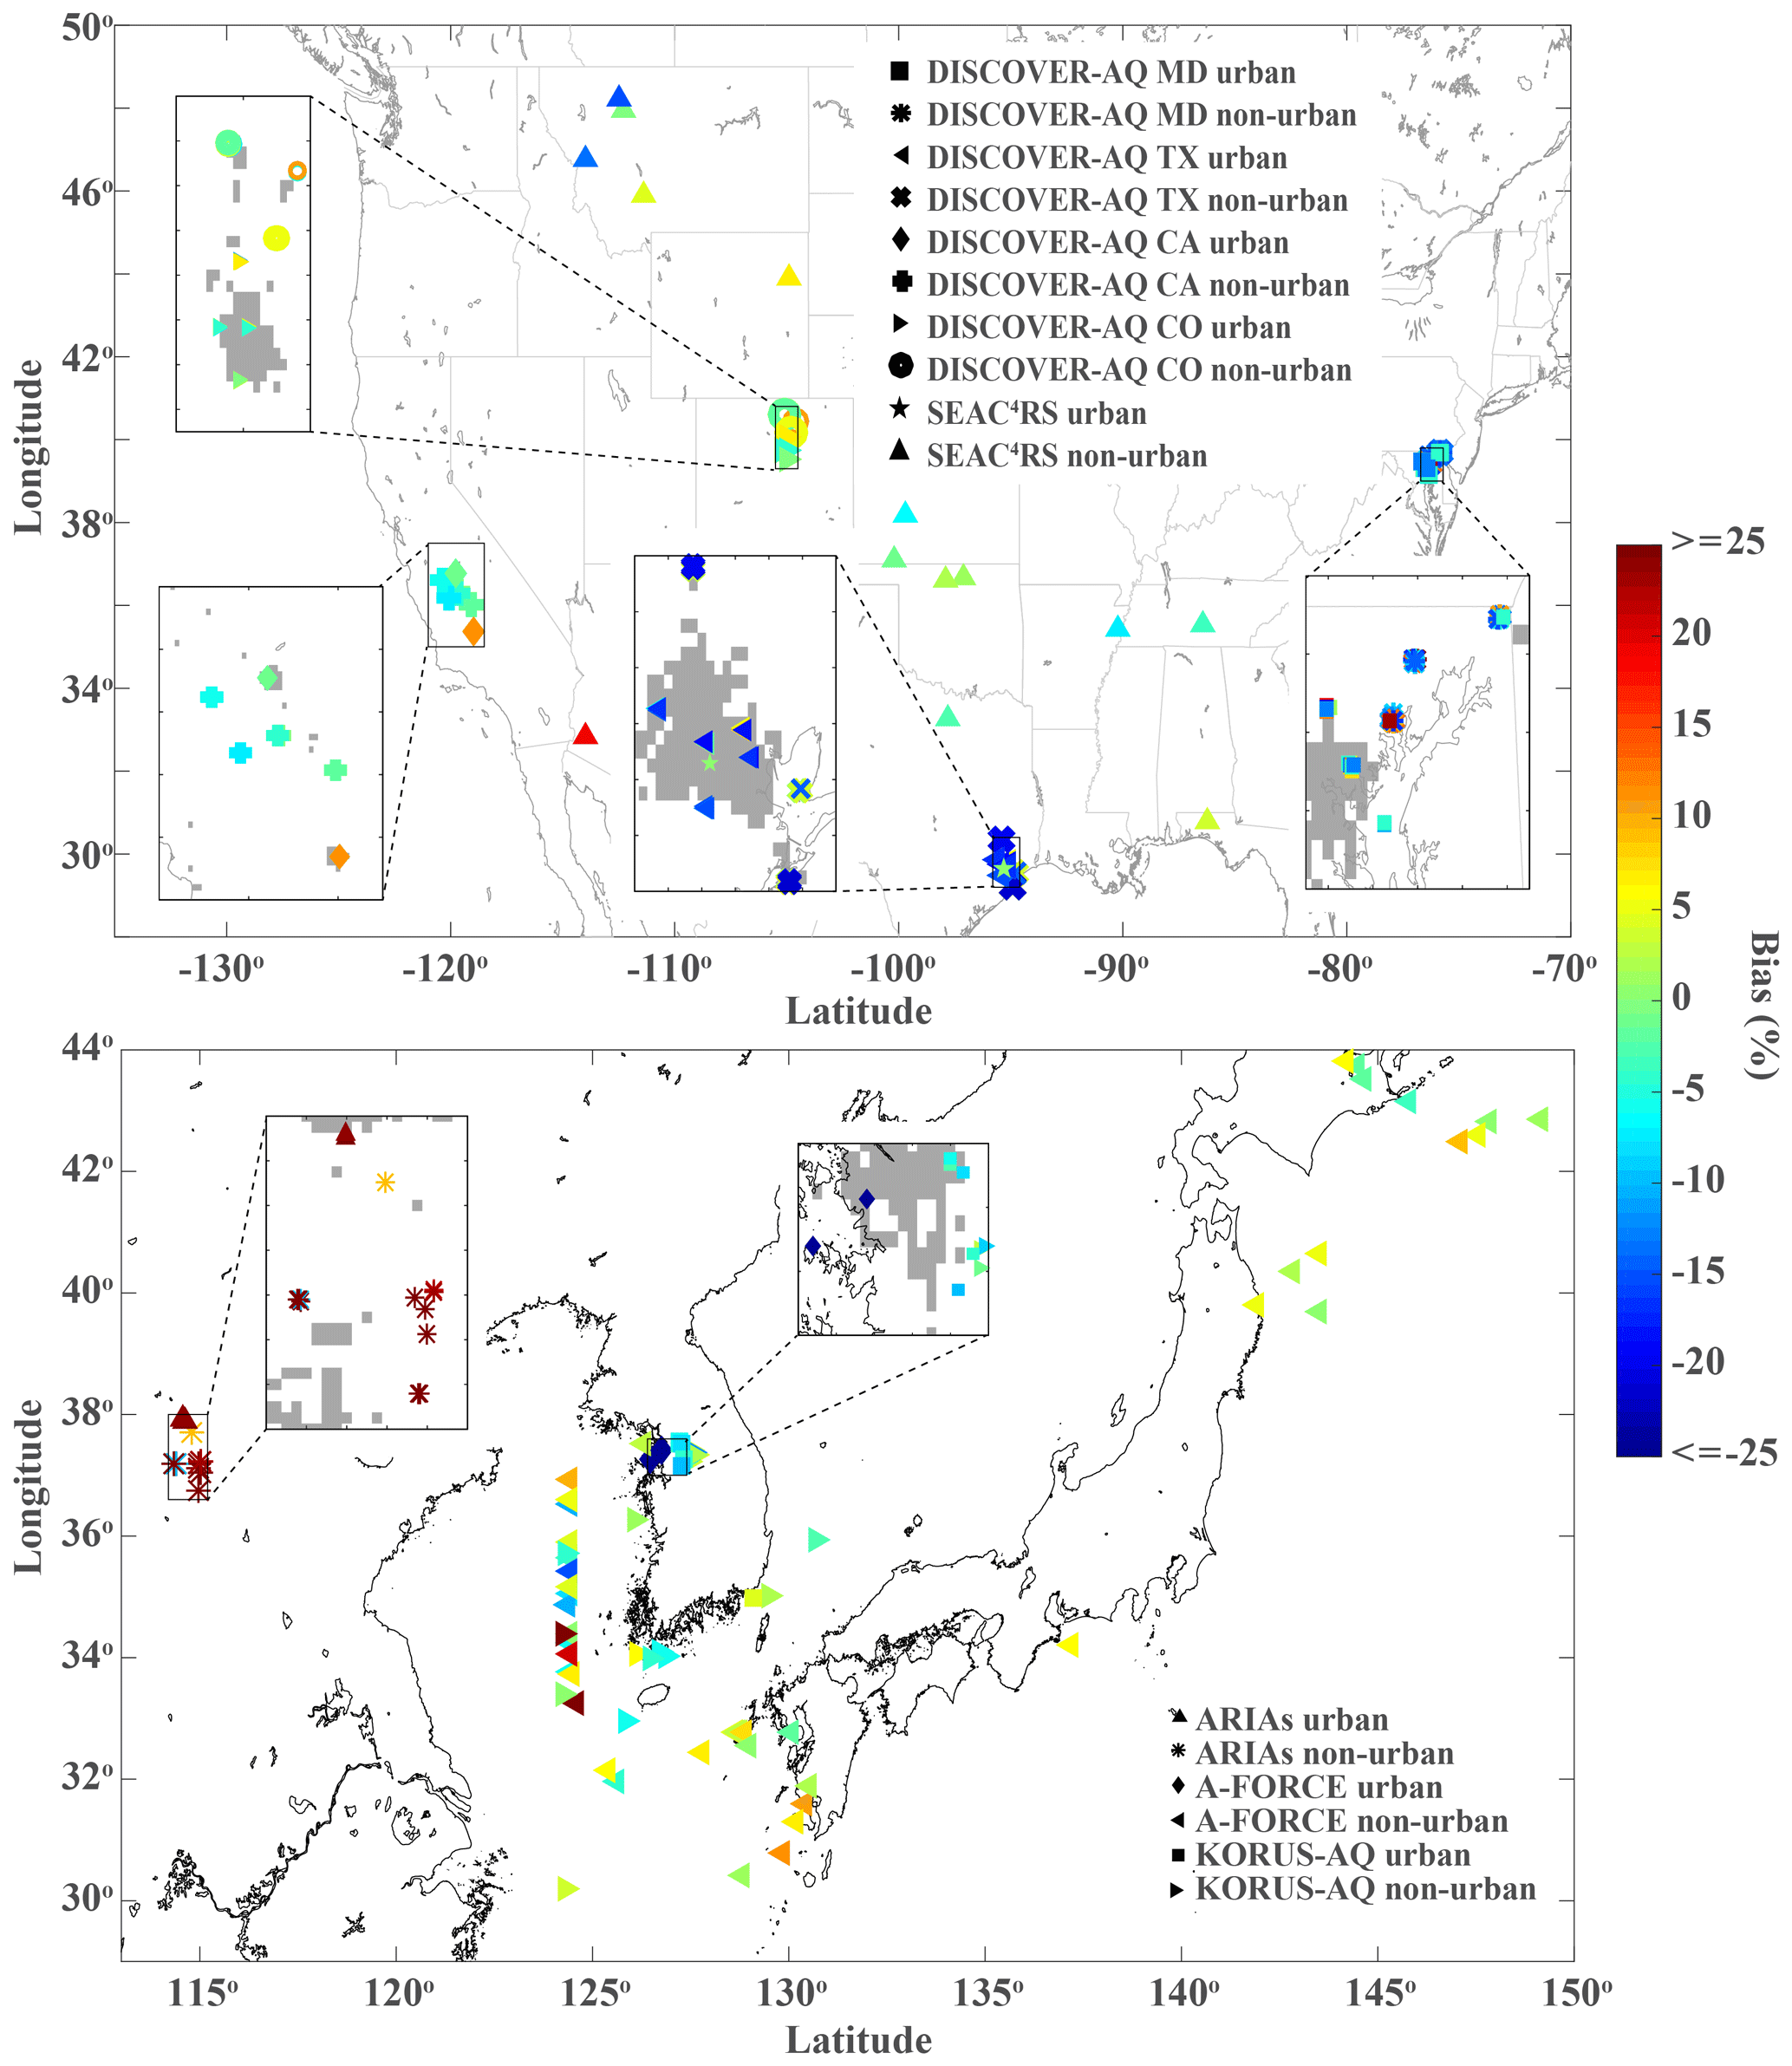
Figure 1Spatial distributions of aircraft profiles from the DISCOVER-AQ, SEAC4RS, ARIAs, A-FORCE, and KORUS-AQ campaigns. Urban and built-up land cover (from MCD12C1 v006) are shown by gray shade in the boxes. Biases of MOPITT V8J compared to the aircraft profile at the surface layer are shown by the color of the profile.
2.3 Method for comparing MOPITT profiles to aircraft measurements
We generally follow the method that has been used in previous MOPITT evaluation and validation studies (Deeter et al., 2010, 2012, 2013, 2014, 2016, 2017, 2019; Emmons et al., 2004, 2007, 2009). There are four main steps in aircraft versus MOPITT comparisons.
-
Because of aircraft altitude limitations, in situ data from field campaigns do not typically reach the highest altitudes at which MOPITT radiances are sensitive. Therefore, to obtain a complete vertical profile as required for comparison with MOPITT retrievals, each in situ profile is extended vertically using the following steps: (i) the aircraft measurements are interpolated to the 35-level vertical grid used in MOPITT forward model calculations (0.2–1060 hPa); (ii) the levels from the surface to the lowest-altitude aircraft measurement are filled with the value of the in situ measurement at the lowest-altitude aircraft measurement; (iii) for levels above a certain pressure level Pinterp (higher altitude), model or reanalysis data are used directly; (iv) for levels between the highest-altitude aircraft measurement and the altitude of Pinterp, values are linearly interpolated. Unlike the previous MOPITT evaluation studies that used monthly model results from MOZART (Model for OZone And Related chemical Tracers) (Emmons et al., 2010) or CAM-chem (Community Atmosphere Model with chemistry) (Lamarque et al., 2012), here we use 3-hourly Copernicus Atmosphere Monitoring Service (CAMS) reanalysis of CO produced by the European Centre for Medium-Range Weather Forecasts (ECMWF). CAMS CO reanalysis has a horizontal resolution of 80 km×80 km and 60 vertical grids (from surface to 0.1 hPa). Satellite retrievals of atmospheric composition including MOPITT TIR Version 6 total column CO retrievals are assimilated in the CAMS reanalysis (Inness et al., 2019; https://confluence.ecmwf.int/pages/viewpage.action?pageId=83396018, last access: 18 March 2020). We note that as we do not compare with these higher levels later, the use of CAMS reanalysis is expected to have a minimal impact on the lower levels we use in the comparison (e.g., the surface layer, the 800 hPa layer, and the 600 hPa layer). The final CO profile at the 35-level vertical grid is then regridded onto a coarser 10-level grid (for consistency with the actual MOPITT retrieval grid) by unweighted averaging the fine-grid VMR values in the layers immediately above the corresponding levels in the retrieval grid. We investigate the sensitivity of the results to Pinterp in Sect. 4.1.
-
For a given in situ profile, MOPITT profiles are considered co-located with the aircraft profile and are selected for comparison only if their center points are within the radius of 100 km and within 12 h of the acquisition of the aircraft profile. Sensitivities of the results to the radius and time criteria for co-location selection are further investigated in Sect. 4.2.
-
For each pair of co-located MOPITT-retrieved and in situ profiles, we apply the MOPITT a priori profile and averaging kernel to the in situ profile as in Eq. (1). Thus, after converting from profiles of the in situ and a priori CO concentrations to log10(VMR) profiles (xin situ and xa), we calculate
so that the log10(VMR)-based transformed in situ profile (xtransformed) has the same degree of smoothing and a priori dependence as the MOPITT-retrieved log10(VMR) profile (xrtv).
-
For each in situ profile, there are likely to be multiple MOPITT retrievals that meet the above co-location criteria. If fewer than five MOPITT retrievals are co-located with an in situ profile, the in situ profile is not used in the following study and analysis. If an in situ profile is co-located with five or more MOPITT retrievals (assume the number to be Nretrieval), then the following steps are used in the comparison with MOPITT: (a) the averaging kernel and a prior of each co-located MOPITT retrieval are applied to the in situ profile (through Eq. 2) to obtain Nretrieval of xtransformed – note that applying these Nretrieval sets of MOPITT a priori profiles and averaging kernels to the same in situ profile results in differently transformed in situ profiles; (b) the Nretrieval of xtransformed are averaged in log10(VMR) space; and (c) the Nretrieval of MOPITT retrievals xrtv are also averaged.
Figure 2 shows an example of profile comparisons (the original aircraft profile, aircraft profile extended with CAMS reanalysis data and regridded to 35-level grid, xin situ, xa, xtransformed, and xrtv) in VMR for an aircraft profile sampled on 22 July 2011 during DISCOVER-AQ in Maryland (MD). Figure 2 also demonstrates what to expect within a MOPITT retrieval pixel and vertical level. The MOPITT retrievals have a spatial resolution of about 22 km×22 km, and each MOPITT retrieval level corresponds to a layer immediately above that level. The standard deviation of the original aircraft CO observations in each MOPITT layer are also shown, which is due to horizontal and vertical variability in CO. Taking the 800 hPa layer as an example, the standard deviation of the original aircraft CO observations in the level is 21.4 ppb, which is larger than the difference between xtransformed and xrtv at that level (12.4 ppb). We also show the relative scale of the aircraft profile (3 km×5 km) and a MOPITT pixel (22 km×22 km) in Fig. 2. We expect the variability of CO within a MOPITT pixel to be even larger than the CO variability within the scale of 3 km×5 km. The variability within a satellite pixel and the representativeness error in the satellite retrieval and aircraft profile comparisons make it challenging to compare satellite retrievals to aircraft observations. This is one of the major reasons that MOPITT has yet to be compared with aircraft observations over urban regions with in situ observations. The representativeness error has been discussed in previous studies (Fishman et al., 2011; Follette-Cook et al., 2015; Judd et al., 2019). Follette-Cook et al. (2015) quantified spatial and temporal variability of column-integrated air pollutants, including CO, during DISCOVER-AQ MD from a modeling perspective (using the Weather Research and Forecasting model coupled with Chemistry – WRF-Chem). They found that during the July 2011 DISCOVER-AQ campaign, the mean CO difference at the distance of 20–24 km is ∼30 ppb (derived from the aircraft observations) and ∼40 ppb (derived from co-located WRF-Chem output), based on structure function analyses. In this study, we demonstrate this challenge with an example in Fig. 2. We also show a sensitivity analysis in Sect. 4 to provide perspectives on how the spatial and temporal representativeness may change the results. Further quantification of the variability within MOPITT pixels would be very challenging (partially due to limited coverage of the observational data), and we will elaborate more on this issue in Sect. 5.
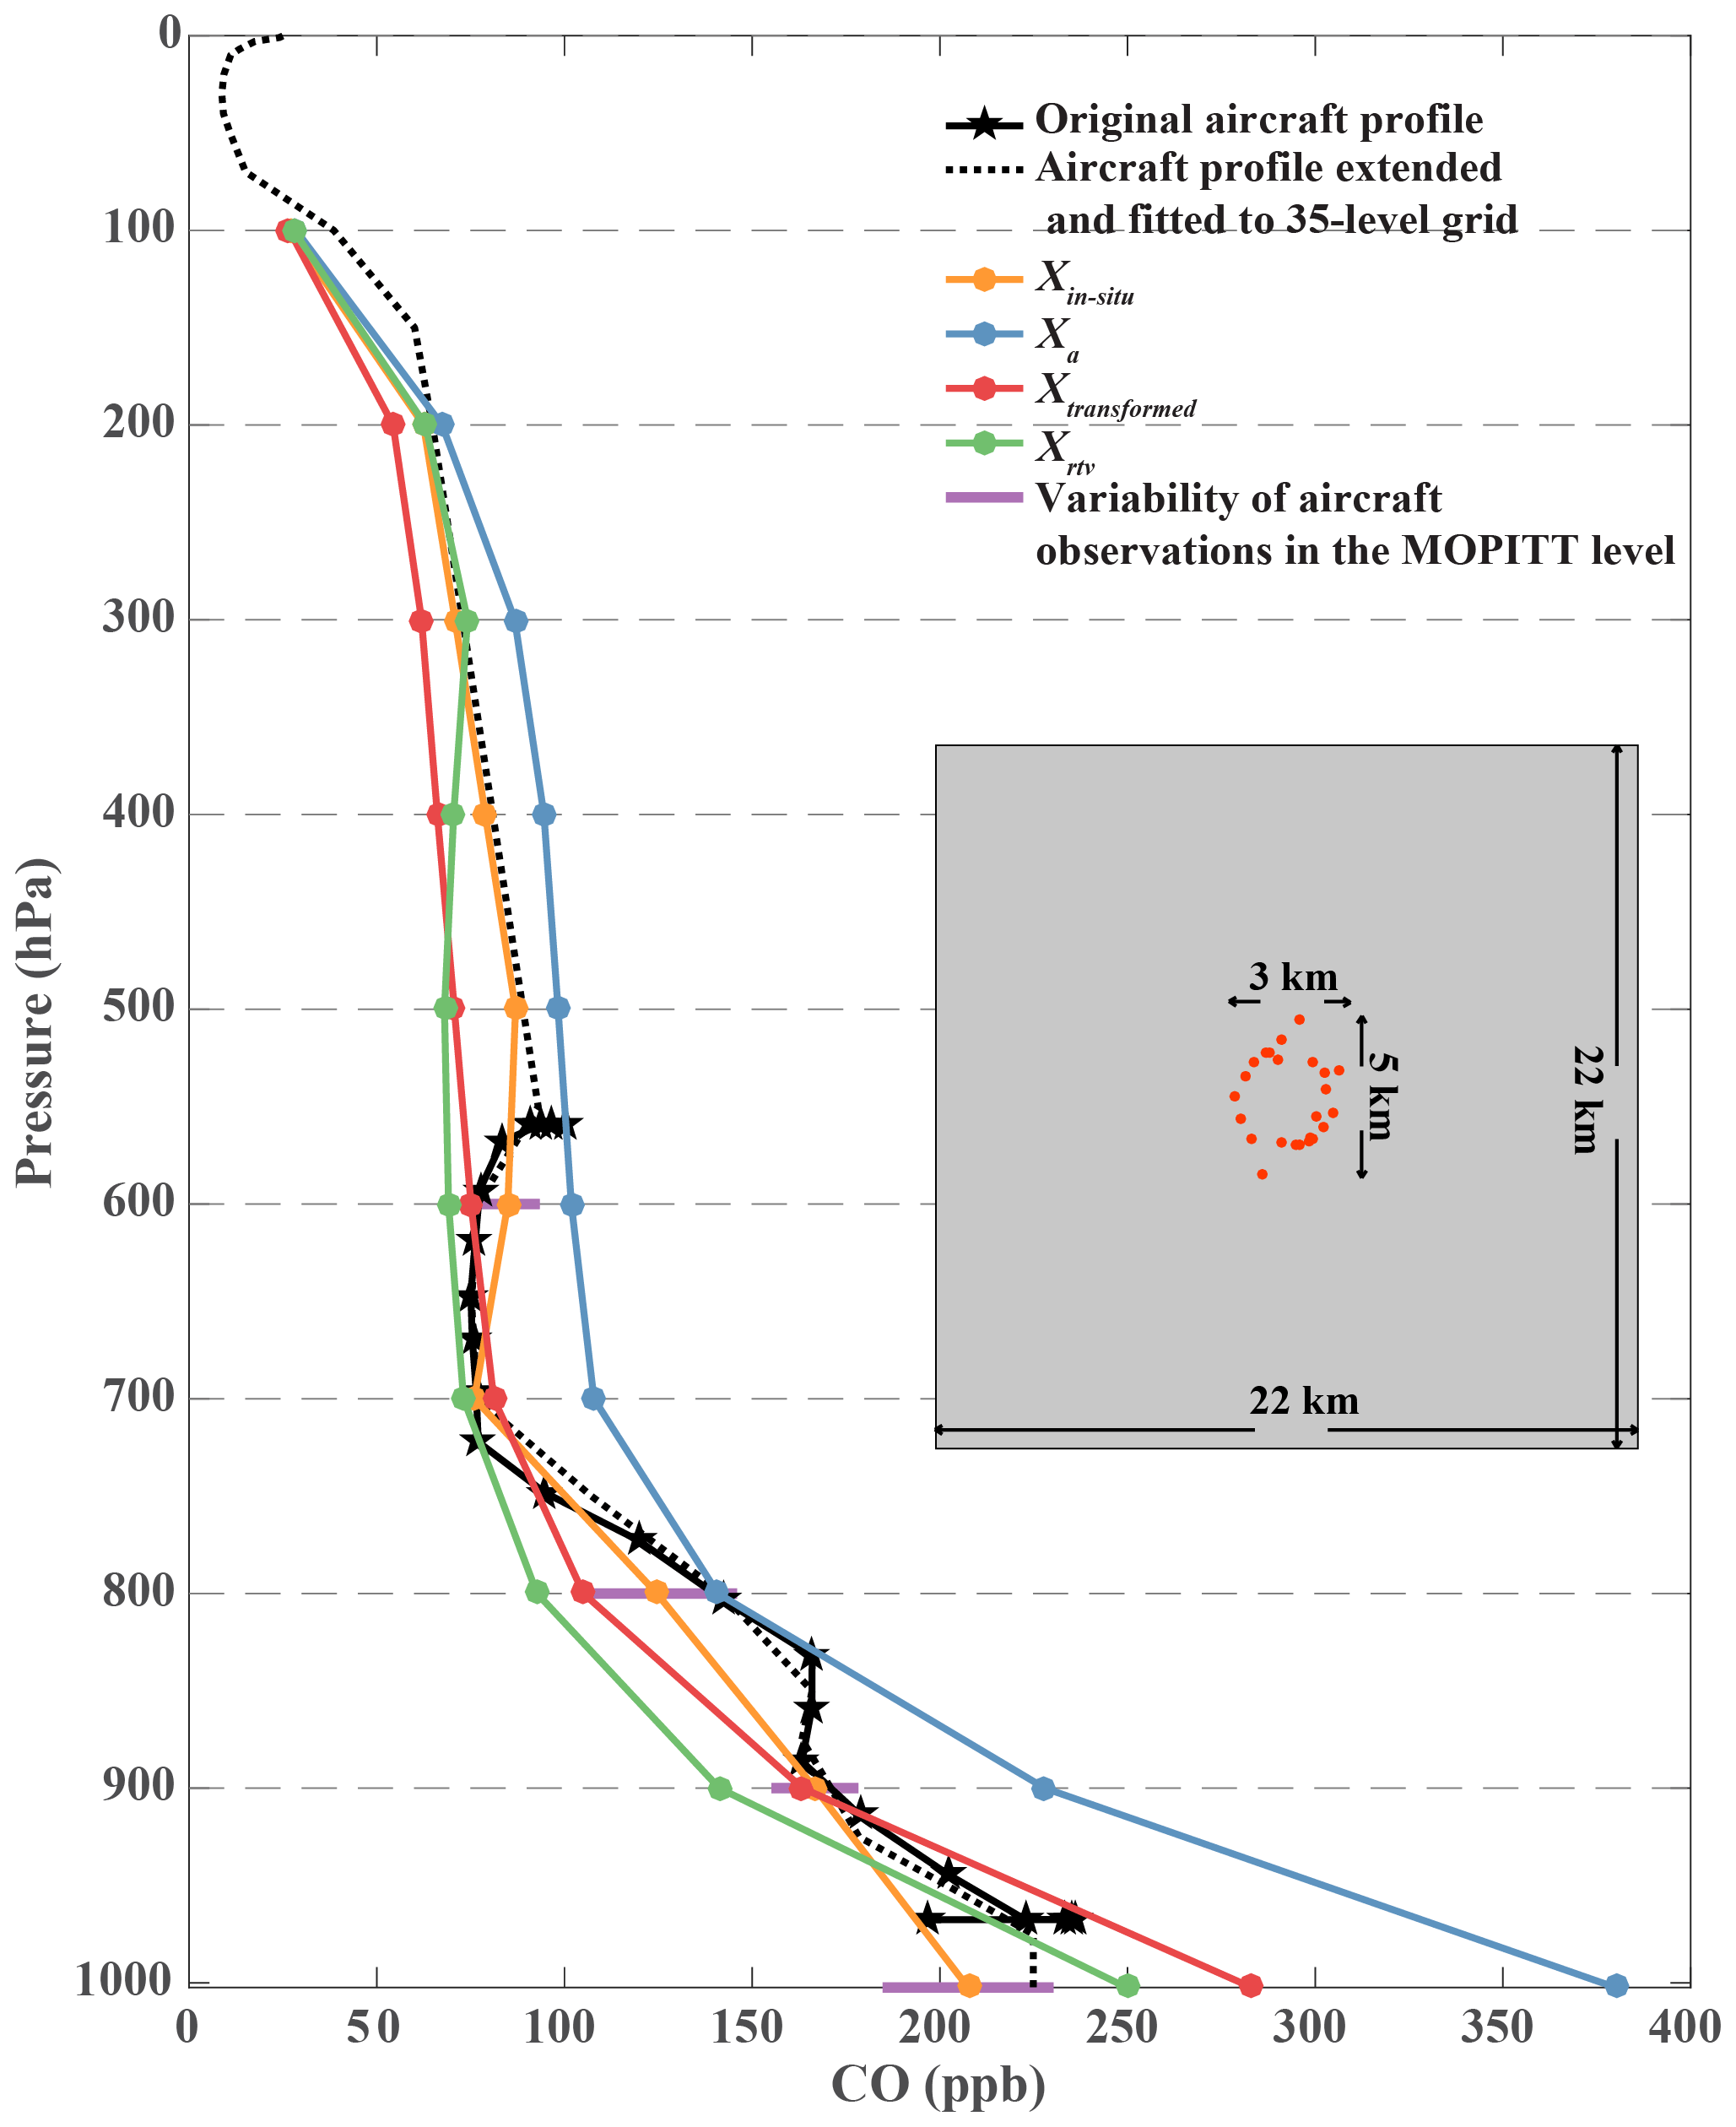
Figure 2Example of profile comparisons for an aircraft profile sampled on 22 July 2011 during DISCOVER-AQ MD. The black solid line represents the original aircraft profile and the stars represent the original aircraft observations; the black dotted line is the aircraft profile extended with CAMS reanalysis data and regridded to 35-level grid. The in situ profile regridded at a 10-level grid (xin situ), the MOPITT a priori profile (xa), the in situ profile transformed with the MOPITT a priori and AK (xtransformed), and the MOPITT-retrieved profile (xrtv) are shown in colored lines with dots. The purple bars centered at the xin situ at each MOPITT retrieval level show the standard deviations of the original aircraft observations in the MOPITT layer. Note that each MOPITT retrieval level corresponds to a uniform layer immediately above that level. The superimposed gray box shows the horizontal scale of the profile (each aircraft observation is represented by a red dot) and a MOPITT pixel (gray box).
In this section, the results for MOPITT comparisons with aircraft profiles are provided for only daytime retrievals (i.e., solar zenith angle in the retrieval) because (1) MOPITT retrievals generally contain more CO profile information in the daytime, which is reflected in AKs and degrees of freedom for signal (DFS) in Fig. 3, and (2) most aircraft profiles are sampled during the daytime. In Sect. 4.3, we discuss the sensitivity to the inclusion of MOPITT nighttime retrievals in MOPITT comparisons with aircraft profiles. In addition, many aircraft profiles, especially those from DISCOVER-AQ, lack observations above 600 hPa. Even though we extended the aircraft profiles vertically with reanalysis data (as discussed in Sect. 2.3), this still prevents the use of these profiles for validating MOPITT retrievals at upper levels against in situ observations. In this paper, we only focus on comparing MOPITT retrievals below the altitude of 600 hPa to aircraft profiles. Nevertheless, since the CO retrievals below 600 hPa are still weakly impacted by CO fields in the upper levels (as shown by the AKs in Fig. 3), in Sect. 4.1 we perform sensitivity tests on how augmenting the aircraft profiles with reanalysis fields affects the comparison results.
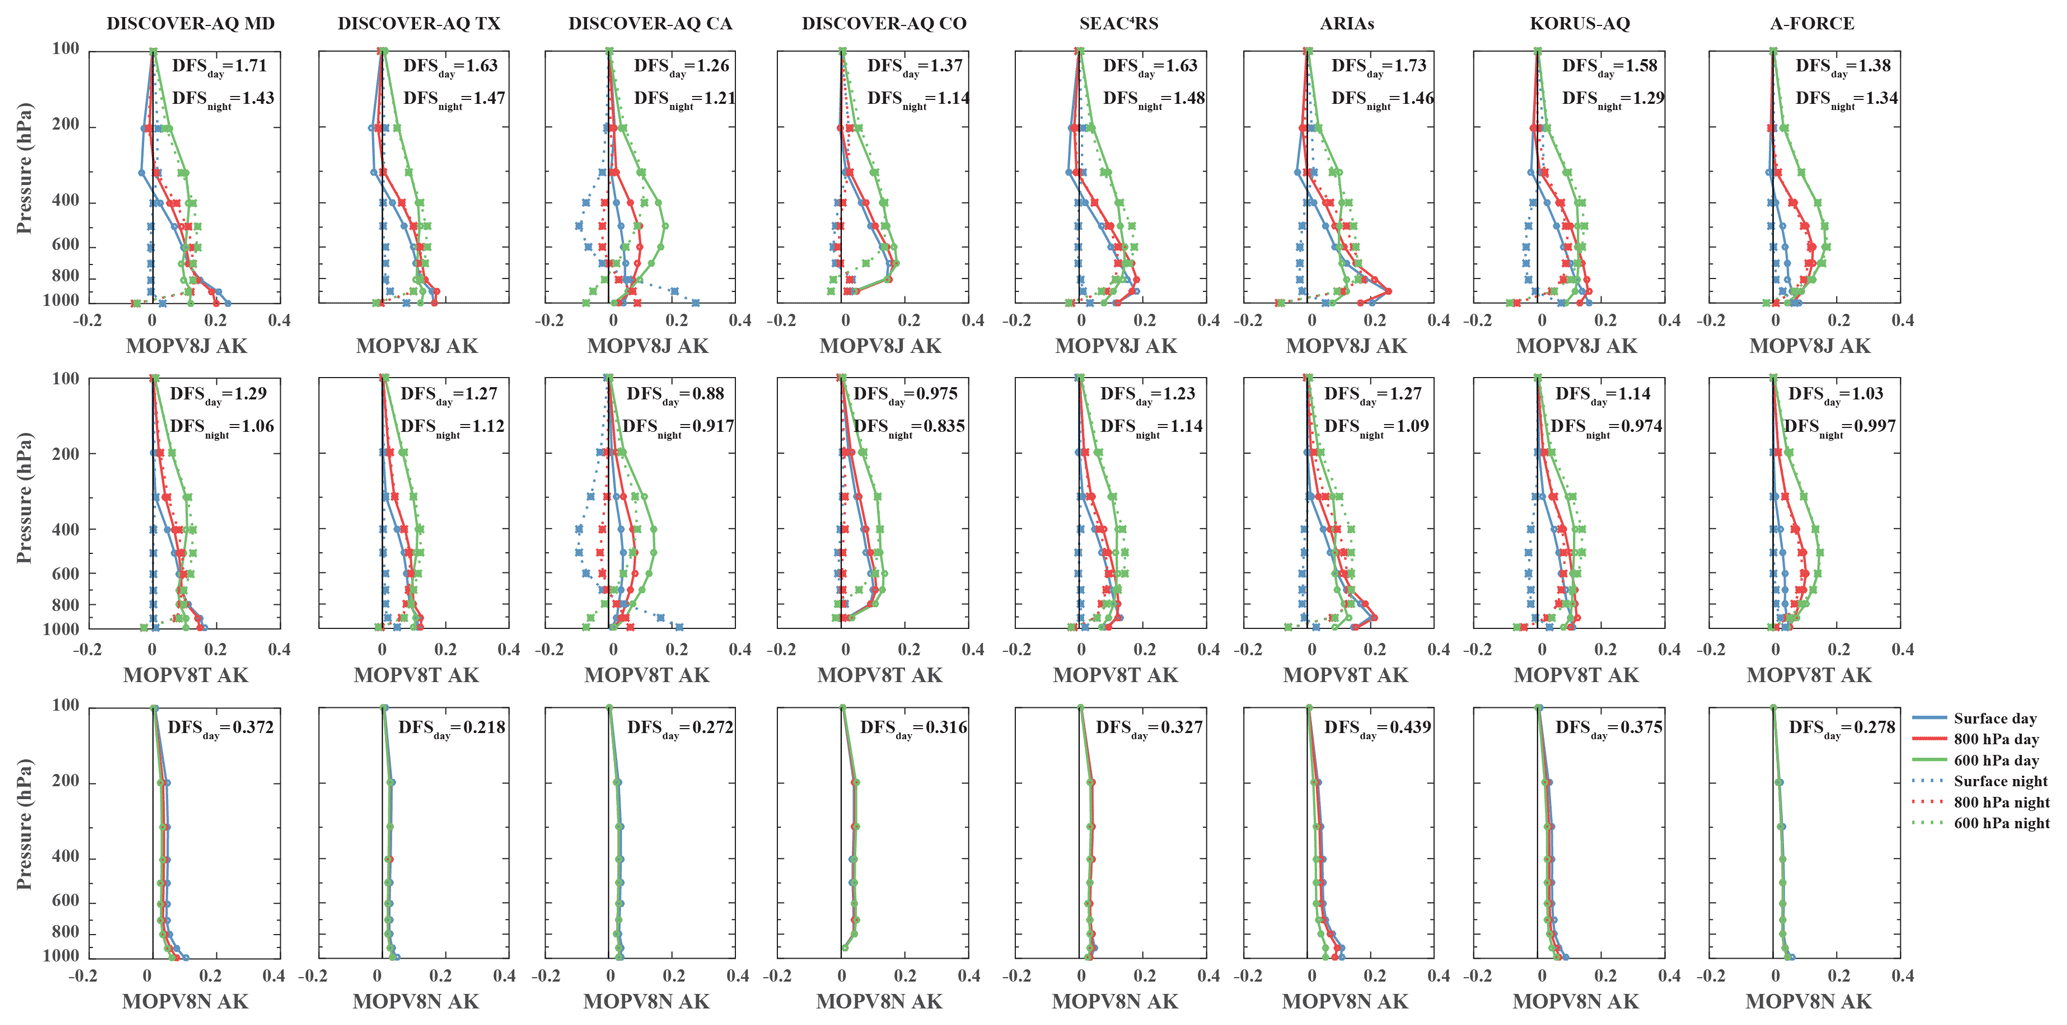
Figure 3Mean retrieval averaging kernels for the MOPITT V8J, V8T, and V8N for the corresponding in situ profiles from the DISCOVER-AQ, SEAC4RS, ARIAs, KORUS-AQ, and A-FORCE at daytime (solid lines) and nighttime (dashed lines).
3.1 Overall statistics
The overall comparison results are presented in Table 2. Following Deeter et al. (2017), retrieval biases and standard deviation (SD) are calculated based on mean xrtv and xtransformed for each in situ profile and converted from log10(VMR) to percent. The correlation coefficient (r) is quantified based on (xrtv−xa) and the corresponding (xtransformed−xa) to avoid correlations which mainly result from the variability of the a priori. xrtv, xtransformed, and xa are in log10(VMR) space in order to apply the AKs, which are computed for xrtv in log10(VMR). These comparisons for MOPITT Version 8 TIR-only (V8T) and Version 8 TIR–NIR (V8J) are shown in Figs. 4 (for all profiles) and 5 (for urban profiles). Overall biases for V8J products (averaged over all campaigns in Table 1) vary from −0.7 % to 0.0 %, which are lower than biases for V8T (from 2.0 % to 3.5 %). Overall biases for V8J products are also smaller than biases for V7J (from −0.5 % to −5.4 %). For V8J and V7J, biases over urban regions vary from −0.8 % to −2 % and from −1.4 % to −8.9 %, respectively, which are generally larger than biases over non-urban regions (−0.3 %–1.1 % and −3.3 %–0.1 %). Correlation coefficients over non-urban regions are higher than those over urban regions for all six products (V7T, V8T, V7N, V8N, V7J, V8J) at all three levels in Table 2 (the surface layer, the 800 hPa layer, and the 600 hPa layer). We also notice that for TIR–NIR and TIR-only products, V8 have higher correlation coefficients with in situ measurements than V7 over non-urban regions, whereas over urban regions, V8 products have lower correlation coefficients than V7 (except for the 600 hPa layer). Overall, MOPITT products (especially V8J) perform reasonably well over both urban and non-urban regions. Performance over non-urban regions is better than that over urban regions in terms of higher correlation coefficients and smaller biases for V8J and V7J.
Table 2Summarized validation results for V7 and V8 TIR-only (V7T and V8T), NIR-only (V7N and V8N) and TIR–NIR (V7J and V8J) products based on in situ profiles from DISCOVER-AQ, SEAC4RS, A-FORCE, KORUS-AQ, and ARIAs.
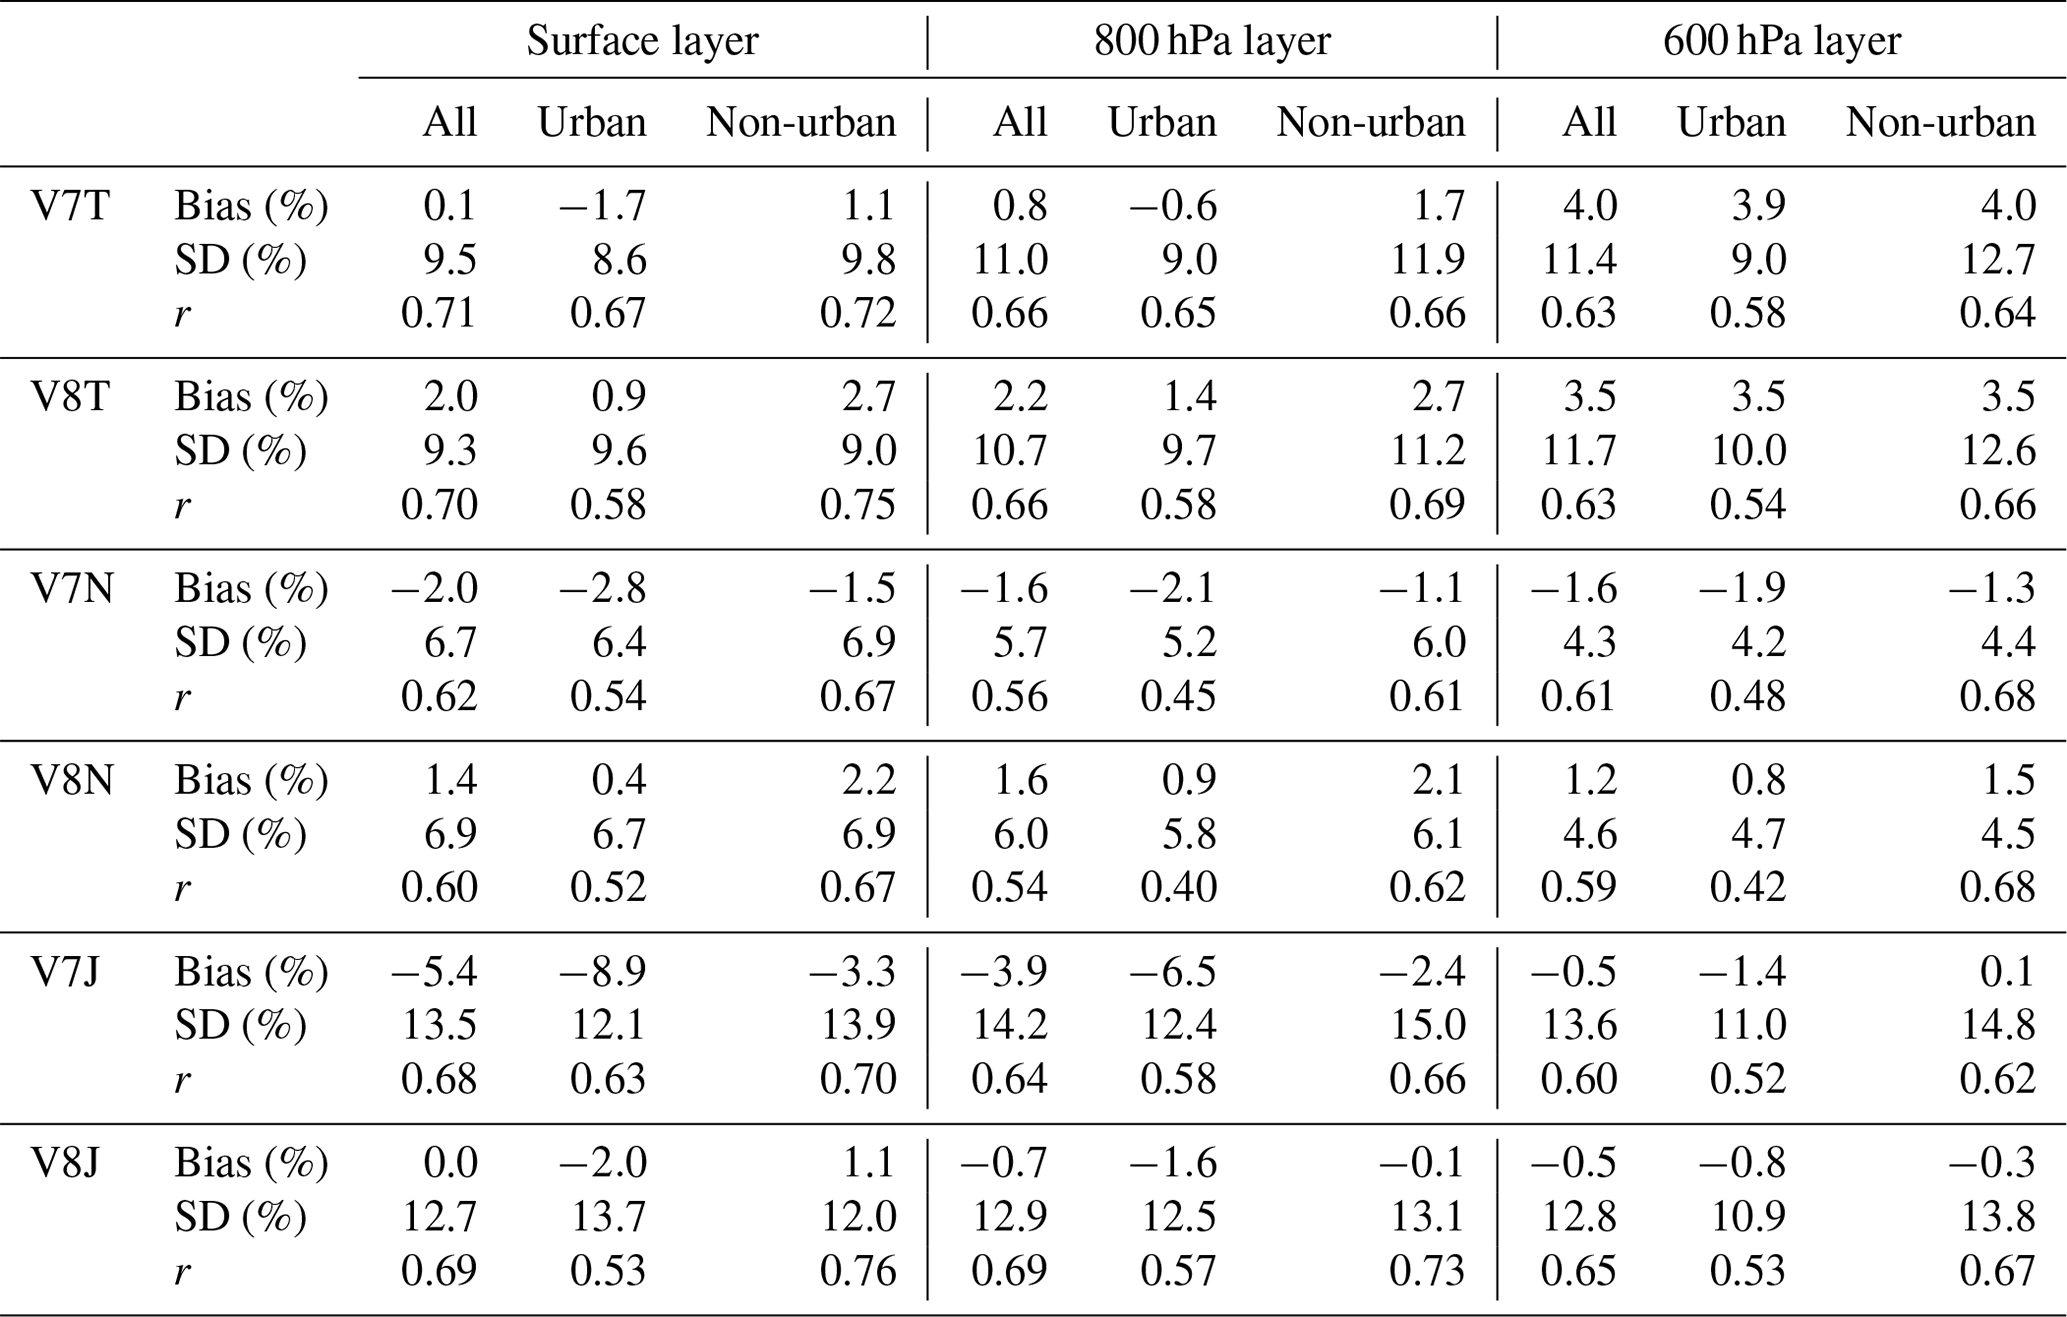
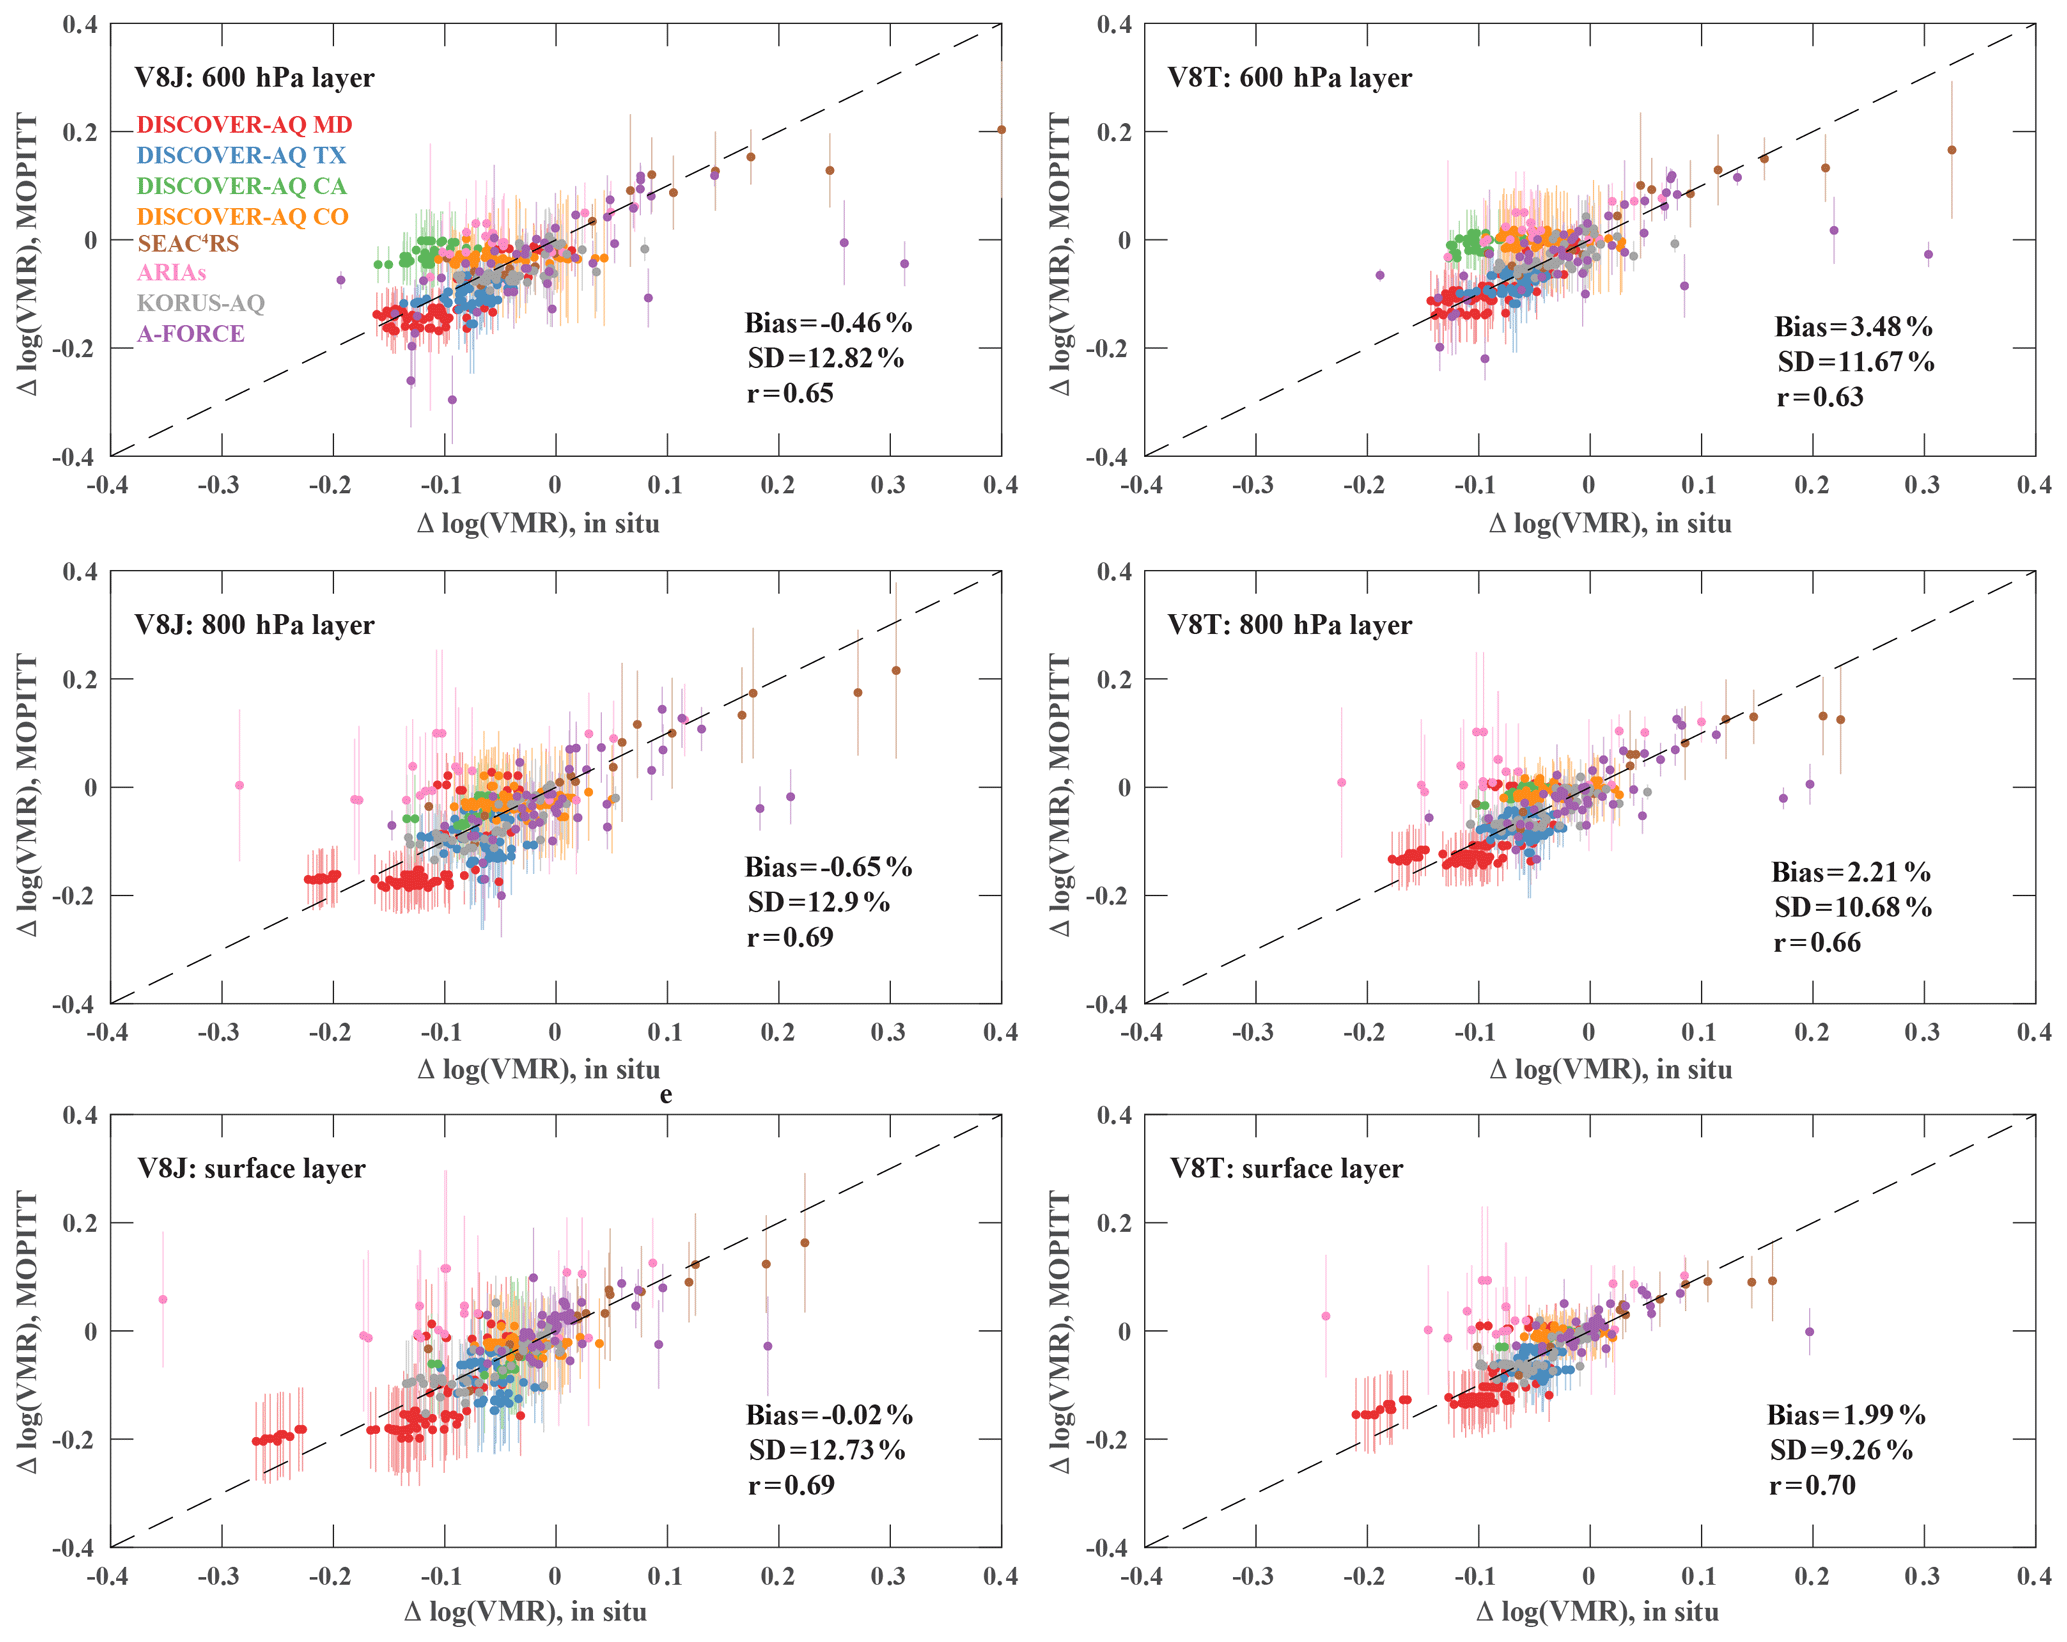
Figure 4MOPITT V8J and V8T validation results over both urban and non-urban regions at 600 hPa layer, 800 hPa layer, and the surface layer in terms of Δlog10(VMR). Δlog10(VMR) is defined as xrtv–xa for MOPITT profiles and xtransformed–xa for the in situ profiles. The use of Δlog10(VMR) allows us to remove the impact of the a priori in the comparisons. The variability of the MOPITT data used to calculate each of the plotted mean values is represented by the vertical error bars. The dashed lines are one-to-one ratio lines.
3.2 Discussions of individual campaigns
We also evaluate MOPITT V8J retrievals during individual field campaigns with results in Fig. 6. The corresponding results for MOPITT V8T are summarized in Fig. S2. The patterns of biases are very similar for MOPITT V8J and V8T. Thus, in this subsection, we focus on V8J unless stated otherwise. Overall, except for comparisons with A-FORCE and ARIAs, biases over urban regions and non-urban regions do not have a significant difference. Neither do biases determined for campaigns over the US and East Asia differ significantly, either.
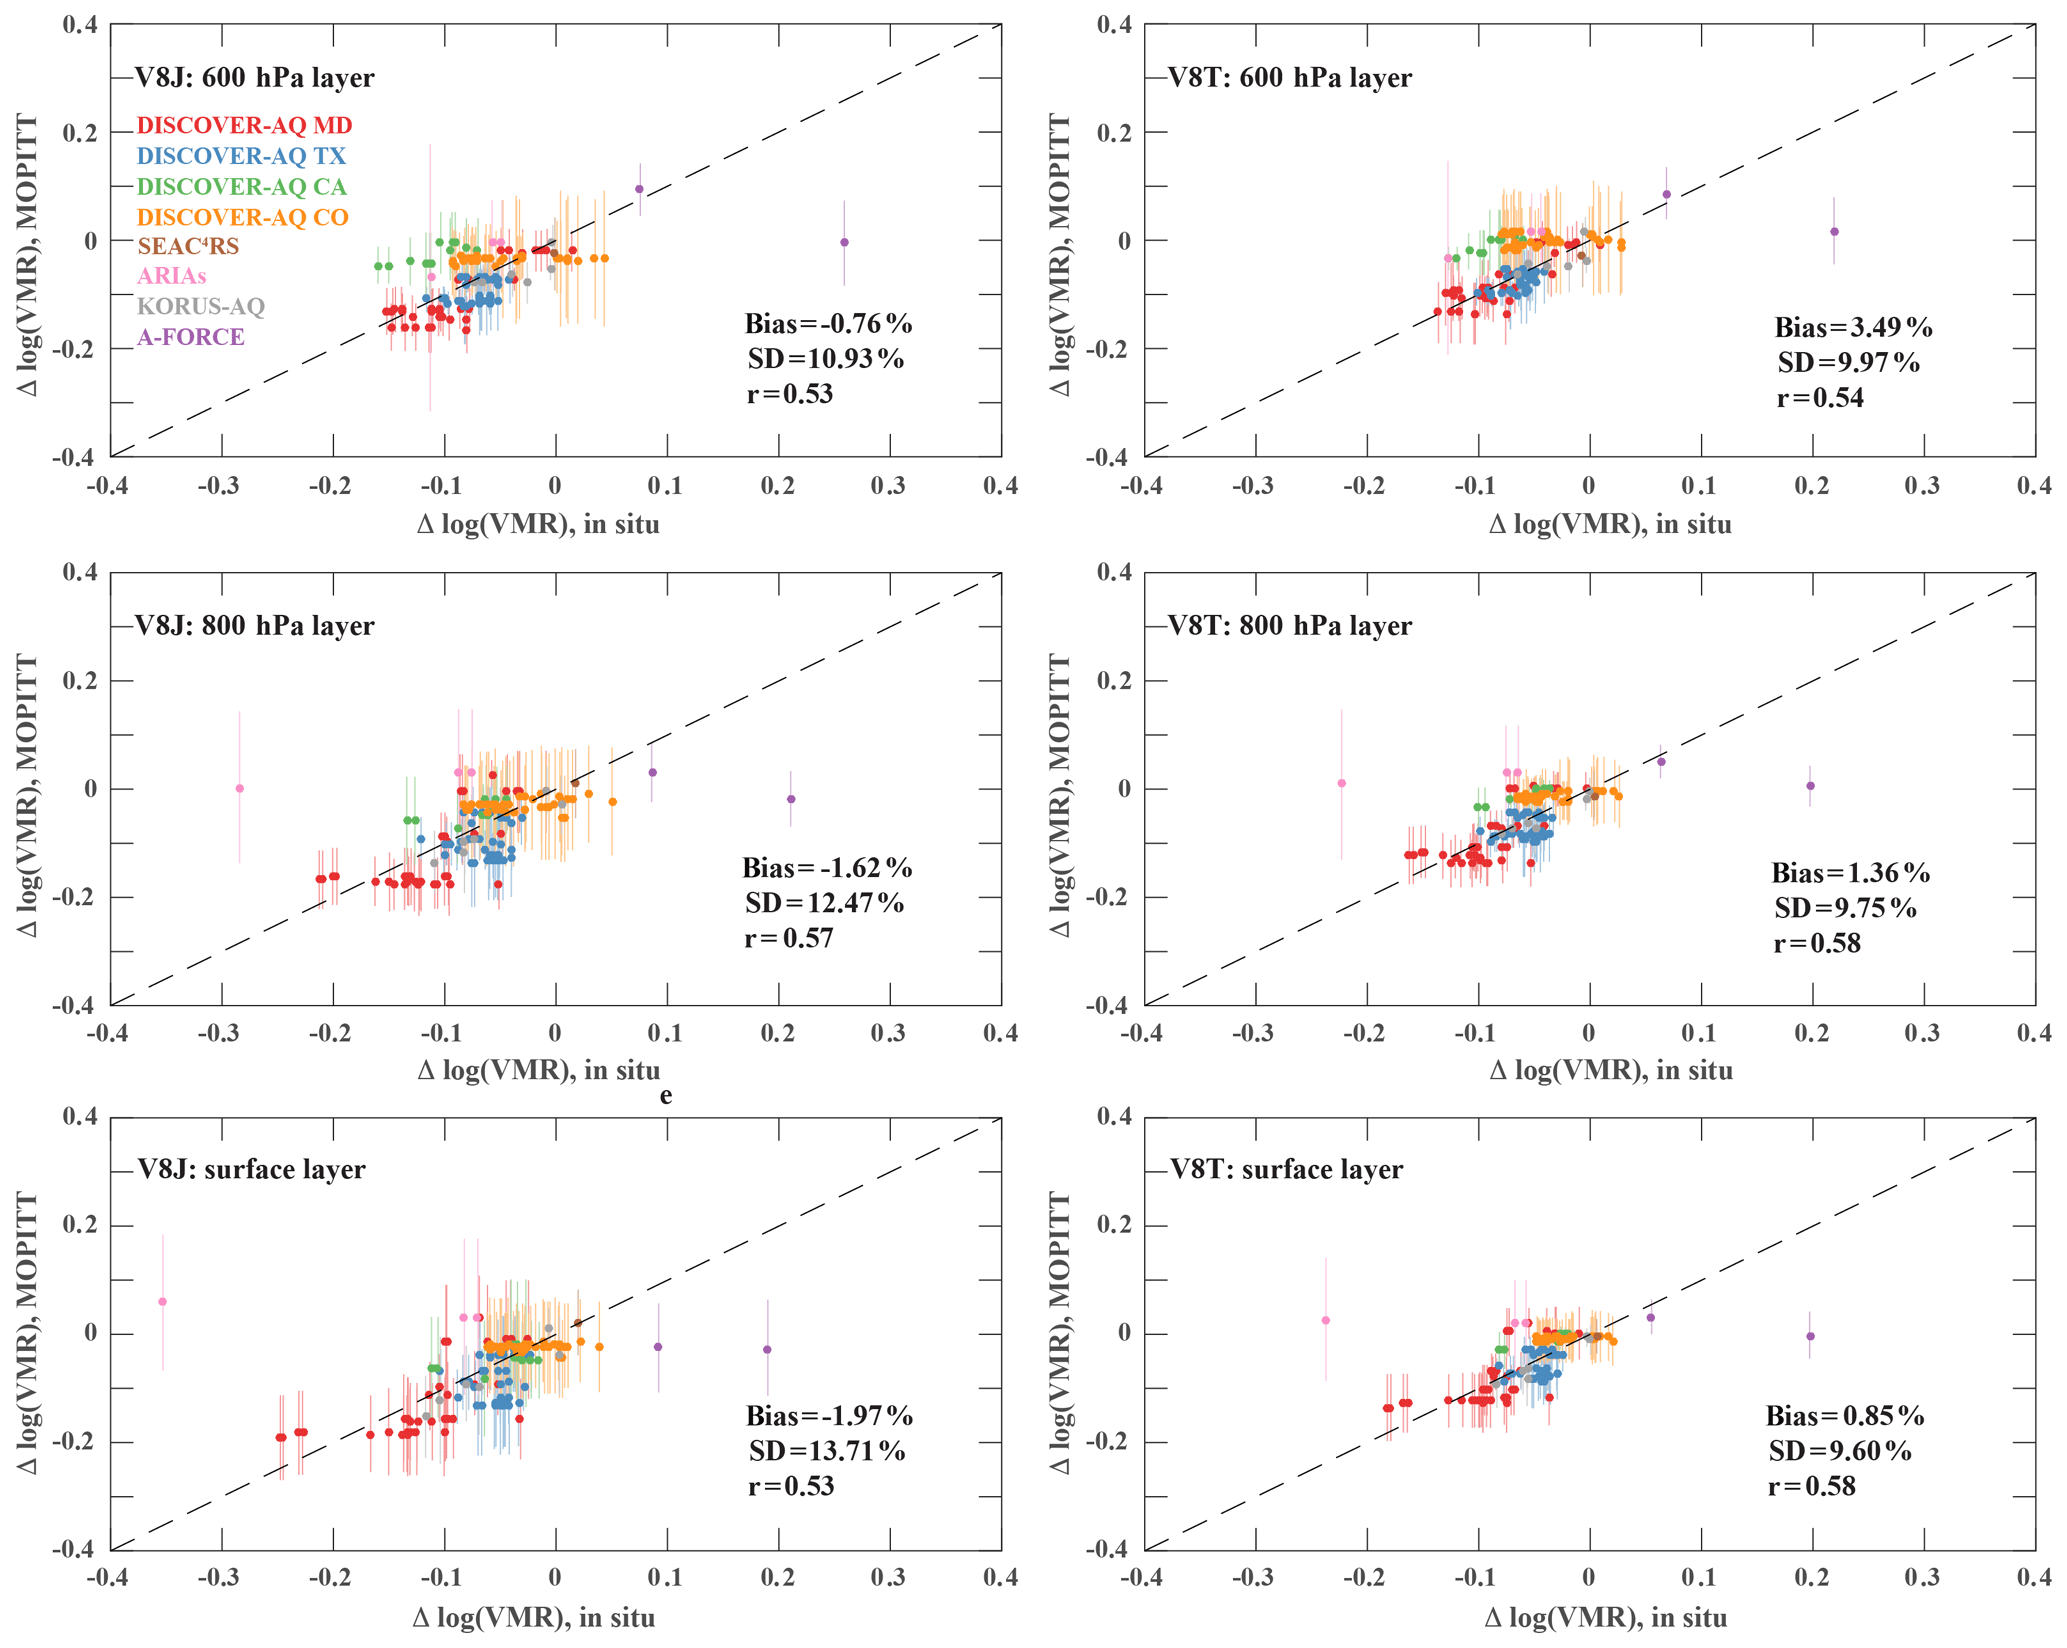
Figure 5MOPITT V8J and V8T validation results against aircraft profiles over urban regions at the 600 hPa layer, the 800 hPa layer, and the surface layer in terms of Δlog (VMR). The dashed lines are one-to-one ratio lines. See the caption of Fig. 4.
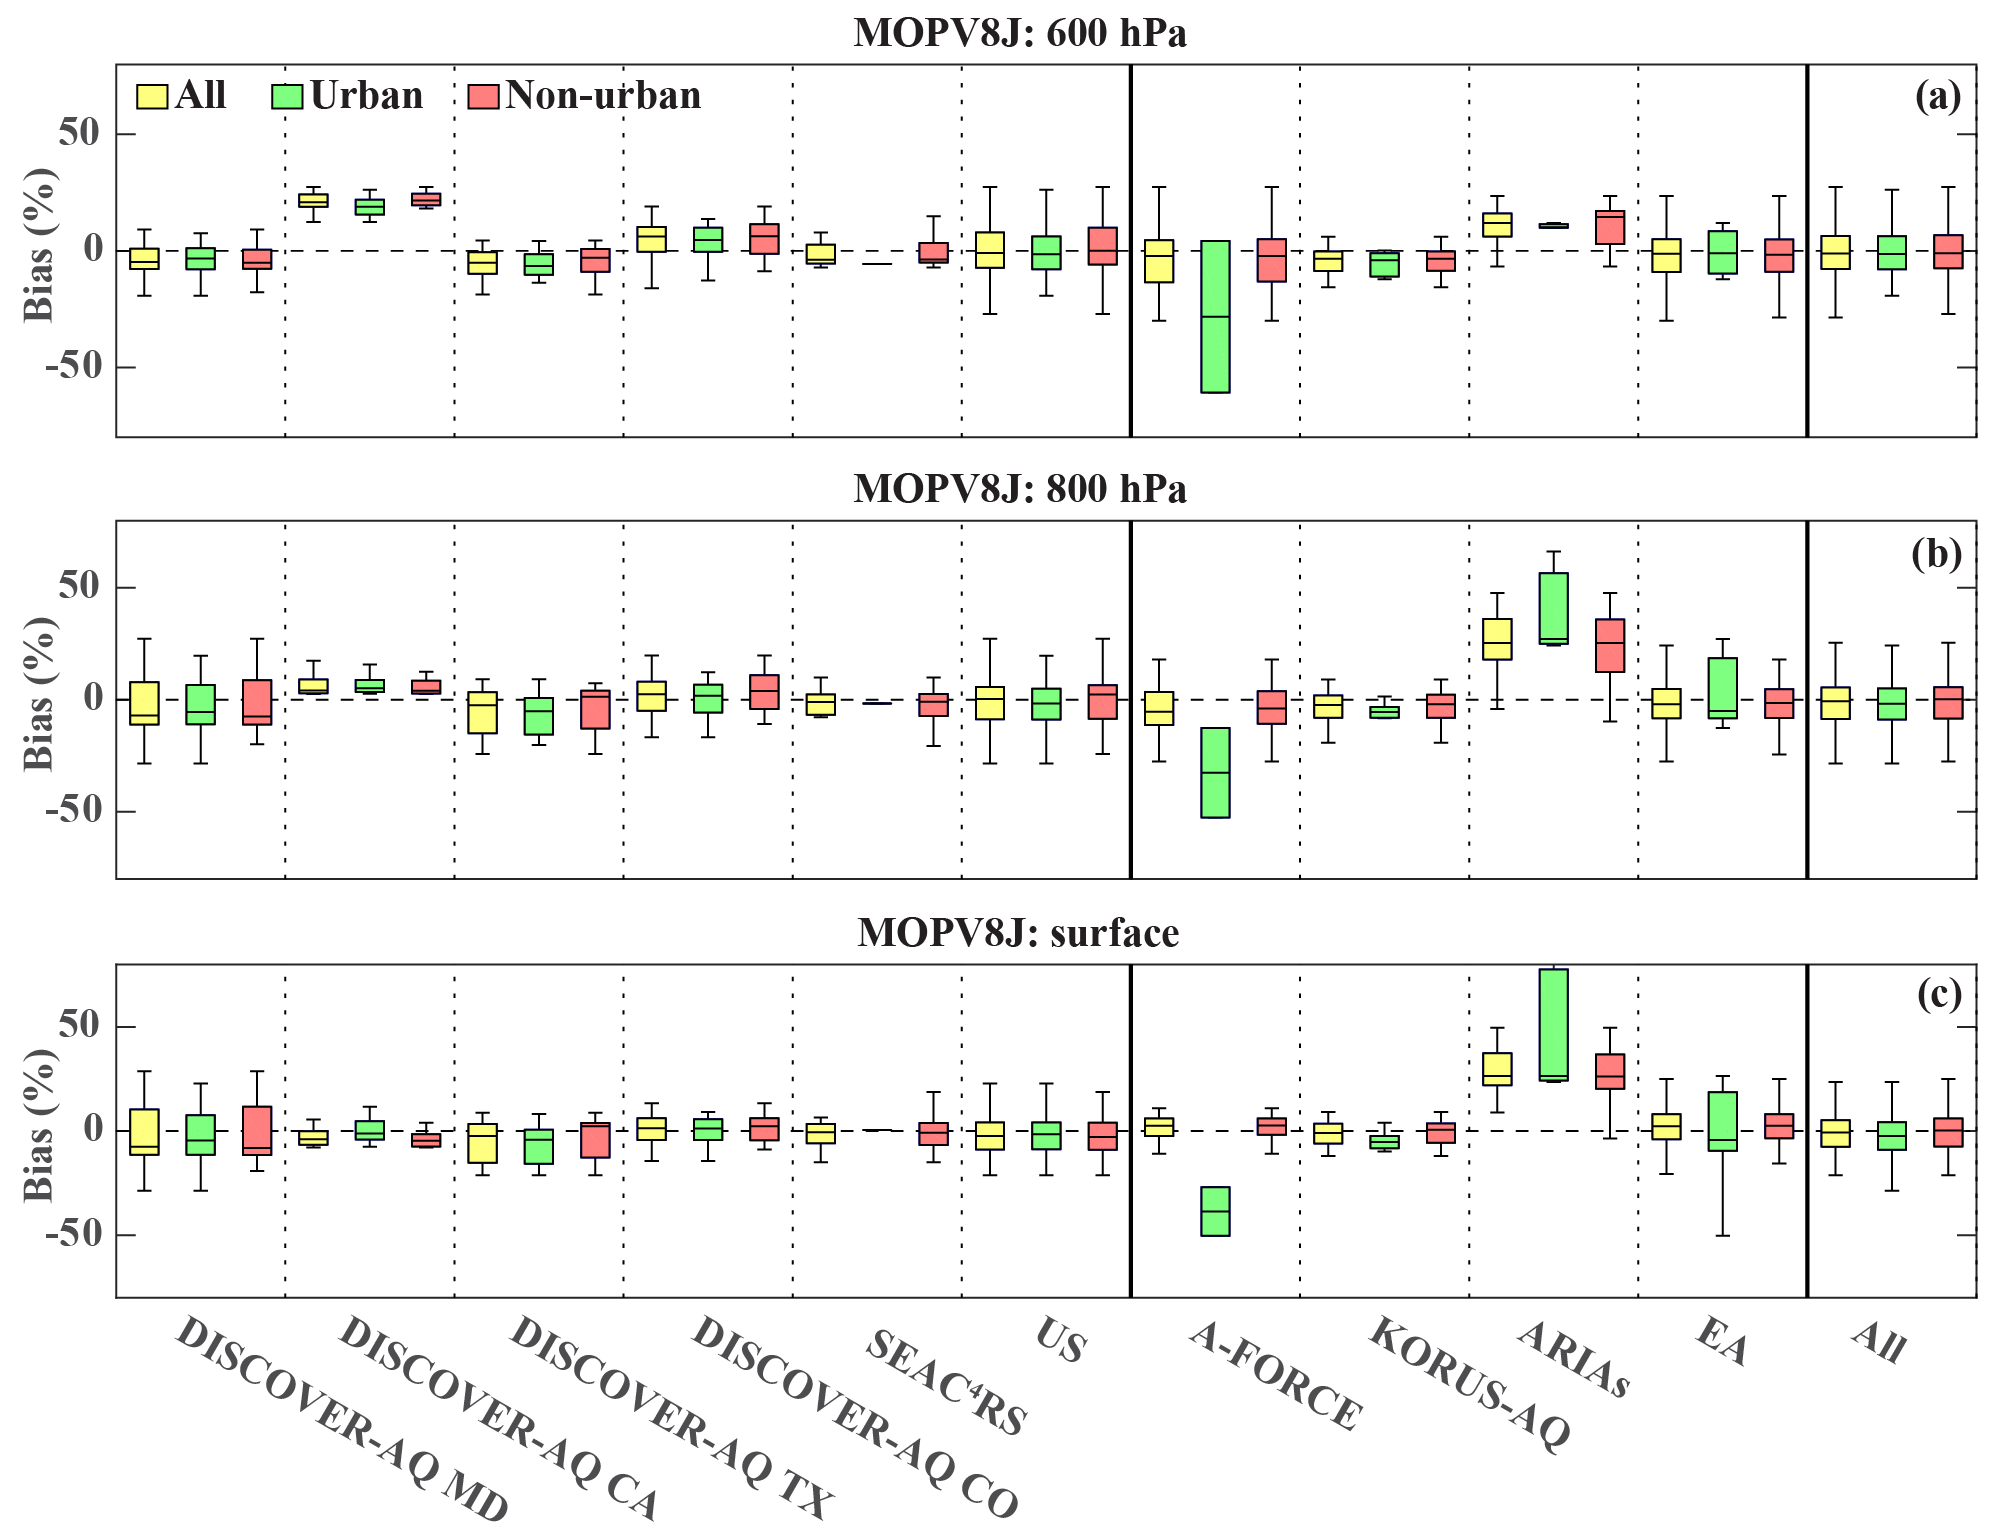
Figure 6Box plot (with medians represented by middle bars, interquartile ranges between 25th and 75th percentiles represented by boxes, and the most extreme data points not considered outliers represented by whiskers) for biases (%) for the profiles over both urban and non-urban regions (yellow), profiles over urban regions (green), and profiles over non-urban regions (red) at 600 hPa layer (a), 800 hPa layer (b), and the surface layer (c). An outlier is a value that is more than 1.5 times the interquartile range away from the top or bottom of the box.
When compared to DISCOVER-AQ CA (California), MOPITT CO values are generally higher than in situ profiles at the 600 hPa layer (i.e., the 100 hPa uniform layer immediately above 600 hPa) but not at the surface layer (i.e., the uniform layer immediately above the surface). This is likely related to the fact that the DISCOVER-AQ CA aircraft profiles are mostly below 600 hPa, and hence CO values of these in situ profiles at 600 hPa and above are filled with CAMS reanalysis data. In addition, DISCOVER-AQ CA was conducted in the winter when boundary layer height is at lower altitudes, which could also explain the difference, in particular since most of the other campaigns are during times with greater vertical mixing. The lack of aircraft observations at 600 hPa and above also has a smaller impact on the biases at the 800 hPa layer through applying AK (see Fig. 3).
During the A-FORCE campaign, only 2 in situ profiles out of 45 were sampled over urban regions. The locations of the two profiles are close to each other and they are both sampled on or near the coast of South Korea (Fig. 1). MOPITT has large negative biases (−30 % to −40 %) when compared to these two profiles. The averaged xin situ, xa, xtransformed, and xrtv over non-urban regions during A-FORCE and the xin situ, xa, xtransformed, and xrtv of the two profiles over urban regions are shown in Fig. S3. Compared to the averaged xin situ over non-urban regions, the xin situ for the two profiles over the urban regions have large enhancements near the surface and between 600 and 800 hPa. Even though the xa and xrtv for the two profiles have higher CO concentrations (∼400 ppb at the surface layer) than the averaged xa and xrtv (∼200 ppb at the surface layer), they are still lower than the xtransformed.
As for KORUS-AQ, MOPITT also has a negative bias (though smaller) when compared to the profiles over urban regions. Most of these KORUS-AQ profiles were located near the two profiles from A-FORCE but farther from the coast. The negative bias is not seen over non-urban regions during KORUS-AQ at the surface layer.
When compared to the in situ profiles from ARIAs, MOPITT has a large positive bias, especially over urban regions (20 %–30 %). During ARIAs, in situ profiles over urban regions have lower CO values (∼200 ppb at the surface layer) than those in situ profiles over non-urban regions (∼400 ppb at the surface layer; Fig. S4). We note there are only a small number of in situ profiles over urban regions in East Asia used in this study, compared to what is provided by DISCOVER-AQ in the US. The large negative biases against A-FORCE and large positive biases against ARIAs point to the need for more in situ observations over East Asia.
3.3 MOPITT comparisons with aircraft profiles at high CO concentrations
Urban regions are often associated with high CO concentrations. But this is not always the case (e.g., Fig. S4). Here we separate the in situ profiles at the surface layer, the 800 hPa layer, and the 600 hPa layer into lower 50 % CO values and higher 50 % CO values based on CO values at each level to demonstrate the impact of CO concentrations on the MOPITT product validation (Fig. 7). For V8J, MOPITT has smaller biases at higher 50 % CO concentrations for all three levels, whereas for V8T, MOPITT has larger biases at the surface layer and the 600 hPa layer at higher 50 % CO concentrations. For the higher 50 % of measured mixing ratios both V8J and V8T have larger SDs and lower correlation coefficients at the surface layer, the 800 hPa layer, and the 600 hPa layer, suggesting that the agreement between MOPITT and the in situ profiles at higher CO concentrations is not as good as that at lower CO concentrations. In contrast, Deeter et al. (2016) found that the retrieval biases do not visibly increase in the upper range of CO concentrations when compared to aircraft measurements over the Amazon Basin. The vertical error bars in Fig. 7 (caused by the multiple co-located MOPITT profiles with one in situ profile) represent the variability (standard deviation) of the MOPITT data used to calculate each of the plotted mean values. For an in situ profile, the variability of the MOPITT data located within its radius of 100 km and within 12 h is larger when the in situ profile has higher CO values, indicated by larger error bars at higher 50 % CO concentrations. At higher 50 % CO concentrations, the averaged retrieval uncertainties for the 600 hPa, 800 hPa, and surface layers are 28 %, 28 %, and 29 %, respectively. This is smaller than the averaged retrieval uncertainties at lower 50 % CO concentrations (28 %, 29 %, and 30 % for the 600 hPa, 800 hPa, and surface layers, respectively). We therefore conclude that the larger apparent biases at high CO concentrations are related to greater CO variability and representativeness error of the in situ profile within the co-location radius used for analyzing the MOPITT data rather than indicating larger retrieval uncertainties. Theoretically, MOPITT retrievals perform better with higher CO concentrations. The larger biases at high CO concentrations in Fig. 7 imply that the relatively greater CO variability may overcome the impact of high CO concentrations. Addressing representativeness error and spatial variability in the comparisons between satellite and in situ profiles is challenging and will be discussed further in Sect. 5.
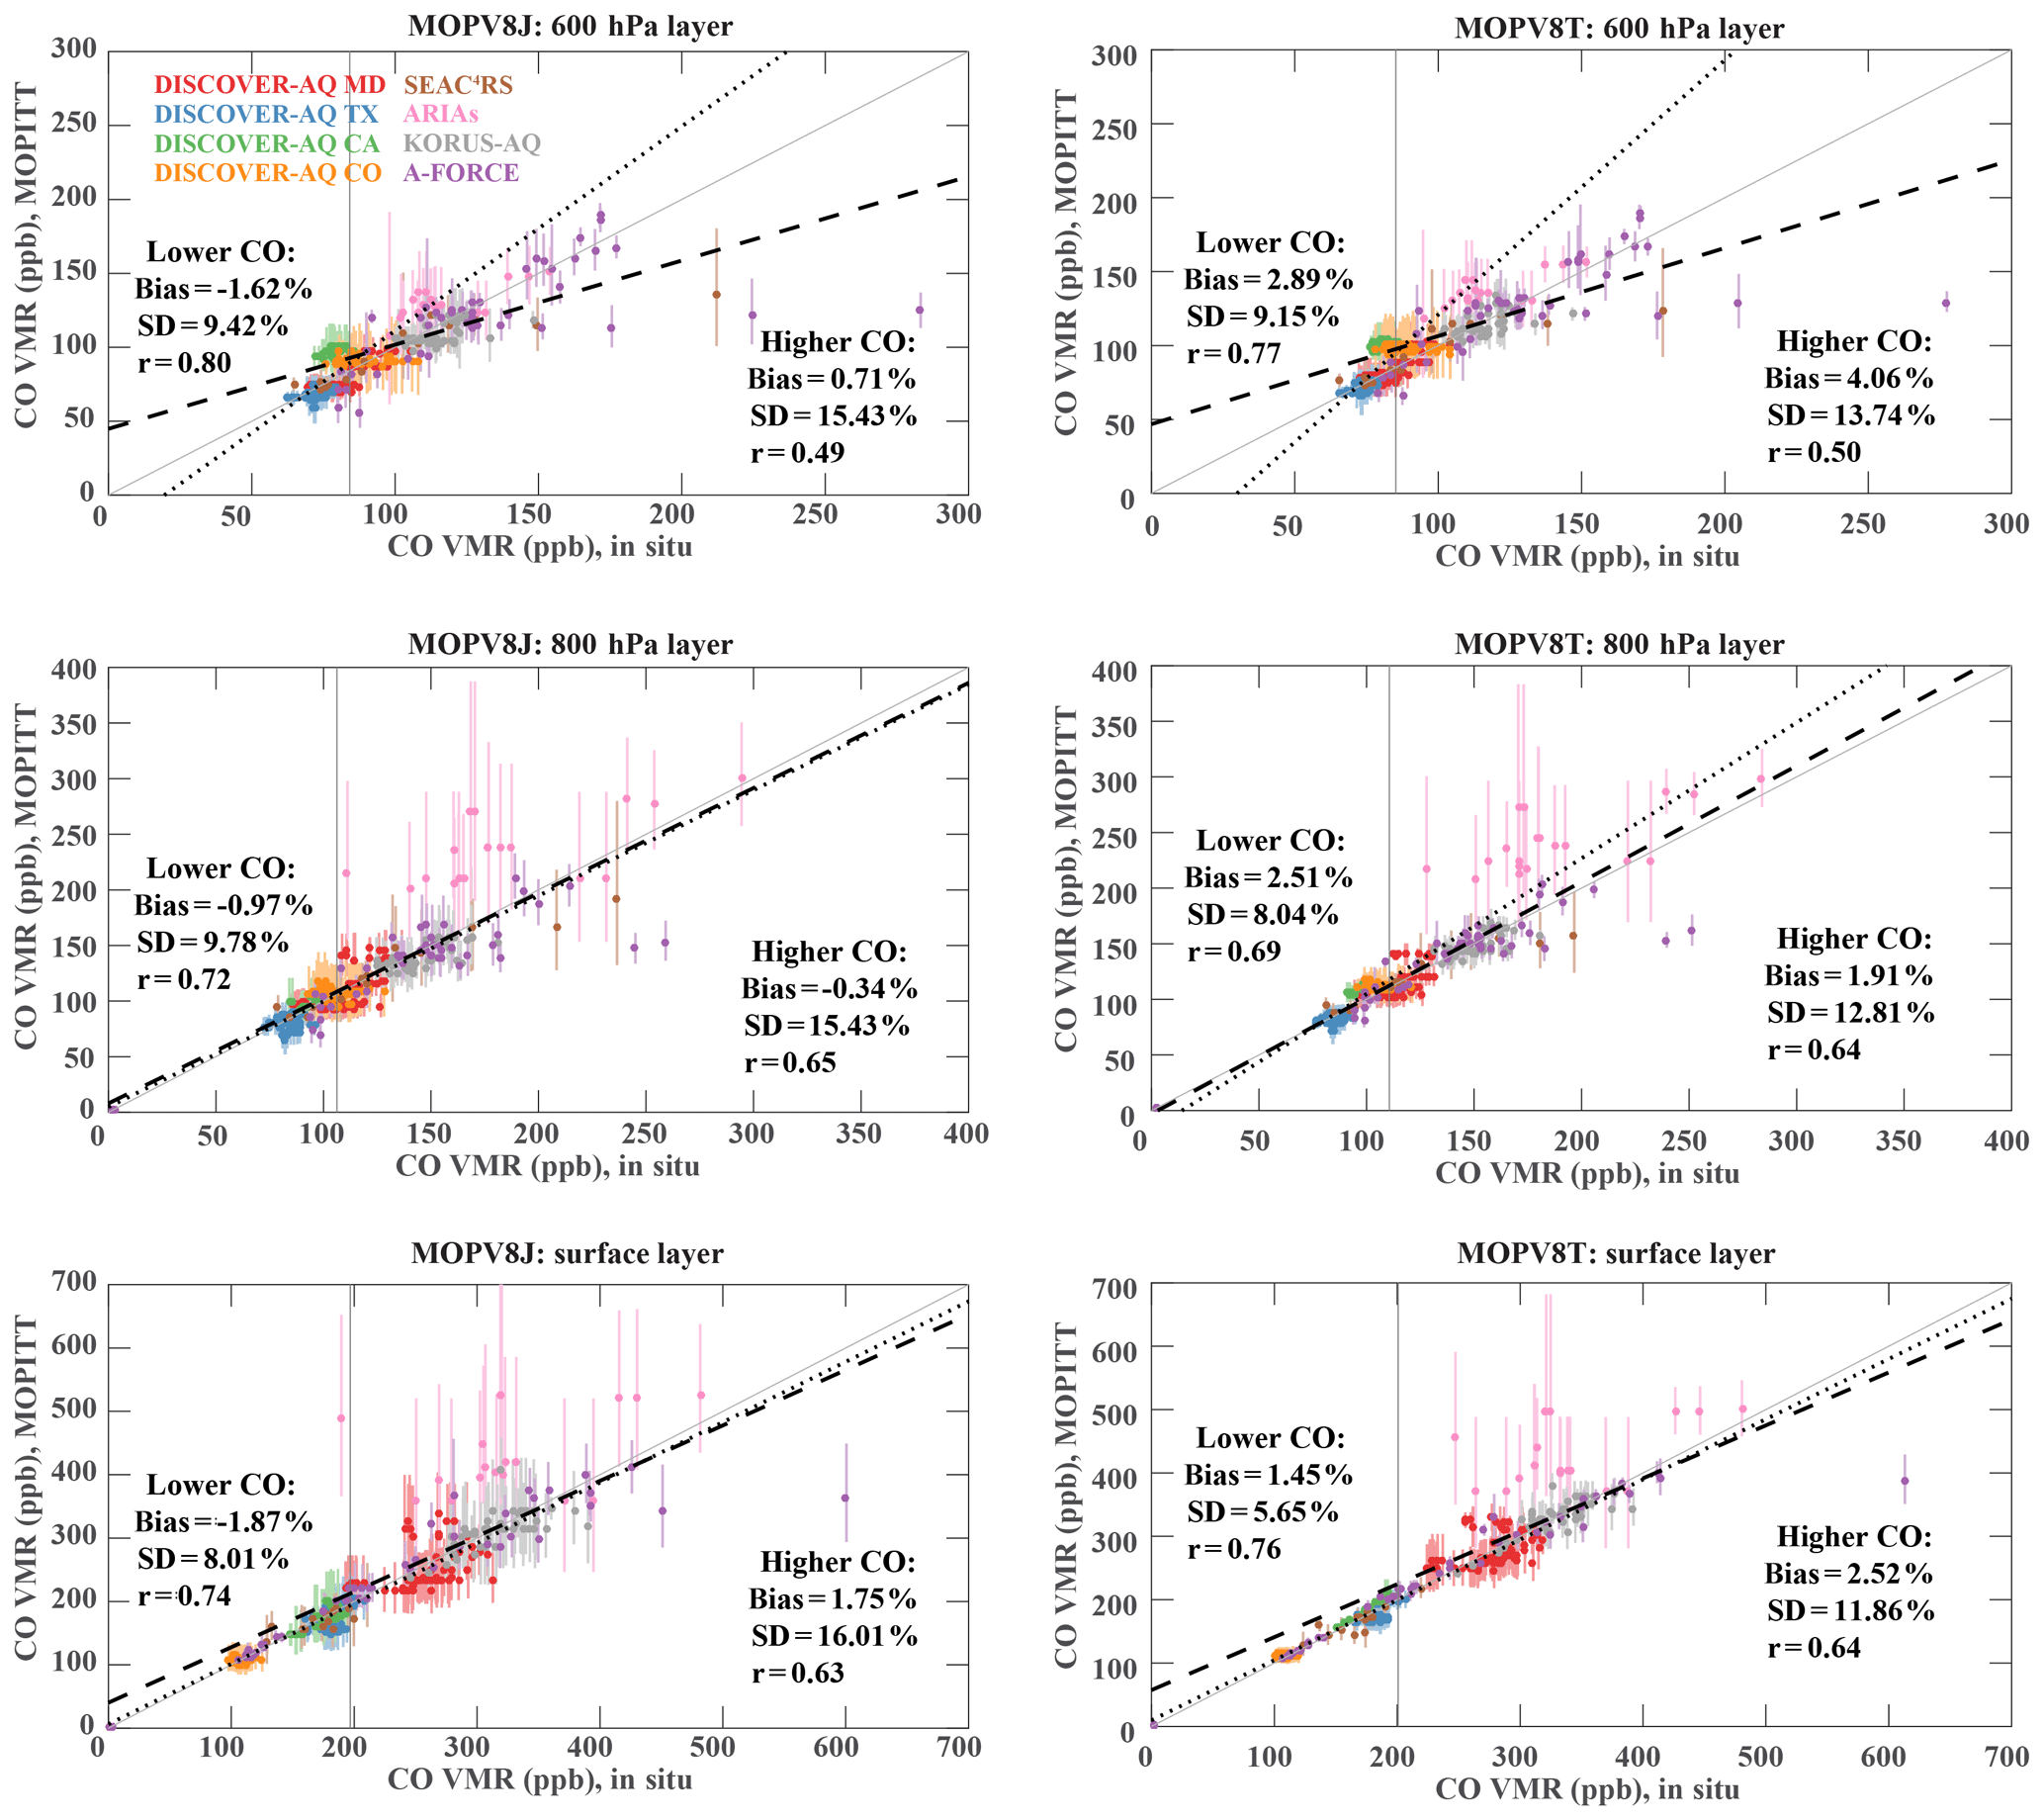
Figure 7MOPITT V8J and V8T validation results at 600 hPa layer, 800 hPa layer, and the surface layer against the lower 50 % in situ profiles of CO and higher 50 % in situ profiles of CO. The variability of the MOPITT data used to calculate each of the plotted mean values is represented by the vertical error bars. Each panel shows the least-squares best-fit lines for the lower 50 % CO concentrations (dotted line) and the higher 50 % CO concentrations (dashed line).
We will discuss the sensitivity of radius and time difference for the selection of co-located data in Sect. 4. The difference in the variability at different CO concentrations was not found in Deeter et al. (2016). It could be partially due to the fact that the aircraft profiles over the Amazon Basin used in Deeter et al. (2016) were sampled under more geographically homogeneous conditions, whereas the profiles used in this study are from different campaigns, and high CO concentrations over and near urban regions might be associated with more complex and inhomogeneous conditions.
In Sect. 3, we compared profiles over urban and non-urban regions separately to MOPITT V8T, V8N, V8J, V7T, V7N, and V7J. In this section, we compare only the MOPITT V8J product to all the in situ profiles (both over urban and non-urban regions) described in Table 1 to test the sensitivity of results to the assumptions made during the comparisons.
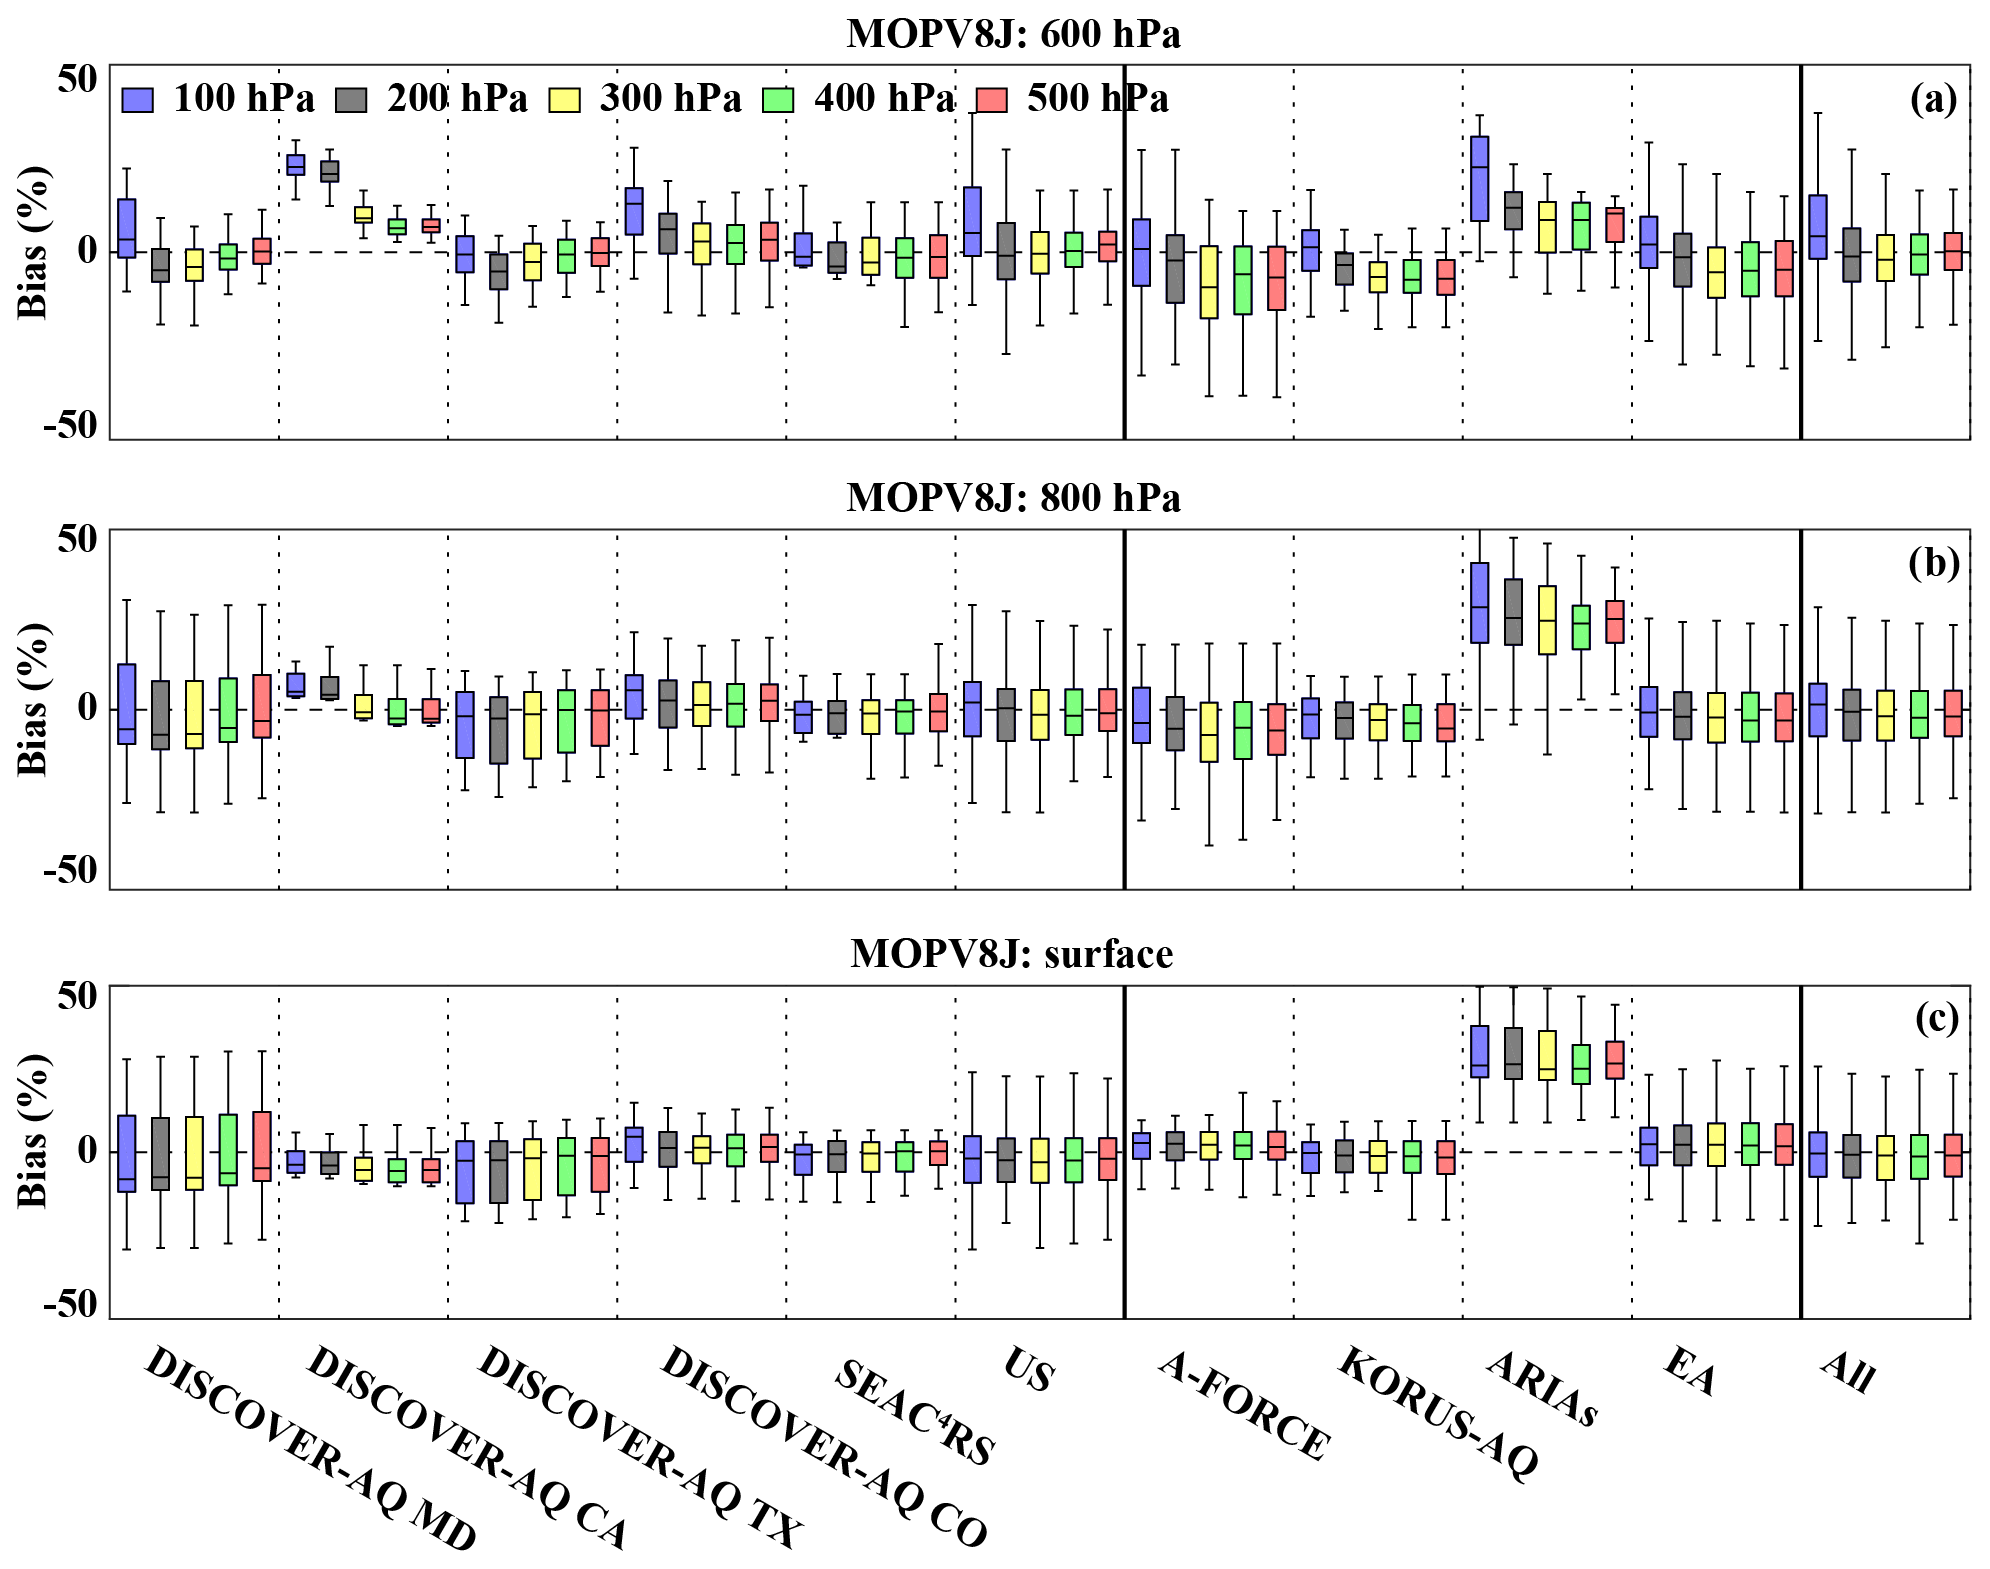
Figure 8Sensitivity to Pinterp. Biases (%) using 100 hPa (blue), 200 hPa (gray), 300 hPa (yellow), 400 hPa (green), and 500 hPa (red) as Pinterp at 600 hPa layer (a), 800 hPa layer (b), and the surface layer (c) are shown by box plot (with medians represented by middle bars, interquartile ranges between 25th and 75th percentiles represented by boxes, and the most extreme data points not considered outliers represented by whiskers). The biases are calculated against all (both urban and non-urban) in situ profiles listed in Table 1. The “200 hPa” values (gray bars) in this figure are the same as yellow bars (for all data) in Fig. 6. See the caption of Fig. 6 for the definition of outliers.
4.1 Sensitivity to the in situ profile extension
As discussed in Sect. 2.3, the in situ profiles must be vertically extrapolated or extended to compare with MOPITT products due to aircraft altitude limits. Thus, model or reanalysis data must be merged with the in situ data to generate a complete CO profile for comparisons with MOPITT satellite retrievals. The use of model or reanalysis data may introduce uncertainties in the comparison results as they are not measured directly. The parameter Pinterp controls the impact of the model-based profile extension on the shape and value of in situ profiles (see Fig. S5). Here we test the sensitivity of validation results to various Pinterp values (100, 200, 300, 400, 500 hPa) to demonstrate the potential impact of the profile extension. Note that the model-based profile extension and the value of Pinterp impacts the validation results through changing the augmented observational profile, which is different from the other sensitivity tests in this study that change the selection of MOPITT data. The agreements between the values of MOPITT and in situ profiles at the surface layer are insensitive to the selection of Pinterp (Fig. 8). The overall agreements between the values of MOPITT and in situ profiles at the 800 hPa layer are also not sensitive to Pinterp, except for the results against DISCOVER-AQ CA, which have slightly larger biases when Pinterp is 200 hPa or 100 hPa since the DISCOVER-AQ CA aircraft profiles at 600 hPa and above are mostly extended using reanalysis data. Therefore, the comparisons with DISCOVER-AQ CA are more likely to be affected by Pinterp compared to other campaigns which typically obtained higher maximum aircraft altitudes. At the 600 hPa layer, the agreements between the values of MOPITT and in situ profiles are affected more by Pinterp compared to the those at the surface layer and the 800 hPa layer for comparisons with all the campaigns. The overall validation results using 100 hPa as Pinterp have larger biases than using other values of Pinterp. At 400 hPa layer and 200 hPa layer, the comparisons are even more sensitive to Pinterp for all the campaigns (Fig. S6). The CAMS 3-hourly reanalysis data are constrained by observations, but their use may still introduce the uncertainties in the validation results especially at upper pressure levels (e.g., 200 and 400 hPa). Previous MOPITT evaluation results may be subject to larger uncertainties by using CAM-chem monthly CO fields that are not constrained by observations (e.g., Deeter et al., 2012, 2016).
4.2 Sensitivity to the radius and allowed maximum time difference as criteria for co-location
The criteria for co-location in this study (within a radius of 100 km and within 12 h of the acquisition of the aircraft profile) generally follow previous MOPITT validation studies (e.g., Deeter et al., 2016, 2019) and are chosen empirically. They are selected based on a trade-off between uncertainties generated from CO spatial and/or temporal variability and the number of included MOPITT retrievals that impacts the statistical robustness. Here we test the sensitivity of the results to the two criteria for co-location. The box plot of biases calculated with different radii (200, 100, 50, and 25 km) at the surface layer, the 800 hPa layer, and the 600 hPa layer are shown in Fig. 9. Overall, the biases calculated with a radius of 200, 100, and 50 km are similar, whereas the biases calculated with the radius of 25 km are different from others. The comparisons of MOPITT to in situ profile results using the radius of 25 km generally have larger biases and SD, due to including fewer MOPITT retrievals. In some cases, there are no matched MOPITT retrievals within the radius of 25 km of the aircraft profile (e.g., DISCOVER-AQ CA and ARIAs). In addition, representativeness errors would be expected to go up if there are only a few retrievals over a more polluted and perhaps heterogeneous area. We note that the use of the largest radius (200 km) in this paper does not appear to degrade the overall results, even though representativeness errors generated from CO spatial and/or temporal variability are expected to increase. However, the use of the smallest radius (25 km) degrades the overall results by reducing the number of included MOPITT retrievals.

Figure 9Sensitivity to the radius as criteria for co-location. Biases (%) using 200 km (blue), 100 km (gray), 50 km (green), and 25 km (pink) as the radius for co-location at 600 hPa layer (a), 800 hPa layer (b), and the surface layer (c) are shown by box plot (with medians represented by middle bars, interquartile ranges between 25th and 75th percentiles represented by boxes, and the most extreme data points not considered outliers represented by whiskers). The numbers in (c) correspond to the number of in situ profiles qualified for validation within the given radius. The biases are calculated against all (both urban and non-urban) in situ profiles listed in Table 1. The “100 km” values (gray bars) are the same as yellow bars (for all data) in Fig. 6. See the caption of Fig. 6 for the definition of outliers.
The box plot of biases calculated with four sets of allowed maximum time difference (12, 6, 3, and 1 h) are shown in Fig. 10. The overall results are not sensitive to the selection of allowed maximum time difference. One exception is the comparisons to the SEAC4RS campaign at the 600 hPa layer, due to a smaller number of MOPITT retrievals in the shorter time window. We note that when comparing to the ARIAs campaign, using 1 h as the allowed maximum time difference decreases the biases at the surface layer, the 800 hPa layer, and the 600 hPa layer, compared to the cases using a longer allowed maximum time difference (i.e., 3, 6, and 12 h). This implies that the temporal variability is relatively large in the region. And the improvement observed for ARIAs for the shortest time also points to the possibility that short-term emission sources might be responsible for the large biases there. On the other hand, when the allowed maximum time difference equals 1 h, there are only six aircraft profiles that match MOPITT retrievals.
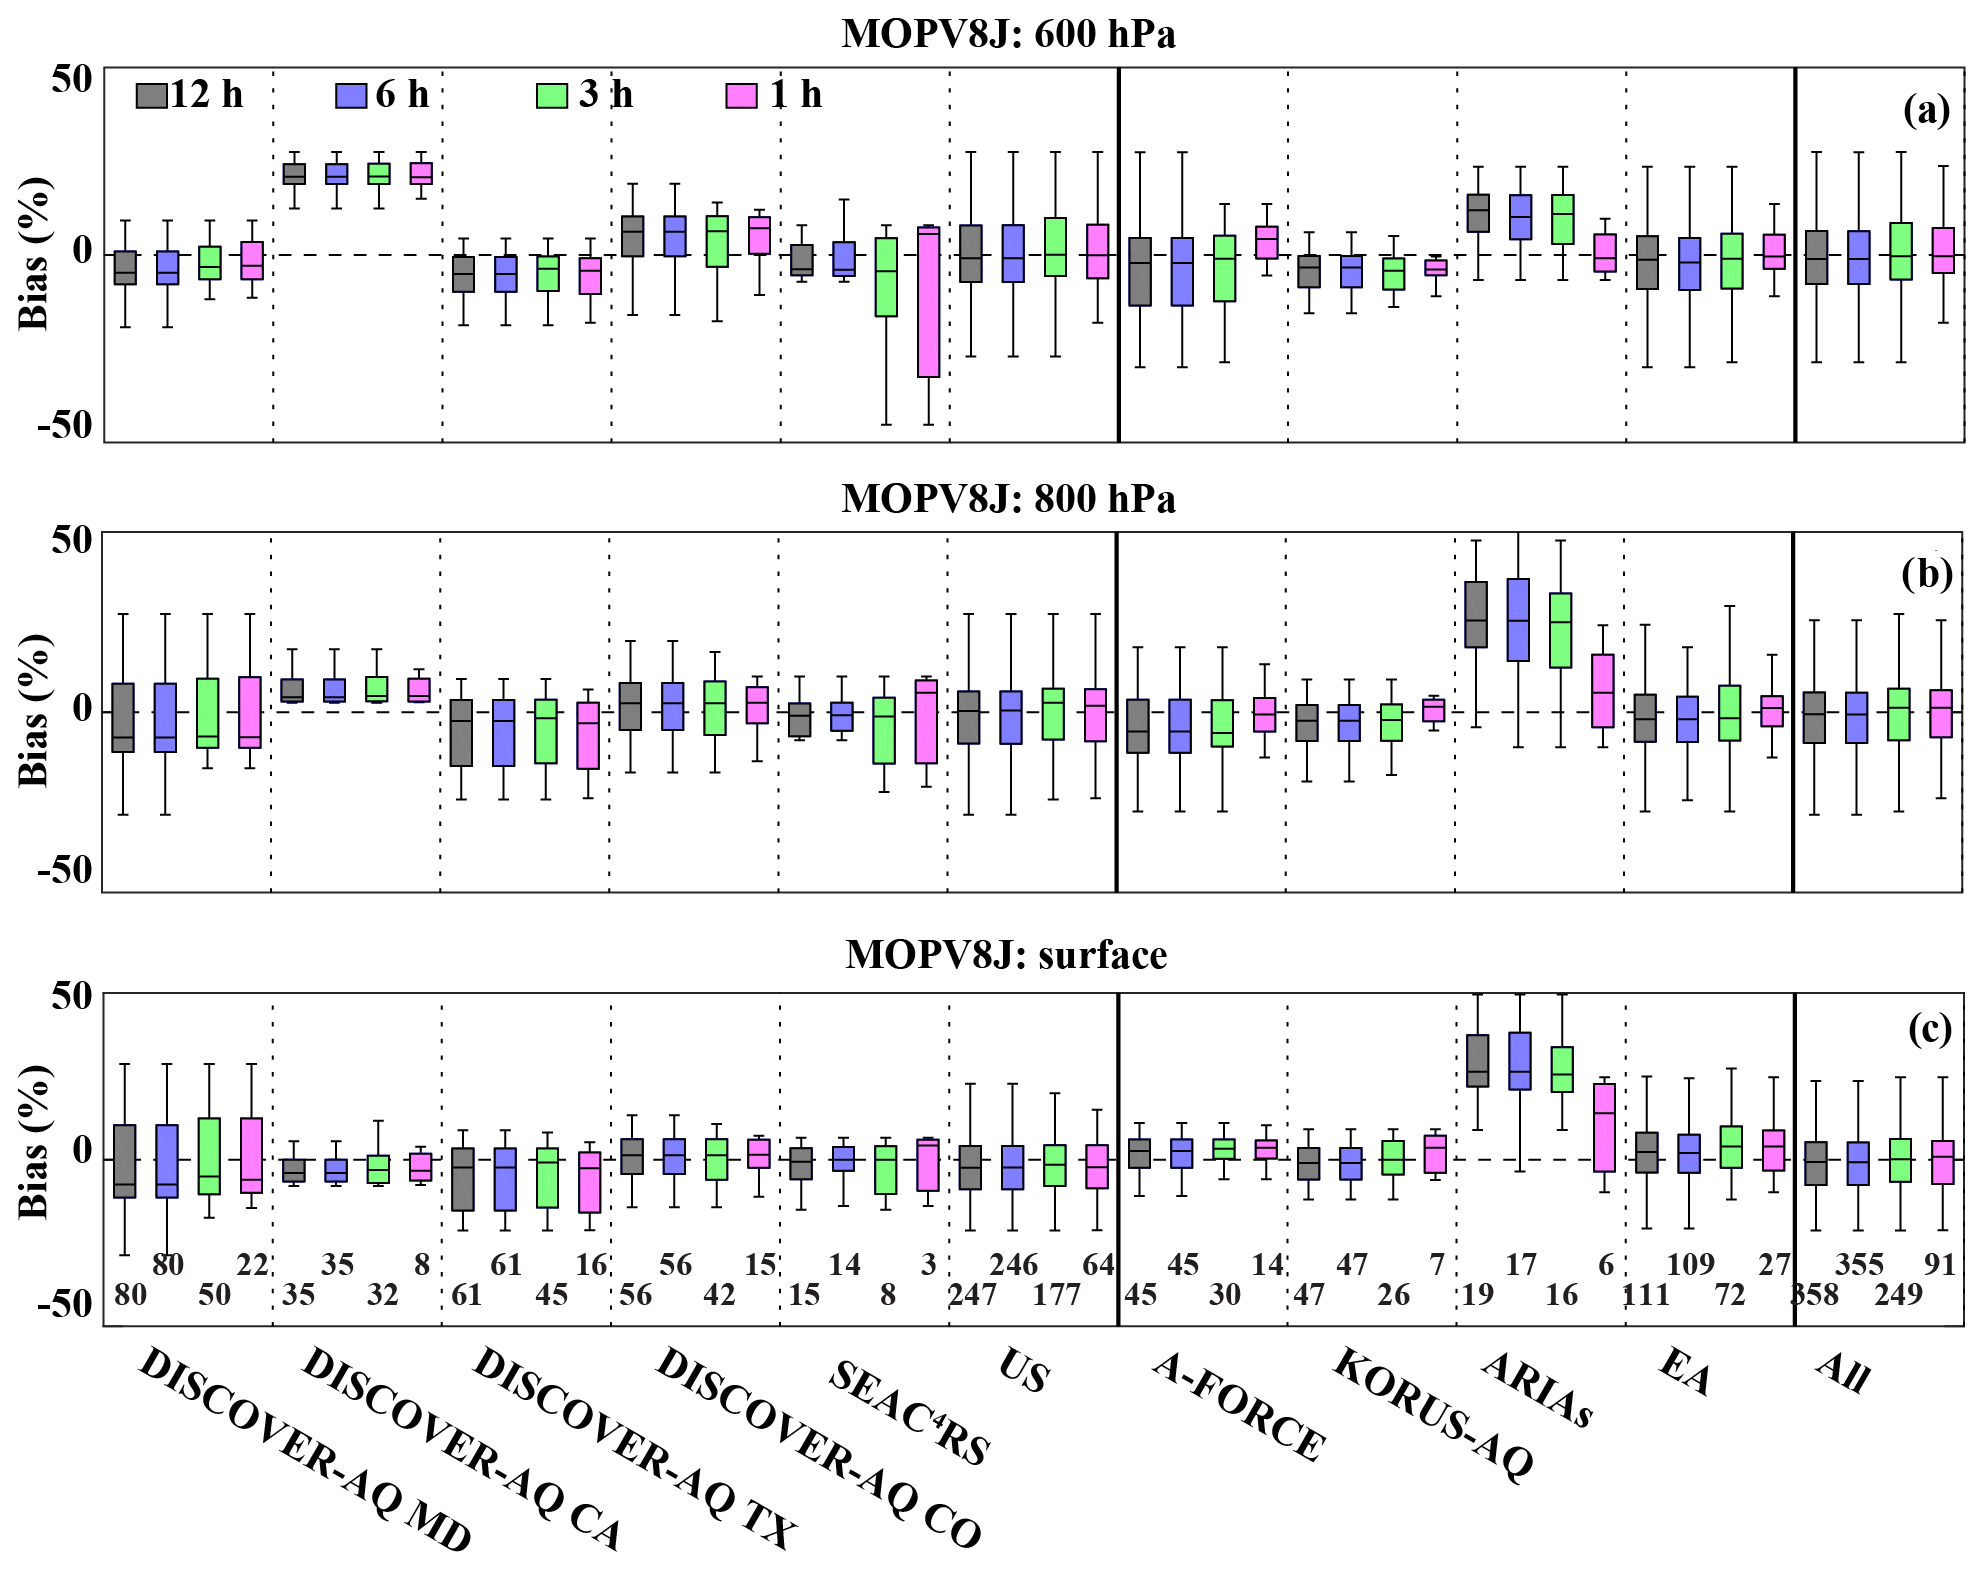
Figure 10Sensitivity to the allowed maximum time difference as criteria for co-location. Biases (%) using 12 h (gray), 6 h (blue), 3 h (green), and 1 h (pink) as the allowed maximum time difference for co-location at 600 hPa layer (a), 800 hPa layer (b), and the surface layer (c) are shown by box plot (with medians represented by middle bars, interquartile ranges between 25th and 75th percentiles represented by boxes, and the most extreme data points not considered outliers represented by whiskers). The numbers in (c) correspond to the number of in situ profiles qualified for validation within the given allowed maximum time difference. The biases are calculated against all (both urban and non-urban) in situ profiles listed in Table 1. The “12 h” values (gray bars) are the same as yellow bars (for all data) in Fig. 6. See the caption of Fig. 6 for the definition of outliers.
4.3 Sensitivity to the inclusion of MOPITT nighttime retrievals
Previous MOPITT validation studies have only included MOPITT daytime observations. Over land, MOPITT retrievals for daytime and nighttime overpasses are characterized by significantly different averaging kernels (Fig. 3) and may be subject to different types of retrieval error (Deeter et al., 2007). CO has a long enough lifetime (approximately 1 month; Gamnitzer et al., 2006) in the free troposphere that nighttime observations could be potentially comparable, in general, to the daytime flights for remote sites. However, for urban regions where the spatiotemporal variability of the emissions and evolution of the planetary boundary layer drives large changes in the measured CO, comparisons of MOPITT nighttime observations to aircraft profiles sampled during the daytime may introduce representative uncertainties, especially for areas that are subject to strong nocturnal inversions, and the surface CO can be enhanced. It is difficult to disentangle the effects of the MOPITT daytime or nighttime performance and the uncertainty from the temporal representativeness, based on the comparison of the MOPITT daytime or nighttime retrievals with daytime aircraft profiles. Therefore, we only include the results in Fig. S7 and briefly describe the results here without drawing any further conclusions. Overall, MOPITT nighttime retrievals have larger biases than daytime retrievals, which could be expected since most of the aircraft profiles are sampled during the daytime. Flight campaigns with nighttime observations are needed to validate MOPITT nighttime retrievals.
4.4 Sensitivity to the signal-to-noise ratio (SNR) filters
The MOPITT Level 3 data are generated from Level 2 data, and are available as gridded () daily mean and monthly mean files. Pixel filtering and SNR thresholds for Channel 5 and 6 average radiances are used when averaging Level 2 data into Level 3 data, and this increases overall mean DFS values (details can be found in the MOPITT Version 8 Product User's Guide, 2018). Taking the MOPITT V8J daytime product as an example, the Level 3 data product excludes all observations from Pixel 3 (one of the four elements of MOPITT's linear detector array that has highly variable Channel 7 SNR values) or observations where both the Channel 5 average radiance SNR <1000 and the Channel 6 average radiance SNR <400. In Fig. 11, we test the impact of applying the aforementioned SNR filters to the agreement between MOPITT and in situ profiles. Note that we are not suggesting the comparisons between MOPITT Level 3 product and aircraft measurements. Because the MOPITT Level 3 product is gridded data, and it represents the average value in a grid. Comparing the grid average value to an aircraft profile within it may be subject to large representativeness errors. Here we only show the sensitivity of agreement between MOPITT Level 2 data and aircraft profiles to the application of SNR filters. We find that applying the SNR filters does not significantly change the overall agreement between MOPITT retrievals and the in situ profiles used in this study. This is mostly because applying the SNR filters reduces the number of MOPITT retrievals included in the comparisons. This effect is particularly important if there are not many MOPITT retrievals to begin with (such as our comparisons with in situ profiles in this study). Even though applying SNR filter when generating Level 3 data does not significantly change the agreement with the in situ profiles used in this study, excluding low-SNR observations from the Level 3 cell-averaged values raises overall mean DFS values (MOPITT Algorithm Development Team, 2018). In addition, the Level 3 product typically is less affected by random retrieval errors (e.g., due to instrument noise or geophysical noise).
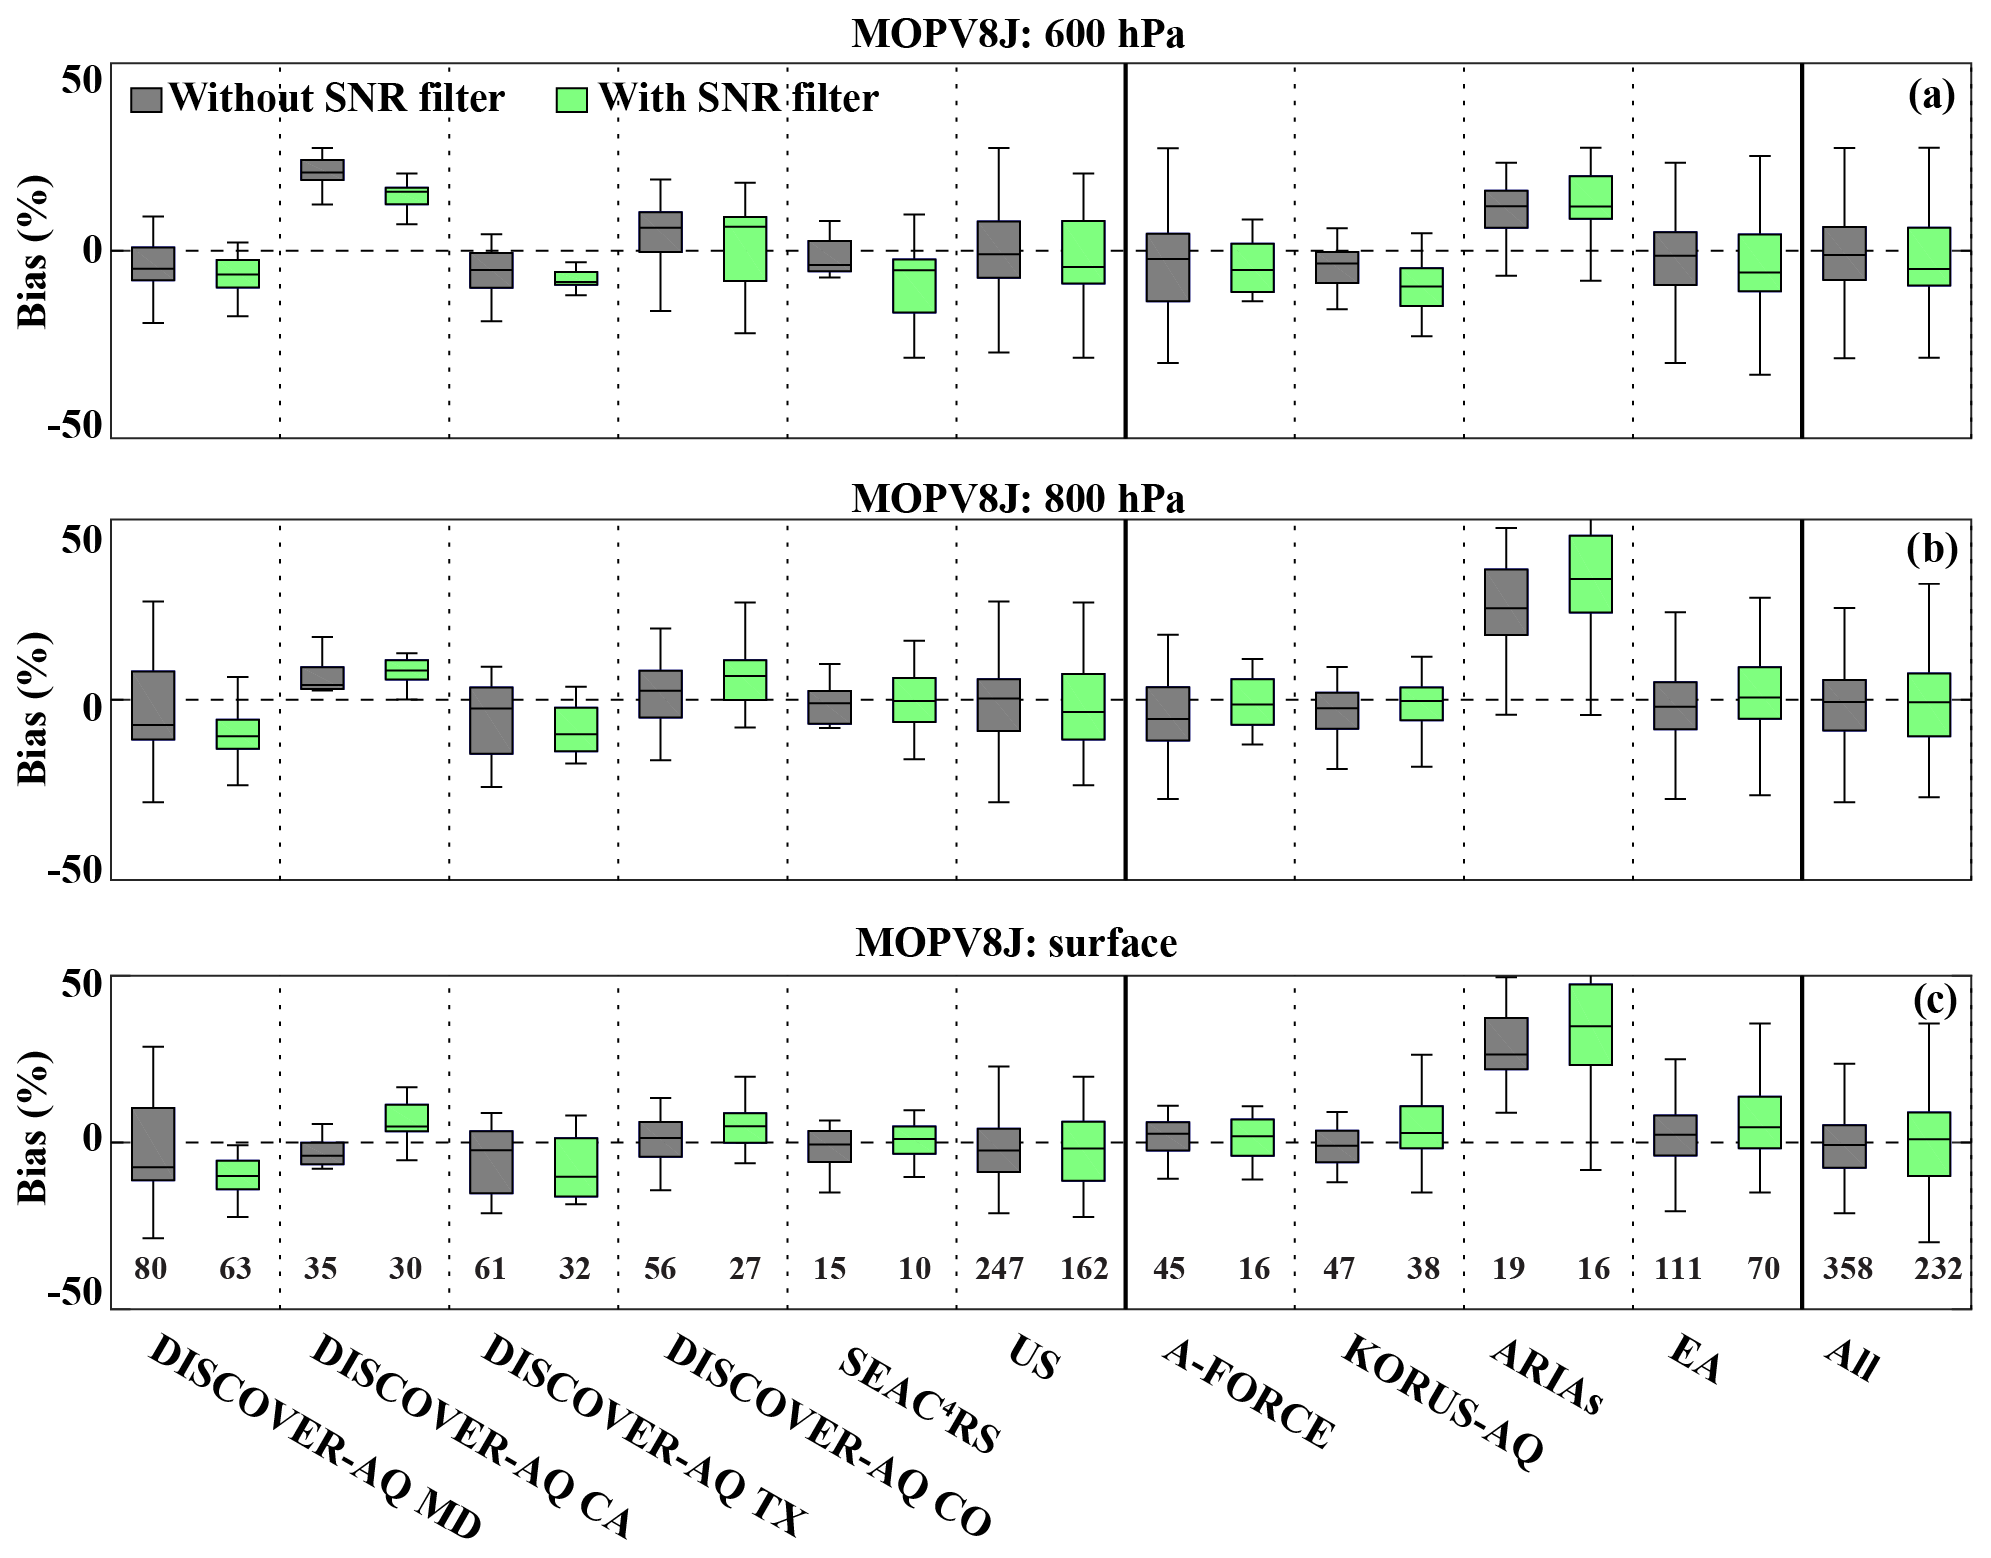
Figure 11Sensitivity to the signal-to-noise ratio (SNR) filters. Biases (%) for MOPITT retrievals without SNR filters (gray) and MOPITT retrievals with SNR filters (green) at 600 hPa layer (a), 800 hPa layer (b), and the surface layer (c) are shown by box plot (with medians represented by middle bars, interquartile ranges between 25th and 75th percentiles represented by boxes, and the most extreme data points not considered outliers represented by whiskers). The numbers in (c) correspond to the number of in situ profiles qualified for validation without or with SNR filters. The biases are calculated against all (both urban and non-urban) in situ profiles listed in Table 1. The “without SNR filter” values (gray bars) in this figure are the same as yellow bars (for all data) in Fig. 6. See the caption of Fig. 6 for the definition of outliers.
MOPITT products are widely used for monitoring and analyzing CO over urban regions. However, systematic validation against observations over urban regions has been lacking. In this study, we compared MOPITT products over urban regions to aircraft measurements from DISCOVER-AQ, SEAC4RS, ARIAs, A-FORCE, and KORUS-AQ campaigns. The DISCOVER-AQ campaign was designed primarily with satellite validation in mind, and the campaign over MD, CA, Texas (TX), and Colorado (CO) together contributes 64.8 % (232 out of 358) of the aircraft profiles and 91.0 % (121 out of 133) of the aircraft profiles over the urban regions in this study (Table 1). Therefore, the DISCOVER-AQ campaign largely contributes to the results and the statistics in this study. We found that MOPITT mean biases are well within the 10 % required accuracy (Drummond and Mand, 1996) for both urban and non-urban regions (mean biases for V8J and V8T vary from −0.7 % to 0.0 % and from 2.0 % to 3.5 % for different levels). The performance over non-urban regions is better than that over urban regions in terms of correlation coefficients for the 6 products in Table 2 and biases of V8J and V7J. However, the in situ profiles over East Asia used in this study are limited, especially over urban regions (only 11 profiles). The large biases against aircraft profiles from the A-FORCE and ARIAs campaigns point to the need for more in situ observations over East Asia. We also studied the impact of CO concentrations on the agreement between MOPITT products and in situ profiles by dividing the aircraft profiles of CO into two groups of high CO (upper 50 %) and low CO (lower 50 %). We found that MOPITT retrievals at high CO concentrations have higher biases and lower correlations compared with low CO concentrations, although CO variability may tend to exaggerate retrieval biases in heavily polluted scenes. The statistics are often very similar between different versions and products over urban and non-urban regions, and in general, MOPITT agrees reasonably well with the in situ profiles in both cases. There is not, therefore, any reason to recommend the continued use of MOPITT versions earlier than V8 based on urban or non-urban region considerations. In general, MOPITT V8 is recommended (Deeter et al., 2019) as it uses a new parameterized radiance bias correction method to minimize retrieval biases and has updated spectroscopic data for water vapor and nitrogen.
In addition, the assumptions and data filters made during aircraft–satellite comparisons may impact the validation results. We tested the sensitivities of the results to assumptions and data filters, including the model-based extension to the in situ profile, radius, and allowed maximum time difference as criteria for the selection of co-located data, the inclusion of nighttime MOPITT data, and the SNR filters. The agreements between the values of MOPITT and in situ profiles at the surface layer are insensitive to the model-based profile extension, whereas the results at upper levels (e.g., 400 and 200 hPa) are more sensitive to the profile extension, as there are very limited aircraft observations. The results are insensitive to the allowed maximum time difference as a co-location criteria and are generally insensitive to the radius for co-location except for the case with a radius of 25 km, where only a small number of MOPITT retrievals are included in the comparisons. Overall, daytime MOPITT products overall have smaller biases than nighttime MOPITT products. However, conclusions regarding the performance of MOPITT daytime and nighttime retrievals cannot be drawn due to the fact that most of the aircraft profiles are sampled during the daytime. As we mentioned earlier, MOPITT daytime and nighttime retrievals may be subject to different retrieval errors. In addition, previous studies suggest pollutants themselves may have different characteristics during the daytime and nighttime (e.g., Yan et al., 2018). Therefore, validation of MOPITT nighttime retrievals, with a sufficient number of nighttime airborne profiles, is needed in order to study nighttime CO characteristics and trends. Applying SNR filters does not necessarily change the overall agreement between MOPITT retrievals and in situ profiles used in this study significantly, and this may be partially caused by the smaller number of MOPITT retrievals in the comparisons after the SNR filters. We note that comparisons to ARIAs are exceptional in a few sensitivity tests due to rather a limited number of aircraft measurements. Given the large biases against aircraft profiles from the ARIAs campaign, more in situ observations over East Asia, especially China, are needed in order to validate MOPITT products in the region.
Validation and evaluation of satellite retrievals with aircraft observations are very challenging, and assumptions have to be made for the comparisons. As discussed in Sect. 2, the CO spatial variability within MOPITT retrieval pixels and the representativeness error of aircraft profiles when compared to MOPITT retrievals may introduce uncertainties in the validation results. This issue is difficult to address and quantify due to the limited spatial coverage of dense aircraft observations. One possible way is to study NO2 data retrieved from the Geostationary Trace Gas and Aerosol Sensor Optimization (GeoTASO) at very high resolution (250 m×250 m), to provide an upper estimate on CO variability. Moreover, the variability of Tropospheric Monitoring Instrument (TROPOMI) CO retrievals (resolution: 7 km×7 km; Landgraf et al., 2016) might also provide information on MOPITT sub-pixel variability. Further research on trace gas spatial variability within satellite retrieval pixels and quantification of the representativeness error incurred by comparing individual aircraft profiles to satellite products are needed and will be the subject of a follow-up study.
MOPITT products are available at https://www2.acom.ucar.edu/mopitt (last access: 14 January 2020, Deeter et al., 2019). The MOPITT Version 8 Product User's Guide is available online at https://www2.acom.ucar.edu/sites/default/files/mopitt/v8_users_guide_201812.pdf (last access: 15 January 2020). DISCOVER-AQ data can be accessed at https://www-air.larc.nasa.gov/missions/discover-aq/discover-aq.html (last access: 14 January 2020, DISCOVER-AQ Science Team, 2014). SEAC4RS data can be accessed at https://www-air.larc.nasa.gov/missions/seac4rs/ (last access: 14 January 2020, SEAC4RS Science Team, 2013). KORUS-AQ and ARIAs data can be accessed at https://www-air.larc.nasa.gov/missions/korus-aq/index.html (last access: 14 January 2020, KORUS-AQ science team, 2016; Wang et al., 2018). A-FORCE data are available upon request (Yutaka Kondo: kondo.yutaka@nipr.ac.jp). The MODIS Land Cover Type Global product (MCD12C1 v006) is available at https://earthdata.nasa.gov/ (last access: 14 January 2020, Friedl and Sulla-Menashe, 2015).
The supplement related to this article is available online at: https://doi.org/10.5194/amt-13-1337-2020-supplement.
WT, HMW, and MND designed the study. WT analyzed the data with help from MND, SMA, and LKE. GSD provided CO measurements during DISCOVER-AQ SEAC4RS, and KORUS-AQ. RRD, XR, and HH provided CO measurements during ARIAs. YK provided CO measurements during A-FORCE. HMW, MND, DPE, LKE, BG, RRB, and XR offered valuable discussions and comments in improving the study. WT prepared the paper with improvements from all the other coauthors.
The authors declare that they have no conflict of interest.
This material is based upon work supported by the National Center for Atmospheric Research, which is a major facility sponsored by the National Science Foundation under Cooperative Agreement No. 1852977. Wenfu Tang is supported by an NCAR Advanced Study Program Postdoctoral Fellowship. The NCAR MOPITT project is supported by the National Aeronautics and Space Administration (NASA) Earth Observing System (EOS) Program. The authors thank the DISCOVER-AQ, SEAC4RS, ARIAs, A-FORCE, and KORUS-AQ Science Teams for the valuable in situ observations. We thank Naga Oshima and Makoto Koike for the A-FORCE data. ARIAs was supported by NSF (grant no. 1558259) and the National Institute of Standards and Technology (NIST, grant no. 70NANB14H332). The authors thank Frank Flocke for helpful comments on the paper. Wenfu Tang thanks Cenlin He for helpful discussions.
This material is based upon work supported by the National Center for Atmospheric Research, which is a major facility sponsored by the National Science Foundation under Cooperative Agreement no. 1852977. Wenfu Tang is supported by an NCAR Advanced Study Program Postdoctoral Fellowship. The NCAR MOPITT project is supported by the National Aeronautics and Space Administration (NASA) Earth Observing System (EOS) Program. ARIAs was supported by NSF (grant no. 1558259) and the National Institute of Standards and Technology (NIST, grant no. 70NANB14H332).
This paper was edited by Andre Butz and reviewed by three anonymous referees.
Aliyu, Y. A. and Botai, J. O.: Appraising city-scale pollution monitoring capabilities of multi-satellite datasets using portable pollutant monitors, Atmos. Environ., 179, 239–249, 2018.
Al-Saadi, J., Carmichael, G., Crawford, J., Emmons, L., Song, CK., Chang, L.-S., Lee G., Kim, J., and Park, R.: NASA contributions to KORUS-AQ: An international cooperative air quality field study in Korea. NASA White Paper available at: https://goo.gl/VhssdX (last access: 3 May 2016), 2015.
Arellano, A. F., Kasibhatla, P. S., Giglio, L., van der Werf, G. R., and Randerson, J. T.: Topdown estimates of global CO sources using MOPITT measurements, Geophys. Res. Lett., 31, L01104, https://doi.org/10.1029/2003GL018609, 2004.
Arellano, A. F., Kasibhatla, P. S., Giglio, L., van der Werf, G. R., Randerson, J. T., and Collatz, G. J.:, Time-dependent inversion estimates of global biomass-burning CO emissions using Measurement of Pollution in the Troposphere (MOPITT) measurements, J. Geophys. Res., 111, D09303, https://doi.org/10.1029/2005JD006613, 2006.
Arellano, A. F., Raeder, K., Anderson, J. L., Hess, P. G., Emmons, L. K., Edwards, D. P., Pfister, G. G., Campos, T. L., and Sachse, G. W.: Evaluating model performance of an ensemble-based chemical data assimilation system during INTEX-B field mission, Atmos. Chem. Phys., 7, 5695–5710, https://doi.org/10.5194/acp-7-5695-2007, 2007.
Buchholz, R. R., Deeter, M. N., Worden, H. M., Gille, J., Edwards, D. P., Hannigan, J. W., Jones, N. B., Paton-Walsh, C., Griffith, D. W. T., Smale, D., Robinson, J., Strong, K., Conway, S., Sussmann, R., Hase, F., Blumenstock, T., Mahieu, E., and Langerock, B.: Validation of MOPITT carbon monoxide using ground-based Fourier transform infrared spectrometer data from NDACC, Atmos. Meas. Tech., 10, 1927–1956, https://doi.org/10.5194/amt-10-1927-2017, 2017.
Chen, D., Wang, Y., McElroy, M. B., He, K., Yantosca, R. M., and Le Sager, P.: Regional CO pollution and export in China simulated by the high-resolution nested-grid GEOS-Chem model, Atmos. Chem. Phys., 9, 3825–3839, https://doi.org/10.5194/acp-9-3825-2009, 2009.
Clerbaux, C., Edwards, D. P., Deeter, M., Emmons, L., Lamarque, J.-F., Tie, X. X., Massie, S. T., and Gille, J.: Carbon monoxide pollution from cities and urban areas observed by the Terra/MOPITT mission, Geophys. Res. Lett., 35, 3817, https://doi.org/10.1029/2007GL032300, 2008.
Deeter, M. N., Emmons, L. K., Francis, G. L., Edwards, D. P., Gille, J. C., Warner, J. X., Khattatov, B., Ziskin, D., Lamarque, J.-F., Ho, S.-P., Yudin, V., Attie, J.-L., Packman, D., Chen, J., Mao, D., and Drummond, J. R.: Operational carbon monoxide retrieval algorithm and selected results for the MOPITT instrument, J. Geophys. Res., 108, 4399, https://doi.org/10.1029/2002JD003186, 2003.
Deeter, M. N., Edwards, D. P., Gille, J. C., Emmons, L. K., Francis, G., Ho, S.-P., Mao, D., Masters, D., Worden, H., Drummond, J. R., and Novelli, P. C.: The MOPITT version 4 CO product: Algorithm enhancements, validation, and long-term stability, J. Geophys. Res., 115, D07306, https://doi.org/10.1029/2009JD013005, 2010.
Deeter, M. N., Worden, H. M., Gille, J. C., Edwards, D. P., Mao, D., and Drummond, J. R.: MOPITT multispectral CO retrievals: Origins and effects of geophysical radiance errors, J. Geophys. Res., 116, D15303, https://doi.org/10.1029/2011JD015703, 2011.
Deeter, M. N., Worden, H. M., Edwards, D. P., Gille, J. C., and Andrews, A. E.: Evaluation of MOPITT Retrievals of Lowertropospheric Carbon Monoxide over the United States, J. Geophys. Res., 117, D13306, https://doi.org/10.1029/2012JD017553, 2012.
Deeter, M. N., Martínez-Alonso, S., Edwards, D. P., Emmons, L. K., Gille, J. C., Worden, H. M., Pittman, J. V., Daube, B. C., and Wofsy, S. C.: Validation of MOPITT Version 5 thermalinfrared, near-infrared, and multispectral carbon monoxide profile retrievals for 2000–2011, J. Geophys. Res., 118, 6710–6725, https://doi.org/10.1002/jgrd.50272, 2013.
Deeter, M. N., Martínez-Alonso, S., Edwards, D. P., Emmons, L. K., Gille, J. C., Worden, H. M., Sweeney, C., Pittman, J. V., Daube, B. C., and Wofsy, S. C.: The MOPITT Version 6 product: algorithm enhancements and validation, Atmos. Meas. Tech., 7, 3623–3632, https://doi.org/10.5194/amt-7-3623-2014, 2014.
Deeter, M. N., Martínez-Alonso, S., Gatti, L. V., Gloor, M., Miller, J. B., Domingues, L. G., and Correia, C. S. C.: Validation and analysis of MOPITT CO observations of the Amazon Basin, Atmos. Meas. Tech., 9, 3999–4012, https://doi.org/10.5194/amt-9-3999-2016, 2016.
Deeter, M. N., Edwards, D. P., Francis, G. L., Gille, J. C., Martínez-Alonso, S., Worden, H. M., and Sweeney, C.: A climate-scale satellite record for carbon monoxide: the MOPITT Version 7 product, Atmos. Meas. Tech., 10, 2533–2555, https://doi.org/10.5194/amt-10-2533-2017, 2017.
Deeter, M. N., Edwards, D. P., Francis, G. L., Gille, J. C., Mao, D., Martínez-Alonso, S., Worden, H. M., Ziskin, D., and Andreae, M. O.: Radiance-based retrieval bias mitigation for the MOPITT instrument: the version 8 product, Atmos. Meas. Tech., 12, 4561–4580, https://doi.org/10.5194/amt-12-4561-2019, 2019.
DISCOVER-AQ Science Team: DISCOVER-AQ P-3B Aircraft In-situ Trace Gas Measurements Version 1 – ICARTT File [Data set], NASA Langley Atmospheric Science Data Center DAAC, https://doi.org/10.5067/AIRCRAFT/DISCOVER-AQ/AEROSOL-TRACEGAS, 2014.
Drummond, J. R. and Mand, G. S.: The Measurements of Pollution in the Troposphere (MOPITT) instrument: Overall performance and calibration requirements, J. Atmos. Ocean. Tech., 13, 314–320, 1996.
Edwards, D., Halvorson, C., and Gille, J.: Radiative transfer modeling for the EOS Terra satellite Measurement of Pollution in the Troposphere (MOPITT) instrument, J. Geophys. Res., 104, 16755–16775, 1999.
Edwards, D. P., Petron, G., Novelli, P. C., Emmons, L. K., Gille, J. C., and Drummond, J. R.: Southern Hemisphere carbon monoxide interannual variability observed by Terra/Measurement of Pollution in the Troposphere (MOPITT), J. Geophys. Res., 111, D16303, https://doi.org/10.1029/2006JD007079, 2006.
Emmons, L. K., Deeter, M. N., Gille, J. C., Edwards, D. P., Attié, J.- L., Warner, J., Ziskin, D., Francis, G., Khattatov, B., Yudin, V., Lamarque, J.-F., Ho, S.-P., Mao, D., Chen, J. S., Drummond, J., Novelli, P., Sachse, G., Coffey, M. T., Hannigan, J. W., Gerbig, C., Kawakami, S., Kondo, Y., Takegawa, N., Schlager, H., Baehr, J., and Ziereis, H.: Validation of Measurements of Pollution in the Troposphere (MOPITT) CO retrievals with aircraft in situ profiles, J. Geophys. Res., 109, D03309, https://doi.org/10.1029/2003JD004101, 2004.
Emmons, L. K., Pfister, G. G., Edwards, D. P., Gille, J. C., Sachse, G., Blake, D., Wofsy, S., Gerbig, C., Matross, D., and Nédélec, P.: Measurements of Pollution in the Troposphere (MOPITT) validation exercises during summer 2004 field campaigns over North America, J. Geophys. Res., 112, D12S02, https://doi.org/10.1029/2006JD007833, 2007.
Emmons, L. K., Edwards, D. P., Deeter, M. N., Gille, J. C., Campos, T., Nédélec, P., Novelli, P., and Sachse, G.: Measurements of Pollution In The Troposphere (MOPITT) validation through 2006, Atmos. Chem. Phys., 9, 1795–1803, https://doi.org/10.5194/acp-9-1795-2009, 2009.
Emmons, L. K., Walters, S., Hess, P. G., Lamarque, J.-F., Pfister, G. G., Fillmore, D., Granier, C., Guenther, A., Kinnison, D., Laepple, T., Orlando, J., Tie, X., Tyndall, G., Wiedinmyer, C., Baughcum, S. L., and Kloster, S.: Description and evaluation of the Model for Ozone and Related chemical Tracers, version 4 (MOZART-4), Geosci. Model Dev., 3, 43–67, https://doi.org/10.5194/gmd-3-43-2010, 2010.
Fishman, J., Silverman, M. L., Crawford, J. H., and Creilson, J. K.: A study of regional-scale variability of in situ and model-generated tropospheric trace gases: Insights into observational requirements for a satellite in geostationary orbit, Atmos. Environ., 45, 4682–4694, 2011.
Follette-Cook, M., Pickering, K., Crawford, J., Duncan, B., Loughner, C., Diskin, G., Fried, A., and Weinheimer, A.: Spatial and temporal variability of trace gas columns derived from WRF/Chem regional model output: Planning for geostationary observations of atmospheric composition, Atmos. Environ., 118, 28–44, https://doi.org/10.1016/j.atmosenv.2015.07.024, 2015.
Fortems-Cheiney, A., Chevallier, F., Pison, I., Bousquet, P., Szopa, S., Deeter, M. N., and Clerbaux, C.: Ten years of CO emissions as seen from Measurements of Pollution in the Troposphere (MOPITT), J. Geophys. Res., 116, D05304, https://doi.org/10.1029/2010JD014416, 2011.
Friedl, M. and Sulla-Menashe, D.: MCD12C1 MODIS/Terra+Aqua Land Cover Type Yearly L3 Global 0.05Deg CMG V006 [Data set], NASA EOSDIS Land Processes DAAC, https://doi.org/10.5067/MODIS/MCD12C1.006, 2015.
Gamnitzer, U., Karstens, U., Kromer, B., Neubert, R. E., Meijer, H. A., Schroeder, H., and Levin, I.: Carbon monoxide: A quantitative tracer for fossil fuel CO2, J. Geophys. Res., 111, D22302, https://doi.org/10.1029/2005JD006966, 2006.
Gaubert, B., Arellano, A. F., Barré, J., Worden, H. M., Emmons, L. K., Tilmes, S., Buchholz, R. R.,Vitt, F., Raeder, K., Collins, N., Anderson, J. L., Wiedinmyer, C., Martinez Alonso, S., Edwards, D. P., Andreae, M. O., Hannigan, J. W., Petri, C., Strong, K., and Jones, N.: Toward a chemical reanalysis in a coupled chemistry-climate model: An evaluation of MOPITT CO assimilation and its impact on tropospheric composition, J. Geophys. Res.-Atmos., 121, 7310–7343, https://doi.org/10.1002/2016JD024863, 2016.
Girach, I. A. and Nair, P. R.: Carbon monoxide over Indian region as observed by MOPITT, Atmos. Environ., 99, 599–609, 2014.
He, H., Stehr, J. W., Hains, J. C., Krask, D. J., Doddridge, B. G., Vinnikov, K. Y., Canty, T. P., Hosley, K. M., Salawitch, R. J., Worden, H. M., and Dickerson, R. R.: Trends in emissions and concentrations of air pollutants in the lower troposphere in the Baltimore/Washington airshed from 1997 to 2011, Atmos. Chem. Phys., 13, 7859–7874, https://doi.org/10.5194/acp-13-7859-2013, 2013.
Heald, C. L., Jacob, D. J., Jones, D. B. A., Palmer, P. I., Logan, J. A., Streets, D. G., Sachse, G. W., Gille, J. C., Hoffman, R. N., and Nehrkorn, T.: Comparative inverse analysis of satellite (MOPITT) and aircraft (TRACE-P) observations to estimate Asian sources of carbon monoxide, J. Geophys. Res., 109, D23306, https://doi.org/10.1029/2004JD005185, 2004.
Hedelius, J. K., He, T.-L., Jones, D. B. A., Baier, B. C., Buchholz, R. R., De Mazière, M., Deutscher, N. M., Dubey, M. K., Feist, D. G., Griffith, D. W. T., Hase, F., Iraci, L. T., Jeseck, P., Kiel, M., Kivi, R., Liu, C., Morino, I., Notholt, J., Oh, Y.-S., Ohyama, H., Pollard, D. F., Rettinger, M., Roche, S., Roehl, C. M., Schneider, M., Shiomi, K., Strong, K., Sussmann, R., Sweeney, C., Té, Y., Uchino, O., Velazco, V. A., Wang, W., Warneke, T., Wennberg, P. O., Worden, H. M., and Wunch, D.: Evaluation of MOPITT Version 7 joint TIR–NIR XCO retrievals with TCCON, Atmos. Meas. Tech., 12, 5547–5572, https://doi.org/10.5194/amt-12-5547-2019, 2019.
Ho, S.-P., Edwards, D. P., Gille, J. C., Chen, J., Ziskin, D., Francis, G. L., Deeter, M. N., and Drummond, J. R.: Estimates of 4.7 µm surface emissivity and their impact on the retrieval of tropospheric carbon monoxide by Measurements of Pollution in the Troposphere (MOPITT), J. Geophys. Res.-Atmos., 110, D21308, https://doi.org/10.1029/2005JD005946, 2005.
Inness, A., Ades, M., Agustí-Panareda, A., Barré, J., Benedictow, A., Blechschmidt, A.-M., Dominguez, J. J., Engelen, R., Eskes, H., Flemming, J., Huijnen, V., Jones, L., Kipling, Z., Massart, S., Parrington, M., Peuch, V.-H., Razinger, M., Remy, S., Schulz, M., and Suttie, M.: The CAMS reanalysis of atmospheric composition, Atmos. Chem. Phys., 19, 3515–3556, https://doi.org/10.5194/acp-19-3515-2019, 2019.
Jiang, Z., Worden, J. R., Jones, D. B. A., Lin, J.-T., Verstraeten, W. W., and Henze, D. K.: Constraints on Asian ozone using Aura TES, OMI and Terra MOPITT, Atmos. Chem. Phys., 15, 99–112, https://doi.org/10.5194/acp-15-99-2015, 2015.
Jiang, Z., McDonald, B. C., Worden, H., Worden, J. R., Miyazaki, K., Qu, Z., Henze, D. K., Jones, D. B. A., Arellano, A. F., Fischer, E. V., Zhu, L. Y., and Boersma, K. F.: Unexpected slowdown of US pollutant emission reduction in the past decade, P. Natl. Acad. Sci. USA, 115, 5099–5104, https://doi.org/10.1073/pnas.1801191115, 2018.
Judd, L. M., Al-Saadi, J. A., Janz, S. J., Kowalewski, M. G., Pierce, R. B., Szykman, J. J., Valin, L. C., Swap, R., Cede, A., Mueller, M., Tiefengraber, M., Abuhassan, N., and Williams, D.: Evaluating the impact of spatial resolution on tropospheric NO2 column comparisons within urban areas using high-resolution airborne data, Atmos. Meas. Tech., 12, 6091–6111, https://doi.org/10.5194/amt-12-6091-2019, 2019.
Kanakidou, M., Mihalopoulos, N., Kindap, T., Im, U., Vrekoussis, M., Dermitzaki, E., Gerasopoulos, E., Unal, A., Koçak, M., Markakis, K., Melas, D., Youssef, A. F., and Moubasher, H.: Megacities as hot spots of air pollution in the East Mediterranean, 45, 1223–1235, https://doi.org/10.1016/j.atmosenv.2010.11.048, 2011.
Kar, J., Deeter, M. N., Fishman, J., Liu, Z., Omar, A., Creilson, J. K., Trepte, C. R., Vaughan, M. A., and Winker, D. M.: Wintertime pollution over the Eastern Indo-Gangetic Plains as observed from MOPITT, CALIPSO and tropospheric ozone residual data, Atmos. Chem. Phys., 10, 12273–12283, https://doi.org/10.5194/acp-10-12273-2010, 2010.
Kondo, Y., Moteki, N., Oshima, N., Ohata, S., Koike, M., Shibano, Y., Takegawa, N., and Kita, K.: Effects of wet deposition on the abundance and size distribution of black carbon in East Asia, J. Geophys. Res.-Atmos., 121, 4691–4712, https://doi.org/10.1002/2015JD024479, 2016.
Kopacz, M., Jacob, D. J., Henze, D. K., Heald, C. L., Streets, D. G., and Zhang, Q.: Comparison of adjoint and analytical Bayesian inversion methods for constraining Asian sources of carbon monoxide using satellite (MOPITT) measurements of CO columns, J. Geophys. Res., 114, D04305, https://doi.org/10.1029/2007JD009264, 2009.
Kopacz, M., Jacob, D. J., Fisher, J. A., Logan, J. A., Zhang, L., Megretskaia, I. A., Yantosca, R. M., Singh, K., Henze, D. K., Burrows, J. P., Buchwitz, M., Khlystova, I., McMillan, W. W., Gille, J. C., Edwards, D. P., Eldering, A., Thouret, V., and Nedelec, P.: Global estimates of CO sources with high resolution by adjoint inversion of multiple satellite datasets (MOPITT, AIRS, SCIAMACHY, TES), Atmos. Chem. Phys., 10, 855–876, https://doi.org/10.5194/acp-10-855-2010, 2010.
KORUS-AQ science team: KORUS-AQ: An International Cooperative Air Quality Field Study in Korea, available at: https://www465air.larc.nasa.gov/missions/korus-aq/ (last access: 18 March 2020), https://doi.org/10.5067/Suborbital/KORUSAQ/DATA01, 2016.
Kumar, R., Naja, M., Pfister, G. G., Barth, M. C., Wiedinmyer, C., and Brasseur, G. P.: Simulations over South Asia using the Weather Research and Forecasting model with Chemistry (WRF-Chem): chemistry evaluation and initial results, Geosci. Model Dev., 5, 619–648, https://doi.org/10.5194/gmd-5-619-2012, 2012.
Lamarque, J.-F., Emmons, L. K., Hess, P. G., Kinnison, D. E., Tilmes, S., Vitt, F., Heald, C. L., Holland, E. A., Lauritzen, P. H., Neu, J., Orlando, J. J., Rasch, P. J., and Tyndall, G. K.: CAM-chem: description and evaluation of interactive atmospheric chemistry in the Community Earth System Model, Geosci. Model Dev., 5, 369–411, https://doi.org/10.5194/gmd-5-369-2012, 2012.
Lamsal, L. N., Krotkov, N. A., Celarier, E. A., Swartz, W. H., Pickering, K. E., Bucsela, E. J., Gleason, J. F., Martin, R. V., Philip, S., Irie, H., Cede, A., Herman, J., Weinheimer, A., Szykman, J. J., and Knepp, T. N.: Evaluation of OMI operational standard NO2 column retrievals using in situ and surface-based NO2 observations, Atmos. Chem. Phys., 14, 11587–11609, https://doi.org/10.5194/acp-14-11587-2014, 2014.
Landgraf, J., aan de Brugh, J., Scheepmaker, R., Borsdorff, T., Hu, H., Houweling, S., Butz, A., Aben, I., and Hasekamp, O.: Carbon monoxide total column retrievals from TROPOMI shortwave infrared measurements, Atmos. Meas. Tech., 9, 4955–4975, https://doi.org/10.5194/amt-9-4955-2016, 2016.
Li, L. and Liu, Y.: Space-borne and ground observations of the characteristics of CO pollution in Beijing, 2000–2010, Atmos. Environ., 45, 2367, https://doi.org/10.1016/j.atmosenv.2011.02.026, 2011.
MOPITT Algorithm Development Team, MOPITT (Measurements of Pollution in the Troposphere) Version 8 Product User's Guide, available at: https://www2.acom.ucar.edu/sites/default/files/mopitt/v8_users_guide_201812.pdf (last access: 18 March 2020), 2018.
Oshima, N., Kondo, Y., Moteki, N., Takegawa, N., Koike, M., Kita, K., Matsui, H., Kajino, M., Nakamura, H., Jung, J. S., and Kim, Y. J.: Wet removal of black carbon in Asian outflow: Aerosol Radiative Forcing in East Asia (A-FORCE) aircraft campaign, J. Geophys. Res., 117, D03204, https://doi.org/10.1029/2011jd016552, 2012.
Pan, L., Gille, J. C., Edwards, D. P., Bailey, P. L., and Rodgers, C. D.: Retrieval of tropospheric carbon monoxide for the MOPITT experiment, J. Geophys. Res.-Atmos., 103, 32277–32290, 1998.
SEAC4RS Science Team: SEAC4RS Field Campaign Data, NASA Langley Atmospheric Science Data Center DAAC, https://doi.org/10.5067/aircraft/seac4rs/aerosol-tracegas-cloud, 2013.
Tang, W., Arellano, A. F., DiGangi, J. P., Choi, Y., Diskin, G. S., Agustí-Panareda, A., Parrington, M., Massart, S., Gaubert, B., Lee, Y., Kim, D., Jung, J., Hong, J., Hong, J.-W., Kanaya, Y., Lee, M., Stauffer, R. M., Thompson, A. M., Flynn, J. H., and Woo, J.-H.: Evaluating high-resolution forecasts of atmospheric CO and CO2 from a global prediction system during KORUS-AQ field campaign, Atmos. Chem. Phys., 18, 11007–11030, https://doi.org/10.5194/acp-18-11007-2018, 2018.
Tang, W., Arellano, A. F., Gaubert, B., Miyazaki, K., and Worden, H. M.: Satellite data reveal a common combustion emission pathway for major cities in China, Atmos. Chem. Phys., 19, 4269–4288, https://doi.org/10.5194/acp-19-4269-2019, 2019.
Toon, O. B., Maring, H., Dibb, J., Ferrare, R., Jacob, D. J., Jensen, E. J., Luo, Z. J., Mace, G. G., Pan, L. L., Pfister, L., and Rosenlof, K. H.: Planning, implementation, and scientific goals of the Studies of Emissions and Atmospheric Composition, Clouds and Climate Coupling by Regional Surveys (SEAC4RS) field mission, J. Geophys. Res.-Atmos., 121, 4967–5009, https://doi.org/10.1002/2015JD024297, 2016.
Wang, F., Li, Z., Ren, X., Jiang, Q., He, H., Dickerson, R. R., Dong, X., and Lv, F.: Vertical distributions of aerosol optical properties during the spring 2016 ARIAs airborne campaign in the North China Plain, Atmos. Chem. Phys., 18, 8995–9010, https://doi.org/10.5194/acp-18-8995-2018, 2018.
Worden, H. M., Deeter, M. N., Edwards, D. P., Gille, J. C., Drummond, J. R., and Nédélec, P.: Observations of near-surface carbon monoxide from space using MOPITT multispectral retrievals, J. Geophys. Res., 115, D18314, https://doi.org/10.1029/2010JD014242, 2010.
Worden, H. M., Deeter, M. N., Edwards, D. P., Gille, J., Drummond, J., Emmons, L. K., Francis, G., and Martínez-Alonso, S.: 13 years of MOPITT operations: lessons from MOPITT retrieval algorithm development, Ann. Geophys., 56, 1–5, https://doi.org/10.4401/ag-6330, 2014.
Yan, Y., Lin, J., and He, C.: Ozone trends over the United States at different times of day, Atmos. Chem. Phys., 18, 1185–1202, https://doi.org/10.5194/acp-18-1185-2018, 2018.
Yurganov, L. N., Duchatelet, P., Dzhola, A. V., Edwards, D. P., Hase, F., Kramer, I., Mahieu, E., Mellqvist, J., Notholt, J., Novelli, P. C., Rockmann, A., Scheel, H. E., Schneider, M., Schulz, A., Strandberg, A., Sussmann, R., Tanimoto, H., Velazco, V., Drummond, J. R., and Gille, J. C.: Increased Northern Hemispheric carbon monoxide burden in the troposphere in 2002 and 2003 detected from the ground and from space, Atmos. Chem. Phys., 5, 563–573, https://doi.org/10.5194/acp-5-563-2005, 2005.
- Abstract
- Introduction
- Data and methods
- MOPITT comparisons with aircraft profiles over urban and non-urban regions
- Sensitivities to assumptions made for aircraft–satellite comparisons
- Discussion and conclusions
- Data availability
- Author contributions
- Competing interests
- Acknowledgements
- Financial support
- Review statement
- References
- Supplement