the Creative Commons Attribution 4.0 License.
the Creative Commons Attribution 4.0 License.
 | 27 Mar 2020
Evaluation of satellite-based aerosol datasets and the CAMS reanalysis over the ocean utilizing shipborne reference observations
Anja Hünerbein
Hartwig Deneke
Reliable reference measurements over the ocean are essential for the evaluation and improvement of satellite- and model-based aerosol datasets. Within the framework of the Maritime Aerosol Network, shipborne reference datasets have been collected over the Atlantic Ocean since 2004 with Microtops Sun photometers. These were recently complemented by measurements with the multi-spectral GUVis-3511 shadowband radiometer during five cruises with the research vessel Polarstern. The aerosol optical depth (AOD) uncertainty estimate of both shipborne instruments of ±0.02 can be confirmed if the GUVis instrument is cross calibrated to the Microtops instrument to account for differences in calibration, and if an empirical correction to account for the broad shadowband as well as the effects of forward scattering is introduced. Based on these two datasets, a comprehensive evaluation of aerosol products from the Moderate Resolution Imaging Spectroradiometer (MODIS) flown on NASA's Earth Observing System satellites, the Spinning Enhanced Visible and Infrared Imager (SEVIRI) aboard the geostationary Meteosat satellite, and the Copernicus Atmosphere Monitoring Service reanalysis (CAMS RA) is presented. For this purpose, focus is given to the accuracy of the AOD at 630 nm in combination with the Ångström exponent (AE), discussed in the context of the ambient aerosol type. In general, the evaluation of MODIS AOD from the official level-2 aerosol products of C6.1 against the Microtops AOD product confirms that 76 % of data points fall into the expected error limits given by previous validation studies. The SEVIRI-based AOD product exhibits a 25 % larger scatter than the MODIS AOD products at the instrument's native spectral channels. Further, the comparison of CAMS RA and MODIS AOD versus the shipborne reference shows similar performance for both datasets, with some differences arising from the assimilation and model assumptions. When considering aerosol conditions, an overestimation of AE is found for scenes dominated by desert dust for MODIS and SEVIRI products versus the shipborne reference dataset. As the composition of the mixture of aerosol in satellite products is constrained by model assumptions, this highlights the importance of considering the aerosol type in evaluation studies for identifying problematic aspects.
- Article
(9981 KB) - Full-text XML
- BibTeX
- EndNote


Aerosol particles directly influence the Earth's radiation budget through their interaction with solar and terrestrial radiation, and indirectly by modifying the optical properties of clouds (Boucher et al., 2013). Studies of aerosol effects on the climate system are based on radiative transfer models. Therefore, knowledge about the spectrally resolved optical properties of different aerosol types is essential. Over the ocean, sea spray (Bellouin et al., 2005; Loeb and Manalo-Smith, 2005; Yu et al., 2006; Myhre et al., 2007) and desert dust (e.g. Tegen, 2003; Christopher and Jones, 2007; Nabat et al., 2015) are the major contributors to the direct radiative effect of aerosol. Observations of aerosol load and optical properties with global coverage are required to improve our understanding of climate-relevant aerosol processes.
Satellite remote sensing provides global observations of aerosol properties and the radiation budget (Chen et al., 2011; Kahn, 2012). These observations are key to quantify direct radiative effects of aerosols, in particular over the ocean, where only limited surface observations, e.g. from ships, are available (Haywood et al., 1999). Due to the sensitivity of the retrievals to factors such as instrumental calibration and retrieval assumptions, however, a critical evaluation of the accuracy of the resulting satellite datasets is essential for understanding their quality and limitations, e.g. by comparing these products with well-calibrated ground-based reference observations.
The most widely used satellite-based aerosol products are based on the Moderate Resolution Imaging Spectrometer (MODIS) instrument flown on the polar-orbiting Terra and Aqua satellite platforms, which were launched in 1999 and 2002, respectively, by the National Aeronautics and Space Administration (NASA), and continue operations to this day. These products were evaluated in numerous studies in their evolution from Collection 4 (C4) (e.g. Remer et al., 2005; Kleidman et al., 2005) to C5 and C5.1 (e.g. Levy et al., 2010; Bréon et al., 2011; Misra, 2015) and finally to C6 and C6.1 (e.g. Munchak et al., 2013; Levy et al., 2013; Livingston et al., 2014). Validation of the product quality over the ocean was more limited compared to that over land and has mostly relied on coastal or island sites with Sun photometer measurements (e.g. Abdou et al., 2005; Bréon et al., 2011; Shi et al., 2011; Anderson et al., 2012; Wei et al., 2019). Ship or airborne reference observations were utilized less frequently (e.g. Smirnov et al., 2011; Adames et al., 2011; Schutgens et al., 2013). Levy et al. (2013) estimated an error of aerosol optical depth (AOD) over the ocean within the error limits of [] for the C6 products. Considered in this paper are the products from both the MODIS Aqua and Terra instruments, and we refer to them as MxD04_3K and MxD04_L2 for the high-resolution 3 km Remer et al. (2013) and lower-resolution 10 km Levy and Hsu (2015a, b) swath products, respectively.
In addition to the widely used aerosol datasets available from the MODIS instruments, datasets based on geostationary satellite observations are of high potential interest for scientific applications. In particular, their high temporal resolution combined with their fixed field of view on the Earth enables studies of the diurnal cycle and the temporal evolution of aerosol plumes. Hence, the aerosol product of Thieuleux et al. (2005), which is based on the Spinning Enhanced Visible and Infrared Imager (SEVIRI) aboard the geostationary Meteosat Second Generation (MSG) satellites operated by the European Organisation for the Exploitation of Meteorological Satellites (EUMETSAT), is also taken into consideration in this evaluation. It is available at a temporal resolution of 15 min. Compared to the MODIS aerosol products, some limitations arise from the instrumental characteristics of the SEVIRI instrument and thus have to be taken into account: the spatial resolution of SEVIRI is 3 km in nadir versus 1 km for MODIS, and only two spectral channels (630 and 810 nm) are utilized in the retrieval. A smaller set of 12 aerosol models is used as basis for the retrieval, and the product has received far less validation efforts (e.g. Bréon et al., 2011; Bernard et al., 2011). To our knowledge, it has not been validated previously with shipborne observations.
For many research purposes, aerosol properties from model-based reanalysis datasets are a promising alternative to the direct use of satellite-based aerosol products. In contrast to satellite products, aerosol properties from a reanalysis are available independent of cloud cover and satellite overpass time. The Copernicus Atmosphere Monitoring Service reanalysis (CAMS RA) is the latest global reanalysis of atmospheric composition produced by the European Centre for Medium-Range Weather Forecasts (ECMWF) and provides global information on aerosol optical properties. It relies on the data assimilation of satellite observations into ECMWF's Integrated Forecasting System (Inness et al., 2019). In the case of aerosol, it has to be realized that MODIS datasets are assimilated into CAMS RA, so differences between both datasets are expected to be relatively small and will mainly show the influence of model assumptions and the assimilation system of CAMS.
In this study, two independent datasets of shipborne aerosol products are compared and used for an evaluation of both satellite products and the CAMS RA over the ocean, with an additional focus on aerosol type. There is still a lack of shipborne spectral radiation measurements for this purpose (Brando et al., 2016). Furthermore, by separating the evaluation according to aerosol type, more insights can be gained into the limitations of the current satellite products. Also, further validation of the CAMS RA aerosol products with respect to aerosol type is needed (Inness et al., 2019). While the optical properties of maritime aerosol are considered to be relatively well understood, the optical properties of mineral dust are still the topic of ongoing research due to their complex, non-spherical shape (Dubovik et al., 2006; Mishchenko et al., 1999), which introduces significant uncertainty in their optical properties and remote sensing.
Compared to observations on land, shipborne observations are more challenging due to the continuously moving nature of the observational platform caused by waves. Observations of aerosol optical properties were established within the framework of the Maritime Aerosol Network (MAN) as a subproject of the Aerosol Robotic Network (AERONET), based on the Sun photometer technique. Global observations from MAN have been available since 2004 and utilize the hand-held Microtops II Sun photometers (referred to as Microtops in the following text). It thus relies on the skill of human observers to compensate for the ship movement (Smirnov et al., 2009). An automatic approach to derive aerosol optical properties over the ocean using the shadowband radiometer technique was established within the framework of the OCEANET project (Macke, 2009). The GUVis-3511 shadowband radiometer (referred to as GUVis in the following), built by Biospherical Instruments Inc., has been operating alongside other OCEANET instruments to provide observations during five Atlantic transit cruises of the German research vessel Polarstern since 2014 (Witthuhn et al., 2017).
Observations from both the GUVis and Microtops instruments on a number of Polarstern ship cruises over the Atlantic Ocean are utilized in this study. The GUVis aerosol product has received a substantial update since the version presented in Witthuhn et al. (2017). The improvements are briefly discussed in the Appendix (Sect. A). The comparison of these shipborne datasets to aerosol products from MODIS C6.1 and SEVIRI as well as the CAMS RA aerosol datasets is presented here, which were collocated to the ship's position along these cruises.
This paper has three principal goals:
-
The first goal is intercomparison of both shipborne aerosol products in terms of their accuracy, with a particular focus on the verification of the uncertainty estimate of the GUVis dataset, and the usability of both datasets for the validation of satellite retrievals.
-
The following goal is evaluation of the satellite aerosol products from SEVIRI and MODIS over the ocean using these shipborne datasets. A specific question is whether SEVIRI can offer additional information on the diurnal cycle and temporal evolution of aerosol.
-
The final goal is evaluation of the CAMS RA as an alternative source of aerosol information to MODIS and SEVIRI for research purposes.
The two shipborne datasets serve as reference for the subsequent validation study. Since they are based on different techniques, an intercomparison is presented first to point out their individual strengths and weaknesses. In this context, focus is given in particular to their suitability for satellite validation.
Within the second and third points, the estimated error limits proposed previously for the MODIS AOD products are investigated compared to the deviations found in this study. These findings are understood in the context of the results found for the SEVIRI aerosol product to observe how the limitations of the SEVIRI sensor influence the retrieval accuracy. Further, the benefit resulting from the increased time resolution of SEVIRI is investigated. Besides the accuracy of the AOD, the estimate of Ångström exponent (AE) is investigated, in particular in the context of characterizing the aerosol type. Both AOD and AE from the CAMS RA are compared to the satellite and shipborne datasets to identify differences due to the satellite retrievals, and to evaluate its performance during different aerosol situations.
The paper is structured as follows. First, shipborne instrumentation and reference datasets are introduced (Sect. 2.1). A description of the satellite products and the CAMS RA is shown in Sect. 2.2 and 2.3. The methods utilized for aerosol classification, satellite data collocation and statistical measures for evaluation as well as the GUVis cross calibration and aerosol forward-scattering correction are reported in Sect. 3. The intercomparison of the shipborne data and the comparison of the satellite products versus the shipborne reference is given in Sect. 4. Finally, the evaluation results are discussed in the conclusions and outlook sections (Sects. 5 and 6). In the Appendix (Sect. A), the update of GUVis irradiance processing algorithm is described.
This section gives an overview of the shipborne instruments and reference datasets (Sect. 2.1) as well as the satellite (Sect. 2.2) and model reanalysis dataset (Sect. 2.3). All datasets are publicly available, see the section on data availability at the end of the article.
In this study, focus is given to the aerosol optical depth (AOD) and Ångström exponent (AE), the latter quantifying the dependency on wavelength λ of the former quantity. Specifically, the AOD at λ=440 nm (for intercomparison of the shipborne datasets) and at λ=630 nm (for comparison of shipborne and satellite data) are mainly considered here, while the AE α is calculated from the AOD τA at λ1=440 and λ2=870 nm based on the Ångström relation as follows, unless otherwise noted:
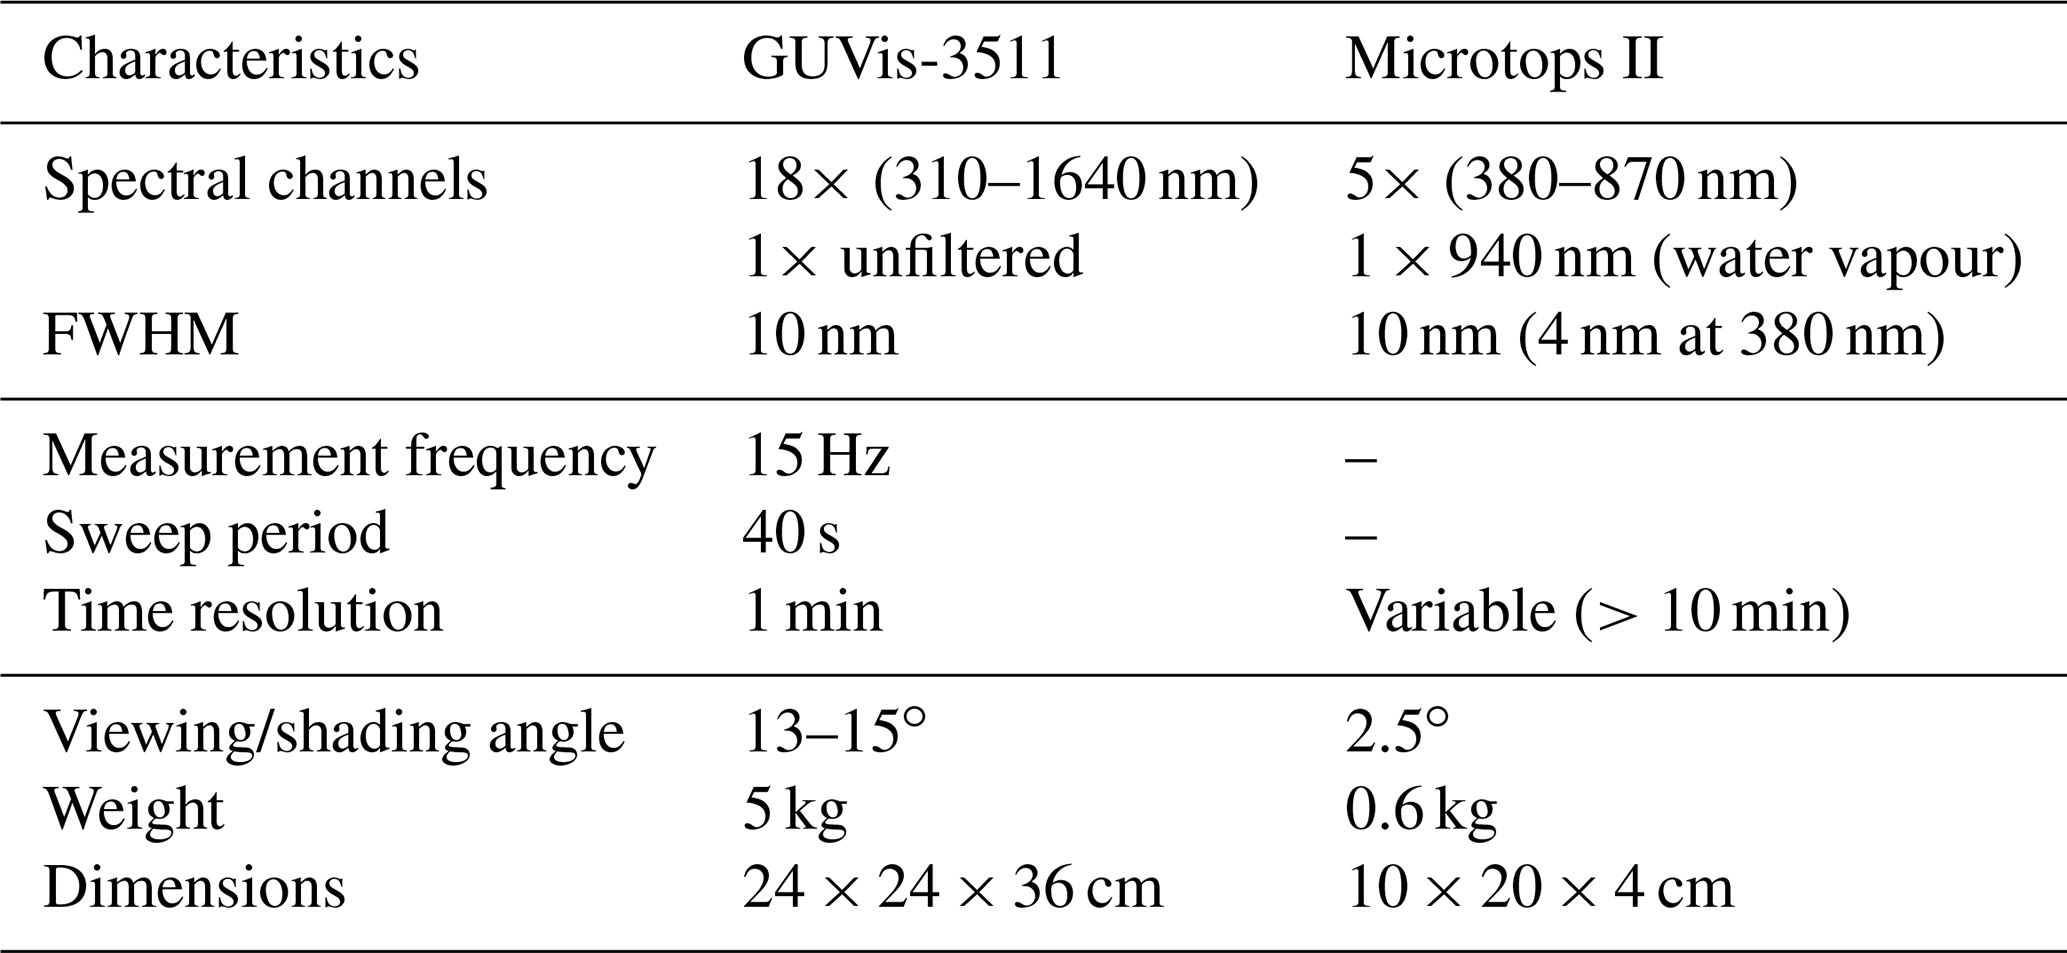
Table 1Technical specifications of the GUVis and Microtops instruments. FWHM indicates full width at half maximum.
2.1 Shipborne instruments and datasets
Two aerosol datasets based on shipborne observations are considered here as ground-based reference: the Microtops Sun photometer (Microtops II manufactured by Solar Light Inc.) and the GUVis shadowband radiometer (GUVis-3511 plus BioSHADE accessory manufactured by Biospherical Instruments Inc.). Both instruments are well suited for operation on moving platforms such as ships. Their measurement principles however are rather different. The technical specifications of the Microtops and GUVis instruments are summarized in Table 1. The configurations of both instruments allow a direct comparison of all spectral channels of the Microtops versus corresponding GUVis observations.
The Microtops is a hand-held Sun photometer, which has to be pointed manually at the Sun. To minimize uncertainties arise from manual pointing, more than five consecutive scans are averaged to form one measurement (Smirnov et al., 2009). The Microtops instrument measures the incident direct normal solar irradiance with a field of view of 2.5∘ (Porter et al., 2001). The MAN Microtops Sun photometers are calibrated against an AERONET master Cimel Sun photometer, which in turn is calibrated using the Langley technique.
The GUVis shadowband radiometer utilizes an entrance optic with a global field of view combined with a shadowband that performs a 180∘ sweep, while the global irradiance is measured at a high temporal frequency of 15 Hz. Several corrections are applied as post-processing to correct the influence of the ship motion, and to retrieve the direct spectral irradiance for later AOD calculation, as is described later. The measurement principle of the shadowband radiometer can be described as follows. While the global irradiance is observed with the shadowband in its lowest position between sweeps, the shadowband blocks a fraction of the incoming diffuse irradiance during its rotation and will occlude the direct irradiance at a specific angle determined by instrument orientation and Sun position. From the irradiance time series measured during the sweep, the global, diffuse and direct irradiance components can be inferred (Witthuhn et al., 2017). Prior to the processing of the GUVis sweeps, the measured irradiance data have to be corrected to compensate for the motion of the ship and the imperfect cosine response of the instrument. The actual cosine response of the entrance optic is measured by the manufacturer during lab calibrations, and can be corrected by applying correction factors depending on the spectral channel and Sun elevation if the orientation angles of the ship are known. The motion correction utilizes the method of Boers et al. (1998) based on the ship motion angles to correct the direct and diffuse irradiance components. The GUVis instrument has been calibrated in a laboratory at regular 2-year intervals using a 1000 W FEL standard calibration lamp as absolute reference. The correction and processing of GUVis irradiance data as well as the calculation of AOD is described in detail in Witthuhn et al. (2017). The concept of the “field of view” of a Sun photometer is not directly applicable to a shadowband radiometer. Instead, there is the “shading angle” as described in Witthuhn et al. (2017), which is the minimum angle between the edges of the shadowband as viewed from the centre of the global entrance optic. For the GUVis, the shading angle is about 15∘ (depending on shadowband position), and thus relatively large in comparison to the Microtops field of view. The wide angle of the shadowband of the GUVis causes an underestimation of AOD caused by the influence of the forward scattering of the aerosol (Russell, 2004). The GUVis processing algorithm has received a substantial update (see Sect. A) to compensate at least partially for this effect. The reduction of measured irradiance during the shadowband sweeps is stronger in situations with increased aerosol forward scattering. Besides some other refinements, an offset was introduced for estimation of the blocked diffuse irradiance as part of the processing algorithm update in order to compensate for this effect (see Sect. A).
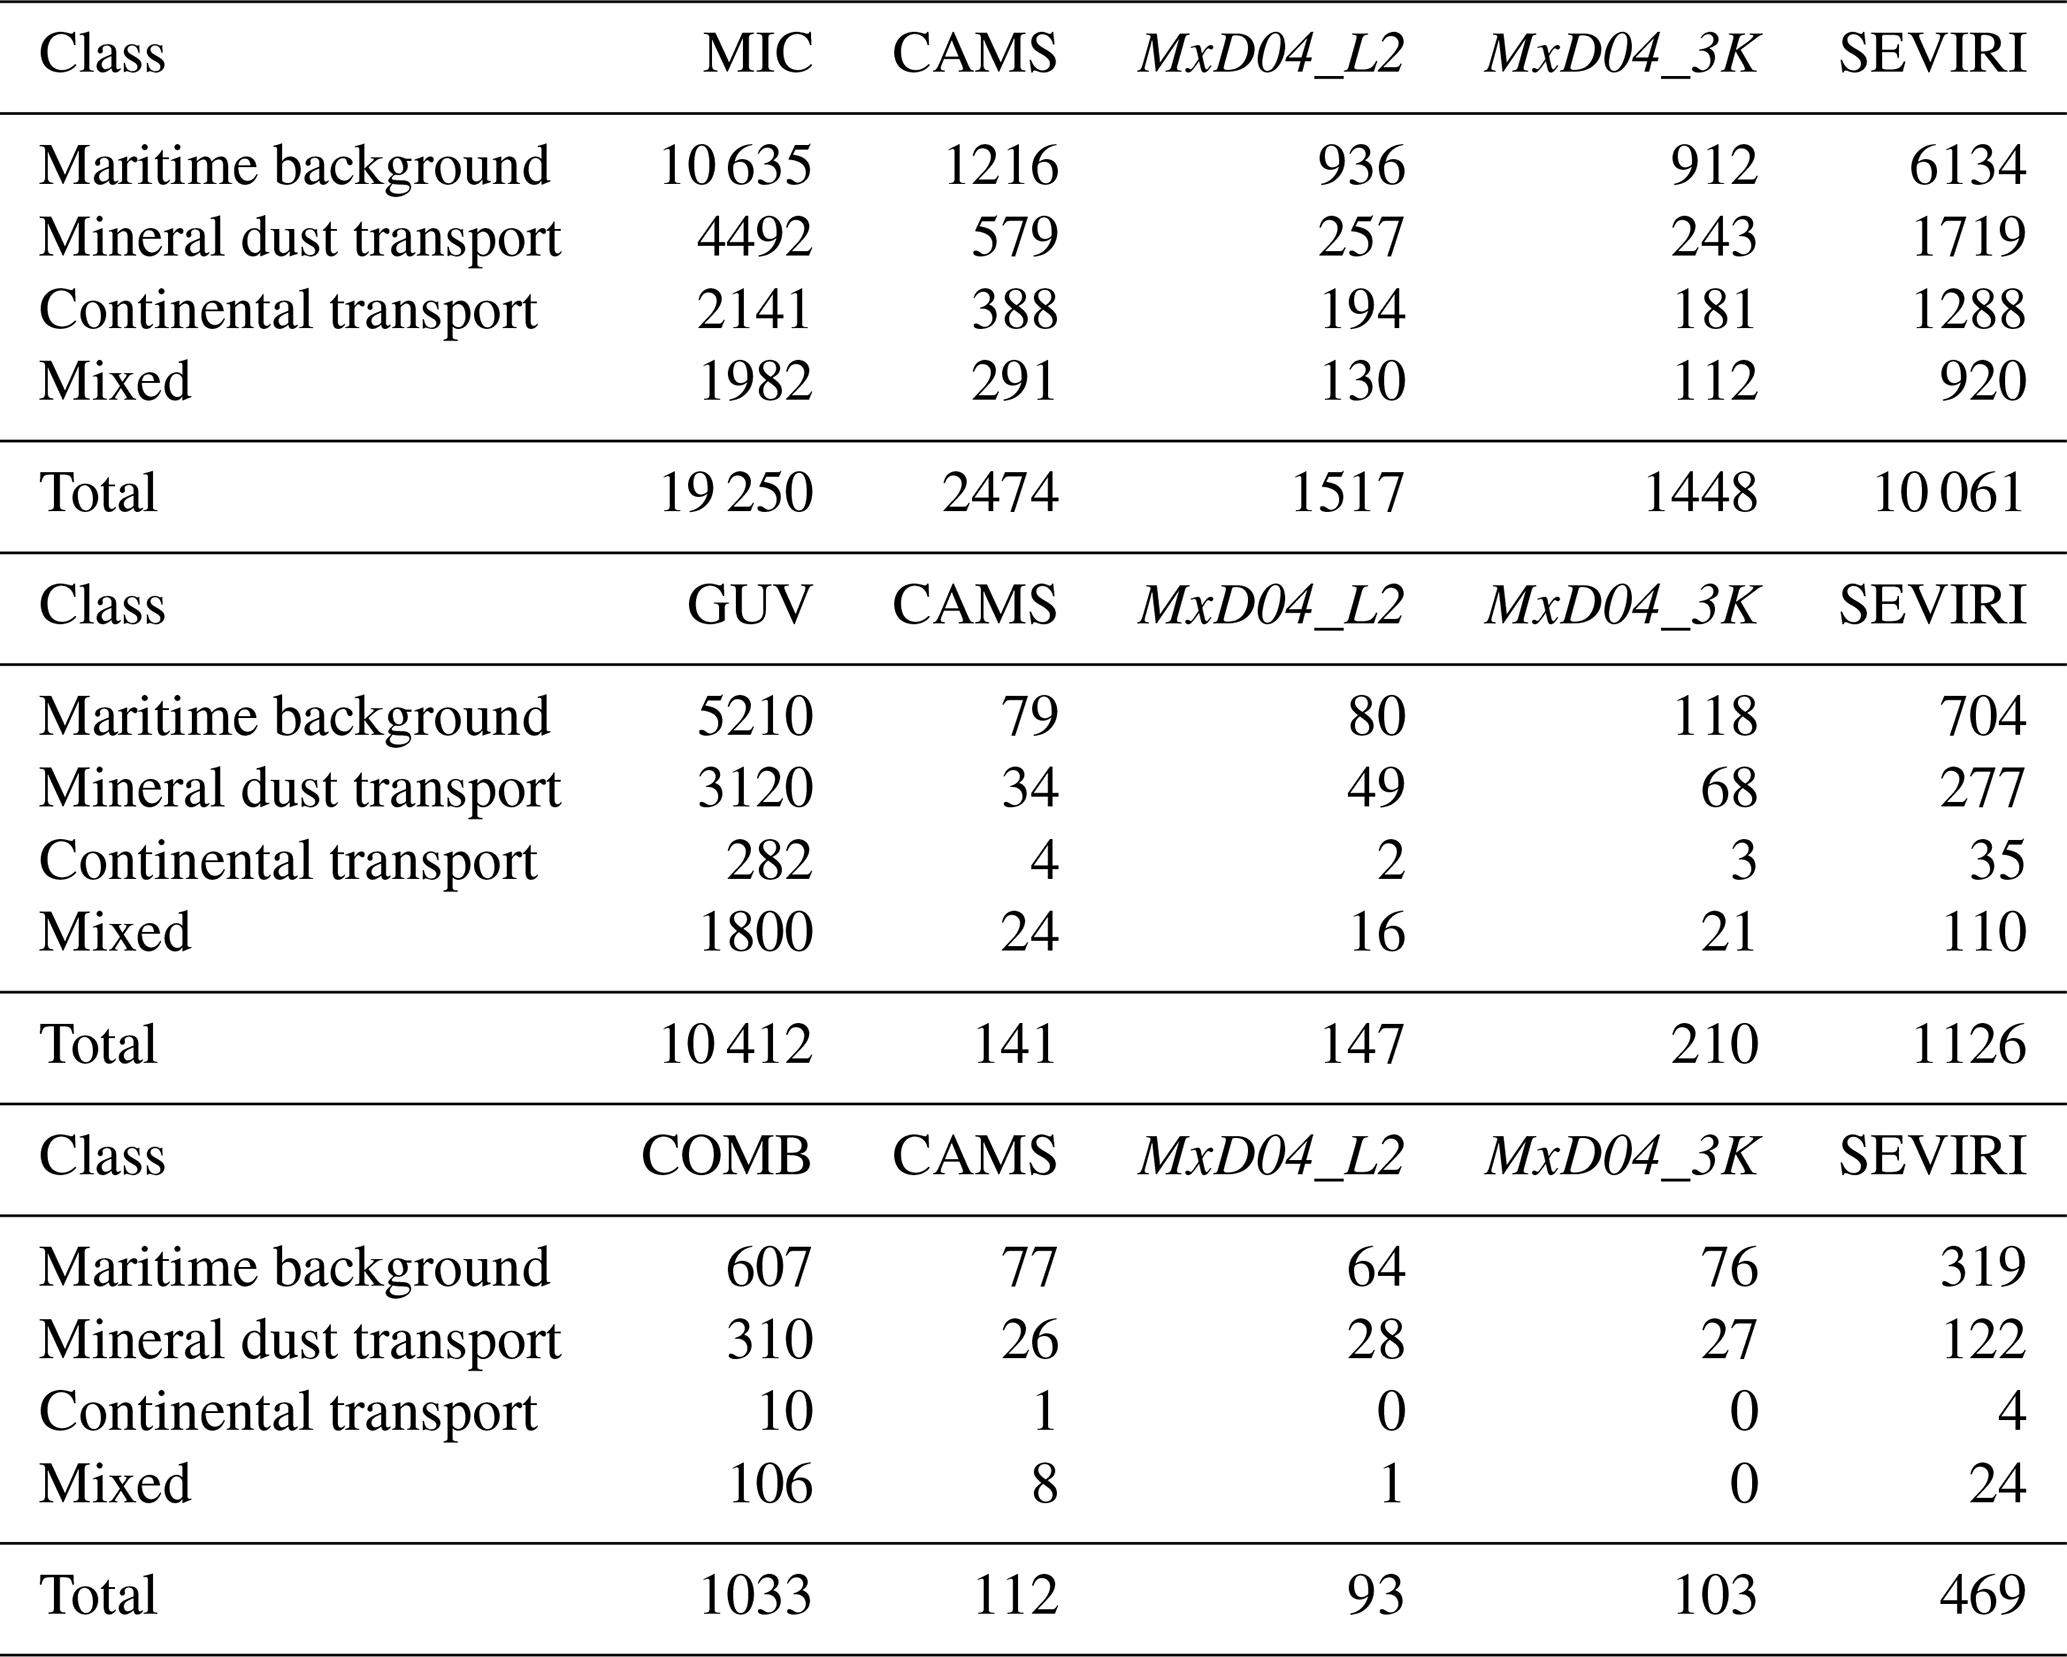
Table 2Number of available data points in the Microtops (MIC), GUV, and COMB datasets, given as total number and separated by aerosol type. The type classification follows the scheme of Toledano et al. (2007). Collocated data points for the comparison with satellite and model datasets (see text for collocation criteria) are also given.
Given the direct normal irradiance obtained from both instruments and a given spectral band, the AOD can be calculated using the well-known Beer–Lambert law, and by subtracting optical depth contributions from Rayleigh scattering and gas absorption. In the following, an overview of the shipborne datasets based on both instruments is presented:
(i) As the first dataset, all observations conducted during numerous cruises with the Microtops II Sun photometer in the framework of AERONET MAN since 2004 to 2018 in the area of the Atlantic Ocean are used. The uncertainty of Microtops AOD is estimated to be within ±0.02 (Smirnov et al., 2009). The datasets include a total number of 19 250 valid data points. This dataset (referred to as MIC in the following text) also provides the diversity needed to investigate aerosol-type-related effects for the evaluation of satellite products, and for the comparison with CAMS RA.
(ii) The second reference dataset (GUVis) is based on the GUVis shadowband radiometer. Observations with the GUVis were conducted within the framework of OCEANET (Macke, 2009) during Atlantic transect cruises with the German research vessel Polarstern operated by the Alfred Wegener Institute since 2014. Until now, five cruises including the shadowband radiometer observations have been performed, namely PS83, PS95, PS98, PS102, and PS113. A Microtops instrument from MAN has also been operated in parallel on all these cruises. This offers the opportunity to directly compare both datasets. A direct comparison of Microtops and GUVis AOD product has already been presented for PS83 in Witthuhn et al. (2017). The AOD uncertainty is estimated to be within ±0.02 (Witthuhn et al., 2017). Following the same procedure, this comparison is extended to all available cruises, with some minor changes to obtain more meaningful results. The total number of valid GUVis observations is 10412.
In order to improve the agreement of the aerosol products of both instruments to acceptable limits, it has been found necessary to introduce a cross calibration to the MIC instrument, and an empirical correction for aerosol forward scattering, to account for differences arising from the limited accuracy of lab-based instrumental calibration, and the broad shadowband of the GUVis instrument. The correction is done fitting a linear regression curve (Eq. 10) to the GUVis AOD (see Sect. 3.4), similar to the approaches adopted by di Sarra et al. (2015) and Wood et al. (2017). This enhanced dataset is denoted as GUVisE in this study.
(iii) The enhanced GUVis dataset (GUVisE) has been combined with the Microtops dataset to obtain a merged surface product, to test whether the combination can lead to further improvements in accuracy. This combined surface dataset (COMB) serves as third reference dataset for the evaluation of the satellite products. COMB consists of the mean of the collocated GUVisE and MIC AOD for this purpose. As shown in Table 2, the total amount of data points decreases to 1033 due to the collocation requirement.
2.2 Satellite aerosol products
Satellite-based aerosol datasets over the ocean considered here are obtained from both the MODIS and SEVIRI satellite instruments. The MODIS Collection 6.1 (C6.1) level-2 aerosol products MxD04_L2 (Levy and Hsu, 2015a, b) and MxD04_3K (Remer et al., 2013) are used from both Terra and Aqua satellites. This dataset includes the AOD at 470, 550, 660, 860, 1240, 1630, and 2130 nm. The AOD(500 nm) and AE obtained from the SEVIRI instrument aboard the MSG satellite provided in the SEV_AER-OC-L2 product (Thieuleux et al., 2005) of the ICARE Data and Services Center is also considered. In the following text, unless otherwise stated, the terms “MODIS aerosol products” or “MODIS retrieval” refer to the MxD04_L2 and MxD04_3K products, and similarly, the term “SEVIRI aerosol product” refers to the ICARE SEV_AER-OC-L2 aerosol product.
Both aerosol retrievals are based on the inversion of the measured reflectance at top of atmosphere to estimate the AOD at the instrumental spectral channels using lookup tables of radiative transfer calculations. The accuracy of these estimates critically depends on realistic assumptions about the optical properties of aerosols assumed in the calculations. A larger number of channels enables a more accurate choice of aerosol type used by the retrieval, and is thus expected to increase the overall accuracy. In addition, factors such as the spatial resolution of the sensor, the viewing geometry, and sensor calibration, as well as the accuracy of cloud screening will influence the overall accuracy. While the SEVIRI retrieval is based on only two wavelengths (630 and 810 nm) (Thieuleux et al., 2005), the MODIS retrieval utilizes seven spectral channels. In addition, it is continuously monitored with ground-based observations at AERONET stations (Levy and Hsu, 2015a, b). A degraded accuracy for aerosol properties in the presence of desert dust in both satellite products is expected, since dust particles are non-spherical. This leads to an increased side-scatter effect compared to spherical particles which are assumed in both retrievals.
Besides the retrieval differences, MODIS and SEVIRI products are also different due to their satellite platform characteristics. MODIS is operated on both the Terra and Aqua satellites, which fly in a polar orbit. For studies targeting aerosol properties at a specific location, MODIS observations are only available for the two overpasses during daylight, compared to SEVIRI with a time resolution of 15 min. On the other hand, the geostationary orbit of MSG leads to lower spatial resolution of nadir 3 km for SEVIRI versus a 1 km nadir resolution of MODIS. In order to avoid cloud contamination in the aerosol product, the MODIS retrievals consider multiple pixels together with a strict cloud mask, leading to a decrease of the spatial resolution to 3 km for the high-resolution aerosol product (MxD04_3K) and 10 km for the standard aerosol product (MxD04_L2).
2.3 CAMS RA aerosol product
CAMS RA is the latest global reanalysis dataset of atmospheric conditions produced by ECMWF (Inness et al., 2019). Amongst other atmospheric constituents, it contains the spectral AOD at a temporal resolution of 3 h on a global grid of 0.7∘ (corresponding to a T255 spatial resolution). The advantage of utilizing CAMS RA over satellite observations is the availability of aerosol properties independent of factors such as cloud coverage or satellite orbit, albeit the accuracy of AOD under cloudy sky conditions in the model might be questionable.
CAMS RA was developed based on the experiences gained with the former Monitoring Atmospheric Composition and Climate (MACC) reanalysis and the CAMS interim analysis (Inness et al., 2019). It relies on the assimilation of global observational datasets into the Integrated Forecast System (IFS) from various satellites to provide a global picture. In terms of aerosol properties, the AODs from the products of the MODIS C6 from both Terra and Aqua are assimilated, while the composition mixture is maintained as given from the IFS. Before its failure in March 2012, retrievals from the Advanced Along-Track Scanning Radiometer (AATSR; Popp et al., 2016) flown aboard the Envisat mission were also being assimilated. The influence of this additional source of information for data assimilation on the accuracy is investigated in Sect. 4.3. Currently, the dataset covers the period 2003–2016 and will be extended in the following years. For the evaluation of the CAMS RA aerosol dataset, an accuracy close to the MODIS aerosol product is expected.
A first validation presented within Inness et al. (2019) emphasizes the high quality of AOD in the CAMS RA system, as judged by a comparison to AERONET stations around the world. However, an overestimate of AE was shown during desert dust events and was attributed to the fixed component mixture (e.g. less dust in CAMS RA) in the forecast model. Further evaluation with a focus on individual aerosol components as well as aerosol properties over the ocean has been recommended (Inness et al., 2019).
This section gives an overview of the methods used for aerosol classification (Sect. 3.1) and collocation of satellite and shipborne measurements (Sect. 3.2), and presents the statistical measures used for evaluation (Sect. 3.3), as well as the correction approach adopted for the GUVis aerosol product for better comparability to MIC AOD (Sect. 3.4).
3.1 Aerosol classification
Our study aims to compare shipborne and satellite AOD products also with respect to the role of aerosol types. A satellite-independent aerosol classification is applied, which is based on the empirical method presented in Toledano et al. (2007) for Cimel instruments from AERONET. This method is also applicable to the Microtops AOD product, as it contains all required parameters. The aerosol classification is done by comparing the AOD at λ=440 nm with the AE calculated based on the 440 and 870 nm channels (Eq. 1). The pair of AOD and AE values is checked against empirical thresholds to identify the dominant aerosol type of the current situation as being one of maritime background (AOD < 0.15), mineral dust transport (AE < 0.5, AOD > 0.15), continental transport (AE >1, AOD > 0.15), or mixed (0.5 < AE <1, AOD > 0.15) types. It should be noted that all categories are expected to cover mixed aerosol types to some extent. Therefore, the mixed category consists of a mixture of aerosol without a dominant type.
In the following text, we shorten the aerosol type description from maritime background (maritime), mineral dust transport (desert dust, since over the Atlantic Ocean most dust cases originate from the Sahara desert), and continental transport (continental). All results shown in this study separated by aerosol type (maritime, desert dust, continental, mixed) are based on this aerosol classification method. It should be noted that the shipborne observations at wavelengths of 440 and 870 nm are utilized for classification, even if figures and tables present AOD and AE for different channels (e.g. Fig. 7).
3.2 Collocation criteria
As common practice for spatiotemporal collocation with MODIS, a window size of 50×50 km and a time window of 1 h are recommended by Ichoku (2002) for Sun photometer observations. For the MODIS C6 validation by Levy et al. (2013), a spatial radius of 25 km and a temporal window of ±30 min have been used. Both the MxD04_L2 and MxD04_3K products have been validated using a window of 5×5 pixel by Munchak et al. (2013), resulting in different window sizes of 50 and 15 km2, respectively. The following collocation technique is utilized here to find the appropriate pixel of the satellite dataset and to compare it to the shipborne data obtained at a certain position. First, eligible satellite images are selected using a time frame of ±30 min around observations, and checking if the ship position is located within the field of view of the satellite image. Then, the distance angles of all pixel coordinates to the ship position have been calculated. The satellite AOD is finally calculated as the median of all non-cloudy pixel values with a distance angle less than 0.2∘.
Choosing a distance angle threshold of 0.2∘ for the collocation of all satellite and model datasets to the shipborne observation assures that the same area around the reference observation is chosen regardless of satellite or model product, spatial resolution, and projection, and ensures comparability of results. This threshold results in a spatial radius of about 22 km.
Applying the collocation strategy introduced above to the 19 250 MIC data points results in a total number of remaining 1517 data pairs for MxD04_L2, 1448 for MxD04_3K, 10 061 for SEVIRI, and 2474 for CAMS RA, as shown in Table 2.
After collocation with the GUVis dataset, consisting of a total number of 10 412 data points, the resulting number of data pairs is 147 for MxD04_L2, 210 for MxD04_3K, and 1126 for SEVIRI. The collocation with CAMS RA results in 141 data pairs. The number of collocated data pairs is rather small, limiting the statistical significance of the comparison results.
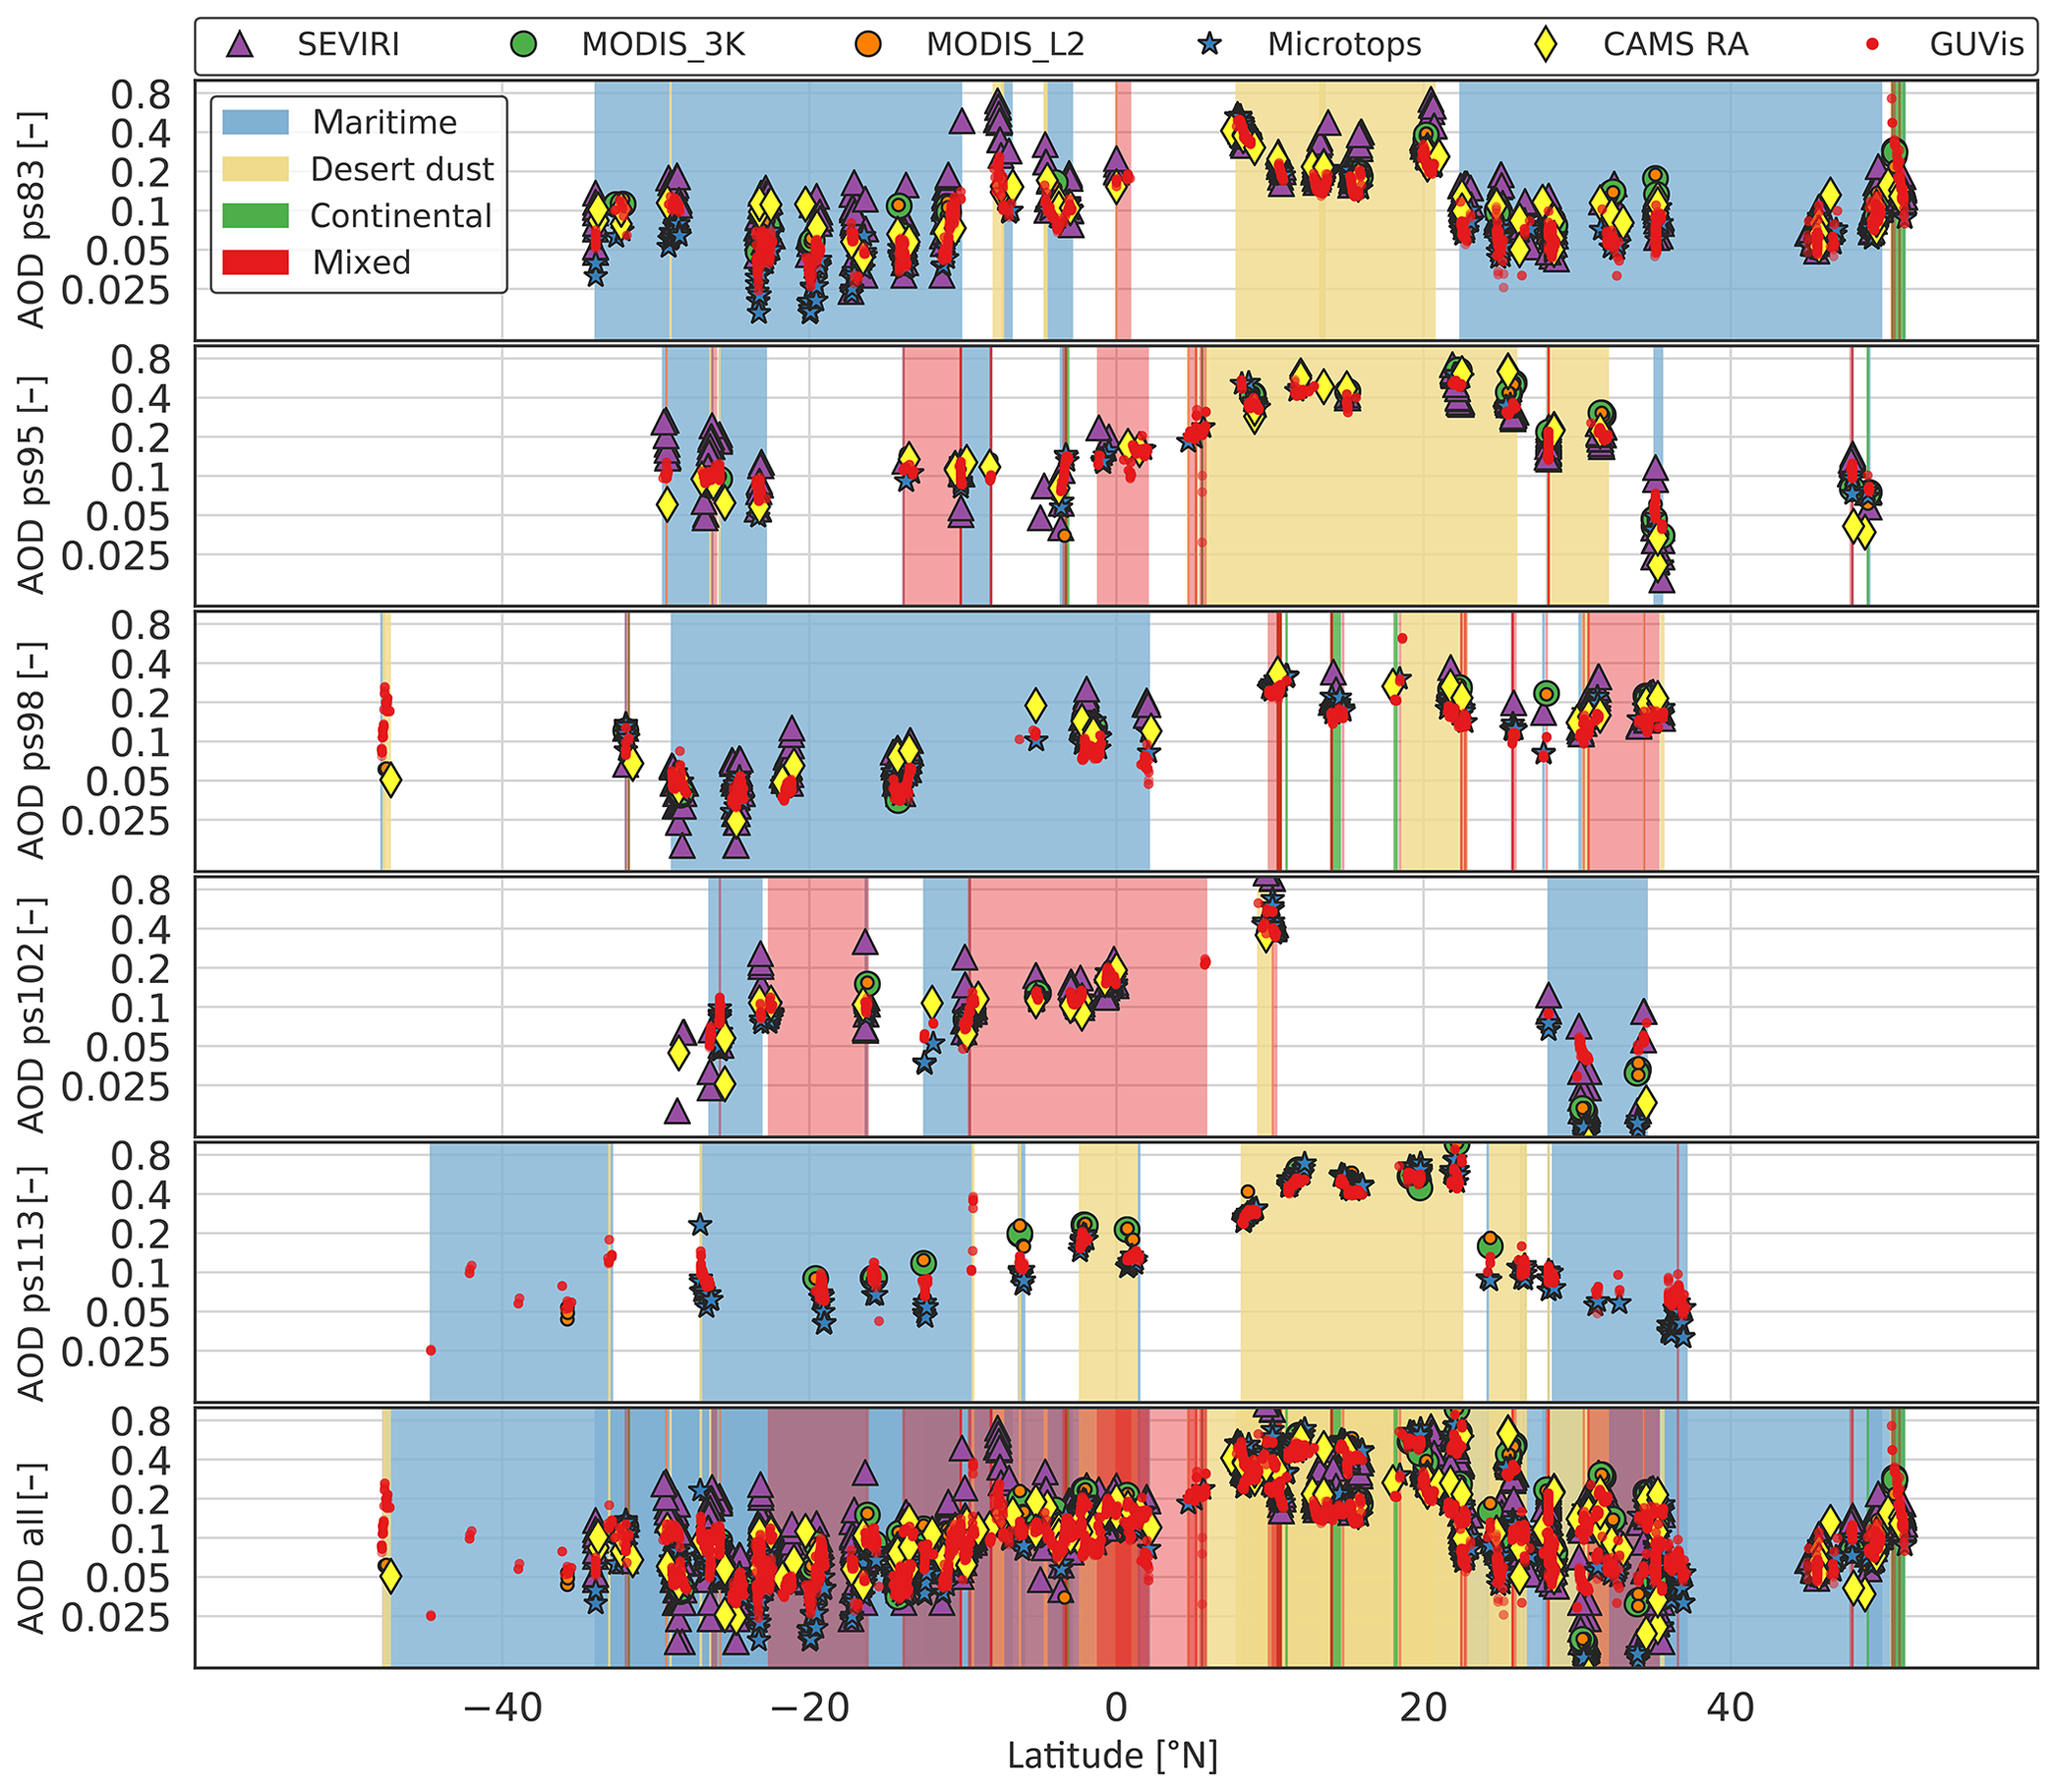
Figure 1Zonal cross section of AOD at 630 nm estimated from GUVis measurements during the Polarstern PS83, PS95, PS98, PS102, and PS113 cruises, together with collocated AOD obtained from Microtops, satellite products, and CAMS RA. Along this cross section across the Atlantic Ocean, the dominant aerosol type is either maritime (blue shaded region) or desert dust (yellow shaded region) while passing the Sahara desert. The aerosol classification method is based on the method of Toledano et al. (2007) and GUVis products.
The number of data pairs per aerosol type classified based on the shipborne reference data as described in Sect. 3.1 is given in Table 2. Since the observations are performed across the Atlantic Ocean, the dominant aerosol conditions are mainly maritime or desert dust originating from the Sahara desert (see Fig. 1 and Table 2).
3.3 Limit of agreement method
To assess the agreement of two measures (X, Y) of the same quantity such as AOD from Microtops versus GUVis, or the shipborne dataset versus satellite products, linear regression statistics and the Pearson product-moment correlation coefficient R (referred to simply as the correlation in the following text) are calculated. Further, the analyses are extended with the so-called “limits of agreement” (LOA) method first introduced by Bland and Altman (1986). This method considers the mean of the differences of both quantities X–Y (i.e. the bias), and the LOA is defined as the 95 % confidence interval for those differences as additional parameters. As not stated otherwise, Y denotes the reference dataset for comparisons presented in this study.
For the evaluation of the uncertainty estimates for the shipborne observations, the method of Knobelspiesse et al. (2019) is adopted, weighting the difference between X and Y (D) with their uncertainty estimate (σX, σY):
Thus, utilizing the LOA method together with the weighted difference, the uncertainty estimate can be confirmed if the uncertainty-weighted difference lies within the range of ±1.96 for the 95 % confidence interval (see Fig. 3). The percentage of outliers exceeding the limits of ±1.96 is used as quantitative measure for the validation.
For the evaluation of the satellite products and CAMS RA, the bias and LOA (95 % confidence interval) are used as a measure for the agreement to the shipborne reference datasets. Additionally, Gfrac, defined as the percentage of data lying within expected error (EE) limits, is calculated in order to be consistent with other validation studies (e.g. Bréon et al., 2011). Expectations of the error are met if 67 % of data points of the satellite or model product fall into the EE range compared to the shipborne reference (Levy et al., 2013). Two EE limits are chosen here, originally presented for the MODIS aerosol product based on former validation studies, e.g. by Abdou et al. (2005); Remer et al. (2008) and Livingston et al. (2014):
and more recently in Levy et al. (2013):
EE1 is a general measure of agreement, since the boundaries are equally distributed around the reference dataset. EE2 has been specialized for the MODIS aerosol product, since a known overestimation is considered via different intercepts.
3.4 Cross calibration and empirical correction of AOD
The relatively large differences originally observed in the comparison between Microtops and GUVis (Sect. 4.1), and their changes from one cruise to another, lead to the hypothesis that calibration of the GUVis instrument might introduce significant uncertainties and be responsible for the differences, given the importance of calibration for the AOD accuracy (see Alexandrov et al., 2002; Witthuhn et al., 2017).
Despite the fact that the deviation of AOD between Microtops and GUVis due to forward-scattering effects of aerosol is partially compensated by the processing update of GUVis (see Sect. A), a remaining linear dependence of the bias has been observed (Sect. 4.1), which can most likely be attributed to the wide shadowband of the GUVis instrument, and the resulting difference in the field of view of both instruments. If AOD increases, this effect increases due to the enhanced circumsolar radiation. Although this effect does not have a major impact on the correlation in the direct comparison of Microtops and GUVis AOD datasets of this study (see Sect. 4.1), it introduces a substantial relative bias and needs to be compensated to ensure the consistency of both shipborne datasets and for the comparison to the satellite and model datasets. The compensation is done using a linear scaling factor for measured AOD (S), as is explained later in this section.
To improve the consistency of the GUVis and MIC datasets, the following approach has been adopted to both transfer the calibration from the MIC instrument to the GUVis instrument, and to empirically correct for the effects of forward scattering. The first correction is accomplished following the method introduced by Alexandrov et al. (2002) for the Multi-Filter Rotating Shadowband Radiometer (MFRSR). The spectral direct irradiance measured by the GUVis can be represented by the following equation:
where and Ii are the spectral direct irradiance at top of atmosphere and surface, respectively, for a spectral channel i. The inverse of the air mass is denoted by μ0, the cosine of the solar zenith angle. τi is the atmospheric column extinction optical depth for a spectral channel i. Following Alexandrov et al. (2002), a correction factor Ci for the calibration is introduced.
The absolute calibration of GUVis spectral channels is carried out in the laboratory to obtain the channel-specific calibration factors (ki; V W−1 m2 nm1) for the conversion of the measured voltage (Vi) to spectral irradiance (Ii):
The relation of the calibration factor ki and the correction Ci can be obtained from Eq. (5) as
where ksi denotes a corrected calibration factor.
τi can be expressed as the sum of AOD τA,i and the remaining contributions to the atmospheric optical depth () from Rayleigh scattering and gaseous absorption as
The AOD can now be obtained from Eqs. (5) and (8) as
This equation shows that the calibration correction factor Ci introduces a change in AOD which is proportional to the product of the cosine of the solar zenith angle and the logarithm of the correction factor. Introducing also a linear scaling factor Si for the AOD to account for the effects of aerosol forward scattering (see Wood et al., 2017; di Sarra et al., 2015), the following correction equation is used here in a bilinear fit, using μ0 and the GUVis-based AOD as dependent variables and the MIC-based AOD as an independent variable:
Thus, the scaling factor Si and the calibration correction factor Ci=exp (ci) can be obtained simultaneously from this bilinear fit.
Table 3Per-channel coefficients obtained for the cross calibration of the GUVis to the MIC instrumental channels (determined per cruise), expressed as relative correction C to the most recent laboratory calibration, together with the empirical scaling coefficient S to correct the AOD for the forward-scattering contribution in the GUVis observations (determined for all cruises). See text for details on their estimation. For comparison, the absolute calibration coefficient k for each cruise is shown. The channels of 630 and 810 nm are non-native spectral channels and therefore marked with (i), as they are interpolated using the AE with Eq. (1).

In the approach adopted for this study, the factor Ci has been determined independently for each of the five Polarstern cruises (PS83, PS95, PS98, PS102, PS113), in order to account for potential temporal changes in calibration between the different ship cruises, while a single constant value is assumed for Si. The correction factors obtained by multi-linear regression based on Eq. (10) (Cij, Si) are listed in Table 3. Excluding individual cruises from the regression has been found to cause only negligible influence on the remaining coefficients, confirming the stability of this correction approach. In addition, adding either a constant or quadratic correction term such as that used by di Sarra et al. (2015) does not lead to a significantly improved fit quality and has thus not been used.
The final procedure adopted here for the correction of GUVis AOD is done in the following steps:
- i.
First, the closest GUVis and MIC data points regarding time of measurement are selected for comparison within a time frame of 30 min.
- ii.
If the deviation of the AOD pair exceeds the uncertainty estimate of ±0.02 of both instruments, the data pair is flagged as an outlier.
- iii.
The fit coefficients (Cij,Si) are calculated based on Eq. (10) from the GUVis and MIC AOD. In this fit, multiple values of Cij are obtained for separated cruises j, whereas a single value of Si is assumed for all data.
- iv.
Based on both correction coefficients, a corrected AOD is calculated from the GUVis measurements.
The cross-calibrated and scaled dataset is denoted in the following text as the “enhanced” dataset (GUVisE).
This section presents and discusses the results of this study. First, the shipborne reference datasets are compared (Sect. 4.1). Second, the satellite aerosol products are evaluated against the shipborne reference datasets (Sect. 4.2). Lastly, the evaluation of the CAMS RA aerosol data is presented in Sect. 4.3.
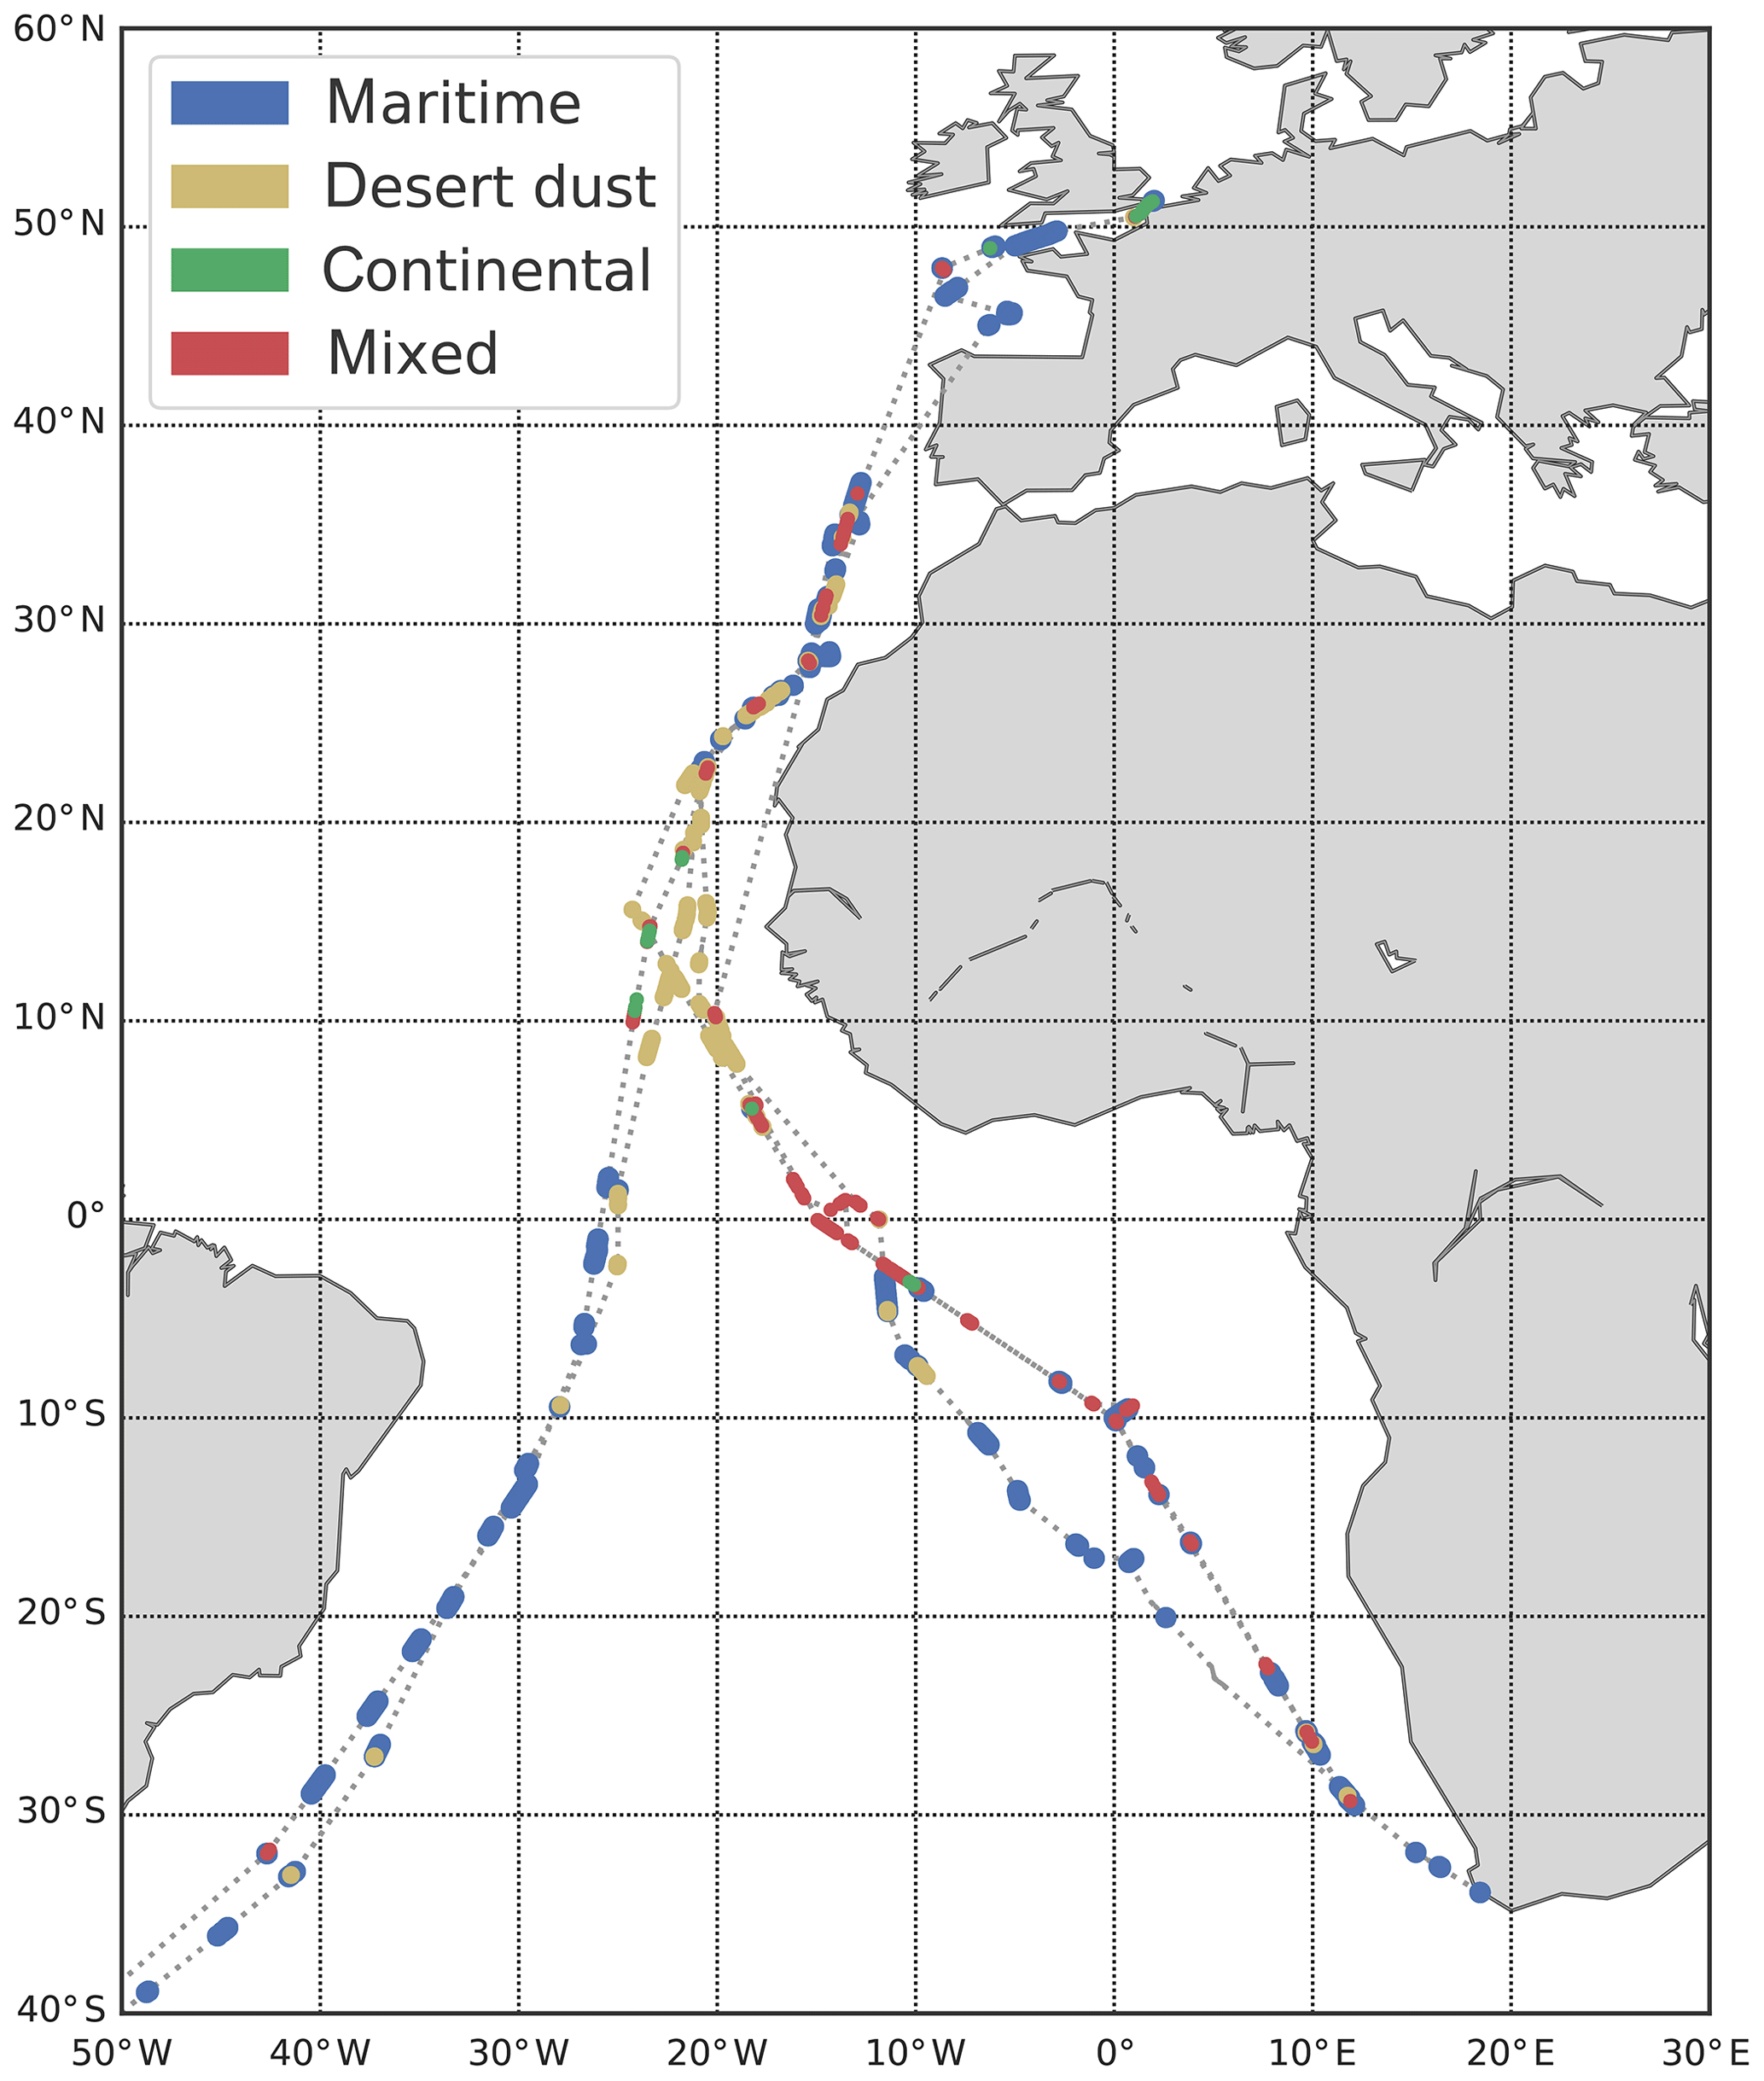
Figure 2Cruise tracks of the Polarstern during PS83, PS95, PS98, PS102, and PS113. The resulting aerosol type classification obtained from the GUVis observation is shown by colour coding.
4.1 Shipborne datasets comparison
An evaluation of the AOD product of the GUVis shadowband radiometer compared to the Microtops Sun photometer as reference was previously described by Witthuhn et al. (2017), considering one cruise of the research vessel (RV) Polarstern (PS83). This study extends the comparison to include four additional cruises with the RV Polarstern (comprising PS83, PS95, PS98, PS102, and PS113) (see Fig. 2). Regarding the comparability of both datasets, certain shortcomings are expected, as already mentioned. (i) Since the radiometers of both instruments utilize different calibration methods, and the spectral response of comparable channels might slightly differ, a deviation due to calibration is expected. (ii) Due to the different measurement methods of the Sun photometer and shadowband radiometer, an underestimation of AOD is expected for the GUVis instrument.
Given the importance of calibration for the AOD accuracy of the GUVis (see Witthuhn et al., 2017), only the calibration difference of both instruments is corrected for first, based on the method presented in Alexandrov et al. (2002) (see Sect. 3.4). The correction factor Cij for each spectral channel i and each cruise of RV Polarstern j is given in Table 3. The Microtops calibration is considered as consistent and trustworthy, due to traceability to the mature AERONET retrieval and calibration process. Therefore, it serves as the calibration reference. In the following, all versions of the GUVis datasets are calibration corrected towards the Microtops by the method presented in Sect. 3.4. The correction of AOD with the linear scaling factor S is only applied to GUVisE.
Table 4Statistics comparing the old and new processing algorithms of the GUVis observations, as well as the calibration- and forward-scattering-corrected GUVis dataset versus the MIC dataset. Availability of Microtops and GUVis channels is indicated as follows: x: available; i: internally interpolated; – : interpolated using AE. Statistics include the number of data points (N), Pearson correlation coefficient (R), the Pearson correlation coefficient of difference (R(D)), and bias plus fraction of outliers based on the limit of agreement (LOA) method for 95 % confidence interval (see Sect. 3.3 for explanation of R(D), bias and LOA).

The extended comparison is presented in the top part of Table 4. The GUVis irradiance data are first processed with the original algorithm used in Witthuhn et al. (2017). The correlation (R>0.95) found for all spectral channels comparing GUVis (old processing) and MIC generally confirms the findings of Witthuhn et al. (2017). However, the goal of an outlier ratio below 5 % (see Table 4) as well as the weighted LOA within ±1.96 to verify the uncertainty estimate of ±0.02 for GUVis is missed with the old processing algorithm. As expected, an underestimation of AOD measured by the GUVis is reflected in the negative bias of −0.03. Since the observations are performed over the ocean, the dominant aerosol conditions are maritime or desert dust (mineral dust transport) from the Sahara desert (see Fig. 1 and Table 2), which significantly differ in their forward-scattering behaviour. Comparing Sun photometers with a narrow field of view to measurements with shadowband radiometers with a wide shading angle the influence of the forward scattering of the aerosol causes an underestimation of AOD of the shadowband radiometer (Russell, 2004). This has previously been confirmed by di Sarra et al. (2015) for the MFRSR as well as for the autonomous marine hyperspectral radiometers presented by Wood et al. (2017).
The GUVis processing algorithm has received a substantial update to improve the data quality and to compensate for the underestimation of aerosol forward scattering. This update is described in detail in the Appendix (Sect. A). The GUVis AOD data of all cruises with RV Polarstern have been reprocessed with the new algorithm, and the resulting improvement of the measured AOD compared to the Microtops is also shown in Table 4. The correlation of GUVis AOD compared to MIC increases from >0.954 to >0.988 for all channels, indicating that any non-linear deviations due to aerosol forward scattering and other effects (di Sarra et al., 2015) have been substantially reduced. The underestimation of AOD is still present, indicated by a negative bias of −0.02. The uncertainty estimate of ±0.02 can be verified for spectral channels with wavelengths larger than 500 nm, since the statistics show a weighted LOA within ±1.96 (see Sect. 3.3). The uncertainty of GUVis AOD increases with decreasing wavelengths, indicated by the increase of outlier percentage and LOA.
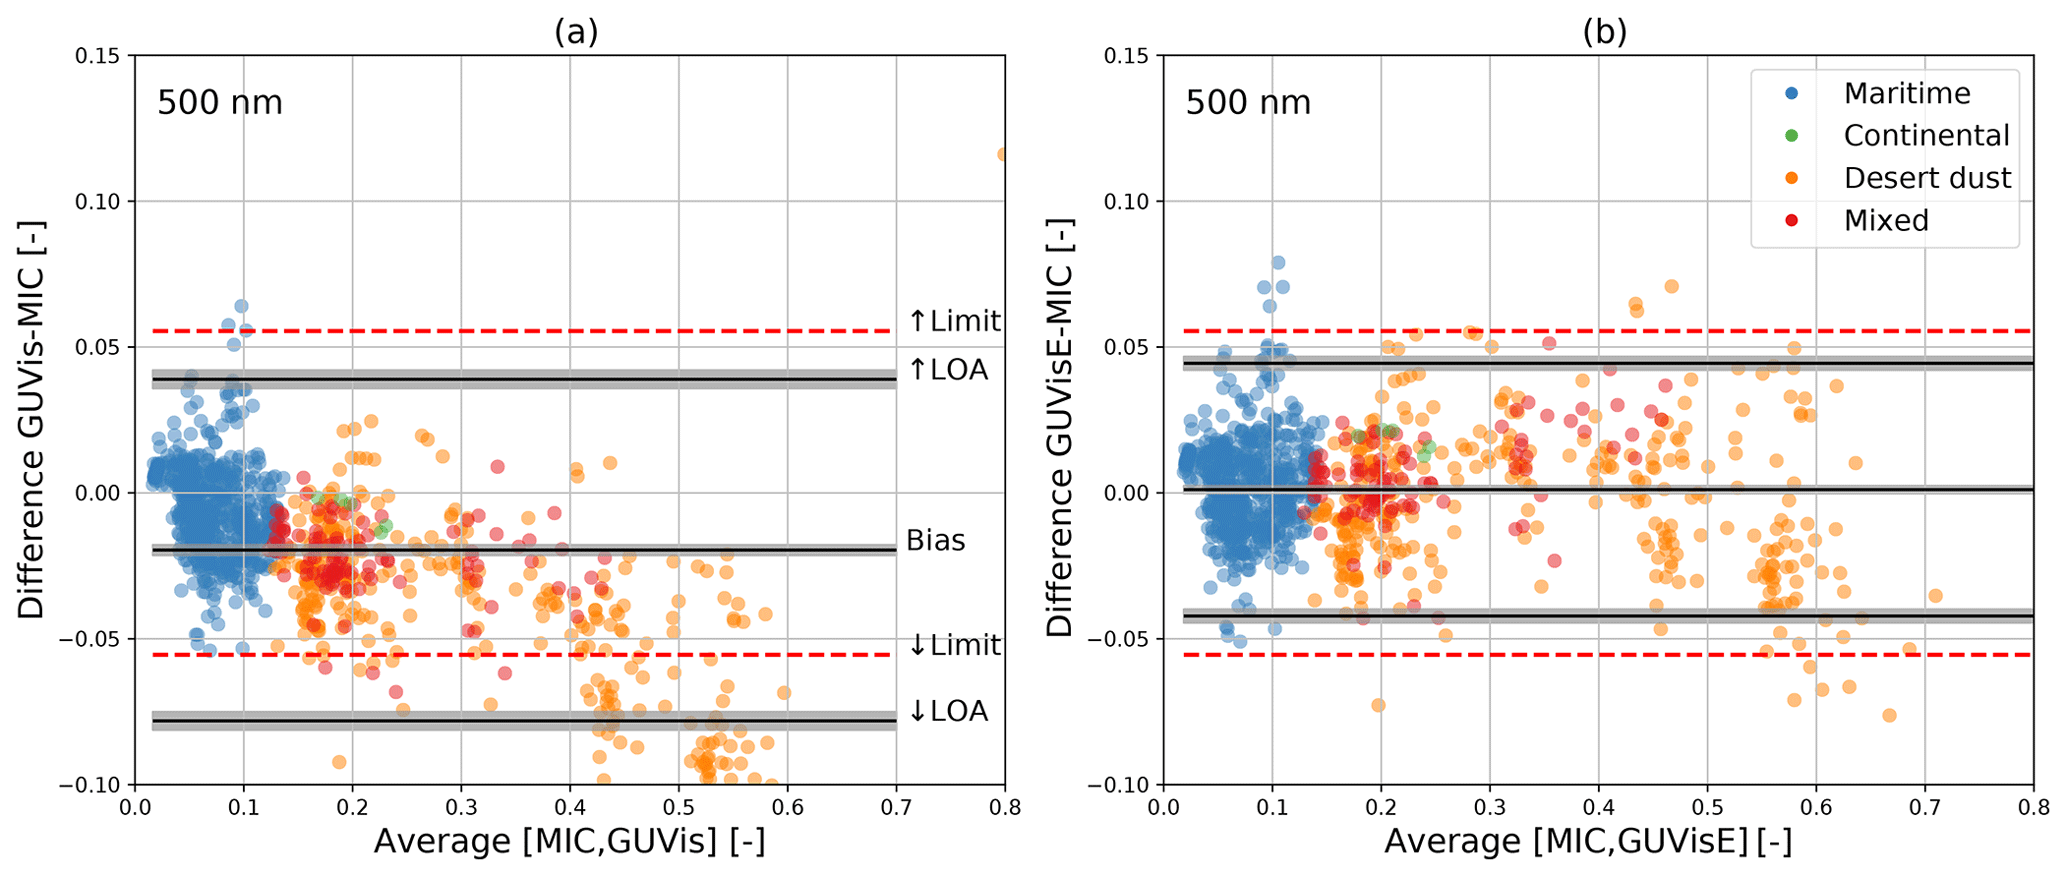
Figure 3(a) Difference of the AOD between the GUVis and MIC datasets plotted versus their mean. (b) Difference of AOD between the GUVisE and MIC datasets plotted versus their mean. Blue and orange dots indicate maritime and desert dust, respectively. These data are considered as valid, while red dots are flagged as outliers (which exceed the uncertainty estimate in at least one of the considered spectral channels). The black lines indicate the bias and the upper and lower limits of agreement (LOAs), which should contain 95 % of data points (see Sect. 3.3). The gray-shaded areas indicate the uncertainty estimate (95 % confidence limit) of bias and LOA.
The difference (D) of GUVis and MIC AOD shows a higher linear correlation as increases from >0.4 to >0.6 going from the old to new processing. As also shown by Fig. 3a, the underestimation of GUVis AOD increases linearly with increasing AOD. This linear dependence is here attributed to the difference of field of view of both instruments. If AOD increases, the effect of the circumsolar radiation due to differences in the field of view will increase. Since GUVis utilizes a broad shadowband resulting in a shading angle of 12 to 15∘ compared to the field of view of Microtops of 2.5∘, this effect results in an underestimation of AOD for the GUVis radiometer.
The lower part of Table 4 shows the results of the comparison of the enhanced GUVis dataset (GUVisE) and MIC, which includes both the calibration and forward-scattering corrections. The expected uncertainty of ±0.02 is verified again, as the values of the weighted LOA are all within ±1.96 (see Sect. 3.3). This is also shown in Fig. 3b, where the LOA falls within the uncertainty limits. In addition, the outlier percentage is close to zero, indicating a close agreement of MIC and GUVisE. The correlation increases to >0.992 for all comparable channels. While the corrections introduced here need to be reconfirmed based on future observations, they are able to reconcile the observed differences between the MIC and the GUV products for the currently available observational data. Hence, we consider the MIC and GUVisE datasets consistent due to their strong linear correlation and their agreement within the individual uncertainty limits. Therefore, the datasets are used as reliable ground-based reference datasets in the following.
4.2 Satellite product evaluation
In the following, the comparison of the two MODIS and the SEVIRI aerosol products to collocated shipborne observations is shown.
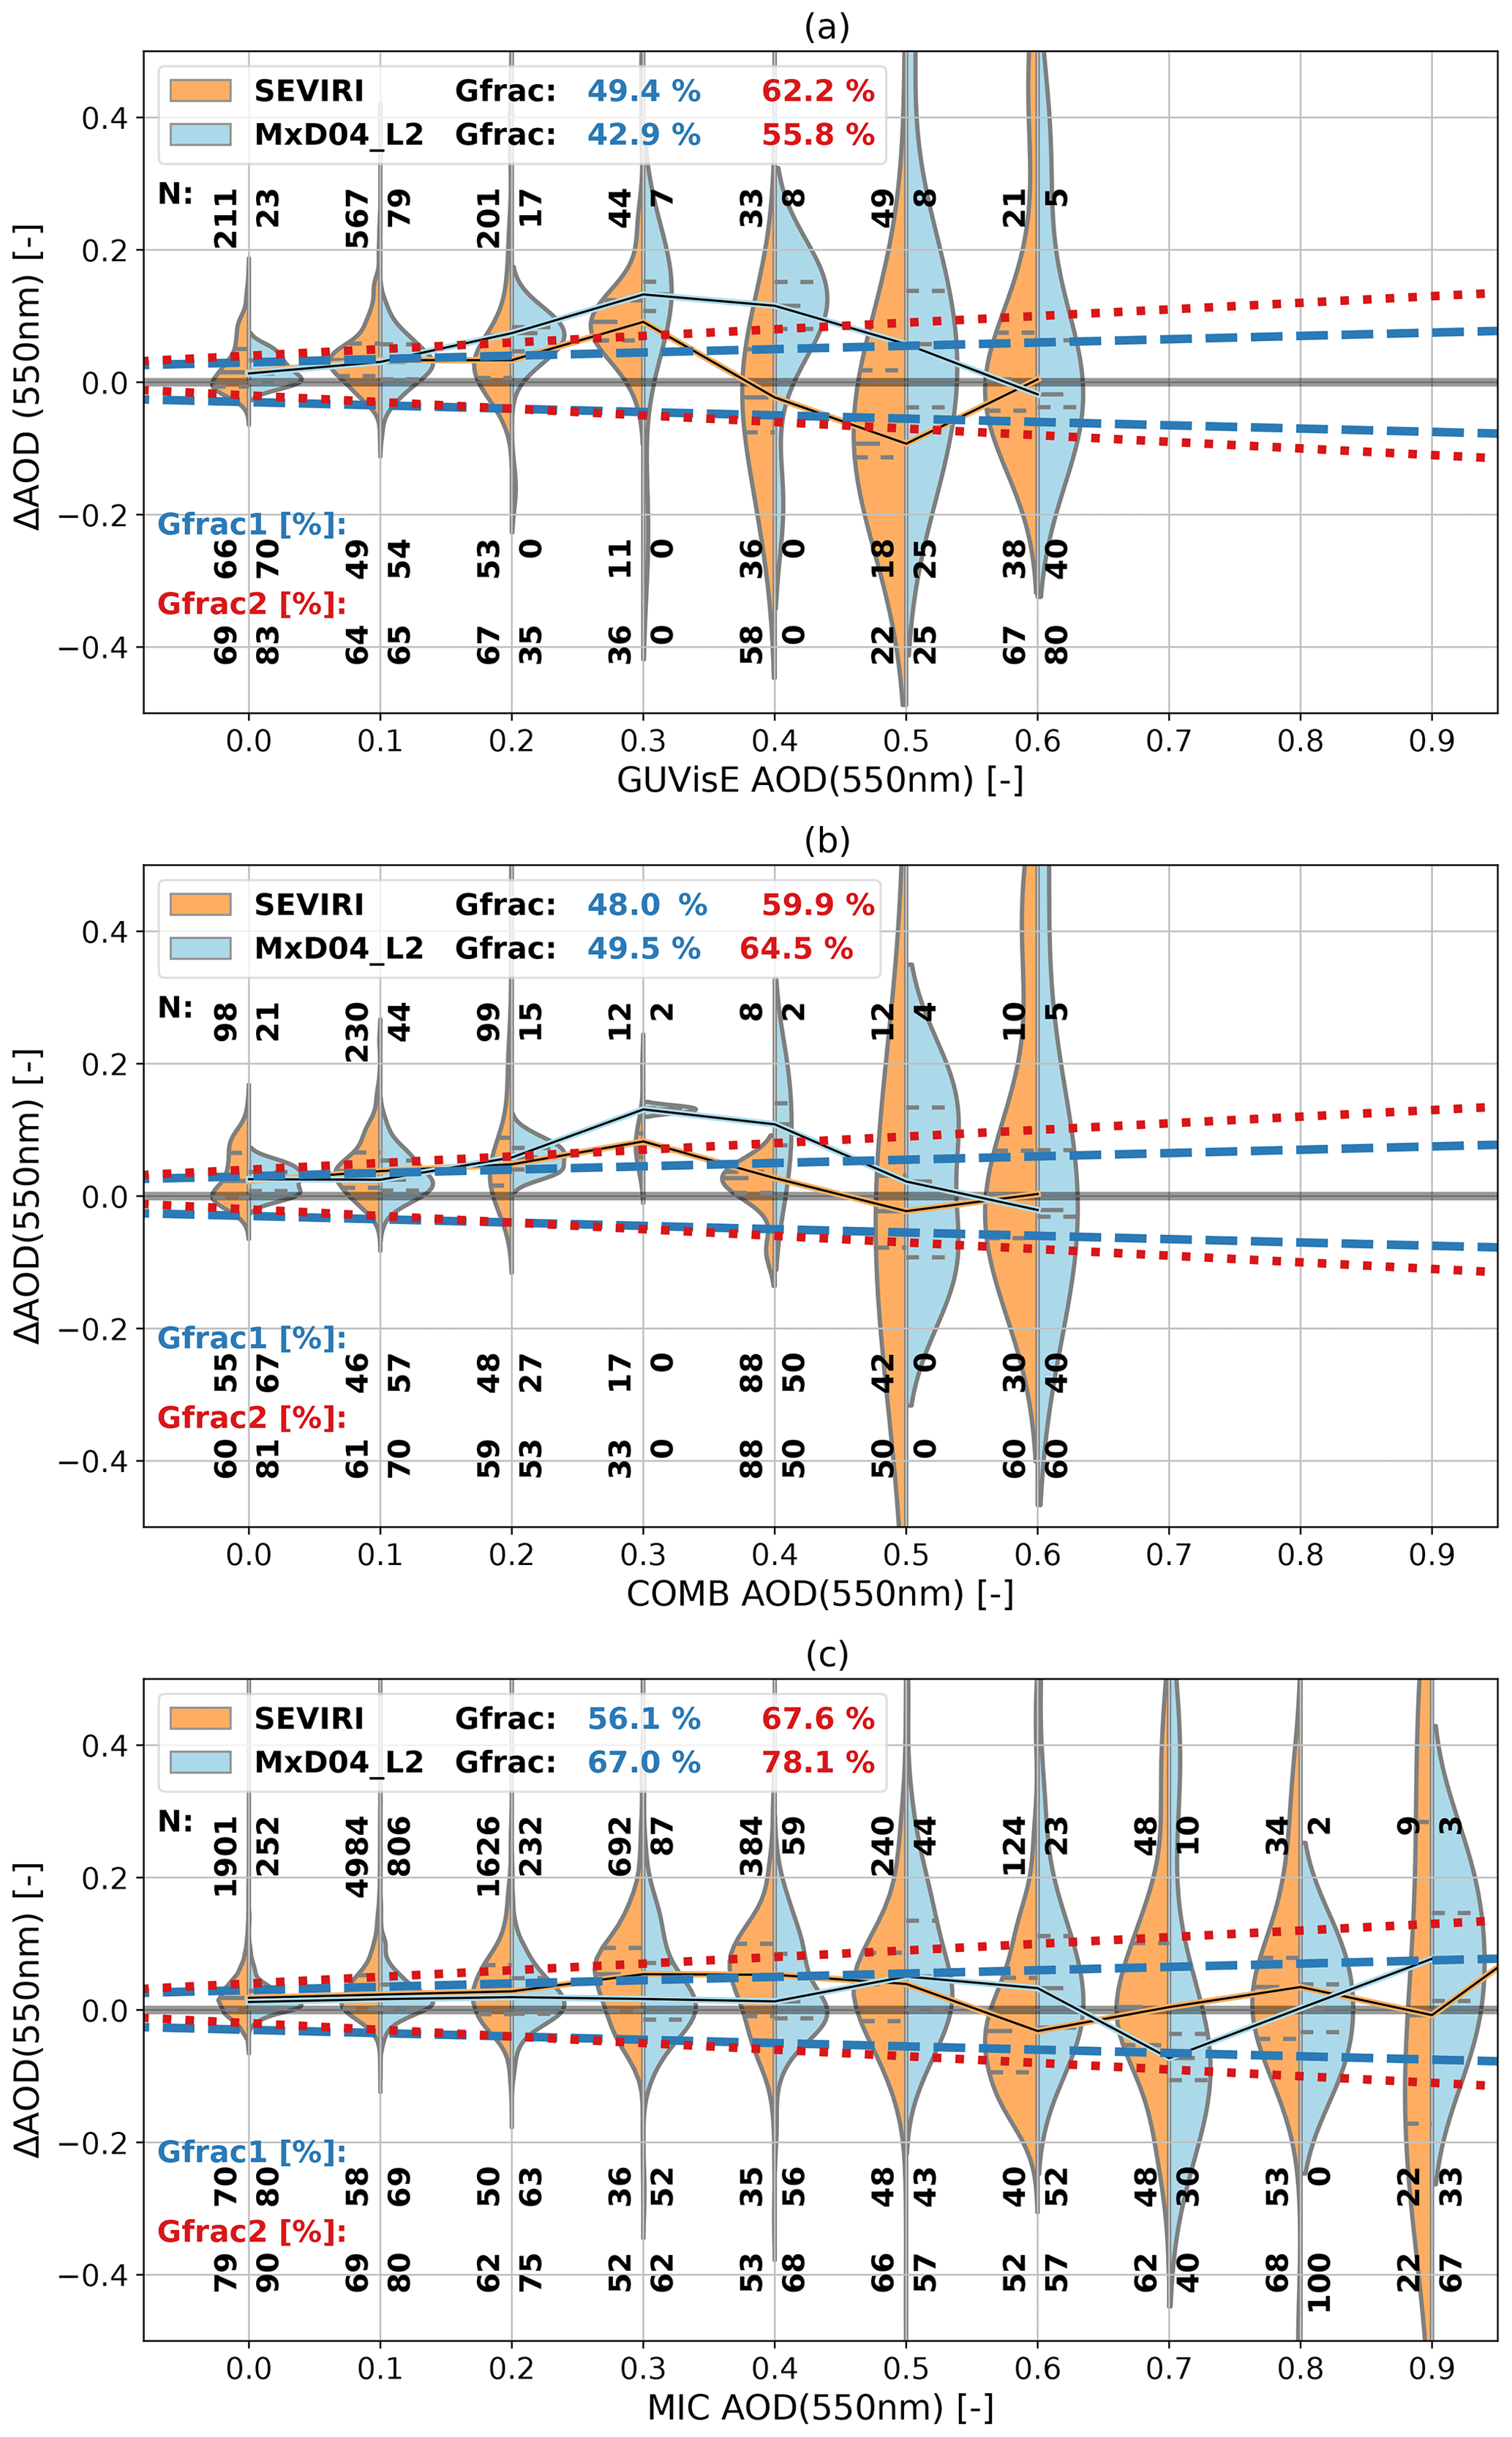
Figure 4Comparison of AOD at 550 nm from the (a) GUVisE, (b) COMB, and (c) MIC reference datasets versus the SEVIRI and MODIS AOD products. The two-sided violin plots indicate the distribution of the difference for bins of 0.1 in AOD. The median of each bin is connected with a solid line to visualize the development of the bias. The dashed blue and dotted red lines indicate the expected error limits for the MODIS AOD products. It is expected that at least 67 % of data points fall into the expected error limits. Gfrac1 and Gfrac2 are the actual percentages of data points lying within the error limits, calculated for each bin, and as the total for both the SEVIRI and MODIS AOD products.
(i) First, the satellite AOD at 550 nm is validated. The wavelength of 550 nm is chosen as this channel is mainly used in previous validation studies (e.g. Abdou et al., 2005; Bréon et al., 2011; Shi et al., 2011; Anderson et al., 2012; Wei et al., 2019) and EE limits are defined for it (Levy et al., 2013). Since the SEVIRI dataset does not provide AOD at 550 nm, it was calculated with Eq. (1) using the AOD of 630 nm and the AE from the SEVIRI dataset.
Figure 4 shows the comparison of MxD04_L2 and the SEVIRI AOD at 550 nm to the shipborne aerosol datasets within AOD bins of 0.1. The validation with respect to the EE limits shows that the MODIS aerosol product meets the goals of both EE1 and EE2 compared to the Microtops dataset. As expected, the SEVIRI aerosol product shows a higher deviation versus Microtops than MODIS and only meets the goal of 67 % for EE2, since it accounts for a general overestimation of satellite AOD. The SEVIRI retrieval shows an even stronger tendency to overestimate AOD in comparison to the MIC reference dataset. The bias of satellite AOD also shows a dependence on the magnitude of the AOD. A positive bias (overestimation) is mostly found in situations with AOD values below 0.5, and decreases for larger AOD. This behaviour is most evident in Fig. 4a and b, as the reference datasets are GUVisE and COMB. A similar behaviour also appears in the comparison to Microtops (Fig. 4c), although it is far less pronounced. Since the satellite instruments measure reflected radiance, the reflecting properties of the ground used in the retrievals influence the retrieved AOD. Especially for clean atmosphere, e.g. low AOD, the influence of such parameters (e.g. surface albedo) is strong, since the values measured reflectance at the top of the atmosphere (TOA) are close to the values of surface reflectance. For larger AOD values, the uncertainty of those characterizations shrinks; therefore, the overestimation of AOD decreases. Since the GUVisE and COMB datasets contain more maritime and desert dust cases than the MIC, this behaviour is strongly visible.

Figure 5Same as Fig. 4 but only using MIC as a reference dataset. The comparison is presented for AOD at 550 nm (a) and 630 nm (b). As an additional constraint, availability of data from both the SEVIRI and MODIS datasets is required.
Figure 5 presents the same comparison as Fig. 4, but simultaneous availability of data from all datasets (SEVIRI, MODIS, MIC) is required to preclude differences arising from a different sampling of cases. Therefore, the accuracy of SEVIRI and MODIS is directly comparable with respect to the MIC reference. This comparison shows that both AODs retrieved from SEVIRI and MODIS agree well with the shipborne reference, although the non-linear behaviour of over- and underestimation is more pronounced for the SEVIRI retrieval. Since 550 nm is not a native spectral channel of SEVIRI, increased deviations in AOD are expected, since the uncertainty of AE calculated from SEVIRI native channels is high, as shown later. Therefore, a strong improvement of agreement is found comparing the 630 nm AOD to the shipborne reference as the SEVIRI AE is not used for calculation in Fig. 5b. At lower AOD values, SEVIRI AOD is close to the MODIS AOD.
Table 5Statistics comparing MIC reference AOD at 550 nm versus CAMS, SEVIRI and MxD04 aerosol products. The comparison is shown for the collocated datasets with different selections based on aerosol type (maritime, desert dust, and continental) and for CAMS RA with and without available AATSR measurements. Further, the comparisons are separated based on the MIC AOD for all AOD values, as well as AOD higher and AOD lower than 0.4. N denotes the number of collocated data points for all selections. Also listed are the correlation (R) and the bias fraction of data based on the limit of agreement (LOA) method for the 95 % confidence interval. G1 and G2 indicate the percentage of data points lying within the expected error limits (EE1 and EE2).
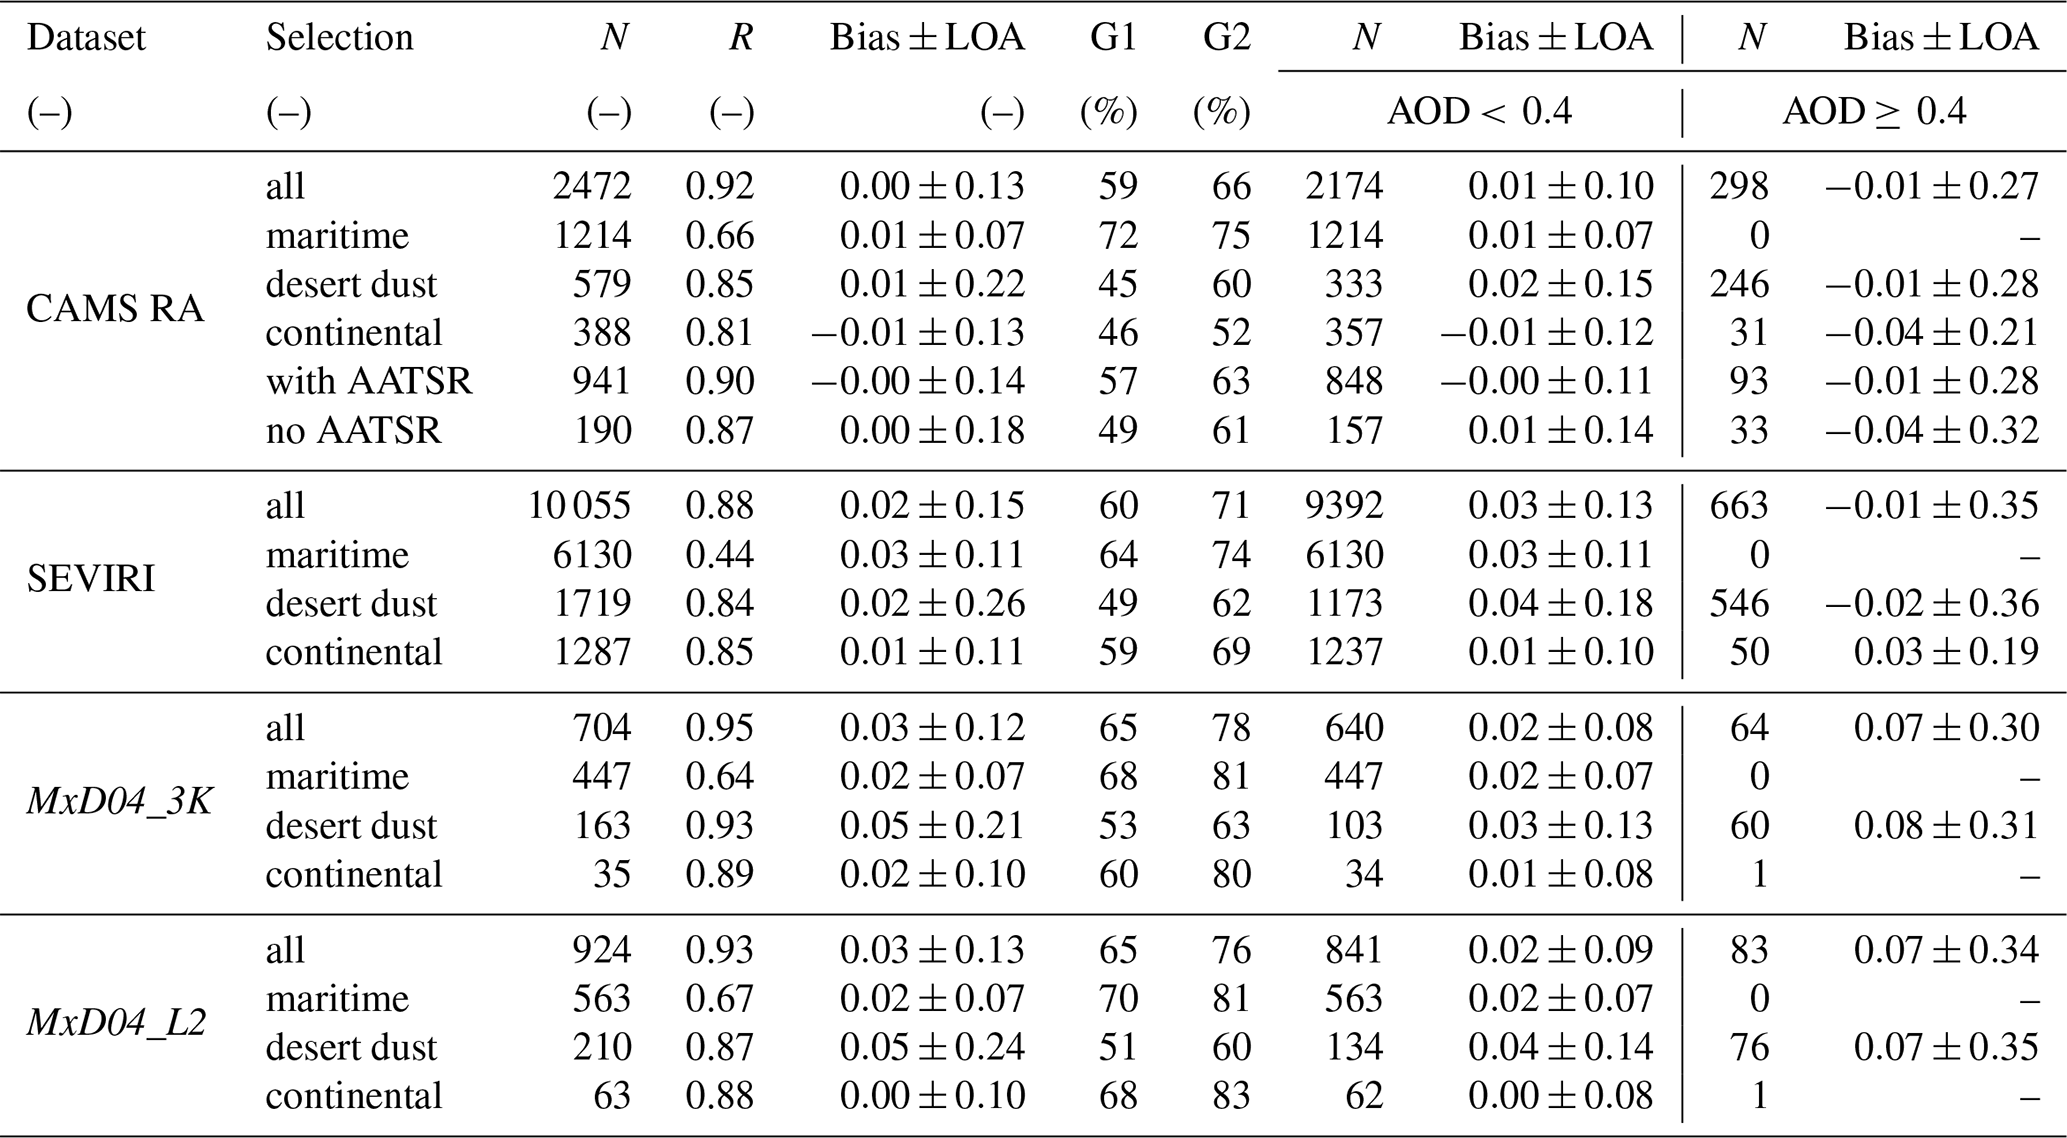
Table 5 summarizes the results of the AOD validation at 550 nm. For the statistics presented in this table, the SEVIRI AOD is calculated using MIC AE since using the native AE leads to high uncertainties. Generally, the satellite-based AOD is higher compared to the shipborne reference datasets, as is reflected in the bias > 0 for all selections, except for larger AOD values, where the SEVIRI bias turns negative. The MODIS aerosol products show the highest linear correlation (0.93 for MxD04_L2, 0.95 for MxD04_3K) and lowest values for LOA. LOA values are even slightly lower than those for the MxD04_L2 product. Thus, this finding does not confirm the expectation of higher noise in the 3 km versus the 10 km product of MODIS expressed in Levy and Hsu (2015a, b). The analysis has also been repeated separately for the MODIS datasets based on the Terra and Aqua satellites (not shown), but only minor differences in the evaluation statistics for the individual satellites were found. Thus, only the combined MODIS dataset from Terra and Aqua is presented here. It also has to be stressed that the considered dataset is still relatively small compared to other validation studies and should be repeated if more reference data become available. Nevertheless, the correlations found here agree well with the findings of Levy et al. (2013) considering the MODIS C6.1 aerosol product (0.937) and the 550 nm channel. A smaller dataset of Microtops observations was compared to MODIS aerosol products by Kharol et al. (2011), where a general overestimation of AOD and a high correlation were found, similar to our results. For SEVIRI, the findings exceed the values found in the study of Bréon et al. (2011) at 630 nm over the ocean (0.795 versus 0.88 in this study), indicating a significantly better performance over the ocean than over land. The results for SEVIRI and MODIS show a similar agreement of the AOD compared to the reference data but with a larger scatter of ±0.15 LOA for SEVIRI versus ±0.13 LOA for MODIS AOD. Also, SEVIRI AOD shows higher bias values for AOD < 0.4 and negative bias for AOD values ≥ 0.4.
(ii) Second, the AE calculated from the satellite products is validated. We chose to calculate the AE for each aerosol product from the channels matching closest to the wavelengths 440 and 870 nm with Eq. (1). This obviously leads to increased uncertainties for the SEVIRI product but also demonstrates its limitations.
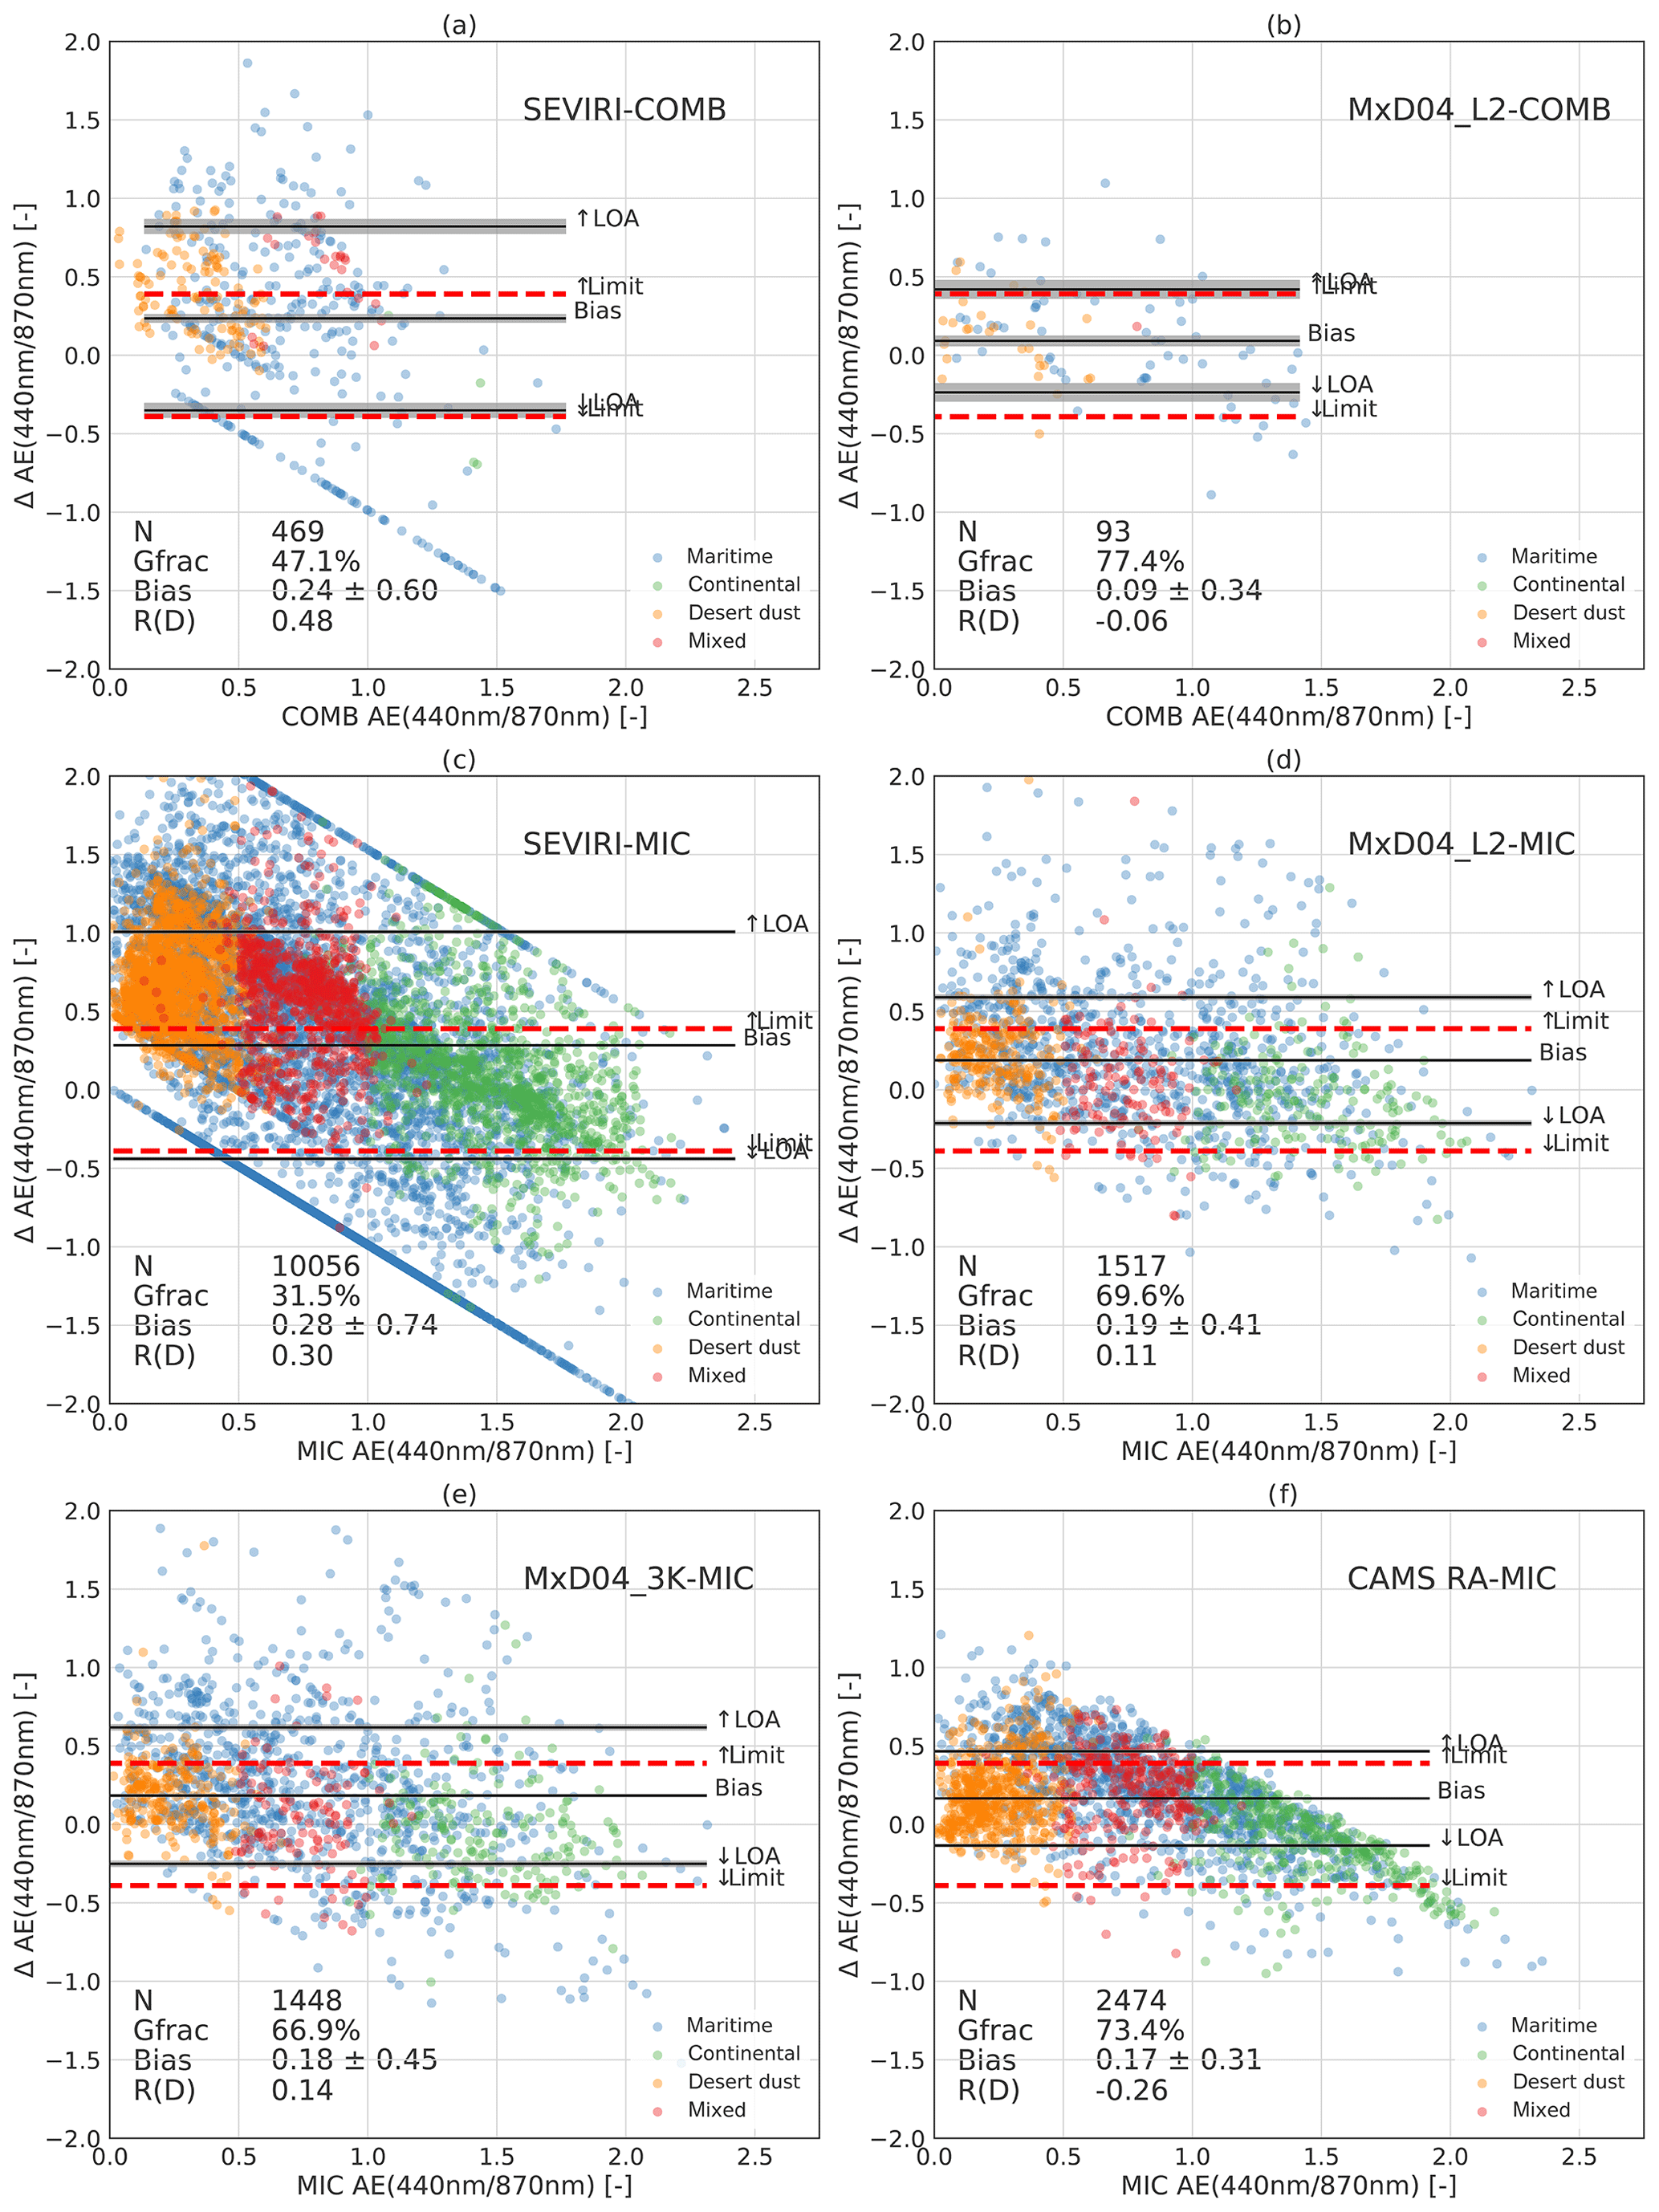
Figure 6Comparison of AE from the COMB or MIC reference datasets versus the SEVIRI, MxD04, and CAMS RA datasets. The aerosol type classified with the reference dataset is indicated by the colour of each point. Dashed red lines indicate the estimated error limits for AE (±0.4) of the MODIS products (Chu, 2002). Overall, 67 % of AE data points are expected to fall into these limits. LOAs (outer black lines) are based on 67 % confidence intervals. The bias is given by the middle black line and is calculated as the mean of the difference. The statistics state the number of measurements (N), percentage of data within expected error limits (Gfrac), bias ± LOA, and correlation of the difference (R(D)).
Figure 6 shows the comparison of the difference of AE versus the different shipborne reference datasets as a scatter plot, indicating the bias, as well as the LOA and EE limits. The EE for AE is estimated to be ±0.4 for the MODIS products (Levy et al., 2010, 2013), and the same EE is applied for the SEVIRI AE product. In general, the MODIS AE agrees with this estimate of the EE limits but shows a tendency to overestimate the shipborne AE, as reflected by the positive bias. The bimodal behaviour of AE of the MODIS products found for C5 in Levy et al. (2010) is not reproduced here, which agrees with the findings for C6.1 presented in Levy et al. (2013). Also, MODIS AE meets the expected Gfrac of >67 % for an EE of ±0.4, as was already found in Levy et al. (2013). The results for the SEVIRI AE show a general overestimation versus MIC, indicated by the positive bias. Furthermore, a bimodal behaviour of AE is found, similar to that reported for the C5 MODIS products in Levy et al. (2010). The SEVIRI-based AE mostly lies close to two values: AE close to zero is associated with the models of oceanic and maritime aerosol used by the retrieval (O99, M99; Shettle and Fenn, 1979). Another large fraction of the dataset is related to purely tropospheric aerosol models (types T99, T90, T50; Shettle and Fenn, 1979), covering AE from 1.29 to 1.61. Another frequent assignment of aerosol model is that for very small particles which cover the AE range from 1.8 to 2.4 (Thieuleux et al., 2005). Therefore, it can be concluded that SEVIRI retrieval of AE cannot realistically capture the variability in the AE which is observed from shipborne products, which is expected given the limitations of the product. It should be noted that the results comparing AE from satellite to MIC can be reproduced with the COMB dataset (Fig. 6a and b), although the number of collocated measurements is small. Thus, this study should be extended with data from additional cruises in the future.
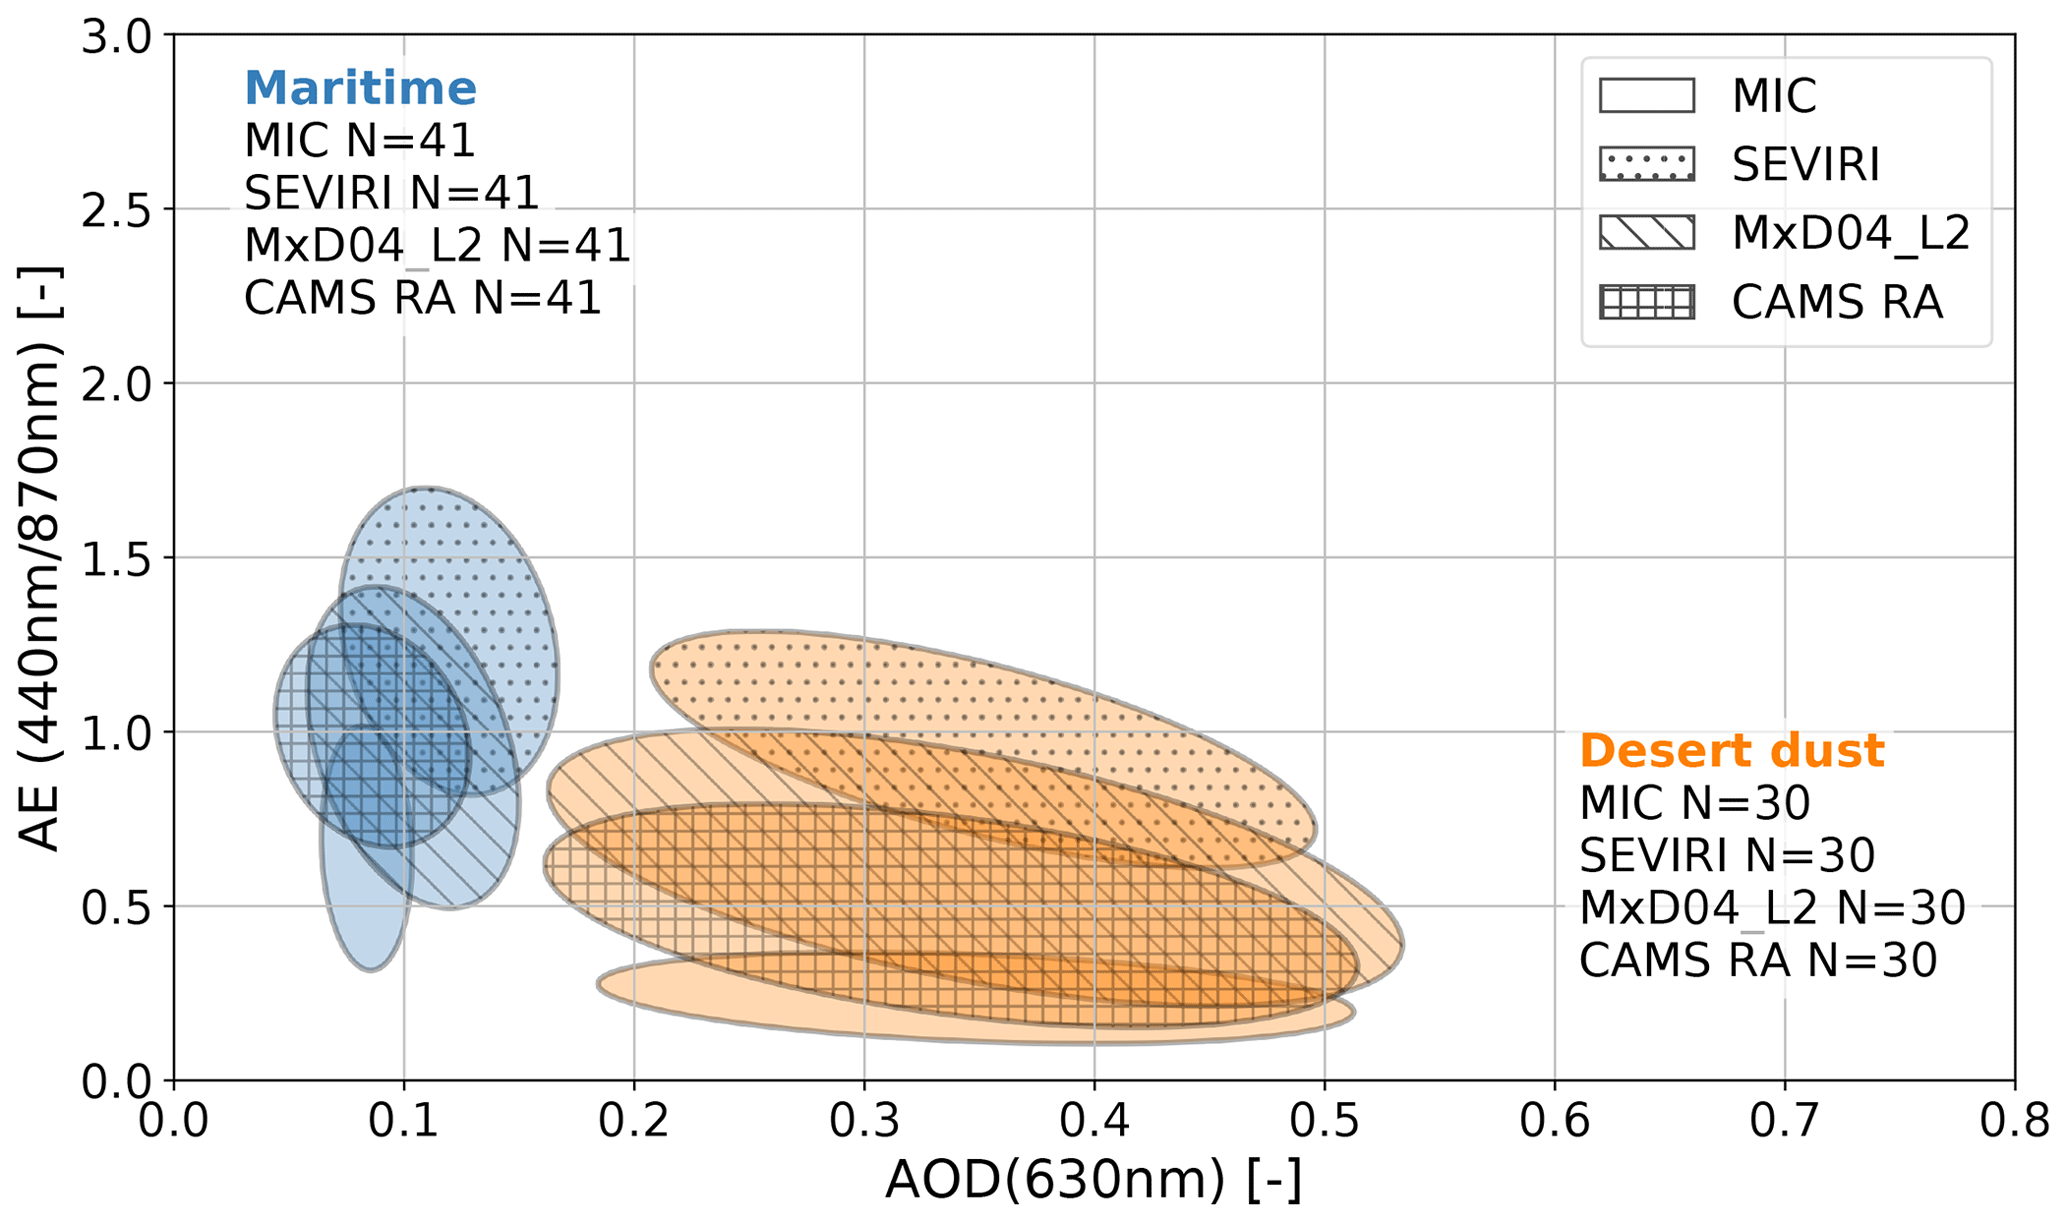
(iii) Third, the representation for different aerosol conditions within the satellite-based AOD and AE products is investigated. To examine the representation of AOD and AE with respect to aerosol type, the layout presented in Toledano et al. (2007) is used for example in Figs. 7 and 8. Instead of the AOD at 440 nm (as chosen by Toledano et al., 2007), the wavelength of 630 nm is chosen to match the native SEVIRI channel. Also we restrict the comparison choosing only data points where AOD at 810 nm > 0.05 to avoid uncertainties from calculating AE from low AOD values. The aerosol type is classified based on the MIC data (see Sect. 3.1). Points related to a certain aerosol type are combined in the form of a covariance ellipse which spans 67 % of the related data points.
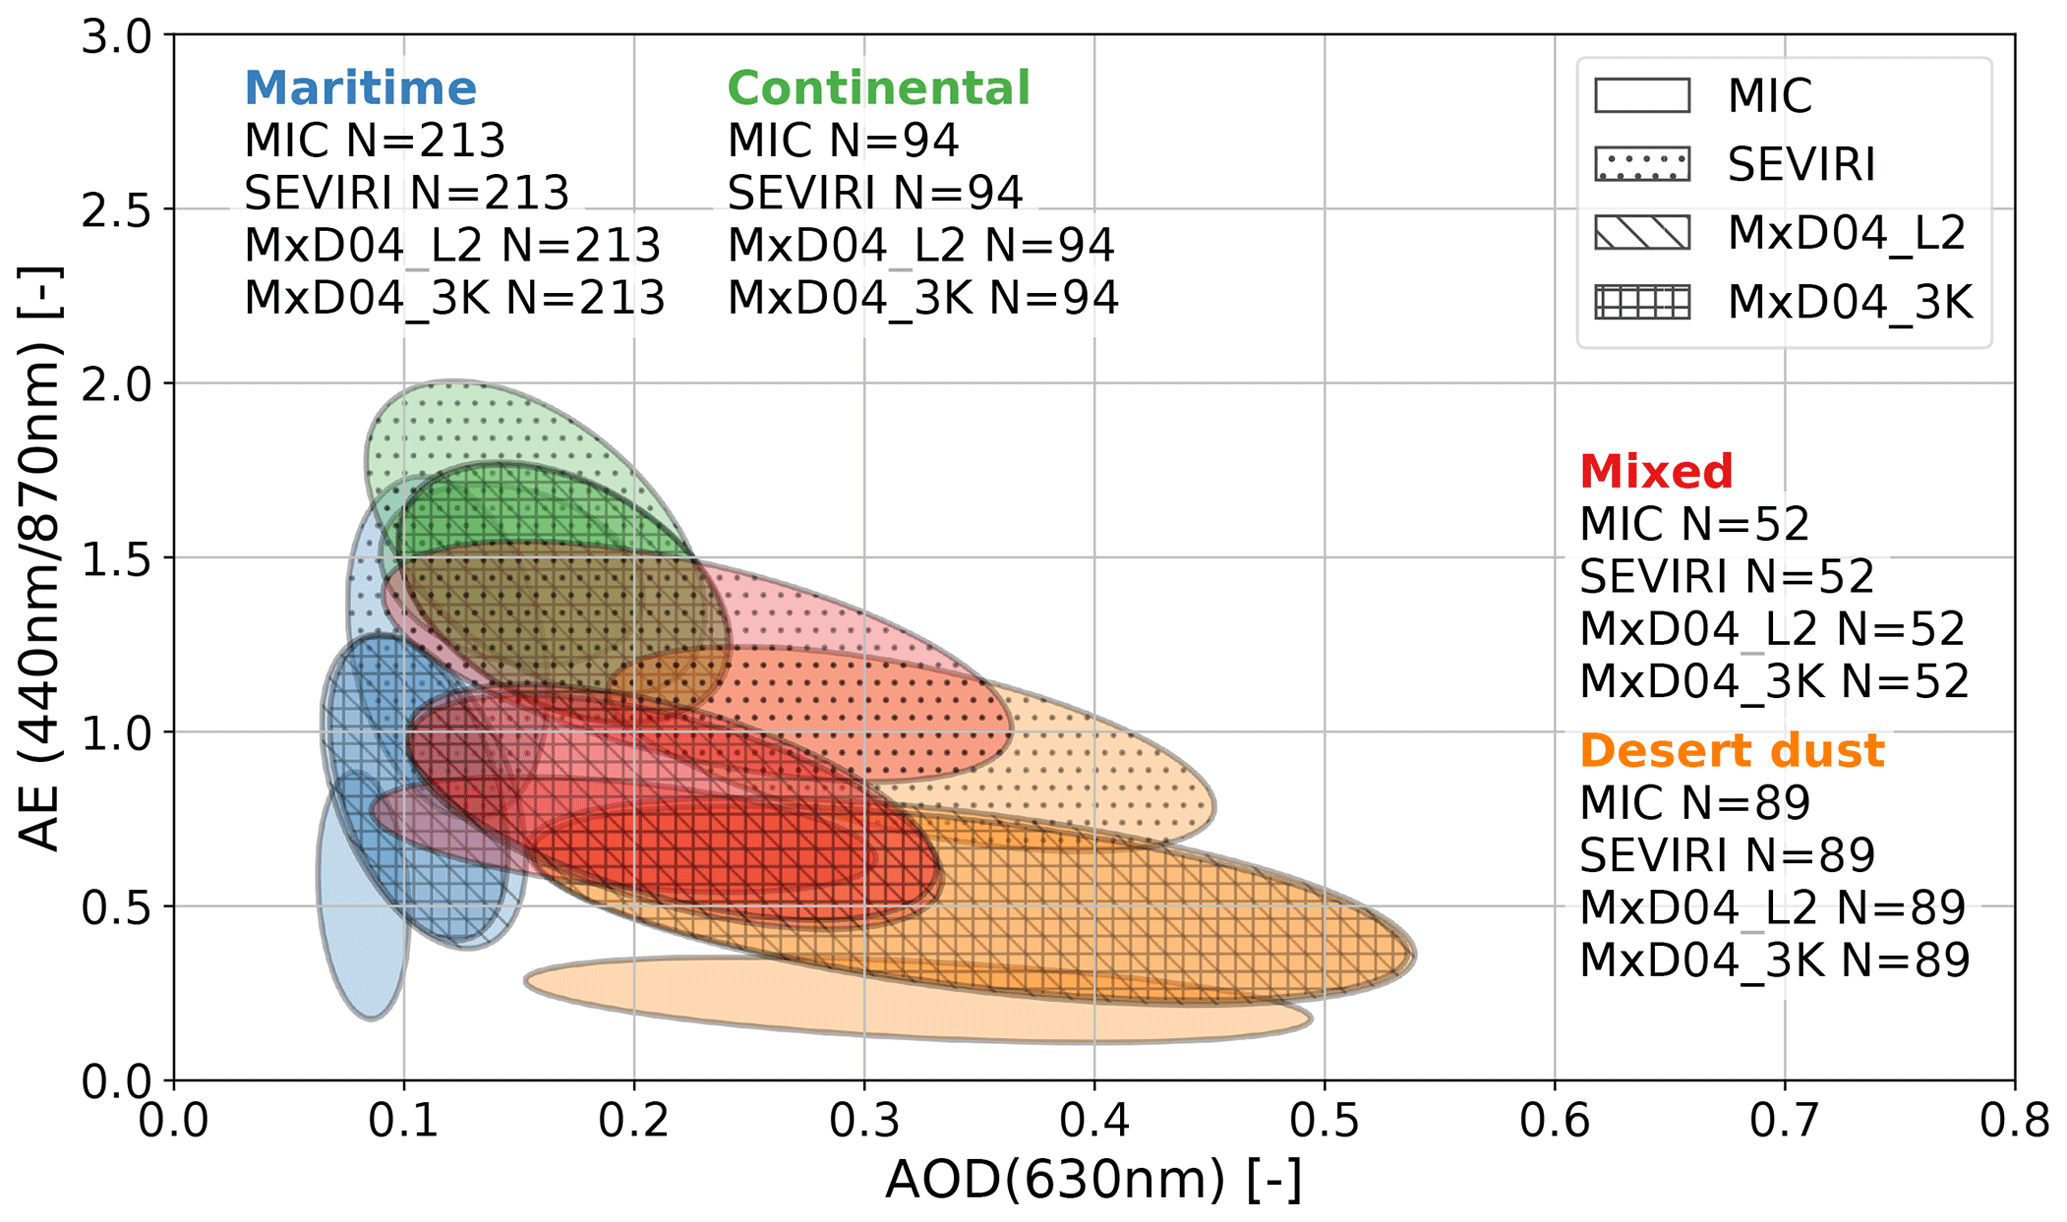
Figure 7Comparison of AE calculated from AOD at the wavelengths of 440 and 810 nm versus AOD at 630 nm calculated from the Microtops, SEVIRI, and MODIS products. Simultaneous data availability from satellites and MIC is required so that each instrumental data points has a corresponding counterpart from the other instruments. The data points are grouped by aerosol type (classified with MIC) and visualized as covariance ellipsoids for a 67 % confidence interval.
Figure 7 shows that, overall, the AODs of the different products and instruments lie very close together, with a slight tendency to overestimate the AOD for desert dust (only MODIS products) or maritime aerosol types. In general, the satellite-based datasets overestimate the AE. These results confirm the statistics discussed before. The satellite ellipses are tilted compared to the MIC ellipses, as a result of the assumed relation of AOD and AE in the retrieval, which is determined by the choice of aerosol model. This effect is strongly visible for SEVIRI in situations other than maritime, because the AE is calculated from the native channels only. SEVIRI AOD in maritime conditions exhibits a stronger overestimation as also shown in Table 5. This effect might be related to the coarser spatial resolution of the satellite pixels or undetected cloud contamination (see Sect. 2.2). The spatial-mean AOD inferred from satellite pixels can deviate from the AOD which is retrieved from slant transmission in the case of MIC, due to the mismatch of spatial scales. The most prominent feature of Fig. 7 is the deviation in AE for desert dust conditions and to a lesser extent for the mixed type aerosol. The MODIS product shows a more than 2 times larger and the SEVIRI product a more than 3 times larger AE for desert dust situations, when compared to the shipborne products. This relates to a lack of realistic mineral dust models in the satellite retrievals. This emphasizes that the Ångström behaviour is not applicable for desert dust conditions, at least with a limited set of spectral channels. However, the AE is still the method of choice for extrapolating the AOD at the desired wavelengths to validate or increase observation capabilities, as is done in several studies (Kleidman et al., 2005).
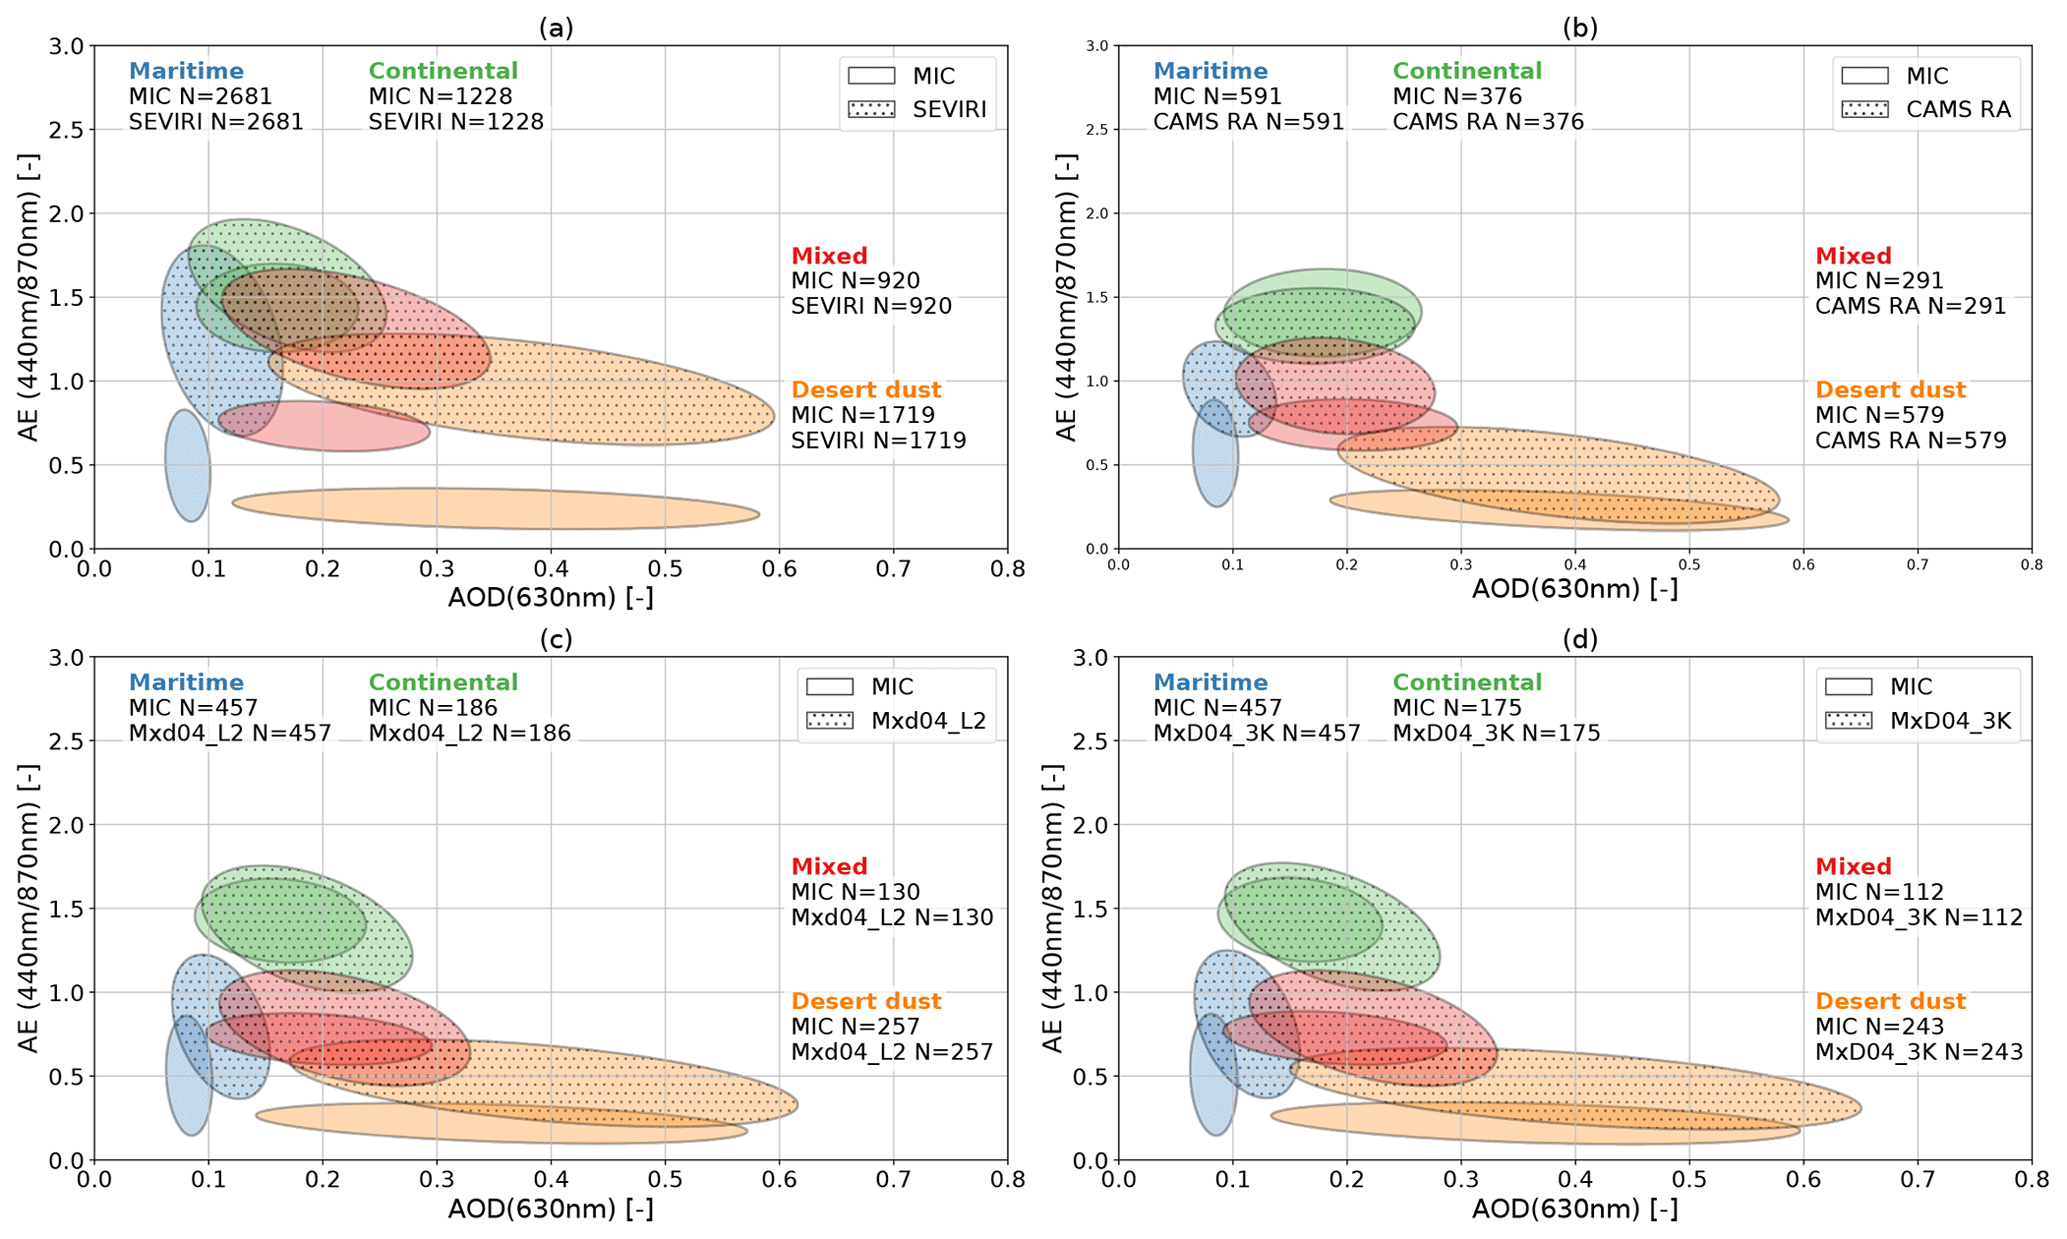
Figure 8Same as Fig. 7, but the requirement for simultaneous data availability from all data points was dropped, and the figure also shows CAMS RA data points.
Figure 8 confirms the above findings. In this figure, each dataset has been collocated individually to the MIC reference to increase the diversity of conditions. No noteworthy discrepancies are found for continental aerosol types. With the exception of the positive bias in AOD especially at lower values of AOD, and the overestimation of AE in particular for desert dust and therefore to some extent also mixed aerosol, the satellite aerosol products are found to agree closely to MIC, in particular for continental aerosol.
The previous statistics confirm that the AOD retrieved from satellite agrees well with the shipborne reference but slightly overestimates AOD in general and especially at low AOD. AE is also overestimated for maritime and especially desert dust aerosol. Therefore, AOD is only represented well for the native spectral channels of the satellite instruments. The estimation of the spectral behaviour of AOD remains challenging, due to the lack of realism of the aerosol models (MODIS and SEVIRI) and the number of spectral channels available (SEVIRI). These findings are in particular applicable for conditions dominated by mineral dust.
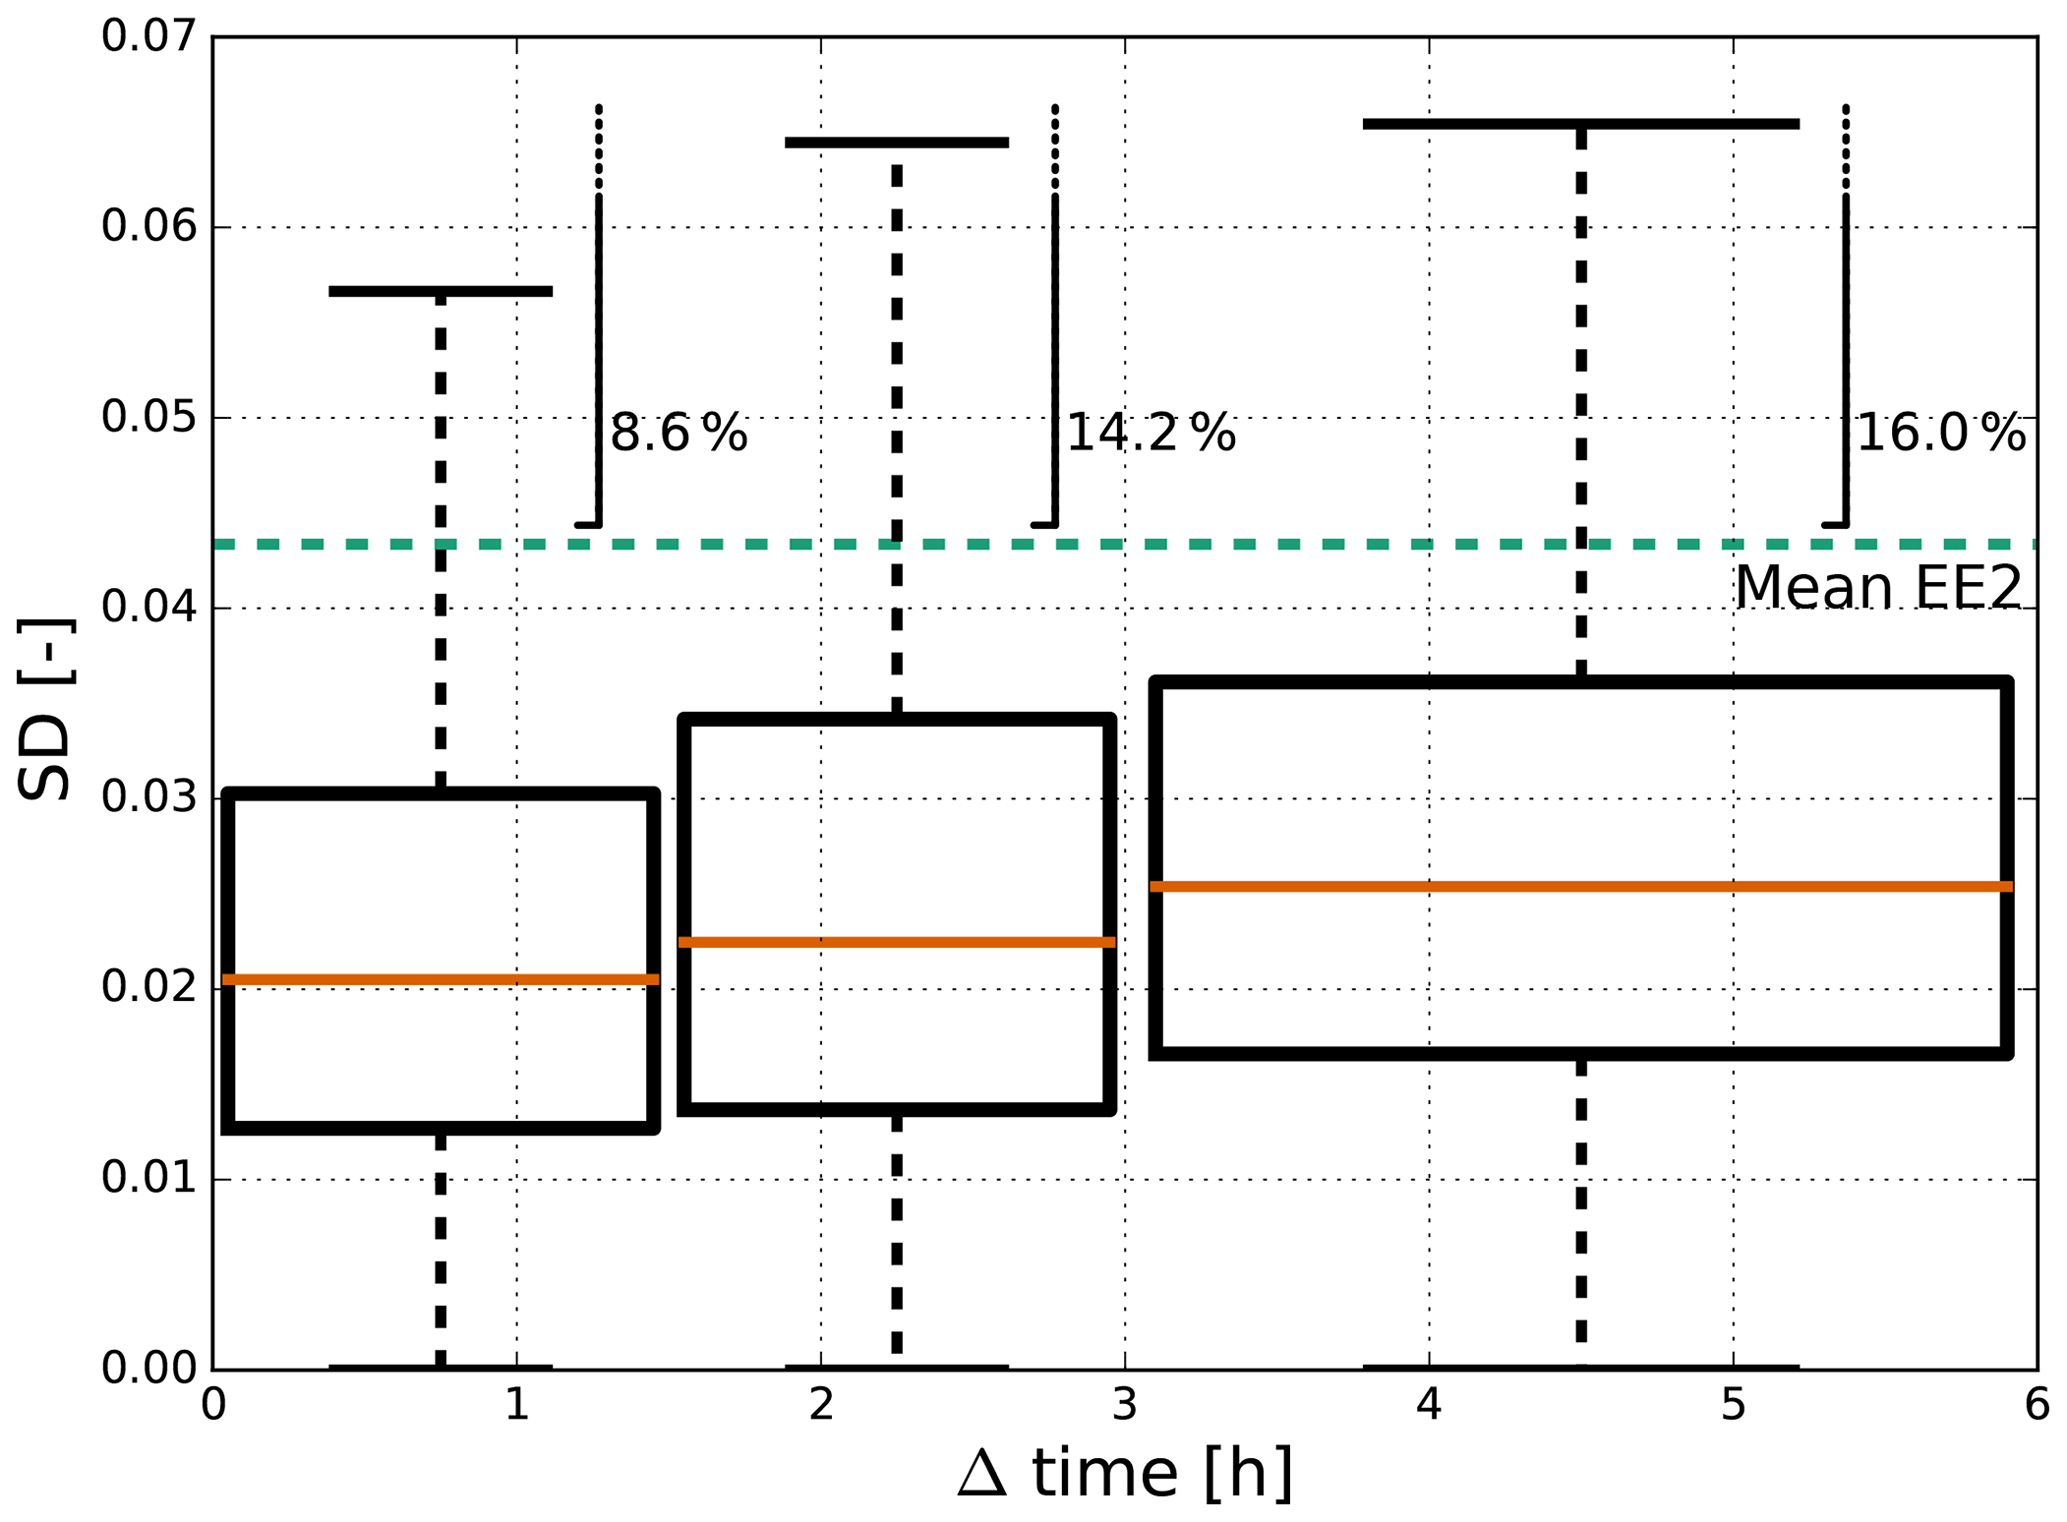
Figure 9Temporal variation of AOD expressed as the standard deviation (SD) of SEVIRI AOD between MODIS overpasses, as a function of time lag between retrievals (Δ time). The mean of the expected error limits (EE2) of MODIS [] is calculated from the mean SEVIRI AOD of all data points and shown as the dashed green line. A variation in AOD can be considered significant if the magnitude of SD exceeds the error limits. The percentage of significant situations is denoted for each time interval.
Last, we investigate the value of increased temporal resolution within the SEVIRI aerosol product versus MODIS products. While the MODIS aerosol product is clearly the product of choice for many applications, i.e. for data assimilation and climate studies, due to its accuracy, availability, and global coverage, the SEVIRI aerosol product is still of scientific interest due to its high temporal resolution of 15 min (Bréon et al., 2011). The high temporal resolution, however, adds information compared to products from polar-orbiting satellites if the temporal variations of aerosol properties since the last overpass of a polar-orbiting satellite exceed the error limits of the retrieval. Thus, it is not clear how much information can actually be gained from the higher temporal resolution of SEVIRI, as it is expected that AOD variations are generally small on the timescale of hours. To further investigate this point, MODIS collocations with the shipborne datasets are used to serve as random samples to study the AOD variability between successive overpasses. For each pixel of a MODIS image, the corresponding SEVIRI AOD for every available SEVIRI image between overlapping MODIS images of consecutive Terra and Aqua overpasses was acquired to calculate the AOD variation. Relative to the linear regression line of the MODIS AOD of each overpass, the standard deviation (SD) of SEVIRI AOD was calculated. Therefore, SD is a measure of the additional variation of AOD which cannot be seen in a MODIS-only AOD product. Figure 9 shows the SD calculated for different time intervals between consecutive MODIS images. The mean SD of AOD within 6 h is slightly larger than 0.02. The SD is compared to the mean EE2 calculated using Eq. (4) and mean SEVIRI AOD, indicated by the dashed green line in Fig. 9. If the SD is larger than EE2, it points out a situation where AOD variation cannot be captured by MODIS and can be called significant. SEVIRI aerosol measurements add information to the general AOD monitoring only if the AOD variation is significant. As Fig. 9 reveals, this is only true for slightly above 8 % of all situations, knowing that, in general, Terra and Aqua satellites pass over the same region every 3 h. This emphasizes that, in terms of climate studies or data assimilation, the significant higher temporal resolution of SEVIRI does not lead to improvements for the majority of situations, unless the accuracy of this product could be significantly improved. In fact, such an improvement will be possible in the future with the third generation of Meteosat (MTG). We are aware that the analyses presented here do not provide a complete picture of the AOD variability over the full diurnal cycle. It was only possible to analyse the variability between daytime overpasses of MODIS. Continuous evaluation of the daily cycle of AOD are only possible with geostationary satellites such as SEVIRI. With the high temporal resolution, the SEVIRI product is needed for many applications, such as extreme events such as dust or smoke plume development, where high variability of AOD is expected.
4.3 CAMS RA evaluation
Alongside the evaluation of satellite aerosol products described above, results for the CAMS RA AOD are presented in Table 5.
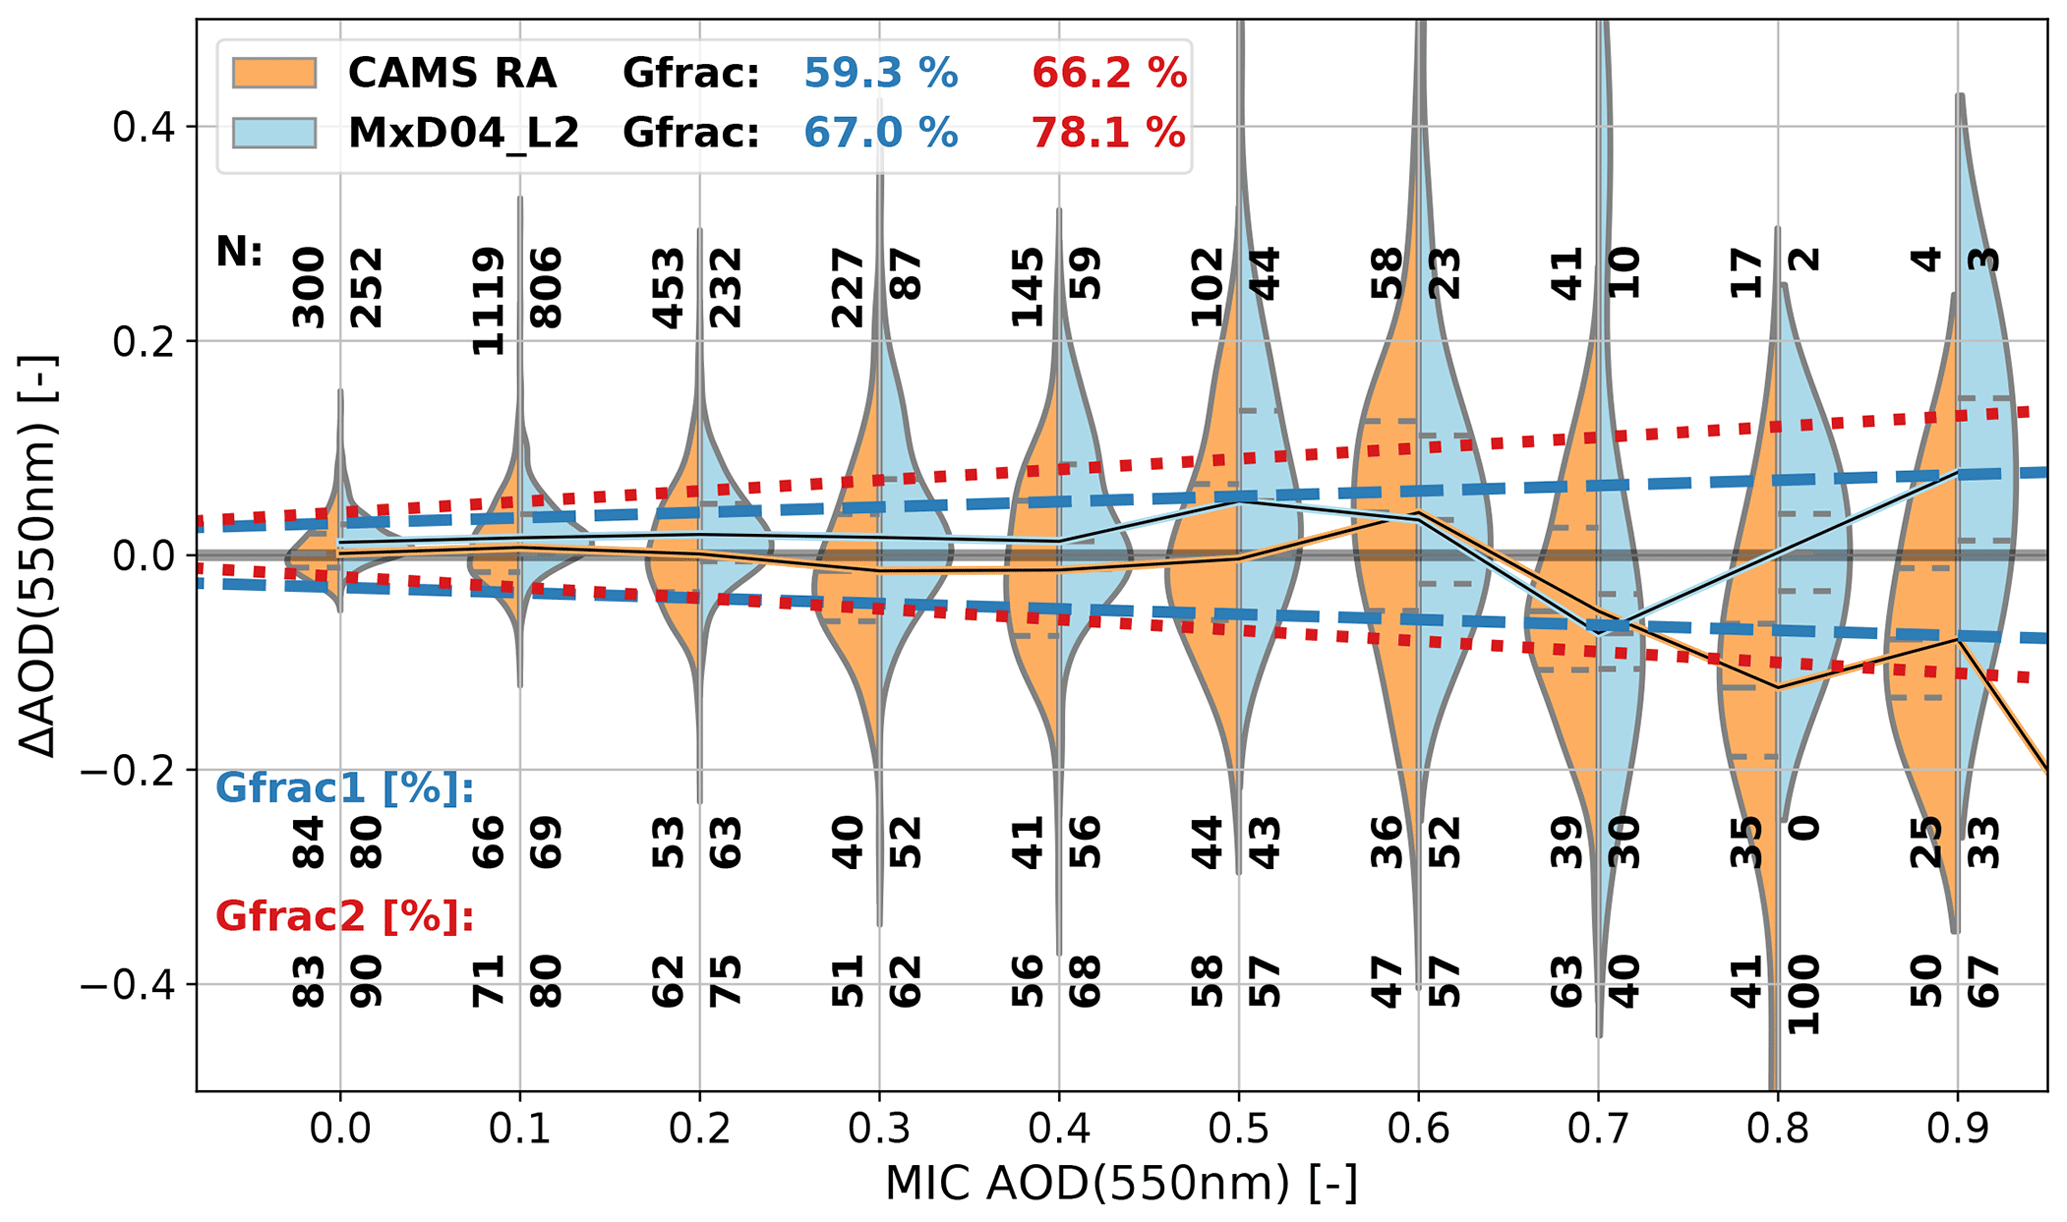
Figure 10Same as Fig. 4 but comparing CAMS RA and MODIS MxD04_L2 AOD to MIC AOD as reference.
In comparison to MIC as a reference dataset, Table 5 shows that CAMS RA AOD agrees closely to MIC, since the correlation is 0.92 and the bias is about zero. The LOA of ±0.13 is similar to the one found for the products of SEVIRI and MODIS compared to MIC, with values ranging from ±0.12 to ±0.15. The CAMS RA outperforms the SEVIRI aerosol dataset in all presented statistical measures at least slightly (e.g. a correlation of 0.88 versus 0.92 or LOA of 0.13 versus 0.15). Further, the bias of AOD and its dependency on AOD is reduced for the CAMS RA product, as it shows low bias values for both low and high AOD values. This is expected since the MODIS AOD bias must be corrected before assimilation into the reanalysis product. This effect is clearly shown in Fig. 10, together with a tendency of CAMS RA towards an underestimation of AOD for larger values of AOD. For maritime aerosol, CAMS RA AOD has the lowest correlation (0.7). The values of LOA are lowest for maritime, which is expected since this measure favours lower AOD and maritime aerosol situations are generally connected to low AOD values. A slight overestimation of 0.01 is shown by the bias considering only maritime aerosol situations, which is lower than the bias found for the MODIS products. For desert dust conditions, the correlation of CAMS RA to MIC (0.85) is similar to the one found for MxD04_L2 (0.87) in Table 5, although the correlation of MxD04_3K is largest with 0.92. As for maritime aerosol, the overestimation of AOD is compensated in the CAMS RA aerosol product. This emphasizes that the CAMS RA aerosol product is comparable in accuracy to the MODIS products in maritime and desert dust situations.
In terms of assimilated aerosol observations, data from MODIS and AATSR are used by the IFS for CAMS RA starting from the year 2003 to March 2012, when the Envisat mission ended due to loss of contact to the satellite. After March 2012, only the MODIS AOD is used (Inness et al., 2019). Table 5 shows the evaluation of CAMS RA versus MIC for the different time periods to investigate potential differences in quality. Without AATSR, MODIS is the only contributor for data assimilation in terms of AOD. Comparing the results of CAMS RA with and without AATSR, the performance of CAMS RA with additional AATSR data is increased, indicated by increased correlation from 0.87 to 0.90 and lower LOA, dropping from 0.18 to 0.14. This shows that the AATSR observations lead to an improvement of the representation of aerosol in CAMS RA. Inness et al. (2019) suspected a slight increase of CAMS RA AOD without AATSR, which cannot be observed in this study. As the analysis presented here is based on a limited number of data points, it is unclear whether these findings are statistically significant, and the discussed tendencies should be considered with caution.
Inness et al. (2019) reported an overestimation of AE in CAMS RA compared to AERONET stations of about 5 %–20 %. From the comparison to MIC presented in Fig. 6f, the same conclusion can be drawn based on our dataset, showing a positive bias of 0.17. Compared to MODIS, similar values are found for Gfrac, but while the MODIS AE scatters more equally around the reference AE, CAMS RA AE is clearly distributed above zero. Also, the AE difference of CAMS RA and MIC shows a increased linear dependency indicated by increased correlation R(D). This indicates that, similar to the SEVIRI product, certain aerosol models are favoured in the processing. Nevertheless, the overall scatter of AE indicated by the values of LOA is lower for CAMS RA.
As stated by Inness et al. (2019), the overestimation of AE results from a deficit in the handling of the coarse dust fraction in the model. The total AOD calculated in CAMS RA is composed of less dust than in its predecessor versions, which explains the higher overall AE. Nevertheless, the comparison of CAMS RA AE with respect to aerosol type in Fig. 11 reveals that the AE for desert dust agrees best with the MIC reference, compared to the satellite products. The slightly better representation compared even to MODIS indicates that the representation of the spectral dependence of AOD for dust is most realistic in CAMS RA. For maritime aerosol, CAMS RA AE shows a similar overestimation compared to the satellite products but with less scatter. This emphasizes a more consistent representation of maritime aerosol in CAMS RA as compared to satellite products. The CAMS RA AE representation versus MIC in Fig. 8 shows a close agreement for all aerosol types, except an overestimation of AE in maritime conditions, and a tendency for overestimation during dust conditions with low AOD. In general, the AE and AOD of CAMS RA are similar to or in some instances even exceed the accuracy of the satellite retrievals including MODIS in comparison to the reference data presented in this study.
Within this paper, a comprehensive evaluation of MODIS and SEVIRI AOD products as well as the representation of AOD in the CAMS reanalysis has been presented with shipborne reference datasets. For this purpose, available Microtops observations from MAN across the Atlantic Ocean were utilized and complemented by a unique set of shipborne aerosol products collected during five Atlantic transit cruises of RV Polarstern with the multi-spectral GUVis-3511 shadowband radiometer.
Three separate aspects have been investigated within the study:
(i) First, the two shipborne datasets were intercompared to verify their consistency. Extending the comparison presented in Witthuhn et al. (2017), the AOD derived from the GUVis and Microtops instruments from five cruises with RV Polarstern were compared. A substantial update of the GUVis processing algorithm is shown to address several shortcomings identified in the prior version. To improve upon the lamp-based instrumental calibration of the GUVis, the method of Alexandrov et al. (2002) has been applied to obtain a cross calibration based on the MIC observations. In addition, an underestimation of AOD by the GUVis instrument compared to the MIC has been observed, which is related to strong forward scattering by aerosol, and arises from the broad shadowband and the much wider effective field of view, compared to the MIC observations (Russell, 2004). Combining the cross calibration with an empirical correction following the approach of di Sarra et al. (2015) and Wood et al. (2017), a correlation >0.992 is found for all spectral channels. The uncertainty estimate of ±0.02 for the GUVis AOD is shown to be valid after applying these two corrections.
Compared to the manually operated Microtops instrument, an important advantage of the GUVis dataset is its high temporal resolution as well as the uniformity of sampling. These automated shipborne measurements lead to a larger collocated dataset for satellite evaluation, which in turn leads to more robust evaluation statistics. They also offer the chance to conduct such observations on more cruises, as they greatly reduce the amount of effort to operate the instrument.
(ii) Second, the shipborne datasets have been utilized to evaluate the MODIS MxD04 and SEVIRI AOD products. The satellite products differ in temporal and spatial resolution as well as in number of spectral channels available from the satellite instruments. The AOD has been compared at 550 nm (used in previous validation studies) and at 630 nm, the latter being a native channel of the SEVIRI instrument, enabling a consistent and fair evaluation of the aerosol products from both satellite sensors. For non-native channels, interpolation of AOD based on the AE using the Ångström relation has been used. The AODs at these two wavelengths have been compared with collocated Microtops measurements and show similar agreement, although the comparison to SEVIRI AOD shows larger scatter (about 25 %) and therefore less correlation than the one to MODIS. Also it was shown that the bias of SEVIRI AOD is dependent on the AOD, as the bias for AOD < 0.4 is larger than that for the MODIS product, and the bias for AOD ≥ 0.4 turns negative (underestimation).
Previous evaluation studies of the MODIS aerosol products have utilized the EE limits at 550 nm (defined as spanning at least 67 % of the data) of ) (EE1) (e.g. Abdou et al., 2005; Remer et al., 2008; Livingston et al., 2014) and [] (EE2) by Levy et al. (2013) over the ocean. The EE1 limits are missed slightly by the 67 % criterion, while the EE2 limits are confirmed by this study. The EE2 limits account for a general overestimation of AOD by the MODIS satellite products of about 0.02, which is close to the value of 0.03 found here. The SEVIRI aerosol product also meets the EE2 limits for the interpolated AOD at 550 nm.
Since SEVIRI has channels only at wavelengths of 630 and 810 nm, which lie relatively close together, the accuracy for calculating the AE is significantly degraded. The representation of the spectral dependence of AOD therefore is superior in the MODIS products, due to the large set of available spectral channels, combined with the mature set of aerosol models used in the retrievals. This manifests itself in a consistent accuracy of AOD for all available spectral channels utilizing the AE for the MODIS product, which is not the case for SEVIRI.
Evaluating the satellite products with a focus on aerosol type reveals that the main challenge arises from the identification of realistic aerosol models for use in the retrieval (for both MODIS and SEVIRI) and from the limited number of spectral channels (for SEVIRI). Therefore, the AOD and AE from the SEVIRI product should not be used to extrapolate the AOD to wavelengths outside the available spectral channel range. Given the large number of channels, the MODIS AOD at non-native wavelengths is significantly more accurate than that of the SEVIRI product but still relies on the underlying aerosol model, which can introduce uncertainties depending on aerosol conditions. In particular, the AE calculated from satellites during aerosol conditions dominated by mineral dust aerosol shows values which are 2 times (MODIS) and 3 times (SEVIRI) larger than the AE from shipborne products.
Our results confirm that satellite products can provide a global view of the spatiotemporal aerosol distribution, e.g for climate studies or model assimilation, as long as their error limits are properly taken into account, and spectral extrapolation of products is avoided. This finding is consistent with results of former validation studies for the MODIS instrument (e.g. Munchak et al., 2013; Levy et al., 2013; Livingston et al., 2014). The quality of MODIS products is continuously monitored over land by comparison with products from worldwide AERONET stations.
In most situations, temporal variations of AOD within a window of 6 h are smaller than the uncertainty limits of the satellite products. Hence, the better time resolution of SEVIRI and other geostationary satellite sensors offers minor benefits for climatological studies compared to the use of polar-orbiting satellite platforms, given its increased uncertainties. The SEVIRI AOD product provides valuable information on the temporal evolution of AOD when the aerosol changes rapidly. Specific cases with high temporal variability are dust storms, plumes of volcanic ash, or the passing of frontal systems.
(iii) Finally, the aerosol fields obtained from the CAMS RA have been evaluated versus collocated Microtops measurements. The performance of CAMS RA is rather close to that of the MODIS product. The differences of MODIS and CAMS RA arise mainly from the model handling of different aerosol types: while an overestimation of AOD observed for MODIS for maritime and desert dust aerosol is compensated in CAMS RA, the overall consistency of MODIS AOD exceeds CAMS RA AOD, indicated by larger correlation of MODIS AOD to the reference datasets.
Finally, it has to be noted that the evaluation presented here is still based on a relatively small set of collocated shipborne and satellite observations. For more meaningful results, a significantly larger shipborne dataset would be desirable.
Ground-based and shipborne observations will continue to play an important role for monitoring and investigating aerosols at a global scale. Applications range from the evaluation and monitoring of satellite products to independent studies targeting radiative closure and aerosol processes, which cannot be resolved by satellite datasets. Shipborne observations of aerosol optical properties with the Microtops Sun photometer will continue within MAN and will be complemented by the GUVis shadowband radiometer on future OCEANET cruises. The GUVis measures direct and diffuse irradiance simultaneously. It is thus well suited to extend the aerosol products by additional parameters such as single scattering albedo and asymmetry parameter utilizing the diffuse-to-direct ratio as outlined by Herman et al. (1975) and applied in a number of previous studies (e.g. Petters et al., 2003; Kassianov et al., 2007). It also offers the chance to evaluate the direct radiative effect of aerosol, and these observations could contribute towards improving climatological estimates of the aerosol radiative effect (e.g. Kinne, 2019).
Current efforts are also directed to operate state-of-the-art Cimel Sun photometers on shipborne platforms (Yin et al., 2019). While the automatic operation of those instruments on a moving platform still poses a significant challenge, the high accuracy offered by Sun photometers combined with recent advances in navigation and alignment sensors make this a promising approach for the future. Fully automated Cimel Sun photometer observations on ships including the capability of sky scans will open up the full potential of the well-developed AERONET aerosol products for studies over the ocean. Nevertheless, the shadowband principle used by the GUVis instrument is less complex and thus might contribute in parallel towards improved data availability of aerosol observations over the ocean.
Alongside these ongoing efforts in shipborne observations, a number of promising new satellite missions will be launched within the next few years collocated with an imager and radar, whose validation will increase the demand for reliable reference datasets.
(i) With the launch of MTG operated by EUMETSAT, SEVIRI on MSG will be replaced by the Flexible Combined Imager. This will lead to observations with an increased spatial resolution comparable to that of MODIS but with the benefits of the geostationary satellite perspective (in particular in terms of temporal resolution). The set of available spectral channels will also increase, including channels at 440 and 510 nm wavelengths. Since the AOD retrieved at SEVIRI's native spectral channels already has been shown to have satisfactory accuracy here, the availability of MTG observations should increase the accuracy of aerosol products to the level of MODIS, including significant improvements in aerosol model selection and AE calculation within the retrievals. The high temporal resolution of MTG will thus provide novel information on the spatiotemporal distribution of aerosols with MODIS-like accuracy, which will be valuable for studies targeting air quality or aerosol transport. These data are also expected to be useful for data assimilation into CAMS RA and can provide information on temporal changes beyond the current time resolution of CAMS RA.
(ii) The Earth Cloud Aerosol and Radiation Explorer (EarthCARE) satellite will be launched by the European Space Agency (ESA) in 2022. This polar-orbiting satellite mission utilizes a combination of instruments including the Multi-Spectral Imager (MSI) spectral radiometer system, which utilize spectral channels in the visible and near-infrared regions similar to the SEVIRI instrument. In addition, the atmospheric lidar (ATLID) will provide vertical profiles of extinction at 355 nm, and thereby reveal new information on the vertical distribution of aerosols and thin clouds. The combination of both instruments on a single satellite and the use of a high-spectral-resolution lidar enabling direct observations of the aerosol extinction at 355 nm is a unique feature and will benefit scientific studies targeting aerosols including their radiative effects. The synergy of the MSI and ATLID instruments will open up new opportunities for the retrieval and classification of aerosol properties and will provide new insights on the vertical distribution of aerosol optical properties. Based on our findings, it seems particularly important to combine MSI and ATLID information to constrain the spectral dependence of aerosol properties, due to the limitations reported here arising for the SEVIRI wavelengths.
(iii) Following on from the EUMETSAT Polar System programme (MetOp), the second generation of European polar-orbiting spacecraft (EPS-SG) will continue the meteorological observations in the morning orbit from 2022 onward. The Multi-Viewing Multi-Channel Multi-Polarisation Imaging (3MI) instrument aboard this mission utilizes 12 spectral channels from 410 to 2130 nm and with a nadir resolution of 4 km. Together with information on light polarization, these observations will provide unique observations for the estimation and characterization of aerosol optical properties at a global scale.
With all these upcoming satellite observations, the consistency of the different aerosol products will become an important aspect for future analyses, in particular with respect to aerosol type. Reliable ground-based reference datasets will continue to play an important role for their evaluation and for reconciling the unavoidable discrepancies between datasets.
In this appendix, the improvements of the GUVis processing algorithm of the shadowband sweep irradiance data are described.
The processing of the sweep time series of the GUVis instrument is required to extract the global, direct, and diffuse components from the measured spectral irradiance components. As described in detail in Witthuhn et al. (2017), the accurate estimation of the blocked diffuse irradiance while the direct Sun is also blocked by the shadowband (i.e. the shadow of the band falls onto the detector) during the sweep is a fundamental challenge which has to be solved by the processing algorithm. Figures A1 and A2 illustrate an idealized and a measured shadowband sweep together with the processing algorithm. Between shadowband sweeps, the band is stowed in a parking position out of sight of the hemispheric field of view of the sensor, so the global irradiance (Fglo) is observed by the radiometer (periods a and g in the figures). The amount of blocked diffuse irradiance can be directly inferred from the sweep data while the sensor is not shaded from direct sunlight by the band, by considering the reduction in measured irradiance (periods b and f in the figures). While the Sun is partially or completely blocked by the band due to the shadow falling onto the sensor (periods c to e in the figures), the reduction of the irradiance recorded by the shadowband compared to the global irradiance consists of both the blocked direct irradiance component (Fdir) and a blocked fraction of the diffuse irradiance (Fdif,b). It is necessary to separate both parts in order to be able to calculate Fdir. The relation of the irradiance components is as follows:
with Fdif being the diffuse irradiance component which is partially blocked by the shadowband during the sweep, and can be separated into a blocked (Fdif,d) and a non-blocked part contributing to the observations (Fdif,o):
As Fdif,b cannot be inferred directly from the measurement, it is estimated by linear extrapolation of the measured irradiance data during the sweep while the Sun is not blocked by the shadowband (periods b and f). As the 30 samples before and after the shadow of the band transitions across the sensor are used, accurate knowledge of the time when the shadow starts to shade the sensor is required (termed the point of contact from here on). The identification of the point of contact is accomplished in our processing algorithm by considering the slope of the measured irradiance data using empirical thresholds. It has to be realized that the change of slope before and after reaching the points of contact (thus at the transition from b to c) depends strongly on the present atmospheric situation, shape of the circumsolar radiation, and shadowband geometry. In particular, this change is not as sharp as indicated by Fig. A1 but shows a smooth transition as is visible in Fig. A2.
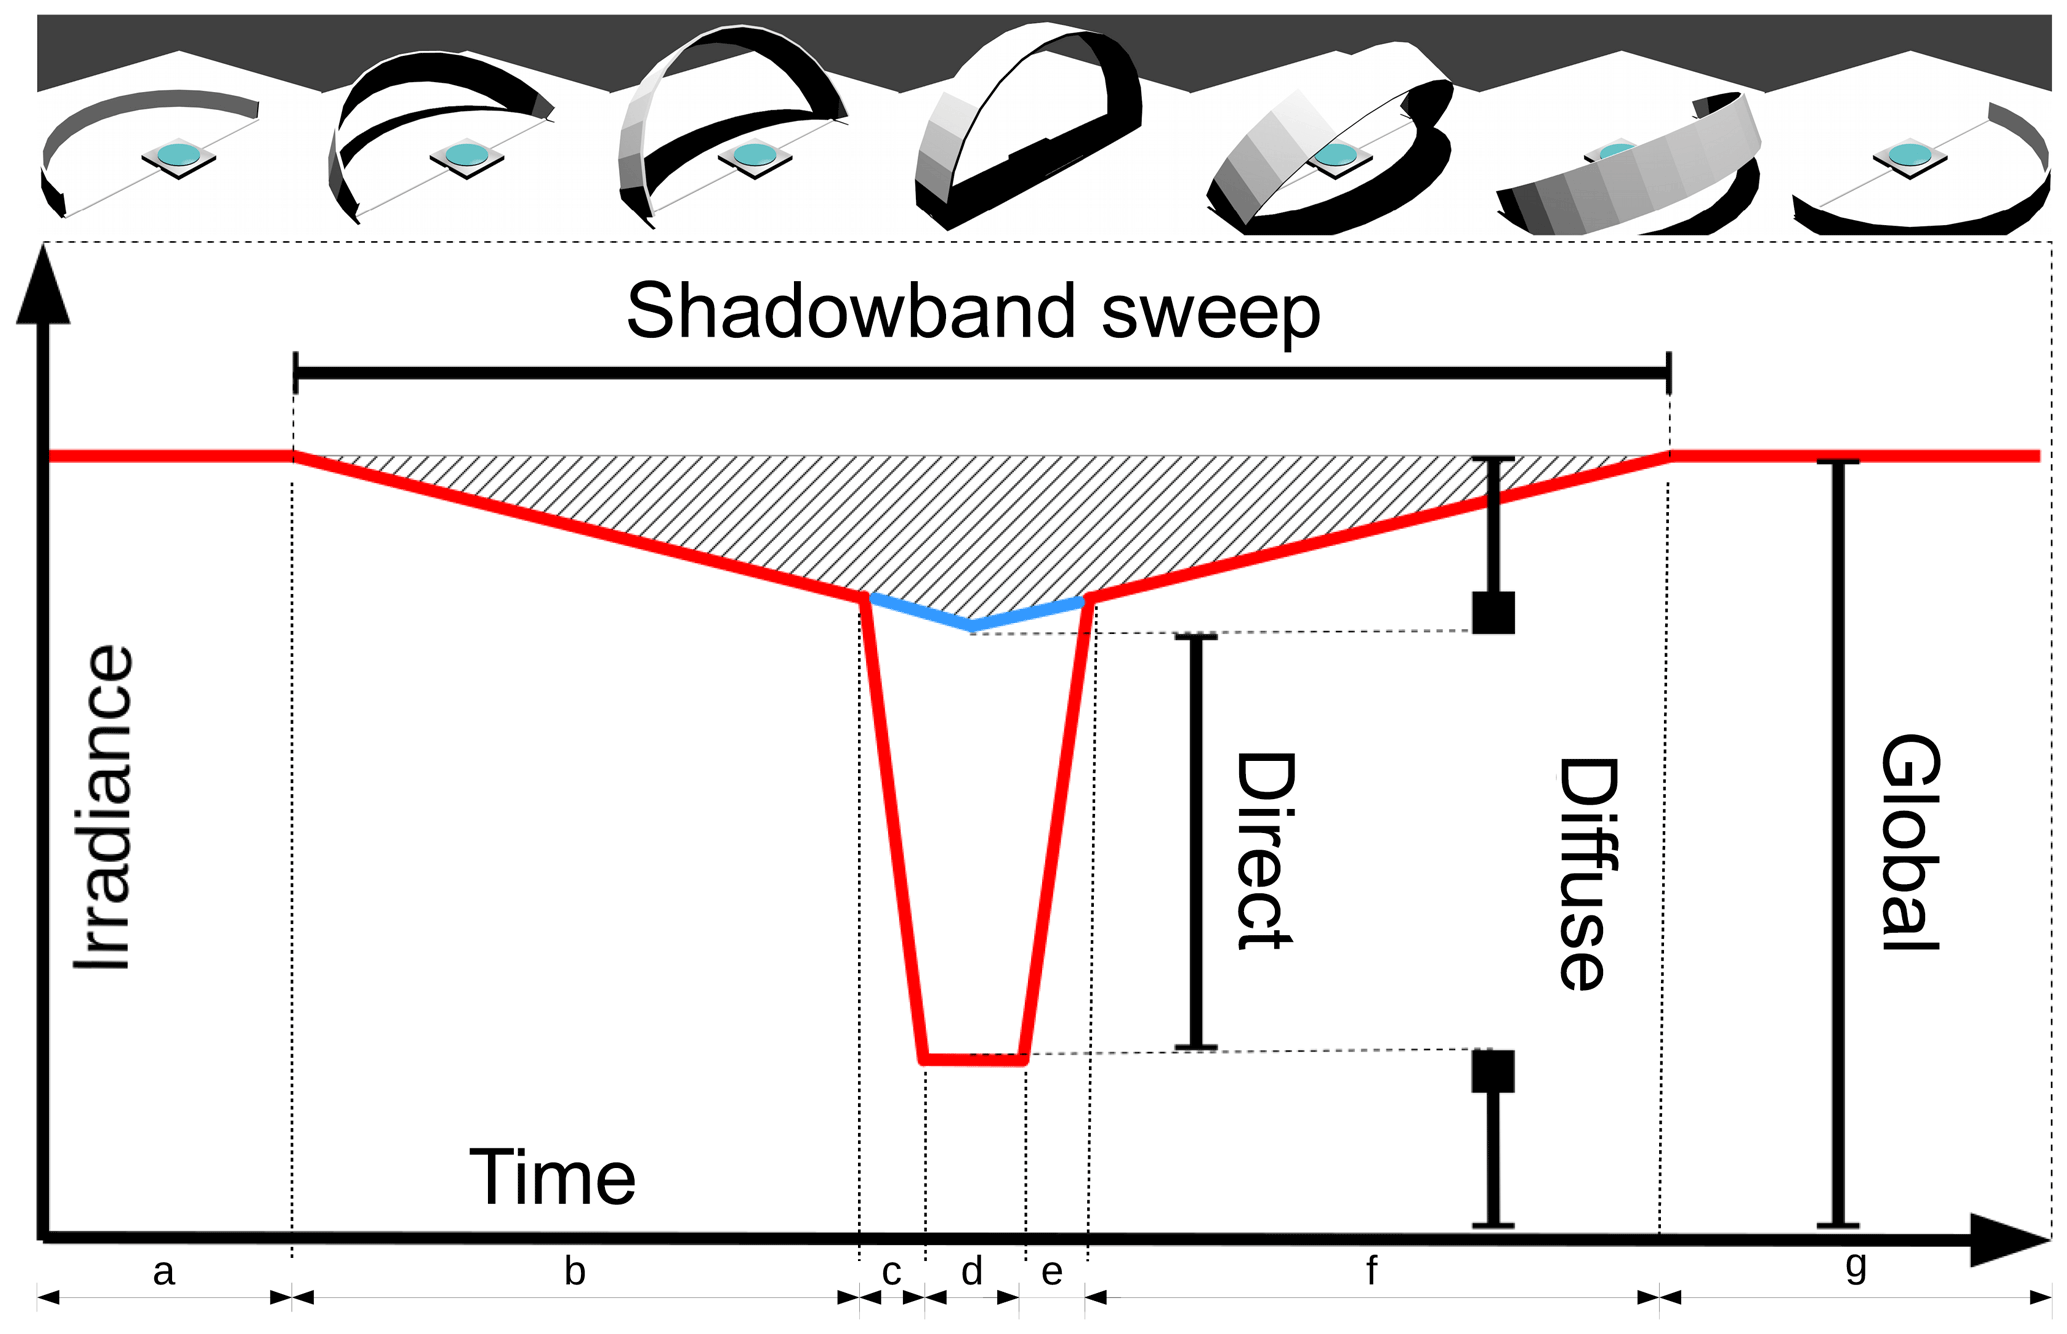
Figure A1Schematic illustration of a shadowband sweep measured by the GUVis shadowband radiometer. The red line indicates the measured irradiance. The figures on top illustrate the shadowband position relative to the sensor during the sweep. The hatched area indicates the diffuse irradiance blocked from the sensor during the sweep. The blue line indicates the unknown blocked diffuse irradiance when the direct irradiance is at least partially blocked by the shadowband. It has to be estimated by the processing algorithm in order to accurately estimate the direct irradiance. The letters a–g indicate different periods during the sweep as follows: (a, g) the shadowband is in parking position, out of sight of the hemispheric field of view of the sensor; the measured irradiance corresponds to the global irradiance. (b, f) The shadowband is moving, but the direct irradiance of the Sun is not blocked from the sensor. (c, e) The direct irradiance is partially blocked by the shadowband as the band shades the sensor. (d) The direct irradiance is completely blocked by the shadowband.
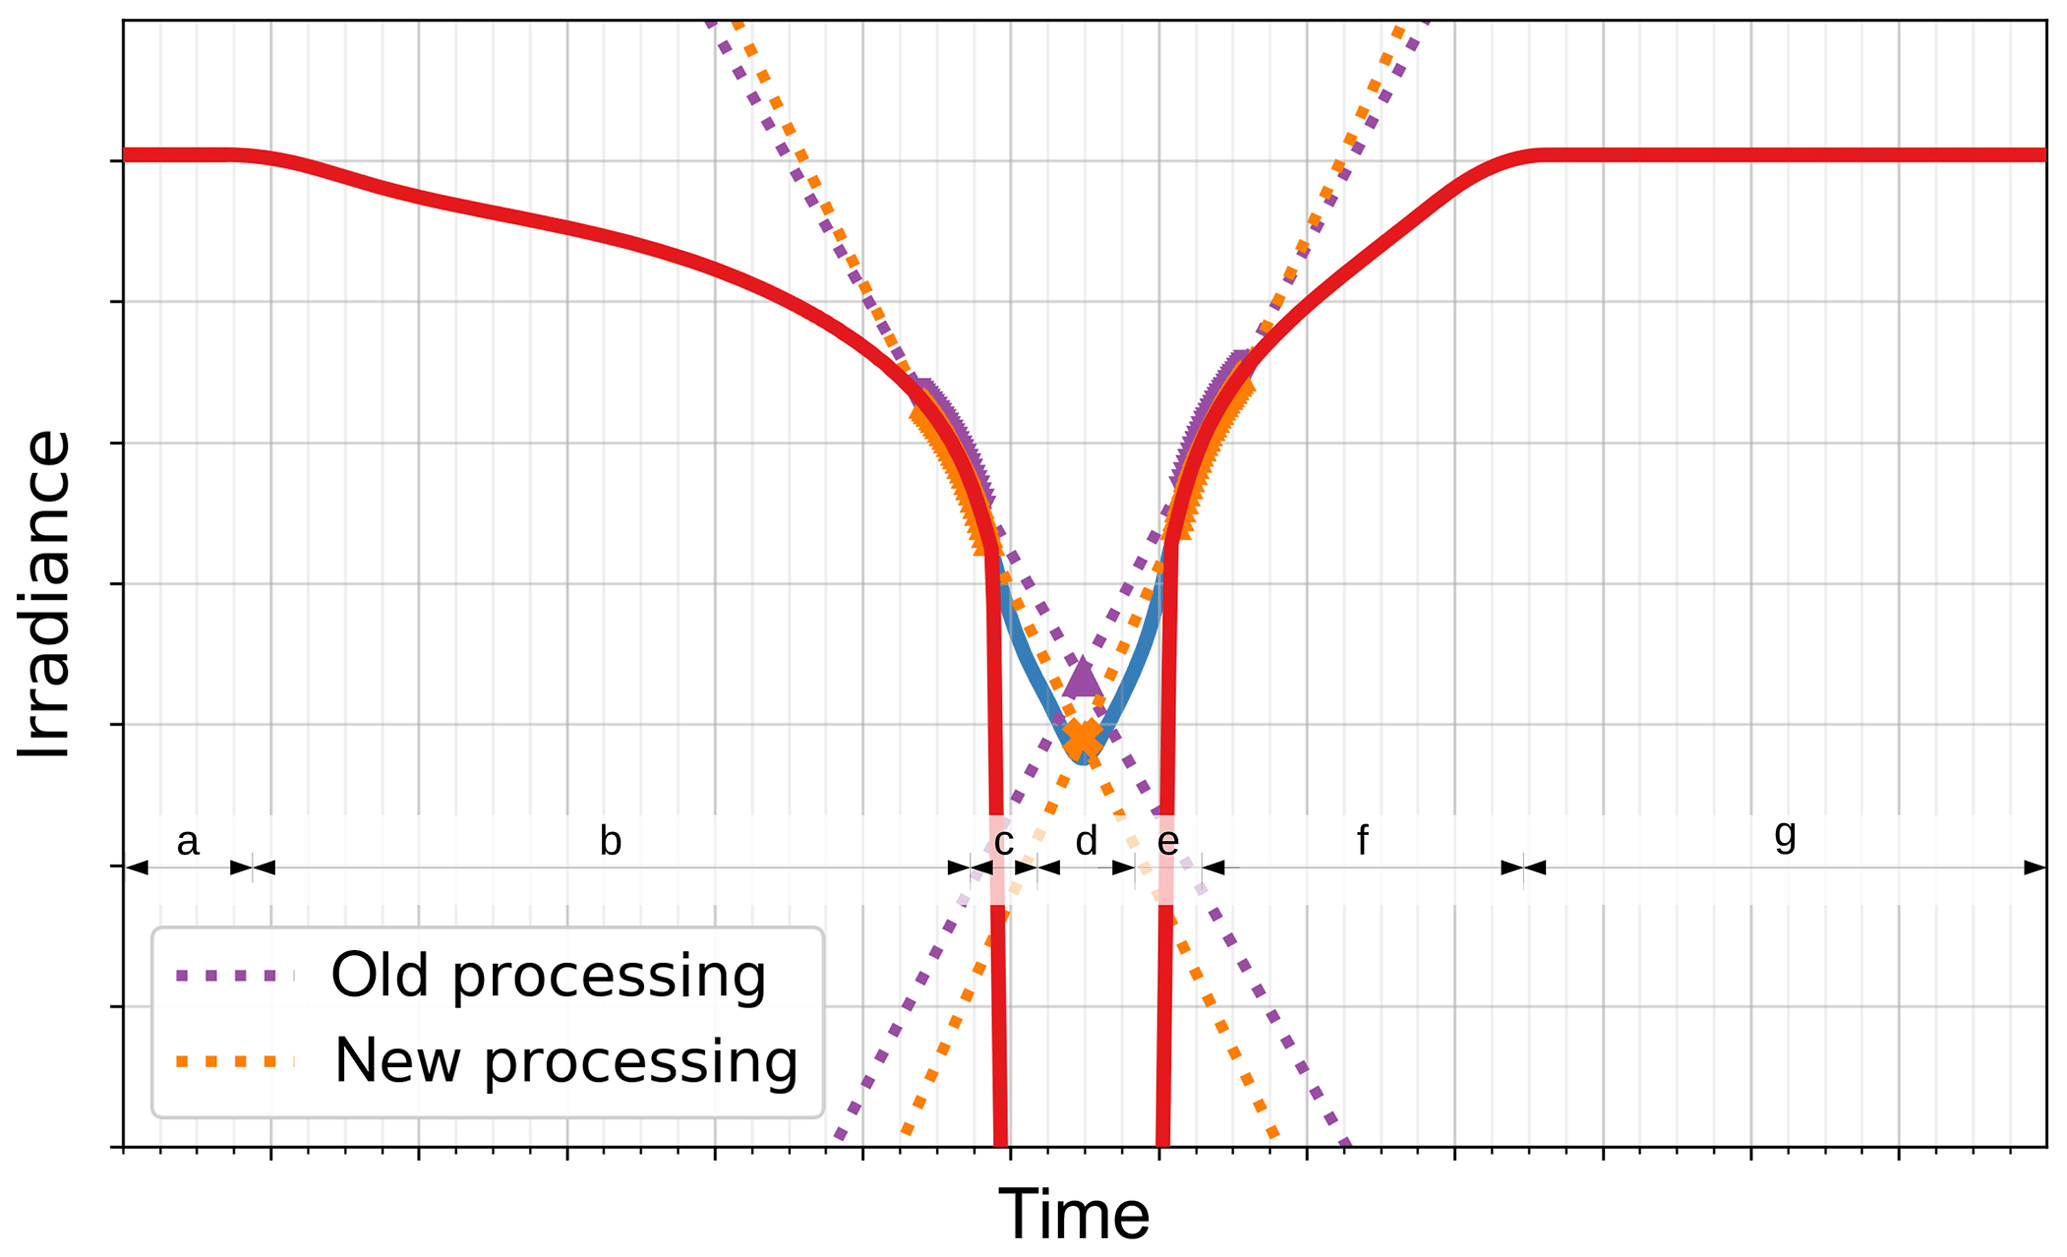
Figure A2Like Fig. A1 but with a measured irradiance time series (red line) of a shadowband sweep. The blue line indicates the unknown amount of blocked diffuse irradiance, which has to be estimated by the processing algorithm. The dotted lines indicate the extrapolation lines of the old (purple) and new (orange) processing algorithms to estimate the blocked diffuse irradiance.
The GUVis processing algorithm has received a substantial update compared to the version introduced in Witthuhn et al. (2017) to address several shortcomings. The following improvements were made:
(i) The identification of the point of contact is done by considering the slope of the measured irradiance during the complete shadowband sweep. Since the measured irradiance drops sharply once the sensor is partially shaded by the shadowband, a threshold can be used for the slope to identify the point of contact. This threshold was chosen by using a constant absolute value in the old processing, which sometimes resulted in an inconsistent identification of the point of contact, in particular during low Sun or high AOD situations. In the revised processing, a relative threshold is used, which is calculated relative to the difference of measured global irradiance and the minimum measured irradiance of the sweep. This leads to a more reliable identification of the point of contact, as well as less scatter of the irradiance components of successive sweeps and during the daily cycle.
(ii) The measured irradiance during one sweep sometimes contains high-frequency variations of the irradiance, e.g. caused by small clouds or the smoke plume of the ship. Affected sweeps are identified by a pre-processing filter and excluded from further processing. The pre-processing filter is applied by calculating the variance for the selected interpolation data (30 data points before and after the points of contact). The variance is compared to an fixed threshold value of 0.0022. In the old processing, if the threshold was exceeded either using the data before or after the points of contact, the sweep was dropped completely. For the updated processing algorithm, if the threshold is exceeded, the data point with the largest deviation is removed from the interpolation. Data points are removed either until the variance criterion is met and the processing continues, or the number of data points used for interpolation is less than 21, in which case the sweep is excluded. (iii) As mentioned before, the BioSHADE accessory for the GUVis utilizes a broad shadowband with a shading angle of about 15∘. The shading angle is comparable to the field of view of a Sun photometer, which has a field of view of about 2.5∘ for the Microtops instrument (Porter et al., 2001). Comparing AOD based on the GUVis and Microtops, the difference in the field of view will lead to an underestimation of AOD retrieved with the GUVis, as has been reported also for the MFRSR in a comparison to the AERONET Sun photometer in the study of di Sarra et al. (2015). The underestimation is attributable to the forward-scattering contribution of aerosol scattering as investigated by Russell (2004). The underestimation of AOD is substantial for large shadowband shading angles and especially large for aerosol particles with strong forward scattering (e.g. desert dust) (Ge et al., 2011). To at least partly compensate for this effect, an offset has been introduced in the linear extrapolation of the blocked diffuse irradiance. The offset depends on the slope of the interpolation data before and after the points of contact, which is steeper during stronger forward-scattering aerosol situations. The offset is calculated from the difference of the irradiance at the point of contact and the extrapolated irradiance using the interpolation data at the time of the point of contact. Therefore, the offset is larger during strong forward-scattering aerosol situations, since the increase in forward scattering leads to a steeper drop before the point of contact. Thus, the offset compensates for the underestimation of AOD due to aerosol forward scattering.
The datasets from all instruments used in this study are publicly available. GUVis data of spectral irradiance and AOD are available from the Pangaea database (https://doi.org/10.1594/PANGAEA.910535; Witthuhn et al., 2020). Microtops data are available on the MAN AERONET website (https://aeronet.gsfc.nasa.gov/new_web/maritime_aerosol_network.html, last access: 6 March 2020). MODIS aerosol products called Effective_Optical_Depth_Average_Ocean are available through the Level-1 and Atmosphere Archive & Distribution System (LAADS) Distributed Active Archive Center (DAAC) (https://ladsweb.modaps.eosdis.nasa.gov, last access: 6 March 2020). The SEVIRI aerosol products are available from the ICARE Data and Services Center (http://www.icare.univ-lille1.fr, last access: 6 March 2020). CAMS RA data can be acquired from the ECMWF public dataset catalogue (https://apps.ecmwf.int/datasets, last access: 6 March 2020).
JW developed and implemented processing scheme and conducted AOD calculation from the GUVis-3511 shadowband radiometer. JW calculated the evaluation statistics and prepared the manuscript. AH and HD contributed expertise about satellite remote sensing, provided helpful advice on the work and paper, and contributed to writing the manuscript.
The authors declare that they have no conflict of interest.
We thank Stefan Kinne and Alexander Smirnov for their effort in maintaining and organizing Microtops observations on RV Polarstern, as well as all scientists operating the Microtops during the cruises.
Thanks are also due to the Alfred Wegener Institute for Polar and Marine Research (AWI) for the opportunity to operate the GUVis instrument during the PS83, PS95, PS98, PS102, and PS113 research cruises across the Atlantic Ocean on RV Polarstern.
We thank the ICARE Data and Services Center for providing access to the data used in this study.
The MODIS Terra and MODIS Aqua aerosol 5 min L2 swath 10 km and 3K swath 3 km datasets (Levy and Hsu, 2015a, b) were acquired from the Level-2 and Atmosphere Archive and Distribution System (LAADS) Distributed Active Archive Center (DAAC), located in the Goddard Space Flight Center in Greenbelt, Maryland (https://ladsweb.nascom.nasa.gov/, last access: 6 March 2020).
This paper contains modified Copernicus Atmosphere Monitoring Service information (2019); neither the European Commission nor ECMWF is responsible for any use that may be made of the information it contains.
We thank the reviewers for the detailed comments and thoughtful suggestions to improve the manuscript. The work presented in this paper has been partially conducted within the scope of the research project MetPVNet funded by the German Federal Ministry for Economic Affairs and Energy (BMWi).
The work has partially been funded by German Federal Ministry for Economic Affairs and Energy (BMWi) (grant no. 0350009E).
This paper was edited by Alexander Kokhanovsky and reviewed by Stefan Kinne and three anonymous referees.
Abdou, W. A., Diner, D. J., Martonchik, J. V., Bruegge, C. J., Kahn, R. A., Gaitley, B. J., Crean, K. A., Remer, L. A., and Holben, B.: Comparison of coincident Multiangle Imaging Spectroradiometer and Moderate Resolution Imaging Spectroradiometer aerosol optical depths over land and ocean scenes containing Aerosol Robotic Network sites, J. Geophys. Res.-Atmos., 110, D10S07, https://doi.org/10.1029/2004JD004693, 2005. a, b, c, d
Adames, A. F., Reynolds, M., Smirnov, A., Covert, D. S., and Ackerman, T. P.: Comparison of Moderate Resolution Imaging Spectroradiometer ocean aerosol retrievals with ship-based Sun photometer measurements from the Around the Americas expedition, J. Geophys. Res., 116, D16303, https://doi.org/10.1029/2010jd015440, 2011. a
AERIS/ICARE Data and Services Center: ICARE Product Catalogue, available at: http://www.icare.univ-lille1.fr, last access: 6 March 2020.
Alexandrov, M. D., Lacis, A. A., Carlson, B. E., and Cairns, B.: Remote Sensing of Atmospheric Aerosols and Trace Gases by Means of Multifilter Rotating Shadowband Radiometer. Part I: Retrieval Algorithm, J. Atmos. Sci., 59, 524–543, https://doi.org/10.1175/1520-0469(2002)059<0524:rsoaaa>2.0.co;2, 2002. a, b, c, d, e
Anderson, J. C., Wang, J., Zeng, J., Petrenko, M., Leptoukh, G. G., and Ichoku, C.: Accuracy assessment of Aqua-MODIS aerosol optical depth over coastal regions: importance of quality flag and sea surface wind speed, Atmos. Meas. Tech. Discuss., 5, 5205–5243, https://doi.org/10.5194/amtd-5-5205-2012, 2012. a, b
Bellouin, N., Boucher, O., Haywood, J., and Reddy, M. S.: Global estimate of aerosol direct radiative forcing from satellite measurements, Nature Sci., 438, 1138–1141, https://doi.org/10.1038/nature04348, 2005. a
Bernard, E., Moulin, C., Ramon, D., Jolivet, D., Riedi, J., and Nicolas, J.-M.: Description and validation of an AOT product over land at the 0.6 µm channel of the SEVIRI sensor onboard MSG, Atmos. Meas. Tech., 4, 2543–2565, https://doi.org/10.5194/amt-4-2543-2011, 2011. a
Bland, J. M. and Altman, D.: Statistical methods for assessing agreement between two methods of clinical measurement, Lancet, 327, 307–310, https://doi.org/10.1016/S0140-6736(86)90837-8 (originally published as Volume 1, Issue 8476), 1986. a
Boers, R., Mitchell, R. M., and Krummel, P. B.: Correction of aircraft pyranometer measurements for diffuse radiance and alignment errors, J. Geophys. Res.-Atmos., 103, 16753–16758, https://doi.org/10.1029/98jd01431, 1998. a
Boucher, O., Randall, D., Artaxo, P., Bretherton, C., Feingold, G., Forster, P., Kerminen, V.-M., Kondo, Y., Liao, H., Lohmann, U., Rasch, P., Satheesh, S., Sherwood, S., Stevens, B., and Zhang, X.: The Physical Science Basis. Contribution of Working Group I to the Fifth Assessment Report of the Intergovernmental Panel on Climate Change, in: Climate Change 2013, edited by: Stocker, T., Qin, D., Plattner, G.-K., Tignor, M., Allen, S., Boschung, J., Nauels, A., Xia, Y., Bex, V., and Midgley, P., chap. 7, Clouds and Aerosols, Cambridge University Press, available at: https://archive.ipcc.ch/pdf/assessment-report/ar5/wg1/WG1AR5_Chapter07_FINAL.pdf (last access: 6 March 2020), 2013. a
Brando, V., Lovell, J., King, E., Boadle, D., Scott, R., and Schroeder, T.: The Potential of Autonomous Ship-Borne Hyperspectral Radiometers for the Validation of Ocean Color Radiometry Data, Remote Sens., 8, 150, https://doi.org/10.3390/rs8020150, 2016. a
Bréon, F.-M., Vermeulen, A., and Descloitres, J.: An evaluation of satellite aerosol products against sunphotometer measurements, Remote Sens. Environ., 115, 3102–3111, https://doi.org/10.1016/j.rse.2011.06.017, 2011. a, b, c, d, e, f, g
Chen, L., Shi, G., Qin, S., Yang, S., and Zhang, P.: Direct radiative forcing of anthropogenic aerosols over oceans from satellite observations, Adv. Atmos. Sci., 28, 973–984, https://doi.org/10.1007/s00376-010-9210-4, 2011. a
Christopher, S. A. and Jones, T.: Satellite-based assessment of cloud-free net radiative effect of dust aerosols over the Atlantic Ocean, Geophys. Res. Lett., 34, l02810, https://doi.org/10.1029/2006GL027783, 2007. a
Chu, D. A.: Validation of MODIS aerosol optical depth retrieval over land, Geophys. Res. Lett., 29, MOD2-1–MOD2-4, https://doi.org/10.1029/2001gl013205, 2002. a
di Sarra, A., Sferlazzo, D., Meloni, D., Anello, F., Bommarito, C., Corradini, S., Silvestri, L. D., Iorio, T. D., Monteleone, F., Pace, G., Piacentino, S., and Pugnaghi, S.: Empirical correction of multifilter rotating shadowband radiometer (MFRSR) aerosol optical depths for the aerosol forward scattering and development of a long-term integrated MFRSR-Cimel dataset at Lampedusa, Appl. Optics, 54, 2725, https://doi.org/10.1364/ao.54.002725, 2015. a, b, c, d, e, f, g
Distributed Active Archive Center: Level-1 and Atmosphere Archive & Distribution System, available at: https://ladsweb.modaps.eosdis.nasa.gov, last access: 6 March 2020.
Dubovik, O., Sinyuk, A., Lapyonok, T., Holben, B. N., Mishchenko, M., Yang, P., Eck, T. F., Volten, H., Muñoz, O., Veihelmann, B., van der Zande, W. J., Leon, J.-F., Sorokin, M., and Slutsker, I.: Application of spheroid models to account for aerosol particle nonsphericity in remote sensing of desert dust, J. Geophys. Res.-Atmos., 111, d11208, https://doi.org/10.1029/2005JD006619, 2006. a
European Centre for Medium-Range Weather Forecasts: ECMWF Public Datasets, available at: https://apps.ecmwf.int/datasets, last access: 6 March 2020.
Ge, J. M., Su, J., Fu, Q., Ackerman, T. P., and Huang, J. P.: Dust aerosol forward scattering effects on ground-based aerosol optical depth retrievals, J. Quant. Spectrosc. Ra., 112, 310–319, https://doi.org/10.1016/j.jqsrt.2010.07.006, 2011. a
Goddard Space Flight Center: AERONET Maritime Aerosol Network data, available at: https://aeronet.gsfc.nasa.gov/new_web/maritime_aerosol_network.html, last access: 6 March 2020.
Haywood, J. M., Ramaswamy, V., and Soden, B. J.: Tropospheric Aerosol Climate Forcing in Clear-Sky Satellite Observations over the Oceans, Science, 283, 1299–1303, https://doi.org/10.1126/science.283.5406.1299, 1999. a
Herman, B. M., Browning, R. S., and Luisi, J. J. D.: Determination of the Effective Imaginary Term of the Complex Refractive Index of Atmospheric Dust by Remote Sensing: The Diffuse–Direct Radiation Method, J. Atmos. Sci., 32, 918–925, https://doi.org/10.1175/1520-0469(1975)032<0918:DOTEIT>2.0.CO;2, 1975. a
Ichoku, C.: A spatio-temporal approach for global validation and analysis of MODIS aerosol products, Geophys. Res. Lett., 29, MOD1-1–MOD1-4, https://doi.org/10.1029/2001gl013206, 2002. a
Inness, A., Ades, M., Agustí-Panareda, A., Barré, J., Benedictow, A., Blechschmidt, A.-M., Dominguez, J. J., Engelen, R., Eskes, H., Flemming, J., Huijnen, V., Jones, L., Kipling, Z., Massart, S., Parrington, M., Peuch, V.-H., Razinger, M., Remy, S., Schulz, M., and Suttie, M.: The CAMS reanalysis of atmospheric composition, Atmos. Chem. Phys., 19, 3515–3556, https://doi.org/10.5194/acp-19-3515-2019, 2019. a, b, c, d, e, f, g, h, i, j
Kahn, R. A.: Reducing the Uncertainties in Direct Aerosol Radiative Forcing, Surv. Geophys., 33, 701–721, https://doi.org/10.1007/s10712-011-9153-z, 2012. a
Kassianov, E. I., Flynn, C. J., Ackerman, T. P., and Barnard, J. C.: Aerosol single-scattering albedo and asymmetry parameter from MFRSR observations during the ARM Aerosol IOP 2003, Atmos. Chem. Phys., 7, 3341–3351, https://doi.org/10.5194/acp-7-3341-2007, 2007. a
Kharol, S. K., Badarinath, K. V. S., Kaskaoutis, D. G., Sharma, A. R., and Gharai, B.: Influence of continental advection on aerosol characteristics over Bay of Bengal (BoB) in winter: results from W-ICARB cruise experiment, Ann. Geophys., 29, 1423–1438, https://doi.org/10.5194/angeo-29-1423-2011, 2011. a
Kinne, S.: Aerosol radiative effects with MACv2, Atmos. Chem. Phys., 19, 10919–10959, https://doi.org/10.5194/acp-19-10919-2019, 2019. a
Kleidman, R. G., O'Neill, N. T., Remer, L. A., Kaufman, Y. J., Eck, T. F., Tanré, D., Dubovik, O., and Holben, B. N.: Comparison of Moderate Resolution Imaging Spectroradiometer (MODIS) and Aerosol Robotic Network (AERONET) remote-sensing retrievals of aerosol fine mode fraction over ocean, J. Geophys. Res., 110, D22205, https://doi.org/10.1029/2005jd005760, 2005. a, b
Knobelspiesse, K., Tan, Q., Bruegge, C., Cairns, B., Chowdhary, J., van Diedenhoven, B., Diner, D., Ferrare, R., van Harten, G., Jovanovic, V., Ottaviani, M., Redemann, J., Seidel, F., and Sinclair, K.: Intercomparison of airborne multi-angle polarimeter observations from the Polarimeter Definition Experiment, Appl. Optics, 58, 650–669, https://doi.org/10.1364/ao.58.000650, 2019. a
Levy, R. and Hsu, C.: MODIS Atmosphere L2 Aerosol Product (Aqua). NASA MODIS Adaptive Processing System, Goddard Space Flight Center, USA, https://doi.org/10.5067/MODIS/MYD04_L2.006, 2015a. a, b, c, d, e
Levy, R. and Hsu, C.: MODIS Atmosphere L2 Aerosol Product (Terra). NASA MODIS Adaptive Processing System, Goddard Space Flight Center, USA, https://doi.org/10.5067/MODIS/MOD04_L2.006, 2015b. a, b, c, d, e
Levy, R. C., Remer, L. A., Kleidman, R. G., Mattoo, S., Ichoku, C., Kahn, R., and Eck, T. F.: Global evaluation of the Collection 5 MODIS dark-target aerosol products over land, Atmos. Chem. Phys., 10, 10399–10420, https://doi.org/10.5194/acp-10-10399-2010, 2010. a, b, c, d
Levy, R. C., Mattoo, S., Munchak, L. A., Remer, L. A., Sayer, A. M., Patadia, F., and Hsu, N. C.: The Collection 6 MODIS aerosol products over land and ocean, Atmos. Meas. Tech., 6, 2989–3034, https://doi.org/10.5194/amt-6-2989-2013, 2013. a, b, c, d, e, f, g, h, i, j, k, l
Livingston, J. M., Redemann, J., Shinozuka, Y., Johnson, R., Russell, P. B., Zhang, Q., Mattoo, S., Remer, L., Levy, R., Munchak, L., and Ramachandran, S.: Comparison of MODIS 3 km and 10 km resolution aerosol optical depth retrievals over land with airborne sunphotometer measurements during ARCTAS summer 2008, Atmos. Chem. Phys., 14, 2015–2038, https://doi.org/10.5194/acp-14-2015-2014, 2014. a, b, c, d
Loeb, N. G. and Manalo-Smith, N.: Top-of-Atmosphere Direct Radiative Effect of Aerosols over Global Oceans from Merged CERES and MODIS Observations, J. Climate, 18, 3506–3526, https://doi.org/10.1175/JCLI3504.1, 2005. a
Macke, A. (Ed.): The expedition of the research vessel “Polarstern” to the Antarctic in 2008 (ANT-XXIV/4), Berichte zur Polar- und Meeresforschung (Reports on Polar and Marine Research), vol. 591, p. 64, Alfred Wegener Institute for Polar and Marine Research, Bremerhaven, hdl:10013/epic.32648.d001, 2009. a, b
Mishchenko, M. I., Hovenier, J. W., and Travis, L. D.: Light Scattering by Nonspherical Particles – Theory, Measurements, and Applications, Academic Press, Amsterdam, Boston, https://doi.org/10.1088/0957-0233/11/12/705, 1999. a
Misra, A.: Validation of Version 5.1 MODIS Aerosol Optical Depth (Deep Blue Algorithm and Dark Target Approach) over a Semi-Arid Location in Western India, Aerosol Air Qual. Res., https://doi.org/10.4209/aaqr.2014.01.0004, 2015. a
Munchak, L. A., Levy, R. C., Mattoo, S., Remer, L. A., Holben, B. N., Schafer, J. S., Hostetler, C. A., and Ferrare, R. A.: MODIS 3 km aerosol product: applications over land in an urban/suburban region, Atmos. Meas. Tech., 6, 1747–1759, https://doi.org/10.5194/amt-6-1747-2013, 2013. a, b, c
Myhre, G., Bellouin, N., Berglen, T. F., Berentsen, T. K., Boucher, O., Grini, A., Isaken, I. S. A., Johnsrud, M., Mishchenko, M. I., Stordal, F., and Tanré, D.: Comparison of the radiative properties and direct radiative effect of aerosols from a global aerosol model and remote sensing data over ocean, Tellus B, 59, 115–129, https://doi.org/10.1111/j.1600-0889.2006.00226.x, 2007. a
Nabat, P., Somot, S., Mallet, M., Michou, M., Sevault, F., Driouech, F., Meloni, D., di Sarra, A., Di Biagio, C., Formenti, P., Sicard, M., Léon, J.-F., and Bouin, M.-N.: Dust aerosol radiative effects during summer 2012 simulated with a coupled regional aerosol–atmosphere–ocean model over the Mediterranean, Atmos. Chem. Phys., 15, 3303–3326, https://doi.org/10.5194/acp-15-3303-2015, 2015. a
Petters, J. L., Saxena, V. K., Slusser, J. R., Wenny, B. N., and Madronich, S.: Aerosol single scattering albedo retrieved from measurements of surface UV irradiance and a radiative transfer model, J. Geophys. Res., 108, 4288, https://doi.org/10.1029/2002jd002360, 2003. a
Popp, T., de Leeuw, G., Bingen, C., Brühl, C., Capelle, V., Chedin, A., Clarisse, L., Dubovik, O., Grainger, R., Griesfeller, J., Heckel, A., Kinne, S., Klüser, L., Kosmale, M., Kolmonen, P., Lelli, L., Litvinov, P., Mei, L., North, P., Pinnock, S., Povey, A., Robert, C., Schulz, M., Sogacheva, L., Stebel, K., Zweers, D. S., Thomas, G., Tilstra, L., Vandenbussche, S., Veefkind, P., Vountas, M., and Xue, Y.: Development, Production and Evaluation of Aerosol Climate Data Records from European Satellite Observations (Aerosol_cci), Remote Sens., 8, 421, https://doi.org/10.3390/rs8050421, 2016. a
Porter, J. N., Miller, M., Pietras, C., and Motell, C.: Ship-Based Sun Photometer Measurements Using Microtops Sun Photometers, J. Atmos. Ocean. Tech., 18, 765–774, https://doi.org/10.1175/1520-0426(2001)018<0765:SBSPMU>2.0.CO;2, 2001. a, b
Remer, L. A., Kaufman, Y. J., Tanré, D., Mattoo, S., Chu, D. A., Martins, J. V., Li, R.-R., Ichoku, C., Levy, R. C., Kleidman, R. G., Eck, T. F., Vermote, E., and Holben, B. N.: The MODIS Aerosol Algorithm, Products, and Validation, J. Atmos. Sci., 62, 947–973, https://doi.org/10.1175/JAS3385.1, 2005. a
Remer, L. A., Kleidman, R. G., Levy, R. C., Kaufman, Y. J., Tanré, D., Mattoo, S., Martins, J. V., Ichoku, C., Koren, I., Yu, H., and Holben, B. N.: Global aerosol climatology from the MODIS satellite sensors, J. Geophys. Res.-Atmos., 113, d14S07, https://doi.org/10.1029/2007JD009661, 2008. a, b
Remer, L. A., Mattoo, S., Levy, R. C., and Munchak, L. A.: MODIS 3 km aerosol product: algorithm and global perspective, Atmos. Meas. Tech., 6, 1829–1844, https://doi.org/10.5194/amt-6-1829-2013, 2013. a, b
Russell, P. B.: Sunlight transmission through desert dust and marine aerosols: Diffuse light corrections to Sun photometry and pyrheliometry, J. Geophys. Res., 109, D08207, https://doi.org/10.1029/2003jd004292, 2004. a, b, c, d
Schutgens, N. A. J., Nakata, M., and Nakajima, T.: Validation and empirical correction of MODIS AOT and AE over ocean, Atmos. Meas. Tech., 6, 2455–2475, https://doi.org/10.5194/amt-6-2455-2013, 2013. a
Shettle, E. P. and Fenn, R. W.: Models for the aerosols of the lower atmosphere and the effects of humidity variations on their optical properties, Tech. rep., Environmental Research Paper Air Force Geophysics Lab., Hanscom AFB, MA. Optical Physics Div., 1979. a, b
Shi, Y., Zhang, J., Reid, J. S., Holben, B., Hyer, E. J., and Curtis, C.: An analysis of the collection 5 MODIS over-ocean aerosol optical depth product for its implication in aerosol assimilation, Atmos. Chem. Phys., 11, 557–565, https://doi.org/10.5194/acp-11-557-2011, 2011. a, b
Smirnov, A., Holben, B. N., Slutsker, I., Giles, D. M., McClain, C. R., Eck, T. F., Sakerin, S. M., Macke, A., Croot, P., Zibordi, G., Quinn, P. K., Sciare, J., Kinne, S., Harvey, M., Smyth, T. J., Piketh, S., Zielinski, T., Proshutinsky, A., Goes, J. I., Nelson, N. B., Larouche, P., Radionov, V. F., Goloub, P., Krishna Moorthy, K., Matarrese, R., Robertson, E. J., and Jourdin, F.: Maritime Aerosol Network as a component of Aerosol Robotic Network, J. Geophys. Res.-Atmos., 114, D06204, https://doi.org/10.1029/2008JD011257, 2009. a, b, c
Smirnov, A., Holben, B. N., Giles, D. M., Slutsker, I., O'Neill, N. T., Eck, T. F., Macke, A., Croot, P., Courcoux, Y., Sakerin, S. M., Smyth, T. J., Zielinski, T., Zibordi, G., Goes, J. I., Harvey, M. J., Quinn, P. K., Nelson, N. B., Radionov, V. F., Duarte, C. M., Losno, R., Sciare, J., Voss, K. J., Kinne, S., Nalli, N. R., Joseph, E., Krishna Moorthy, K., Covert, D. S., Gulev, S. K., Milinevsky, G., Larouche, P., Belanger, S., Horne, E., Chin, M., Remer, L. A., Kahn, R. A., Reid, J. S., Schulz, M., Heald, C. L., Zhang, J., Lapina, K., Kleidman, R. G., Griesfeller, J., Gaitley, B. J., Tan, Q., and Diehl, T. L.: Maritime aerosol network as a component of AERONET – first results and comparison with global aerosol models and satellite retrievals, Atmos. Meas. Tech., 4, 583–597, https://doi.org/10.5194/amt-4-583-2011, 2011. a
Tegen, I.: Modeling the mineral dust aerosol cycle in the climate system, Quaternary Sci. Rev., 22, 1821–1834, https://doi.org/10.1016/S0277-3791(03)00163-X, 2003. a
Thieuleux, F., Moulin, C., Bréon, F. M., Maignan, F., Poitou, J., and Tanré, D.: Remote sensing of aerosols over the oceans using MSG/SEVIRI imagery, Ann. Geophys., 23, 3561–3568, https://doi.org/10.5194/angeo-23-3561-2005, 2005. a, b, c, d
Toledano, C., Cachorro, V. E., Berjon, A., de Frutos, A. M., Sorribas, M., de la Morena, B. A., and Goloub, P.: Aerosol optical depth and Ångström exponent climatology at El Arenosillo AERONET site (Huelva, Spain), Q. J. Roy. Meteor. Soc., 133, 795–807, https://doi.org/10.1002/qj.54, 2007. a, b, c, d, e
Wei, J., Li, Z., Peng, Y., and Sun, L.: MODIS Collection 6.1 aerosol optical depth products over land and ocean: validation and comparison, Atmos. Environ., 201, 428–440, https://doi.org/10.1016/j.atmosenv.2018.12.004, 2019. a, b
Witthuhn, J., Deneke, H., Macke, A., and Bernhard, G.: Algorithms and uncertainties for the determination of multispectral irradiance components and aerosol optical depth from a shipborne rotating shadowband radiometer, Atmos. Meas. Tech., 10, 709–730, https://doi.org/10.5194/amt-10-709-2017, 2017. a, b, c, d, e, f, g, h, i, j, k, l, m, n, o
Witthuhn, J., Deneke, H., and Macke, A.: Shipborne rotating shadowband radiometer data of spectral irradiance components and aerosol optical depth during Polarstern cruises PS83, PS95, PS98, PS102 and PS113, PANGAEA, https://doi.org/10.1594/PANGAEA.910535, 2020. a
Wood, J., Smyth, T. J., and Estellés, V.: Autonomous marine hyperspectral radiometers for determining solar irradiances and aerosol optical properties, Atmos. Meas. Tech., 10, 1723–1737, https://doi.org/10.5194/amt-10-1723-2017, 2017 a, b, c, d
Yin, Z., Ansmann, A., Baars, H., Seifert, P., Engelmann, R., Radenz, M., Jimenez, C., Herzog, A., Ohneiser, K., Hanbuch, K., Blarel, L., Goloub, P., Dubois, G., Victori, S., and Maupin, F.: Aerosol measurements with a shipborne Sun–sky–lunar photometer and collocated multiwavelength Raman polarization lidar over the Atlantic Ocean, Atmos. Meas. Tech., 12, 5685–5698, https://doi.org/10.5194/amt-12-5685-2019, 2019. a
Yu, H., Kaufman, Y. J., Chin, M., Feingold, G., Remer, L. A., Anderson, T. L., Balkanski, Y., Bellouin, N., Boucher, O., Christopher, S., DeCola, P., Kahn, R., Koch, D., Loeb, N., Reddy, M. S., Schulz, M., Takemura, T., and Zhou, M.: A review of measurement-based assessments of the aerosol direct radiative effect and forcing, Atmos. Chem. Phys., 6, 613–666, https://doi.org/10.5194/acp-6-613-2006, 2006. a