the Creative Commons Attribution 4.0 License.
the Creative Commons Attribution 4.0 License.
 | 30 Mar 2020
Shipborne MAX-DOAS measurements for validation of TROPOMI NO2 products
Ping Wang
Ankie Piters
Jos van Geffen
Olaf Tuinder
Piet Stammes
Stefan Kinne
Tropospheric NO2 and stratospheric NO2 vertical column densities are important TROPOspheric Monitoring Instrument (TROPOMI) data products. In order to validate the TROPOMI NO2 products, KNMI Multi-AXis Differential Optical Absorption Spectroscopy (MAX-DOAS) instruments have measured NO2 on ship cruises over the Atlantic and the Pacific oceans. The MAX-DOAS instruments have participated in five cruises on board RV Sonne (in 2017 and 2019) and RV Maria S. Merian (in 2018). The MAX-DOAS measurements were acquired over 7 months and spanned about 90∘ in latitude and 300∘ in longitude. During the cruises aerosol measurements from Microtops sun photometers were also taken. The MAX-DOAS measured stratospheric NO2 columns between 1.5×10¹⁵ and 3.5×10¹⁵ molec cm−2 and tropospheric NO2 up to 0.6×10¹⁵ molec cm−2. The MAX-DOAS stratospheric NO2 vertical column densities have been compared with TROPOMI stratospheric NO2 vertical column densities and the stratospheric NO2 vertical column densities simulated by the global chemistry Transport Model, version 5, Massively Parallel model (TM5-MP). Good correlation is found between the MAX-DOAS and TROPOMI and TM5 stratospheric NO2 vertical column densities, with a correlation coefficient of 0.93 or larger. The TROPOMI and TM5 stratospheric NO2 vertical column densities are about 0.4×10¹⁵ molec cm−2 (19 %) higher than the MAX-DOAS measurements. The TROPOMI tropospheric NO2 also has good agreement with the MAX-DOAS measurements. The tropospheric NO2 vertical column density is as low as 0.5×10¹⁵ molec cm−2 over remote oceans.
- Article
(2604 KB) - Full-text XML
- BibTeX
- EndNote


Nitrogen dioxide (NO2) and nitrogen oxide (NO) – usually referred to as nitrogen oxides () – are air-polluting trace gases in the troposphere. Tropospheric NO2 is mostly produced at high temperatures in combustion processes but also in soil microbial process and lightning events. In the stratosphere, NO2 is an ozone-depleting substance produced primarily from the oxidation of nitrous oxide (N2O) (Crutzen, 1970; Johnston, 1971; Seinfeld and Pandis, 2006). NOx can also suppress ozone depletion by converting reactive chlorine and hydrogen compounds into unreactive reservoir species (Murphy et al., 1993).
Stratospheric NO2 total column densities have a strong diurnal cycle that is caused by the sunlight-driven balance between NO and NO2 and is influenced by (bounded to) a total NOx amount. At night, NOx is in the form of NO2, which is oxidized by O3 to produce NO3, and NO3 is converted to N2O5 in the presence of NO2. Therefore, N2O5 is produced at night and NO2 decreases during night.
During the daytime, NO2 and NO are in a photochemical balance via the photolysis of NO2 into NO and the oxidation of NO into NO2 via ozone. Stratospheric NO2 decreases at sunrise because photodissociation brings NO2 back in balance with NO. The daytime NO2 concentrations increase gradually, which is caused by the slow increase in total NOx. The slow increase in NOx during the daytime is due to the photodissociation of N2O5. In the lower stratosphere, additional reactions involving formation of HNO3 and ClONO2 also affect the total NOx available.
Tropospheric NO2 concentrations have been derived from ultraviolet–visible backscatter satellite spectrometers such as Global Ozone Monitoring Experiment (GOME) (Burrows et al., 1999), SCanning Imaging Absorption spectroMeter for Atmospheric CHartographY (SCIAMACHY) (Bovensmann et al., 1999), Ozone Monitoring Instrument (OMI) (Levelt et al., 2006), GOME-2 (Munro et al., 2006), and Ozone Mapping and Profiler Suite (OMPS) (Yang et al., 2014). The TROPOspheric Monitoring Instrument (TROPOMI) (Veefkind et al., 2012), launched in October 2017, extends these observation records. The TROPOMI instrument has a small pixel size of 3.6 km across-track by 7.2 km along-track at nadir and provides detailed daily global NO2 images. In August 2019, TROPOMI was switched to a smaller pixel size of 3.6 km×5.6 km.
In TROPOMI tropospheric NO2 retrievals, the stratospheric NO2 has to be subtracted from the total NO2 column density. Several approaches have been developed to separate stratospheric NO2 and tropospheric NO2 (e.g. Richter and Burrows, 2002; Bucsela et al., 2006; Beirle et al., 2016). In the KNMI NO2 algorithm, the stratospheric NO2 is simulated through the assimilation of the TROPOMI NO2 slant column densities in the global chemistry Transport Model, version 5, Massively Parallel version (TM5-MP) (van Geffen et al., 2019).
Validation of TROPOMI satellite NO2 products has been done with ground-based measurements over land at different locations recently (e.g. Griffin et al., 2019; Ialongo et al., 2020; Zhao et al., 2019). Good agreement between TROPOMI and the ground-based tropospheric NO2 measurements was found. For the TROPOMI products, there is also the routine validation in the Sentinel-5P mission performance centre (http://mpc-vdaf.tropomi.eu/, last access: 23 March 2020). OMI stratospheric NO2 product has been evaluated by Belmonte-Rivas et al. (2014) and Dirksen et al. (2011). Validation of satellite-based NO2 measurements over oceans using shipborne Multi-AXis Differential Optical Absorption Spectroscopy (MAX-DOAS) measurements are not routine. Few shipborne MAX-DOAS measurements have been used for the validation of SCIAMACHY and GOME-2 trace gas products (e.g. Krueger and Quack, 2013; Peters et al., 2012; Schreier et al., 2015; Behrens et al., 2019). Peters et al. (2012) found good agreement between morning MAX-DOAS stratospheric NO2 VCDs with the SCIAMACHY and GOME-2A stratospheric NO2 VCDs. Behrens et al. (2019) reported that the GOME-2B stratospheric NO2 VCDs were similar to the morning MAX-DOAS stratospheric NO2 VCDs, while the GOME-2A values were slightly higher than the morning MAX-DOAS stratospheric NO2 VCDs. Research cruises usually follow routes that are different from those of commercial ships: these routes are mostly across remote oceans where there is little or no pollution in the troposphere. Therefore, the ship cruises provide a good opportunity for measuring background NO2 concentration.
From December 2017 to June 2019, we had four opportunities to participate in ship cruises with a MAX-DOAS instrument on board the German research vessel Sonne and one cruise on board the German research vessel Maria S. Merian. Four of the cruises were transit cruises, and therefore our measurements covered a large latitude and longitude range, thus providing measurements of latitude gradients in NO2 vertical column densities. The cruises are listed in Table 1 and shown in Fig. 1. During transit cruises, the ship usually sails continuously at about 22 km h−1 with only a few short stops for activities, such as deployment of Argo floats, while during normal campaign cruises the ship may stay stationary at one or two locations for some days. Because the ship sails over remote oceans, we mainly measured the background tropospheric NO2 and the stratospheric NO2.
Table 1List of RV Sonne (SO) and RV Maria S. Merian (MSM) cruises with MAX-DOAS measurements.
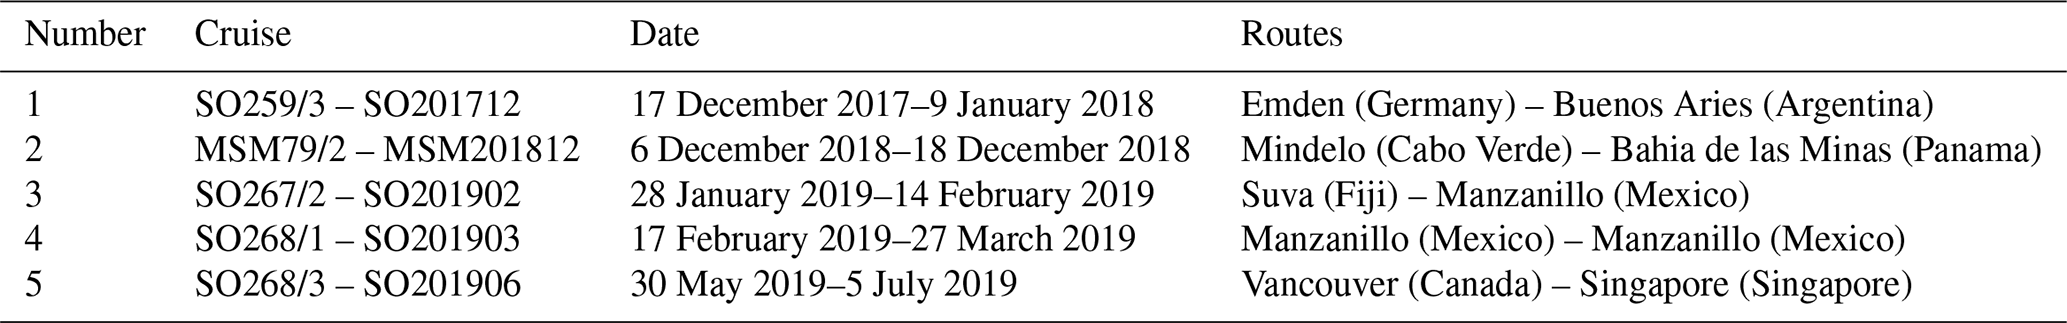
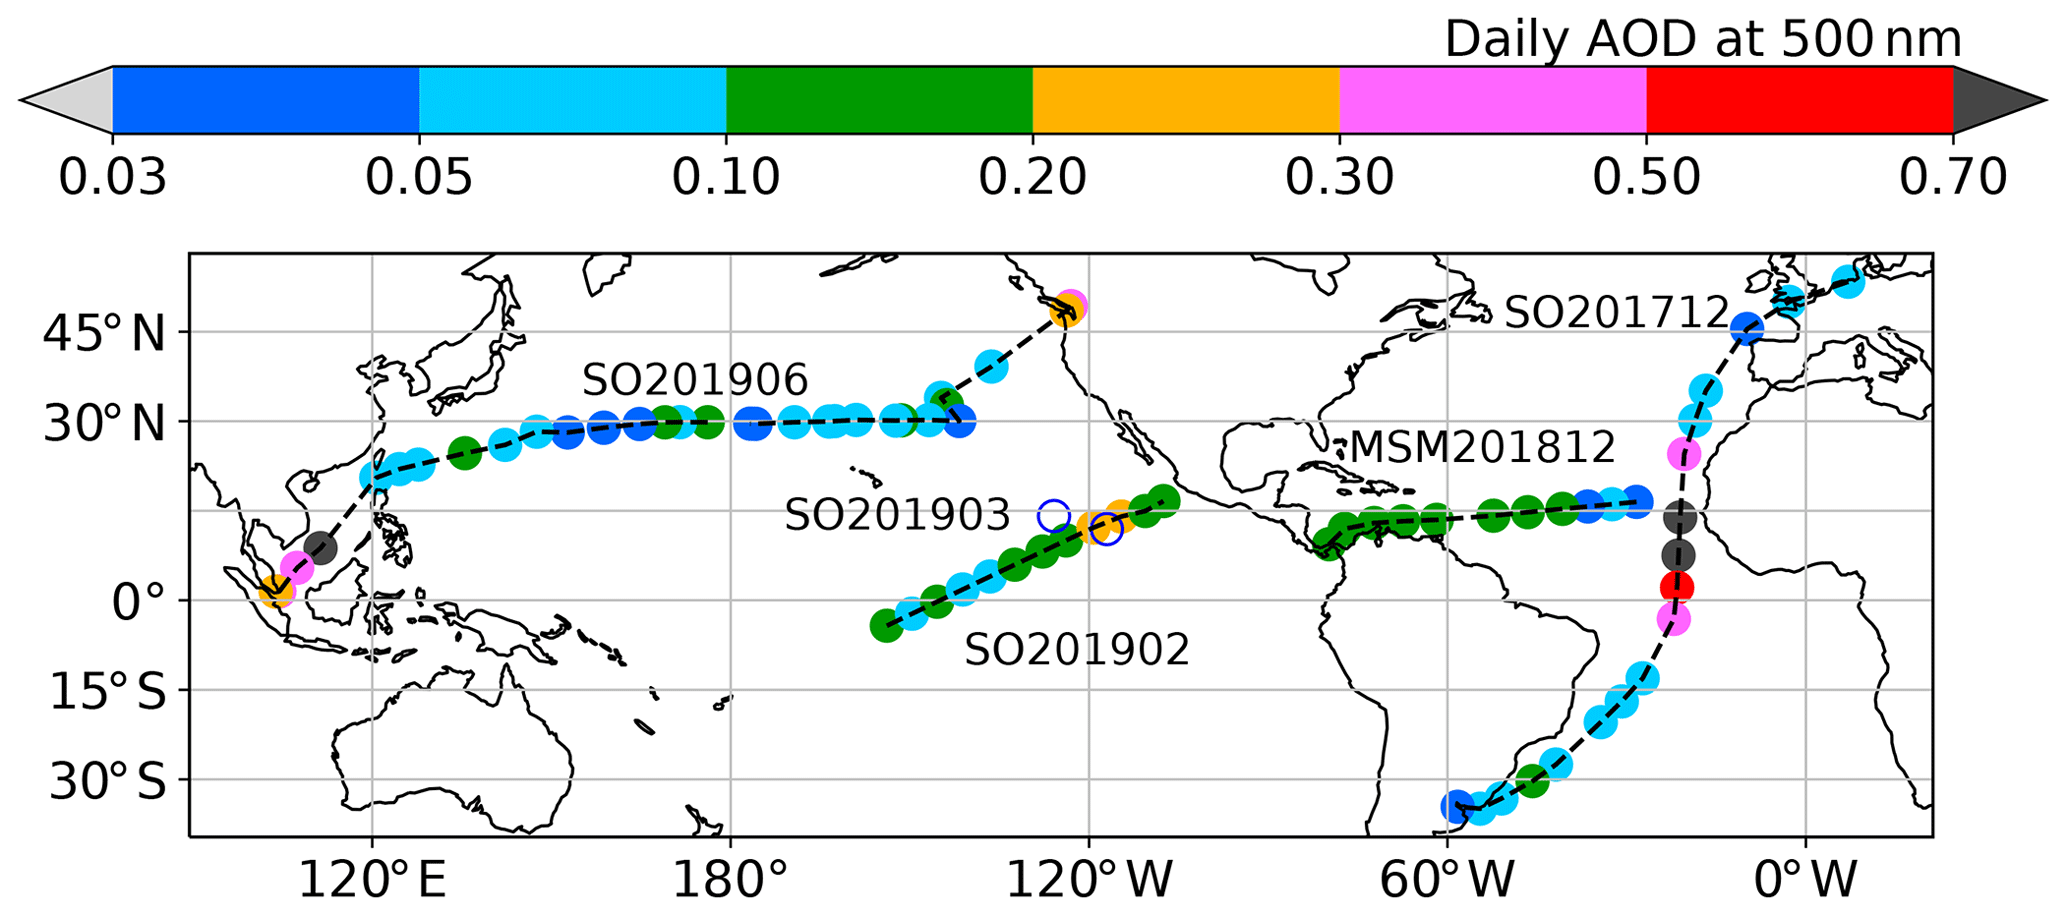
Figure 1Daily aerosol optical thickness at 500 nm (AOT) along the cruise routes. The two open circles indicate the stationary positions of RV Sonne for the cruise in March 2019 (SO201903) with no Microtops measurements.
In this paper we show the results of the MAX-DOAS measurements during the five cruises and compare the MAX-DOAS measurements with the TROPOMI measurements and TM5-MP model simulations. This paper has the following structure: Sect. 2 describes the data sets used in the paper, Sect. 3 describes the data analysis method, the results and some discussions are shown in Sect. 4, and Sect. 5 presents the conclusions.
2.1 Data from ship cruises
This section describes ship-based data sets used in this paper, i.e. the scientific data sets of the MAX-DOAS and Microtops, as well as data measured by the ship's instruments (GPS system and automatic weather station).
2.1.1 Ship cruises and weather data
The RV Sonne and RV Maria S. Merian provide extensive position and ship state data, as well as weather station data, at high time resolution during the cruises. The data sets include time, latitude, longitude, and course from the ship's GPS and heading, pitch, and roll of the ship from its compass and inertial systems. The weather data consists of absolute and relative wind speed, absolute and relative wind direction, air temperature, pressure, relative humidity, water temperature, and short-wave and long-wave radiation. Short-wave and long-wave radiation are only measured outside of the exclusive economic zones (EEZs) of the countries that the ship sailed through. The time, latitude, and longitude are important to obtain an accurate ship position and calculate the local solar zenith angle. The heading is used to calculate the viewing azimuth angle of the MAX-DOAS instruments. We downloaded the ship data at 1 min time resolution.
The ships were quite stable measurement platforms, with pitch values mainly within ±1∘ and roll values within ±2∘ during the cruises. For most of the cruises, the relative wind direction was mostly from the front of the ship. However, in cases where the relative wind direction was from the stern (back) of the ship, there was a risk that the exhaust gases of the ship's smoke stack came into the field of view of the MAX-DOAS, which could contaminate the measurement. The ship speed was usually 22 km h−1 during the transit cruises. Cruises with a oceanographic purpose had more stationary time. An example is RV Sonne cruise SO268/1 in March 2019, which was mainly stationary at two locations in the Pacific Ocean. The air temperature in the tropical regions ranged mainly between 25 and 30 ∘C. There were a few cloud-free days, but most days were partly cloudy. There were also several days with rain during the cruises.
2.1.2 MAX-DOAS data
Two similar compact Airyx MAX-DOAS instruments have been used in the cruises. One MAX-DOAS instrument was used in the cruise on board RV Sonne from December 2017 to January 2018. Another MAX-DOAS instrument was used in four cruises, the RV Maria S. Merian (MSM for short hereafter) cruise in December 2018 and three RV Sonne cruises in 2019. The compact MAX-DOAS instrument consists of an Avantes spectrometer, a scanning mirror, a computer, a web camera, and a GPS. Similar instruments have been used in the Cabauw Intercomparison of Nitrogen Dioxide Measuring Instruments 2 (CINDI2) campaign (Kreher et al., 2019).
The MAX-DOAS instrument was mounted on the railing of the observation deck of RV Sonne at the same position during the four RV Sonne cruises. During the RV Sonne cruise in December 2017 and January 2018, the instrument was pointed at 200∘ (clockwise) with respect to the ship forward direction. On the MSM, the MAX-DOAS was installed below the observation deck behind the bridge of the ship and pointed 90∘ with respect to the ship forward direction. During the RV Sonne cruises in 2019, the MAX-DOAS instrument was pointed to 180∘ to the ship forward direction. In March and June 2019, the MAX-DOAS was on the RV Sonne cruises without a KNMI scientist on board.
The MAX-DOAS performed measurements in both forward and backward directions with respect to the instrument itself. When the solar zenith angle (SZA) was smaller than 84∘, the instrument scanned at elevation angles (i.e. the viewing angle above the horizon) of 15 and 30∘ in the forward direction, 90∘ at the zenith, and 150∘ and 165∘ in the backward direction. During the RV Sonne cruises in 2019, the 8 and 172∘ elevation angles were added to the scanning series. The measurement time was about 1 min per elevation angle. The computer time was synchronized to the GPS time at the start of the measurements in the morning. The SZA was calculated by the MAX-DOAS operation software using the computer time and the position of the ship.
When the solar zenith angle was between 84 and 97∘, the MAX-DOAS performed zenith measurements (90∘ elevation angle) only. When the SZA was greater than 100∘, MAX-DOAS performed dark current and offset measurements. The dark current and offset measurements are used to check the stability of the instruments.
The temperature of the spectrometer was stabilized at 20 ∘C during the trips. The telescope has a heating unit to prevent ice but the temperature of the telescope is not stabilized. During the cruises, MAX-DOAS performed measurements automatically every day, except for the days sailing inside the EEZs. Sometimes MAX-DOAS measured the emissions from the ship itself, but these data were not used in this paper.
2.1.3 Aerosol data
Aerosol data were measured using a handheld Microtops sun photometer (Smirnov et al., 2009). The measurements were performed manually by pointing the sun photometer to the sun when there were no clouds in the viewing direction of the sun roughly every 20 min. The Microtops measures aerosol optical thickness (AOT) at five wavelengths and total water vapour column density. The Ångström coefficients are calculated from the AOTs. The data derived from the Microtops directly are called level 1 data and are sent to NASA Maritime Aerosol Network (MAN) for cloud screening and quality control. This process generates Microtops level 1.5 and level 2 data, which we downloaded from the NASA MAN website after the cruises. These Microtops data include daily time series and daily mean for AOTs, Ångström coefficients, and total water vapour column density.
The daily aerosol optical thickness time series data were used in the MAX-DOAS data analysis. For each day, the AOT time series were interpolated at the MAX-DOAS measurement time. On the days without aerosol data, an AOT of 0.05 was used in the data analysis. The Microtops daily mean AOT at 500 nm is shown in Fig. 1. During cruise SO259/3 in December 2017, the ship entered a dust plume on 25 December 2017 at 25∘ N, 20∘ W and sailed out of the dust plume on 30 December 2017 at 5∘ S, 23∘ W. In this region, the aerosol optical thickness increased from 0.05 to 0.7 on 25 December 2017. The largest AOT was about 1.5; the AOT was ≥1 for 3 d when the visibility was a few hundred metres and the ship was covered by dust. During the other cruises the AOT values were low, about 0.1 or less at 500 nm, mainly due to sea salt aerosols. The lowest AOT value was about 0.03 at 500 nm during one of the cruises.
2.2 TROPOMI data
The TROPOMI NO2 product was developed at KNMI and is generated within the TROPOMI ground segment (PDGS) operating at the German Aerospace Centre (DLR) (van Geffen et al., 2019). The TROPOMI NO2 product provides tropospheric, stratospheric, and total vertical column densities (VCDs) and their precision, as well as detailed results of, for example, NO2 slant column densities and precision air mass factors.
The KNMI TROPOMI NO2 retrieval algorithm is based on a retrieval and data assimilation system, following the approach introduced for the OMI NO2 retrievals (the DOMINO approach) (Boersma et al., 2007, 2011) and also applied for the OMI retrievals within the QA4ECV project (Boersma et al., 2018). The total NO2 slant column densities are derived using the Differential Optical Absorption Spectroscopy (DOAS) method (Platt and Stutz, 2008). The total slant column densities are then assimilated in the TM5-MP model to determine the stratospheric NO2 slant column densities. The tropospheric NO2 slant column density is the total slant column density minus the stratospheric slant column density, after which these slant column densities are converted to the tropospheric and stratospheric NO2 VCDs using appropriate air mass factors (AMFs).
The TROPOMI overpass is at about 13:30 LT. On any given day, the TROPOMI measurement closest in space and time to one of the MAX-DOAS measurements was selected as the overpass pixel. The mean and standard deviation of the 3×3 and 5×5 pixels around the overpass pixel were also determined. TROPOMI data were not available for the cruise from December 2017 to January 2018 when the instrument was still in its in-orbit test phase. Only data with a quality assurance (QA) value of >0.75 (i.e. cloud radiance fraction <0.5) were selected.
2.3 TM5-MP model data
The baseline method in the TROPOMI NO2 algorithm to separate stratospheric and tropospheric contributions to the NO2 total slant column densities is by data assimilation of slant column densities in the TM5-MP chemistry transport model (Huijnen et al., 2010; Williams et al., 2017). The TM5-MP NO2 profiles are simulated globally in 1∘ × 1∘ (latitude × longitude) grids at 35 levels from surface to about 0.01 hPa. The time interval of the output is 30 min. The TM5-MP NO2 profiles are kept in archive at KNMI. We selected the NO2 profiles along the ship tracks every day. The number of grid cells from the TM5-MP model collocated with the ship in space and time varied from 1 to 6 d−1, depending on the speed of the ship and its activities. The total, stratospheric, and tropospheric NO2 vertical column densities were integrated using the TM5-MP NO2 profiles. The tropopause level provided in the TM5-MP data was used to separate the stratospheric and tropospheric NO2 column densities. The collocated TM5-MP data are available for four cruises. There are no TROPOMI NO2 data for the first cruise, and therefore there were no TM5-MP data either.
3.1 Fitting of NO2 slant column densities
The NO2 slant column densities were retrieved with the DOAS technique (Platt and Stutz, 2008) using software developed at KNMI. The MAX-DOAS spectra were corrected for the dark current and offset measured on the same day. For some days without the dark current and offset spectra measurements, the dark current and offset spectra from nearby days were used. Wavelength calibration was performed using the measurement at the 15∘ elevation angle in every measurement series. The full width half maximum (FWHM) of the instrument spectral response function was fitted during the wavelength calibration. The FWHM is about 0.6 nm for the MAX-DOAS instruments.
For the DOAS fit we used the settings commonly used in the MAX-DOAS community (e.g. Piters et al., 2012; Kreher et al., 2019). The fitting window was 425–490 nm. For the stratospheric NO2 fit, the cross sections included were NO2 at 220 K (Vandaele et al., 1998), O3 at 223 K (Bogumil et al., 2003), water vapour (Rothman et al., 2010), O2–O2 (Hermans et al., 2001), and a Ring cross section based on a solar spectrum from Kurucz et al. (1984). For the tropospheric NO2 fit, the O3, water vapour, O2–O2, and Ring cross sections were the same as those used in the stratospheric NO2 fit, but the NO2 cross section at 298 K (Vandaele et al., 1998) and the NO2 cross section at 220 K that was made orthogonal with the 298 K cross section were used. A fifth-order polynomial of the wavelength was also included in the fits.
In the DOAS fit, the solar Fraunhofer lines are removed by using the ratio of the measured spectrum and a reference spectrum. Because both spectra are influenced by the instrument spectral response function, the solar Fraunhofer lines cannot be removed completely in the ratio. Since this effect comes from the solar spectrum I0, it is referred to as “I0 effect”. Detailed explanation and corrections for the I0 effect were presented by Alliwell et al. (2002). The NO2 and O3 cross sections have been corrected for the I0 effect.
For the fit of tropospheric NO2, the reference spectrum was the measurement at 90∘ elevation angle (zenith) at every scanning series. For the stratospheric NO2, the reference spectrum for the MAX-DOAS measurements from December 2017 to January 2018 was taken on 3 January 2018. The reference spectrum for the MAX-DOAS measurements in December 2018 and 2019 was taken on 3 February 2019. These two reference spectra were measured at solar zenith angle 17 and 24∘ in the afternoon at 90∘ elevation angle in cloud-free situations. We did not use spectra measured at a solar zenith angle close to 0∘ because of saturation of the detector.
3.2 Computation of NO2 vertical column densities
The NO2 slant column densities present the amount of NO2 along the effective light path from the sun to the MAX-DOAS. In order to convert the slant column densities to the vertical column densities, air mass factors (AMFs) were calculated using the Doubling–Adding KNMI radiative transfer codes (DAK) (De Haan et al., 1987; Stammes, 2001), with a pseudospherical correction (because of the large solar zenith angles up to 89∘) and tropical atmospheric profiles of temperature and pressure (Anderson et al., 1986). The NO2 profile was taken from the TM5-MP model simulations and interpolated at the tropical atmospheric profile levels. For the stratospheric AMF, the tropospheric NO2 mixing ratio was set to zero at the altitude from 0 to 18 km, which is about the tropopause height from the model for the tropical regions. The NO2 total column density in the tropical atmospheric profile is about 2.0×10¹⁵ molec cm−2. NO2 photolysis at twilight was not taken into account in the AMF calculations. The uncertainty of the AMFs caused by the neglecting of the NO2 photolysis has been shown by Van Roozendael and Hendrick (2012) and will be discussed in Sect. 4.5. Aerosols were specified in a well-mixed layer from 0 to 1 km, with aerosol optical thickness values from 0 to 2 in 20 intervals. A Henyey–Greenstein phase function was used for aerosols in the computations.
AMFs for the stratospheric and tropospheric NO2 were calculated separately offline and stored in look-up tables. The AMF is a function of elevation angle, solar zenith angle, relative azimuth angle, aerosol optical thickness, surface albedo, and surface height. For the ship measurements, we set the surface albedo to 0.05 and the surface height to 0 km. The solar zenith angles ranged from 0 to 89∘. The AMFs were calculated at the wavelength of 460 nm. The method for the calculation of the tropospheric AMFs is described by Vlemmix et al. (2010).
Clouds were not taken into account in the AMF computations. According to Van Roozendael and Hendrick (2012) clouds are not important for the stratospheric NO2 retrievals using MAX-DOAS. The impact of clouds on tropospheric NO2 retrievals has been analysed by Vlemmix et al. (2015), by analysing the fully cloudy scenes (both zenith and off-axis elevation having clouds) and partly cloudy scenes (one elevation having clouds, either zenith or off-axis). They have reported that, for the fully cloudy scenes, the impact of clouds on the sensitivity of MAX-DOAS tropospheric NO2 measurement is small. For the partly cloudy scenes, the clouds have strong impact on the MAX-DOAS tropospheric NO2 measurements, but the impact can be reduced if the MAX-DOAS data are averaged in time.
The viewing azimuth angles of the MAX-DOAS measurements were corrected using the heading data of the ship. The elevation angles were not explicitly corrected for the pitch and roll of the ship in our calculations because the MAX-DOAS instruments had an automatic continuous adjustment of the elevation angles during the measurements. Because we use 15∘ (165∘), 30∘ (150∘), and 90∘ elevation angles in the NO2 retrievals, the 1∘ of pitch and roll are not important for these elevation angles. The solar zenith angles and relative azimuth angles have been re-computed using the ship GPS data because the internal GPS of the MAX-DOAS instrument was malfunctioning.
The stratospheric NO2 vertical column densities (VCDstrat) are calculated using Eq. (1).
where DSCD is the differential slant column density between the actual slant column density and the slant column density in the reference spectrum. SCDref is the slant column density in the reference spectrum, which is calculated using the total VCD multiplied with the cosine of the SZA. AMFstrat is the stratospheric NO2 AMF.
We obtained the total NO2 VCDs in the MAX-DOAS reference spectra from collocated OMI/QA4ECV NO2 data (version 1.1 offline, at http://www.temis.nl/, last access: 23 March 2020) (Boersma et al., 2018). The total NO2 column density was 1.5×10¹⁵ molec cm−2 in the reference spectrum on 3 January 2018 and was 1.7×10¹⁵ molec cm−2 in the reference spectrum on 3 February 2019.
The tropospheric NO2 vertical column densities (VCDtrop) are calculated using Eq. (2).
where DSCD90 is the differential slant column densities between a given elevation angle and 90∘ elevation angle in the same scanning series, and DAMF is the difference between the NO2 AMFs at the given elevation angle and at 90∘ elevation angle.
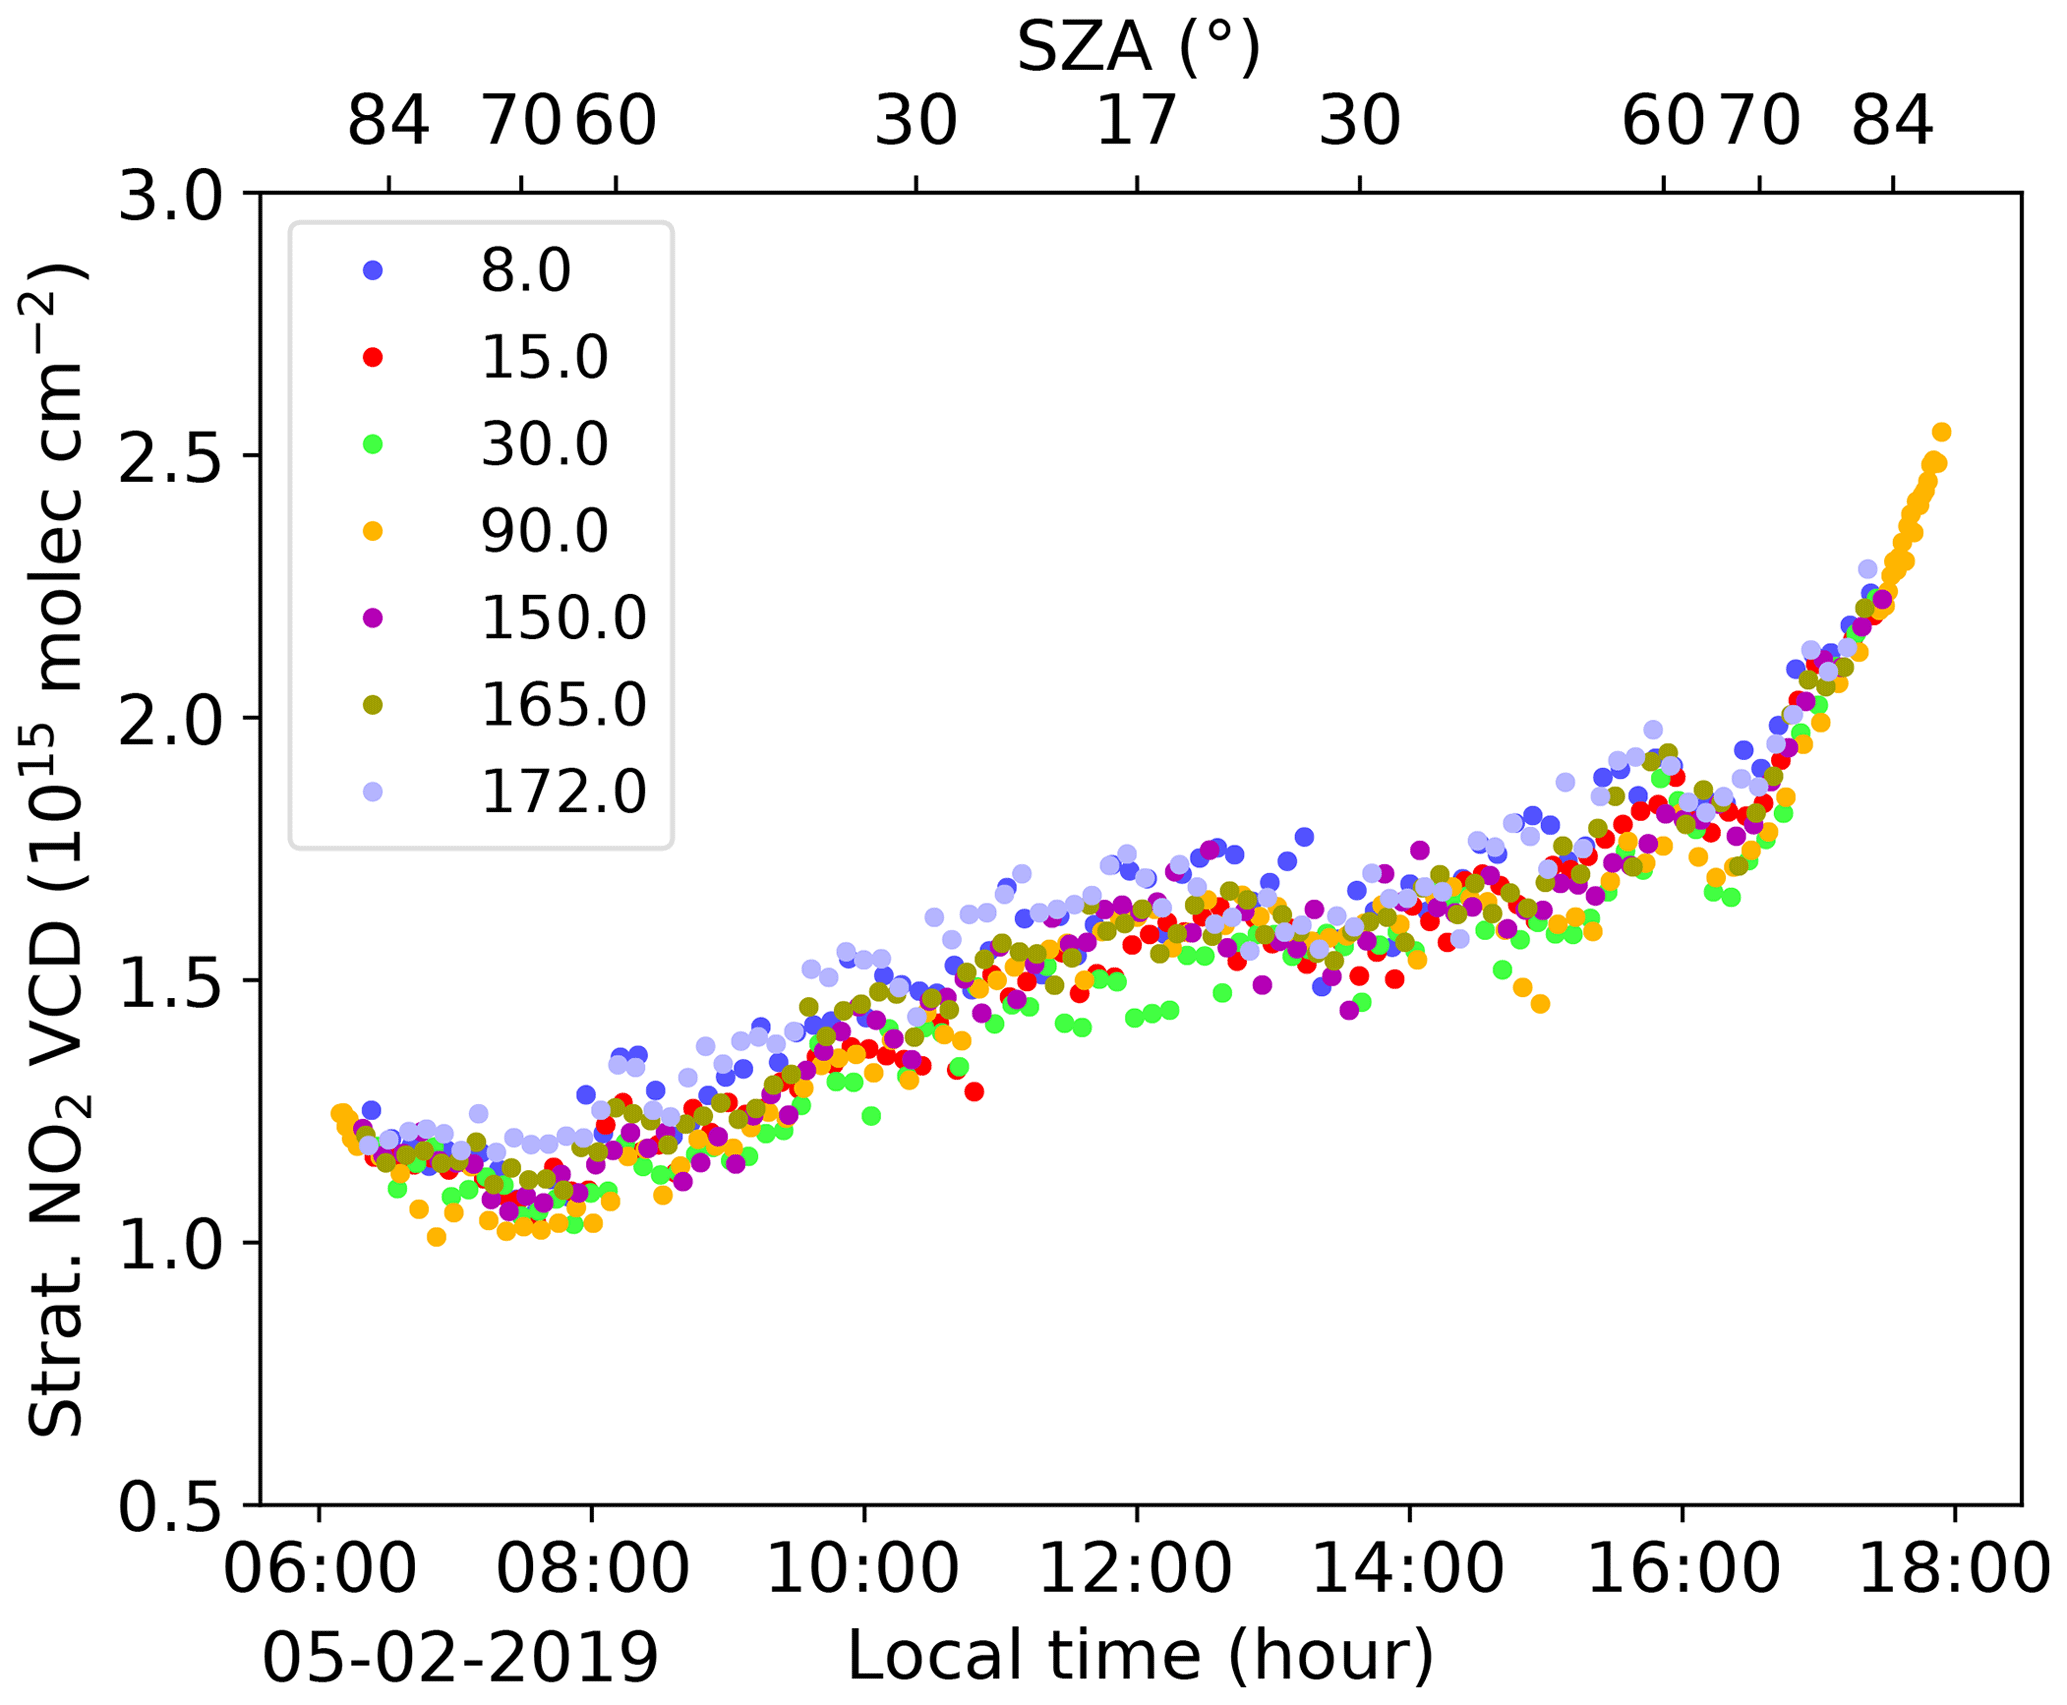
Figure 2An example of diurnal cycle of stratospheric NO2 VCDs on 5 February 2019. The NO2 VCDs derived from different elevation angles are indicated with different colours. The measurements were taken over the Pacific Ocean. At 12:00 LT, RV Sonne was at 1.9∘ N, 140.9∘ W.
4.1 MAX-DOAS stratospheric NO2
Stratospheric NO2 vertical column densities derived from all viewing directions on 5 February 2019 are shown in Fig. 2. On this day, RV Sonne sailed in the Pacific ocean (1.37–2.08∘ N, 142.08–140.58∘ W). It was good weather with lots of scattered clouds, which was the normal weather condition during the cruises. The stratospheric NO2 VCDs derived from different elevation angles are quite close to each other, but the VCDs are slightly larger at small elevation angles. The NO2 VCD shows a typical diurnal evolution pattern in the stratosphere, with low values in the morning, increasing during the day, and high values in the evening. These features can be explained by the NOx-related stratospheric chemistry, as mentioned in the Introduction. The stratospheric NO2 VCD is about 1.5×10¹⁵ molec cm−2 at noon and 2.6×10¹⁵ molec cm−2 at SZA of 89∘. The values are in the same range as those measured by satellite instruments reported by Belmonte-Rivas et al. (2014).
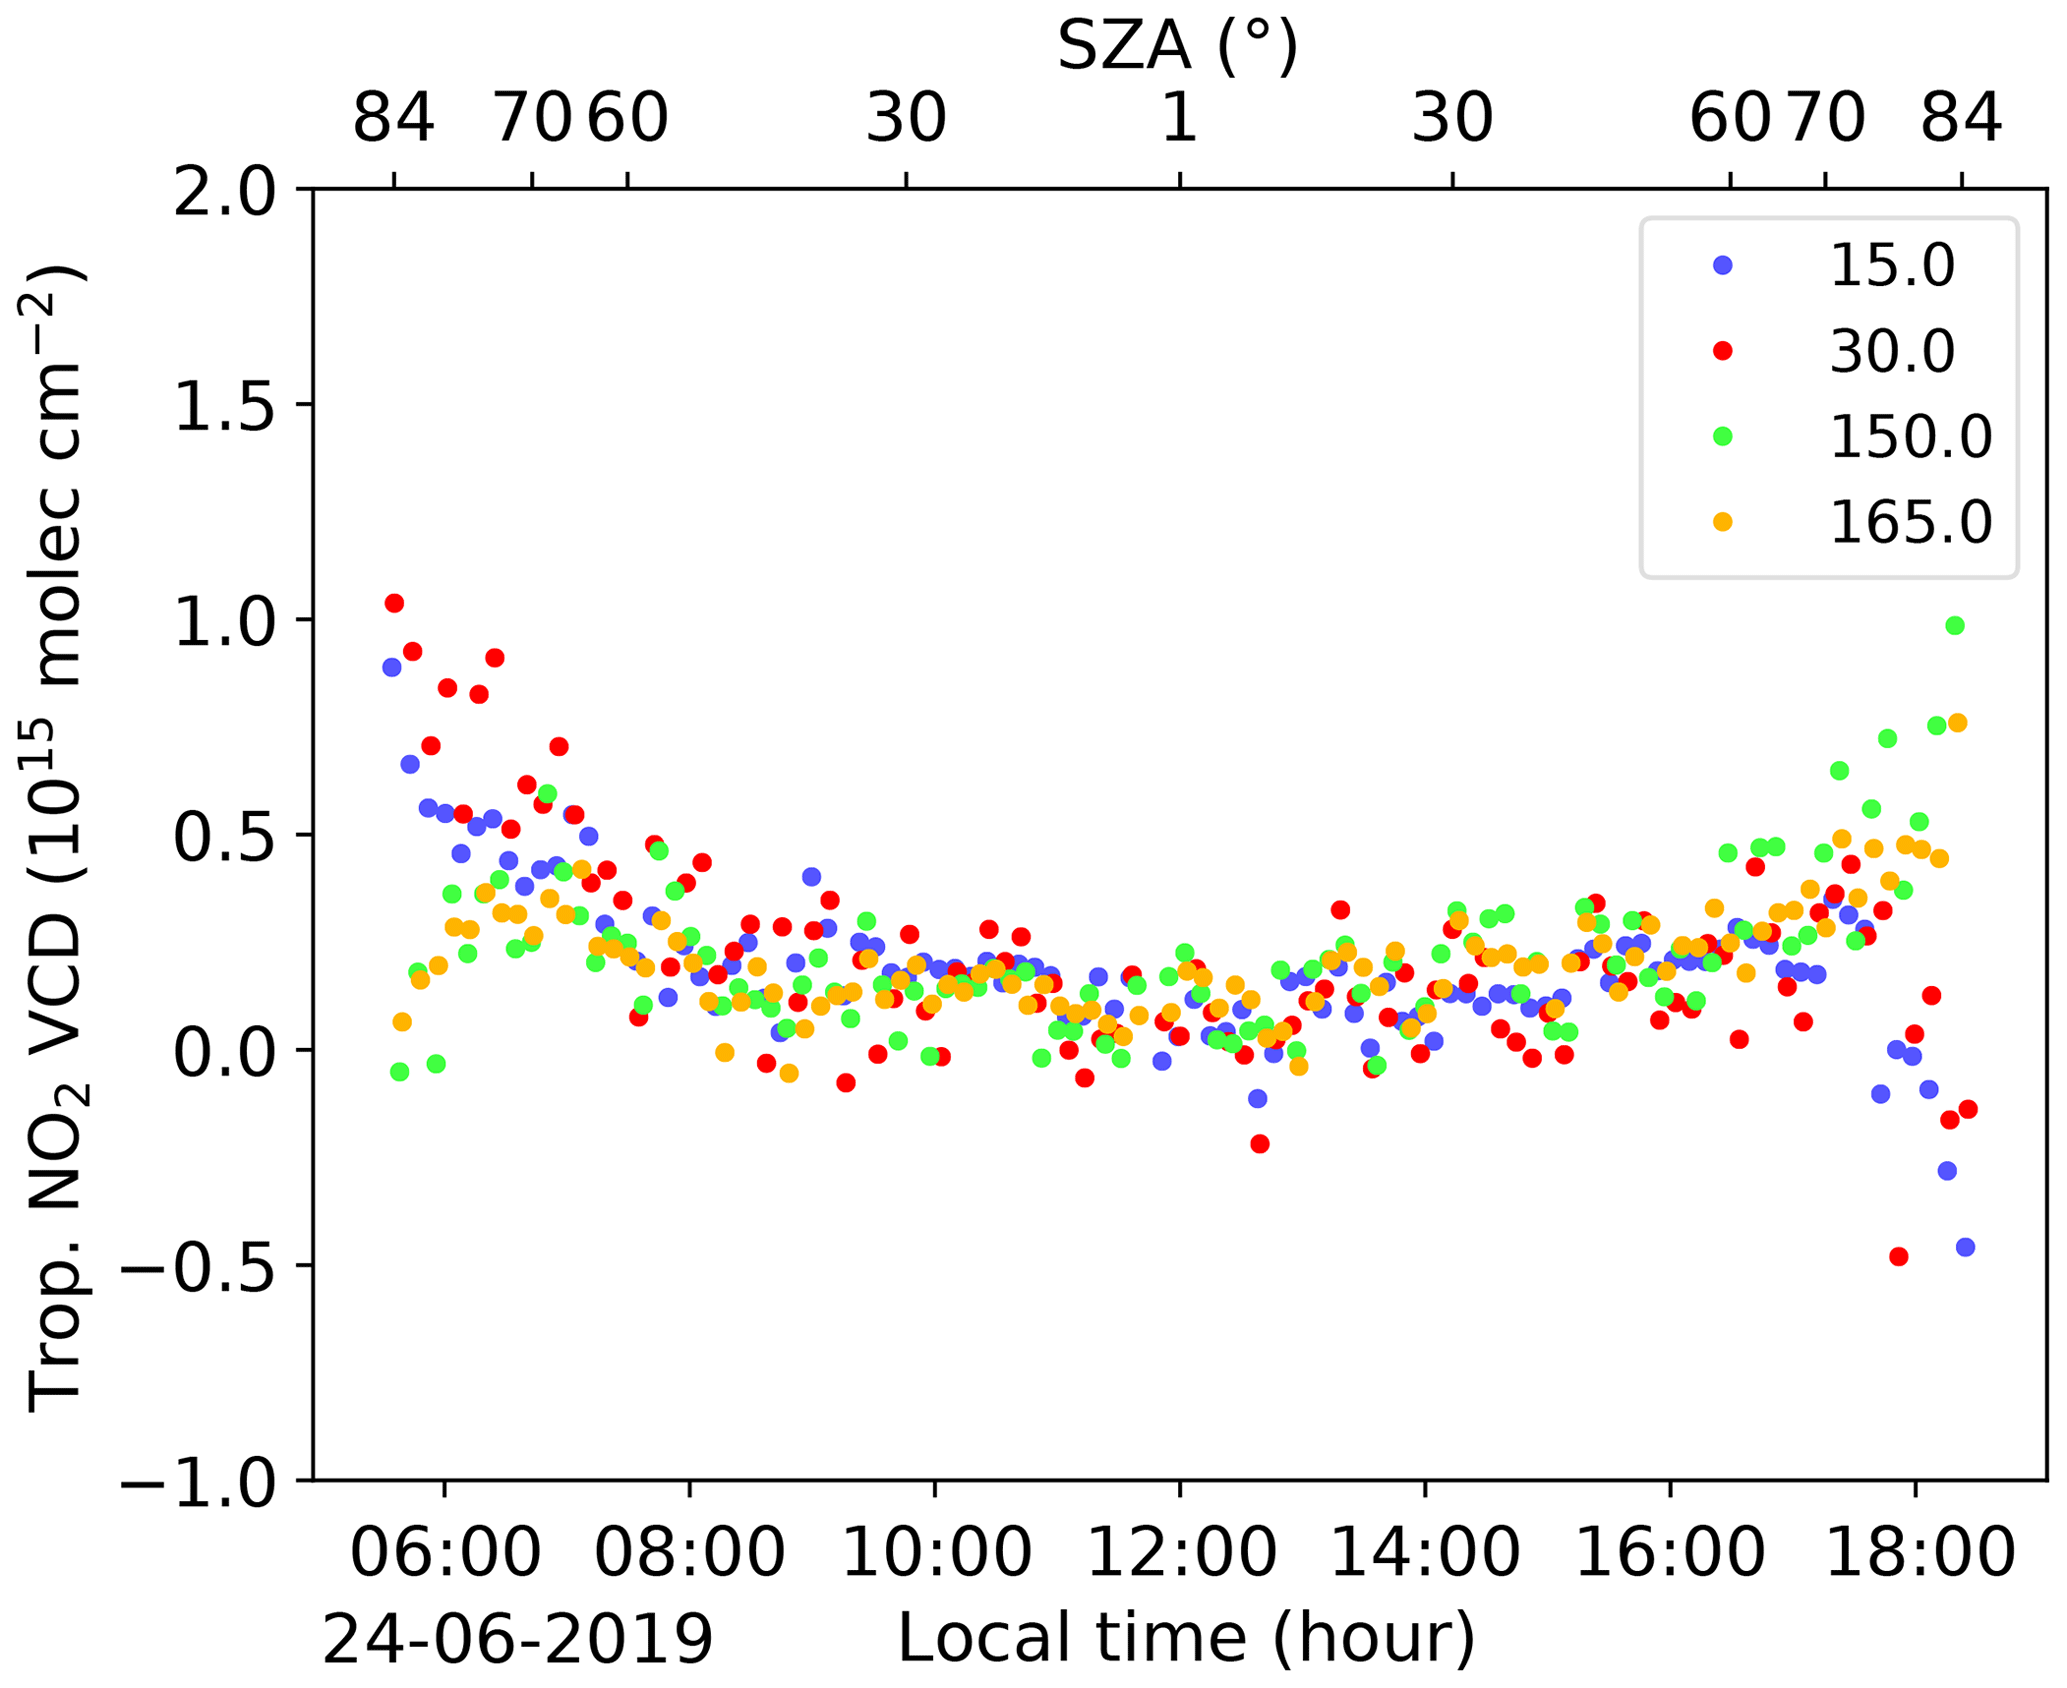
Figure 3An example of 1 d of tropospheric NO2 VCDs on 24 June 2019. The NO2 VCDs derived from different elevation angles are indicated with different colours. The reference spectrum was taken at the 90∘ elevation angle in every scan so that no NO2 VCD was retrieved from the 90∘ elevation angle. The measurements were taken over the Pacific Ocean. At 12:00 LT, RV Sonne was at 24.8∘ N, 136.1∘ E.
4.2 MAX-DOAS tropospheric NO2
Figure 3 shows tropospheric NO2 VCDs on 24 June 2019. The measurement was taken over the Pacific ocean (25.12–24.40∘ N, 137.83–134.44∘ E) with scattered clouds. The tropospheric NO2 vertical column densities are between 0 and 0.5×10¹⁵ molec cm−2 and similar at different elevation angles. Therefore, we do not need to separate different elevation angles when comparing MAX-DOAS tropospheric NO2 vertical column densities with TROPOMI tropospheric NO2 vertical column densities. There is no enhanced tropospheric NO2 on this day, which is the case for most of the cruises. At SZA larger than 60∘, some tropospheric NO2 VCDs are larger than at noon, which may be the impact of the stratospheric NO2.
As shown in Fig. 3, when the solar zenith angles are larger than 70∘, in the morning the VCDs at the elevations of 150 and 165∘ decrease with the increasing SZA; in the evening the VCDs at the elevations of 15 and 30∘ decrease with the increasing SZA. The decrease in tropospheric NO2 VCDs with increasing SZA at relatively large SZA is an artefact that is caused by the rapid changing of the stratospheric NO2 at large SZA and using the spectrum measured at 90∘ elevation angle as the reference spectrum in every scanning series. The measurements started from the 15∘ elevation angle and finished at the 165∘ elevation angle. In the morning, the spectra at the 150 and 165∘ elevation angles are measured later than the reference spectrum and the stratospheric NO2 decreases rapidly in the morning, therefore less NO2 is measured at the 150 and 165∘ elevation angles than in the reference spectrum. In the evening, the stratospheric NO2 increases rapidly as SZA is increasing, and the spectra at the 15 and 30∘ elevation angles are measured earlier than the reference spectrum; consequently, less NO2 is measured at the 15 and 30∘ elevation angles than in the reference spectrum. If there is more NO2 in the reference spectrum than in the actual measurement, the DOAS fit may yield a negative NO2 slant column density. This artefact has no impact on the comparison with TROPOMI tropospheric NO2 because the SZAs are small at the TROPOMI overpass time during the four cruises.

Figure 4Stratospheric NO2 vertical column densities on 22 March 2019, measured by MAX-DOAS and simulated by TM5. RV Sonne was stationary over the Pacific Ocean at 14.5∘ N, 125.5∘ W. TM5 simulations of one grid were used.
4.3 Comparison of MAX-DOAS and TROPOMI stratospheric NO2 with TM5-MP model simulations
The TM5-MP-simulated NO2 profiles were integrated vertically from the tropopause level to the highest level of the model to get the stratospheric NO2 vertical column densities. If there were several TM5 latitude–longitude grid cells crossed by the ship in a day, the NO2 column densities in the morning (evening) from the first (last) TM5 grid were used to compare with the MAX-DOAS morning (evening) measurements. The SZA values of the TM5 NO2 profiles were calculated at the centre of the latitude and longitude grids. The variation in the NO2 column densities in different grid cells crossed by the ship per day was usually small. Figure 4 shows 1 d of the stratospheric NO2 column densities simulated by TM5 and measured by MAX-DOAS on 22 March 2019, when the ship was stationary in the Pacific at 14.5∘ N, 125.5∘ W. On this day, the NO2 vertical column densities from one TM5 grid cell were selected. The largest SZA in the MAX-DOAS NO2 VCD data is 89∘ in the morning and evening. The MAX-DOAS stratospheric NO2 vertical column densities have a similar diurnal variation to the TM5-simulated stratospheric NO2 column densities. The TM5 stratospheric NO2 vertical column densities have a positive offset compared to the MAX-DOAS stratospheric NO2 VCDs. Plots of other days show a similar pattern.
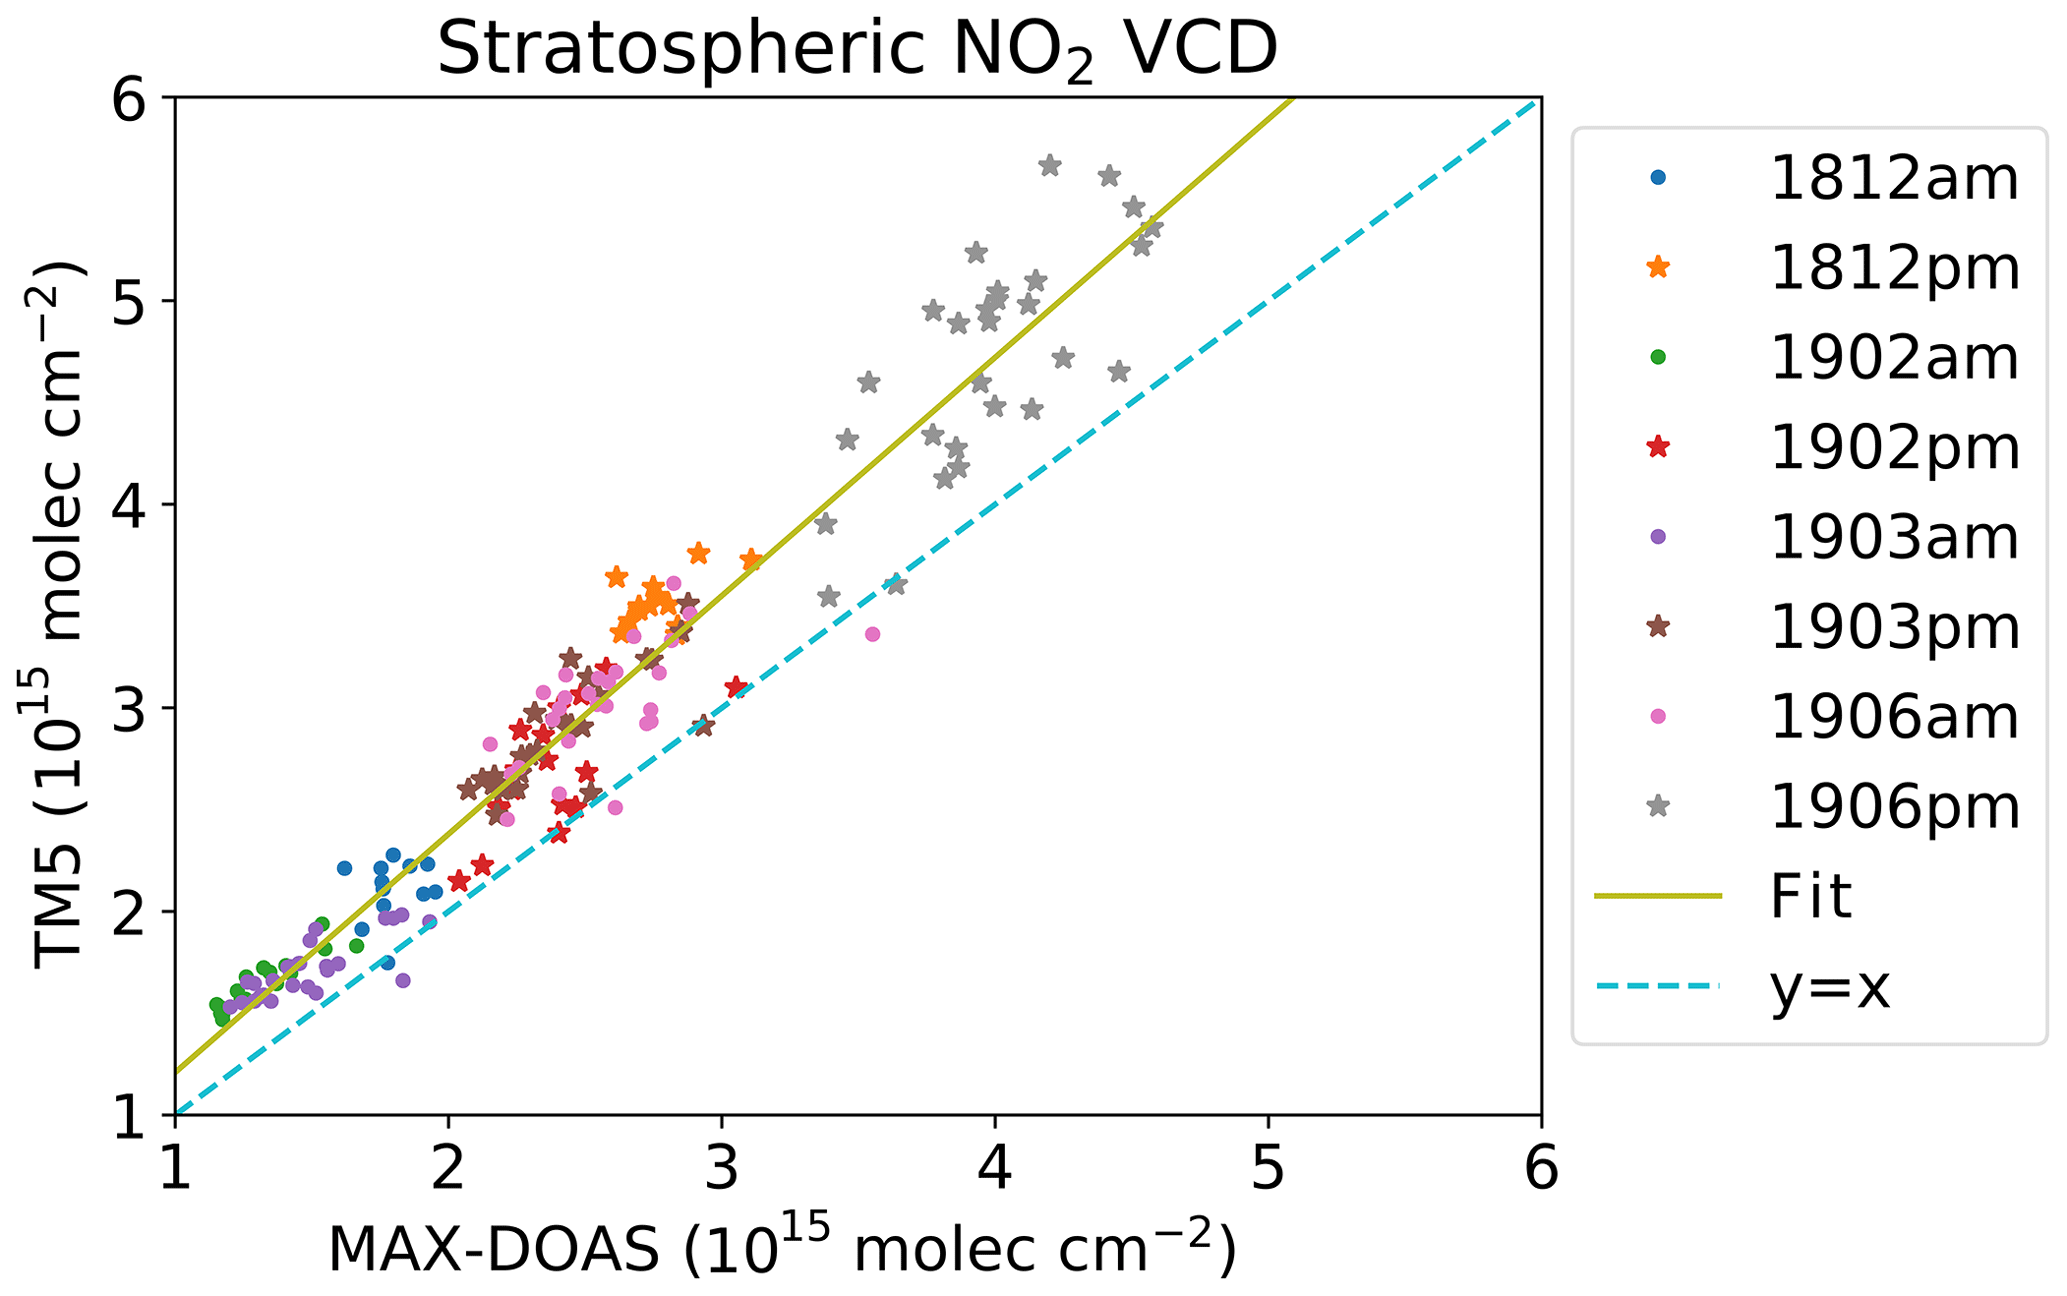
Figure 5Scatter plot of TM5 stratospheric NO2 vertical column densities versus MAX-DOAS stratospheric NO2 vertical column densities. The abbreviations “am” and “pm” represent MAX-DOAS NO2 vertical column density mean values between a solar zenith angle of 75 and 89∘ in the morning and in the evening, respectively. The numbers 1812, 1902, 1903, and 1906 refer to the years (2018, 2019) and months (December, February, March, June) of the cruises. The correlation coefficient is R=0.97. The fit is molec cm−2.
Figure 5 shows the scatter plot of the MAX-DOAS stratospheric NO2 VCDs measured in the morning and evening versus TM5-simulated stratospheric NO2 VCDs for four cruises. The morning and evening NO2 values are the average of NO2 VCD measured from SZA 75 to 89∘, respectively. This solar zenith angle range is used throughout the paper to define the morning and evening NO2. At large SZA, the light path in the stratosphere is longer than that at noon; consequently, the MAX-DOAS measurements are more sensitive to the stratospheric NO2. The MAX-DOAS and TM5 stratospheric NO2 VCDs have a good linear correlation, with a correlation coefficient R=0.97. The mean differences are 3.34×10¹⁴ () molec cm−2 (16.5 %) in the morning and 5.69×10¹⁴ () molec cm−2 (17.4 %) in the evening. The TM5 stratospheric NO2 VCDs are slightly higher than the MAX-DOAS stratospheric NO2 VCDs.
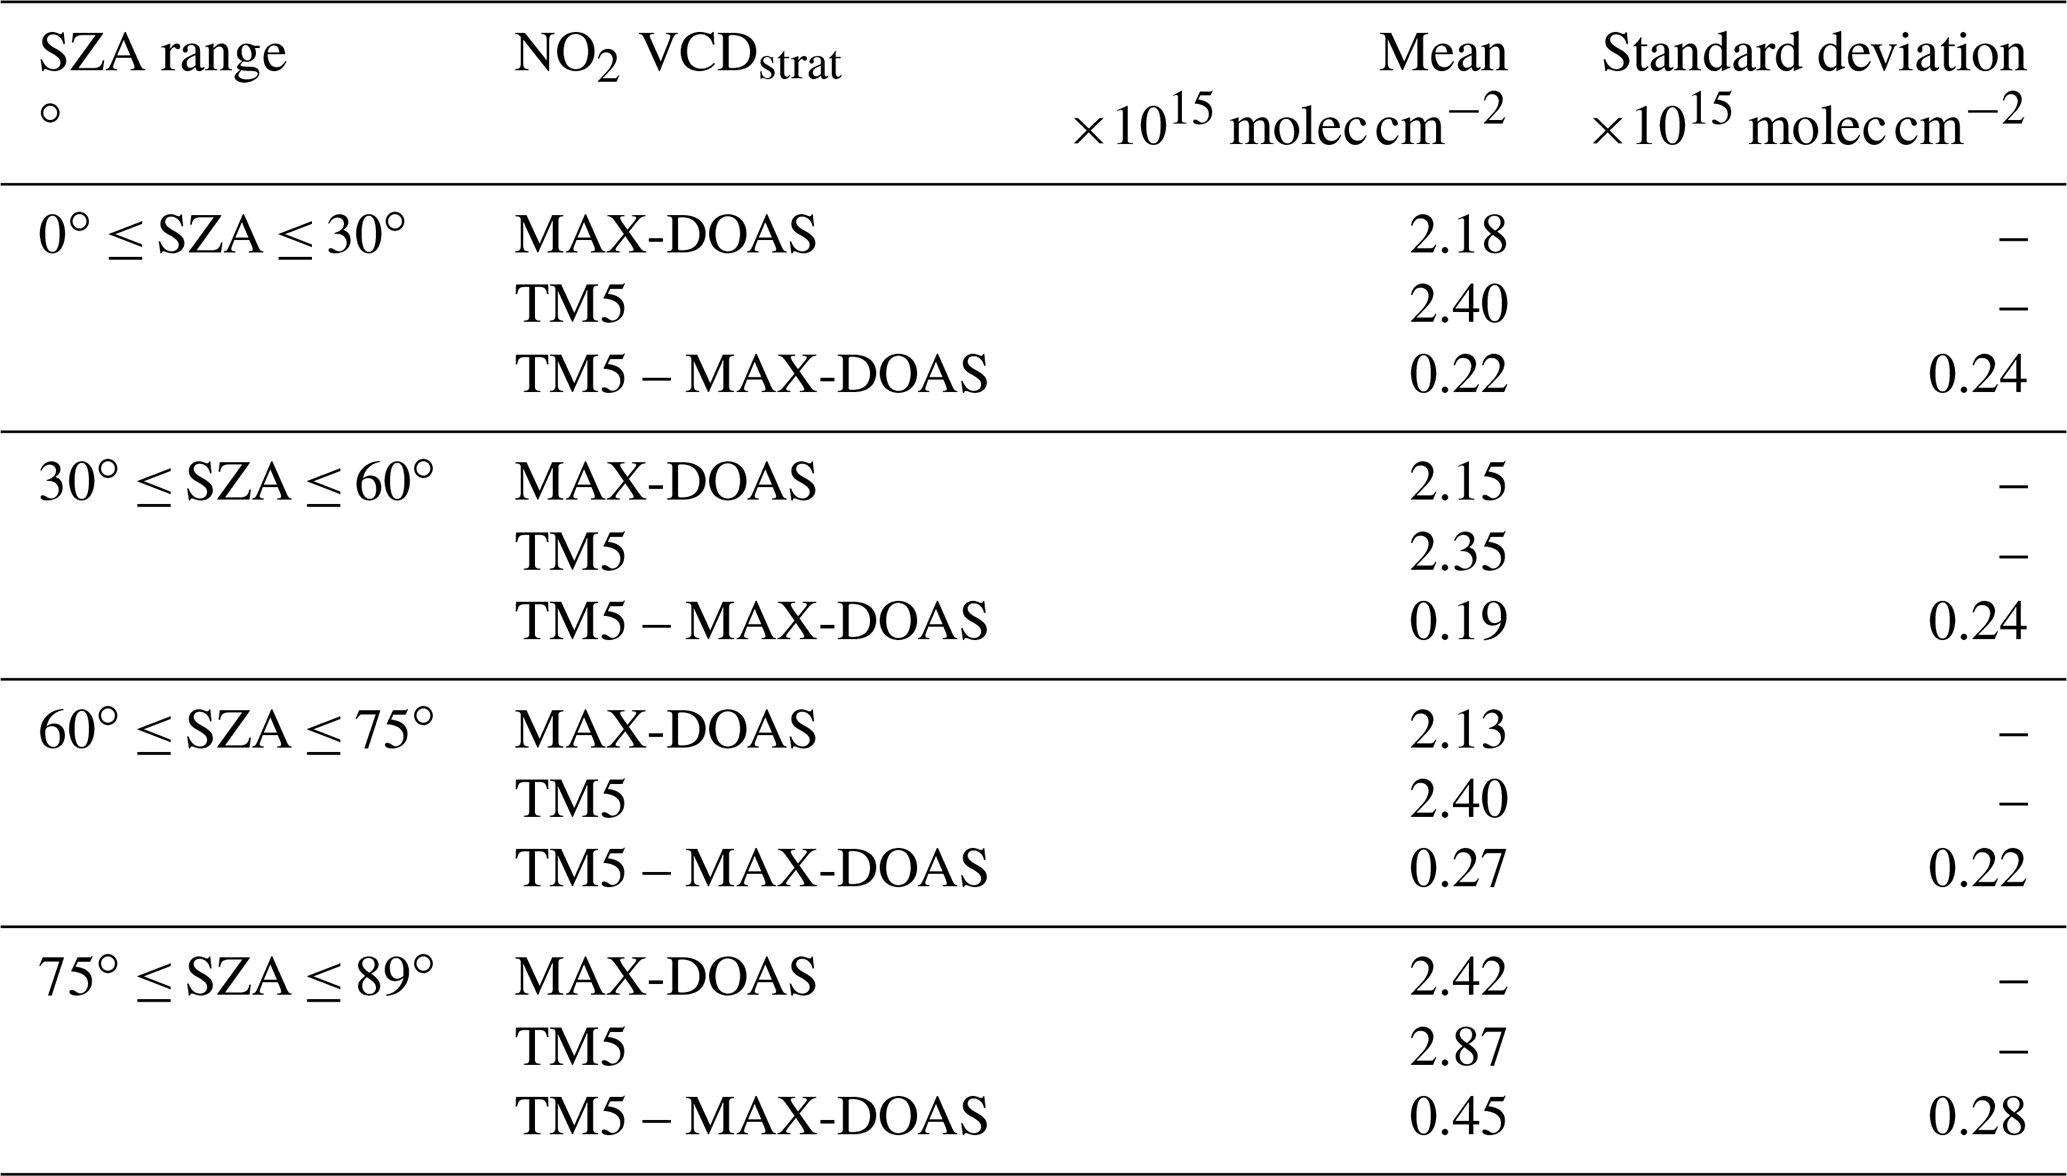
Additionally, we have compared the MAX-DOAS and TM5 stratospheric NO2 VCDs at the SZA ranges of 0–30∘, 30–60∘, and 60–75∘. At smaller SZA angles, TM5-simulated stratospheric NO2 VCDs are mostly larger than the MAX-DOAS measurements. The results of the comparison are presented in Table 2.
Table 2Statistic results of the comparison of TM-5 and MAX-DOAS stratospheric NO2 vertical column densities.
We also compared the TROPOMI stratospheric NO2 VCDs with the TM5-MP model-simulated stratospheric NO2 VCDs. They are almost the same, and the mean difference is about molec cm−2 (about 1 %). This is expected because the TROPOMI NO2 total column densities are assimilated in TM5-MP model to separate the stratospheric and tropospheric NO2. This is a good consistency check for the TROPOMI stratospheric NO2 VCDs.
4.4 Comparison of MAX-DOAS and TROPOMI NO2 vertical column densities
4.4.1 Stratospheric NO2
As mentioned before, the MAX-DOAS measurements are more sensitive to the stratospheric NO2 in the morning and evening than at the TROPOMI overpass time (at 13:30 LT). Because the stratospheric NO2 VCDs have a diurnal cycle, we cannot interpolate the stratospheric NO2 VCD directly at the TROPOMI overpass time using the MAX-DOAS morning and evening values. The interpolation has to be done using a chemistry model as presented by Tack et al. (2015). Since the TM5 and MAX-DOAS stratospheric NO2 VCDs had a similar diurnal cycle, we used the TM5 model to interpolate the MAX-DOAS stratospheric NO2 VCDs at the TROPOMI overpass time. First, for each day the TM5 stratospheric NO2 VCDs were shifted to the MAX-DOAS stratospheric NO2 VCDs by subtracting the mean difference of the stratospheric NO2 VCDs between TM5 and MAX-DOAS for SZA between 75 and 89∘. The stratospheric NO2 VCD at the TROPOMI overpass time (called TM5-interpolated NO2 VCD) was interpolated using this corrected (shifted) TM5 stratospheric NO2 VCDs.
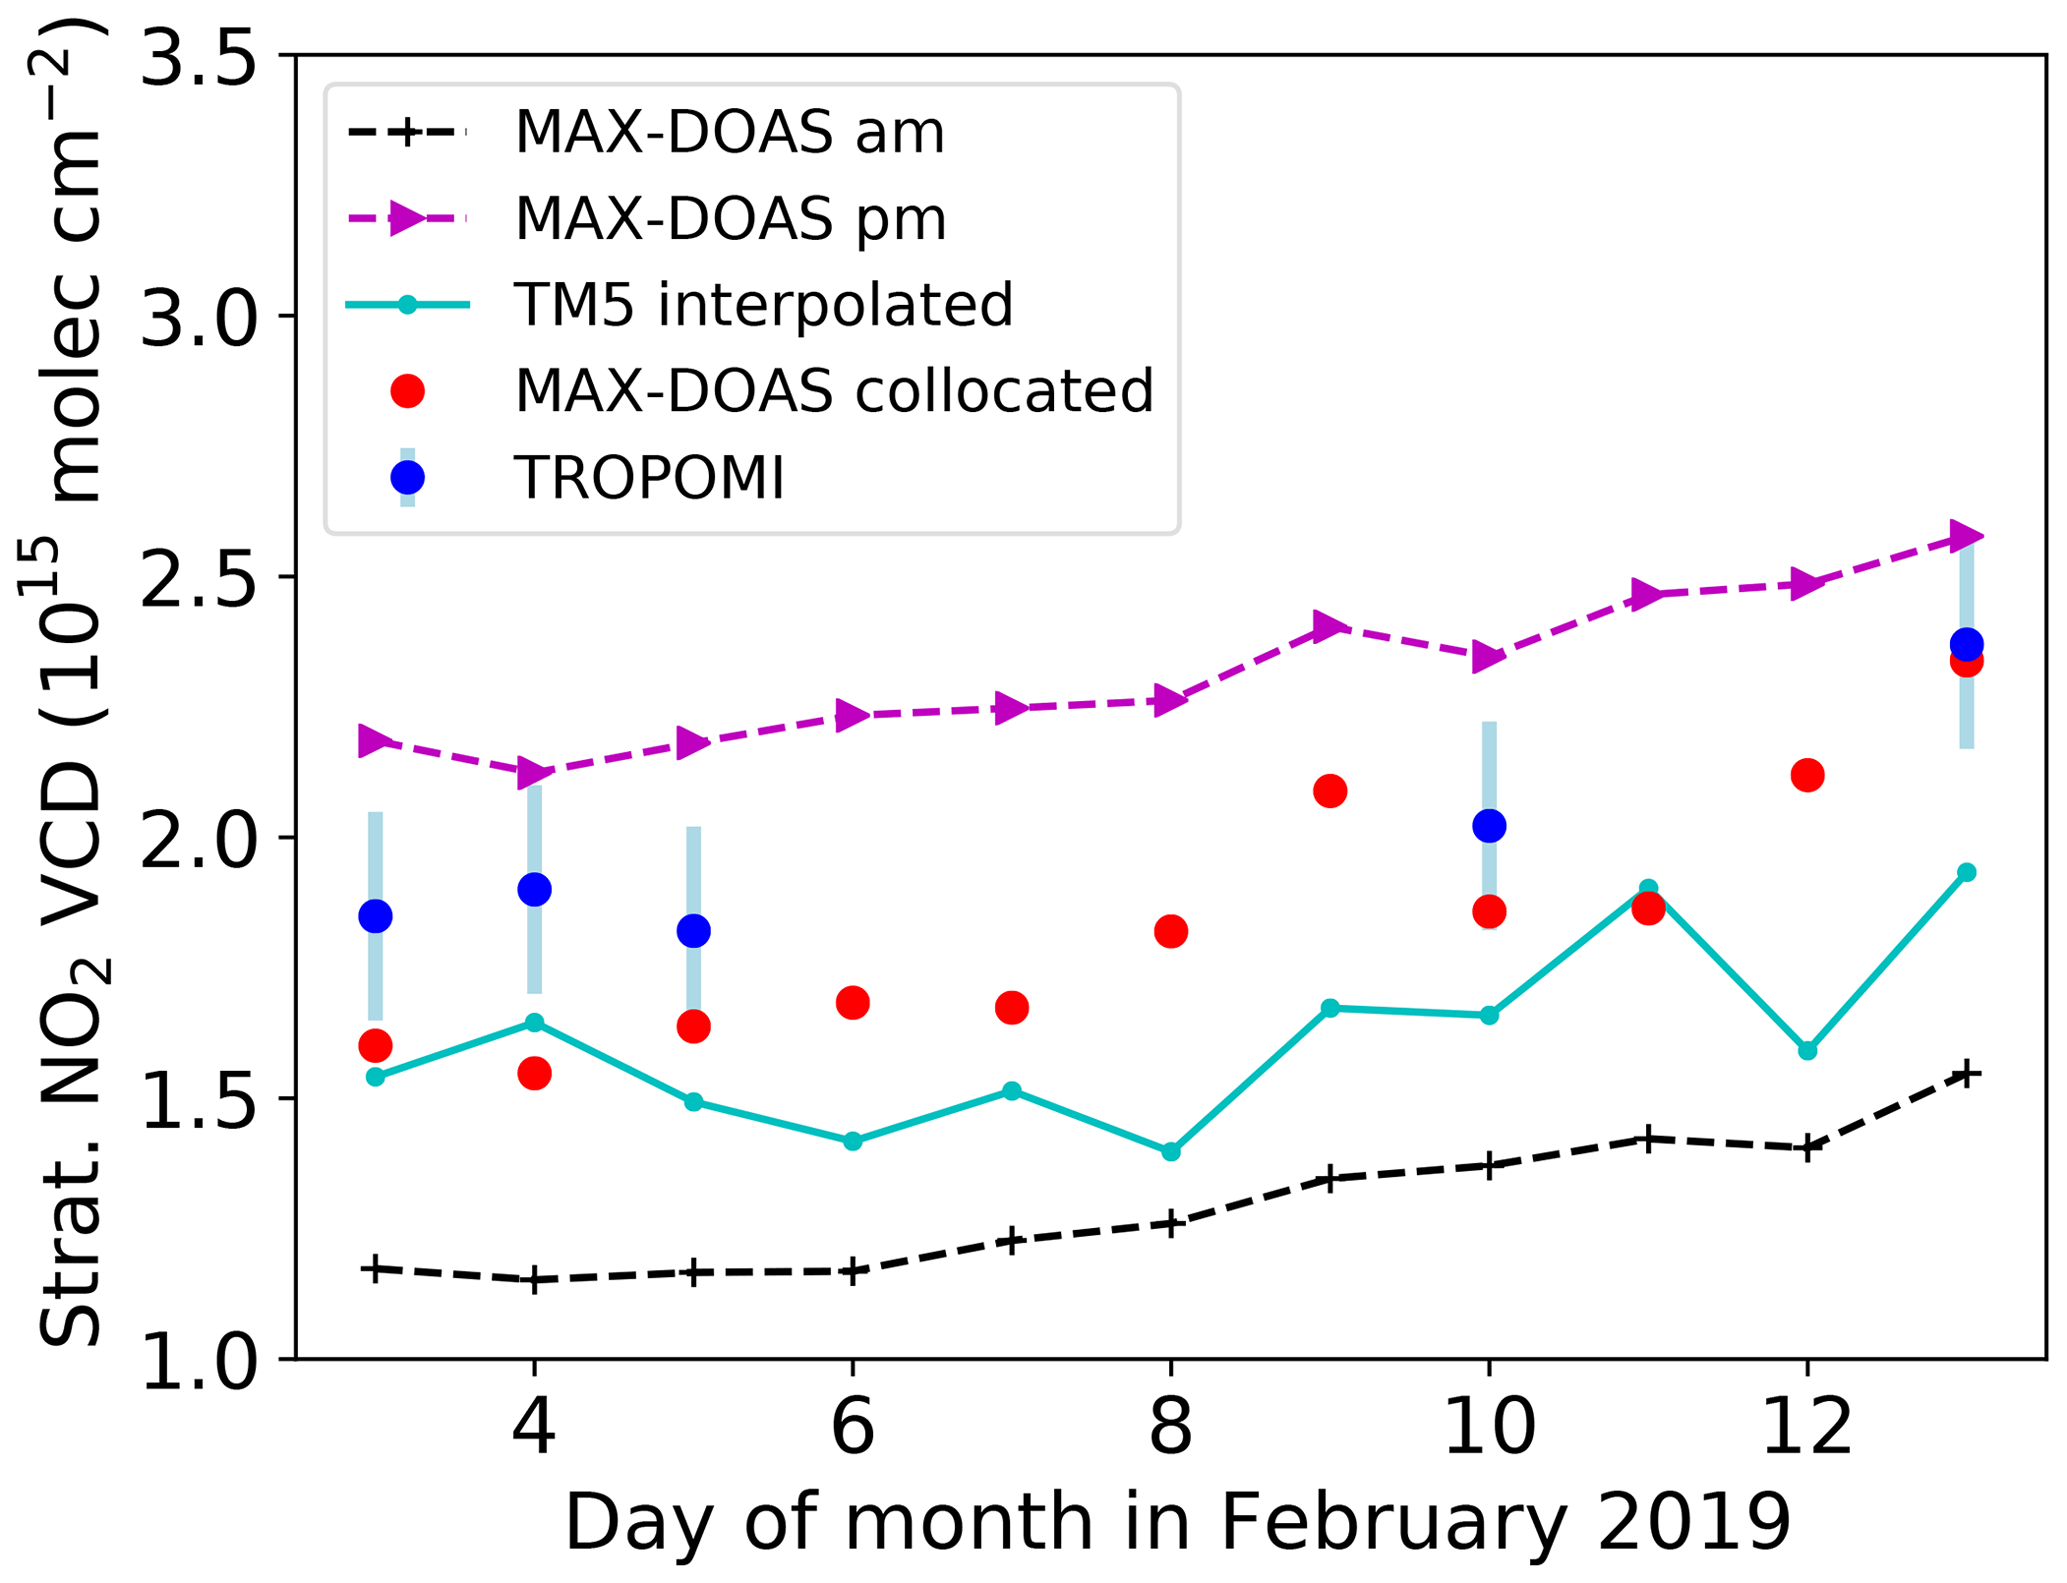
Figure 6Time series of stratospheric NO2 vertical column densities for the cruise in February 2019. The abbreviations “am” and “pm” represent MAX-DOAS NO2 vertical column density mean values between a solar zenith angle of 75 and 89∘ in the morning and in the evening, respectively. The missing TROPOMI data are due to clouds. The error bar shows the precision of the TROPOMI stratospheric NO2 VCD.
The stratospheric NO2 VCDs of MAX-DOAS and TROPOMI for the cruise in February 2019 are shown in Fig. 6. The figure shows the MAX-DOAS stratospheric NO2 VCDs collocated with the TROPOMI measurements, the MAX-DOAS morning and evening stratospheric NO2 VCDs, and the TM5-interpolated stratospheric NO2 VCDs. Before 3 February, RV Sonne was in EEZs, so no data are shown in Fig. 6. In absolute terms, the MAX-DOAS stratospheric NO2 VCDs are smaller in the morning and larger in the evening. The MAX-DOAS NO2 VCDs collocated to the TROPOMI overpass and the interpolated TM5 stratospheric NO2 VCDs are between the morning and evening values. The MAX-DOAS NO2 VCDs are lower than the TROPOMI NO2 VCDs. In some cases, there was no TROPOMI data due to the presence of clouds (with a cut-off at a cloud radiance fraction of 0.5).
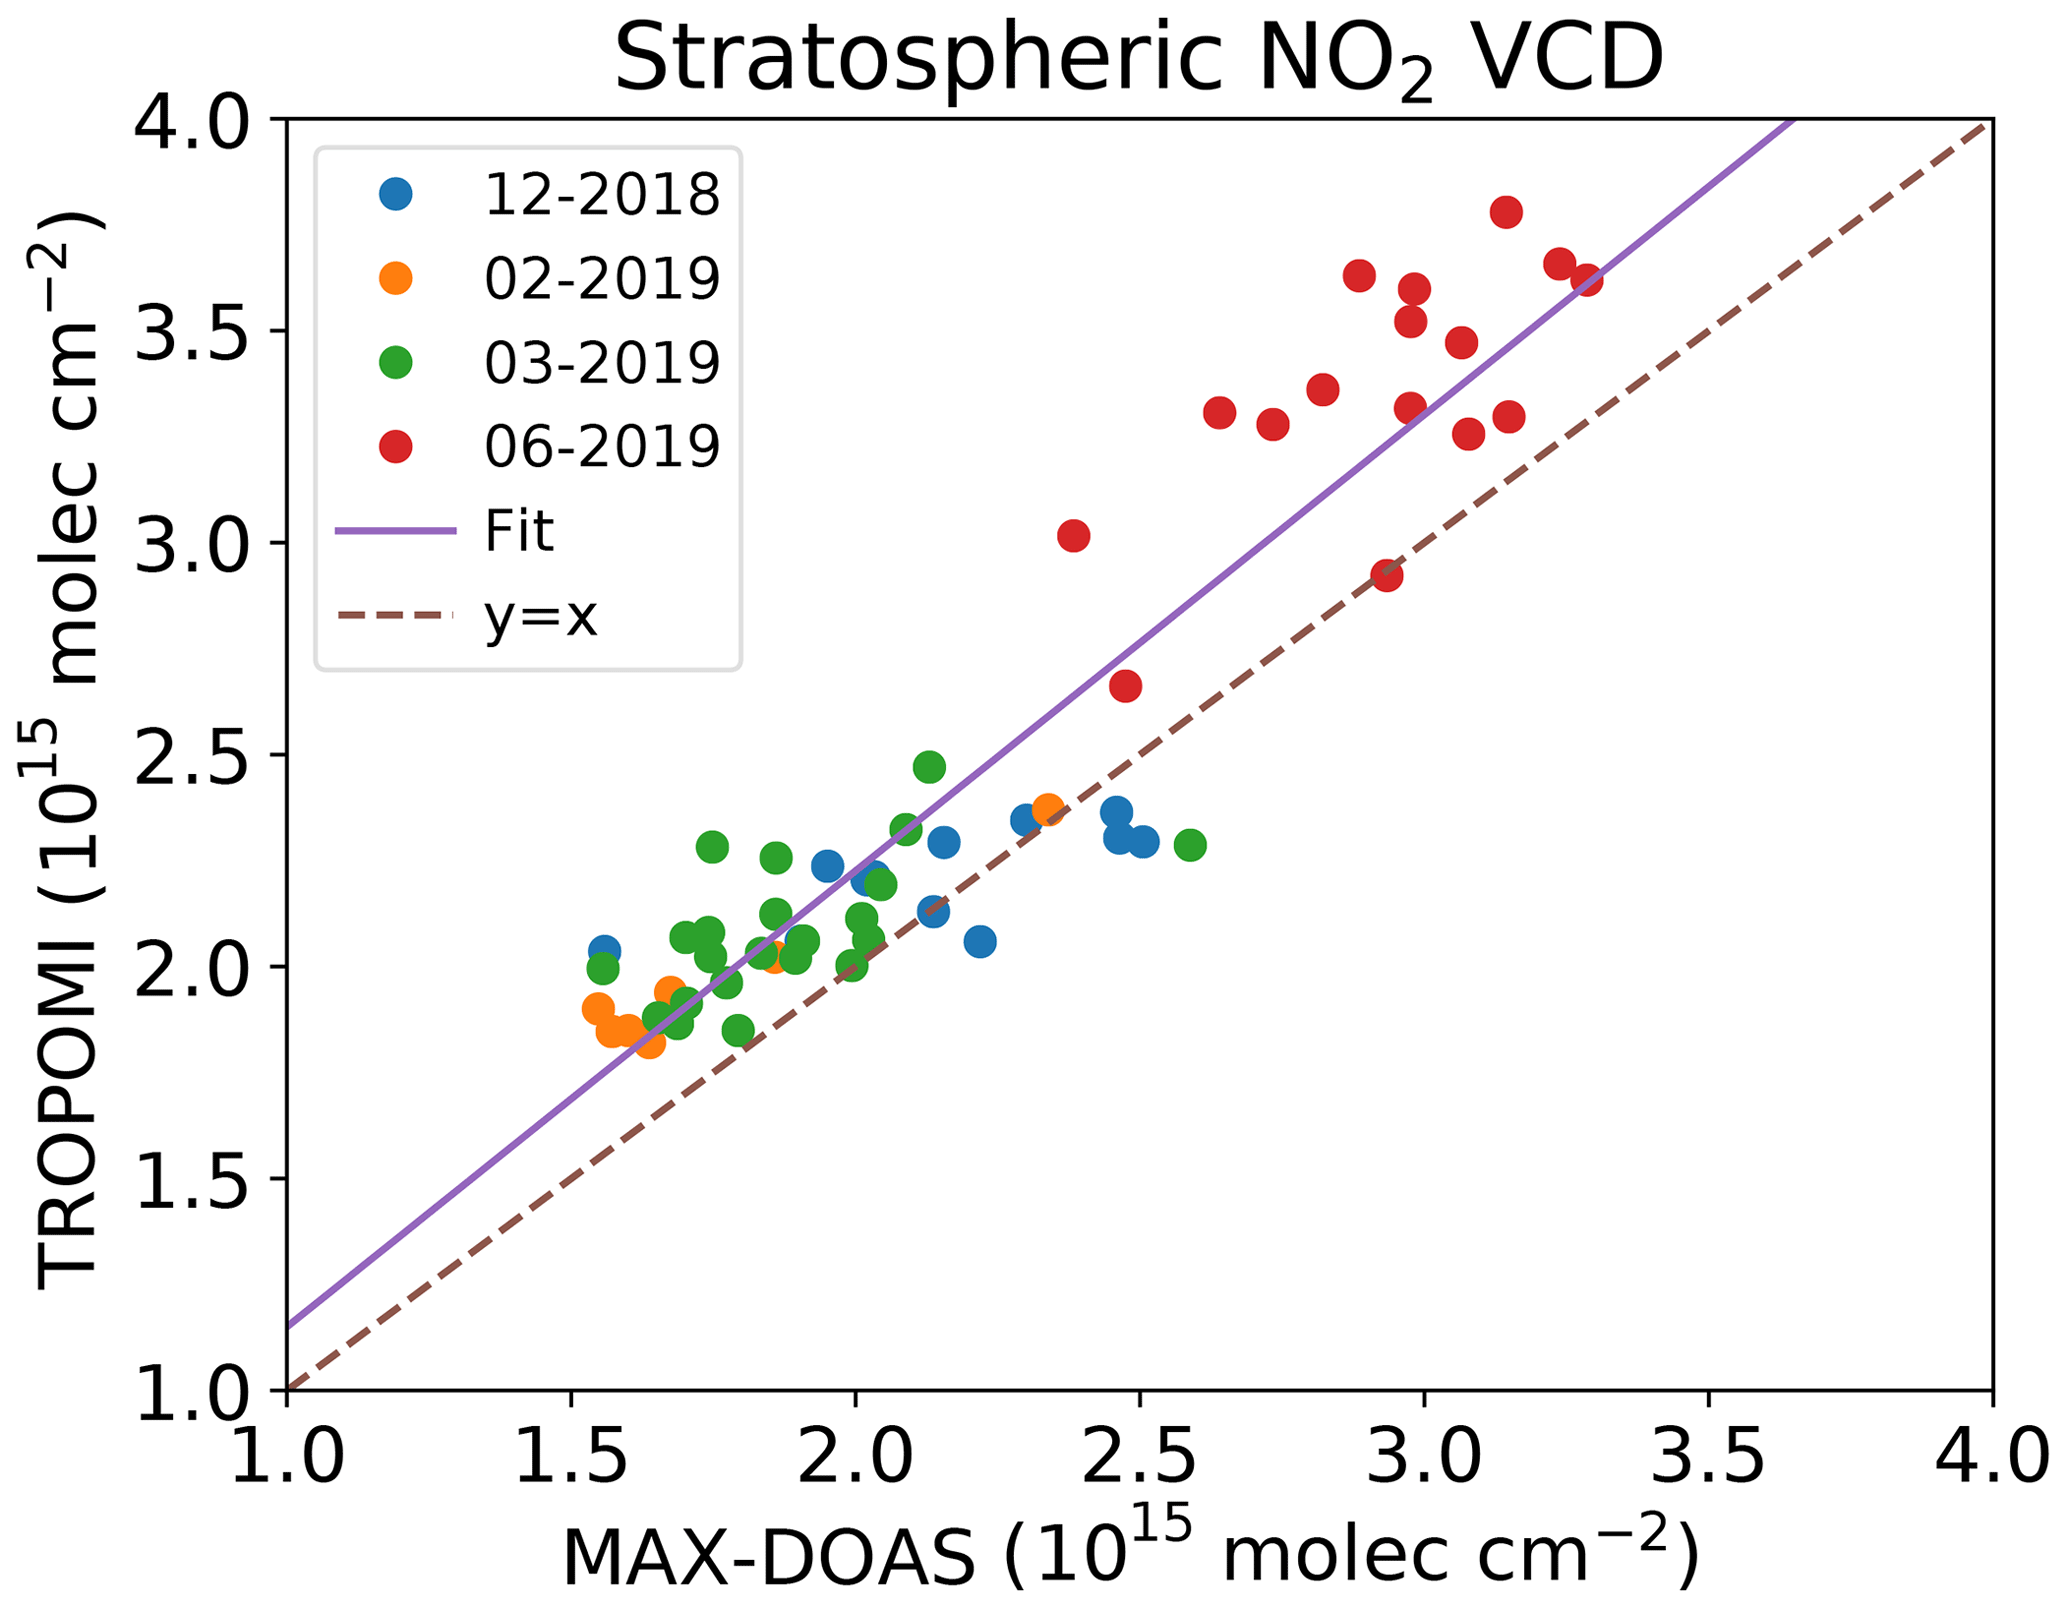
Figure 7Scatter plot of TROPOMI stratospheric NO2 vertical column densities versus MAX-DOAS stratospheric NO2 vertical column densities. The MAX-DOAS measurements are taken from the collocated TROPOMI pixels. The correlation coefficient is 0.93. The fit is molec cm−2.
A scatter plot of TROPOMI versus MAX-DOAS stratospheric NO2 VCDs for all the cruises is shown in Fig. 7. The TROPOMI values were taken from the pixels collocated to the MAX-DOAS location. If the collocated MAX-DOAS NO2 measurement was contaminated by ship emissions, then the NO2 VCD was derived from unpolluted data within 7 min around the overpass time. We removed the MAX-DOAS data measured on the days when the wind direction was from the back of ship and the exhaust of the ship was measured. On the days when the wind was from the front of the ship, MAX-DOAS sometimes measured a small amount of exhaust NO2 for a few minutes; these peaks were also removed. If the collocated MAX-DOAS NO2 was larger than the MAX-DOAS NO2 VCD at the SZA of 80∘ in the evening, the collocated MAX-DOAS NO2 VCD was flagged as polluted. For the data in Fig. 7, the correlation coefficient is 0.93, with a mean difference of 2.42×10¹⁴ molec cm−2 (10.3 %) and standard deviation of 2.24×10¹⁴ molec cm−2. The linear fit of the TROPOMI and MAX-DOAS stratospheric NO2 VCDs has a slope of 1.076 and an offset of 0.74×10¹⁴ molec cm−2.
.

Figure 8Scatter plot of TROPOMI stratospheric NO2 vertical column densities versus TM5-interpolated stratospheric NO2 vertical column densities with the correction of MAX-DOAS measurements using the same TROPOMI data as in Fig. 7. The correlation coefficient is 0.95. The fit is molec cm−2.
Figure 8 shows the TROPOMI stratospheric NO2 VCDs versus the TM5-interpolated stratospheric NO2 VCDs. The correlation coefficient is 0.95, with a mean difference of 4.34×10¹⁴ molec cm−2 (19.2 %) and a standard deviation of 1.92×10¹⁴ molec cm−2. The linear fit of the TROPOMI and TM5-interpolated stratospheric NO2 VCDs has a slope of 1.083 and an offset of 2.653×10¹⁴ molec cm−2, which is similar to that of Fig. 7. The mean and standard deviation values for TROPOMI and MAX-DOAS stratospheric NO2 VCDs are presented in Table 3.
Table 3Statistical results of the comparison of TROPOMI and MAX-DOAS stratospheric NO2 vertical column densities. MAX-DOAS collocated is the MAX-DOAS stratospheric NO2 VCD collocated with TROPOMI measurement. TM5 interpolated is the MAX-DOAS stratospheric NO2 VCD interpolated using the TM5 stratospheric NO2 diurnal cycle.

.
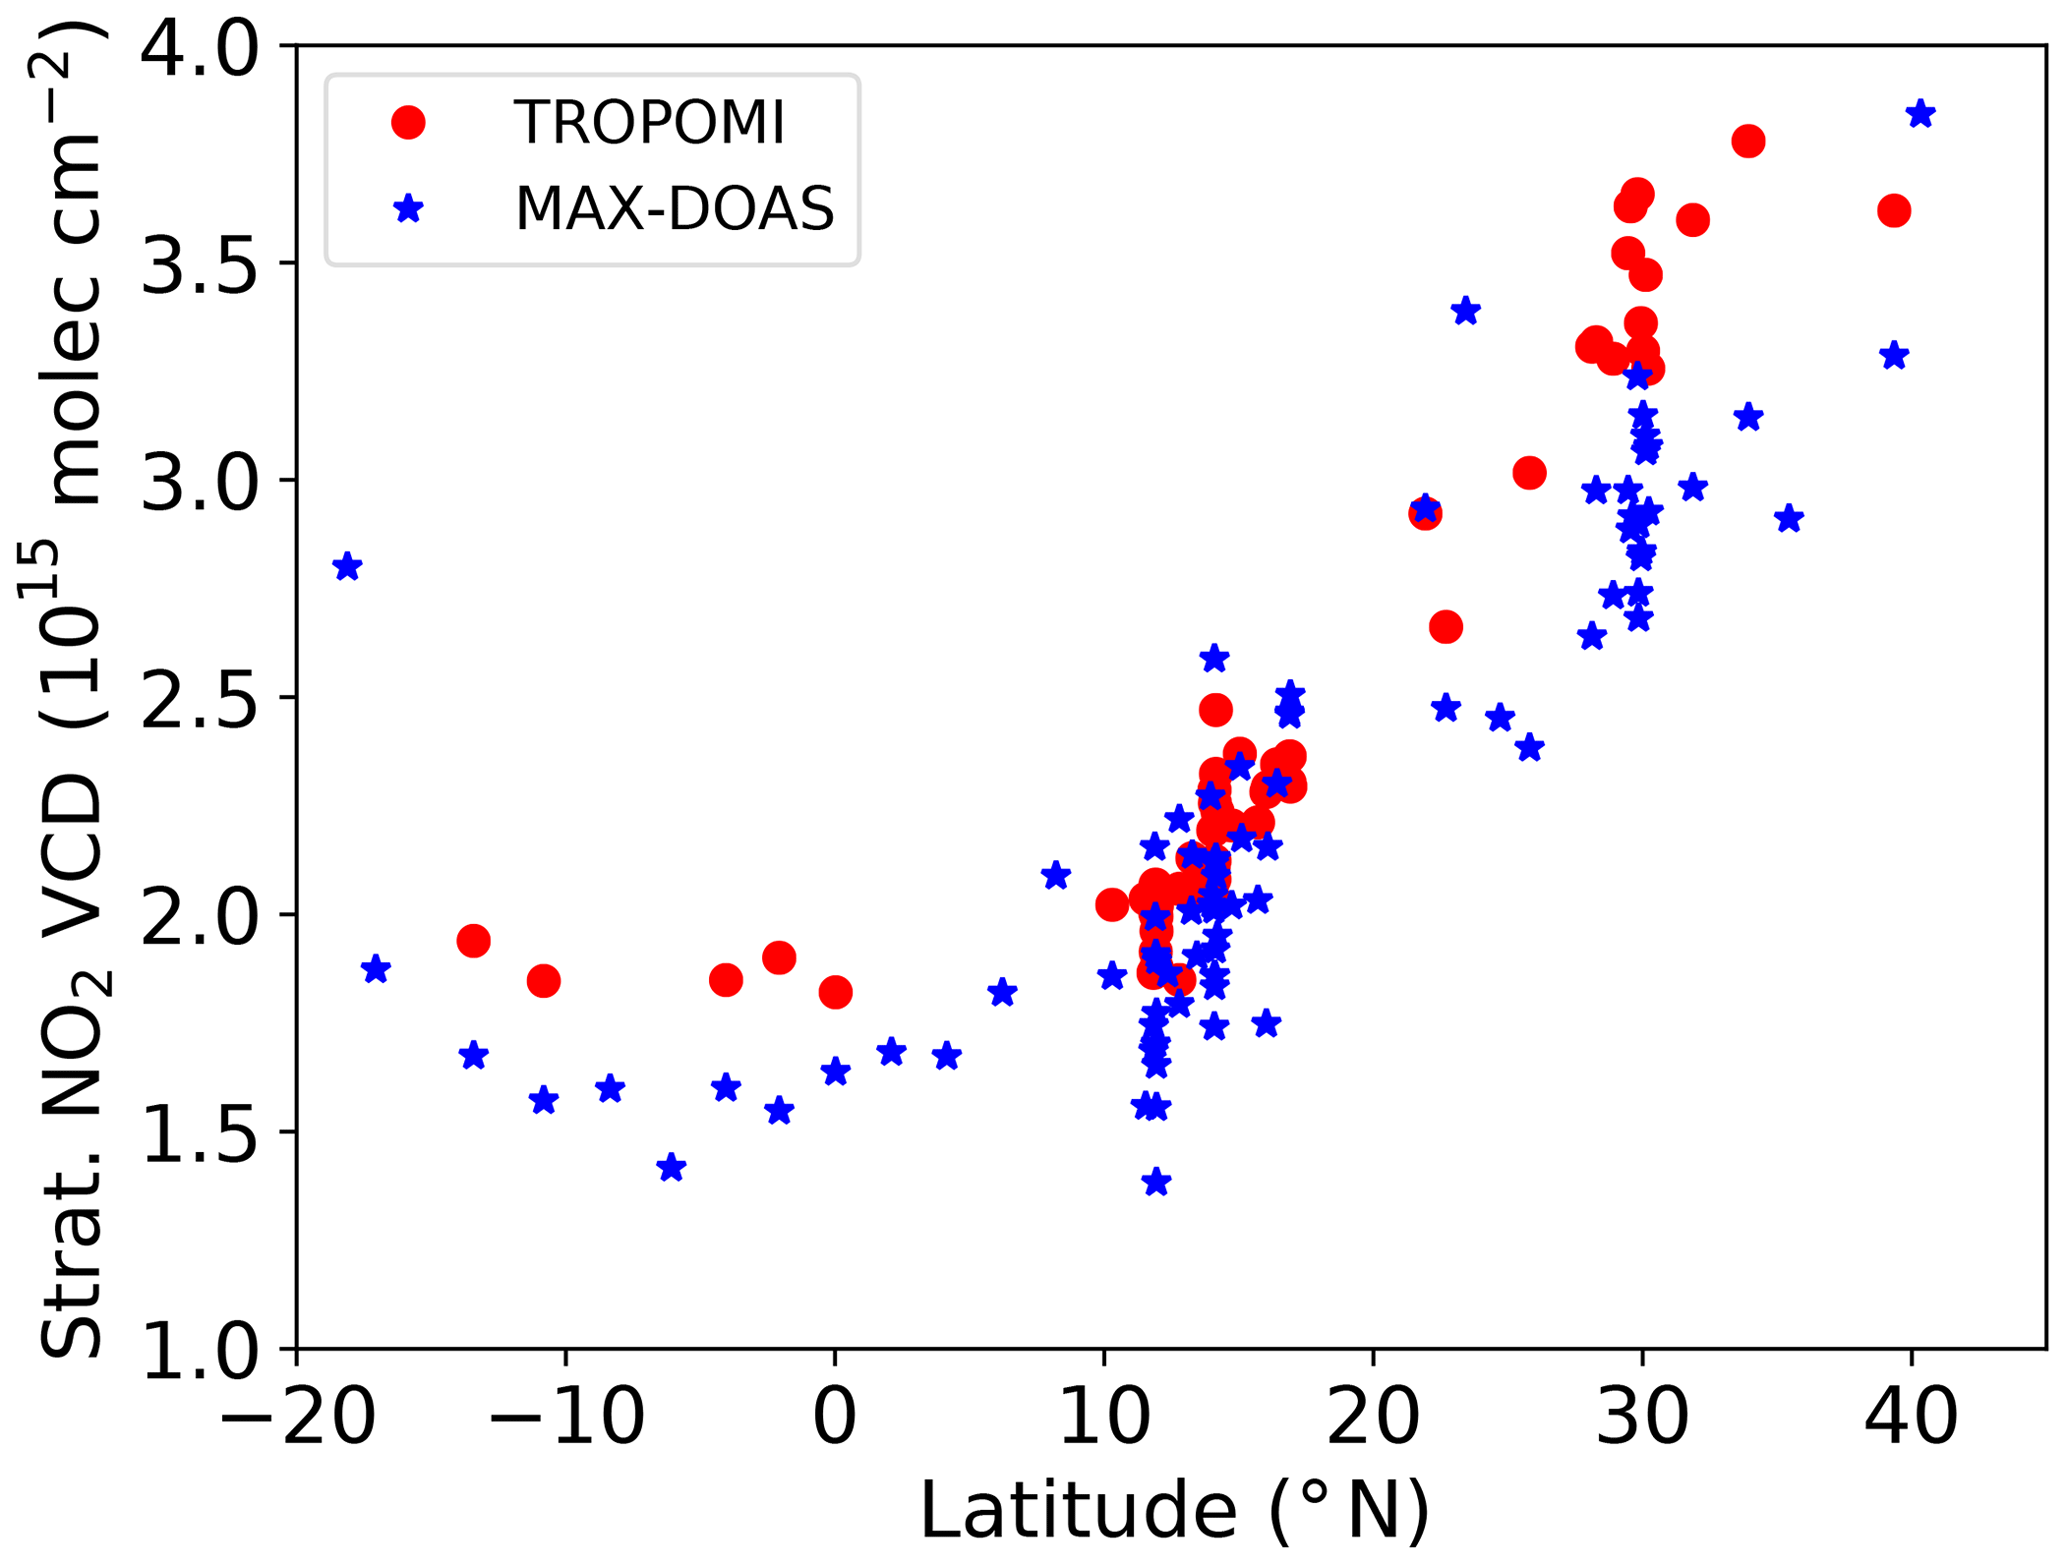
Figure 9TROPOMI and MAX-DOAS stratospheric NO2 vertical column densities as a function of latitude. Same data as in Fig. 7.
The MAX-DOAS and TROPOMI stratospheric NO2 VCDs for all cruises are shown as a function of latitude in Fig. 9. Both data sets illustrate the latitudinal dependency of the stratospheric NO2 VCDs, with low values in tropical region (20∘ S to 10∘ N) and higher values at mid-latitudes (10–40∘ N). Note that the MAX-DOAS data were taken during four cruises in different months and not in a single cruise. The latitudinal dependency is well-known in satellite stratospheric NO2 VCD data (Belmonte-Rivas et al., 2014). In the tropics the low stratospheric NO2 VCDs are caused by upward and poleward transport in the Hadley cell (Noxon, 1979).
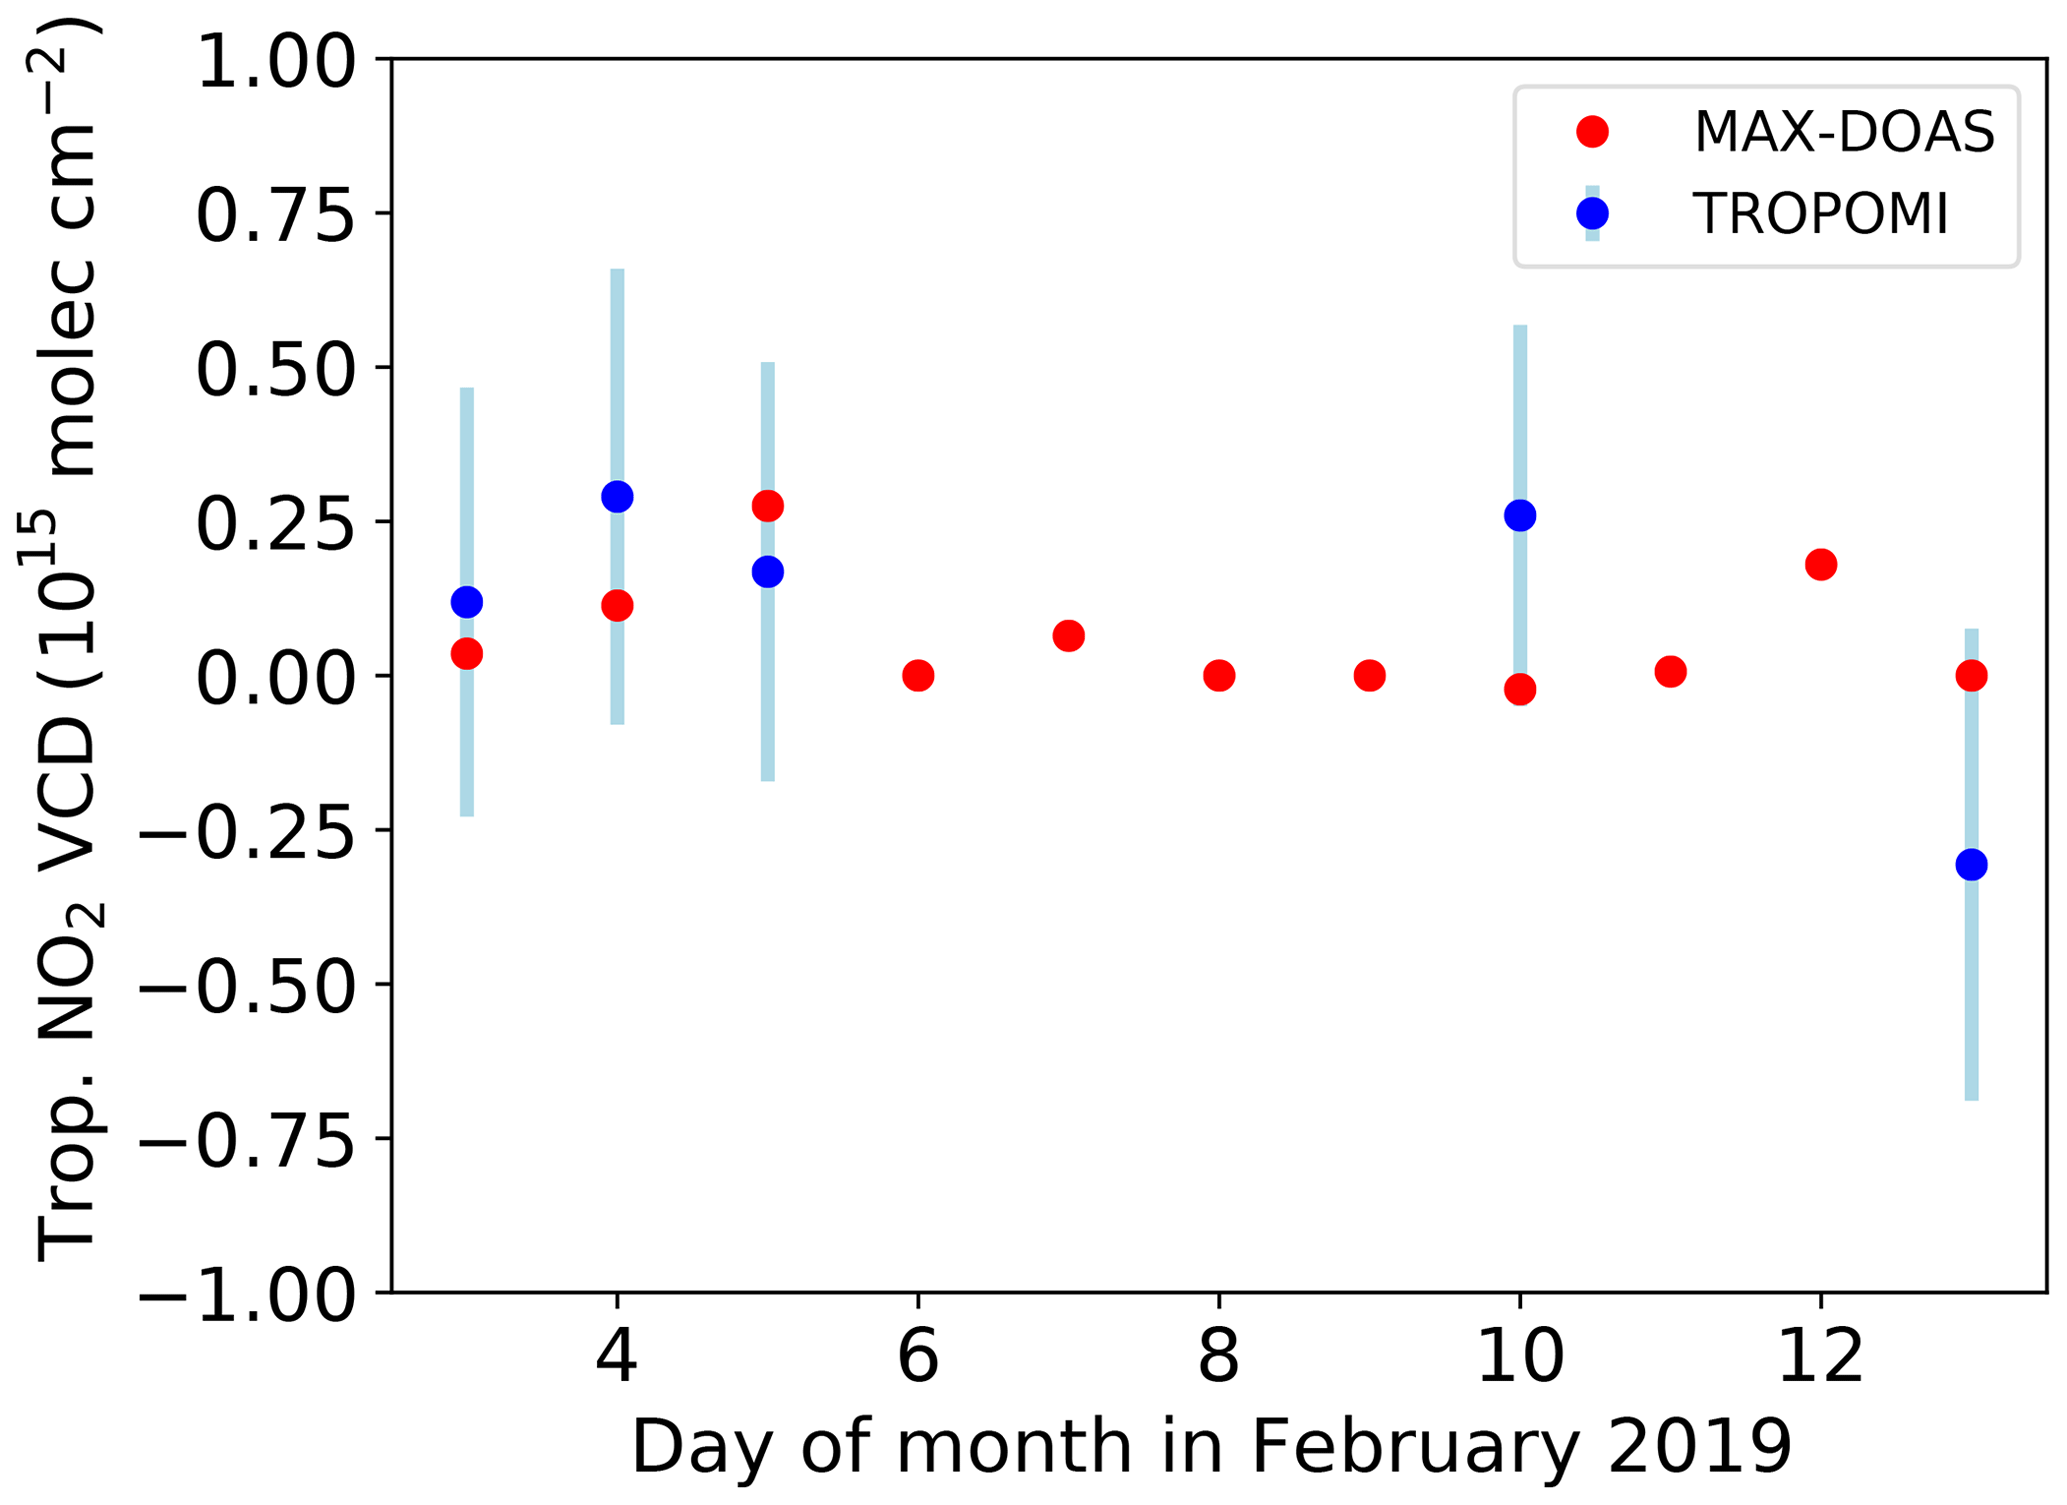
Figure 10Time series of TROPOMI (blue) and collocated MAX-DOAS (red) tropospheric NO2 vertical column densities for the cruise in February 2019. The missing TROPOMI data are due to clouds. The error bar shows the precision of the TROPOMI tropospheric NO2 VCD.
4.4.2 Tropospheric NO2
The tropospheric NO2 VCDs for the cruise in February 2019 across the Pacific is shown in Fig. 10. There are no anomalous high tropospheric NO2 VCDs during this cruise. As shown in the figure, most MAX-DOAS tropospheric NO2 VCDs are close to zero. The TROPOMI tropospheric NO2 VCDs are also very low, 7×10¹⁴ molec cm−2, with large error bars because of the low NO2 concentrations (van Geffen et al., 2019).
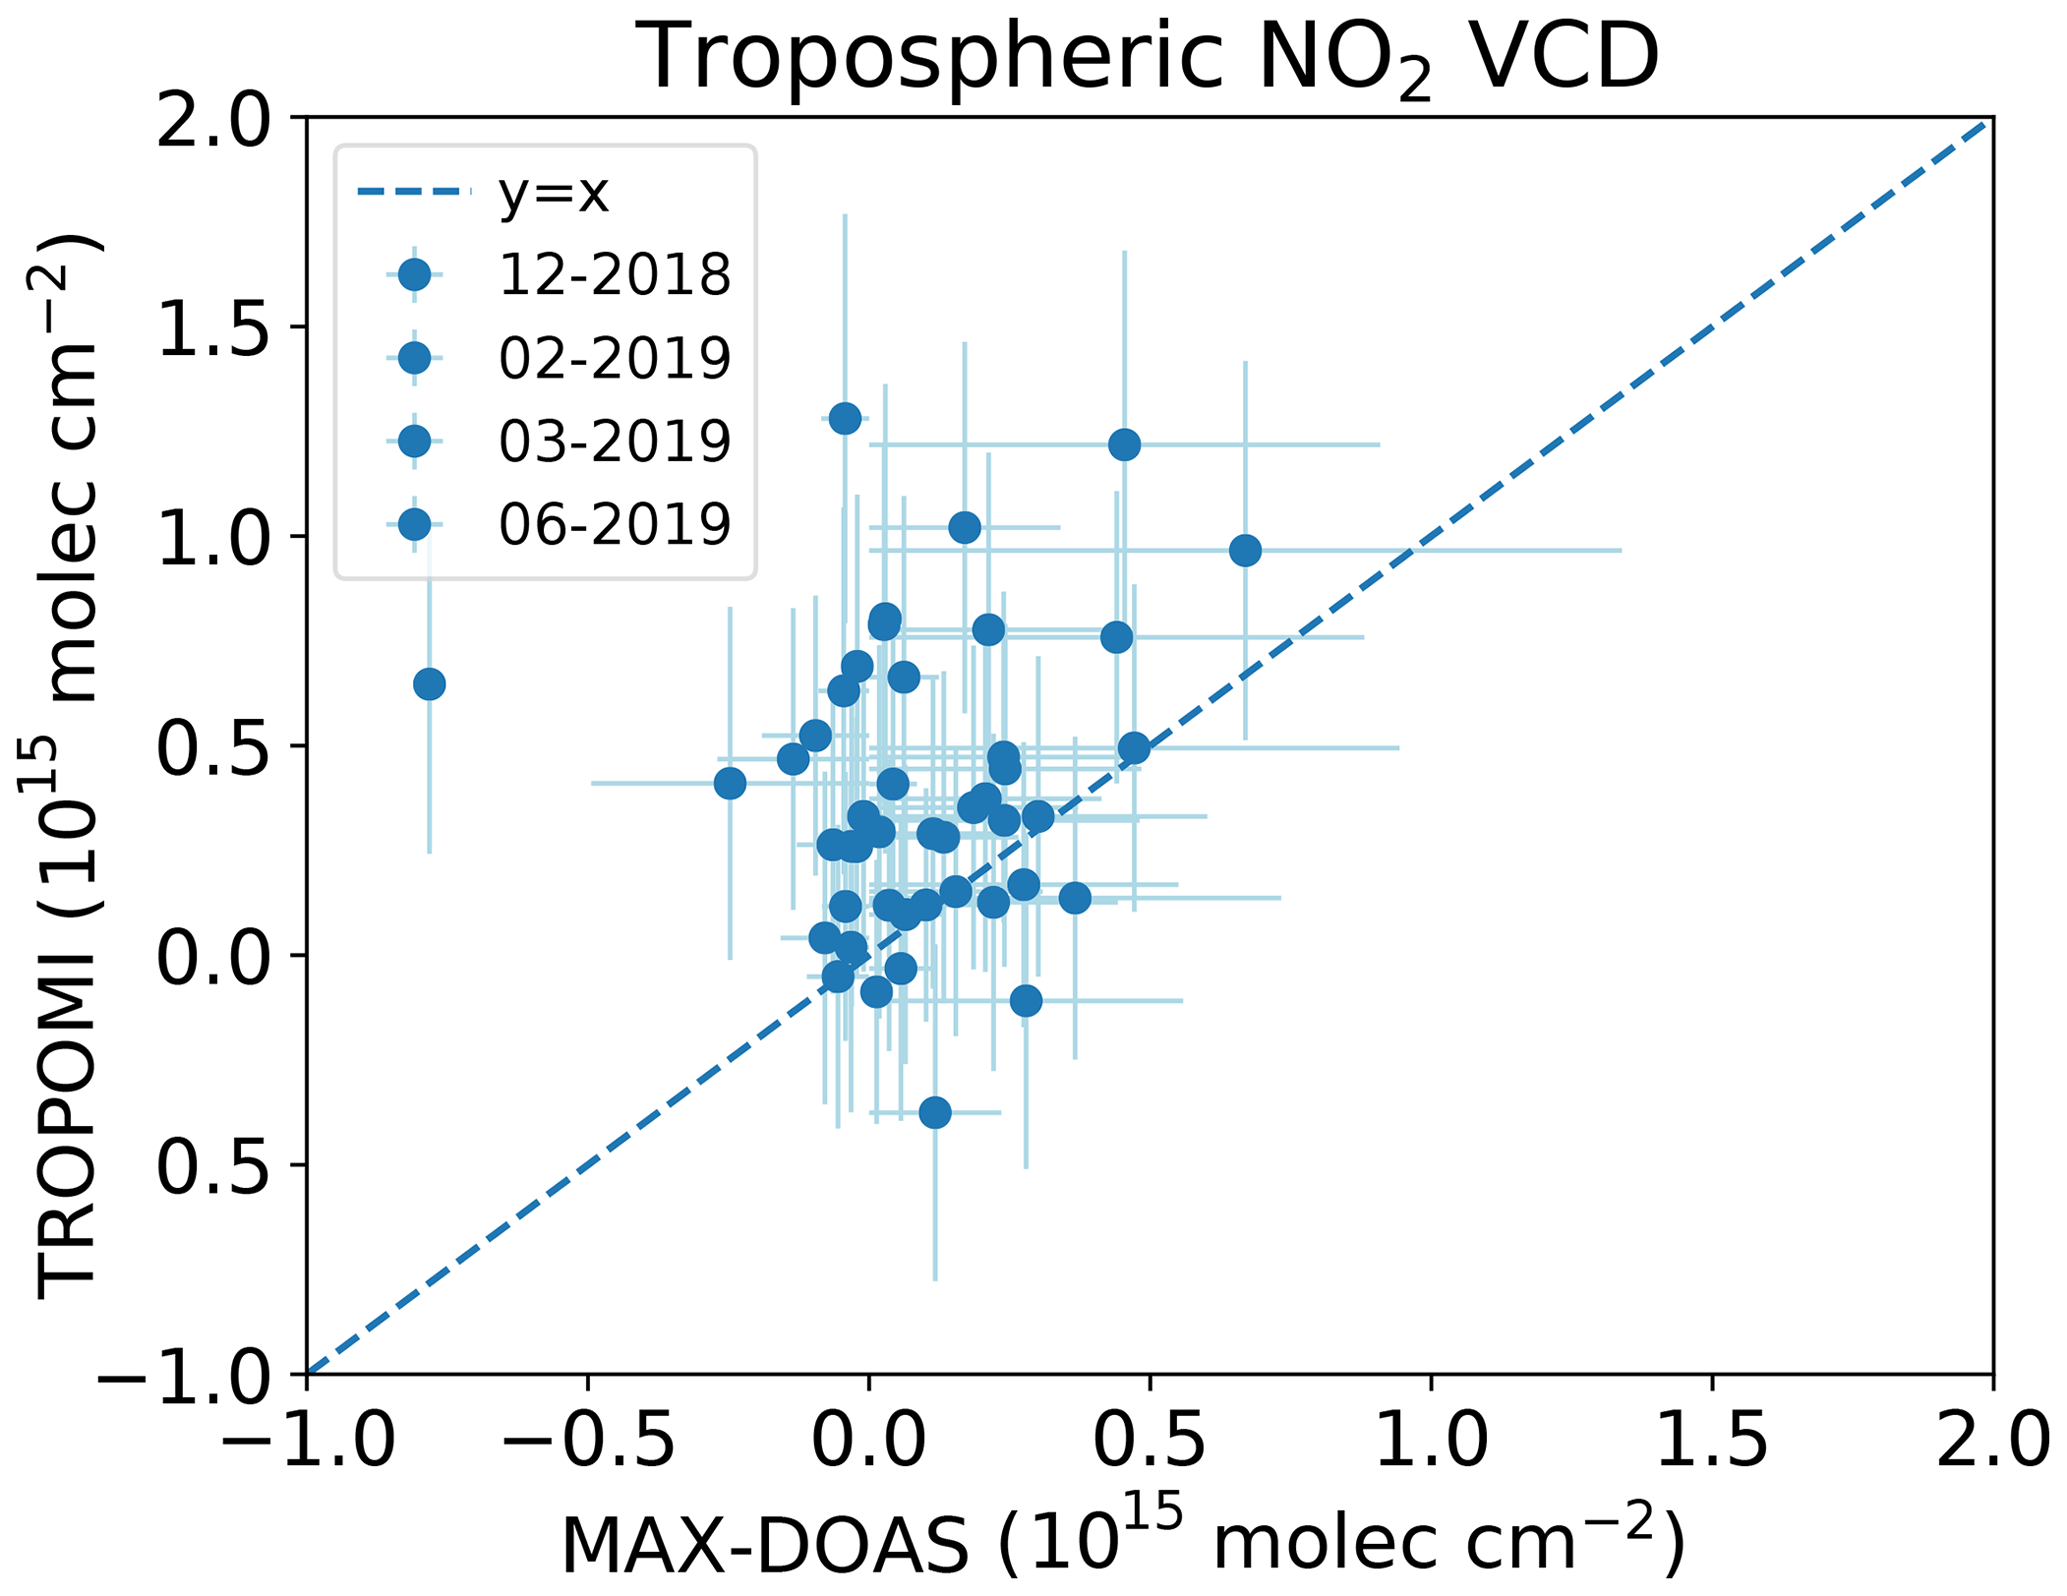
Figure 11Scatter plot of TROPOMI tropospheric NO2 vertical column densities versus MAX-DOAS tropospheric NO2 vertical column densities for all cruises. The MAX-DOAS measurements are taken from the collocated TROPOMI pixels. The vertical error bar shows the precision of the TROPOMI data; the horizontal error bar shows the uncertainty of the MAX-DOAS data.
Figure 11 shows the scatter plot of TROPOMI tropospheric NO2 VCD versus MAX-DOAS tropospheric NO2 VCD at the closest overpass time. The vertical error bar is the uncertainty of the TROPOMI tropospheric NO2 VCD, which is taken from the TROPOMI data. The horizontal error bar is for the MAX-DOAS tropospheric NO2 VCD, which is assumed to be 100 % of the NO2 VCD. We can see that the MAX-DOAS and TROPOMI data both show low tropospheric NO2 during these cruises. The TROPOMI and MAX-DOAS tropospheric NO2 VCDs are in the same range, and most of the points are between 0 and 5×10¹⁴ molec cm−2. Because of very low tropospheric NO2, there is almost no correlation between the tropospheric NO2 VCDs. The mean difference and standard deviation are 4.00×10¹⁴ and 5.08×10¹⁴ molec cm−2, respectively.
The negative values in the MAX-DOAS tropospheric NO2 are mostly due to the low NO2 values and the detection limit of the MAX-DOAS. The negative tropospheric NO2 VCD values may also be caused by the clouds in the reference spectrum but not in the off-axis spectrum. The smallest root-mean-square error in the DOAS fit for tropospheric NO2 is . The NO2 cross section is about cm2 molec−1. If we assume that twice the root mean square can be detected, the detection limit for the slant column density is 2.4×10¹⁵ molec cm−2. The AMF for the 15∘ elevation angle is about 2.2, hence the detection limit for the vertical column density is 1.1×10¹⁵ molec cm−2. This estimation of the detection limit is similar to that used by Peters et al. (2012). They proposed this value as an upper limit, the actual detection limit can be lower than this. During the cruises, tropospheric NO2 slant column densities larger than 2.4×10¹⁵ molec cm−2 were rarely detected.
4.5 Discussion
Because the reference spectra were measured by the MAX-DOAS during the cruises, there was background NO2 absorption in the reference spectra. The NO2 VCD in the reference spectrum was estimated using the collocated OMI/QA4ECV NO2 VCD, which may cause an uncertainty (offset) in the MAX-DOAS stratospheric NO2 VCDs. Zara et al. (2018) reported that the uncertainty of the OMI NO2 SCD in remote ocean regions was about 8×10¹⁴ molec cm−2. The uncertainty of the NO2 VCD in the reference spectrum is estimated to be 4×10¹⁴ molec cm−2 because the AMF is about 2 at noon. The NO2 VCD in the reference spectrum has a larger impact on the stratospheric NO2 VCD at the TROPOMI overpass time, e.g. in the comparison of MAX-DOAS NO2 VCD with TROPOMI at the collocated pixels. Since the same reference spectrum is used for the MAX-DOAS analysis, the impact of the reference spectrum on the MAX-DOAS stratospheric NO2 VCD is the same for all trips. The NO2 in the reference spectrum has less impact on the MAX-DOAS stratospheric NO2 VCD at the SZA range of 75–89∘ because the mean AMF in this SZA range is about 7 times the AMFs of the reference spectrum (due to the long light path at large SZAs).
Neglecting the NO2 photodissociation may lead to 10 % uncertainty in the AMFs at twilight because of the change of the NO2 profiles (Van Roozendael and Hendrick, 2012). Since we only used the measurements at SZA smaller than 89∘, the impact from the photodissociation may be smaller in our analysis. We have calculated the stratospheric NO2 AMFs using a range of NO2 profiles from the TM5 output. The AMFs for the stratospheric NO2 are very similar and the differences are within 5 %.
In the DOAS fit, the uncertainty of the MAX-DOAS stratospheric NO2 slant column densities is about 0.5×10¹⁴ molec cm−2 at SZA of 20∘ and increases to 1×10¹⁴ molec cm−2 at SZA of 80∘. These uncertainties are given in the output of our DOAS fit program. The uncertainty of the NO2 VCD in the reference spectra is about 4×10¹⁴ molec cm−2 based on the OMI data. The stratospheric NO2 AMFs are about 1.2 and 5.5 at 20 and 80∘ of the SZA, with an uncertainty of 10 %. Using the uncertainty estimation method presented by Tack et al. (2015), in total we estimate that the uncertainty of the stratospheric NO2 VCD is about 4×10¹⁴ molec cm−2 and 1×10¹⁴ molec cm−2 at SZA of 20 and 80∘, respectively.
For the tropospheric NO2 VCDs, assuming an AMF of 2.0 with an uncertainty of 10 %, the uncertainty of the tropospheric NO2 VCD is estimated to be 2.1×10¹⁴ molec cm−2. However, Bais et al. (2016) recommended that the NO2 differential AMF uncertainties to be used for MAX-DOAS at 15 and 30∘ elevations are 41 % and 22 %, respectively. In reality the uncertainty of the MAX-DOAS tropospheric NO2 VCDs is larger than the values given here.
The comparison of MAX-DOAS and TROPOMI stratospheric NO2 VCDs has also been analysed using averaged TROPOMI data over 3×3 and 5×5 ground pixels around the collocated pixels. The mean differences between TROPOMI and MAX-DOAS stratospheric NO2 VCDs are 4.34, 4.57, and 4.55 ×10¹⁴ molec cm−2 for 1, 3×3, and 5×5 pixels, respectively. The best agreement between the TROPOMI and MAX-DOAS stratospheric NO2 VCDs occurs for the single-pixel cases presented in this paper.
The comparisons of TROPOMI stratospheric NO2 VCDs with MAX-DOAS-collocated stratospheric NO2 VCD and with the TM5-MP-interpolated stratospheric NO2 VCDs show consistent results: TROPOMI stratospheric NO2 VCDs are higher than the other two products. The TROPOMI stratospheric NO2 VCDs have good linear correlation with the MAX-DOAS-collocated and TM5-interpolated stratospheric NO2 VCDs. The linear fit of the TROPOMI stratospheric NO2 VCDs and MAX-DOAS-collocated stratospheric NO2 VCDs or TM5-interpolated stratospheric NO2 VCDs have similar slopes and offsets.
The differences between the MAX-DOAS and TROPOMI NO2 VCDs do not depend on the cloud radiance fraction. The MAX-DOAS tropospheric NO2 VCDs are close to the detection limit. The negative values can also be due to clouds observed in the 90∘ elevation angle but not in the off-axis elevation angle. These MAX-DOAS tropospheric NO2 VCDs provide an evaluation of the lowest TROPOMI tropospheric NO2 values; such clean cases are not easily observed over land.
Similar to Peters et al. (2012) and Behrens et al. (2019), we also measured the latitude-dependent shape of stratospheric NO2 VCDs. Because the TROPOMI overpass time is close to noon, we cannot use the morning or evening MAX-DOAS values to compare with TROPOMI data directly. The morning and evening MAX-DOAS NO2 were calculated from the SZA of 88 to 92∘ by Peters et al. (2012) and Behrens et al. (2019). We used the NO2 VCDs up to a solar zenith angle of 89∘. Peters et al. (2012) reported that the tropospheric NO2 VCDs were only above the detection limit when there were ship emissions or they were close to land. This agrees with our tropospheric NO2 measurements, although we do not have measurements close to land.
We have presented MAX-DOAS measurements during five cruises from 2017 to 2019, covering a large latitude and longitude range in both summer and winter. The MAX-DOAS measurements have been compared with TROPOMI stratospheric and tropospheric NO2 vertical column densities. Since the TM5-MP model is used in the TROPOMI retrievals, we also compared MAX-DOAS NO2 VCDs with the TM5-MP simulations. It turns out that TROPOMI stratospheric NO2 vertical column densities have a good linear correlation with MAX-DOAS stratospheric NO2 vertical column densities. Compared to the MAX-DOAS measurements, TROPOMI has a small positive bias of 2.4 to 4.3×10¹⁴ molec cm−2 (10 %–20 %), with an uncertainty of 2×10¹⁴ molec cm−2. The uncertainty of MAX-DOAS stratospheric NO2 vertical column densities is estimated to be 1 to 4×10¹⁴ molec cm−2.
Because the cruises were mostly in remote ocean areas, the MAX-DOAS tropospheric NO2 values were quite low, often close to 0 or slightly negative, as a result of a low detection limit or the impact of clouds. The mean of the collocated TROPOMI tropospheric NO2 VCDs is 4.7×10¹⁴ molec cm−2. The mean difference between TROPOMI and MAX-DOAS NO2 VCDs is 4.0×10¹⁴ molec cm−2 with a standard deviation of 5.1×10¹⁴ molec cm−2. The uncertainty of MAX-DOAS tropospheric NO2 vertical column densities is about 2×10¹⁴ molec cm−2. We can confirm that both TROPOMI and MAX-DOAS measured very low tropospheric NO2 VCDs over clean oceans.
MAX-DOAS data are available from the authors, and TROPOMI data are available from the S5P Pre-Operations Data Hub (https://s5phub.copernicus.eu/dhus, last access: 23 March 2020).
PW performed the MAX-DOAS measurements on RV Sonne, analysed the MAX-DOAS data, and wrote the manuscript. AP prepared the MAX-DOAS instruments and the software for measurement and data analysis and helped with the measurements. OT performed the MAX-DOAS measurements on RV Maria S. Merian. SK performed Microtops measurements. JvG selected the collocated TROPOMI data. PS contributed to the organization of the campaigns. All co-authors contributed to the text of the paper and to the discussion.
The authors declare that they have no conflict of interest.
This article is part of the special issue “TROPOMI on Sentinel-5 Precursor: first year in operation (AMT/ACPT inter-journal SI)”. It is not associated with a conference.
We would like to thank Stefan Kinne (MPI-M) for the organization of the cruises and the Microtops measurements and Thomas Rutz (FU-Berlin) for taking care of the MAX-DOAS instrument during the cruise in June 2019. We appreciate Henk Eskes (KNMI) for the discussions about the TM5-MP data. We also want to thank the captains and crews of the German research vessels RV Sonne and RV Maria S. Merian for their hospitality and support. The support of the Leitstelle Deutsche Forschungsschiffe (German Research Fleet Coordination Centre) at the University of Hamburg was highly appreciated. The cruises were sponsored and funded by the DFG and BMBF in Germany.
This research has been supported by the BMBF (grant nos. 03G0267TC and 03G0268TD).
This paper was edited by Ben Veihelmann and reviewed by two anonymous referees.
Alliwell, S. R., Van Roozendael, M., Johnston, P. V., Richter, A., Wagner, T., Arlander, D. W., Burrows, J. P., Fish, D. J., Jones, R. L., Karlsen Tørnkvist, K., Lambert, J.-C., Pfeilsticker, K., and Pundt, I.: Analysis for BrO in zenith-sky spectra – an intercomparison exercise for analysis improvement, J. Geophys. Res., 107, 4199, https://doi.org/10.1029/2001JD000329, 2002. a
Anderson, G. P., Clough, S. A., Kneizys, F. X., Chetwynd, J. H., Shettle, E. P.: AFGL Atmospheric Constituent Profiles, Technical report, Air Force Geophysics Laboratory, Hanscom AFB, MA, aFGL–TR–86–0110, 1986. a
Bais, A., Dils, B., Gielen, C., Hendrick, F., Pinardi, G., Peters, E., Piters, A., Remmers, J., Richter, A., Wagner, T., Wang, S., and Wang, Y.: Quality indicators on uncertainties and representativity of atmospheric reference data, QA4ECV Report/Deliverable no. D3.9 version 1.0, available at: http://www.qa4ecv.eu/sites/default/files/D3.9.pdf (last access: 23 March 2020), 2016. a
Behrens, L. K., Hilboll, A., Richter, A., Peters, E., Alvarado, L. M. A., Kalisz Hedegaard, A. B., Wittrock, F., Burrows, J. P., and Vrekoussis, M.: Detection of outflow of formaldehyde and glyoxal from the African continent to the Atlantic Ocean with a MAX-DOAS instrument, Atmos. Chem. Phys., 19, 10257–10278, https://doi.org/10.5194/acp-19-10257-2019, 2019. a, b, c, d
Beirle, S., Hörmann, C., Jöckel, P., Liu, S., Penning de Vries, M., Pozzer, A., Sihler, H., Valks, P., and Wagner, T.: The STRatospheric Estimation Algorithm from Mainz (STREAM): estimating stratospheric NO2 from nadir-viewing satellites by weighted convolution, Atmos. Meas. Tech., 9, 2753–2779, https://doi.org/10.5194/amt-9-2753-2016, 2016. a
Belmonte Rivas, M., Veefkind, P., Boersma, F., Levelt, P., Eskes, H., and Gille, J.: Intercomparison of daytime stratospheric NO2 satellite retrievals and model simulations, Atmos. Meas. Tech., 7, 2203–2225, https://doi.org/10.5194/amt-7-2203-2014, 2014. a, b, c
Boersma, K. F., Eskes, H. J., Veefkind, J. P., Brinksma, E. J., van der A, R. J., Sneep, M., van den Oord, G. H. J., Levelt, P. F., Stammes, P., Gleason, J. F., and Bucsela, E. J.: Near-real time retrieval of tropospheric NO2 from OMI, Atmos. Chem. Phys., 7, 2103–2118, https://doi.org/10.5194/acp-7-2103-2007, 2007. a
Boersma, K. F., Eskes, H. J., Dirksen, R. J., van der A, R. J., Veefkind, J. P., Stammes, P., Huijnen, V., Kleipool, Q. L., Sneep, M., Claas, J., Leitão, J., Richter, A., Zhou, Y., and Brunner, D.: An improved tropospheric NO2 column retrieval algorithm for the Ozone Monitoring Instrument, Atmos. Meas. Tech., 4, 1905–1928, https://doi.org/10.5194/amt-4-1905-2011, 2011. a
Boersma, K. F., Eskes, H. J., Richter, A., De Smedt, I., Lorente, A., Beirle, S., van Geffen, J. H. G. M., Zara, M., Peters, E., Van Roozendael, M., Wagner, T., Maasakkers, J. D., van der A, R. J., Nightingale, J., De Rudder, A., Irie, H., Pinardi, G., Lambert, J.-C., and Compernolle, S. C.: Improving algorithms and uncertainty estimates for satellite NO2 retrievals: results from the quality assurance for the essential climate variables (QA4ECV) project, Atmos. Meas. Tech., 11, 6651–6678, https://doi.org/10.5194/amt-11-6651-2018, 2018. a, b
Bogumil, K., Orphal, J., Homann, T., Voigt, S., Spietz, P., Fleischmann, O. C., Vogel, A., Hartmann, M., Kromminga, H., Bovensmann, H., Frerick, J., and Burrows, J. P.: Measurements of Molecular Absorption Spectra with the SCIAMACHY PreFlight Model: Instrument Characterization and Reference Data for Atmospheric Remote-Sensing in the 230–2380 nm Region, J. Photochem. Photobiol. A., 157, 167–184, 2003. a
Bovensmann, H., Burrows, J. P., Buchwitz, M., Frerick, J., Noel, S., Rozanov, V. V., Chance, K. V., and Goede, A. P. H.: SCIAMACHY: mission objectives and measurement modes, J. Atmos. Sci., 56, 127–150, 1999. a
Bucsela, E. J., Celarier, E. A., Wenig, M. O., Gleason, J. F., Veefkind, J. P., Boersma, K. F., and Brinksma, E. J.: Algorithm for NO2 vertical column retrieval from the ozone monitoring instrument, IEEE T. Geosci. Rem. Sens., 44, 1245–1258, 2006. a
Burrows, J. P., Weber, M., Buchwitz, M., Rozanov, V., Ladstätter-Weißenmayer, A., Richter, A., Debeek, R., Hoogen, R., Bramstedt, K., Eichmann, K.-U., Eisinger, M., and Perner, D.: The Global Ozone Monitoring Experiment (GOME): Mission concept and first results, J. Atmos. Sci., 56, 151–175, 1999. a
Crutzen, P. J.: The influence of nitrogen oxides on the atmospheric ozone content, Q. J. Roy. Meteor. Soc., 96, 320–325, 1970. a
De Haan, J. F., Bosma, P. B., and Hovenier, J. W.: The adding method for multiple scattering calculations of polarized light, Astron. Astrophys., 183, 371–391, 1987. a
Dirksen, R. J., Boersma, K. F., Eskes, H. J., Ionov, D. V., Bucsela, E. J., Levelt, P. F., and Kelder, H. M.: Evaluation of stratospheric NO2 retrieved from the Ozone Monitoring Instrument: Intercomparison, diurnal cycle, and trending, J. Geophys. Res., 116, D08305, https://doi.org/10.1029/2010JD014943, 2011. a
Griffin, D., Zhao, X., McLinden, C. A., Boersma, F., Bourassa, A., Dammers, E., Degenstein, D., Eskes, H., Fehr, L., Fioletov, V., Hayden, K., Kharol, S. K., Li, S. M., Makar, P., Martin, R. V., Mihele, C., Mittermeier, R. L., Krotkov, N., Sneep, M., Lamsal, L. N., ter Linden, M., van Geffen, J., Veefkind, P., and Wolde, M.: High Resolution Mapping of Nitrogen Dioxide With TROPOMI: First Results and Validation Over the Canadian Oil Sands, Geophys. Res. Lett., 46, 1049–1060, https://doi.org/10.1029/2018GL081095, 2019. a
Hermans, C., Vandaele, A. C., Coquart, B., Jenouvrier, A., and Merienne, M. F.: Absorption Bands of O2 and its Collision Induced Absorption Bands in the 3000–7500 cm−1 Wavenumber Region, in: Proceedings of the International Radiation Symposium, St. Petesberg, Rusia, 24–29 July 2000, edited by: Smith, W. L. and Timofeyev, Y. M., pp. 639–642, A. Deepak, Hampton, Va, 2001. a
Huijnen, V., Williams, J., van Weele, M., van Noije, T., Krol, M., Dentener, F., Segers, A., Houweling, S., Peters, W., de Laat, J., Boersma, F., Bergamaschi, P., van Velthoven, P., Le Sager, P., Eskes, H., Alkemade, F., Scheele, R., Nédélec, P., and Pätz, H.-W.: The global chemistry transport model TM5: description and evaluation of the tropospheric chemistry version 3.0, Geosci. Model Dev., 3, 445–473, https://doi.org/10.5194/gmd-3-445-2010, 2010. a
Ialongo, I., Virta, H., Eskes, H., Hovila, J., and Douros, J.: Comparison of TROPOMI/Sentinel-5 Precursor NO2 observations with ground-based measurements in Helsinki, Atmos. Meas. Tech., 13, 205–218, https://doi.org/10.5194/amt-13-205-2020, 2020. a
Johnston, H.: Reduction of stratospheric ozone by nitrogen oxide catalysts from supersonic transport exhaust, Science, 173, 517–522, 1971. a
Kreher, K., Van Roozendael, M., Hendrick, F., Apituley, A., Dimitropoulou, E., Frieß, U., Richter, A., Wagner, T., Abuhassan, N., Ang, L., Anguas, M., Bais, A., Benavent, N., Bösch, T., Bognar, K., Borovski, A., Bruchkouski, I., Cede, A., Chan, K. L., Donner, S., Drosoglou, T., Fayt, C., Finkenzeller, H., Garcia-Nieto, D., Gielen, C., Gómez-Martín, L., Hao, N., Herman, J. R., Hermans, C., Hoque, S., Irie, H., Jin, J., Johnston, P., Khayyam Butt, J., Khokhar, F., Koenig, T. K., Kuhn, J., Kumar, V., Lampel, J., Liu, C., Ma, J., Merlaud, A., Mishra, A. K., Müller, M., Navarro-Comas, M., Ostendorf, M., Pazmino, A., Peters, E., Pinardi, G., Pinharanda, M., Piters, A., Platt, U., Postylyakov, O., Prados-Roman, C., Puentedura, O., Querel, R., Saiz-Lopez, A., Schönhardt, A., Schreier, S. F., Seyler, A., Sinha, V., Spinei, E., Strong, K., Tack, F., Tian, X., Tiefengraber, M., Tirpitz, J.-L., van Gent, J., Volkamer, R., Vrekoussis, M., Wang, S., Wang, Z., Wenig, M., Wittrock, F., Xie, P. H., Xu, J., Yela, M., Zhang, C., and Zhao, X.: Intercomparison of NO2, O4, O3 and HCHO slant column measurements by MAX-DOAS and zenith-sky UV-Visible spectrometers during the CINDI-2 campaign, Atmos. Meas. Tech. Discuss., https://doi.org/10.5194/amt-2019-157, in review, 2019. a, b
Krüger, K. and Quack, B.: Introduction to special issue: the TransBrom Sonne expedition in the tropical West Pacific, Atmos. Chem. Phys., 13, 9439–9446, https://doi.org/10.5194/acp-13-9439-2013, 2013. a
Kurucz, R. L., Furenlid, I., and Testerman, L.: Solar Flux Atlas from 296 to 1300 nm, Technical Report, National Solar Observatory, Sunspot, New Mexico, 1984. a
Levelt, P. F., van den Oord, G. H. J., Dobber, M. R., Mälkki, A., Visser, H., de Vries, J., Stammes, P., Lundell, J. O. V., and Saari, H.: The Ozone Monitoring Instrument. IEEE T. Geosci. Remote Sens., 44, 1093–1101, 2006. a
Munro, R., Eisinger, M., Anderson, C., Callies, J., Corpaccioli, E., Lang, R., Lefebvre, A., Livschitz, Y., and Albinana, A. P.: GOME-2 on MetOp. In Proceedings of the Atmospheric Science Conference 2006, SP 628, ESA, ESA, Paris, 2006. a
Murphy, D. M., Fahey, D. W., Proffitt, M. H., Liu, S. C., Chan, K. R., Eubank, C. S., Kawa, S. R., and Kelly, K. K.: Reactive nitrogen and its correlation with ozone in the lower stratosphere and upper troposphere, J. Geophys. Res., 98, 8751–8773, 1993. a
Noxon, J. F.: Stratospheric NO2: global behavior, J. Geophys. Res., 84, 5067–5076, https://doi.org/10.1029/JC084iC08p05067, 1979. a
Peters, E., Wittrock, F., Großmann, K., Frieß, U., Richter, A., and Burrows, J. P.: Formaldehyde and nitrogen dioxide over the remote western Pacific Ocean: SCIAMACHY and GOME-2 validation using ship-based MAX-DOAS observations, Atmos. Chem. Phys., 12, 11179–11197, https://doi.org/10.5194/acp-12-11179-2012, 2012. a, b, c, d, e, f
Piters, A. J. M., Boersma, K. F., Kroon, M., Hains, J. C., Van Roozendael, M., Wittrock, F., Abuhassan, N., Adams, C., Akrami, M., Allaart, M. A. F., Apituley, A., Beirle, S., Bergwerff, J. B., Berkhout, A. J. C., Brunner, D., Cede, A., Chong, J., Clémer, K., Fayt, C., Frieß, U., Gast, L. F. L., Gil-Ojeda, M., Goutail, F., Graves, R., Griesfeller, A., Großmann, K., Hemerijckx, G., Hendrick, F., Henzing, B., Herman, J., Hermans, C., Hoexum, M., van der Hoff, G. R., Irie, H., Johnston, P. V., Kanaya, Y., Kim, Y. J., Klein Baltink, H., Kreher, K., de Leeuw, G., Leigh, R., Merlaud, A., Moerman, M. M., Monks, P. S., Mount, G. H., Navarro-Comas, M., Oetjen, H., Pazmino, A., Perez-Camacho, M., Peters, E., du Piesanie, A., Pinardi, G., Puentedura, O., Richter, A., Roscoe, H. K., Schönhardt, A., Schwarzenbach, B., Shaiganfar, R., Sluis, W., Spinei, E., Stolk, A. P., Strong, K., Swart, D. P. J., Takashima, H., Vlemmix, T., Vrekoussis, M., Wagner, T., Whyte, C., Wilson, K. M., Yela, M., Yilmaz, S., Zieger, P., and Zhou, Y.: The Cabauw Intercomparison campaign for Nitrogen Dioxide measuring Instruments (CINDI): design, execution, and early results, Atmos. Meas. Tech., 5, 457–485, https://doi.org/10.5194/amt-5-457-2012, 2012. a
Platt, U. and Stutz, Z.: Differential Optical Absorption Spectroscopy, Principles and Applications, Springer, Heidelberg, Germany, 2008. a, b
Richter, A. and Burrows, J. P.: Tropospheric NO2 from GOME measure- ments, Adv. Space Res., 29, 1673–1683, 2002. a
Rothman, L. S., Gordon, I. E., Barber, R. J., Dothe, H., Gamache, R. R., Goldman, A., Perevalov, V., Tashkun, S. A., and Tennyson, J.: HITEMP, the high-temperature molecular spectroscopic database, J. Quant. Spectrosc. Ra., 111, 2139–2150, https://doi.org/10.1016/j.jqsrt.2010.05.001, 2010. a
Schreier, S. F., Peters, E., Richter, A., Lampel, J., Wittrock, F., and Burrows, J. P.: Ship-based MAX-DOAS measurements of tropospheric NO2 and SO2 in the South China and Sulu Sea, Atmos. Environ., 102, 331–343, https://doi.org/10.1016/j.atmosenv.2014.12.015, 2015. a
Seinfeld, J. H. and Pandis, S. N.: Atmospheric Chemistry and Physics From Air Pollution to Climate Change (2nd Edition), John Wiley & Sons, 2006. a
Smirnov, A., Holben, B. N., Slutsker, I., Giles, D. M., McClain, C. R., Eck, T. F., Sakerin, S. M., Macke, A., Croot, P., Zibordi, G., Quinn, P. K., Sciare, J., Kinne, S., Harvey, M., Smyth, T. J., Piketh, S., Zielinski, T., Proshutinsky, A., Goes, J. I., Nelson, N. B., Larouche, P., Radionov, V. F., Goloub, P., Moorthy, K., Matar-rese, R., Robertson, E. J., and Jourdin, F.: Maritime Aerosol Network as a component of Aerosol Robotic Network, J. Geophys. Res., 114, D06204, https://doi.org/10.1029/2008JD011257, 2009. a
Stammes, P.: Spectral radiance modeling in the UV-visible range, in: IRS 2000: Current Problems in Atmospheric Radiation, edited by: Smith, W. and Timofeyev, Y., pp. 385–388, A. Deepak, Hampton, Va, 2001. a
Tack, F., Hendrick, F., Goutail, F., Fayt, C., Merlaud, A., Pinardi, G., Hermans, C., Pommereau, J.-P., and Van Roozendael, M.: Tropospheric nitrogen dioxide column retrieval from ground-based zenith–sky DOAS observations, Atmos. Meas. Tech., 8, 2417–2435, https://doi.org/10.5194/amt-8-2417-2015, 2015. a, b
Vandaele, A. C., Hermans, C., Simon, P. C., Carleer, M., Colin, R., Fally, S., Mérienne, M. F., Jenouvrier, A., and Coquart, B.: Measurements of the NO2 absorption cross-section from 42 000 cm−1 to 10 000 cm−1 (238–1000 nm) at 220 K and 294 K, J. Quant. Spectrosc. Ra., 59, 171–184, 1998. a, b
van Geffen, J. H. G. M., Eskes, H. J., Boersma, K. F., Maasakkers, J. D., and Veefkind, J. P.: TROPOMI ATBD of the total and tropospheric NO2 data products, S5P-KNMI-L2-0005-RP, CI-7430-ATBD, issue 1.4.0, 2019-02-06, 2019. a, b, c
Van Roozendael, F. and Hendrick, F.: Recommendations for NO2 column retrieval from NDACC zenith-sky UV-VIS spectrometers, version 4.0, available at: http://ndacc-uvvis-wg.aeronomie.be/tools/NDACC_UVVIS-WG_NO2settings_v4.pdf, (last access: 10 October 2019), 2012. a, b, c
Veefkind, J. P., Aben, I., McMullan, K., Förster, H., De Vries, J., Otter, G., Claas, J., Eskes, H. J., De Haan, J. F., Kleipool, Q., Van Weele, M., Hasekamp, O., Hoogeveen, R., Landgraf, J., Snel, R., Tol, P., Ingmann, P., Voors, R., Kruizinga, B., Vink, R., Visser, H., and Levelt, P. F.: TROPOMI on the ESA Sentinel-5 Precursor: A GMES mission for global observations of the atmospheric composition for climate, air quality and ozone layer applications, Remote Sens. Environ., 120, 70–83, 2012. a
Vlemmix, T., Piters, A. J. M., Stammes, P., Wang, P., and Levelt, P. F.: Retrieval of tropospheric NO2 using the MAX-DOAS method combined with relative intensity measurements for aerosol correction, Atmos. Meas. Tech., 3, 1287–1305, https://doi.org/10.5194/amt-3-1287-2010, 2010. a
Vlemmix, T., Eskes, H. J., Piters, A. J. M., Schaap, M., Sauter, F. J., Kelder, H., and Levelt, P. F.: MAX-DOAS tropospheric nitrogen dioxide column measurements compared with the Lotos-Euros air quality model, Atmos. Chem. Phys., 15, 1313–1330, https://doi.org/10.5194/acp-15-1313-2015, 2015. a
Williams, J. E., Boersma, K. F., Le Sager, P., and Verstraeten, W. W.: The high-resolution version of TM5-MP for optimized satellite retrievals: description and validation, Geosci. Model Dev., 10, 721–750, https://doi.org/10.5194/gmd-10-721-2017, 2017. a
Yang, K., Carn, S. A., Ge, C., Wang, J., and Dickerson, R. R.: Advancing measurements of tropospheric NO2 from space: New algorithm and first global results from OMPS, Geophys. Res. Lett., 41, 4777–4786, 2014. a
Zara, M., Boersma, K. F., De Smedt, I., Richter, A., Peters, E., van Geffen, J. H. G. M., Beirle, S., Wagner, T., Van Roozendael, M., Marchenko, S., Lamsal, L. N., and Eskes, H. J.: Improved slant column density retrieval of nitrogen dioxide and formaldehyde for OMI and GOME-2A from QA4ECV: intercomparison, uncertainty characterisation, and trends, Atmos. Meas. Tech., 11, 4033–4058, https://doi.org/10.5194/amt-11-4033-2018, 2018. a
Zhao, X., Griffin, D., Fioletov, V., McLinden, C., Cede, A., Tiefengraber, M., Müller, M., Bognar, K., Strong, K., Boersma, F., Eskes, H., Davies, J., Ogyu, A., and Lee, S. C.: Assessment of the quality of TROPOMI high-spatial-resolution NO2 data products, Atmos. Meas. Tech. Discuss., https://doi.org/10.5194/amt-2019-416, in review, 2019. a