the Creative Commons Attribution 4.0 License.
the Creative Commons Attribution 4.0 License.
 | 01 Apr 2020
Development of a new nanoparticle sizer equipped with a 12-channel multi-port differential mobility analyzer and multi-condensation particle counters
Hong Ku Lee
Handol Lee
Kang-Ho Ahn
Measuring particle size distributions precisely is an important concern in addressing environmental and human health-related issues. To measure particle size distributions, a scanning mobility particle sizer (SMPS) is often used. However, it is difficult to analyze particle size distributions under fast-changing concentration conditions because the SMPS cannot respond fast enough to reflect current conditions due to the time necessary for voltage scanning. In this research, we developed a new nanoparticle sizer (NPS), which consists of a multi-port differential mobility analyzer (MP-DMA) with 12 sampling ports and multi-condensation particle counters (M-CPCs) that simultaneously measure concentrations of particles classified by the sampling ports. The M-CPC can completely condense particles larger than 10 nm, and the total particle concentrations measured by each CPC in the M-CPCs and an electrometer were in agreement up to 20 000 . We conducted size distribution measurements under steady-state conditions using an aerosol generator and under unsteady conditions by switching the aerosol supply on or off. The data obtained by the NPS corresponded closely to the SMPS measurement data for the steady-state particle concentration case. In addition, the NPS could successfully capture the changes in particle size distribution under fast-changing particle concentration conditions. Finally, we present NPS measurement results of size distributions in a common situation (cooking) as an exemplary real-world application.
- Article
(4451 KB) - Full-text XML
-
Supplement
(238 KB) - BibTeX
- EndNote


There are several methods to measure size distributions of aerosols. Among them, the combination of a differential mobility analyzer (DMA) and a condensation particle counter (CPC) has been widely used. The measurement procedure of this technique begins with a voltage applied to the DMA to classify monodisperse particles in a narrow electrical mobility range, and then the CPC measures the particle number concentration (Fissan et al., 1983). This is the differential mobility particle sizer (DMPS) method, and by stepping the voltages, the complete size distribution of aerosols can be obtained. However, generally 10–15 min of the voltage stepping process are required for accurate estimation of the complete size distribution, making the DMPS unable to respond accurately if the concentration is changing rapidly. For this reason, the DMPS method has limited applications. Wang and Flagan (1990) developed a scanning mobility particle sizer (SMPS) to reduce the measurement time. For the SMPS measurement, the applied voltage is increased (or decreased) continuously, and particles consecutively classified by a DMA are counted by a CPC. As a result, measurement time can be reduced to less than 2 min. However, it is still too long to analyze fast-changing particle size distributions. Recently, several aerosol instrument systems have been developed and studied with the aim of faster measurement. A fast mobility particle sizer (FMPS) was developed based on a principle similar to the SMPS system: the electrical mobility analyzer. Instead of a CPC, the FMPS uses multiple electrometers for particle detection, and the system provides particle size distribution information in real time. The FMPS is generally used for analyzing engine emissions because the electrometers are not sensitive enough to measure low particle concentrations (). In addition, current leakage and electrical noise of electrometers sometimes result in less precise measurements. A new fast integrated mobility spectrometer (FIMS) for real-time measurement of aerosols was developed (Kulkarni and Wang, 2006). The FIMS detects charged particles based on their different electrical mobilities, which result in different trajectories. A fast charge-coupled device (CCD) imaging system is employed to capture the locations of droplets nucleated from these spatially separated particles. The FIMS can be used to obtain size distributions at sub-second time intervals. Another fast aerosol measurement instrument is a DMA train (Stolzenburg et al., 2017). The DMA train is operated with six DMAs in parallel at a fixed voltage for particle size distribution measurement with high time resolution. Therefore, it can be used to observe very fast aerosol growth, especially in the sub-10 nm range. However, the DMA train contains six commercial CPCs and six commercial DMAs, which make the system costly and bulky. Recently, Oberreit et al. (2014) performed a mobility analysis of sub-10 nm particles using an aspirating drift tube ion mobility spectrometer (DT-IMS) numerically and experimentally. By using the instrument, the electrical mobility of the particles can be estimated from the time required for the particles to traverse a drift zone. The findings in the paper show that particles ranging from 2 to 11 nm can be analyzed in less than 5 s. Another instrument for fast measurement is a nucleation mode aerosol size spectrometer (NMASS) developed by Williamson et al. (2018). The NMASS consists of five embedded CPCs with different cutoff diameters to measure the particle size distribution between 3 and 60 nm. To distinguish different diameters, the NMASS requires five different thermal operating conditions for its condensers.
In addition to the abovementioned instruments, Chen et al. (2007) and Kim et al. (2007) previously developed a differential mobility analyzer with multiple sampling ports for a fast measurement system. However, the multistage DMA (MDMA) by Chen et al. (2007) only has three sampling ports and needs three CPCs. Furthermore, an exponentially extended longitudinal length is required to increase the number of sampling ports and accommodate the wide size range of particles. As a result, the system becomes complicated and expensive. Kim et al. (2007) developed a DMA with a multi-port system, a substitution for the MDMA system, and it can classify a total of seven sizes simultaneously. They evaluated the DMA system using monodisperse particles and deduced from the experiments that increasing the number of sampling ports did not affect the classification efficiency and transfer functions of the DMA. This was also theoretically supported in research by Giamarelou et al. (2012), in deriving analytical expressions for estimating the transfer functions and the resolutions of DMAs with multiple sampling ports. However, there is still a lack of research on a fast measurement system that retains the traditional DMA function. Therefore, in this study, we developed a new nanoparticle sizer (NPS), consisting of a multi-port DMA (MP-DMA) and multi-CPCs (M-CPCs), that can perform fast measurement of particle size distributions.
2.1 Design concept and construction of the NPS
The NPS consists of one MP-DMA with 12 ports (Fig. 1a) and two M-CPC modules with 12 CPCs (Fig. 1c). The MP-DMA, unlike the common cylindrical DMA with one sampling port (Knutson and Whitby, 1975), has an outer electrode with multiple sampling ports (annular slits) and a truncated cone-shaped inner electrode where a high voltage is applied. Once the constant voltage is applied, the MP-DMA classifies monodisperse particles according to their electrical mobility. The dimensions of the entire system are . The flow systems and paths for the NPS are depicted in Fig. 1, including the aerosol flow rate (Qa, 0.18 L min−1), sheath flow rate (Qsh, 3.78 L min−1), sampling flow rate for each CPC (Qs, 0.18 L min−1), and exhaust flow rate (Qe, 1.8 L min−1). Like the common DMA flow system, Qa is the same as Qs. The clean sheath flow carries aerosols from the top to the bottom. Because Qs continuously flows out through each sampling port, the total flow rate along the classification zone is reduced.
2.2 Design concept of the MP-DMA
While Chen et al. (2007) employed three sampling ports and applied an exponentially increasing distance between neighboring ports to allow a wide size range of particles, the MP-DMA has 12 annular sampling ports that are placed with a uniform distance of 2 cm between neighboring ports. The MP-DMA uses an inner electrode with increasing diameter along the longitudinal direction. As the diameter of the electrode increases, the distance between the inner electrode and the outer cylindrical electrode decreases. Accordingly, the electrical field strength applied to particles increases as they flow to the downstream side. As a result, the MP-DMA can accommodate a wider size range of particles without excessive extension of the electrode length found in the common cylindrical electrode.
2.3 Design concept of the M-CPC
Each sampling port in the MP-DMA is directly connected to the inlet of each CPC. Classified particles are introduced to and measured by the CPC. One M-CPC module consists of six CPCs, and the NPS has two M-CPC modules (12 CPCs). The module has a unified saturator and condenser block to maintain uniform temperatures. A common working fluid reservoir is located beneath the saturator block. The operating principle of the M-CPC is the same as other typical CPCs. Particles are introduced to the saturator (temperature: 35 ∘C), and the condensational growth of the particles occurs in the condenser at a temperature of 10 ∘C. The condensed particles are detected in the optical part. Each CPC was denoted as CPC1, CPC2, CPC3, etc., based on their location. CPC1 is closest to the aerosol inlet and CPC12 is closest to the sheath outlet in the MP-DMA. The reference CPC used in this study is denoted as TSI-CPC (model 3776, TSI Inc., Shoreview MN, USA).
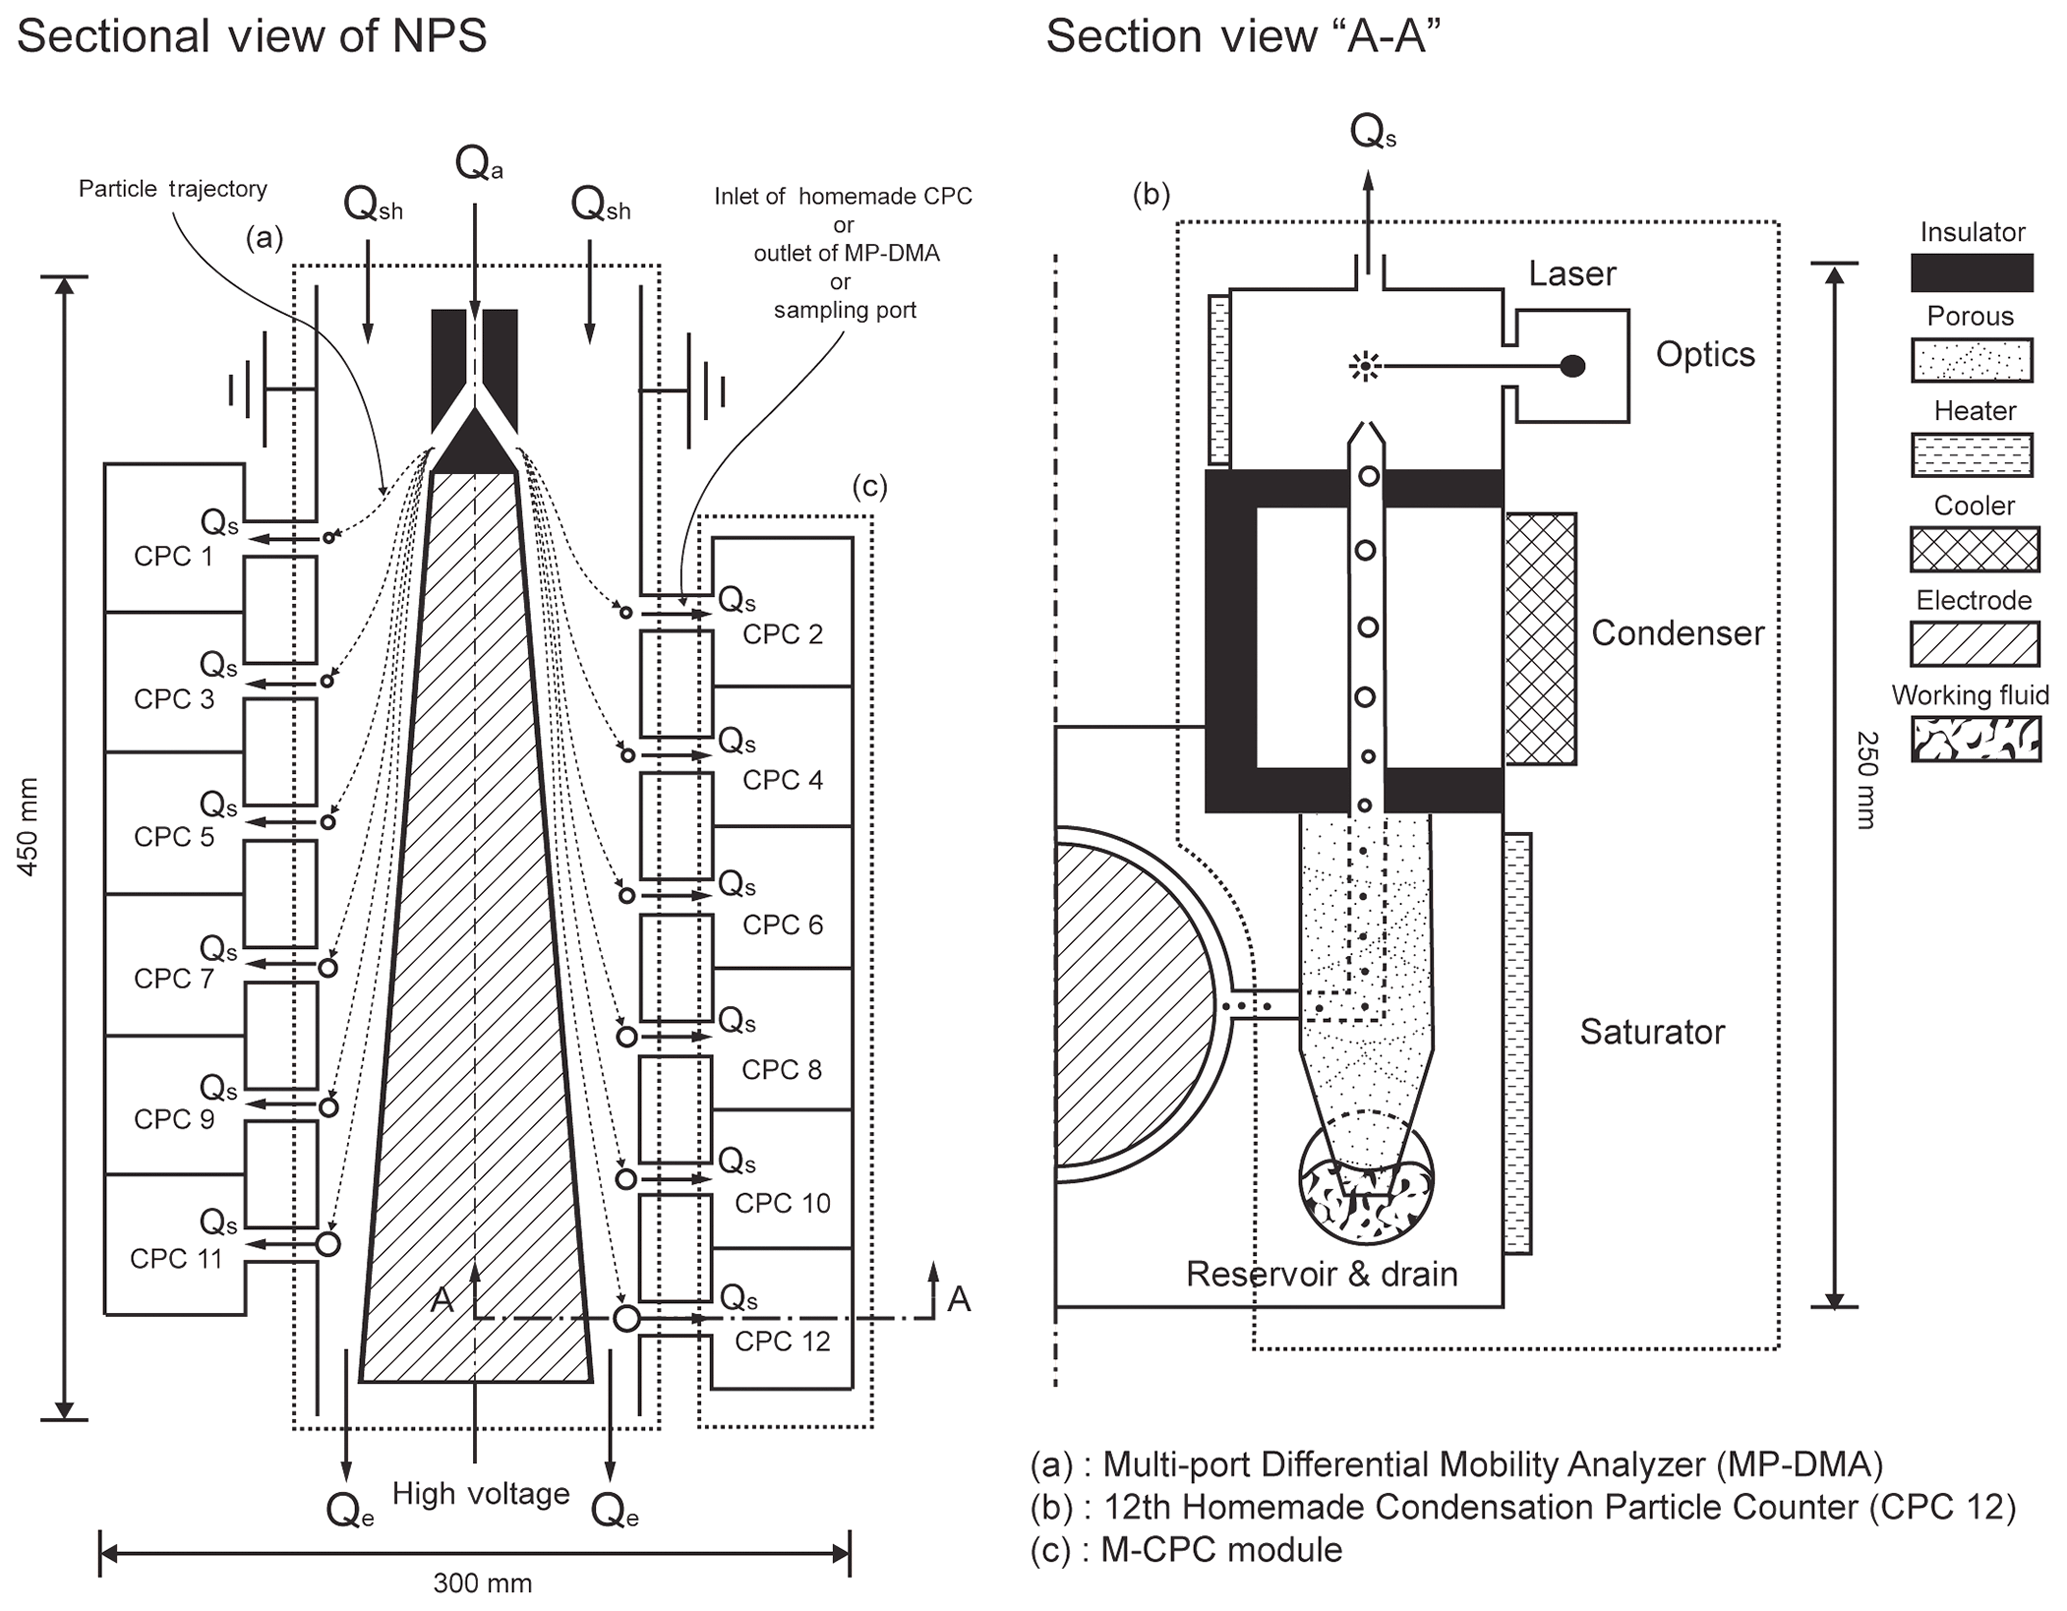
Figure 1Schematic diagram of the NPS consisting of the MP-DMA including M-CPCs: (a) the geometry of the MP-DMA and flow paths; (b) the details of the 12th CPC; (c) the M-CPC module.
3.1 M-CPC
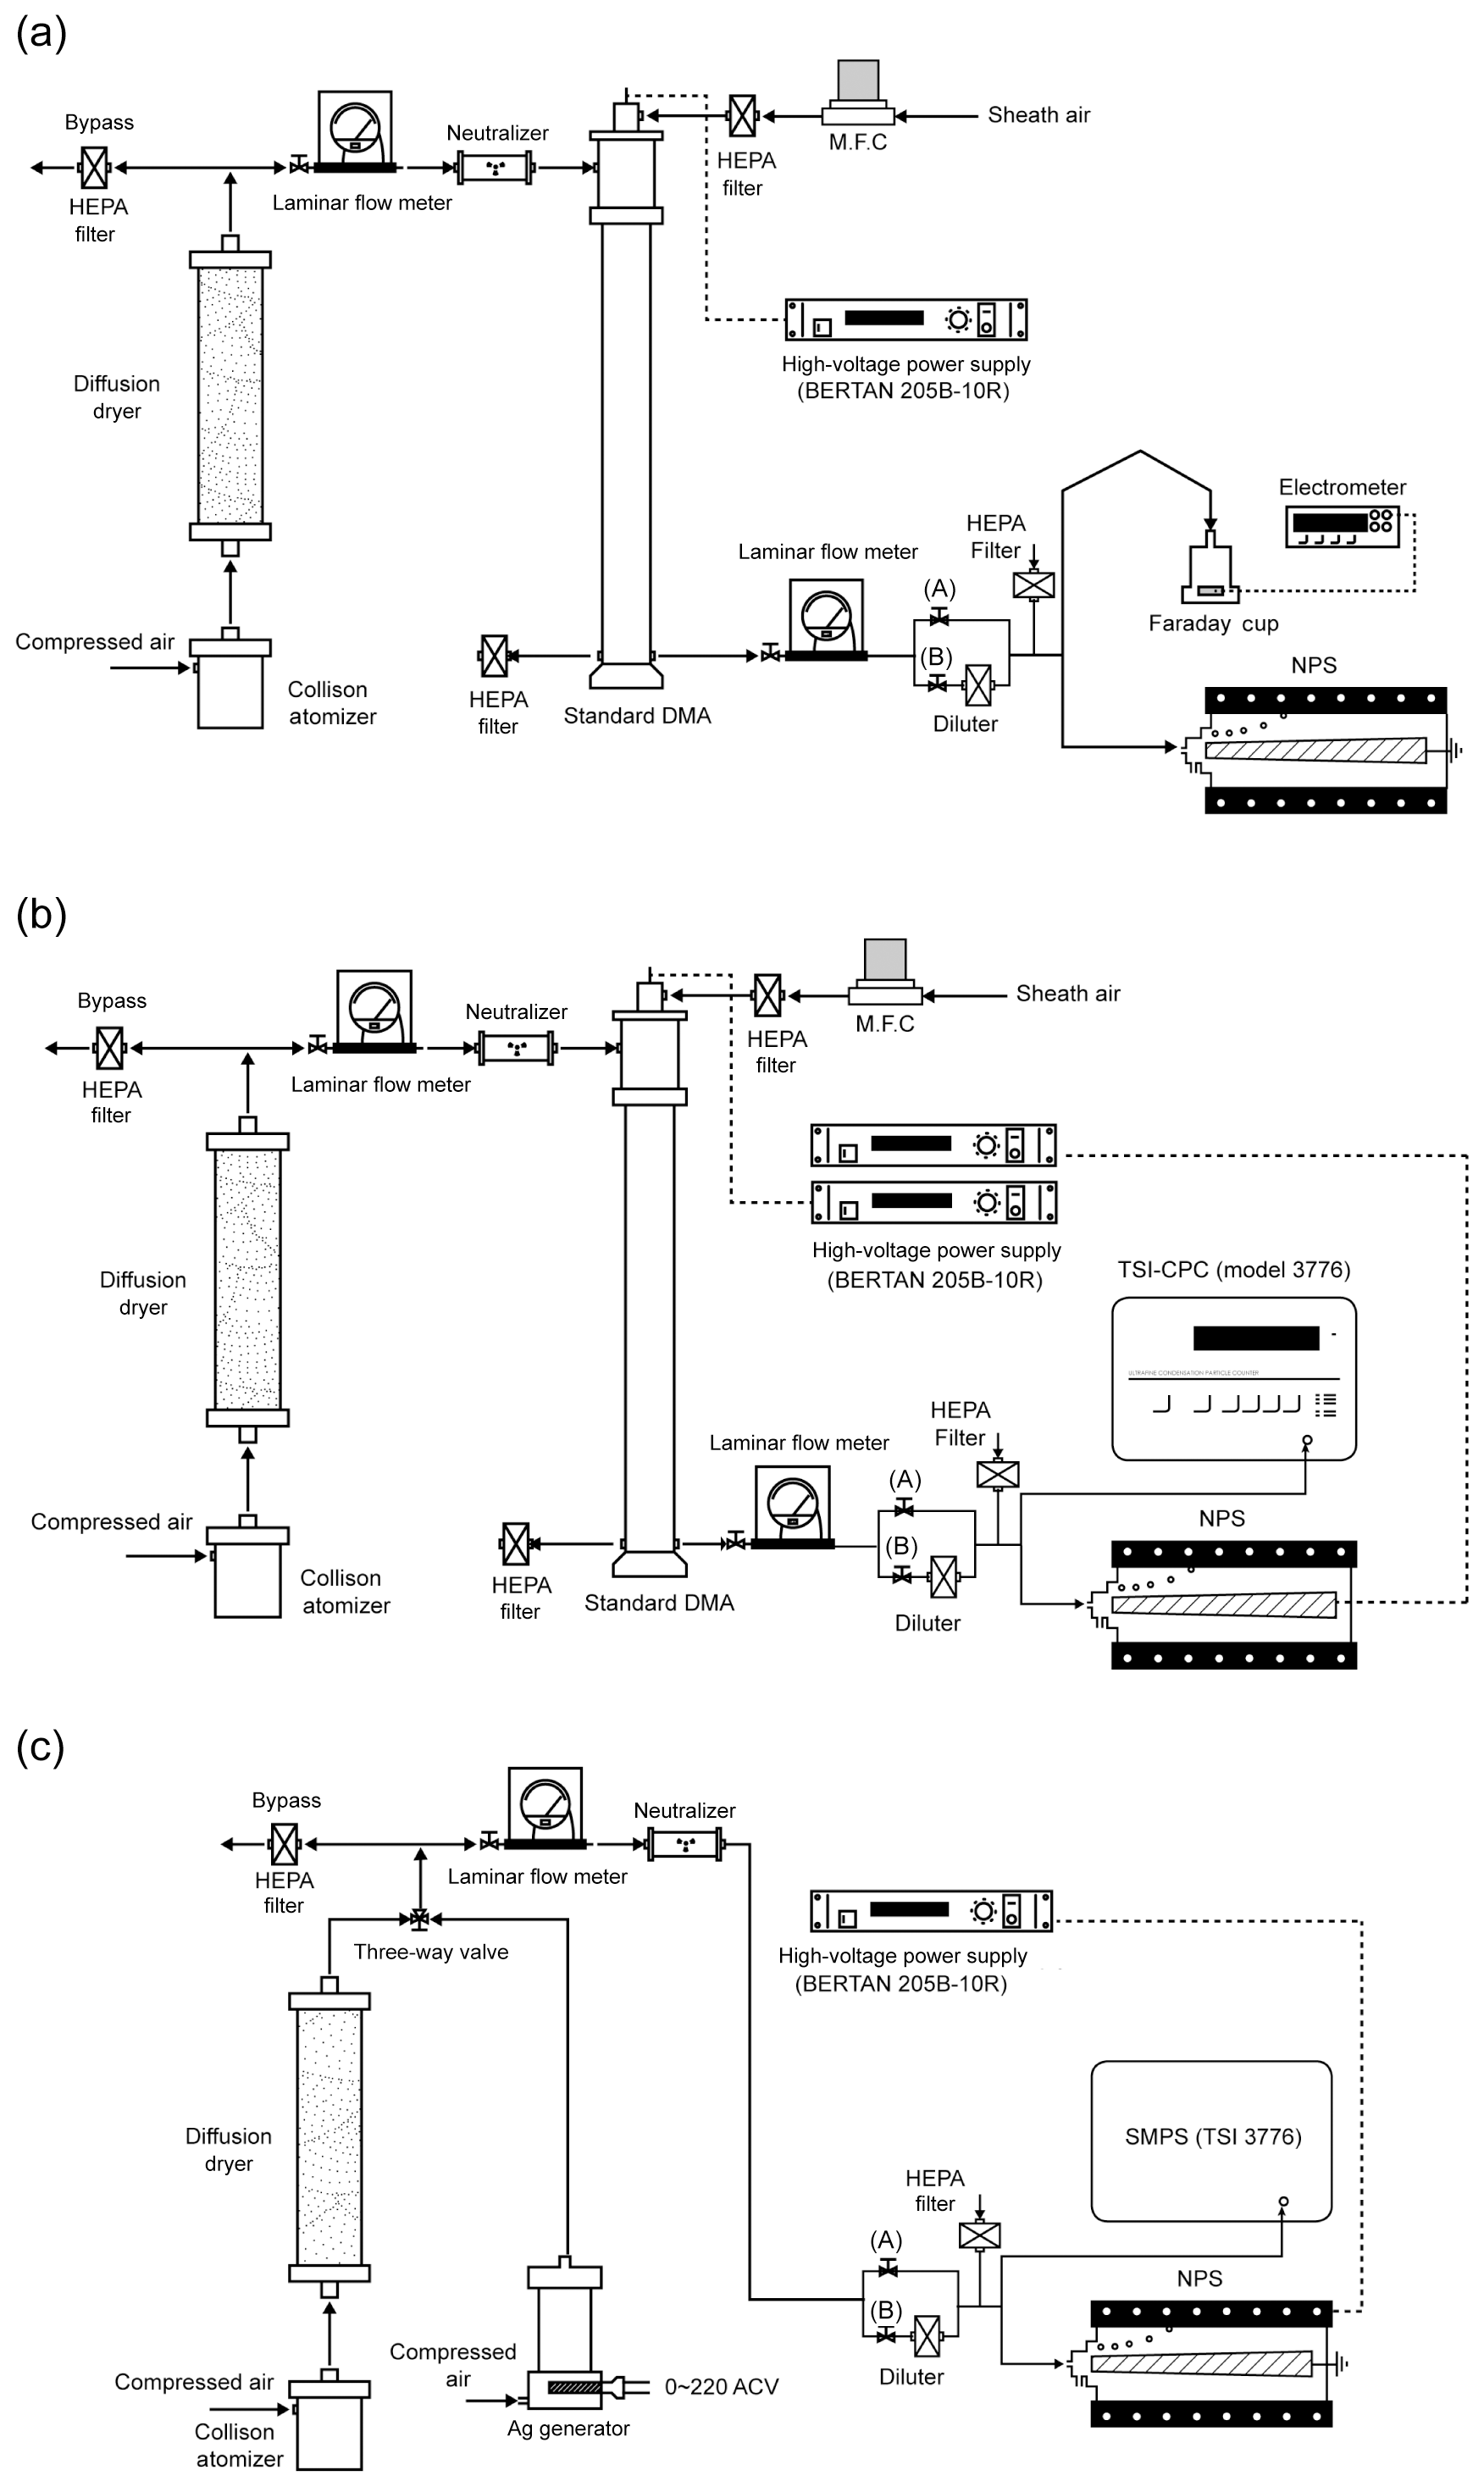
In order to evaluate the performance of the M-CPC, the activation efficiency and concentration linearity of each CPC were obtained from comparison with a reference electrometer. Figure 2a is the schematic diagram of the M-CPC performance test. Using a Collison atomizer, a 0.1 wt % NaCl solution was atomized and the aerosols were classified by the first DMA (standard DMA, model 3081, TSI Inc., Shoreview MN, USA) to generate monodisperse particles which were distributed to the analyzing instruments. In this study, the operating sheath and aerosol flow rates in the first DMA were 10 and 1 L min−1, respectively. The mode size and geometric standard deviation of the atomized aerosols were 43 and 1.65 nm, respectively. The particle sizes obtained from the atomizer were smaller than 100 nm, thereby minimizing multiple charging effects on the size selection (Fig. S1 in the Supplement). The concentration of particles was controlled by a diluter before entering the instruments as shown in Fig. 2a. To measure the particle number concentration as a reference, an electrometer (model 6517A, Keithley) with a Faraday cup was used. This is one of the most commonly used methods for CPC calibration (Liu and Pui, 1974). In this experiment, the sampling flow rate of each CPC was 0.18 L min−1, and N-butyl alcohol (Agarwal and Sem, 1980) was used for the working fluid. Temperatures of the condenser and saturator were controlled to maintain 10 and 35 ∘C, respectively. The M-CPC measured the number concentration every 1 s, and the response time of the M-CPC is less than 0.3 s. The experimental setup shown in Fig. 2a was used to obtain the results in Fig. 3. For the activation efficiency tests, the tested particle sizes were 10, 30, 50, 80, and 100 nm. For the concentration linearity test, which is associated with the detection efficiency of M-CPCs, 50 nm monodisperse particles were used. The tested monodisperse particles were introduced to the sheath inlet of the MP-DMA with 0 V applied to the inner electrode, and the concentrations measured by each CPC and the electrometer were compared.
3.2 MP-DMA
To evaluate the performance of the MP-DMA, the normalized particle mobility distribution for each port and penetration efficiency for the MP-DMA were obtained. Figure 2b is the schematic diagram of the MP-DMA performance test. The particle size and concentration were controlled by the first DMA and diluter, respectively. The operating conditions of the MP-DMA were 0.18 L min−1 for Qa, 0.18 L min−1 for Qs, 1.8 L min−1 for Qe, and 3.78 L min−1 for Qsh. The total flow rate (Qsh+Qa) flowing inside the MP-DMA decreases as the flow goes along the downstream side because each CPC takes 0.18 L min−1. Under these flow conditions, the residence time of the particles flowing from the aerosol inlet to each sampling port inlet is approximately 0.3 s (Port 1) to 3 s (Port 12) (Lee et al., 2020). The delay due to the residence time inside the MP-DMA was considered when obtaining the size distributions. In the experiments, the applied voltage on the MP-DMA was fixed, and the stepwise increase in the voltage on the first DMA was carried out to generate different sizes of monodisperse particles. Their concentrations were measured by each CPC in the M-CPCs. The upstream concentration of the monodisperse particles was monitored by the reference TSI-CPC and controlled to approximately 10 000 by adjusting the valve (“B” in Fig. 2b) located in the diluter.
With stepwise increase in the voltage on the first DMA, the mobility distributions were obtained from the sets of measured concentrations as a function of electrical mobility based on the first DMA. The measured concentrations were normalized by the maximum concentration for each port. The electrical mobility was normalized by the central mobility for each port, and the results are shown in Fig. 4. In addition, the particle penetration ratios as a function of port number at voltages of 1000 and 2000 V are shown in Fig. 5, representing the maximum ratio between the measured concentration at each CPC and the upstream concentration measured by the TSI-CPC, which is approximately 10 000 . The maximum penetration ratio was obtained at the central electrical mobility for each port. The penetration ratios were used to calibrate the NPS data in the inversion process.
3.3 Particle size distribution measurement
To test the performance of the NPS, the experimental setup in Fig. 2c was used. For particle generation, we used two types of particles: NaCl and Ag. The NaCl and Ag particles were generated by the Collison atomizer and evaporation generator (Hwang and Ahn, 2017). The particles were neutralized by a neutralizer, and the concentration was controlled by a diluter. The particles were introduced into the TSI-SMPS and NPS. The TSI-SMPS consists of the standard long DMA (model 3081, TSI Inc., Shoreview MN, USA) and a CPC (model 3775, TSI Inc., Shoreview MN, USA), and the voltage was generated by a high-voltage power supply (model 205B-10R, Bertan High Voltage, Hicksville NY, USA). The NPS was operated at a constant voltage of 1000 V for size distribution measurements. The performance tests were conducted under steady-state conditions with constant NaCl and Ag particle concentrations and with changing NaCl particle concentrations during the transition to the equilibrium state. To provide unsteady particle concentrations, we used the on or off valve at the aerosol path (“A” in Fig. 2c) before the TSI-SMPS and NPS. The total measurement time was 240 s. Two cycles of the TSI-SMPS measurement were performed consecutively with 120 s scanning time for each cycle, and the NPS obtained concentration data every 1 s.
3.4 Inversion process for the NPS concentration data
The raw concentration data measured by the M-CPCs were converted to the real concentrations using an inversion process considering the multiple charging effect, detection efficiency of the M-CPCs, and penetration ratio through the MP-DMA. The real concentration of each sampling port was estimated by Eq. (1), and the multiple charge correction was referred by Hoppel's inversion method (Hoppel, 1978). Variables used in this inversion process were derived from the experimental results and the research of Giamarelou et al. (2012) and Stolzenburg and McMurry (2008). The correction based on the charge fraction was inferred by Wiedensohler's bipolar charge distribution (Wiedensohler, 1988). For a clear understanding of the variables in Eq. (1), we added a brief explanation of the experimental method in each result section.
where Dp is the particle diameter, fc is the charge fraction, P is the penetration ratio, and ηCPC,act and ηCPC,det are the activation and detection efficiency of the M-CPC, respectively. The subscript “n” indicates the port number. Dp,S and Dp,E indicate the particle size range classified by each port. Because the NPS receives data every 1 s, the raw data with a unit of numbers per second were converted to numbers per cubic centimeter.
4.1 Performance of the M-CPC
Figure 3a shows the activation efficiency of the M-CPCs for particles sizes between 10 and 100 nm. To obtain the activation efficiency, monodisperse particles were measured by the electrometer and NPS operated at 0 V as shown in Fig. 2a. For the NPS measurement, all aerosols were introduced through the sheath flow inlet only (with a flow rate of 3.96 L min−1), so the particle concentrations could be measured by all M-CPCs. The same flow rate of 3.96 L min−1 was introduced to the electrometer, and the measurements were carried out simultaneously. When comparing the M-CPCs to the electrometer measurements, activation efficiencies of almost 100 % were obtained for all CPCs for particle sizes down to 10 nm. In this study, we did not find the cut size of the M-CPC, but we initially designed the NPS system for detecting particles down to 10 nm.
We also examined the detectable concentration range for the M-CPCs using the experimental setup in Fig. 2a. The test was conducted with 50 nm monodisperse particles under different concentration conditions. The comparison between concentrations obtained by the electrometer and the M-CPCs is shown in Fig. 3b. The slope of the graph has a good linearity for concentrations up to 20 000 , indicating that each CPC can be used for concentrations up to this value. It should be noted that a correction factor was considered in the concentration range higher than 20 000 . Furthermore, each CPC in the NPS always measures the concentration of particles classified by the MP-DMA; therefore, in real applications such as atmospheric particle measurements, this high concentration after classification by the MP-DMA can be rarely achieved.
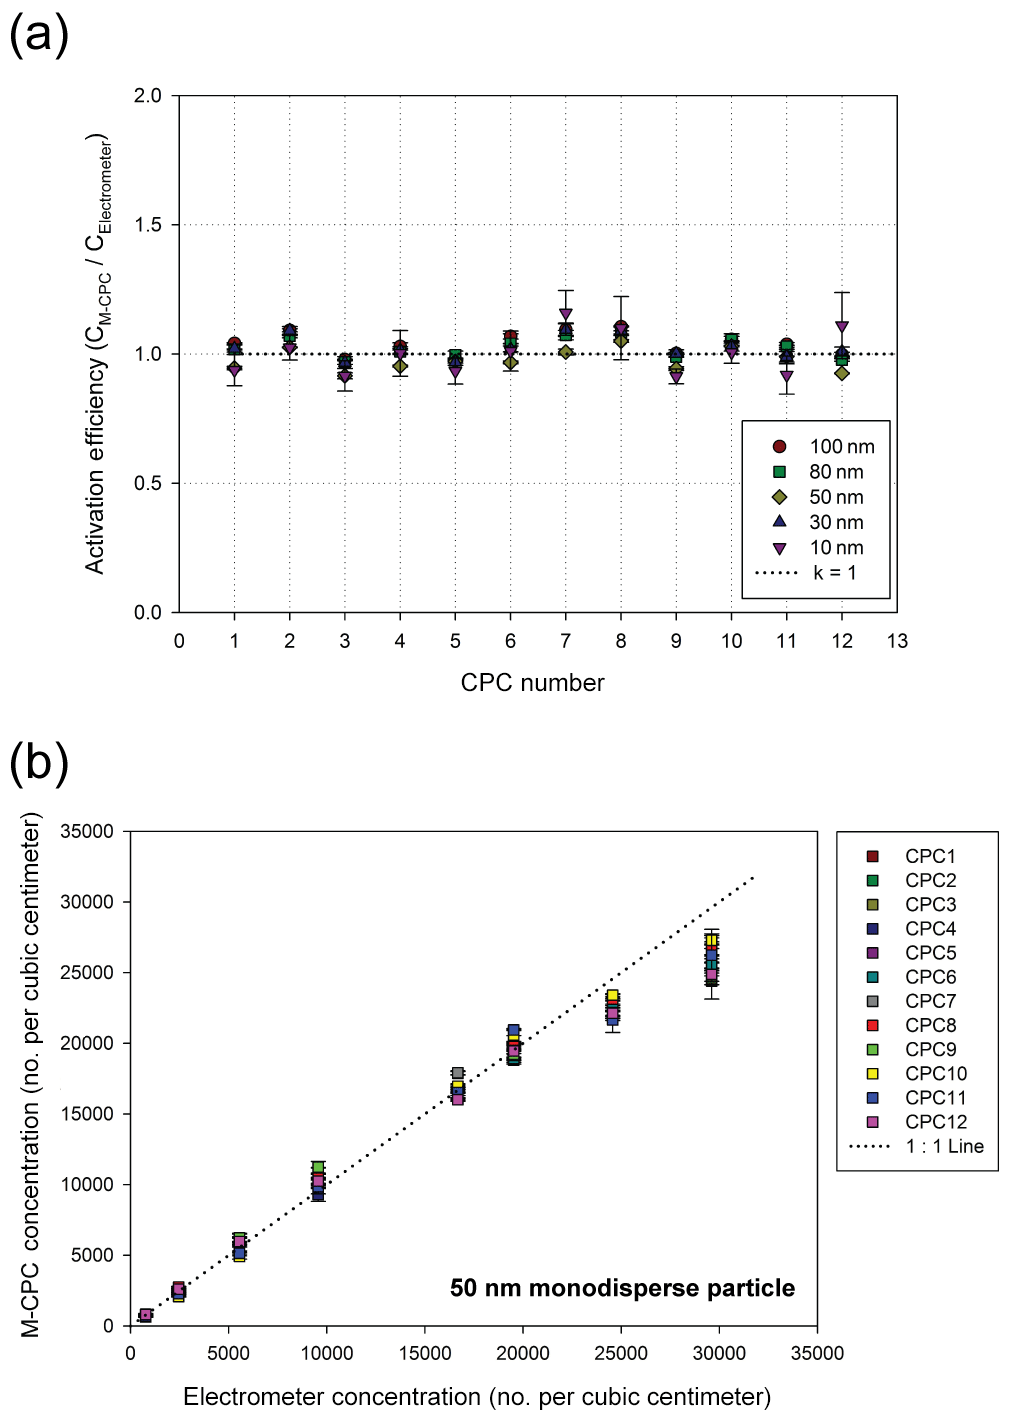
Figure 3M-CPC performance: (a) activation efficiencies of 12 CPCs; (b) concentration linearity between the electrometer and M-CPCs.
4.2 Performance of the MP-DMA
The normalized mobility distributions of the MP-DMA's 12 sampling ports were obtained using the experimental setup in Fig. 2b, and the results are shown in Fig. 4. The geometric standard deviations for the distributions were estimated between 1.037 and 1.066, which can be considered a very narrow size classification, indicating that the resolution of the MP-DMA is fairly good. As mentioned earlier, the total flow rate inside the MP-DMA decreases as it flows along the downstream side due to the individual sampling ports continuously taking 0.18 L min−1. Thus, the increase in the ratio of Qa to Qsh results in increasing geometric standard deviation with increasing port number.
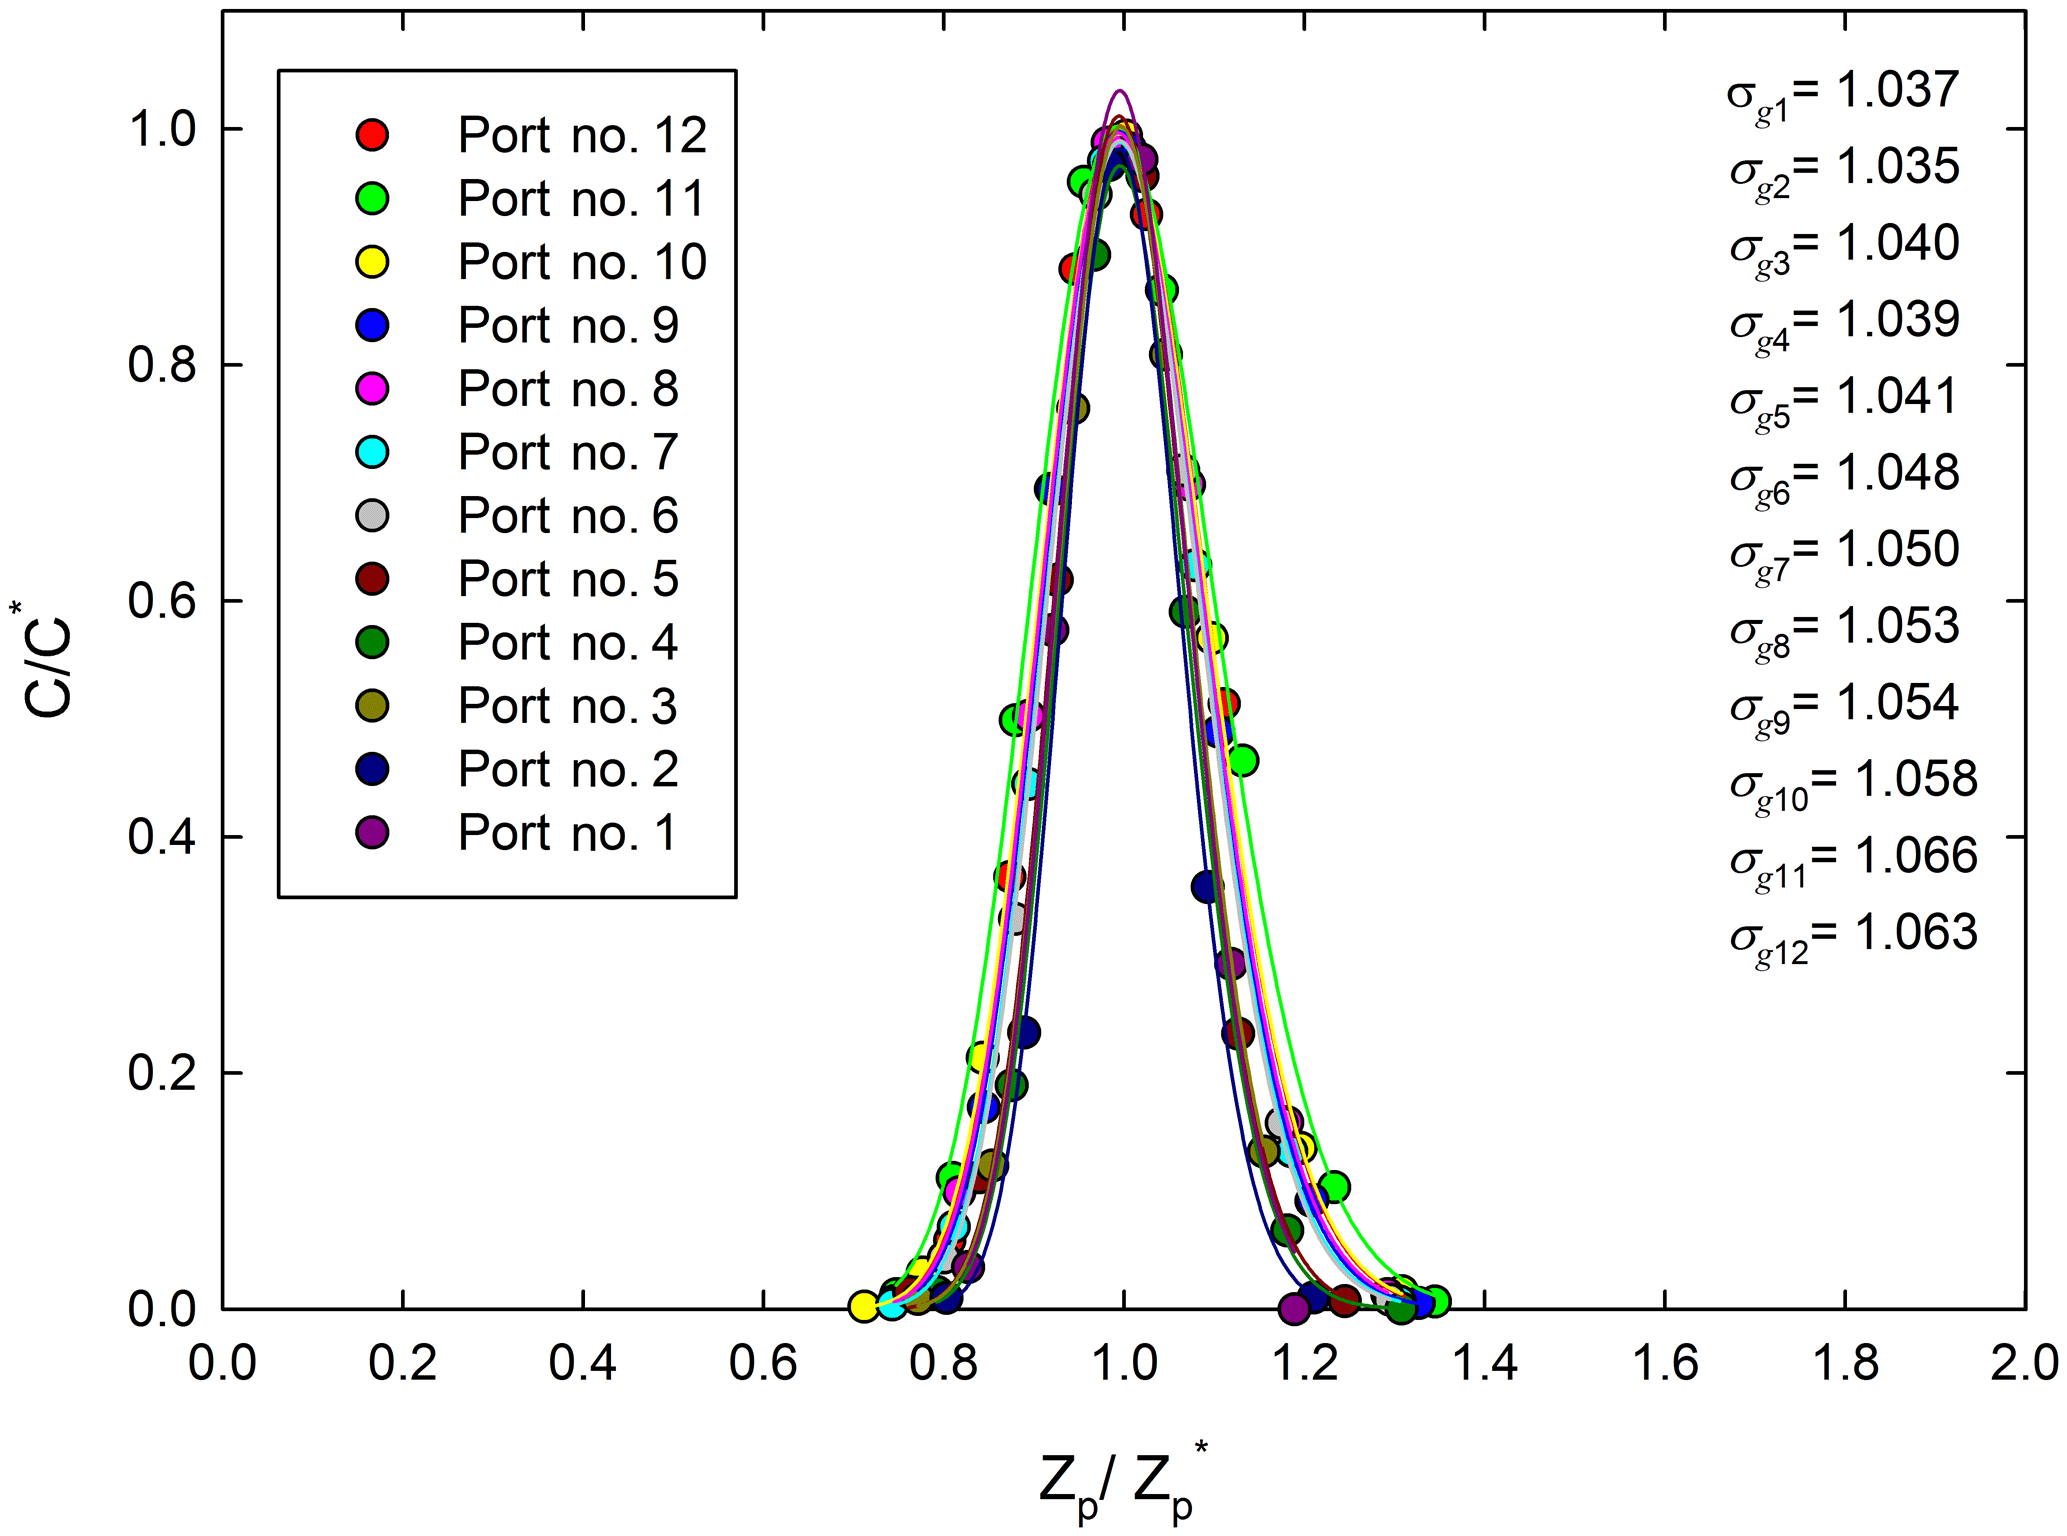
Figure 4Normalized concentrations of the classified particles through each port in the MP-DMA as a function of normalized electrical mobilities. The C and C* on the y axis represent the concentration and the maximum concentration at each port measured by each CPC, respectively. The data were obtained at the NPS applied voltage of 1000 V.
Figure 5 shows the penetration ratio of each port in the MP-DMA at voltages of 1000 and 2000 V. The penetration ratio is defined as the ratio of the total concentration at the central particle diameter (ref. Table 1) measured by the NPS to the reference concentration obtained by the TSI-CPC as presented in Fig. 2b. For example, monodisperse particles with a mode diameter shown in Table 1 were generated by using a DMA and introduced to the NPS and TSI-CPC to achieve the penetration ratio. The penetration ratio of the MP-DMA ranges from 0.099 to 0.765, and these data were used for calibrating the NPS system to convert the raw data obtained by the NPS to the reference concentration data. The theoretical resolution of the MP-DMA decreases from 21 (Port 1) to 10 (Port 12) due to the increasing aerosol-to-sheath flow rate. However, the resolution of the first DMA (TSI standard DMA) is 10 owing to the ratio between aerosol and sheath flow rate of 1:10. Therefore, the CPC at Port 1 might count the particles in the narrower size distribution classified by the first DMA, resulting in a low penetration ratio. Thus, the penetration ratios for all ports were used as correction factors in Eq. (1) to achieve the same concentration as the reference data measured by the TSI-CPC. Notably, in this experiment, the reference data are the concentrations of particles classified by the first DMA, and thus the shape of the input particle size distribution is close to a triangle. Therefore, Nraw∕P (measured raw concentration divided by the penetration ratio) represents the area under a triangle. For this reason we multiplied a factor of 2 as shown in Eq. (1) assuming that a shape of the size distribution of particles entering each port in the NPS is rectangular.
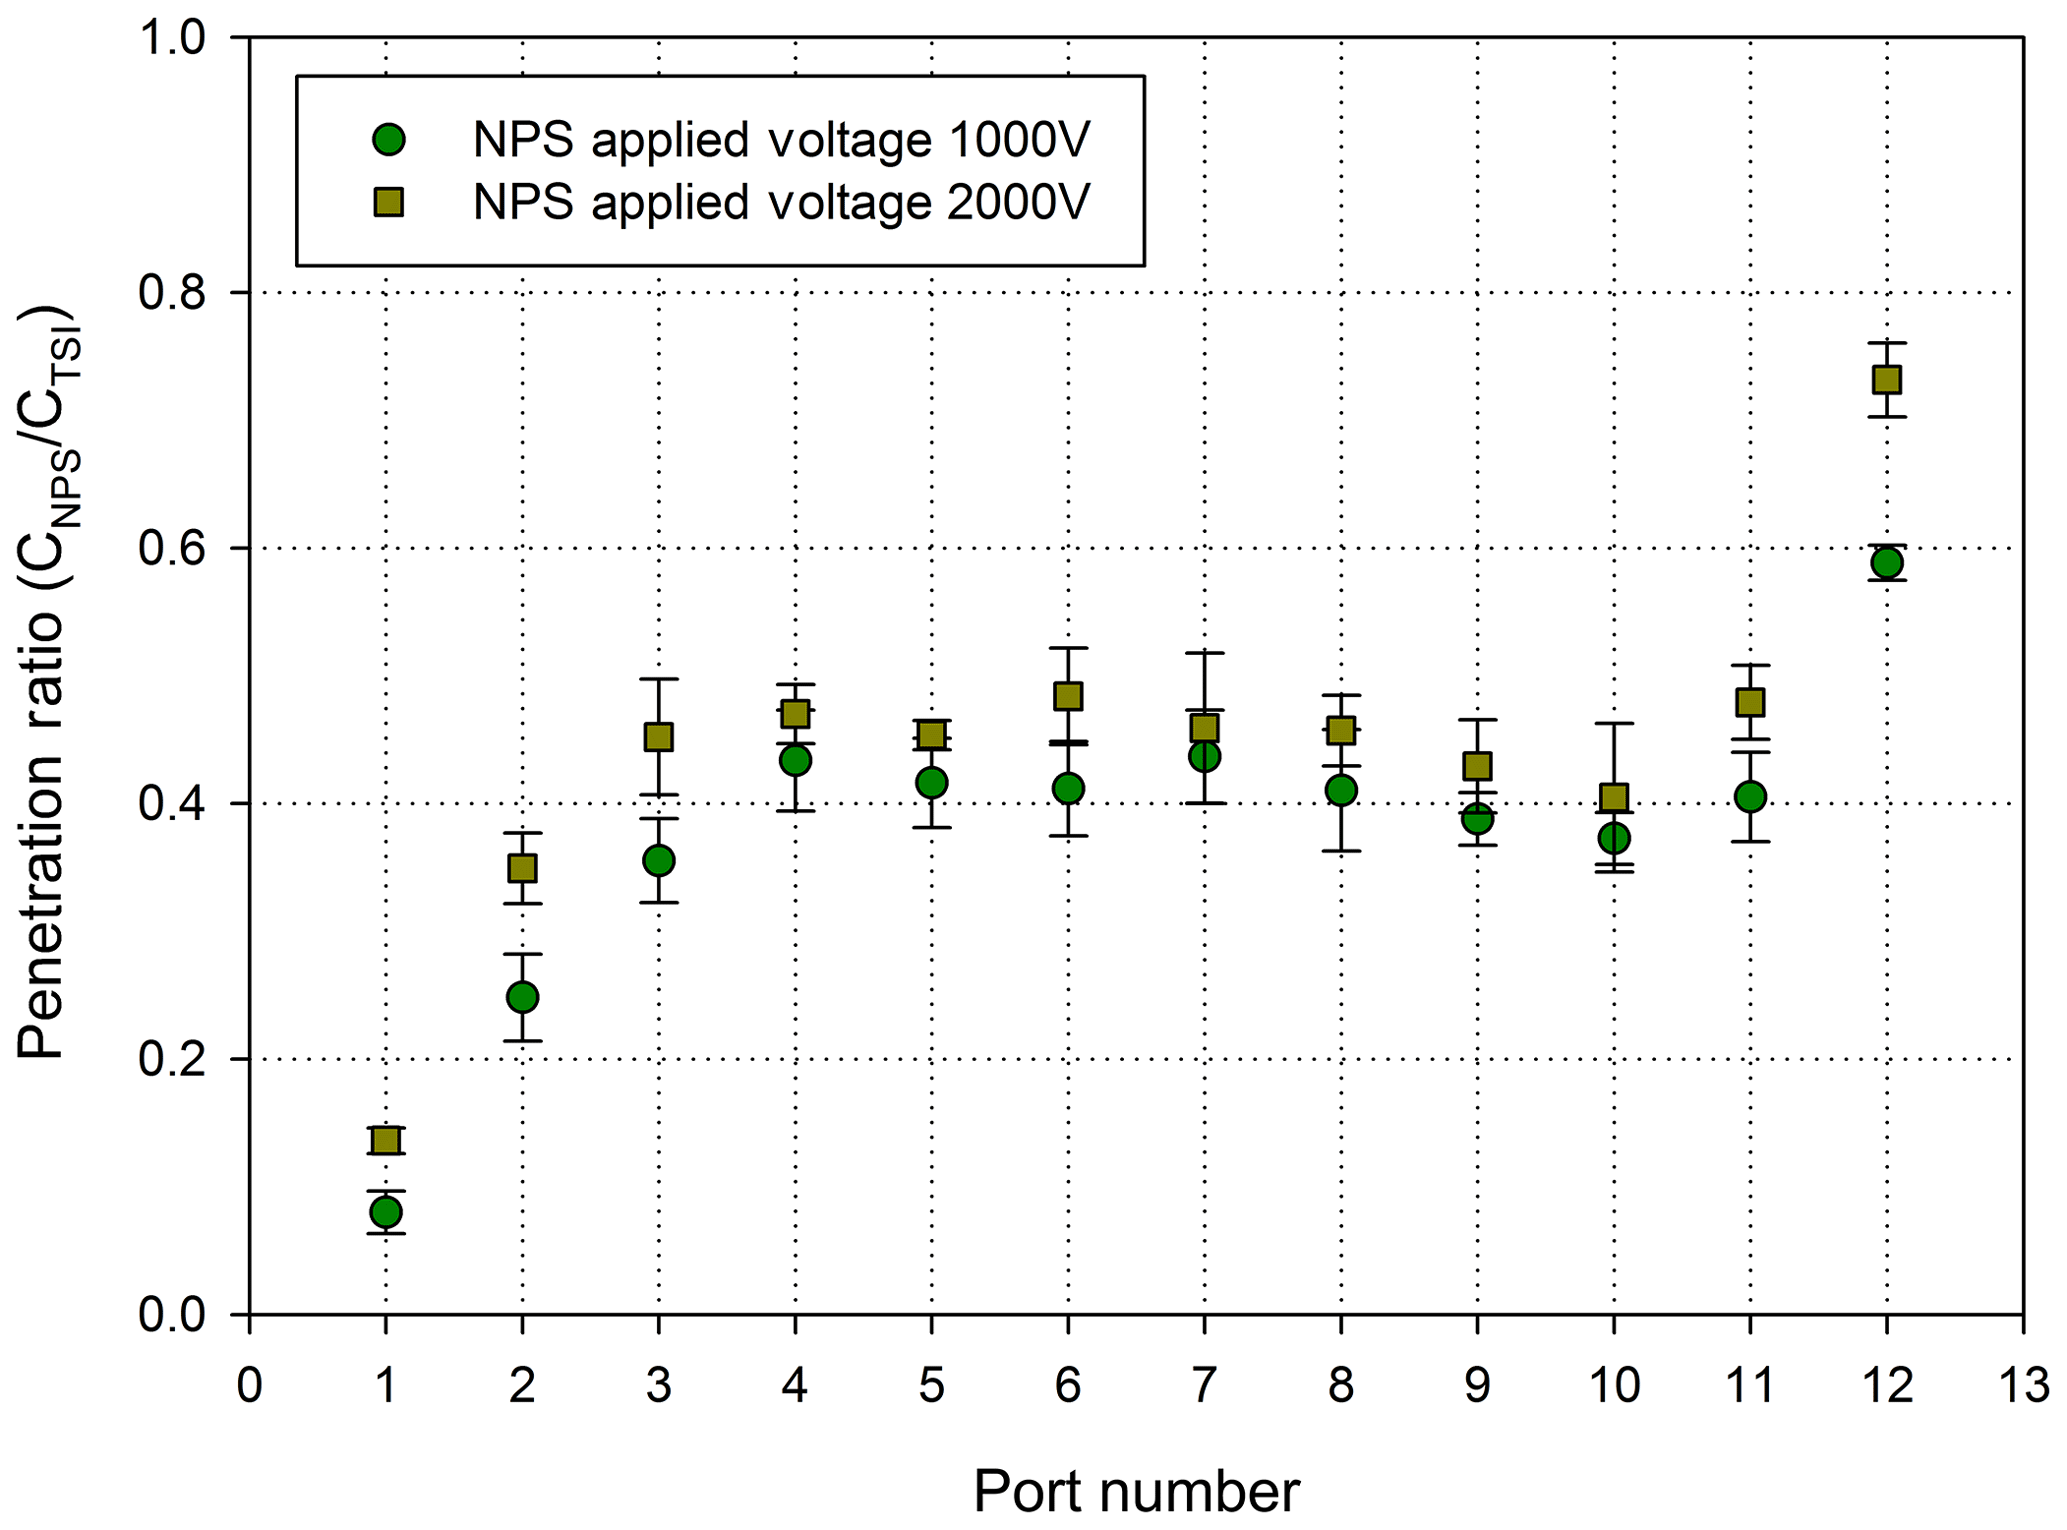
Table 1 summarizes the central particle diameters on each port under different voltage conditions: 1000 and 2000 V. The classified mode diameter is the corresponding particle diameter when the concentration of the classified particles in each port is at its maximum. The classified size range of the NPS is 17–210 nm at 1000 V and 25–320 nm at 2000 V. The range can be easily adjusted by changing the applied voltage of the NPS. However, there still remains a limitation in the MP-DMA. There is a blank area between Port 1 and Port 2 where particles with a geometric standard deviation less than 1.04 (narrow size distribution) and a mode diameter between those of Port 1 and Port 2 are deposited and will not be detected. However, most real-world aerosol systems have a wide range of size distribution. Furthermore, the size distribution of aerosols with a geometric standard deviation of 1.04 is rarely seen in actual applications such as a measurement in ambient air. Therefore, the limitation on the MP-DMA might not result in critical issues for atmospheric research purposes.
Table 1Mode diameter of the size distribution obtained by using the central mobility range for each port.

4.3 Performance of the NPS
4.3.1 Steady-state particle size distribution
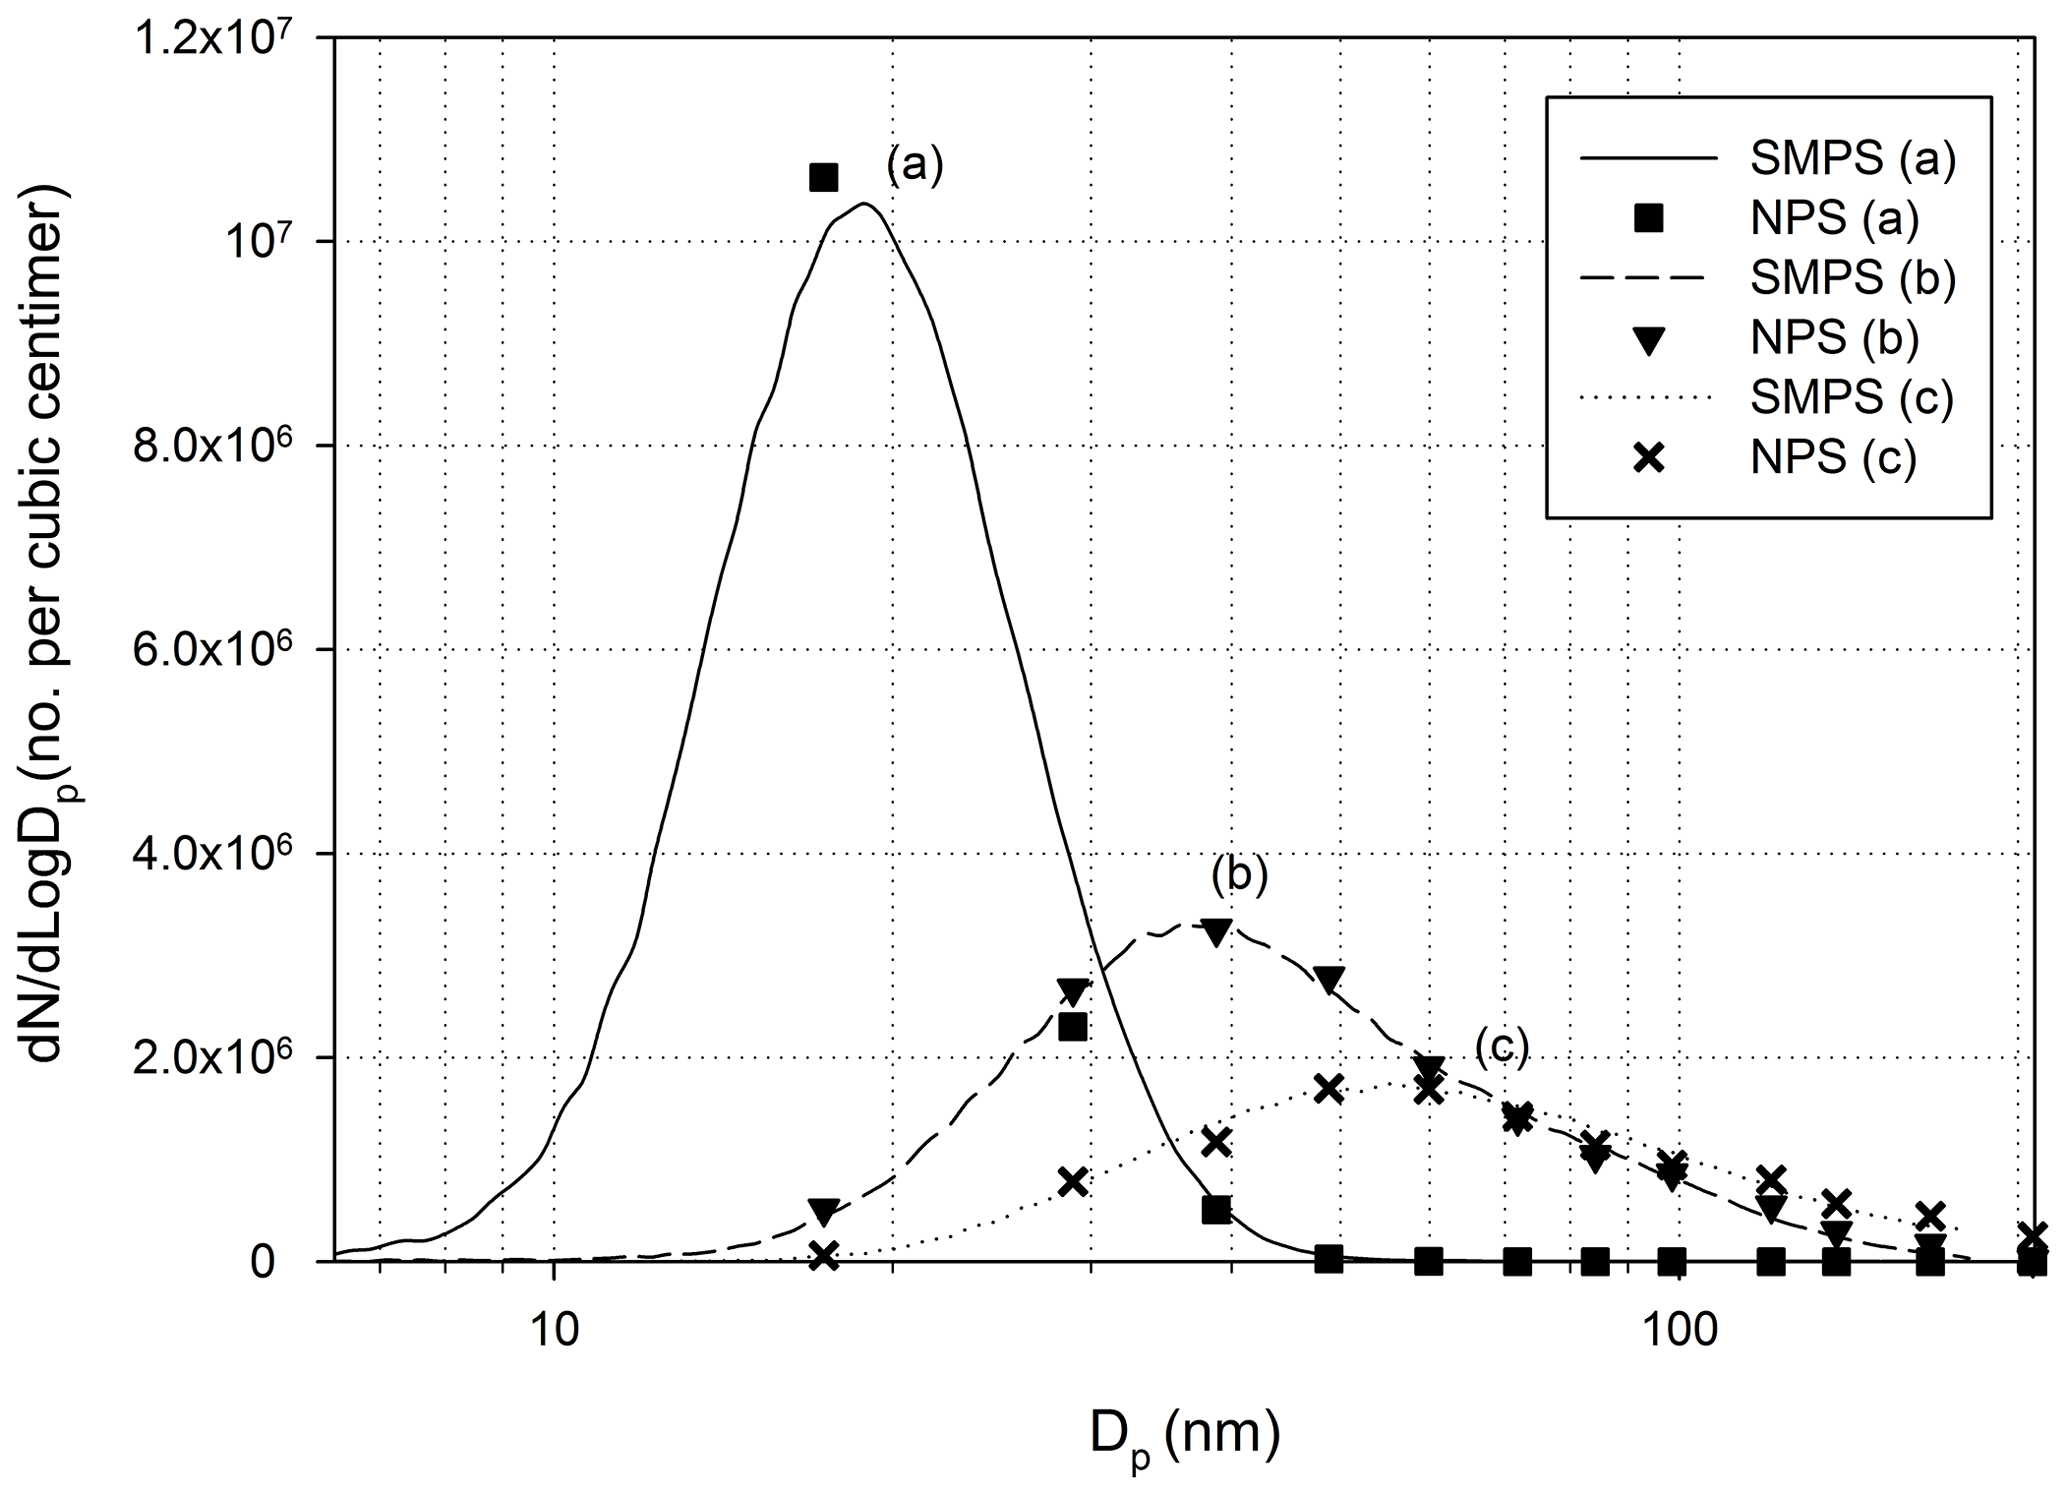
Figure 6Size distributions of the TSI-SMPS and NPS for the constant particle concentrations: (a) Ag particle – evaporation generator (low temperature); (b) Ag particle – evaporation generator (high temperature); (c) NaCl particle – collison atomizer (0.1 wt % NaCl solution). The data were obtained at the NPS applied voltage of 1000 V.

Figure 7Comparison of (a) mode sizes and (b) total particle number concentrations obtained by the TSI-SMPS and NPS with NaCl particles. The data were obtained at the NPS applied voltage of 1000 V.
Using the experimental setup in Fig. 2c, we introduced NaCl or Ag particles to the NPS to measure particle size distribution, and the results were compared to the TSI-SMPS measurements. The TSI-SMPS system consists of the TSI standard DMA and TSI-CPC which were used in Fig. 2a or b. The initial concentrations measured by the NPS were converted to the real concentration based on the inversion process using Eq. (1). Figure 6 shows particle size distributions estimated by the TSI-SMPS and NPS under steady-state conditions of an aerosol generator. The data points from the NPS measurements agree with the TSI-SMPS data. Because the NPS has 12 sampling ports and is operated at a fixed voltage, the number of data points is 12. Therefore, to get the complete size distribution, we fitted the measured data points based on a log-normal distribution. To validate the accuracy of the fitting method used in this study, we also measured different sets of polydisperse particles (total of 10 size distributions) using the TSI-SMPS and NPS to obtain the mode size and total concentration of each size distribution, represented in Fig. 7a and b. Overall, the NPS shows a comparable performance to the TSI-SMPS in measuring particle size and total concentration and, thus, size distribution. For all TSI-SMPS measurements performed in this study, the corrections for the multiple charging and diffusion loss were applied.
4.3.2 Unsteady particle size distribution
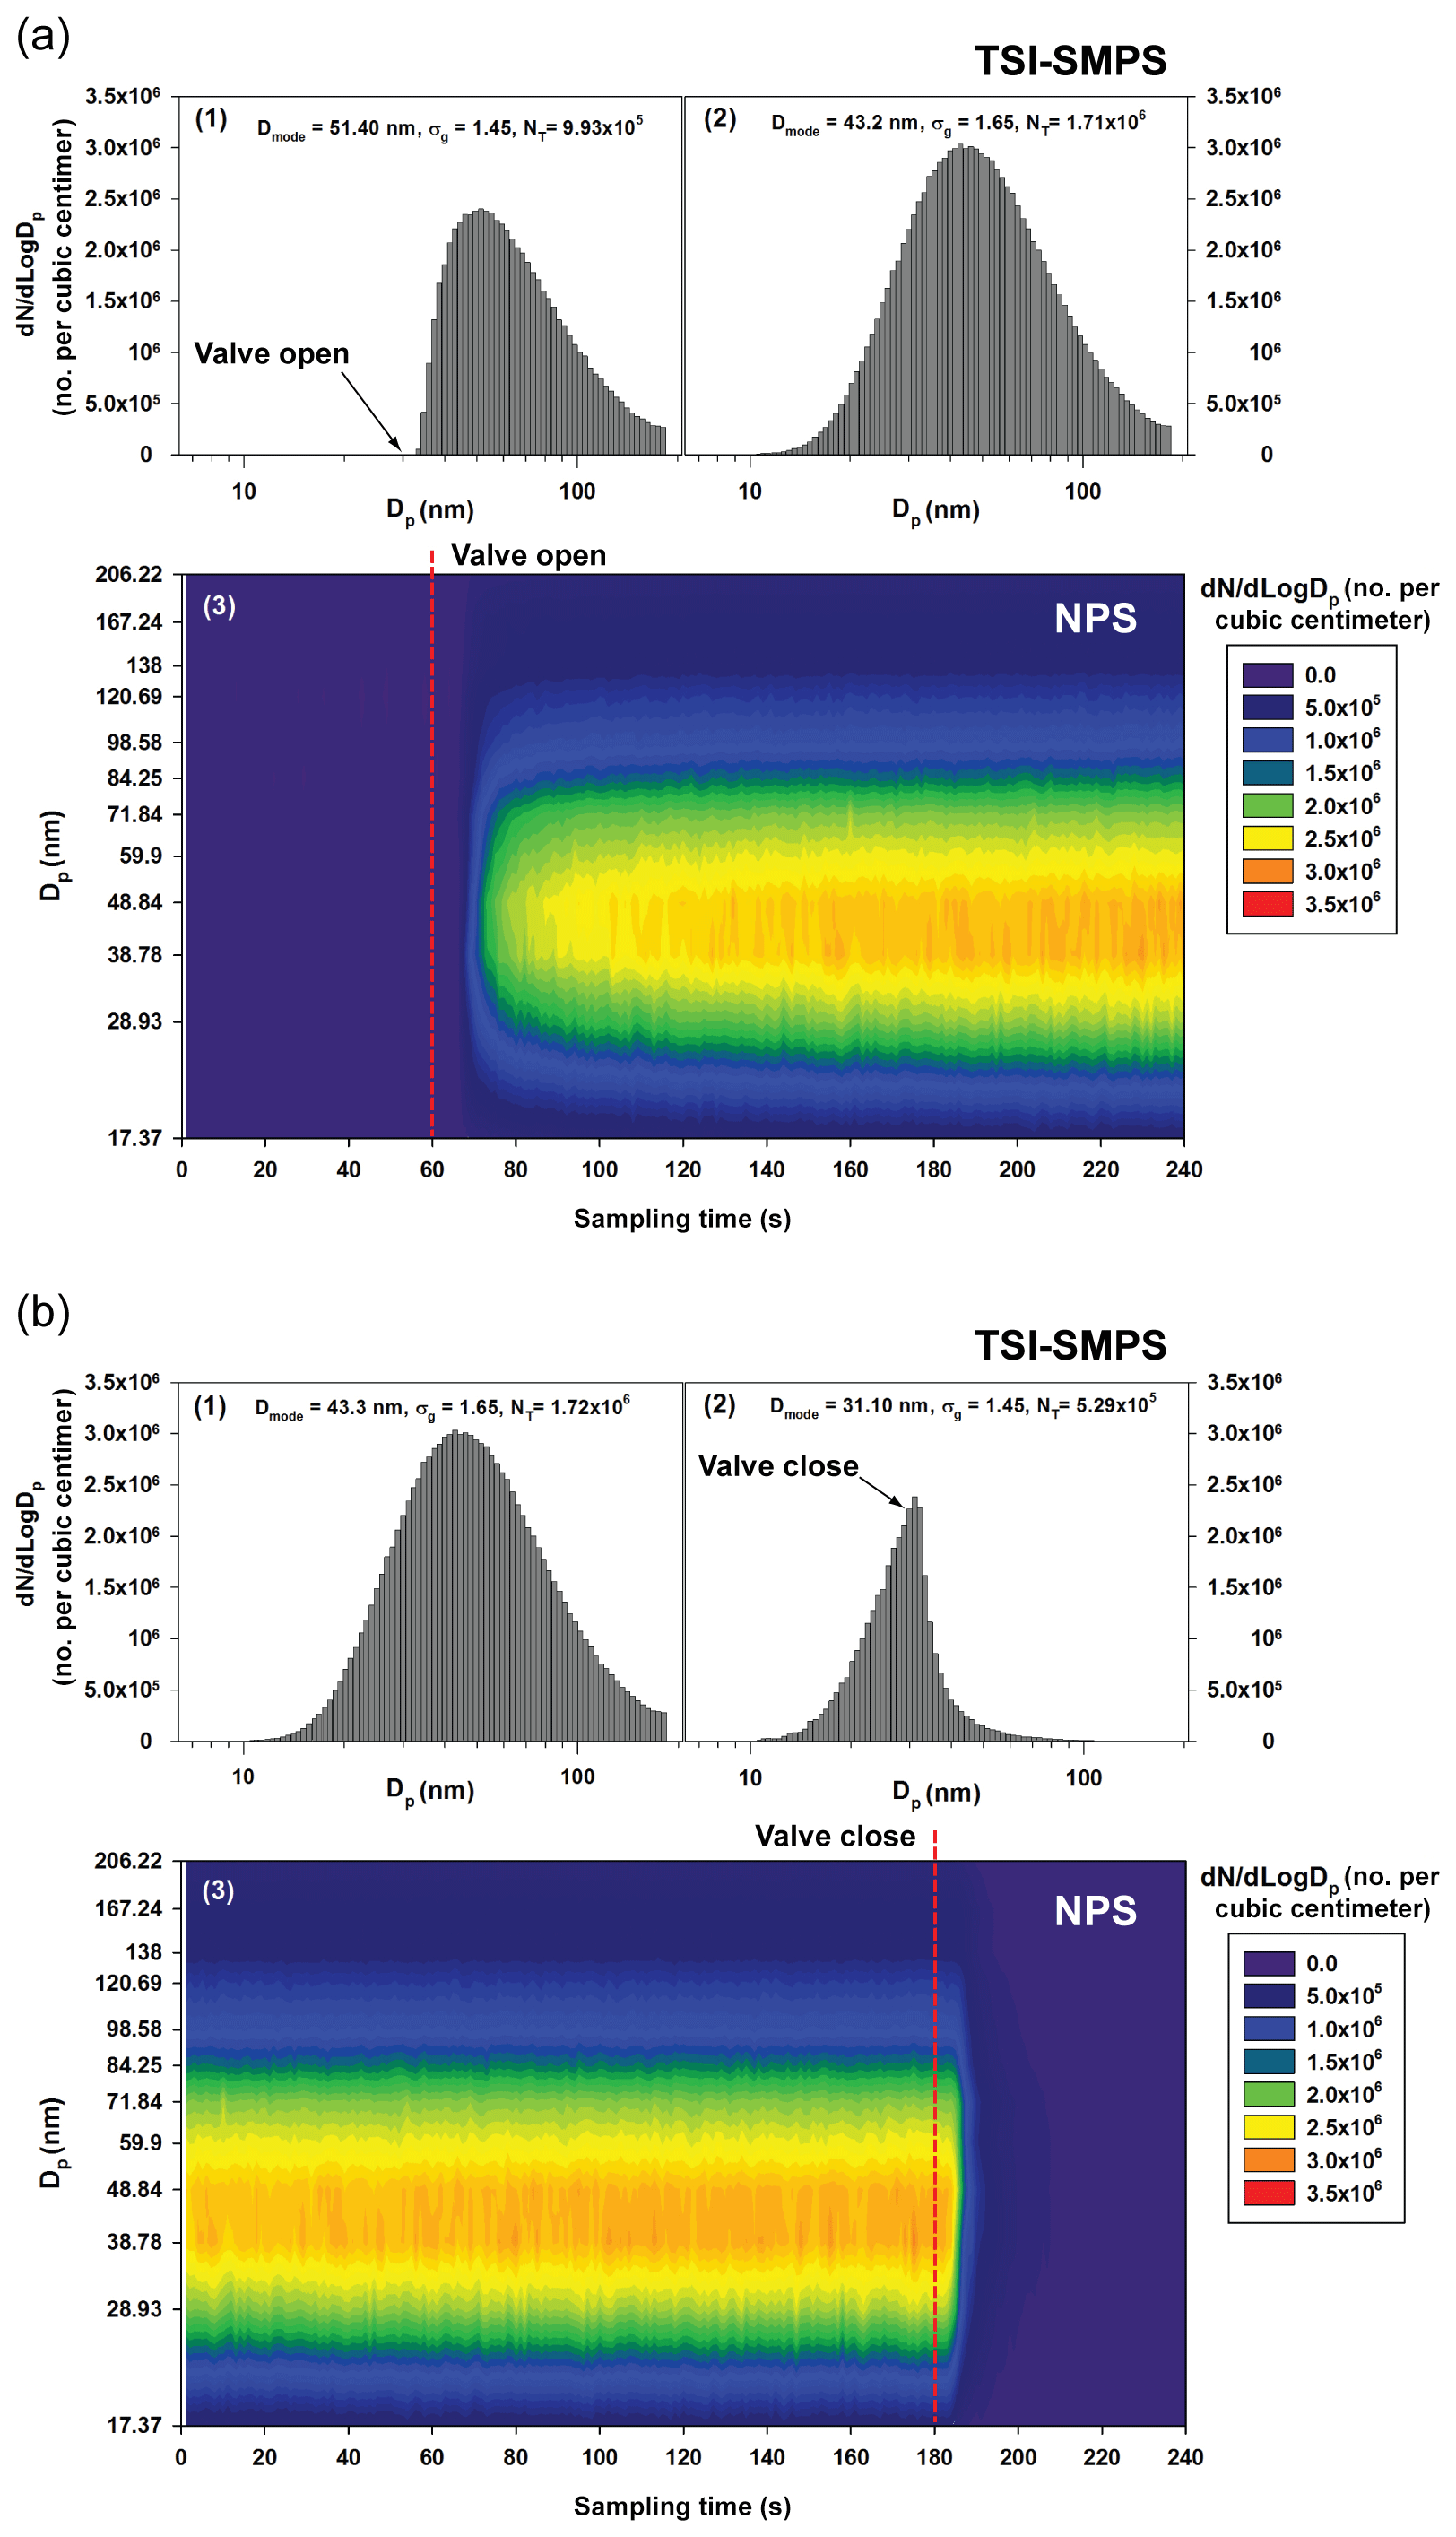
Figure 8Comparison of the size distributions measured by the TSI-SMPS and NPS for the unsteady particle size distribution in (a) increasing and (b) decreasing particle concentrations. The tested aerosols were introduced or blocked 60 or 180 s after starting measurements: (1) the first TSI-SMPS scanning data; (2) the second TSI-SMPS scanning data; (3) the NPS data for 240 s. The data were obtained at the NPS applied voltage of 1000 V.
By using the same experimental setup shown in Fig. 2c, we conducted performance tests for the NPS for unsteady particle size distributions by employing an on or off valve (“A” in Fig. 2c) to introduce or block aerosols to the instruments. Figure 8 shows the comparison between the particle size distributions obtained by the TSI-SMPS and NPS for 240 s measurements. The dotted red line in Fig. 8a-3 represents the moment we opened the valve (“A” in Fig. 2c), indicating the introduction of aerosols 60 s after the beginning of the first TSI-SMPS (or NPS) measurement. In Fig. 8b, we closed the valve to block the aerosols 60 s after the second TSI-SMPS measurement start (i.e., 180 s after the NPS measurement start). The x axis and y axis of the graph for the TSI-SMPS measurement results are particle diameter and number concentration, respectively. The NPS data are represented in a contour graph with the sampling time (x axis) and particle diameter (y axis). The color indicates the particle number concentration measured by the NPS.

Figure 9Size distributions measured by the (a) TSI-SMPS and (b) NPS during a cooking activity and (c) variation in particle concentration at mode diameters. The NPS data were obtained at the applied voltage of 1000 V.
In Fig. 8a-1, the concentration data appeared after the valve was opened (60 s after the first SMPS scan began). However, concentrations for particle sizes <32 nm were not recovered from the inversion of this scan because the corresponding voltages were applied to the DMA before the valve was opened, when there were no particles in the sample line. In the second scan, the complete size distribution was obtained. In contrast, the NPS measurement shows a rapid increase in particle concentration for the complete size range soon after the valve was opened. Specifically, the particle concentration started to increase or decrease approximately 5 s after the valve was opened or closed, respectively (Fig. S2 in the Supplement). Considering that the response time of the NPS is approximately 3.3 s (sum of the M-CPC response time of approximately 0.3 s and particle residence time in the MP-DMA, maximum 3 s), the rest of the delay time might be caused by the time required for concentration stabilization and particle transport. During the test for rapid decrease in particle concentration (Fig. 8b), the performances of the TSI-SMPS and NPS were quite distinct as well. After closing the aerosol valve ∼180 s after the measurement, data from the second scan of the TSI-SMPS showed only smaller particles, in a manner similar to the results in Fig. 8a. However, the size distribution measured by the NPS quickly approached zero. These tests indicate that the NPS can be successfully used for unsteady particle size distributions to observe changes in concentration.
Further NPS measurements under unsteady conditions of rapidly changing particle concentrations were performed for real-world applications. Figure 9a and b represent particle size distributions measured by TSI-SMPS and NPS, respectively, during the cooking of fish. The sampling location for the TSI-SMPS and NPS measurements was 1 m away from the cooking spot, which caused sudden changes in concentration. The cooking activity was continued for approximately 8 min. The size distribution obtained by the NPS is shown every 1 s while the TSI-SMPS measurement provides one size distribution every 2 min (total of six successive measurements). Therefore, the SMPS analysis provides only discontinuous size distributions. Figure 9c shows the particle concentration at a peak particle size for each measurement of the TSI-SMPS and NPS. From the NPS measurements during the cooking activity, particle concentrations varied significantly. Relatively low particle concentrations were observed approximately 180 s after the beginning of the activity, and then several peaks were observed until the end of the event. Like these experiments, size distribution data obtained every 1 s by the NPS can be informative in various applications.
We developed and evaluated the performance of a new nanoparticle sizer (NPS) that measures particle size distributions under unsteady conditions with changing concentrations. The NPS consists of a multiport-differential mobility analyzer (MP-DMA) that classifies 12 monodisperse particles of different size and multi-condensation particle counters (M-CPCs) that count the classified particles. The performances of the MP-DMA and M-CPC were evaluated by obtaining activation efficiency, detection efficiency, penetration ratio, and normalized size distributions. The results were used to calibrate the NPS raw data to derive a real particle number concentration and size distribution. The NPS was compared to a TSI-scanning mobility particle sizer (TSI-SMPS) for steady-state and unsteady particle concentrations using NaCl and Ag particles. The size distributions obtained by the NPS under steady-state condition agreed with the results from the TSI-SMPS. For unsteady particle size distributions with fast-changing particle concentrations, the NPS was found to be superior to the TSI-SMPS in terms of measurement speed. However, there remains a necessary improvement. During the NPS measurements, we experienced electrical breakdown when the applied voltage was approximately 4000–5000 V. Therefore, to improve the NPS system for a wider size range classification, further optimization is required. From the findings in this study, we believe that the NPS is a promising instrument for providing comprehensive information on particle size distributions in fast-changing concentration environments.
The data can be made available upon request from the corresponding author (khahn@hanyang.ac.kr).
The supplement related to this article is available online at: https://doi.org/10.5194/amt-13-1551-2020-supplement.
KHA conceptualized the instrument developed in this study (nanoparticle sizer), and he received the funding to support the project leading to the development of the instrument. HKL designed the experimental methodology and collected the data, and he wrote the first draft. HL validated and analyzed the experimental data. He wrote the final draft and edited the paper.
The authors declare that they have no conflict of interest.
This work was supported by the research fund of Hanyang University (HY-2019-P).
This research has been supported by Hanyang University (grant no. 201900000000418).
This paper was edited by Charles Brock and reviewed by two anonymous referees.
Agarwal, J. K. and Sem, G.: Continuous flow, single-particle-counting condensation nucleus counter, J. Aerosol Sci., 11, 343–357, 1980.
Chen, D. R., Li, W., and Cheng, M. D.: Development of a multiple-stage differential mobility analyzer (MDMA), Aerosol Sci. Technol., 41, 217–230, https://doi.org/10.1080/02786820601134551, 2007.
Fissan, H. J., Helsper, C., and Thielen, H. J.: Determination of particle size distributions by means of an electrostatic classifier, J. Aerosol Sci., 14, 354–357, https://doi.org/10.1016/0021-8502(83)90133-7, 1983.
Giamarelou, M., Stolzenburg, M., and Biskos, G.: The multiple monodisperse outlet differential mobility analyzer: Derivation of its transfer function and resolution, Aerosol Sci. Technol., 46, 951–965, https://doi.org/10.1080/02786826.2012.683838, 2012.
Hoppel, W. A.: Determination of the aerosol size distribution from the mobility distribution of the charged fraction of aerosols, J. Aerosol Sci., 9, 41–54, https://doi.org/10.1016/0021-8502(78)90062-9, 1978.
Hwang, I. and Ahn, K. H.: Performance evaluation of conventional type conductive cooling continuous flow compact water-based CPC (Hy-WCPC), J. Aerosol Sci., 113, 12–19, https://doi.org/10.1016/j.jaerosci.2017.07.007, 2017.
Kim, J. S., Chung, H., and Ahn, K.-H.: Development and Evaluation of Multi-Port System for Real-time Size Distribution Measurement, Proc. KAPAR Conf., Yongpyeong, South Korea, 69–70, 2007.
Knutson, E. O. and Whitby, K. T.: Aerosol classification by electric mobility: apparatus, theory, and applications, J. Aerosol Sci., 6, 443–451, https://doi.org/10.1016/0021-8502(75)90060-9, 1975.
Kulkarni, P. and Wang, J.: New fast integrated mobility spectrometer for real-time measurement of aerosol size distribution-I: Concept and theory, J. Aerosol Sci., 37, 1303–1325, https://doi.org/10.1016/j.jaerosci.2006.01.005, 2006.
Lee, H., Ku, H., and Ahn, K.: Numerical simulation of a multi-port differential mobility analyzer (MP-DMA) used in a real-time nano-particle sizer (NPS), Powder Technol., 362, 135–144, https://doi.org/10.1016/j.powtec.2019.11.055, 2020.
Liu, B. Y. H. and Pui, D. Y. H.: A submicron aerosol standard and the primary, absolute calibration of the condensation nuclei counter, J. Colloid Interface Sci., 47, 155–171, https://doi.org/10.1016/0021-9797(74)90090-3, 1974.
Oberreit, D. R., McMurry, P. H., and Hogan, C. J.: Mobility analysis of 2 nm to 11 nm aerosol particles with an aspirating drift tube ion mobility spectrometer, Aerosol Sci. Technol., 48, 108–118, https://doi.org/10.1080/02786826.2013.861893, 2014.
Stolzenburg, D., Steiner, G., and Winkler, P. M.: A DMA-train for precision measurement of sub-10 nm aerosol dynamics, Atmos. Meas. Tech., 10, 1639–1651, https://doi.org/10.5194/amt-10-1639-2017, 2017.
Stolzenburg, M. R. and McMurry, P. H.: Equations governing single and tandem DMA configurations and a new lognormal approximation to the transfer function, Aerosol Sci. Technol., 42, 421–432, https://doi.org/10.1080/02786820802157823, 2008.
Wang, S. C. and Flagan, R. C.: Scanning electrical mobility spectrometer, Aerosol Sci. Technol., 13, 230–240, https://doi.org/10.1080/02786829008959441, 1990.
Wiedensohler, A.: An approximation of the bipolar charge distribution for particles in the submicron size range, J. Aerosol Sci., 19, 387–389, 1988.
Williamson, C., Kupc, A., Wilson, J., Gesler, D. W., Reeves, J. M., Erdesz, F., McLaughlin, R., and Brock, C. A.: Fast time response measurements of particle size distributions in the 3–60 nm size range with the nucleation mode aerosol size spectrometer, Atmos. Meas. Tech., 11, 3491–3509, https://doi.org/10.5194/amt-11-3491-2018, 2018.