the Creative Commons Attribution 4.0 License.
the Creative Commons Attribution 4.0 License.
 | 16 Jan 2020
Comparison of TROPOMI/Sentinel-5 Precursor NO2 observations with ground-based measurements in Helsinki
Henrik Virta
Henk Eskes
Jari Hovila
John Douros
We present a comparison between satellite-based TROPOMI (TROPOspheric Monitoring Instrument) NO2 products and ground-based observations in Helsinki (Finland). TROPOMI NO2 total (summed) columns are compared with the measurements performed by the Pandora spectrometer between April and September 2018. The mean relative and absolute bias between the TROPOMI and Pandora NO2 total columns is about 10 % and 0.12×10¹⁵ molec. cm−2 respectively. The dispersion of these differences (estimated as their standard deviation) is 2.2×10¹⁵ molec. cm−2. We find high correlation (r = 0.68) between satellite- and ground-based data, but also that TROPOMI total columns underestimate ground-based observations for relatively large Pandora NO2 total columns, corresponding to episodes of relatively elevated pollution. This is expected because of the relatively large size of the TROPOMI ground pixel (3.5×7 km) and the a priori used in the retrieval compared to the relatively small field-of-view of the Pandora instrument. On the other hand, TROPOMI slightly overestimates (within the retrieval uncertainties) relatively small NO2 total columns. Replacing the coarse a priori NO2 profiles with high-resolution profiles from the CAMS chemical transport model improves the agreement between TROPOMI and Pandora total columns for episodes of NO2 enhancement. When only the low values of NO2 total columns or the whole dataset are taken into account, the mean bias slightly increases. The change in bias remains mostly within the uncertainties.
We also analyse the consistency between satellite-based data and in situ NO2 surface concentrations measured at the Helsinki–Kumpula air quality station (located a few metres from the Pandora spectrometer). We find similar day-to-day variability between TROPOMI, Pandora and in situ measurements, with NO2 enhancements observed during the same days. Both satellite- and ground-based data show a similar weekly cycle, with lower NO2 levels during the weekend compared to the weekdays as a result of reduced emissions from traffic and industrial activities (as expected in urban sites). The TROPOMI NO2 maps reveal also spatial features, such as the main traffic ways and the airport area, as well as the effect of the prevailing south-west wind patterns.
This is one of the first works in which TROPOMI NO2 retrievals are validated against ground-based observations and the results provide an early evaluation of their applicability for monitoring pollution levels in urban sites. Overall, TROPOMI retrievals are valuable to complement the ground-based air quality data (available with high temporal resolution) for describing the spatio-temporal variability of NO2, even in a relatively small city like Helsinki.
- Article
(3583 KB) - Full-text XML
-
Supplement
(688 KB) - BibTeX
- EndNote


Nitrogen oxides () play an important role in tropospheric chemistry, participating in ozone and aerosol production. NOx are mainly generated by combustion processes from anthropogenic pollution sources (including transportation, energy production and other industrial activities), and they are toxic in high concentrations at the surface (US-EPA, 2019). The NO2 amount in the atmosphere can be measured using satellite-based instruments. Launched in October 2017, TROPOMI (TROPOspheric Monitoring Instrument), the only payload on-board the Sentinel-5 Precursor (S5P) satellite of the European Space Agency (ESA), is expected to revolutionise the way we monitor air pollution from space because of its unprecedented spatial resolution (3.5×7 km at the beginning of the mission and 3.5×5.5 km since 6 August 2019) and high signal-to-noise ratio. TROPOMI (jointly developed by the Netherlands Space Office and ESA) is designed to retrieve the concentrations of several atmospheric constituents including ozone, NO2, SO2, CO, CH4, CH2O and aerosol properties, as well as surface UV radiation. TROPOMI derives information on atmospheric NO2 concentrations by measuring the solar light backscattered by the atmosphere and the Earth's surface. Due to its high spatial resolution, TROPOMI observations are particularly suitable to monitoring polluting emission sources at the city level. The S5P mission is part of the Space Component of the European Copernicus Earth Observation Programme.
TROPOMI builds on the experience from previous polar orbiting instruments such as the Dutch–Finnish Ozone Monitoring Instrument (OMI), which has been operating on-board NASA's EOS (Earth Observing System) Aura satellite (Levelt et al., 2006) since late 2004. OMI NO2 observations have been used in several air quality applications and the main achievements have been recently summarised by Levelt et al. (2018). The results achieved using OMI NO2 retrievals include estimating top-down polluting emissions, analysing changes in the pollution levels over the period of 13 years and verifying the success of environmental policy measures (e.g. Beirle et al., 2011; Castellanos and Boersma, 2012; Streets et al., 2013; Lu et al., 2015; Lamsal et al., 2015; Duncan et al., 2016; Krotkov et al., 2016; Liu et al., 2017). Also, OMI observations have been used for monitoring the NO2 weekly cycle over urban sites (Beirle et al., 2003; Boersma et al., 2009; de Foy et al., 2016). Recently, a reprocessing of the OMI NO2 dataset has become available (Boersma et al., 2018) as a deliverable of the European QA4ECV project. Many of the QA4ECV OMI retrieval developments have been incorporated in the TROPOMI NO2 retrieval processor.
Since TROPOMI/S5P is a very recent mission, accurate validation against independent ground-based measurements is needed in order to evaluate the quality of the retrieval. Recently, the Pandonia Global Network (PGN), including a network of ground-based Pandora spectrometers, has been established to provide reference measurements of NO2 total columns for validating satellite-based retrievals. Pandora measures direct sunlight in the ultraviolet–visible spectral range (280–525 nm) and provides NO2 total columns using the direct-sun DOAS (differential optical absorption spectroscopy) technique (Herman et al., 2009). Recently, Zhao et al. (2019) presented a method to derive NO2 total columns from Pandora zenith-sky measurements as well. The TROPOMI/S5P NO2 products are operationally validated by the S5P-MPC-VDAF (S5P – Mission Performance Centre – Validation Data Analysis Facility) using the Pandora NO2 total columns from the PGN. The operational validation results are reported every 3 months at the S5P-MPC-VDAF website (http://mpc-vdaf.tropomi.eu/, last access: 11 January 2020).
Very recently, Griffin et al. (2019) presented first results of the validation of TROPOMI NO2 retrievals over the Canadian oil sands using air-mass factors calculated with the high-resolution GEM-MACH model. They show how the TROPOMI NO2 vertical column densities are highly correlated with ground-based observations and have a negative bias of 15–30 %. In this work, we evaluate the quality of TROPOMI NO2 vertical columns against ground-based observations in the urban site of Helsinki (60.2∘ N; 24.95∘ E). Helsinki is a city with about half a million inhabitants, surrounded by a larger urban area (including the city of Espoo in the west and Vantaa in the north-east). Satellite-based NO2 observations from the OMI instrument in Helsinki were previously validated by Ialongo et al. (2016), finding that the bias between OMI and Pandora total columns ranges between −30 % and +5 %, depending on the retrieval algorithm and parameters. The improved resolution of TROPOMI retrievals is expected to reduce the effect of spatial averaging compared to OMI, leading to a better agreement with the ground-based Pandora observations that have a relatively narrow field of view.
The satellite- and ground-based data used in the analysis are described in Sect. 2. The results of the comparison between TROPOMI NO2 retrievals and ground-based Pandora total columns are shown in Sect. 3. The temporal correlation with in situ NO2 surface concentration measurements and the NO2 weekly cycle are also analysed. Finally, the conclusions are presented in Sect. 4.
2.1 TROPOMI NO2 observations
TROPOMI is a passive-sensing hyperspectral nadir-viewing imager aboard the Sentinel-5 Precursor (S5P) satellite, launched on 13 October 2017. S5P is a near-polar sun-synchronous orbit satellite flying at an altitude of 817 km, with an overpass local time at ascending node (LTAN) of 13:30 and a repeat cycle of 17 d (KNMI, 2017). TROPOMI is operated in a non-scanning push broom configuration, with an instantaneous field of view of 108∘ and a measurement period of about 1 s. This results in a swath width of approx. 2600 km, an along-track resolution of 7 km and daily global coverage (KNMI, 2017). TROPOMI's four separate spectrometers measure the ultraviolet (UV), UV–visible (UV-VIS), near-infrared (NIR) and short-wavelength infrared (SWIR) spectral bands, of which the NIR and SWIR bands are new as compared to its predecessor OMI (Veefkind et al., 2012).
The NO2 columns are derived using TROPOMI's UV–VIS spectrometer backscattered solar radiation measurements in the 405–465 nm wavelength range (van Geffen et al., 2015, 2019). The swath is divided into 450 individual measurement pixels, which results in a near-nadir resolution of 7×3.5 km. The total NO2 slant column density is retrieved from the Level 1b UV–VIS radiance and solar irradiance spectra using the DOAS method (Platt and Stutz, 2008). The species fitted by TROPOMI and their corresponding literature cross sections can be found in van Geffen et al. (2019). Tropospheric and stratospheric slant column densities are separated from the total slant column using a data assimilation system based on the TM5-MP chemical transport model, after which they are converted into vertical column densities using a look-up table of altitude-dependent air-mass factors (AMFs) and information on the vertical distribution of NO2 from TM5-MP available with a horizontal resolution of and a time step of 30 min (van Geffen et al., 2019; Boersma et al., 2018; Williams et al., 2017).
The instrument, the NO2 retrieval and assimilation scheme and the data product have been described in detail by Veefkind et al. (2012), KNMI (2017), KNMI (2019), Eskes et al. (2019) and van Geffen et al. (2019).
We used reprocessed (RPRO) TROPOMI NO2 data files, processor version 1.2.2, for the entire study period of 15 April to 30 September 2018. Reprocessed data files are occasionally generated using older sensing data as new processor algorithm versions become available. Version 1.2.x includes retrieval enhancements for high solar zenith angle and snow-covered scenes (Eskes et al., 2019), both of which are important for high-latitude locations such as Helsinki. The time period of this study did not, however, include any days with snow cover. Additionally, offline (OFFL) and near-real-time (NRTI) NO2 products are also available. Offline data files are the main TROPOMI data product and are made available within about 2 weeks from the sensing time, whereas NRTI files are available within 3 h of measurement time. NRTI files are generated using forecast TM5-MP data rather than analysis data as with offline and reprocessed files (van Geffen et al., 2019), but the differences between the offline/reprocessed and near-real-time products are generally small (Lambert et al., 2019).
The TROPOMI NO2 product used in the comparison was the summed total column, which is the sum of the tropospheric and stratospheric vertical column densities. It was chosen over the total column product since the latter's sensitivity to the ratio between the stratospheric and tropospheric a priori columns may lead to substantial systematic retrieval errors. The intermediate step of using data assimilation to first estimate the stratospheric column does remove part of this error. The summed total column product is described by the data provider as the best physical estimate of the NO2 vertical column and recommended for comparison to ground-based total column observations (van Geffen et al., 2019). The precision values of the summed total columns used in the analysis stay within the range of 0.5–4.5×10¹⁵ molec. cm−2 (or about 10 %–50 %). The data before 30 April 2018 were downloaded from the Sentinel-5P Expert Users Data Hub (https://s5pexp.copernicus.eu/dhus, last access: 11 January 2020) as part of the S5P validation team activities, and starting from this date from the S5P Pre-Operations Data Hub (https://s5phub.copernicus.eu/dhus, last access: 11 January 2020).
Figure 1 shows the TROPOMI NO2 tropospheric columns over Helsinki averaged over the period 15 April to 30 September 2018. The largest enhancements are visible over the main traffic lanes as well as the Helsinki–Vantaa airport and surrounding area. Overall, the NO2 levels during weekends (Fig. 1b) are smaller than those observed during weekdays (Fig. 1a) by about 30 %. This is typical for urban sites due to the weekly variability of traffic-related emissions, which are relatively higher during working days (from Monday to Friday). We also note that the NO2 spatial distribution shown in Fig. 1 is partially affected by systematic wind patterns, which causes the NO2 levels in the eastern part of the area to become relatively higher than the western part. Figure S1 in the Supplement shows the difference between the NO2 tropospheric columns (normalised to the maximum value in the area) for all wind and low wind speed (less than 3 m s−1) conditions. The pixels in red and blue in Fig. S1 indicate the area where the NO2 levels are relatively higher or lower, respectively, due to the wind patterns. This is related to the prevailing wind directions from south-west over the Helsinki capital region.
Since the retrieval of TROPOMI vertical column densities (VCDs) is sensitive to the a priori estimate of the NO2 profile shape, the accuracy of the VCDs may be improved by using a priori profiles from a chemical transport model (CTM) with a higher resolution than the of TM5-MP (Williams et al., 2017). The air-mass factor (AMF) can be recomputed using an alternative a priori NO2 profile, resulting in a new retrieval of the tropospheric NO2 column as described by Eskes et al. (2019).
In order to analyse their impact on the comparison, below 3 km altitude we used NO2 profiles from the CAMS regional ENSEMBLE model (Météo-France, 2016; Marécal et al., 2015) as an alternative to the TM5-MP profiles. The CAMS regional ENSEMBLE is a median of seven European CTMs, and the data are provided on a regular grid over Europe on eight vertical levels up to 5 km altitude. In addition, the CAMS global model was used to generate the profiles above 3 km altitude with the assumption that this model gives a more reliable description of NOx in the free troposphere. Data for CAMS global are provided on a regular grid on 60 model levels reaching up to 0.1 hPa (Flemming et al., 2015). In particular, we used the ratios between TROPOMI tropospheric air-mass factors derived using the hybrid CAMS regional/global a priori profile (henceforth “CAMS a priori”) and the TM5-MP a priori profile (see Sect. 2.3). These ratios were derived on the regular CAMS grid for the period 30 April to 30 September 2018.
In order to minimise representativeness errors during the comparison, certain considerations were taken into account so that the fields could be correctly sampled in space and time. Horizontally, all available gridded data were interpolated to the CAMS regional, grid. Source grids in this process were either the TROPOMI native grid which is different for each orbit, the CAMS global grid or the TM5-MP grid. Horizontal interpolation of retrieval columns was realised by means of a weighted average of all individual columns within a target grid cell. Intensive variables (e.g. temperatures, pressures, averaging kernels, the tropopause layer index) were interpolated horizontally using bilinear regridding. Modelled fields were also interpolated in time, based on the satellite overpass time over Central Europe. All vertical levels of source data were linearly interpolated to the TM5-MP vertical levels and all subsequent integrations to columns were performed based on those levels. Pressures at each of those levels were calculated based on the surface pressure and the hybrid coefficients included in the TROPOMI product, which originate in TM5-MP. For the column integrations, all concentrations were converted to densities based on temperature and pressure profiles provided by TM5-MP.
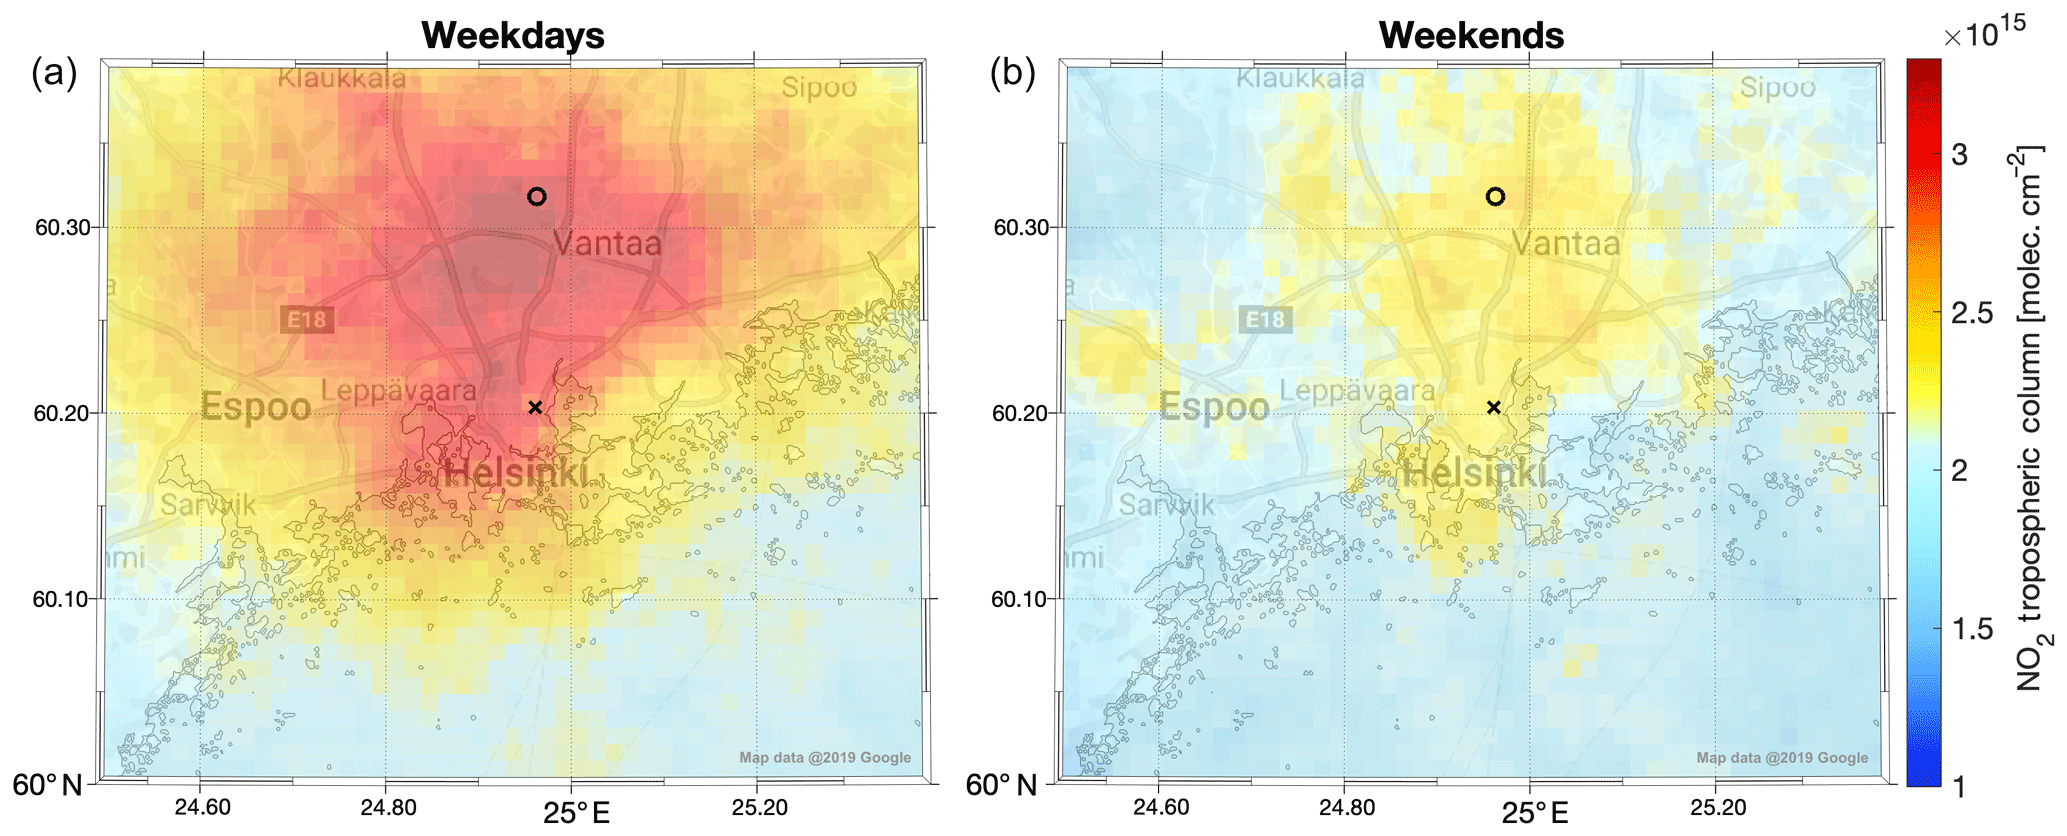
Figure 1Average TROPOMI NO2 tropospheric columns over Helsinki during the period 15 April to 30 September 2018. (a) and (b) correspond to weekdays and weekends respectively. The data have been binned and averaged to a 1 km resolution grid. The locations of the Kumpula ground-based station and the Helsinki–Vantaa airport are shown with a black cross and circle respectively.
2.2 Ground-based NO2 observations
The NO2 total columns measured by the ground-based Pandora instrument #105 located in the district of Kumpula, Helsinki, Finland (60.20∘ N, 24.96∘ E), are compared to the TROPOMI NO2 retrievals. The Pandora system is composed of a spectrometer connected by a fibre optic cable to a sensor head with 1.6∘ FOV (field of view). A sun-tracking device allows the optical head to point at the centre of the Sun with a precision of 0.013∘ (Herman et al., 2009). Pandora performs direct-sun measurements in the UV–VIS spectral range (280–525 nm) and provides NO2 total vertical column densities, among other products.
The NO2 total column retrieval is based on the DOAS spectral-fitting technique (e.g. Cede et al., 2006), with NO2 and O3 being the trace gases fitted. The algorithm derives the relative NO2 slant column densities (SCDs) from the 400–440 nm spectral band and converts them to absolute SCDs using a statistically estimated reference spectrum obtained using the minimum-amount Langley extrapolation method (MLE; Herman et al., 2009).
The Pandora SCD retrieval employs a temperature correction to the cross sections used in the spectral-fitting procedure based on modelled monthly average NO2 and temperature profiles and high-resolution temperature-dependent cross sections by Vandaele et al. (1998) for NO2 and Serdyuchenko et al. (2014) for O3 (as in the TROPOMI retrieval). We note that while TROPOMI uses the European Centre for Medium-range Weather Forecasts (ECMWF) operational model as its source for atmospheric temperature profiles (van Geffen et al., 2019), Pandora uses a precalculated atmospheric temperature for a typical NO2 profile (Cede, 2019). Due to the nature of direct-sun measurements no Ring effect correction is needed for Pandora (Herman et al., 2009).
The NO2 columns are available about every 1.5 min. The full description of the Pandora instrument and the algorithm for the inversion methodology has been presented by Herman et al. (2009). The nominal clear-sky precision of the Pandora NO2 total column retrievals is in the order of 0.3×10¹⁵ molec. cm−2 with an accuracy of about molec. cm−2. The accuracy depends on the uncertainties in the MLE-calculated reference spectrum, the difference between the actual and assumed atmospheric temperature profiles and the uncertainties in the laboratory-determined absorption cross sections (Herman et al., 2009). At typical Helsinki concentrations (6×10¹⁵ molec. cm−2) and AMF values (2.0) most of the systematic errors are due to uncertainties in the reference spectrum (Sect. 3.3 in Herman et al., 2009). Pandora #105 is part of the Pandonia global network and the observations used in this paper were processed following the Pandonia procedure and distributed at http://lb3.pandonia.net/FMI/Pandora105s1/L2/Pandora105s1_FMI_L2Tot_rnvs0p1-5.txt (last access: 29 November 2019).
The NO2 surface concentrations available from the Kumpula, Helsinki, air quality (AQ) station were used in order to analyse the temporal correspondence between surface NO2 concentrations and TROPOMI vertical columns. This station, also known as the SMEAR III station (Järvi et al., 2009), is located close to the Pandora instrument (about 100 m distance), and is classified as a semi-urban site. Nitrogen oxides are measured using a chemiluminescence-based analyser (HORIBA APNA-360, Kato and Yoneda, 1997). NOx and NO measurements from the station are available from the SmartSMEAR online service in intervals of 1 min and in units of ppb (https://avaa.tdata.fi/web/smart, last access: 11 January 2020), while NO2 measurements are available from the FMI (Finnish Meteorological Institute) measurement database as hourly averaged concentrations in units of µg m−3 (no open access). The air quality data were linearly interpolated to TROPOMI overpass times when compared with collocated Pandora and TROPOMI data. The middle of the 1 h averaging period was used as the time stamp for the AQ measurements, as it was found that this resulted in the best correlation with collocated Pandora measurements.
2.3 Methodology
We evaluate the agreement between TROPOMI and Pandora NO2 vertical column densities by calculating the mean absolute difference (MD), the mean relative difference (MRD), the dispersion (i.e. the standard deviation) of the differences (σ), the correlation coefficient (r) and the slopes of ordinary least squares and York linear regression fits for the measurements. The MD is defined as the average difference between the TROPOMI and Pandora VCDs in Eq. (1), whereas the MRD is the average of these differences when normalised with Pandora's VCD (Eq. 2).
A positive (negative) MD or MRD is thus an indication of TROPOMI overestimation (underestimation). The York linear regression (York et al., 2004) is used alongside the traditional least squares linear regression, since it has been shown to be appropriate in situations where the two sets of data have different levels of uncertainty (Wu and Yu, 2018). We also analyse weekdays and weekends separately, and the results are presented in Sect. 3.
Both TROPOMI and Pandora data were separately filtered according to a set of quality assurance criteria, after which the remaining temporally collocated measurements were compared with each other. For TROPOMI, only measurements with a data quality value QA >0.75 are used, which disqualifies scenes with a cloud radiance fraction >0.5, some scenes covered by snow or ice and scenes that have been determined to include errors or problematic retrievals. Further details on the QA value are provided in the appendices of van Geffen et al. (2019). Only TROPOMI pixels including the Helsinki Pandora station were considered for the comparison. Also, only Pandora retrievals with a data quality flag value of 0, 1, 10 or 11, corresponding to so-called assured and not-assured high- or medium-quality data (Cede, 2019), were taken into account. Pandora measurements within 10 min of TROPOMI overpass were averaged to get the Pandora component of the validation data pairs. Wind speed data (average from the four lowest pressure levels: 925, 950, 975 and 1000 hPa) available from the ECMWF as part of the ERA5 reanalysis product (https://cds.climate.copernicus.eu, last access: 11 January 2020) were associated with each data pair in order to quantify the effect of advection on the NO2 concentrations. The wind data were linearly interpolated to the Helsinki Pandora station's coordinates and the overpass time of each TROPOMI pixel used in the comparison.
Furthermore, we analyse the effect of the colocation choices on the MD, MRD, standard deviation of the differences σ and correlation coefficient by varying both the maximum distance from the ground-based station and the averaging time interval for Pandora measurements around the S5P overpass time. The results are presented in Sect. 3. When calculating these values for increasing maximum distances, we also required that in all cases the TROPOMI pixel above the station had to have a valid measurement fulfilling our quality criteria.
The effect of using high-resolution CAMS a priori NO2 profiles instead of TM5-MP (as used in the standard product) in the calculation of TROPOMI VCDs was analysed by calculating an alternative summed column using the ratio (R) between the tropospheric air-mass factors derived using CAMS and TM5-MP a priori profiles, computed on the CAMS regional grid with 0.1∘ resolution (see Sect. 2.1). For each available orbit we used the value of R in the CAMS grid pixel that included the Pandora station. The new summed column, derived using the CAMS a priori profile, was then calculated from the tropospheric and stratospheric NO2 VCDs of the standard L2 product as
The stratospheric columns from TM5-MP (as in the standard product) are used in the calculation of the new summed columns because at the moment CAMS global does not include detailed stratospheric chemistry nor accurate NO2 profile information in the stratosphere. The new TROPOMI-CAMS summed columns calculated using Eq. (3) were then also compared to the Pandora total columns, and the results are presented in Table 2 and Fig. 8. Apart from these two instances, all tables and figures in this paper use standard TROPOMI data products (i.e. based on TM5-MP a priori profiles).
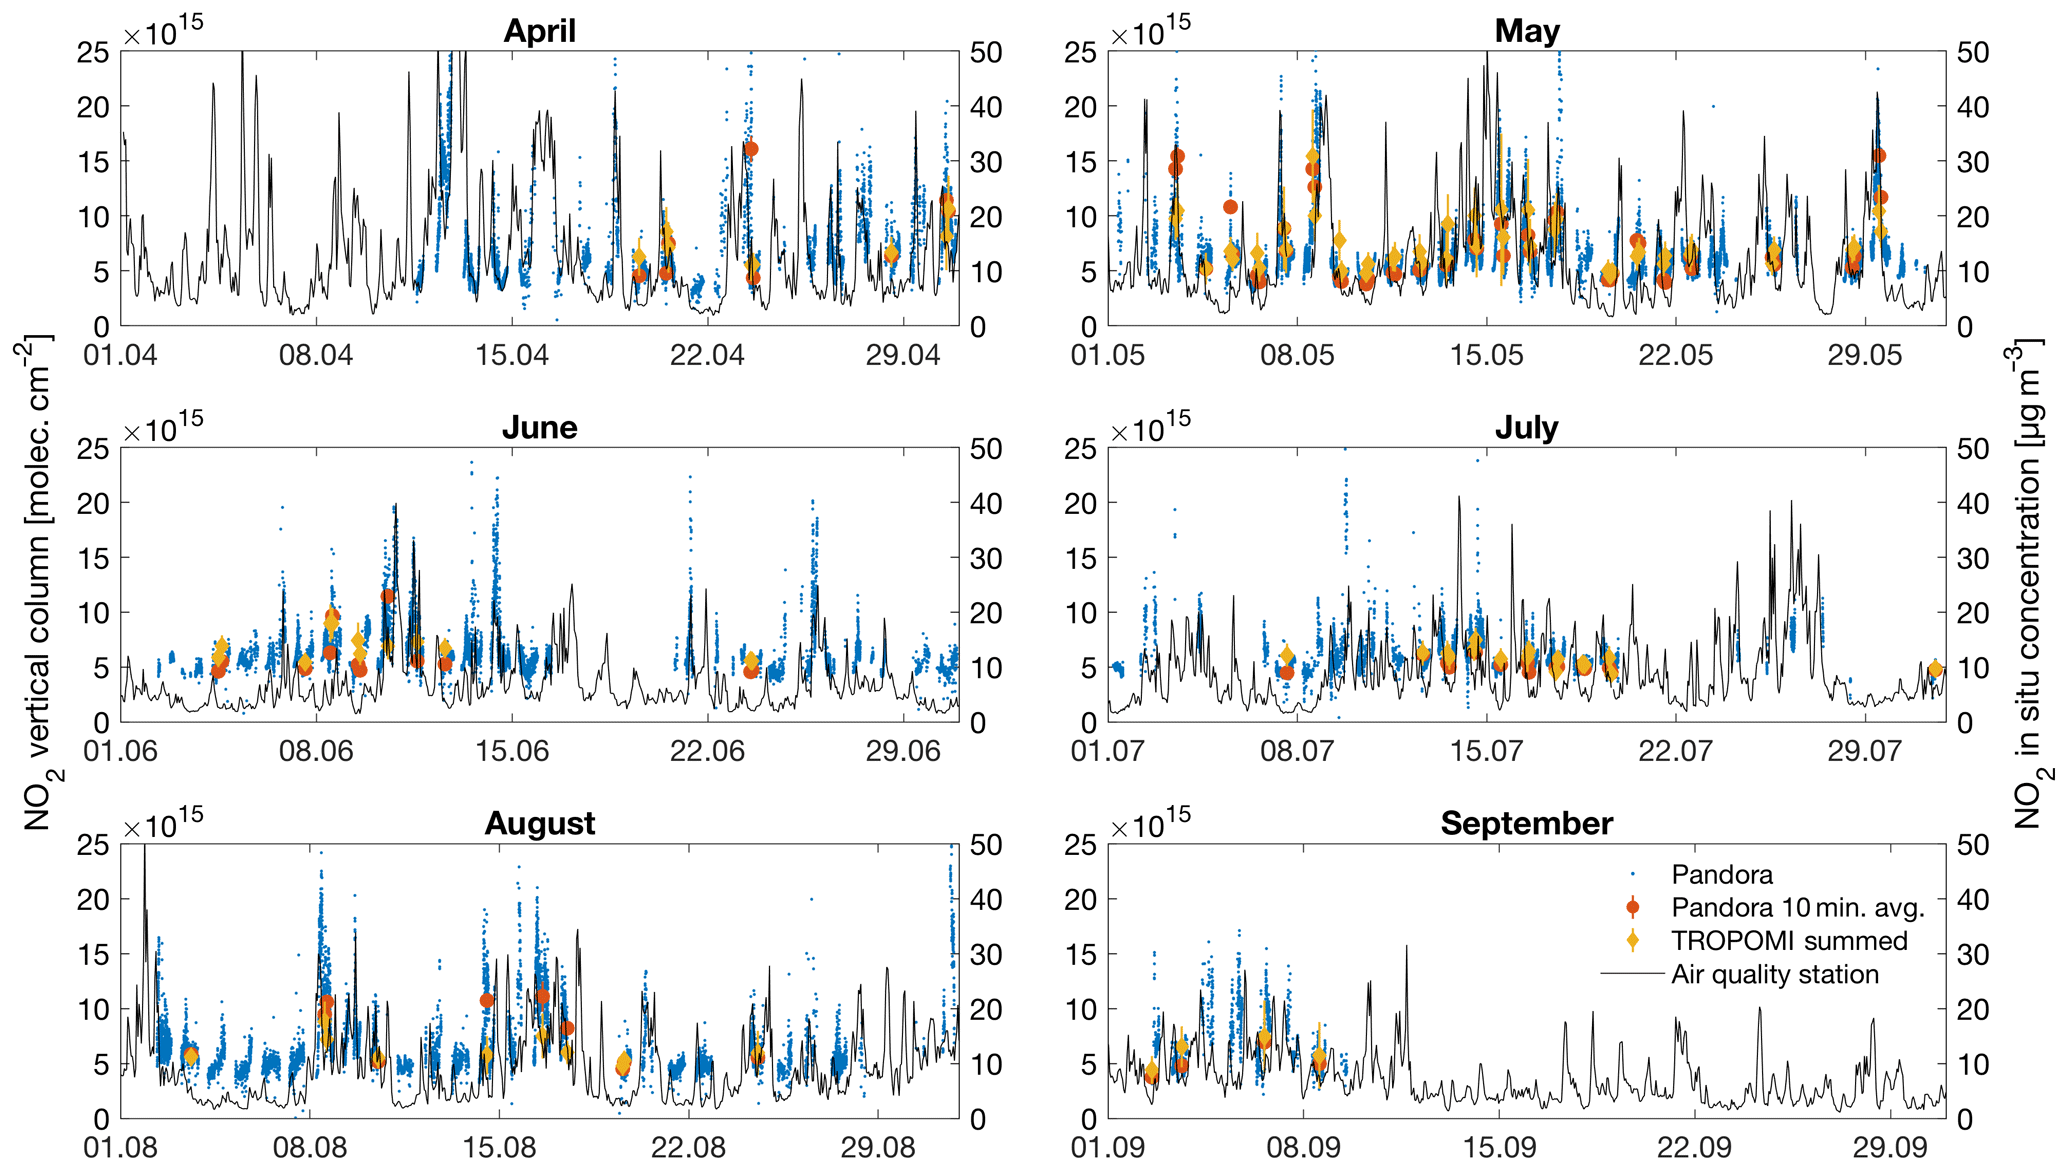
Figure 2Time series of collocated Pandora total and TROPOMI summed NO2 columns during the period 15 April to 30 September 2018. Blue dots are all the available Pandora observations; red dots are the Pandora observations averaged 10 min before and after S5P's overpass (with standard errors of the mean as error bars); yellow diamonds are TROPOMI summed columns of the pixels including the ground-based Pandora station (with retrieval precisions as error bars). The black line (right y axis) indicates the NO2 surface concentrations from the in situ measurements at the Kumpula AQ station.
Figure 2 shows the time series of the NO2 measurements used in the analysis, covering the period April to September 2018. The Pandora NO2 total columns are shown in their original time resolution (blue dots) as well as averaged 10 min around the S5P overpass (red dots). The latter are used in the quantitative comparison to the TROPOMI NO2 summed columns (yellow diamonds). The hourly NO2 surface concentrations measured at Kumpula AQ station are also shown on the right-hand y axis (black line). The Pandora total columns and the surface concentrations show similar peaks and day-to-day variability (blue dots and black line respectively), which shows how the Pandora observations are sensitive to the changes in the NO2 levels occurring at the surface. We note that the collocated TROPOMI and Pandora vertical columns (yellow diamonds and red dots, respectively, in Fig. 2) also mostly follow the same day-to-day variability. The largest differences between TROPOMI and Pandora vertical columns, with TROPOMI smaller than Pandora, correspond to relatively high NO2 enhancements measured at the surface (black line in Fig. 2). This is expected, as the comparatively large size of the TROPOMI pixels leads to greater spatial averaging compared to the Pandora field of view.
In order to further compare satellite- and ground-based collocated observations, Fig. 3 shows the scatterplot of Pandora and TROPOMI total columns from the overpasses presented in Fig. 2. The filled dots correspond to weekdays while the empty circles to the weekends. The colour indicates the corresponding wind speed. The weekend overpasses fall mostly into the bottom-left area of the scatterplot, corresponding to relatively small NO2 total columns from both Pandora and TROPOMI retrievals. This is expected due to the NO2 weekly cycle over urban sites, i.e. reduced polluting emissions from traffic during the weekend compared to the weekdays. Furthermore, the overpasses corresponding to high wind speed values (green–yellow colours in Fig. 3) also fall into the bottom-left area of the scatterplot. In these cases, the dilution by the wind acts to reduce the NO2 levels. Overall, the data points are quite close to the one-to-one line, except for some cases with elevated NO2 total columns measured by Pandora. These cases correspond to NO2 enhancements with small wind speed (below 3 m s−1), when the spatial dilution effect of TROPOMI's ground footprint as compared to Pandora's narrow field of view is especially pronounced.
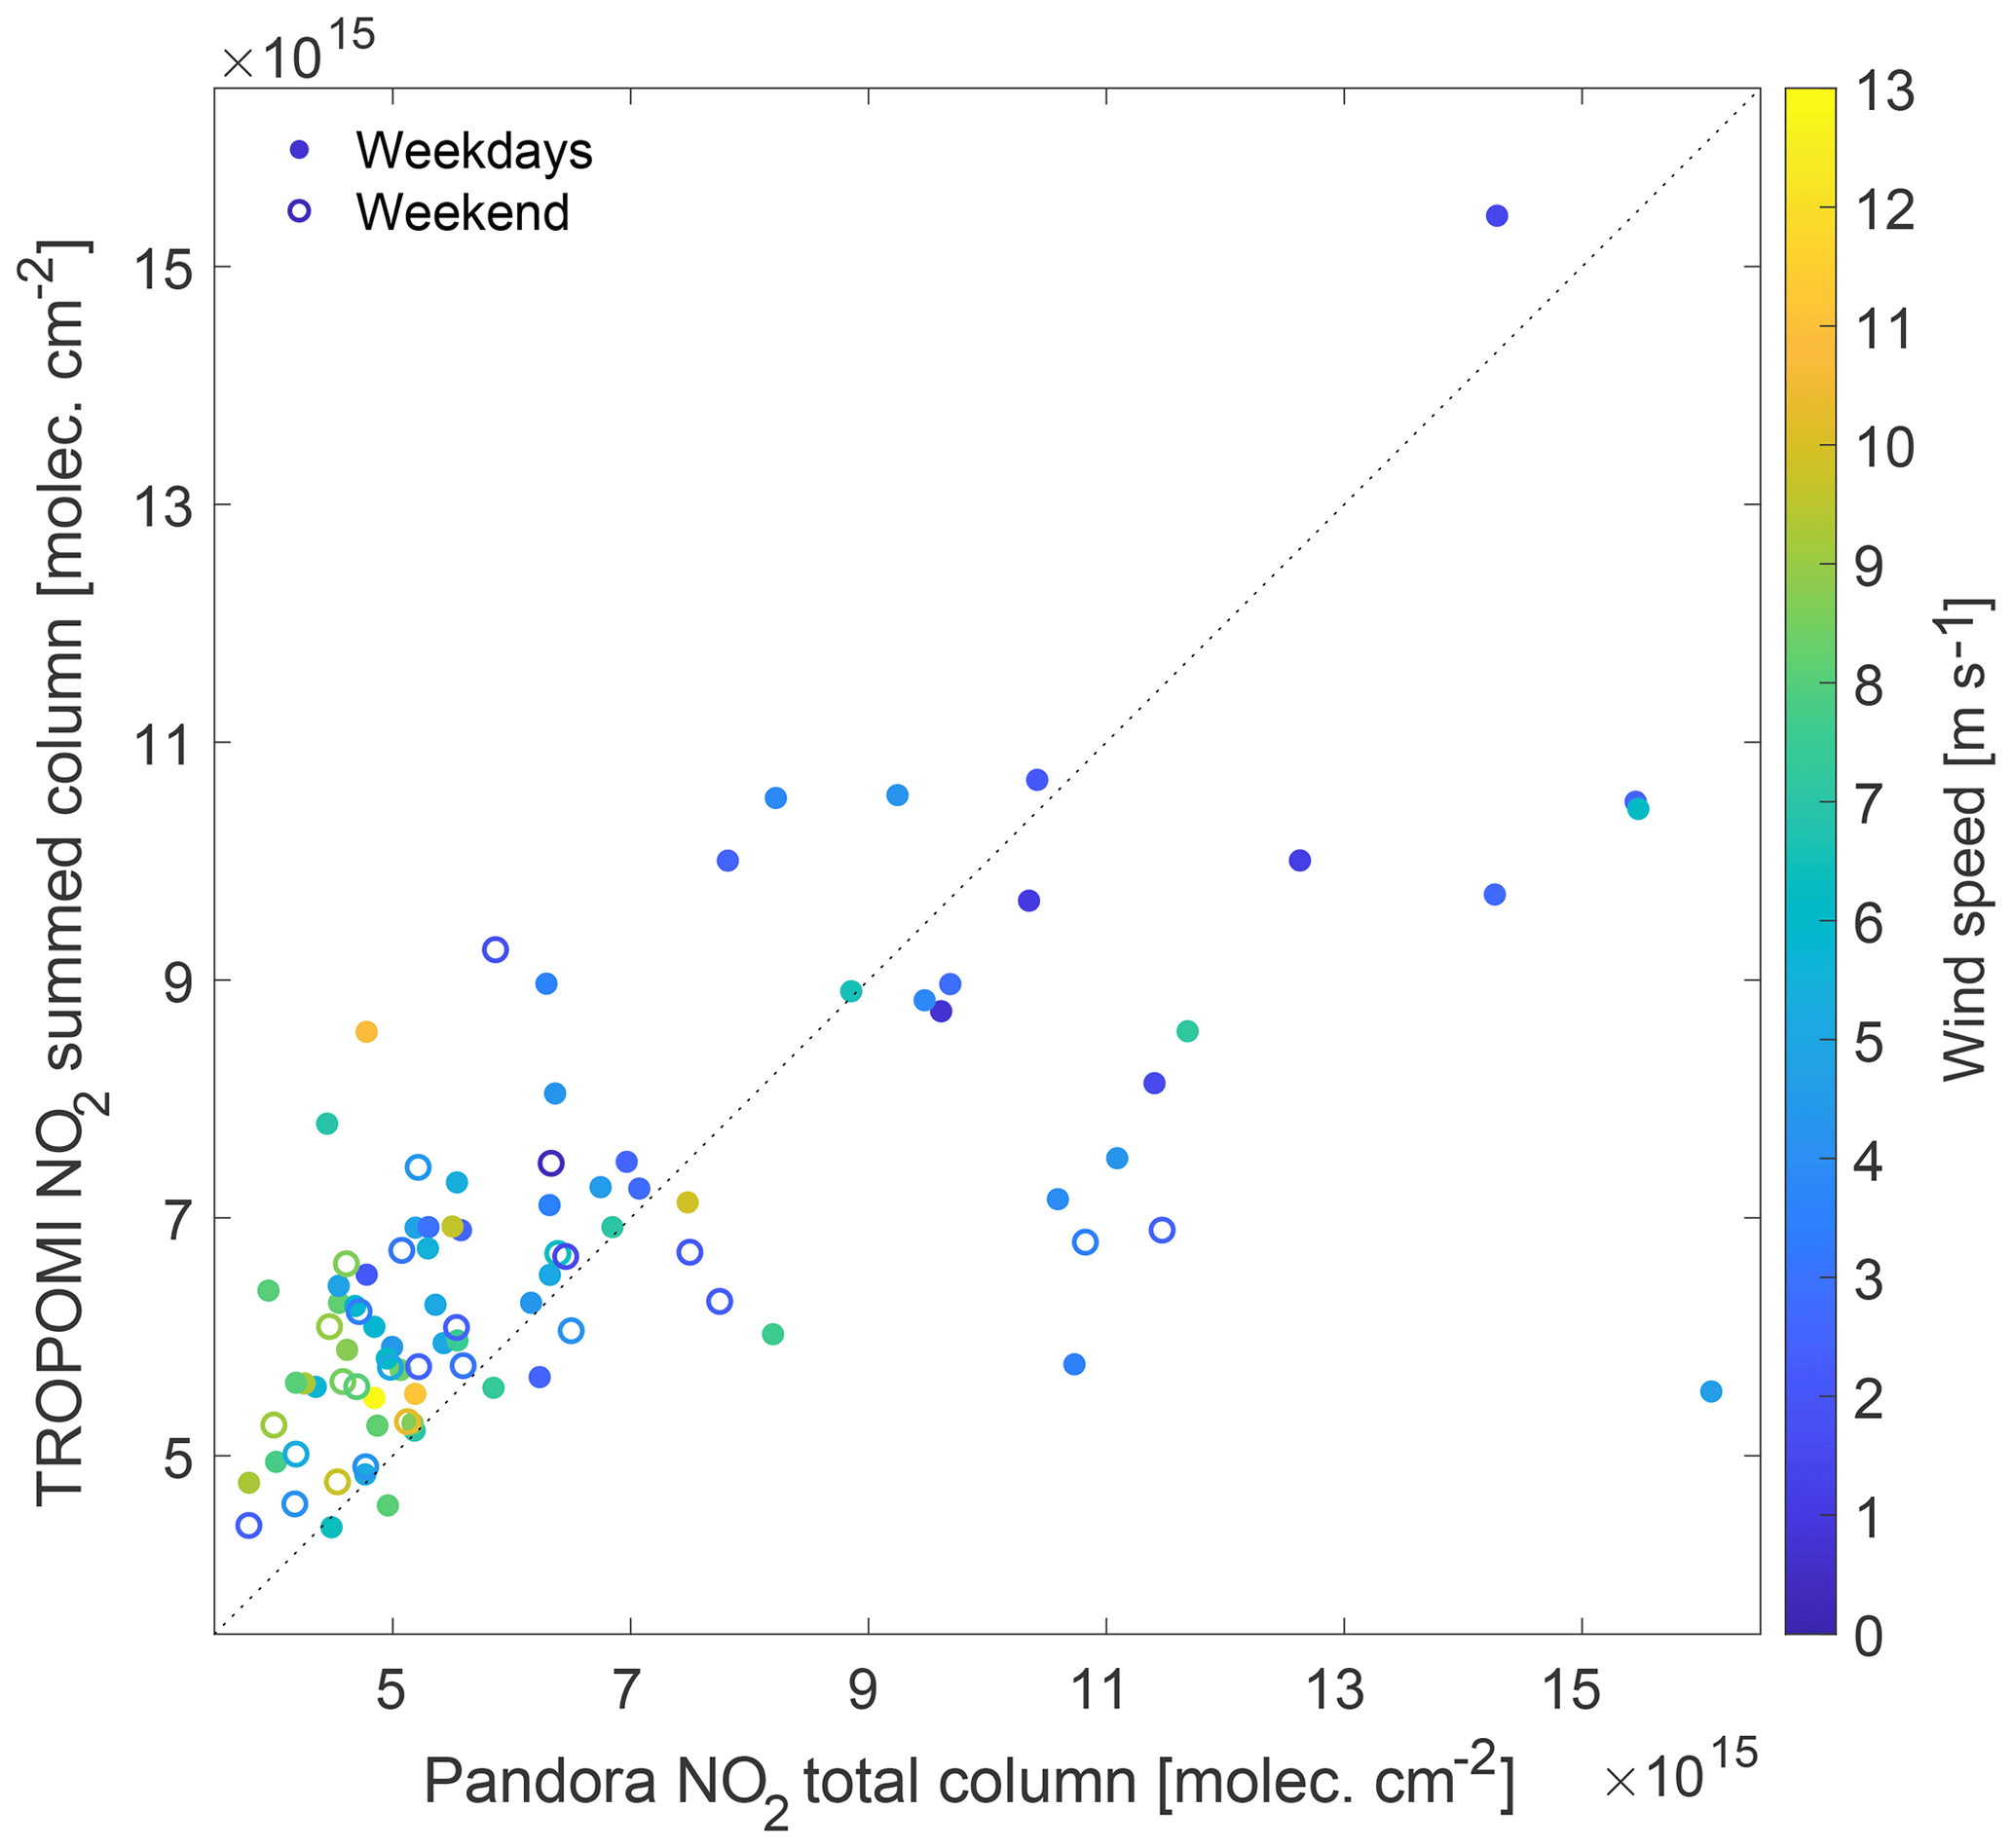
Figure 3Scatterplot of Pandora and TROPOMI vertical columns. The filled dots correspond to weekdays while the empty circles to the weekends. The colour indicates the wind speed interpolated at the overpass time. The 1:1 line is plotted as a dotted line.
Table 1Statistics of the comparison between TROPOMI and Pandora NO2 total columns. The uncertainties are the corresponding standard errors of the mean. The uncertainty estimates used in the York fit are pixel-specific precisions for TROPOMI (included in the data product), and standard errors of the mean for Pandora as calculated for the set of measurements within 10 min of the S5P overpass.
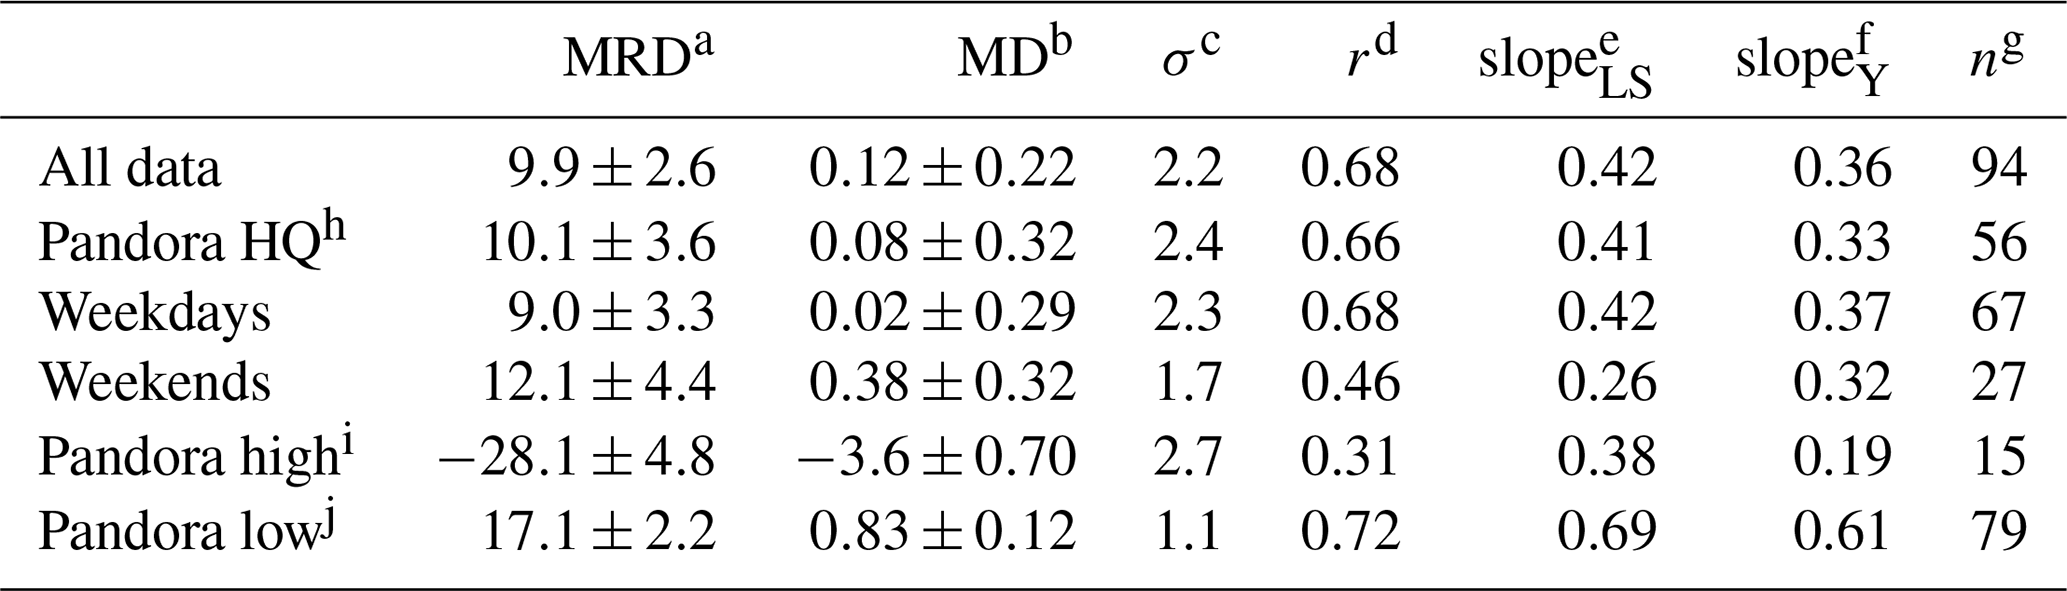
a Mean relative difference (%). b Mean difference (×1015 molec. cm−2). c Standard deviation of absolute bias (×1015 molec. cm−2). d Correlation coefficient. e Least squares linear fit slope. f York linear fit slope. g Number of collocations. h High-quality Pandora observations (QA value 0 or 10). i Pandora NO2 total columns ≧10×1015 molec. cm−2. j Pandora NO2 total columns molec. cm−2.
Table 1 summarises the results of the comparison between TROPOMI and Pandora in terms of mean relative difference (MRD), mean difference (MD), standard deviation of the difference (σ), correlation coefficient (r), slopes of linear and York regression fits and number of overpasses (n). The overall MRD and MD values are (9.9±2.6) % and ( molec. cm−2, respectively, meaning that on average TROPOMI slightly overestimates the NO2 total columns. The dispersion of these absolute differences, calculated as their standard deviation, is 2.2×10¹⁵ molec. cm−2. The correlation coefficient is high (r = 0.68). When considering only weekdays, the MD and MRD values become slightly smaller (MRD =(9.0±3.3) %) but the change remains within the uncertainties. This is expected, as weekday observations contain a number of collocations where the difference between TROPOMI and Pandora vertical columns is exceedingly negative (Fig. 3), corresponding to NO2 enhancements measured by Pandora. Correspondingly, the MRD and MD values for the weekend (typically associated with lower NO2 levels) are larger. When taking into account only overpasses with Pandora NO2 columns larger than 10×1015 molec. cm−2, the bias becomes exceedingly negative (about −28 % or ( molec. cm−2), meaning that TROPOMI underestimates the NO2 total columns when NO2 enhancements occur. When considering overpasses below that threshold, the bias is positive (about 17 %). These two effects partially cancel each other when the dataset is considered as a whole. Figure S2 illustrates in more details how the bias changes from positive (about +1015 molec. cm−2) to negative (almost molec. cm−2) for increasing values of Pandora NO2 total columns. The standard deviation of differences and the correlation coefficient are smaller for weekend overpasses and low Pandora NO2 total columns compared to weekdays and high Pandora NO2 total columns. We also note that taking into account only Pandora retrievals with the highest-quality flagging (0 or 10) does not have a substantial effect on the results of the comparison (second row of Table 1), but it reduces the amount of data available for the comparison by about 40 % (as compared to the case where medium-quality data are also included).
Figure 4 shows how the choice of the overpass criteria affects the calculated MD value (a similar plot for the MRD is shown in Fig. S3). In the analysis presented so far we have included only measurements from those TROPOMI pixels which include the Pandora ground-based station. It is also possible to average the contribution from all those pixels which fall within a certain distance from the station. Figure 4a shows how the MD gradually shifts towards negative values (from about +0.1 to molec. cm−2) when the radius increases from 5 to 30 km. This suggests that averaging over a larger area causes the resulting TROPOMI vertical columns (used in the comparison) to become smaller than those obtained from the single overlaying pixel because of the inhomogeneous spatial distribution of NO2, so that the mean concentrations decrease with increasing distance. The MD (and MRD) value for the overlaying pixel criterion is very similar to the value obtained for the distance of 5 km, even if the number of collocations is not exactly the same. Also, the correlation coefficient value decreases and the standard deviation of the differences increases while the radius increases (upper panels in Figs. S4 and S5 respectively).
Similarly, Fig. 4b shows how the MD value changes when the Pandora observations are averaged over an increasing time range, from 5 to 55 min around the overpass time of the satellite. The MD value increases with increasing temporal averaging interval by about 0.3×10¹⁵ molec. cm−2 (2 percentage points). Averaging over an increasing time range generally slightly reduces the Pandora total column values used in the comparison with TROPOMI, making the MD more positive. The correlation coefficient value decreases until 20 km radius while slightly increasing for larger radius values, while the standard deviation of the differences behaves in the opposite way (lower panels in Figs. S4 and S5 respectively).
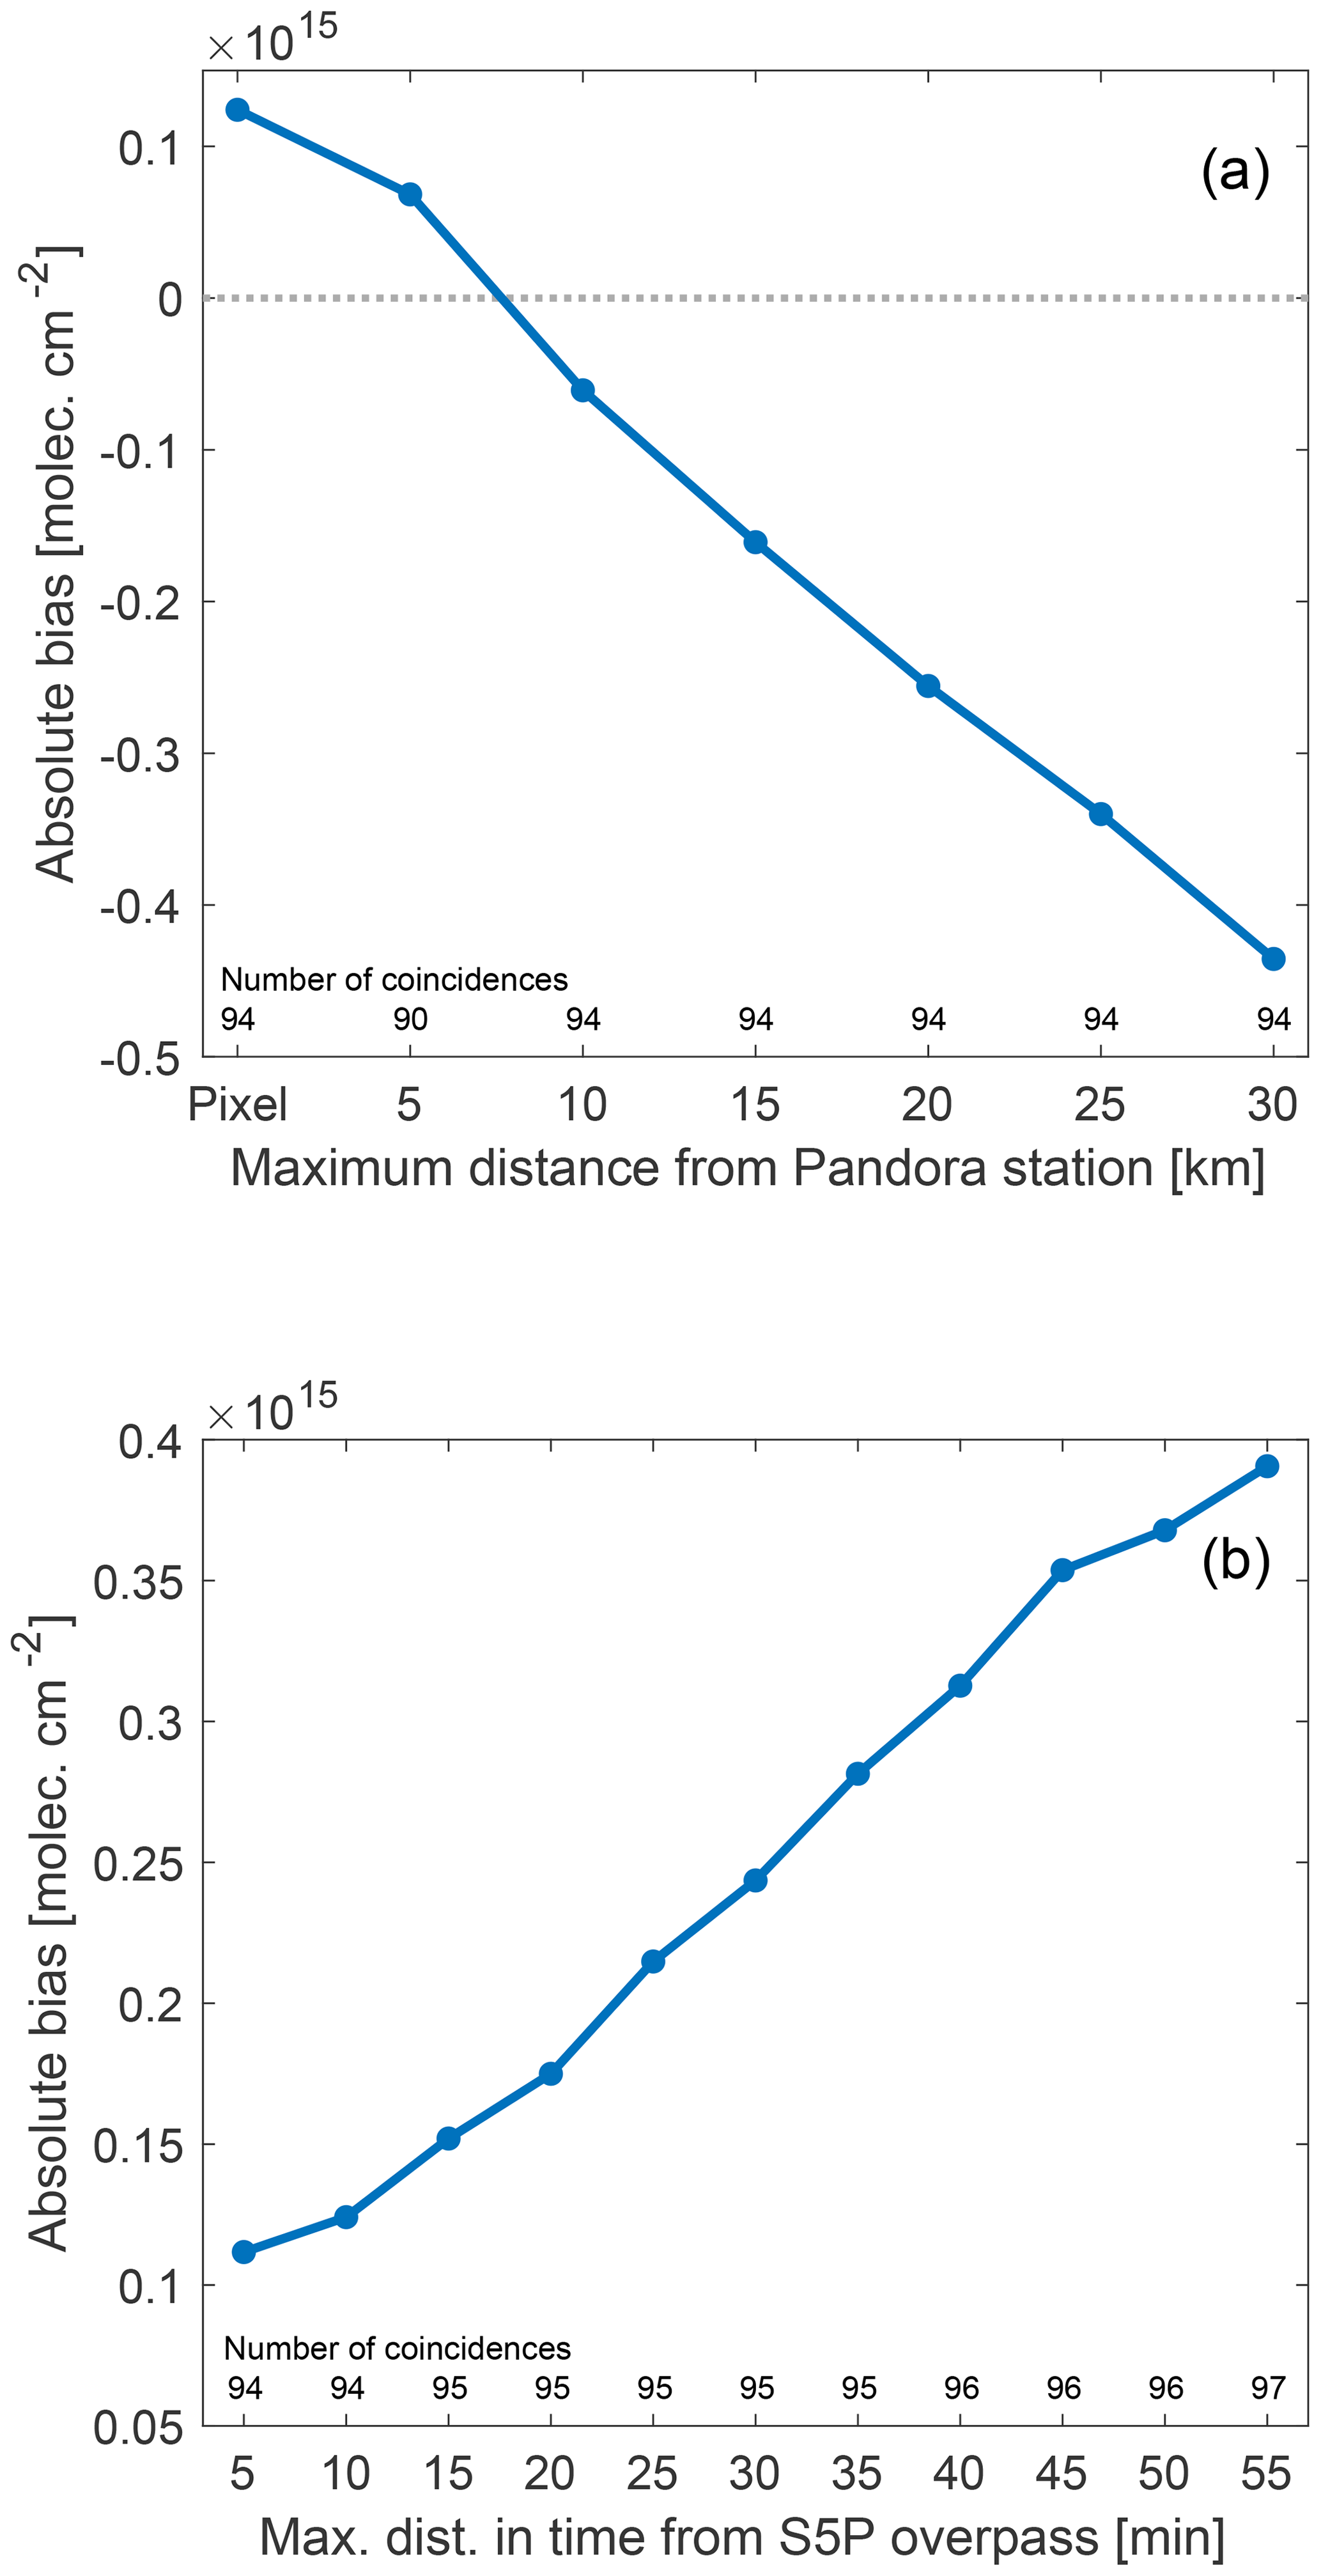
Figure 4Mean absolute difference between TROPOMI summed and Pandora total columns as a function of the maximum distance between the centre of the pixel and the ground-based station (a), and as a function of the maximum time difference from the TROPOMI overpass (b). The number of coincidences for different collocation criteria are shown above the x axis. Note that in (a) we also require that the TROPOMI pixel above Pandora station contains a valid measurement (QA value >0.75). Thus the number of coincidences does not increase with distance.
Figure S6 includes the absolute differences between TROPOMI and Pandora NO2 total columns as a function of TROPOMI SZA (solar zenith angle) and CRF (cloud radiance fraction; upper and lower panels respectively) within the range of values allowed after the TROPOMI data screening (QA value >0.75). The differences between satellite- and ground-based retrievals for SZA above 45∘ are generally larger (between −3 and 1×10¹⁵ molec. cm−2) than for smaller values (0 to 1×10¹⁵ molec. cm−2). Similarly, larger CRF values correspond to larger (positive or negative) absolute differences.
Since S5P often has two valid overpasses per day at Helsinki's latitude (60∘ N), it is possible to study the NO2 daily variability in the time range between about 12:00 and 15:00 LT. The S5P overpass time typically corresponds to the NO2 daily local minimum (between the morning and afternoon peaks due to commuter traffic), observed for example in the NO2 surface concentration measurements from the Kumpula AQ site (Fig. S7). Figure 5a shows TROPOMI and Pandora NO2 total columns as a function of the time of day between 12:00 and 15:00 LT. Both datasets show an enhancement around 13:30 LT and lower NO2 levels before and after. The relative differences between TROPOMI and Pandora NO2 total columns do not show a clear dependence on the time of day (Fig. 5b), but the dispersion (standard deviation of the relative differences) is larger before 13:30 LT (about 30 %) than afterwards (21 %). A later time of day also corresponds to increasing pixel number (colour of the filled dots in Fig. 5b), with the first overpass of the day corresponding to the left side of the swath (smaller pixel numbers) and the second overpass to the right side (higher pixels number). No clear dependence between the relative differences and the pixel size (larger at the edges and smaller in the centre of the swath) was observed.
Table 2Statistics of the comparisons between TROPOMI summed columns calculated using two different a priori NO2 profiles (TM5-MP and CAMS regional) and Pandora total columns during 30 April to 30 September 2018. The uncertainties are given as standard errors of the mean.
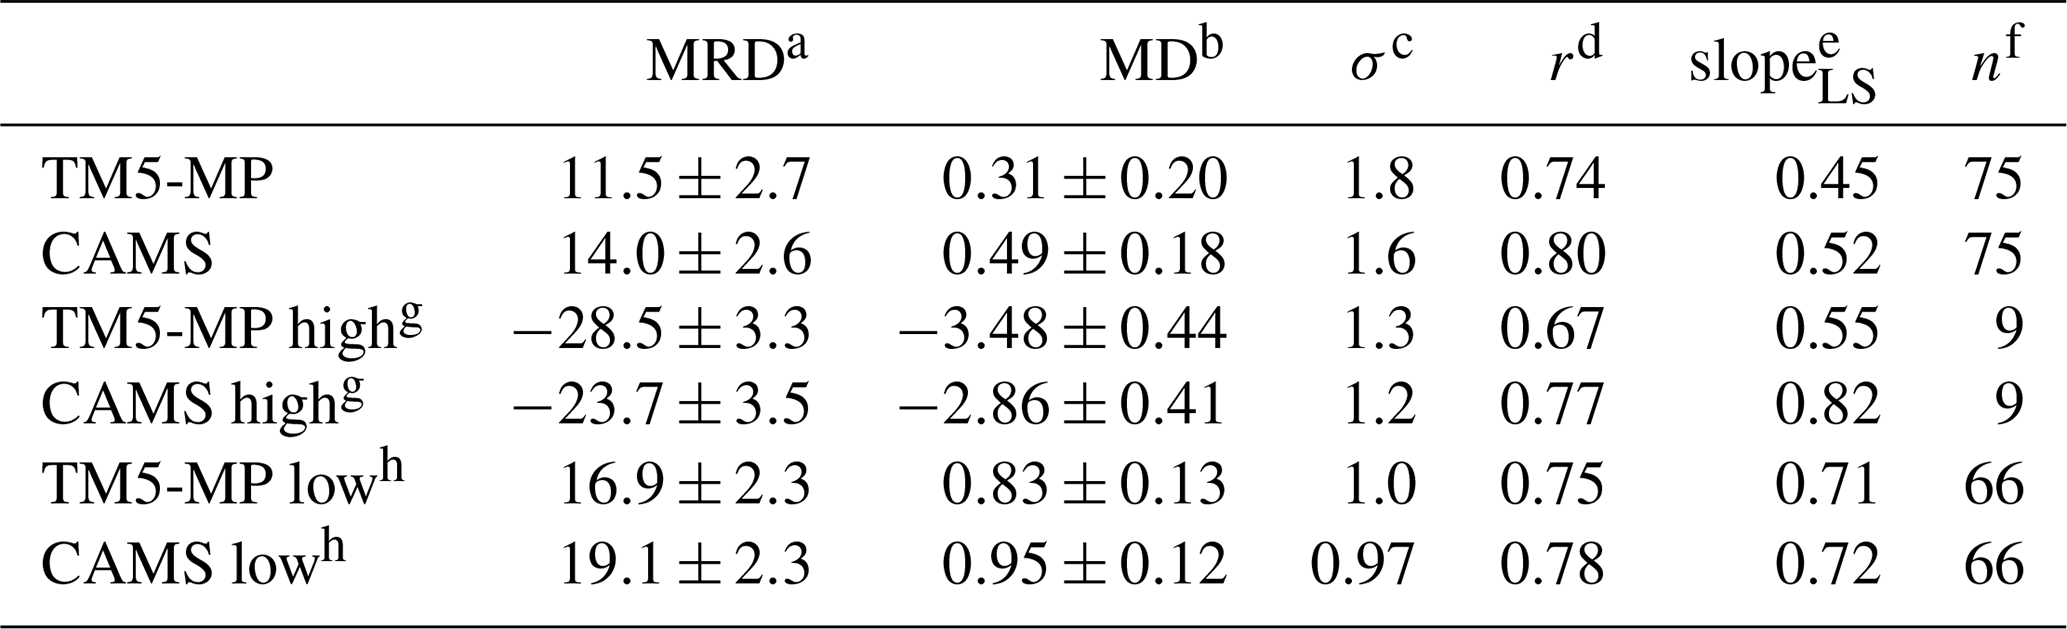
a Mean relative difference (%). b Mean difference (×1015 molec. cm−2). c Standard deviation of absolute bias (×1015 molec. cm−2). d Correlation coefficient. e Least squares linear fit slope. f Number of collocations. g Pandora NO2 total columns ≧10×1015 molec. cm−2; h Pandora NO2 total columns molec. cm−2.
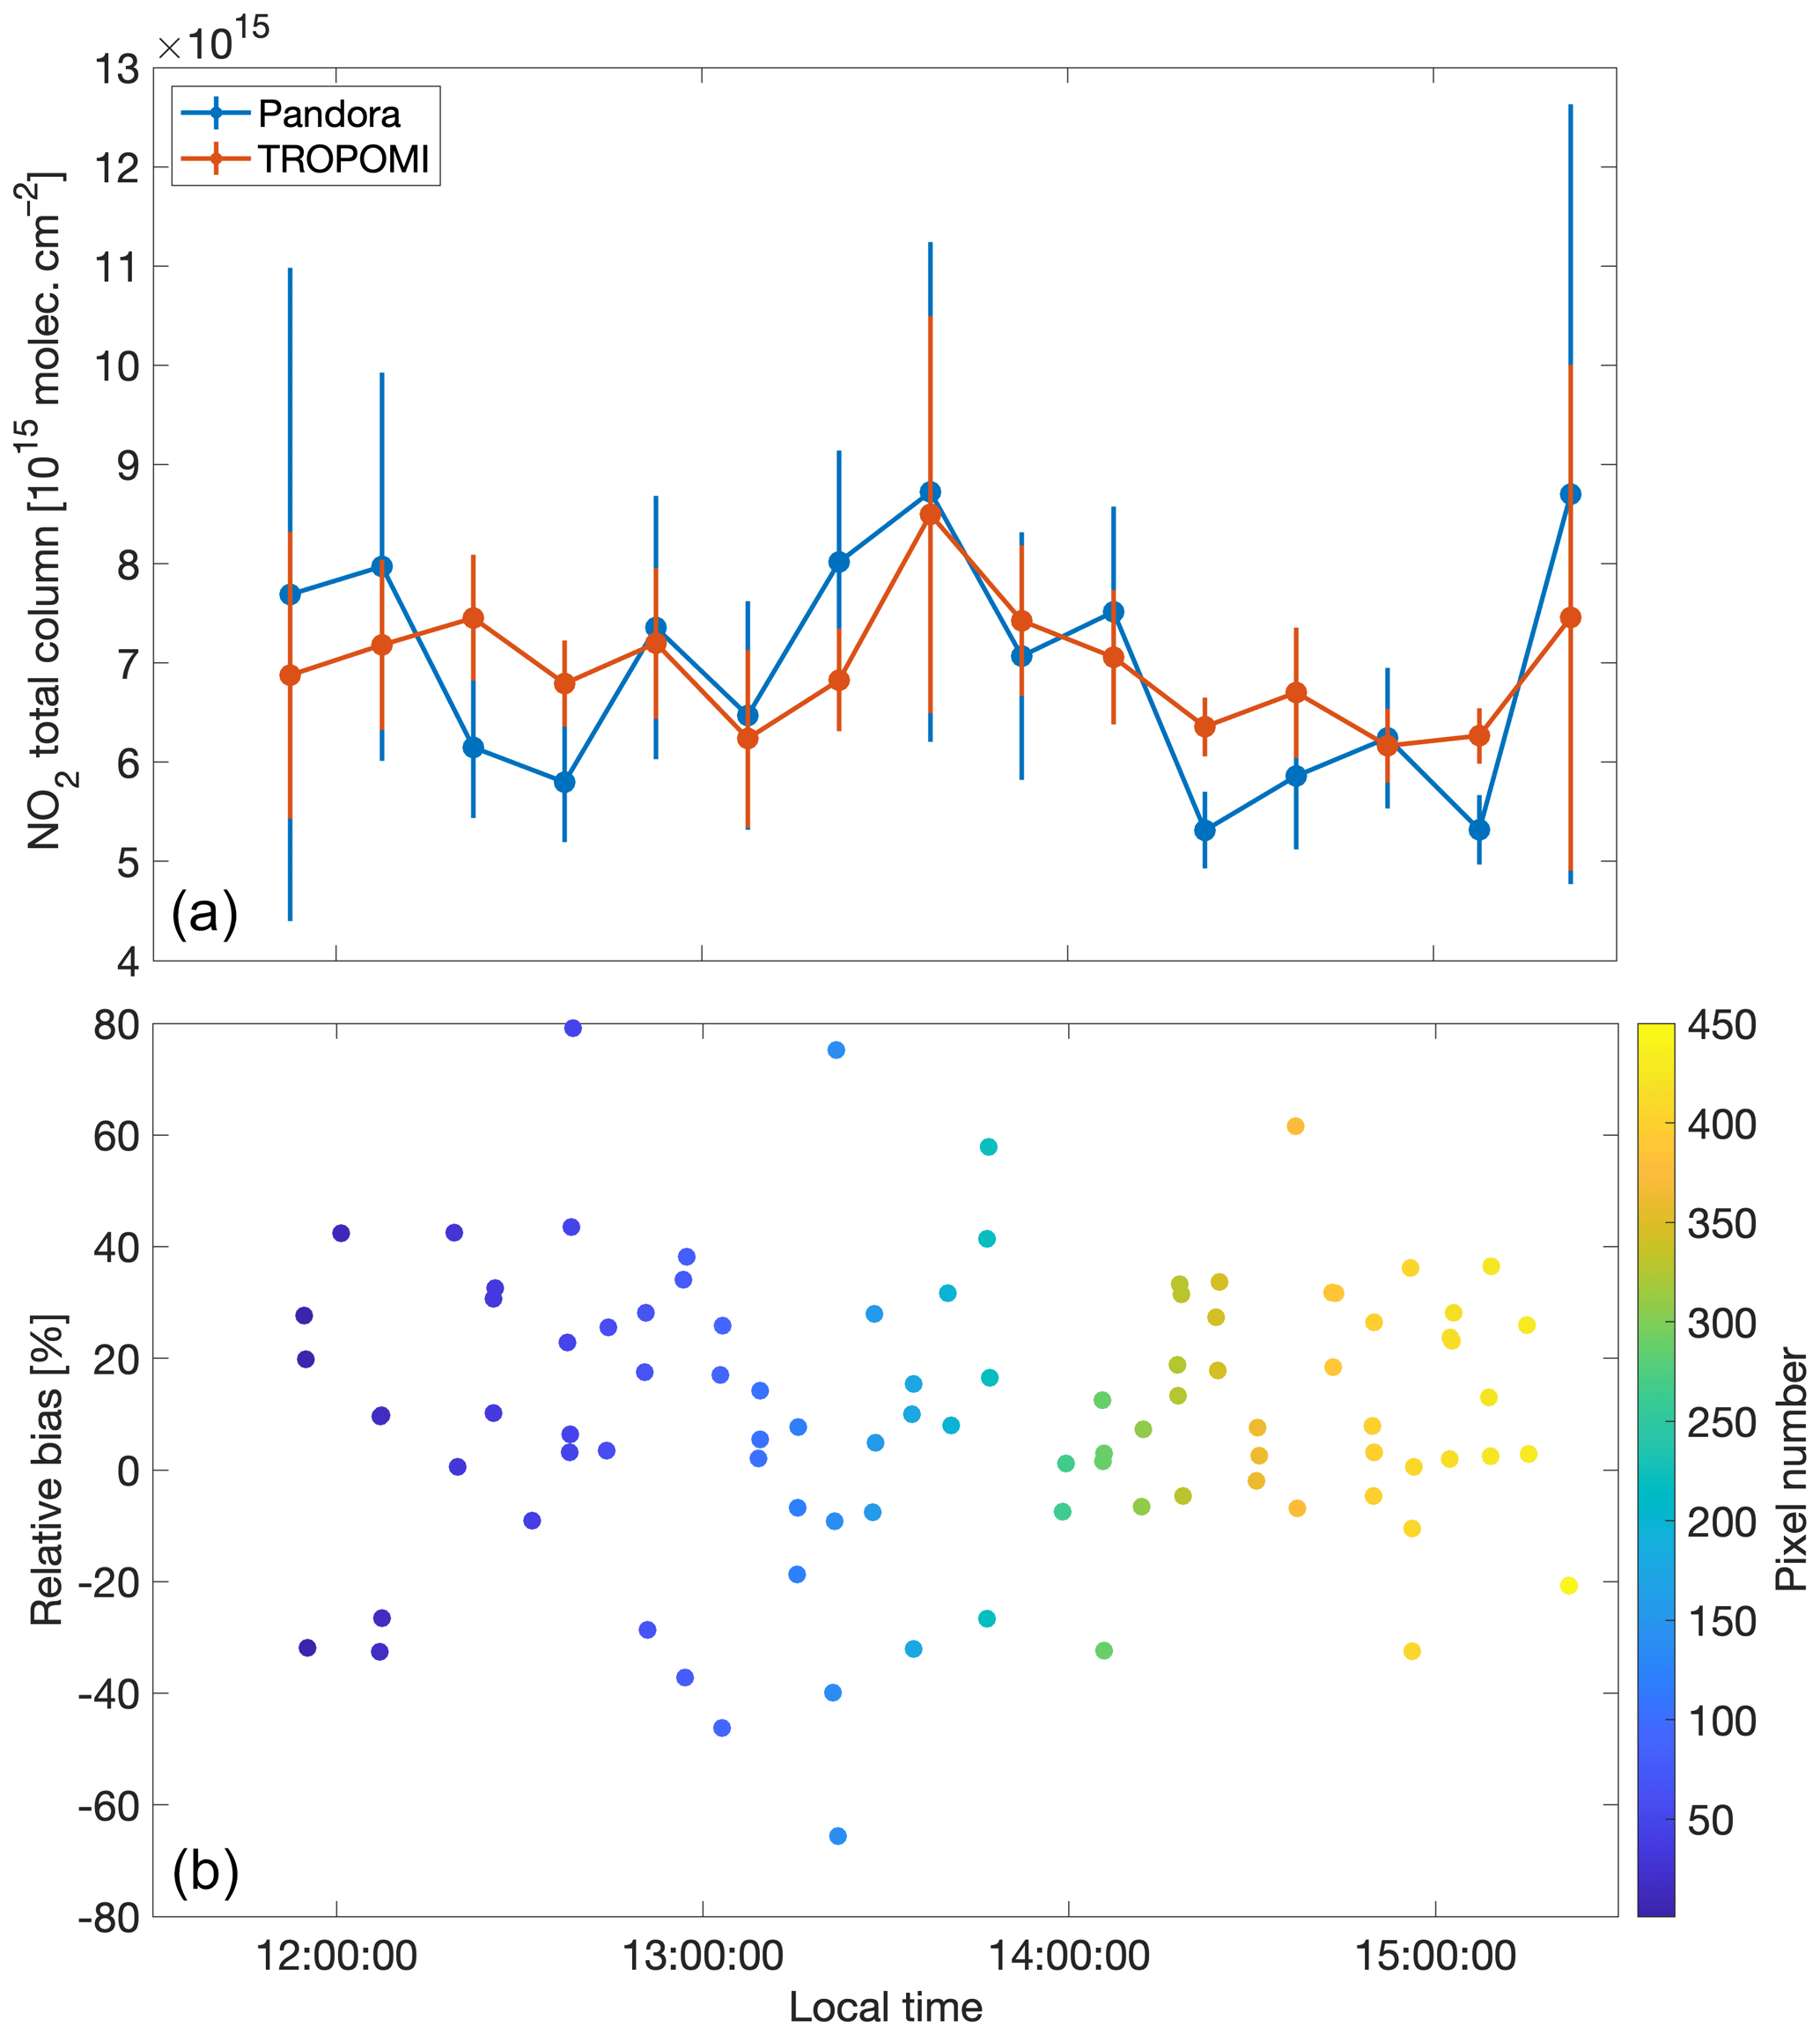
Figure 5(a) TROPOMI NO2 summed columns and Pandora total columns as a function of the time of day between about 12:00 and 15:00 LT. The error bars are the standard errors of the mean. (b) Relative difference between TROPOMI summed columns and Pandora total columns as a function of the time of day. The colours of the circles correspond to the TROPOMI pixel number.
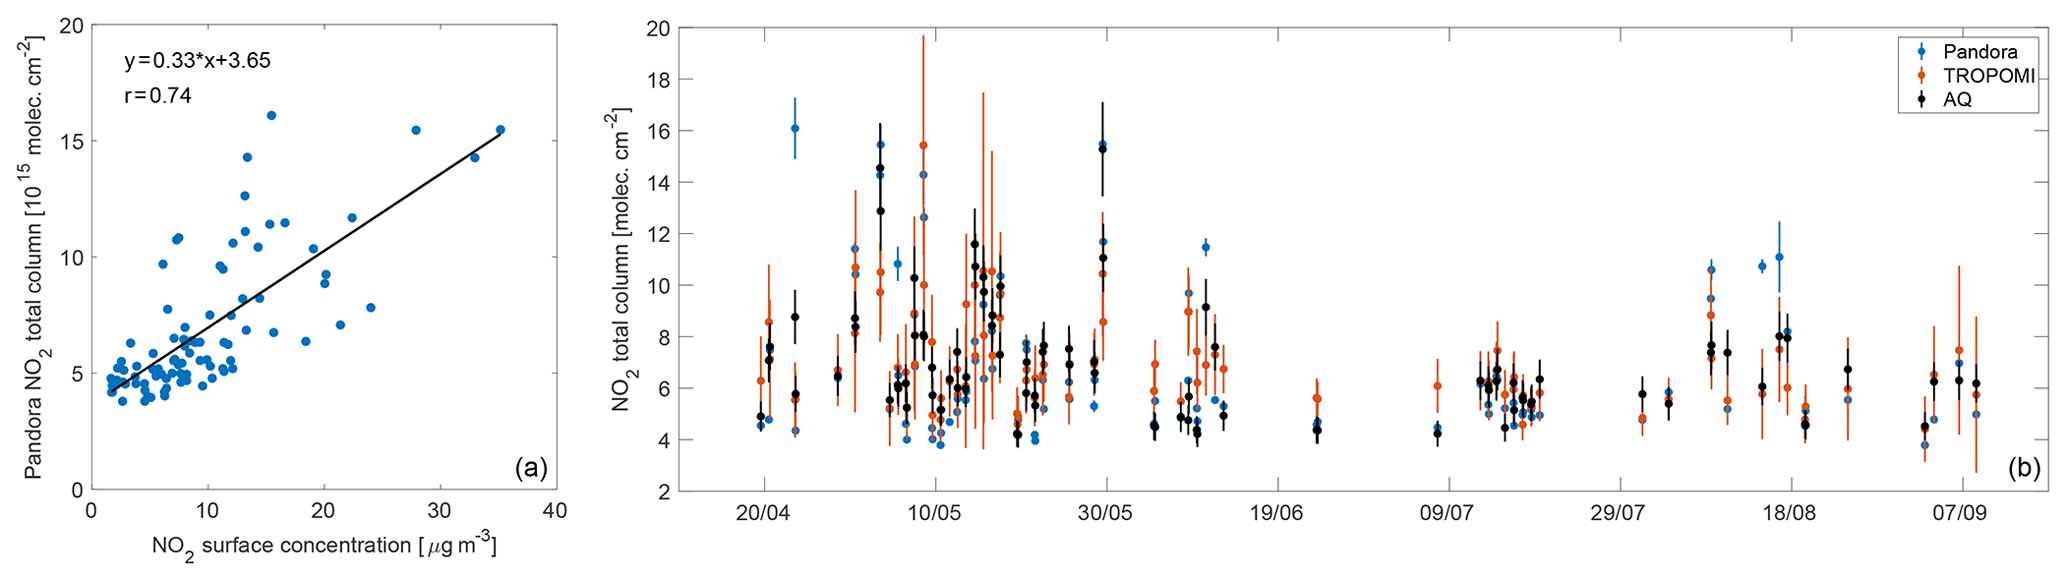
Figure 6(a) Scatterplot of Pandora total columns and surface concentration data. (b) Time series of NO2 total columns from Pandora (blue), TROPOMI (red) and Kumpula AQ station (black) at the satellite overpass time. The surface concentrations are empirically converted to total columns using the results of the linear regression between Pandora total columns and surface concentration data (a).
In order to better compare the temporal variability of the NO2 vertical columns and surface concentrations, we employ a simple empirical conversion based on the linear regression between Pandora vertical columns and surface concentrations measured at the Kumpula AQ site, at the satellite overpass time (Fig. 6a). From the results of the linear fit (showing high correlation, r = 0.74), we convert the surface concentrations into total columns and compare the results to the TROPOMI and Pandora time series (Fig. 6b). We note how the three datasets show a very similar temporal variability, with NO2 peaks occurring during the same days. We particularly note NO2 enhancements in May and during the first half of August.
We also analyse the NO2 weekly cycle as seen from the different datasets. Figure 7 shows the Pandora NO2 total columns, TROPOMI summed and tropospheric columns and surface concentrations at the Kumpula air quality station as a function of the day of the week. The data are normalised by the corresponding weekly mean value. We note that all datasets show smaller values on Saturdays and Sundays, as expected from the weekly cycle of NOx emissions typical of urban sites. The NO2 surface concentrations show about 30–50 % smaller values during the weekend compared to the weekly average, while TROPOMI tropospheric columns are about 20–30 % lower. Pandora and TROPOMI summed NO2 vertical columns are also lower during the weekends (compared to the corresponding weekly means), but only by about 10–20 %. This is because no weekend effect is expected in the stratospheric fraction of the NO2 column. Surface NO2 concentration measurements can be expected to show a larger difference between weekend and weekdays due to their greater sensitivity to changes in polluting emissions at the surface (especially from traffic in the urban environment). The results are consistent with those found using 9 years of OMI NO2 observations in Helsinki (Ialongo et al., 2016).
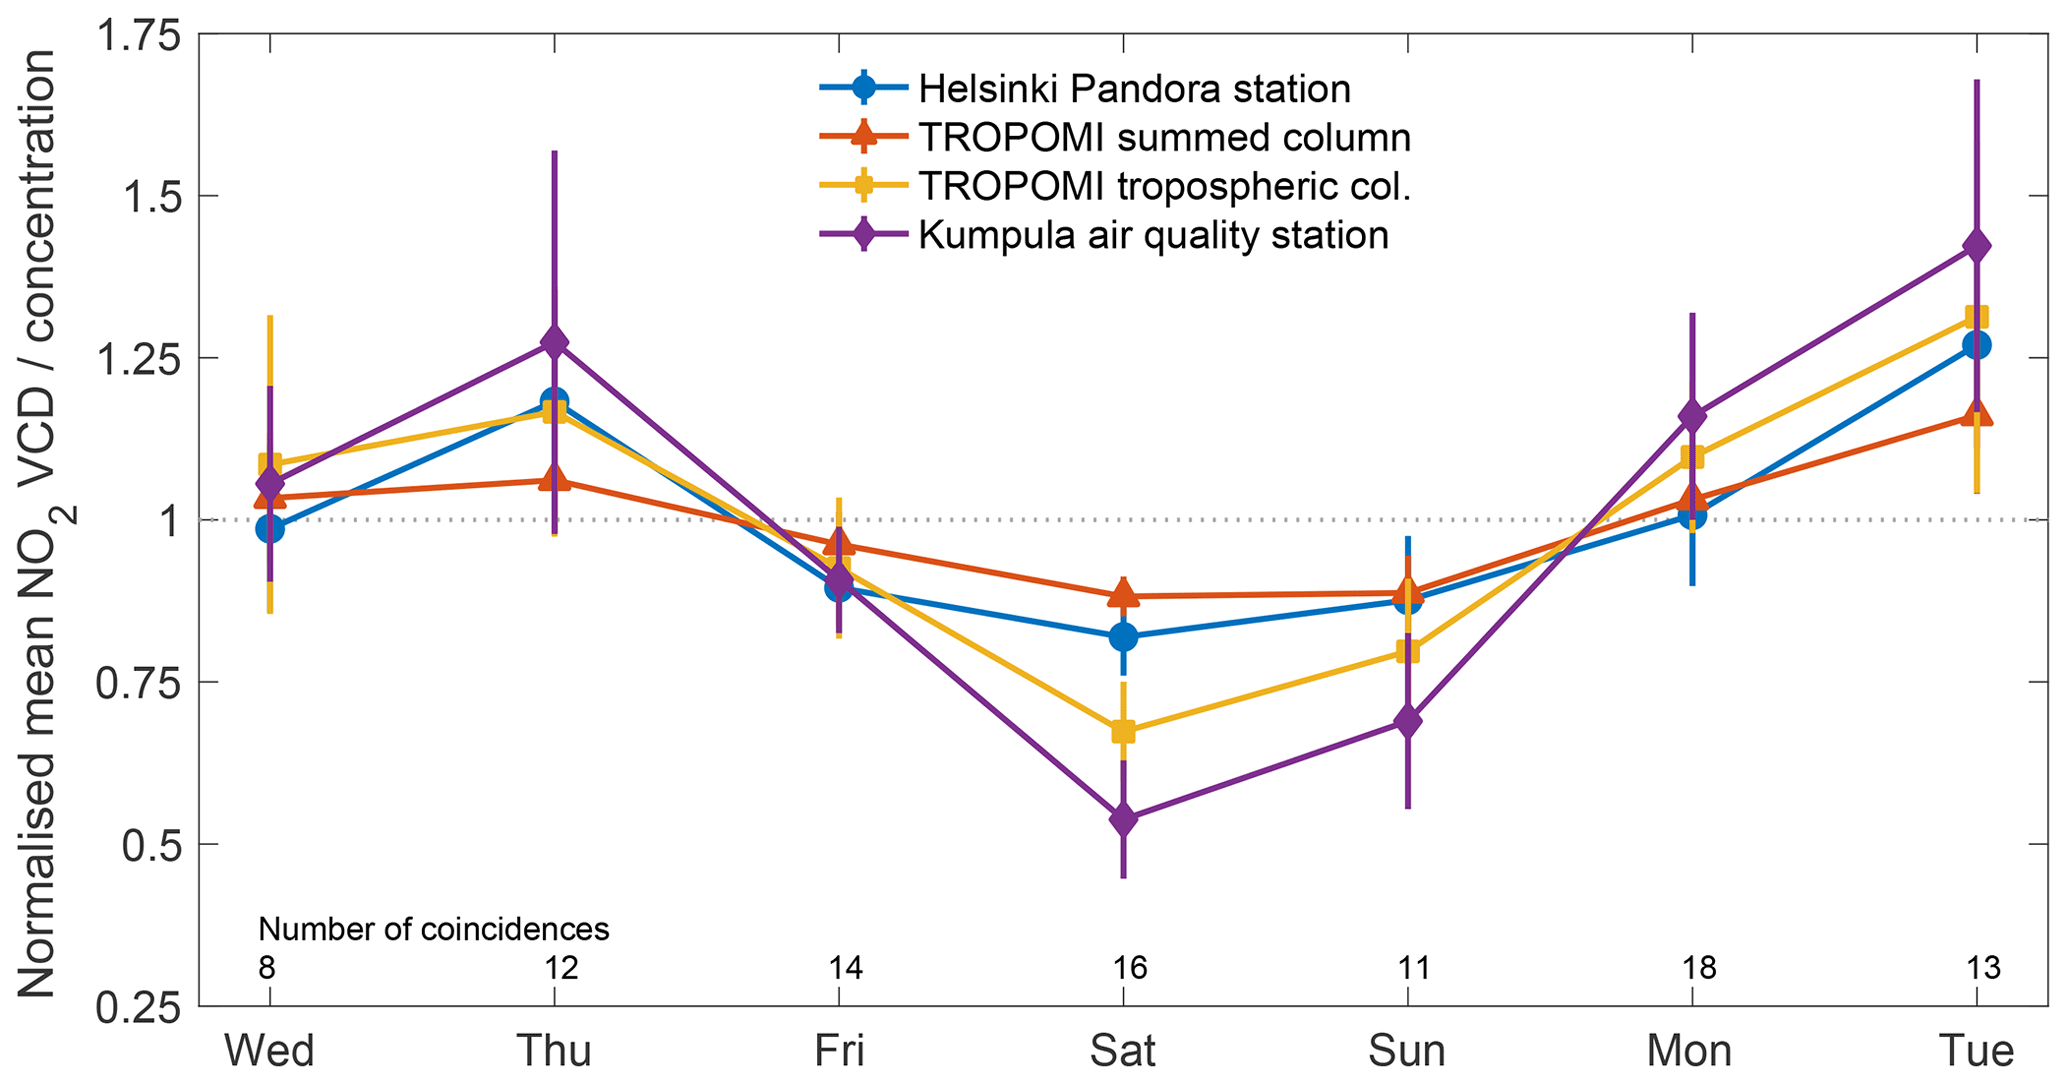
Figure 7NO2 weekly cycle in Helsinki. The average of temporally collocated values for each day of the week for Pandora total columns (blue line), TROPOMI summed and tropospheric columns (red and yellow lines respectively) and surface concentrations as measured at the Kumpula AQ station (purple line) are shown. Error bars represent corresponding standard errors of the mean. All values have been normalised by the weekly mean of each dataset.
Finally, we evaluate the effect of using the NO2 a priori profiles derived from the high-resolution CAMS regional ENSEMBLE model, instead of profiles from the TM5-MP CTM as used in TROPOMI's standard product, in the calculation of NO2 vertical column densities. Figure 8 shows the comparison of the standard product summed columns and the summed columns derived using the CAMS a priori profiles, calculated as described in Sect. 2.3, to the Pandora total columns (analogously to Fig. 3). Only those overpasses (n=75) for which both a priori summed columns were available were included in the comparison. The statistics are presented in Table 2 and the corresponding time series in Fig. S8. The comparison shows that the largest differences between the two summed columns are mostly found in cases of relatively high concentrations. In these cases, the use of CAMS profiles generally increases the TROPOMI summed columns and reduces the difference between TROPOMI and Pandora (from () % for TM5-MP to (5) % for CAMS). On the other hand, in cases of low concentrations, where TROPOMI tends to overestimate the VCDs compared to Pandora, the use of CAMS a priori profiles slightly increases the positive bias (from (16.9±2.3) % for TM5-MP to (19.1±2.3) % for CAMS). Because the largest improvement is achieved for relatively high concentrations and negative biases becoming less negative, the overall MRD value increases from 11.5 % to 14 % (Table 2). According to a two-sided t test, the differences of the two mean absolute biases (MD) in Table 2 are statistically significant only at the 52 % significance level. Thus, on average, the use of CAMS profiles does not significantly improve the agreement with Pandora observations.
For this smaller subset of 75 collocations with Pandora the correlation between TM5-MP summed columns and Pandora is 0.74 and the slope of a least squares linear fit is 0.45. Using the CAMS profiles improves the agreement with Pandora in terms of correlation and slope, with their values increasing to 0.80 and 0.52 respectively. This improvement is more evident for high values of the Pandora NO2 total columns with the correlation and the linear slope increasing by 0.1 and 0.27, respectively, from TM5-MP to CAMS (Table 2). The time series in Fig. S8 further show how using the high-resolution CAMS profiles increases the TROPOMI tropospheric columns so that the summed columns (yellow dots) become closer to Pandora's peak values (blue dots), corresponding to episodes of NO2 enhancement, but that overall the difference between the summed columns obtained using TM5-MP and CAMS remains mostly within the uncertainties of the TROPOMI NO2 retrieval.
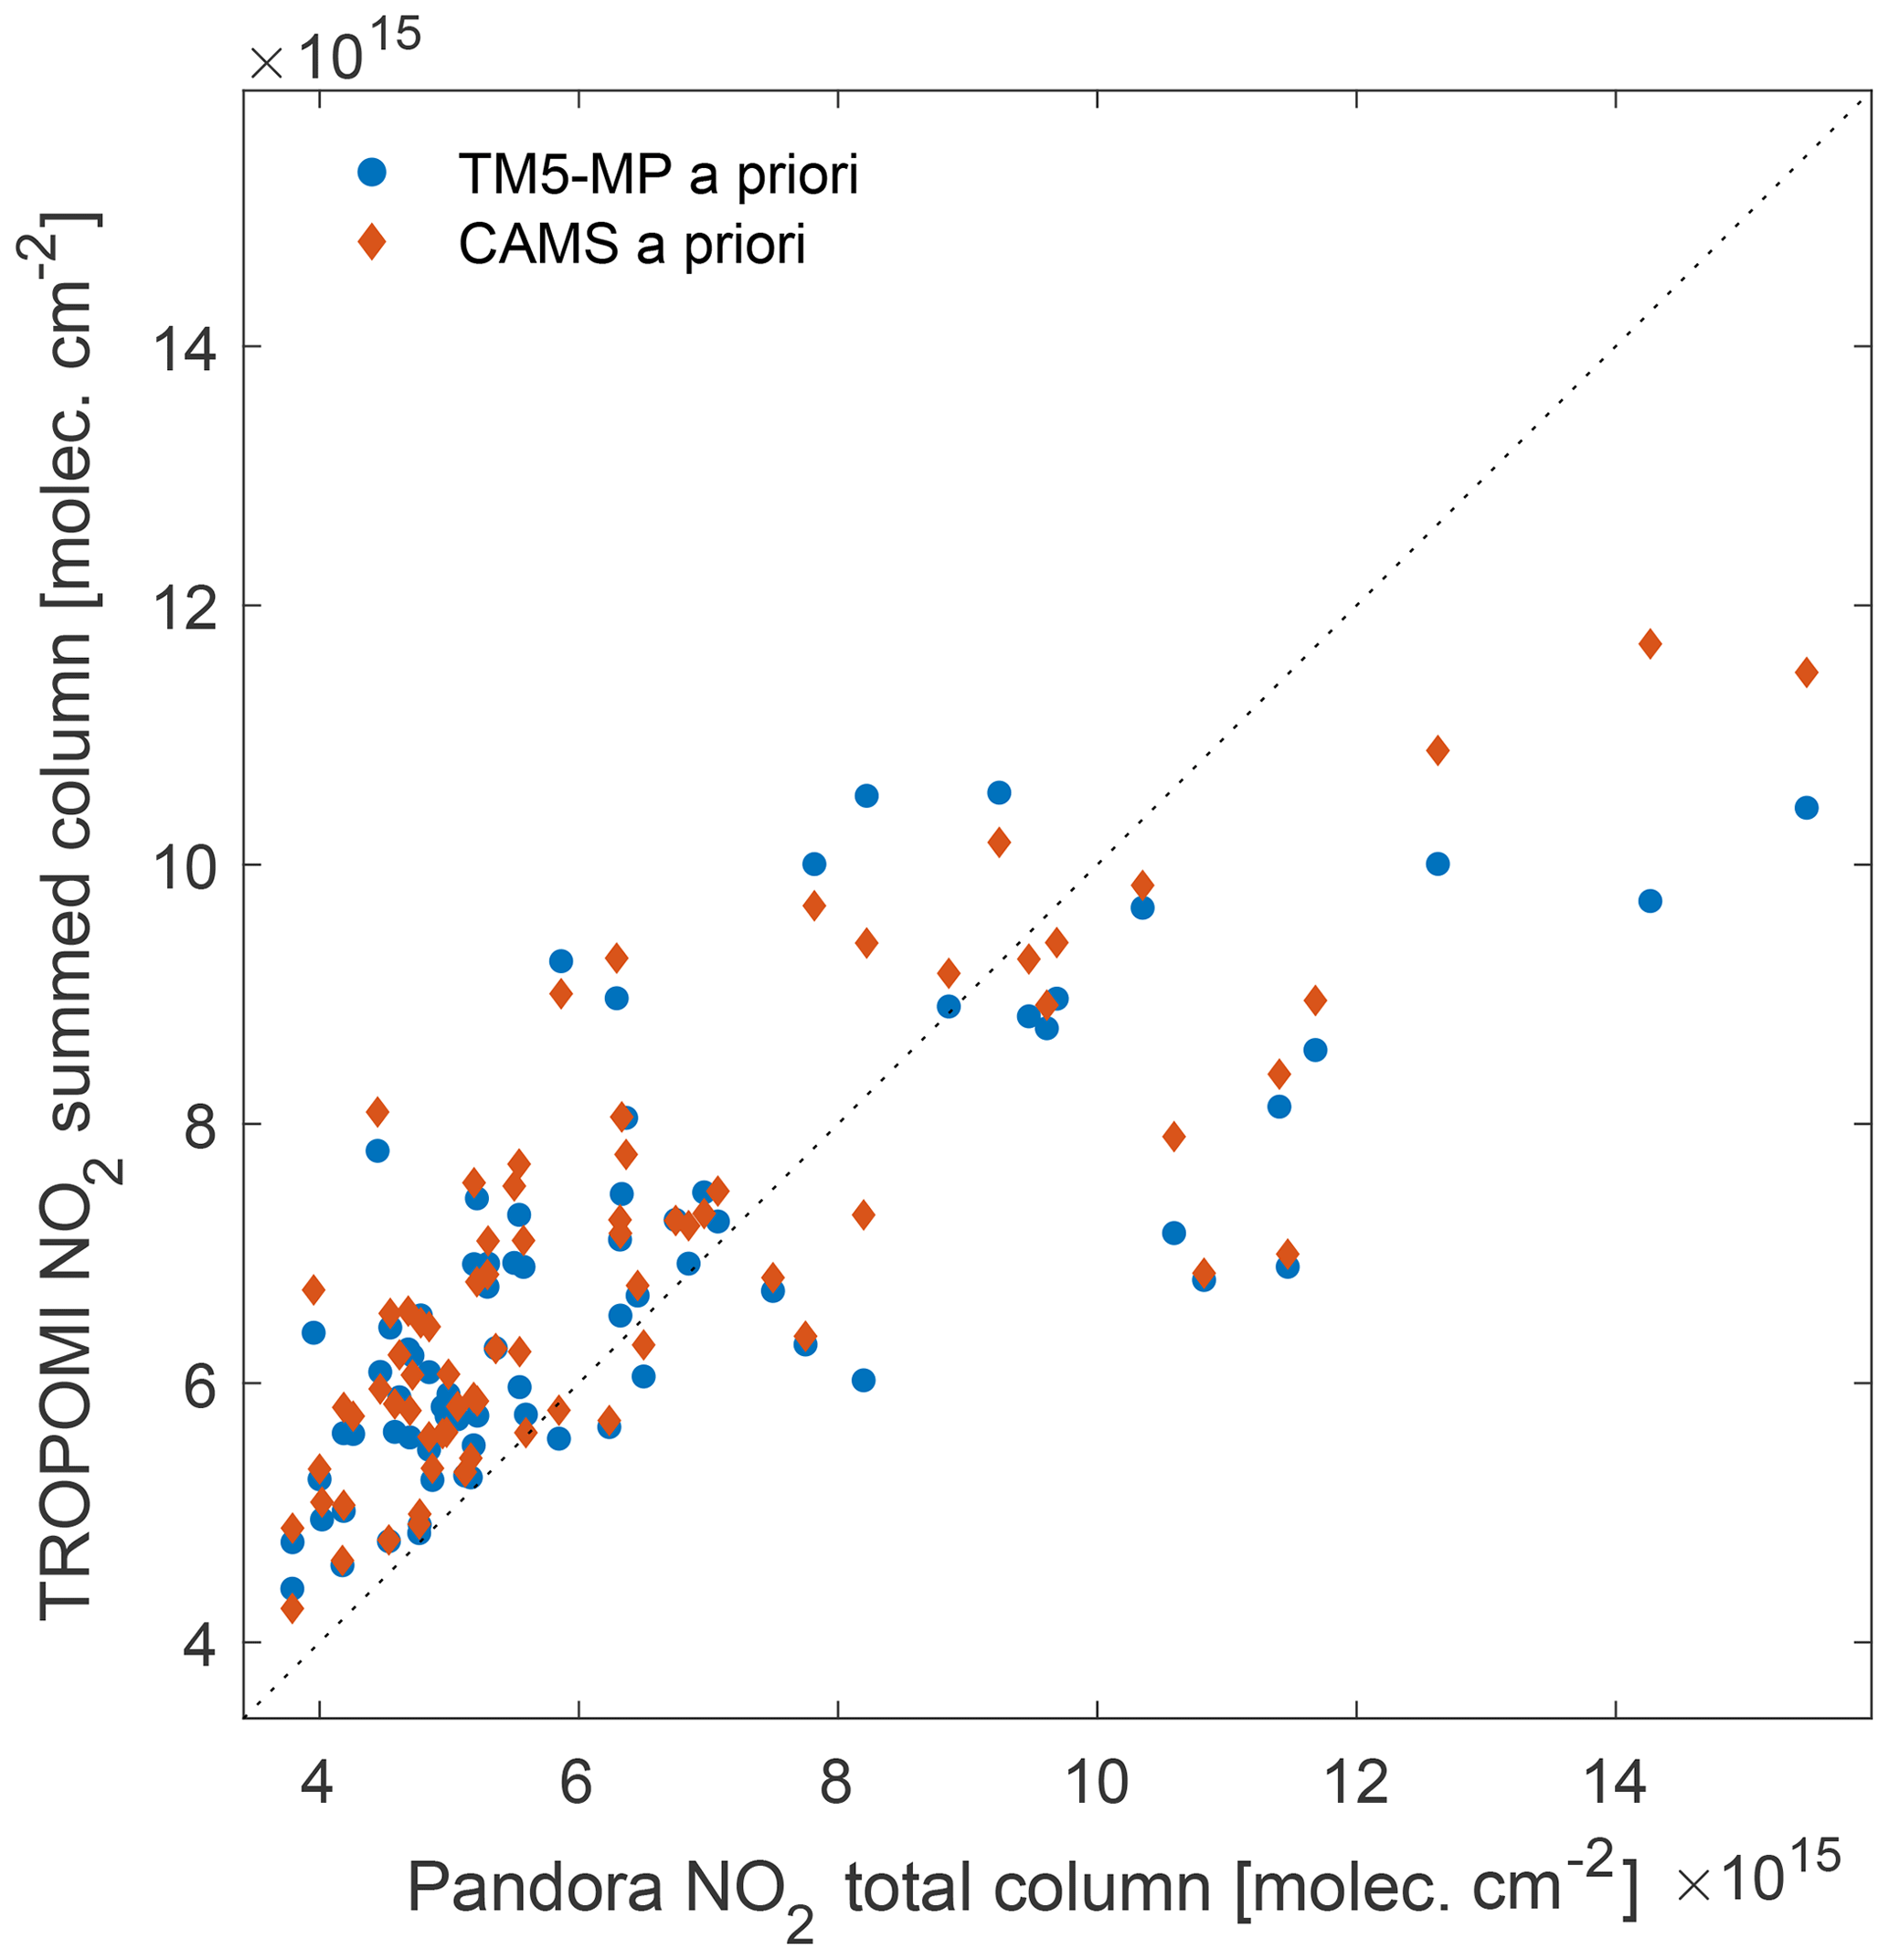
Figure 8Scatterplot of Pandora and TROPOMI summed columns derived using CAMS regional and TM5-MP a priori NO2 profiles (blue dots and red diamonds respectively). The comparison includes only those overpasses for which both summed columns were available at the same time during the time interval 30 April to 30 September 2018. The 1:1 line is plotted as a dotted line.
We showed the results of the comparison between satellite-based TROPOMI/S5P NO2 products and ground-based observations at a medium-sized urban site in Helsinki (Finland). We find that the differences between the total columns derived from the TROPOMI and Pandora instruments are on average around 10 % (or 0.12×10¹⁵ molec. cm−2), which is smaller than the precision of the TROPOMI summed columns used in this study (10 %–50 %) and well below the requirements for TROPOMI observations (25 %–50 % for the NO2 tropospheric column and <10 % for the stratospheric column; ESA, 2017). The day-to-day and weekly NO2 variability (typical of urban sites) is reproduced well by the TROPOMI retrievals, similarly to Pandora and in situ surface observations from the local air quality station. This confirms that the satellite-based TROPOMI/S5P NO2 retrievals are sensitive to changes in air pollution levels occurring at the surface.
In general, we find that TROPOMI NO2 summed columns are smaller than Pandora total columns for relatively high concentrations, while low values are overestimated. This is partly due to the low resolution of the TM5-MP profile shapes used to compute the tropospheric air-mass factors and thus the vertical columns. Because of the relatively coarse resolution of the TM5-MP a priori profiles in the standard product, TROPOMI tropospheric columns are expected to have a negative bias over polluted areas where the peak in the NO2 profile is close to the surface, and where the boundary layer column is underestimated in the a priori. Also, the time variability of the column amounts at the measurement site may be underestimated due to the a priori. In the same way, the concentrations away from major sources may be somewhat overestimated. In Helsinki we find that replacing the original profiles with those derived from the high-resolution CAMS regional ensemble model increases the TROPOMI NO2 tropospheric columns and partly reduces the discrepancy between TROPOMI and Pandora VCDs for episodes of relatively high NO2 concentrations, while increasing the correlation and linear fit slope. On the other hand, the agreement does not significantly improve on average or for lower values of NO2 vertical columns. Overall, the change in bias remains mostly within the uncertainties.
The overestimation of low NO2 columns suggests a possible overestimation of the stratospheric fraction of the column. Also, replacing the surface reflectance climatology (Kleipool et al., 2008) currently used in the retrieval with higher-resolution geometry-dependent information is expected to improve the comparison of the TROPOMI NO2 vertical columns with the ground-based observations.
As compared to previous satellite-based instruments such as OMI, the bias against ground-based observations in Helsinki is similar on average (±5 % under clear-sky conditions for OMI, Ialongo et al., 2016), while the correlation coefficient is generally higher for TROPOMI (r = 0.68 for TROPOMI and r = 0.5 for OMI, see Ialongo et al., 2016). The correlation between Pandora and TROPOMI NO2 retrievals is also in line with the results obtained over the Canadian oil sands (r = 0.70 according to Griffin et al., 2019). On the other hand, Griffin et al. (2019) report a mean negative bias of up to −30 %, as expected for very polluted sites, while we find a smaller positive bias (on average about 10 %) over a relatively less polluted site like Helsinki.
Overall, the analysis of TROPOMI NO2 observations in the Helsinki area shows high correlation with ground-based observations, and demonstrates TROPOMI's capability to properly reproduce the temporal (day-to-day and weekly) variability of surface NO2 concentrations. This is a confirmation that satellite-based observations can provide additional information on the temporal and spatial variability of NO2 in the surroundings of major cities, in addition to traditional air quality measurements.
The re-processed TROPOMI data from before 30 April 2018 were downloaded from the Sentinel-5P Expert Users Data Hub (https://s5pexp.copernicus.eu/dhus, ESA, 2018a, no open access) as part of the S5P validation team activities, and after that date from the S5P Pre-Operations Data Hub (https://s5phub.copernicus.eu/dhus, ESA, 2018b, open access). Pandora #105 total column data belong to the Pandonia network and are available at http://lb3.pandonia.net/FMI/Pandora105s1/L2/Pandora105s1_FMI_L2Tot_rnvs0p1-5.txt (LuftBlick OG, 2019). Surface concentration data at the Kumpula air quality station were obtained from the FMI measurement database (no open access); an alternative source is the SmartSMEAR service (https://avaa.tdata.fi/web/smart, University of Helsinki, 2019, open access). CAMS regional forecasts and analyses for the previous day, as well as CAMS global forecasts, are available through the Copernicus Atmosphere Monitoring Service data portal (https://atmosphere.copernicus.eu/data, ECMWF, 2015). The wind data are part of the ECMWF ERA5 reanalysis product and were downloaded from the Climate Data Store (https://cds.climate.copernicus.eu, ECMWF, 2018).
The supplement related to this article is available online at: https://doi.org/10.5194/amt-13-205-2020-supplement.
II and HV designed the content of the paper and carried on the data analysis. EH and JD provided their expertise on TROPOMI NO2 retrievals and provided the CAMS model calculations. JH was responsible for the Pandora data. All authors participated in writing the manuscript.
The authors declare that they have no conflict of interest.
This article is part of the special issue “TROPOMI on Sentinel-5 Precursor: first year in operation (AMT/ACPT inter-journal SI)”. It is not associated with a conference.
This research activity has been supported by the EU Horizon 2020 project E-Shape, by the Academy of Finland and by ESA EO Science for Society funding scheme.
This research activity has been supported by the European Space Agency (grant no. DACES), the Academy of Finland, Luonnontieteiden ja Tekniikan Tutkimuksen Toimikunta (grant no. 312125), the Academy of Finland, Luonnontieteiden ja Tekniikan Tutkimuksen Toimikunta (grant no. 303876) and the European Commission, Horizon 2020 Framework Programme (grant no. 820852).
This paper was edited by Ben Veihelmann and reviewed by Steven Compernolle and two anonymous referees.
Beirle, S., Platt, U., Wenig, M., and Wagner, T.: Weekly cycle of NO2 by GOME measurements: a signature of anthropogenic sources, Atmos. Chem. Phys., 3, 2225–2232, https://doi.org/10.5194/acp-3-2225-2003, 2003. a
Beirle, S., Boersma, K. F., Platt, U., Lawrence, M. G., and Wagner, T.: Megacity Emissions and Lifetimes of Nitrogen Oxides Probed from Space, Science, 333, 1737–1739, https://doi.org/10.1126/science.1207824, 2011. a
Boersma, K. F., Jacob, D. J., Trainic, M., Rudich, Y., DeSmedt, I., Dirksen, R., and Eskes, H. J.: Validation of urban NO2 concentrations and their diurnal and seasonal variations observed from the SCIAMACHY and OMI sensors using in situ surface measurements in Israeli cities, Atmos. Chem. Phys., 9, 3867–3879, https://doi.org/10.5194/acp-9-3867-2009, 2009. a
Boersma, K. F., Eskes, H. J., Richter, A., De Smedt, I., Lorente, A., Beirle, S., van Geffen, J. H. G. M., Zara, M., Peters, E., Van Roozendael, M., Wagner, T., Maasakkers, J. D., van der A, R. J., Nightingale, J., De Rudder, A., Irie, H., Pinardi, G., Lambert, J.-C., and Compernolle, S. C.: Improving algorithms and uncertainty estimates for satellite NO2 retrievals: results from the quality assurance for the essential climate variables (QA4ECV) project, Atmos. Meas. Tech., 11, 6651–6678, https://doi.org/10.5194/amt-11-6651-2018, 2018. a, b
Castellanos, P. and Boersma, K. F.: Reductions in nitrogen oxides over Europe driven by environmental policy and economic recession, Sci. Rep., 2, 265, https://doi.org/10.1038/srep00265, 2012. a
Cede, A.: Manual for Blick Software Suite 1.6, LuftBlick OG, Mutters, Austria, version 11, available at: https://www.pandonia-global-network.org/wp-content/uploads/2019/11/BlickSoftwareSuite_Manual_v1-7.pdf (last access: 29 November 2019), 2019. a, b
Cede, A., Herman, J., Richter, A., Krotkov, N., and Burrows, J.: Measurements of nitrogen dioxide total column amounts using a Brewer double spectrophotometer in direct Sun mode, J. Geophys. Res.-Atmos., 111, D05304, https://doi.org/10.1029/2005JD006585, 2006. a
de Foy, B., Lu, Z., and Streets, D. G.: Impacts of control strategies, the Great Recession and weekday variations on NO2 columns above North American cities, Atmos. Environ., 138, 74–86, https://doi.org/10.1016/j.atmosenv.2016.04.038, 2016. a
Duncan, B. N., Lamsal, L. N., Thompson, A. M., Yoshida, Y., Lu, Z., Streets, D. G., Hurwitz, M. M., and Pickering, K. E.: A space-based, high-resolution view of notable changes in urban NOx pollution around the world (2005–2014), J. Geophys. Res.-Atmos., 121, 976–996, https://doi.org/10.1002/2015JD024121, 2016. a
ECMWF: Copernicus Atmosphere Monitoring Service, available at: https://atmosphere.copernicus.eu/data (last access: 11 January 2020), 2015. a
ECMWF: Climate Data Store, available at: https://cds.climate.copernicus.eu (last access: 11 January 2020), 2018. a
ESA: Sentinel-5 Precursor Calibration and Validation Plan for the Operational Phase, Tech. Rep. ESA-EOPG-CSCOP-PL-0073, European Space Agency (ESA), issue 1, available at: https://sentinels.copernicus.eu/documents/247904/2474724/Sentinel-5P-Calibration-and-Validation-Plan.pdf (last access: 11 January 2020), 2017. a
ESA: Sentinel-5P Expert Users Data Hub, available at: https://s5pexp.copernicus.eu/dhus (last access: 11 January 2020), 2018a. a
ESA: Sentinel-5P Pre-Operations Data Hub, available at: https://s5phub.copernicus.eu/dhus (last access: 11 January 2020), 2018b. a
Eskes, H., van Geffen, J., Boersma, F., Eichmann, K.-U., Apituley, A., Pedergnana, M., Sneep, M., Veefkind, J. P., and Loyola, D.: Sentinel-5 precursor/TROPOMI Level 2 Product User Manual Nitrogendioxide, Tech. Rep. S5P-KNMI-L2-0021-MA, Koninklijk Nederlands Meteorologisch Instituut (KNMI), CI-7570-PUM, issue 3.0.0, available at: https://sentinels.copernicus.eu/documents/247904/2474726/Sentinel-5P-Level-2-Product-User-Manual-Nitrogen-Dioxide (last access: 11 January 2020), 2019. a, b, c
Flemming, J., Huijnen, V., Arteta, J., Bechtold, P., Beljaars, A., Blechschmidt, A.-M., Diamantakis, M., Engelen, R. J., Gaudel, A., Inness, A., Jones, L., Josse, B., Katragkou, E., Marecal, V., Peuch, V.-H., Richter, A., Schultz, M. G., Stein, O., and Tsikerdekis, A.: Tropospheric chemistry in the Integrated Forecasting System of ECMWF, Geosci. Model Dev., 8, 975–1003, https://doi.org/10.5194/gmd-8-975-2015, 2015. a
Griffin, D., Zhao, X., McLinden, C. A., Boersma, F., Bourassa, A., Dammers, E., Degenstein, D., Eskes, H., Fehr, L., Fioletov, V., Hayden, K., Kharol, S. K., Li, S.-M., Makar, P., Martin, R. V., Mihele, C., Mittermeier, R. L., Krotkov, N., Sneep, M., Lamsal, L. N., ter Linden, M., van Geffen, J., Veefkind, P., and Wolde, M.: High-Resolution Mapping of Nitrogen Dioxide With TROPOMI: First Results and Validation Over the Canadian Oil Sands, Geophys. Res. Lett., 46, 1049–1060, https://doi.org/10.1029/2018GL081095, 2019. a, b, c
Herman, J., Cede, A., Spinei, E., Mount, G., Tzortziou, M., and Abuhassan, N.: NO2 column amounts from ground-based Pandora and MFDOAS spectrometers using the direct-sun DOAS technique: Intercomparisons and application to OMI validation, J. Geophys. Res.-Atmos., 114, D13307, https://doi.org/10.1029/2009JD011848, 2009. a, b, c, d, e, f, g
Ialongo, I., Herman, J., Krotkov, N., Lamsal, L., Boersma, K. F., Hovila, J., and Tamminen, J.: Comparison of OMI NO2 observations and their seasonal and weekly cycles with ground-based measurements in Helsinki, Atmos. Meas. Tech., 9, 5203–5212, https://doi.org/10.5194/amt-9-5203-2016, 2016. a, b, c, d
Järvi, L., Hannuniemi, H., Hussein, T., Junninen, H., Aalto, P. P., Hillamo, R., Mäkelä, T., Keronen, P., Siivola, E., Vesala, T., and Kulmala, M.: The urban measurement station SMEAR III: Continuous monitoring of air pollution and surface-atmosphere interactions in Helsinki, Finland, Boreal Environ. Res., 14, 86–109, 2009. a
Kato, J. and Yoneda, A.: Air Pollution Monitoring Systems, AP-360 Series, Tech. rep., HORIBA, Inc., Kyoto, Japan, available at: https://www.horiba.com/uploads/media/RE01-06-029.pdf (last access: 11 January 2020), 1997. a
Kleipool, Q. L., Dobber, M. R., de Haan, J. F., and Levelt, P. F.: Earth surface reflectance climatology from 3 years of OMI data, J. Geophys. Res.-Atmos., 113, D18308, https://doi.org/10.1029/2008JD010290, 2008. a
KNMI: Algorithm theoretical basis document for the TROPOMI L01b data processor, Tech. Rep. S5P-KNMI-L01B-0009-SD, Koninklijk Nederlands Meteorologisch Instituut (KNMI), CI-6480-ATBD, issue 8.0.0, available at: https://sentinels.copernicus.eu/documents/247904/2476257/Sentinel-5P-TROPOMI-Level-1B-ATBD (last access: 11 January 2020), 2017. a, b, c
KNMI: Sentinel 5 precursor/TROPOMI KNMI and SRON level 2 Input Output Data Definition, Tech. Rep. S5P-KNMI-L2-0009-SD, Koninklijk Nederlands Meteorologisch Instituut (KNMI), issue 11.0.0, available at: https://sentinel.esa.int/documents/247904/3119978/Sentinel-5P-Level-2-Input-Output-Data-Definition (last access: 11 January 2020), 2019. a
Krotkov, N. A., McLinden, C. A., Li, C., Lamsal, L. N., Celarier, E. A., Marchenko, S. V., Swartz, W. H., Bucsela, E. J., Joiner, J., Duncan, B. N., Boersma, K. F., Veefkind, J. P., Levelt, P. F., Fioletov, V. E., Dickerson, R. R., He, H., Lu, Z., and Streets, D. G.: Aura OMI observations of regional SO2 and NO2 pollution changes from 2005 to 2015, Atmos. Chem. Phys., 16, 4605–4629, https://doi.org/10.5194/acp-16-4605-2016, 2016. a
Lambert, J.-C., Keppens, A., Hubert, D., Langerock, B., Eichmann, K.-U., Kleipool, Q., Sneep, M., Verhoelst, T., Wagner, T., Weber, M., Ahn, C., Argyrouli, A., Balis, D., Chan, K., Compernolle, S., De Smedt, I., Eskes, H., Fjæraa, A., Garane, K., Gleason, J., Goutail, F., Granville, J., Hedelt, P., Heue, K.-P., Jaross, G., Koukouli, M., Landgraf, J., Lutz, R., Niemejer, S., Pazmiño, A., Pinardi, G., Pommereau, J.-P., Richter, A., Rozemeijer, N., Sha, M., Stein Zweers, D., Theys, N., Tilstra, G., Torres, O., Valks, P., Vigouroux, C., and Wang, P.: Quarterly Validation Report of the Copernicus Sentinel-5 Precursor Operational Data Products – #04: April 2018 – August 2019., S5P MPC Routine Operations Consolidated Validation Report series, Issue #04, Version 04.0.0, 129 pp., available at: http://s5p-mpc-vdaf.aeronomie.be/ProjectDir/reports/pdf/S5P-MPC-IASB-ROCVR-04.0.0-20190923_FINAL.pdf (last access: 11 January 2020), 2019. a
Lamsal, L. N., Duncan, B. N., Yoshida, Y., Krotkov, N. A., Pickering, K. E., Streets, D. G., and Lu, Z.: U.S. NO2 trends (2005–2013): EPA Air Quality System (AQS) data versus improved observations from the Ozone Monitoring Instrument (OMI), Atmos. Environ., 110, 130–143, https://doi.org/10.1016/j.atmosenv.2015.03.055, 2015. a
Levelt, P. F., van den Oord, G. H. J., Dobber, M. R., Malkki, A., Visser, H., de Vries, J., Stammes, P., Lundell, J. O. V., and Saari, H.: The ozone monitoring instrument, IEEE T. Geosci. Remote, 44, 1093–1101, https://doi.org/10.1109/TGRS.2006.872333, 2006. a
Levelt, P. F., Joiner, J., Tamminen, J., Veefkind, J. P., Bhartia, P. K., Stein Zweers, D. C., Duncan, B. N., Streets, D. G., Eskes, H., van der A, R., McLinden, C., Fioletov, V., Carn, S., de Laat, J., DeLand, M., Marchenko, S., McPeters, R., Ziemke, J., Fu, D., Liu, X., Pickering, K., Apituley, A., González Abad, G., Arola, A., Boersma, F., Chan Miller, C., Chance, K., de Graaf, M., Hakkarainen, J., Hassinen, S., Ialongo, I., Kleipool, Q., Krotkov, N., Li, C., Lamsal, L., Newman, P., Nowlan, C., Suleiman, R., Tilstra, L. G., Torres, O., Wang, H., and Wargan, K.: The Ozone Monitoring Instrument: overview of 14 years in space, Atmos. Chem. Phys., 18, 5699–5745, https://doi.org/10.5194/acp-18-5699-2018, 2018. a
Liu, F., Beirle, S., Zhang, Q., van der A, R. J., Zheng, B., Tong, D., and He, K.: NOx emission trends over Chinese cities estimated from OMI observations during 2005 to 2015, Atmos. Chem. Phys., 17, 9261–9275, https://doi.org/10.5194/acp-17-9261-2017, 2017. a
Lu, Z., Streets, D. G., de Foy, B., Lamsal, L. N., Duncan, B. N., and Xing, J.: Emissions of nitrogen oxides from US urban areas: estimation from Ozone Monitoring Instrument retrievals for 2005–2014, Atmos. Chem. Phys., 15, 10367–10383, https://doi.org/10.5194/acp-15-10367-2015, 2015. a
LuftBlick OG: Level 2 total columns file for Pandora #105, available at: http://lb3.pandonia.net/FMI/Pandora105s1/L2/Pandora105s1_FMI_L2Tot_rnvs0p1-5.txt (last access: 11 January 2020), 2019. a
Marécal, V., Peuch, V.-H., Andersson, C., Andersson, S., Arteta, J., Beekmann, M., Benedictow, A., Bergström, R., Bessagnet, B., Cansado, A., Chéroux, F., Colette, A., Coman, A., Curier, R. L., Denier van der Gon, H. A. C., Drouin, A., Elbern, H., Emili, E., Engelen, R. J., Eskes, H. J., Foret, G., Friese, E., Gauss, M., Giannaros, C., Guth, J., Joly, M., Jaumouillé, E., Josse, B., Kadygrov, N., Kaiser, J. W., Krajsek, K., Kuenen, J., Kumar, U., Liora, N., Lopez, E., Malherbe, L., Martinez, I., Melas, D., Meleux, F., Menut, L., Moinat, P., Morales, T., Parmentier, J., Piacentini, A., Plu, M., Poupkou, A., Queguiner, S., Robertson, L., Rouïl, L., Schaap, M., Segers, A., Sofiev, M., Tarasson, L., Thomas, M., Timmermans, R., Valdebenito, Á., van Velthoven, P., van Versendaal, R., Vira, J., and Ung, A.: A regional air quality forecasting system over Europe: the MACC-II daily ensemble production, Geosci. Model Dev., 8, 2777–2813, https://doi.org/10.5194/gmd-8-2777-2015, 2015. a
Météo-France: Regional Production, Description of the operational models and of the ENSEMBLE system, Tech. rep., Copernicus Atmosphere Monitoring Service (CAMS), Ref.: CAMS_50_2015SC1_Models_Factsheets_201610_v2, available at: https://atmosphere.copernicus.eu/sites/default/files/2018-02/CAMS50_factsheet_201610_v2.pdf (last access: 11 January 2020), 2016. a
Platt, U. and Stutz, J.: Differential Optical Absorption Spectroscopy: Principles and Applications, Springer-Verlag, Berlin, Germany, https://doi.org/10.1007/978-3-540-75776-4, 2008. a
Serdyuchenko, A., Gorshelev, V., Weber, M., Chehade, W., and Burrows, J. P.: High spectral resolution ozone absorption cross-sections – Part 2: Temperature dependence, Atmos. Meas. Tech., 7, 625–636, https://doi.org/10.5194/amt-7-625-2014, 2014. a
Streets, D., Canty, T., Carmichael, G., de Foy, B., Dickerson, R., Duncan, B., Edwards, D., Haynes, J., Henze, D., Houyoux, M., Jacob, D., Krotkov, N., Lamsal, L., Liu, Y., Lu, Z., Martin, R., Pfister, G., Pinder, R., Salawitch, R., and Wecht, K.: Emissions estimation from satellite retrievals: A review of current capability, Atmos. Environ., 77, 1011–1042, https://doi.org/10.1016/j.atmosenv.2013.05.051, 2013. a
University of Helsinki: SmartSMEAR, available at: https://avaa.tdata.fi/web/smart (last access: 11 January 2020), 2009. a
US-EPA: Nitrogen Dioxide (NO2) Pollution, available at: https://www.epa.gov/no2-pollution, last access: 6 August 2019. a
van Geffen, J. H. G. M., Boersma, K. F., Van Roozendael, M., Hendrick, F., Mahieu, E., De Smedt, I., Sneep, M., and Veefkind, J. P.: Improved spectral fitting of nitrogen dioxide from OMI in the 405–465 nm window, Atmos. Meas. Tech., 8, 1685–1699, https://doi.org/10.5194/amt-8-1685-2015, 2015. a
van Geffen, J. H. G. M., Eskes, H. J., Boersma, K. F., Maasakkers, J. D., and Veefkind, J. P.: TROPOMI ATBD of the total and tropospheric NO2 data products, Tech. Rep. S5P-KNMI-L2-0005-RP, Koninklijk Nederlands Meteorologisch Instituut (KNMI), CI-7430-ATBD, issue 1.4.0, available at: https://sentinels.copernicus.eu/documents/247904/2476257/Sentinel-5P-TROPOMI-ATBD-NO2-data-products (last access: 11 January 2020), 2019. a, b, c, d, e, f, g, h
Vandaele, A., Hermans, C., Simon, P., Carleer, M., Colin, R., Fally, S., Mérienne, M., Jenouvrier, A., and Coquart, B.: Measurements of the NO2 absorption cross-section from 42000 cm−1 to 10000 cm−1 (238–1000 nm) at 220 K and 294 K, J. Quant. Spectrosc. Ra., 59, 171–184, https://doi.org/10.1016/S0022-4073(97)00168-4, 1998. a
Veefkind, J. P., Aben, I., McMullan, K., Forster, H., de Vries, J., Otter, G., Claas, J., Eskes, H. J., de Haan, J. F., Kleipool, Q., van Weele, M., Hasekamp, O., Hoogeveen, R., Landgraf, J., Snel, R., Tol, P., Ingmann, P., Voors, R., Kruizinga, B., Vink, R., Visser, H., and Levelt, P. F.: TROPOMI on the ESA Sentinel-5 Precursor: A GMES mission for global observations of the atmospheric composition for climate, air quality and ozone layer applications, Remote Sens. Environ., 120, 70–83, https://doi.org/10.1016/j.rse.2011.09.027, 2012. a, b
Williams, J. E., Boersma, K. F., Le Sager, P., and Verstraeten, W. W.: The high-resolution version of TM5-MP for optimized satellite retrievals: description and validation, Geosci. Model Dev., 10, 721–750, https://doi.org/10.5194/gmd-10-721-2017, 2017. a, b
Wu, C. and Yu, J. Z.: Evaluation of linear regression techniques for atmospheric applications: the importance of appropriate weighting, Atmos. Meas. Tech., 11, 1233–1250, https://doi.org/10.5194/amt-11-1233-2018, 2018. a
York, D., Evensen, N. M., Martínez, M. L., and Delgado, J. D. B.: Unified Equations for the Slope, Intercept, and Standard Errors of the Best Straight Line, Am. J. Phys., 72, 367–375, https://doi.org/10.1119/1.1632486, 2004. a
Zhao, X., Griffin, D., Fioletov, V., McLinden, C., Davies, J., Ogyu, A., Lee, S. C., Lupu, A., Moran, M. D., Cede, A., Tiefengraber, M., and Müller, M.: Retrieval of total column and surface NO2 from Pandora zenith-sky measurements, Atmos. Chem. Phys., 19, 10619–10642, https://doi.org/10.5194/acp-19-10619-2019, 2019. a