the Creative Commons Attribution 4.0 License.
the Creative Commons Attribution 4.0 License.
 | 30 Apr 2020
Assessment of the quality of TROPOMI high-spatial-resolution NO2 data products in the Greater Toronto Area
Debora Griffin
Vitali Fioletov
Chris McLinden
Alexander Cede
Martin Tiefengraber
Moritz Müller
Kristof Bognar
Kimberly Strong
Folkert Boersma
Henk Eskes
Jonathan Davies
Akira Ogyu
Sum Chi Lee
The TROPOspheric Monitoring Instrument (TROPOMI) aboard the Sentinel-5 Precursor satellite (launched on 13 October 2017) is a nadir-viewing spectrometer measuring reflected sunlight in the ultraviolet, visible, near-infrared, and shortwave infrared spectral ranges. The measured spectra are used to retrieve total columns of trace gases, including nitrogen dioxide (NO2). For ground validation of these satellite measurements, Pandora spectrometers, which retrieve high-quality NO2 total columns via direct-sun measurements, are widely used. In this study, Pandora NO2 measurements made at three sites located in or north of the Greater Toronto Area (GTA) are used to evaluate the TROPOMI NO2 data products, including a standard Royal Netherlands Meteorological Institute (KNMI) tropospheric and stratospheric NO2 data product and a TROPOMI research data product developed by Environment and Climate Change Canada (ECCC) using a high-resolution regional air quality forecast model (in the air mass factor calculation). It is found that these current TROPOMI tropospheric NO2 data products (standard and ECCC) met the TROPOMI design bias requirement (< 10 %). Using the statistical uncertainty estimation method, the estimated TROPOMI upper-limit precision falls below the design requirement at a rural site but above in the other two urban and suburban sites. The Pandora instruments are found to have sufficient precision (< 0.02 DU) to perform TROPOMI validation work. In addition to the traditional satellite validation method (i.e., pairing ground-based measurements with satellite measurements closest in time and space), we analyzed TROPOMI pixels located upwind and downwind from the Pandora site. This makes it possible to improve the statistics and better interpret the high-spatial-resolution measurements made by TROPOMI. By using this wind-based validation technique, the number of coincident measurements can be increased by about a factor of 5. With this larger number of coincident measurements, this work shows that both TROPOMI and Pandora instruments can reveal detailed spatial patterns (i.e., horizontal distributions) of local and transported NO2 emissions, which can be used to evaluate regional air quality changes. The TROPOMI ECCC NO2 research data product shows improved agreement with Pandora measurements compared to the TROPOMI standard tropospheric NO2 data product (e.g., lower multiplicative bias at the suburban and urban sites by about 10 %), demonstrating benefits from the high-resolution regional air quality forecast model.
- Article
(7013 KB) - Full-text XML
- BibTeX
- EndNote


Nitrogen dioxide (NO2) is an important air pollutant and plays a critical role in tropospheric photochemistry (e.g., ECCC, 2016; EPA, 2014). It is primarily emitted to the lower troposphere from combustion processes and biomass burning as well as from lightning to the upper troposphere. NO2 forms nitrate aerosol that contributes to acid deposition and eutrophication of lakes (ECCC, 2016). Exposure to NO2 can lead to adverse health effects, such as decrease in lung function and increase in susceptibility to allergens for people with asthma (Anenberg et al., 2018; EEA, 2017; WHO, 2017).
Total vertical column NO2 can be measured by ground-based UV-visible remote sensing instruments using direct-sun, zenith-sky, or off-axis spectroscopy techniques (Cede et al., 2006; Drosoglou et al., 2017; Herman et al., 2009; Lee et al., 1994; Noxon, 1975; Piters et al., 2012; Roscoe et al., 2010; Vaughan et al., 1997). These measurements are of high quality and good precision and have been widely used for atmospheric chemistry studies (e.g., Adams et al., 2012; Hendrick et al., 2014) and satellite validations (e.g., Celarier et al., 2008; Drosoglou et al., 2018; Irie et al., 2008; Wenig et al., 2008). Among all these different viewing geometries, direct-sun measurements are of high accuracy and are not dependent on radiative transfer models (RTMs) to calculate air mass factors (AMFs) (Herman et al., 2009) or on knowledge of other atmospheric constituents.
The Pandora sun spectrometer is an instrument that measures vertical column densities (total columns) of trace gases in the atmosphere using sun and sky radiation in the UV-visible spectral region. It was developed at the National Aeronautics and Space Administration (NASA) Goddard Space Flight Center and first deployed in the field in 2006 (Herman et al., 2009). One of its primary data products is NO2 total vertical column density (VCDtotal) from the direct-sun viewing mode, where VCDtotal represents the vertically integrated number of molecules per unit area and is reported in units of molec cm−2 or Dobson units (1 DU molec cm−2). The Pandora direct-sun NO2 VCDtotal products have been validated through many field campaigns (Flynn et al., 2014; Lamsal et al., 2017; Martins et al., 2016; Piters et al., 2012; Reed et al., 2015) and ground-based comparisons (Herman et al., 2009; Wang et al., 2010) and used in satellite validations (Griffin et al., 2019; Herman et al., 2019; Ialongo et al., 2016, 2020; Lamsal et al., 2014). Since their introduction in 2006, Pandora spectrometers have been deployed at more than 50 sites globally. Funded by the European Space Agency (ESA), the Pandonia project (http://pandonia.net, last access: 1 November 2019) was established in 2015 to provide fiducial reference measurements for satellite instruments. From the collaboration between the NASA Pandora Project (http://pandora.gsfc.nasa.gov, last access: 24 April 2020) and the ESA Pandonia project, the Pandonia Global Network (PGN) was officially launched in June 2019 (https://www.pandonia-global-network.org/, last access: 24 April 2020). As a research partner to NASA's Pandora project and the ESA's Pandonia project, the Environment and Climate Change Canada (ECCC) Canadian Pandora team carries out Pandora measurements at six Canadian sites (Szykman et al., 2019). In this work, measurements made at three sites in southern Ontario, Canada, are used. These three sites represent different environments in or north of the Greater Toronto Area (GTA).
Using Pandora measurements in and north of the GTA, two versions of TROPOMI tropospheric NO2 data products are evaluated in this work: the standard TROPOMI NO2 (offline v1.1 to v1.2, Boersma et al., 2018; Eskes et al., 2019; Eskes and Eichmann, 2019; van Geffen et al., 2019) processed by the Royal Netherlands Meteorological Institute (KNMI) and the ECCC-recalculated TROPOMI NO2 (Griffin et al., 2019). The ECCC-recalculated NO2 data (referred to as ECCC NO2) utilize AMFs generated using higher-resolution input for profile shape, albedo, and snow flag. These AMFs were found to lead to a better agreement with aircraft and ground-based measurements in the Athabasca oil sands region (AOSR) (Griffin et al., 2019) than the standard TROPOMI tropospheric NO2 (referred to as KNMI NO2). One part of this work focuses on further comparison between the KNMI and ECCC TROPOMI NO2 data products.
Traditionally, ground-based measurements that are spatially and temporally close are used to validate satellite data (e.g., Boersma et al., 2009; Celarier et al., 2008; Griffin et al., 2019; Herman et al., 2009; Lamsal et al., 2014; Wenig et al., 2008). Depending on the satellite's ground-pixel size (spatial resolution) and orbit, this standard methodology usually has some constraints, such as spatial sampling (satellite data averaging a larger area than the ground-based measurements) and temporal sampling issues (for sun-synchronous orbits, satellite instruments only measure once per day over most mid-latitude regions). Furthermore, most satellite measurements are sensitive to cloud cover, and thus for a single site, the number of coincident measurements between satellite and ground-based instruments can be very limited. To improve the statistics and interpretation of the high-spatial-resolution measurements made by TROPOMI, a wind-based method was developed, tested, and applied for TROPOMI NO2 validation. The enhanced number of coincident measurements and combined meteorological data provide information about the regional NO2 distribution and transport patterns.
This paper is organized as follows: Sect. 2 describes the ground-based and satellite measurements of NO2 and the wind field data. In Sect. 3, the different validation schemes are introduced, with a detailed description of the new wind-based technique. In Sect. 4, the KNMI and ECCC satellite NO2 data products are evaluated by comparing them with ground-based data at three sites. Lastly, in Sect. 5, several aspects of the wind-based validation work are discussed, including sensitivity tests, NO2 spatial distribution and transport patterns, and performance comparison between the Ozone Monitoring Instrument (OMI) and TROPOMI. Conclusions are given in Sect. 6.
2.1 TROPOMI
TROPOMI is the single payload on the Sentinel 5 Precursor (S5P) satellite, which has a sun-synchronous orbit with an overpass time of around 13:30 local solar time (Veefkind et al., 2012). TROPOMI has near-full earth-surface coverage on a daily basis. The instrument contains three spectrometers that cover the ultraviolet-near infrared (UVN) with two spectral bands at 270–500 and 675–775 nm and one spectrometer that covers the shortwave infrared. The UVN detector developed for TROPOMI is a back-illuminated 1024×1024 pixel frame transfer charge-coupled device (CCD) (Kleipool et al., 2018). The instrument has a high spatial resolution of 7 km×3.5 km (along-track × across-track) at nadir for bands 2–6 (UVN module) (Eskes et al., 2019) (note that since 6 August 2019, the resolution has improved to 5.5 km×3.5 km). The high spatial resolution of TROPOMI is a major improvement compared to its predecessor, OMI, which has a ground footprint of roughly 13 km×24 km at nadir (de Graaf et al., 2016).
2.1.1 KNMI NO2
The standard TROPOMI NO2 retrieval algorithm was developed by the KNMI and utilizes the bands of the ultraviolet-near-infrared spectrometer (van Geffen et al., 2019). The retrieval algorithm is based on the NO2 DOMINO retrieval previously used for OMI spectra (Boersma et al., 2011) with improvements made for retrieval sub-steps (Boersma et al., 2018; van Geffen et al., 2015, 2019; Lorente et al., 2017; Zara et al., 2018). The total NO2 slant column density (SCD) is retrieved by using the differential optical absorption spectroscopy (DOAS) method (e.g., Platt, 1994; Platt and Stutz, 2008). The SCD is separated into stratospheric (SCDstrat) and tropospheric (SCDtrop) components using information from a data assimilation system (van Geffen et al., 2019). Next, SCDstrat and SCDtrop are converted to stratospheric and tropospheric vertical columns, respectively (VCDstrat and VCDtrop), by applying appropriate altitude-dependent AMFs based on a look-up table. The look-up table requires daily information on the vertical profile of NO2 from the TM5-MP model (at resolution; Williams et al., 2017) and the surface albedo information derived from a monthly OMI climatology (on a resolution; Kleipool et al., 2008). TROPOMI uses a snow flag from the Near real-time Ice and Snow Extent (NISE), and the albedo is set to 0.6 if the surface beneath is covered in snow or ice. For this study, we use offline (OFFL) level 2 v1.1 to v1.2 (van Geffen et al., 2019), which is the first released offline version of the TROPOMI tropospheric and stratospheric NO2 columns (http://www.tropomi.eu, last access: 24 April 2020). During preparation of this paper, a new reprocessing level v1.3 product became available (van Geffen et al., 2019). The total column NO2 used in this work is the sum of VCDstrat and VCDtrop. Spatial resolution varies with across-track position, and in this study, the average pixel size is about 5.9 km×7 km. Pixels that are fully or partially covered by clouds were filtered; here we used 0.3 as a cutoff for the radiative cloud fraction (provided with TROPOMI data).
The TROPOMI NO2 data product bias and random uncertainty requirements (ESA EOP-GMQ, 2017) are shown in Table 1. Independent preliminary validation by the S5P Mission Performance Center (MPC) and S5P validation team concludes that OFFL level 2 NO2 data are in overall agreement with reference measurements collected from global ground-based networks (Eskes and Eichmann, 2019; Lambert et al., 2019). TROPOMI tropospheric columns were compared with multi-axis DOAS (MAX-DOAS) data at 14 sites. It was found that TROPOMI tropospheric columns have a median negative bias of less than 50 %. TROPOMI stratospheric columns were compared with zenith-sky scatter-light DOAS (ZSL-DOAS) data and a 0.01 DU negative bias (below 5 %) was found. Total columns were compared with measurements by more than 10 Pandora instruments and showed a negative bias, with TROPOMI being up to 45 % lower and showing a lower than expected accuracy. However, currently, the random uncertainties of the data product have not been fully accessed.
Table 1TROPOMI NO2 data product requirements extracted from the S5P Calibration and Validation Plan (ESA EOP-GMQ, 2017).

n/a: not applicable
2.1.2 ECCC NO2
Following Griffin et al. (2019), tropospheric AMFs, which are recalculated at a much higher resolution (10 km×10 km) than those for the standard TROPOMI product (about 40 km×110 km in the GTA), are used to produce the ECCC version of TROPOMI tropospheric NO2 data. The Global Environmental Multiscale – Modelling Air-quality and Chemistry (GEM-MACH) operational model output (version 2, at 10 km×10 km resolution, the closest hourly data) was used to provide the NO2 profile shape used in the AMF calculation. GEM-MACH is ECCC's regional air quality forecast model. It is run operationally two times per day to predict hourly surface pollutant concentrations over North America for the next 48 h (Moran et al., 2009; Pavlovic et al., 2016; Pendlebury et al., 2018). Physical and chemical processes represented in GEM-MACH include emissions, dispersion, gas- and aqueous-phase chemistry, inorganic heterogeneous chemistry, aerosol dynamics, and wet and dry removal. The ECCC AMF calculation used the Interactive Multisensor Snow and Ice Mapping System (IMS) data (Helfrich et al., 2007) to flag pixels with snow cover. Improved albedo inputs were created using averaged monthly albedo for areas without snow cover and a climatology for snow-covered areas using the MODIS MCD43C3 data product (Schaaf et al., 2002) by only considering grid boxes that were 100 % snow-free or 100 % snow-covered. The choice of which to use, snow-free or snow-covered, is determined using the IMS snow product. With the inputs from GEM-MACH, MODIS, IMS, and the SASKTRAN radiative transfer model (Bourassa et al., 2008; Dueck et al., 2017; Zawada et al., 2015), new tropospheric AMFs were calculated. More details about this TROPOMI ECCC tropospheric NO2 data product can be found in Griffin et al. (2019). In this work, the ECCC total column NO2 data products are generated by adding ECCC tropospheric columns to KNMI standard stratospheric columns.
2.2 OMI
OMI is a Dutch–Finnish nadir-viewing UV-visible spectrometer aboard NASA's Earth Observing System (EOS) Aura satellite that was launched in July 2004. It measures the solar radiation backscattered by the earth's atmosphere and surface between 270 and 500 nm with a spectral resolution of 0.5 nm (Levelt et al., 2006, 2018). OMI has a 780×576 CCD detector that measures at 60 across-track positions simultaneously and thus does not require across-track scanning. Due to this approach, the spatial resolution of the CCD pixels varies significantly along the across-track direction: the pixels near the track centre have a ground footprint of 13 km×24 km, whereas the pixels close to the track edge (e.g., view zenith angle ) have a ground footprint of roughly 23 km×126 km (de Graaf et al., 2016). Note that from 2012 onwards, the smallest pixels (across-track positions) can no longer be used and are excluded from the analysis (known as the “row anomaly”, i.e., Levelt et al., 2018). This means the “smallest” pixels available for OMI are larger than 13 km×24 km.
2.2.1 SPv3 NO2
The OMI total column NO2 data used in this work are the NASA standard product (SP) (Bucsela et al., 2013; Wenig et al., 2008) version 3.1 level 2 (SPv3.1) (Krotkov et al., 2017). The NO2 SCDs are derived using the DOAS technique in the 405–465 nm window (Marchenko et al., 2015). The AMFs used in SPv3.1 are calculated by using (latitude × longitude) resolution a priori NO2 and temperature profiles from the Global Modeling Initiative (GMI) chemistry-transport model with yearly varying emissions (Krotkov et al., 2017).
2.2.2 ECCC NO2
Similarly to TROPOMI ECCC NO2, the same alternative tropospheric ECCC AMFs were applied to OMI data. The OMI–ECCC tropospheric column data were evaluated in McLinden et al. (2014), which showed that the OMI–ECCC data have increased the peak NO2 VCDtrop occurring over the Canadian AOSR by a factor of 2. In this work, the OMI–ECCC total column NO2 data products are generated by adding ECCC tropospheric columns to OMI standard stratospheric columns. Compared to TROPOMI–ECCC, which uses the hourly GEM-MACH profiles, OMI–ECCC uses the modelled monthly NO2 climatology as the input in the AMF calculation.
2.3 Pandora
The Pandora instrument records spectra between 280 and 530 nm with a resolution of 0.6 nm (Herman et al., 2009, 2015; Tzortziou et al., 2012). It uses a temperature-stabilized Czerny–Turner spectrometer, with a 50 µm entrance slit, 1200 groove mm−1 grating, and a 2048×64 back-thinned Hamamatsu CCD detector. The spectra are analyzed using a total optical absorption spectroscopy (TOAS) technique (Cede, 2019), in which absorption cross sections for multiple atmospheric absorbers, such as ozone, NO2, and sulfur dioxide (SO2), are fitted to the spectra.
The Pandora direct-sun total column NO2 data are produced using Pandora's standard NO2 algorithm implemented in the BlickP software (Cede, 2019). The measured direct-sun spectra from 400 to 440 nm are used in the TOAS analysis. A synthetic reference spectrum is produced by averaging multiple measured spectra which get corrected for the estimated total optical depth included in it. Cross sections of NO2 at an effective temperature of 254.5 K (Vandaele et al., 1998), ozone at an effective temperature of 225 K (Brion et al., 1993, 1998; Daumont et al., 1992), and a fourth-order polynomial are all fitted. The resulting NO2 SCDs are then converted to total column by using direct-sun geometry AMFs. Herman et al. (2009) showed that Pandora direct-sun total column NO2 has a clear-sky precision of 0.01 DU (in the slant column) and a nominal accuracy of 0.1 DU (in the vertical column). Additional information on Pandora calibrations, operation, and retrieval algorithms can be found in Herman et al. (2009) and Cede (2019).
Pandora instrument nos. 103 and 104 have been deployed in Downsview, Toronto (43.781∘ N, −79.468∘ W; suburban), since 2013 to perform direct-sun measurements (Zhao et al., 2016). The instruments are installed on the roof of the ECCC Downsview building at an altitude of 187 m a.s.l. The building is located in a suburban area with multiple roads nearby. Since February 2018, the instruments have employed an alternating direct-sun, zenith-sky, and multi-axis observation schedule, which includes direct-sun measurements every 5 min during the sunlit period.
Pandora instrument nos. 108 and 145 have been deployed in Egbert (44.230∘ N, −79.780∘ W; rural) and the University of Toronto St. George Campus (43.661∘ N, −79.399∘ W, referred to as UTSG; urban), respectively, since May 2018. The same alternating observation schedule is implemented. Pandora no. 108 is located on the roof of the ECCC Center for Atmospheric Research Experiments (CARE) building in Egbert at an altitude of 251 m a.s.l. The building is in a rural area, which is surrounded by farmlands. Pandora no. 145 is located in the University of Toronto Atmospheric Observatory (TAO) in downtown Toronto at an altitude of 174 m a.s.l. A map of the GTA and surrounding areas is shown in Fig. 1, overlaid with a colour map of TROPOMI KNMI NO2 tropospheric columns averaged over the March 2018 to March 2019 period utilizing the pixel-averaging technique (Fioletov et al., 2011; Sun et al., 2018). It is clear that the three sites (Downsview, Egbert, and UTSG) represent three different NO2 pollution levels.
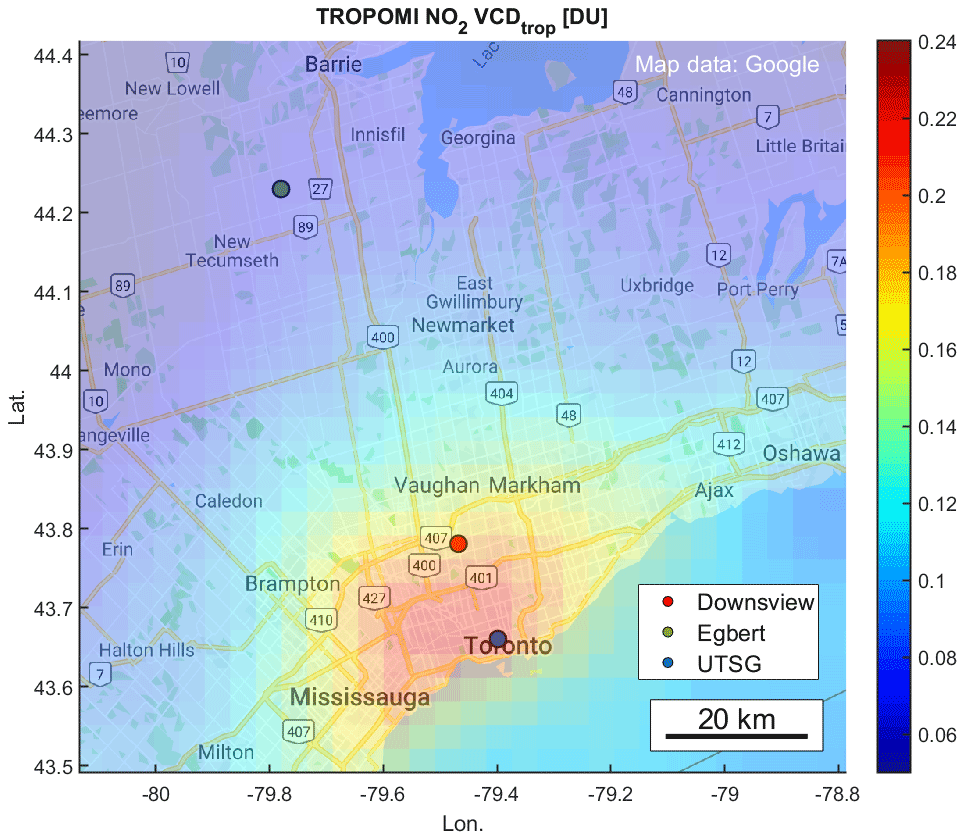
Figure 1Pandora sites in and north of the Greater Toronto Area. Colour dots indicate the sites. The map (© Google Maps) is masked with TROPOMI KNMI NO2 tropospheric columns smoothed by pixel averaging (March 2018 to March 2019).
2.4 Wind data
2.4.1 ERA-Interim for OMI
As in several previous studies (Fioletov et al., 2017, 2015; McLinden et al., 2016), wind speed and direction data for each satellite pixel from the European Centre for Medium-Range Weather Forecasts (ECMWF) reanalysis data (Dee et al., 2011; http://apps.ecmwf.int/datasets/, last access: 24 April 2020), i.e., ERA-Interim, were merged with OMI measurements. Wind profiles are available every 6 h on a 0.75∘ horizontal grid and are interpolated in time and space to the location of each OMI pixel centre. U and V (west–east and south–north, respectively) wind-speed components were interpolated spatially and temporally to the location and overpass time of each OMI pixel. The wind components were then averaged in the vertical between 1000 and 900 hPa, where the majority of the tropospheric NO2 mass resides.
2.4.2 ERA-5 for TROPOMI
ERA-5 data have better spatial and temporal resolution (1 h on a 0.28∘ horizontal grid, approximately 30 km) than ERA-Interim. Thus, ERA-5 data were selected and merged with TROPOMI NO2 data. Wind profiles were interpolated spatially and temporally for TROPOMI pixels, and 1000–900 hPa vertical pressure levels were used in averaging the wind speed and direction. The results of “ERA-Interim + OMI” and “ERA-5 + TROPOMI” are compared and presented in Sect. 5.2. The other combinations such as “ERA-Interim + TROPOMI” were also evaluated, but it was found that the “ERA-Interim + TROPOMI” result did not perform as well as the combination of “ERA-5 + TROPOMI”. This is unsurprising since the core of the wind-based method (see Sect. 3.2) is the quality of high-resolution wind and satellite data. Thus, the “ERA-Interim + TROPOMI” combination was not included in this work.
3.1 Standard approach
To validate the satellite measurements, coincident ground-based data are required. The coincidence criteria are normally composed of spatial, temporal and quality control criteria (e.g., Boersma et al., 2018; Drosoglou et al., 2017; Griffin et al., 2019; Irie et al., 2008; Toohey and Strong, 2007). For example, in Zhao et al. (2019b), the coincidence criteria used to pair ground-based observations (Pandora) and OMI data include (1) the nearest (in time) measurement that was within ±30 min of the OMI overpass time, (2) the closest OMI ground pixel (having a distance of less than 20 km from the ground pixel centre to the location of the Pandora instrument), and (3) cloud fraction < =0.3 (the effective geometric cloud fraction as determined by the OMCLDO2 algorithm), and only high-quality OMI data are used (VcdQualityFlags =0) (Celarier et al., 2016). This simple coincident measurement selection scheme is referred to here as the “standard” method.
In this work, similar criteria are used with some adjustments. The temporal criterion is changed from ±30 to ±10 min of TROPOMI overpass time (this is to ensure the standard method can be fairly compared with the new wind-based method; see Sect. 3.2). Since TROPOMI has better spatial resolution than that of OMI, the selected spatial criterion is set to 10 km for TROPOMI. Similarly to OMI, only high-quality TROPOMI data are used (qa_value > 0.75) (Eskes et al., 2019). Pandora direct-sun NO2 total column data of assured high quality (L2 data quality flag =0) are used in the validation (Cede, 2019). Note that the TROPOMI quality assurance value filter (qa_value > 0.75) removes cloud-covered scenes with cloud radiance fraction > 0.5. In this study, to make a straightforward comparison with OMI, an additional cloud fraction filter is used (cloud fraction < =0.3) for TROPOMI data.
3.2 Wind-based method
To make more use of the high-resolution measurements made by TROPOMI and to improve their validation, a wind-based method is tested, which can increase the number of coincident measurements. In addition to coincident and co-located data, this method looks at upwind (downwind) TROPOMI pixels that will arrive at (have passed over) the Pandora site within a short time window. Technically, this is done by using wind rotation and aligning all wind directions to the preferred direction. After the rotation, all ground pixels have a common effective wind direction and can be analyzed together regardless of the true wind direction. Any NO2 source located between the satellite pixel and the Pandora site will affect the performance, and we need to look at the TROPOMI–Pandora differences as a function of the wind direction.
In general, the wind-based method adapts a pixel-rotation technique developed and used in several previous studies (e.g., Fioletov et al., 2015; Pommier et al., 2013). Previously, the pixel rotation involved a rotation of each satellite ground pixel around the SO2 source location (e.g., smelters or mining areas). In this work, we adapted the pixel-rotation technique, where the satellite observations are rotated around a point, which in this case is the location of the ground-based instrument.
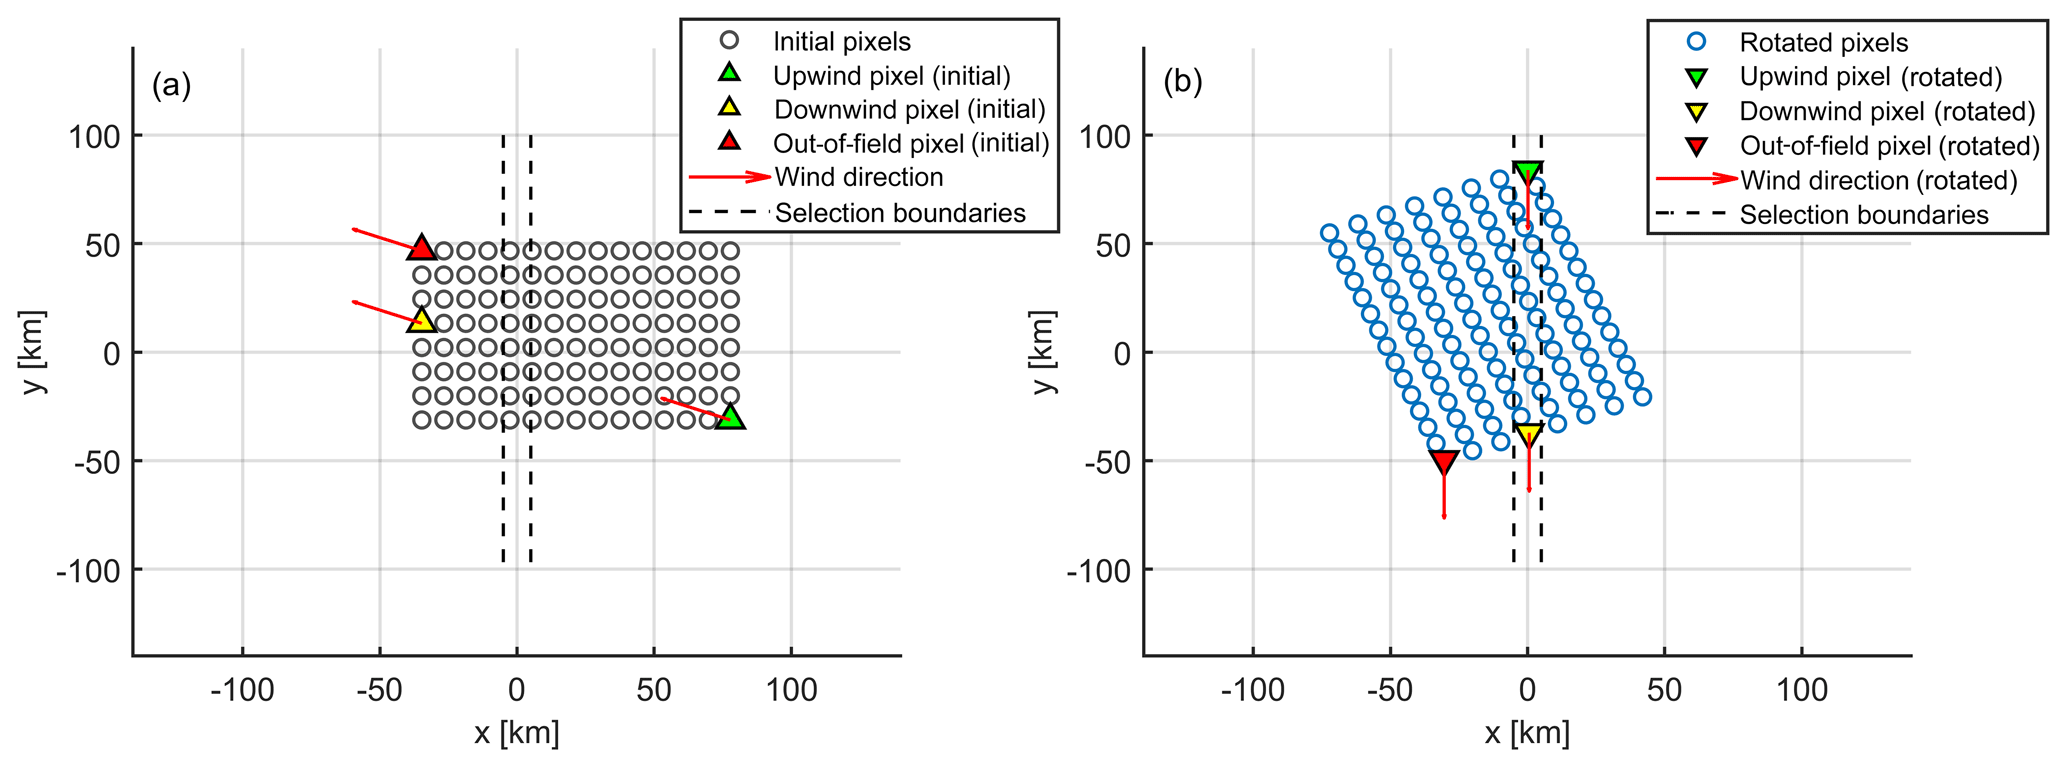
Figure 2Visualization of the wind-based method, (a) initial positions of satellite ground pixels, and (b) rotated positions of these satellite ground pixels, both in local tangent plane coordinates. Examples of upwind (green), downwind (yellow), and out-of-field (red) pixels are shown by colour-coded triangles with wind arrows. Dashed black lines are the boundaries used to select pixels (and measurements) that are coincident with the ground-based site.
First, the initial coordinates of each satellite pixel (geographic coordinate; Ginitial (lat, lon)) are interpolated to the horizontal distance from the selected centre (local tangent plane coordinate; Pinital (x, y), where x is east–west distance and y is north–south distance). Figure 2a shows the initial positions of pixels in the local tangent plane coordinate, where the ground-based instrument site is at P (0, 0). Then a rotation matrix R is applied to satellite ground pixels, with the rotation angle equal to the negative of the wind direction (θ):
After the rotation, each satellite ground pixel maintains its upwind–downwind character. In other words, after rotation, the new ground pixel, Protate (x, y), can be analyzed assuming that the wind always has a constant direction (from “north” to “south”) as shown in Fig. 2. All the pixels in Fig. 2 share the same wind direction, but only three colour-coded pixels are selected to show with the wind arrow. Thus, for a given rotated pixel, the closest distance it can reach to the site, P (0, 0), is xrotate, at a time given by
where tmeas is the measurement time of the pixel, yrotate is the y value of Protate, and ν is the wind speed. Next, the boundaries of coincident measurement selection are defined as
where ρ is an arbitrary distance, referred to as rotational-coincident distance. For example, for TROPOMI, we find the optimized ρ value equal to 5 km. Use of a larger ρ value will increase the number of coincident measurements, while the representativeness of coincident measurements (i.e., whether or not the selected satellite pixel can represent the ground-based measurement at a given time) will decrease. Based on sensitivity tests using various ρ values, a balance between number of coincident measurements and representativeness can be achieved. For other satellites with coarse spatial resolution, the rotational-coincident distance value has to be increased (e.g., approximately equal to the satellite's ground-pixel size).
This method is valid if the trace gas concentrations do not change rapidly over the pixel travel time, ttravel. The assumptions made here are that (1) the local emission patterns (strength and spatial distribution), (2) chemical reactions, and (3) vertical atmospheric dynamics (i.e., boundary layer variation) do not change rapidly during this time period. All these assumptions are likely to be close to reality for tropospheric NO2 in most areas around local noon. Even for urban areas, the local emissions are relatively stable around local noon (when sun-synchronous orbiting satellites such as OMI and TROPOMI pass over a given site) compared to morning or evening rush hours. In addition, the NO2 photolysis rate (Dickerson et al., 1982) and boundary layer height (Garratt, 1994) around local noon are also relatively stable compared to morning or evening conditions.
For example, using the rotated plane coordinates (Fig. 2b), any pixel within the rotational-coincident boundaries ±ρ (indicated by the dashed lines) will “overpass” the site at tcoincident, having an “overpass” distance from the ground pixel centre to the location of the ground-based instrument less than or equal to 5 km. In the application, we give a cutoff value to the pixel travel time, ttravel, as
which ensures that the assumptions we made (i.e., emission, chemical, and dynamic changes are not significant in this period) are valid. The colour-coded pixels in Fig. 2 are examples of upwind pixel (green), downwind pixel (yellow), and out-of-field pixel (red). In general, the wind-based method can identify any pixel that has its simulated “trajectory” passing over the ground-based site. However, if there is a major emission source between the TROPOMI pixel and the ground-based instrument, the difference between satellite and ground-based measurements will increase. This feature is observed and can be used to distinguish local and transported pollution (discussed in Sect. 5.1).
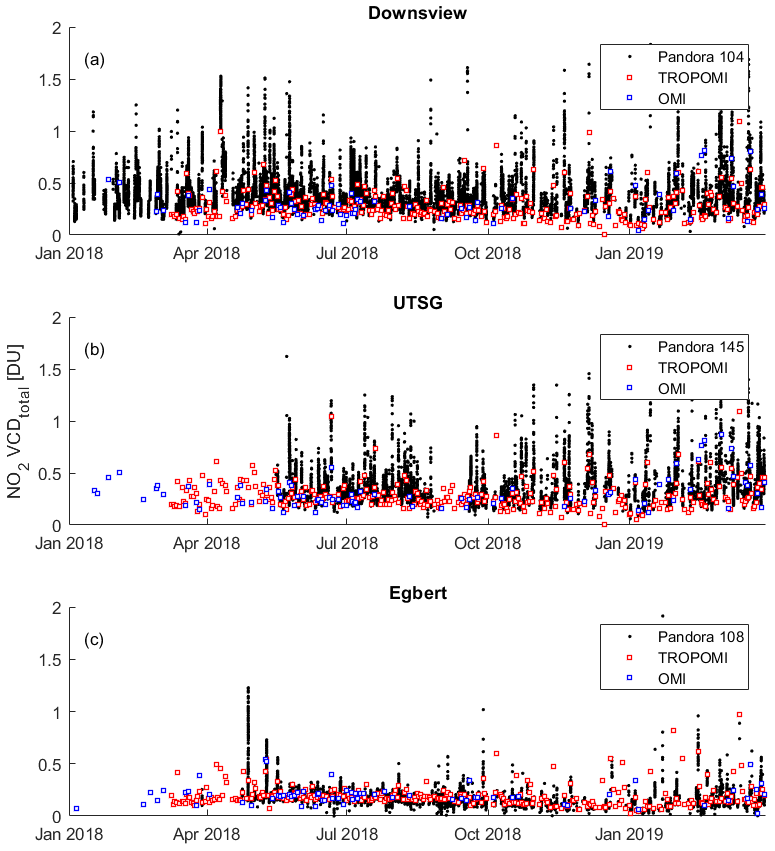
Figure 3Time series of Pandora, TROPOMI, and OMI total column NO2 in the Greater Toronto Area.
Times series of Pandora, TROPOMI and OMI total column NO2 are shown in Fig. 3. For the Downsview and UTSG sites, local morning and evening rush hour NO2 pollution can be more than 1.5 DU. When compared to downtown UTSG, suburban Downsview is more polluted, which is mainly due to the heavy traffic in the Downsview area (close to several major highways and the major city airport). In contrast, the Egbert rural site shows no sign of increased NO2 during rush hour.
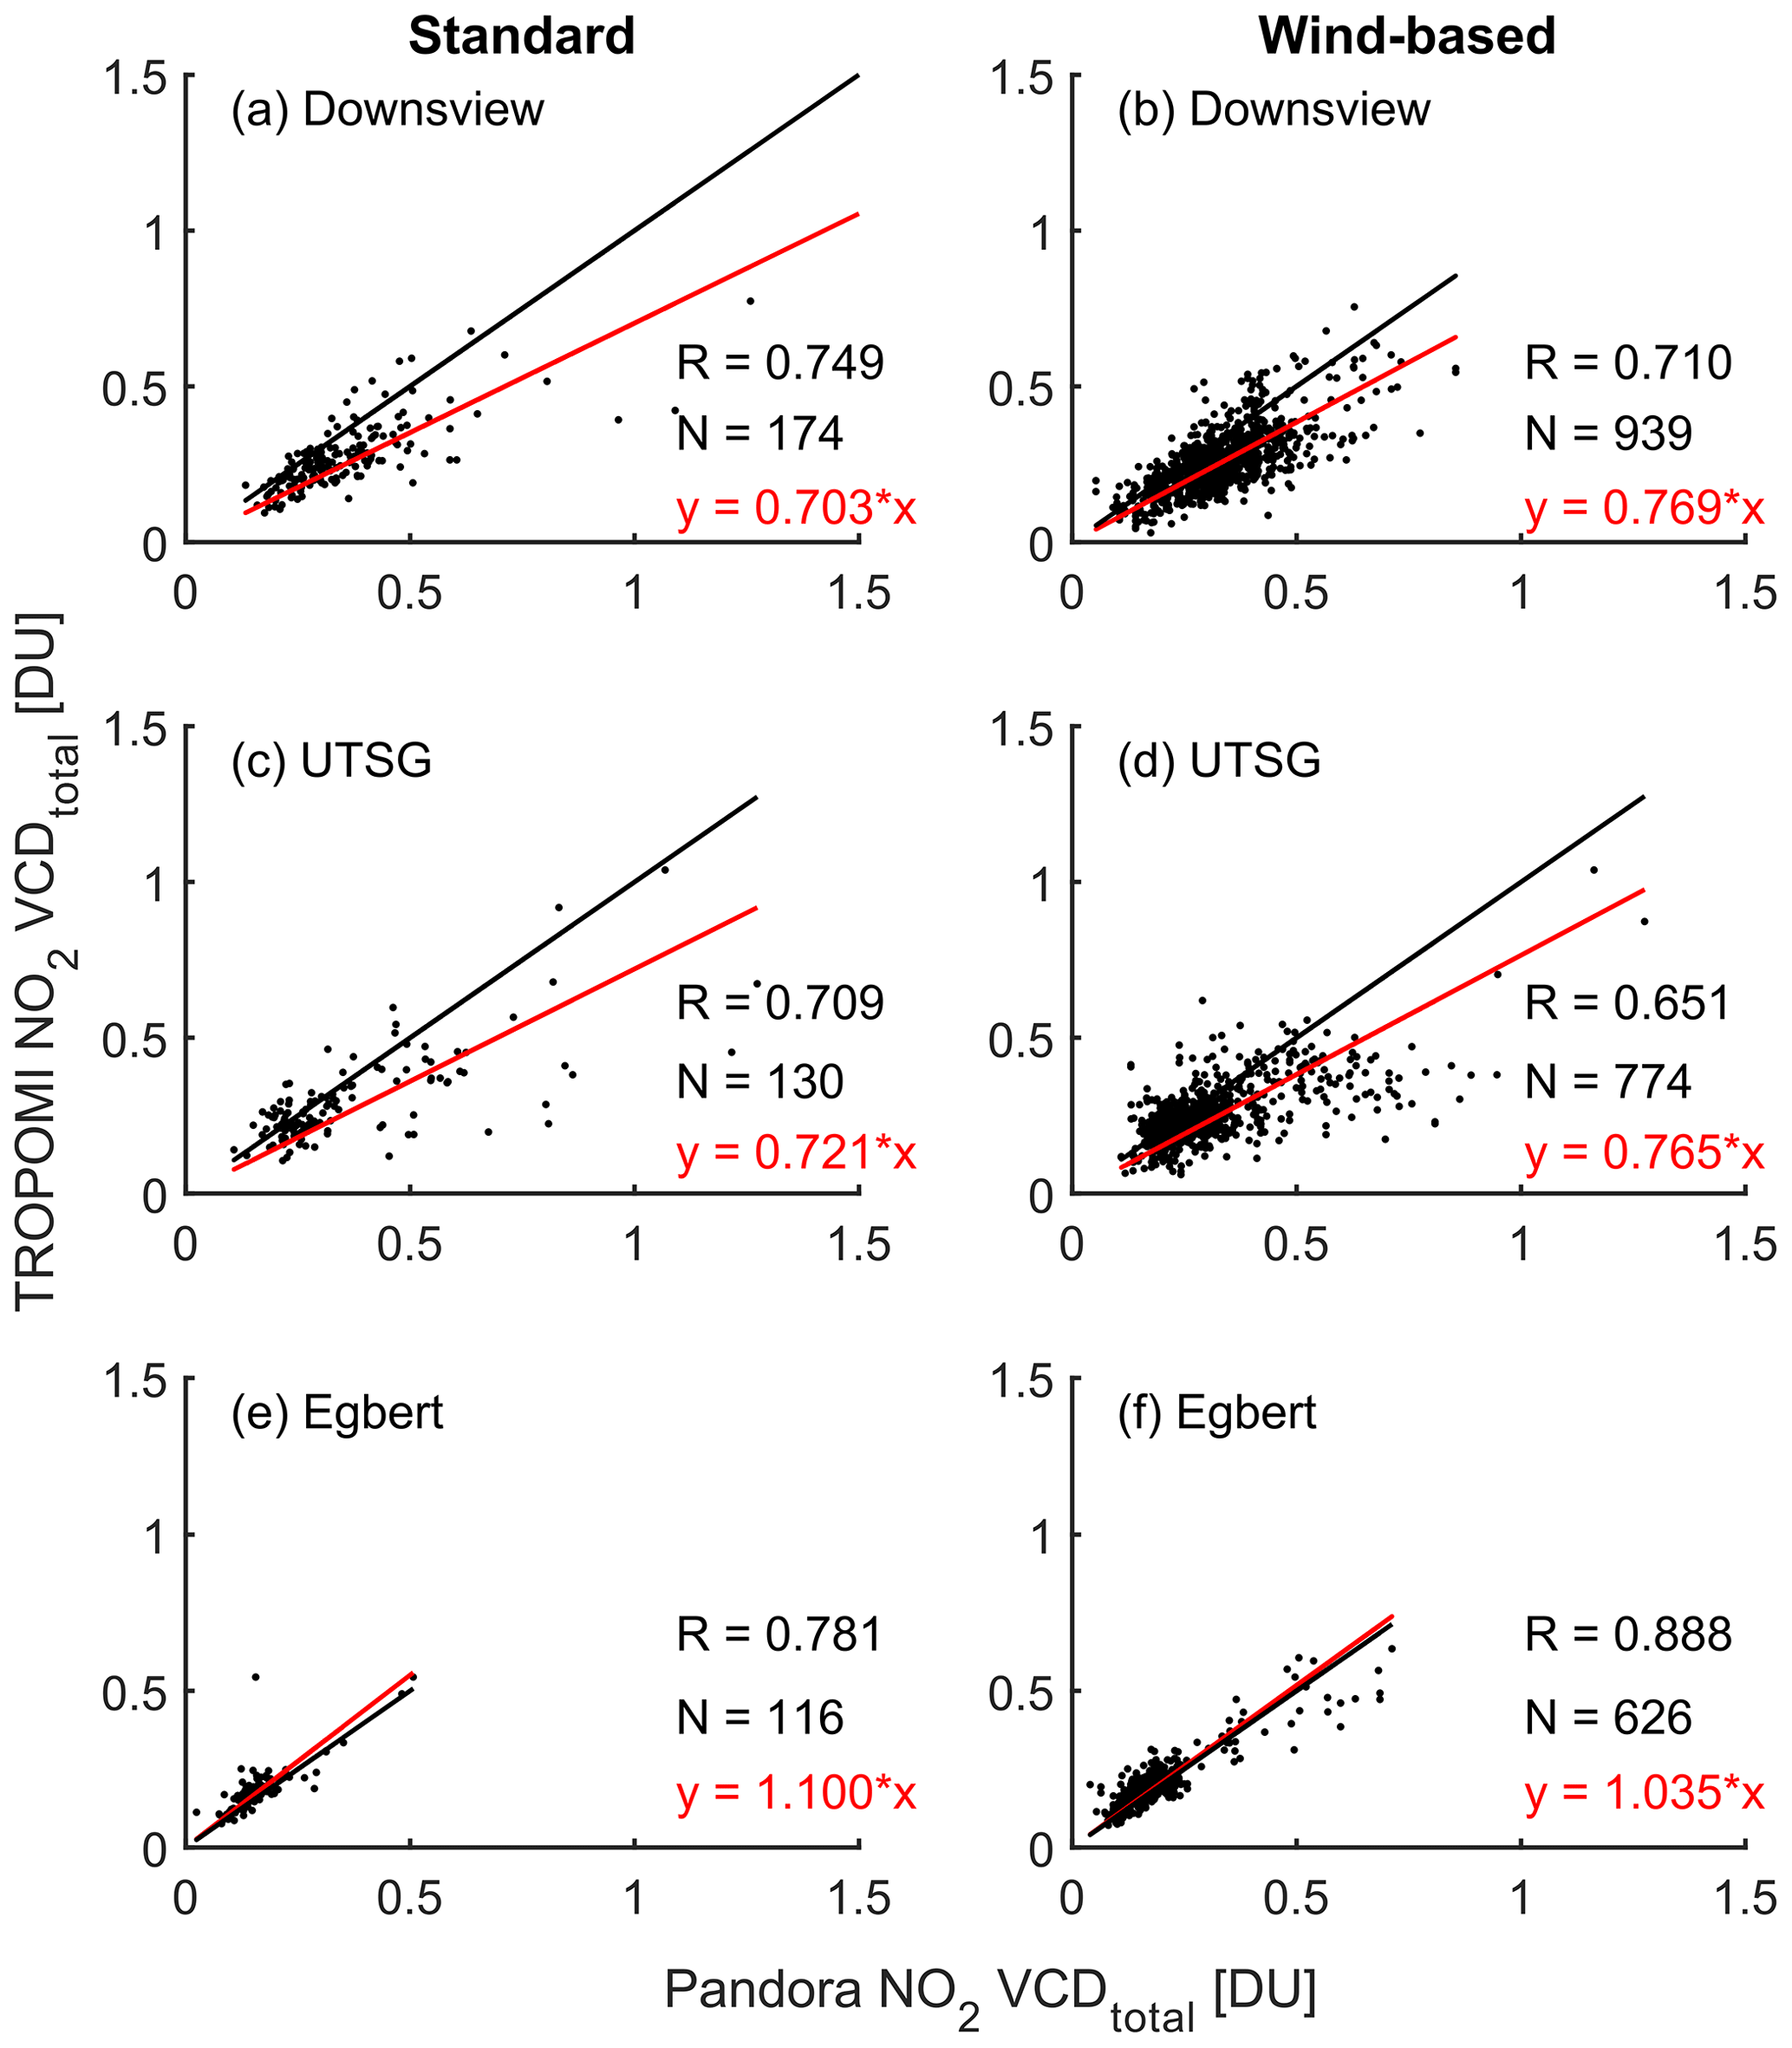
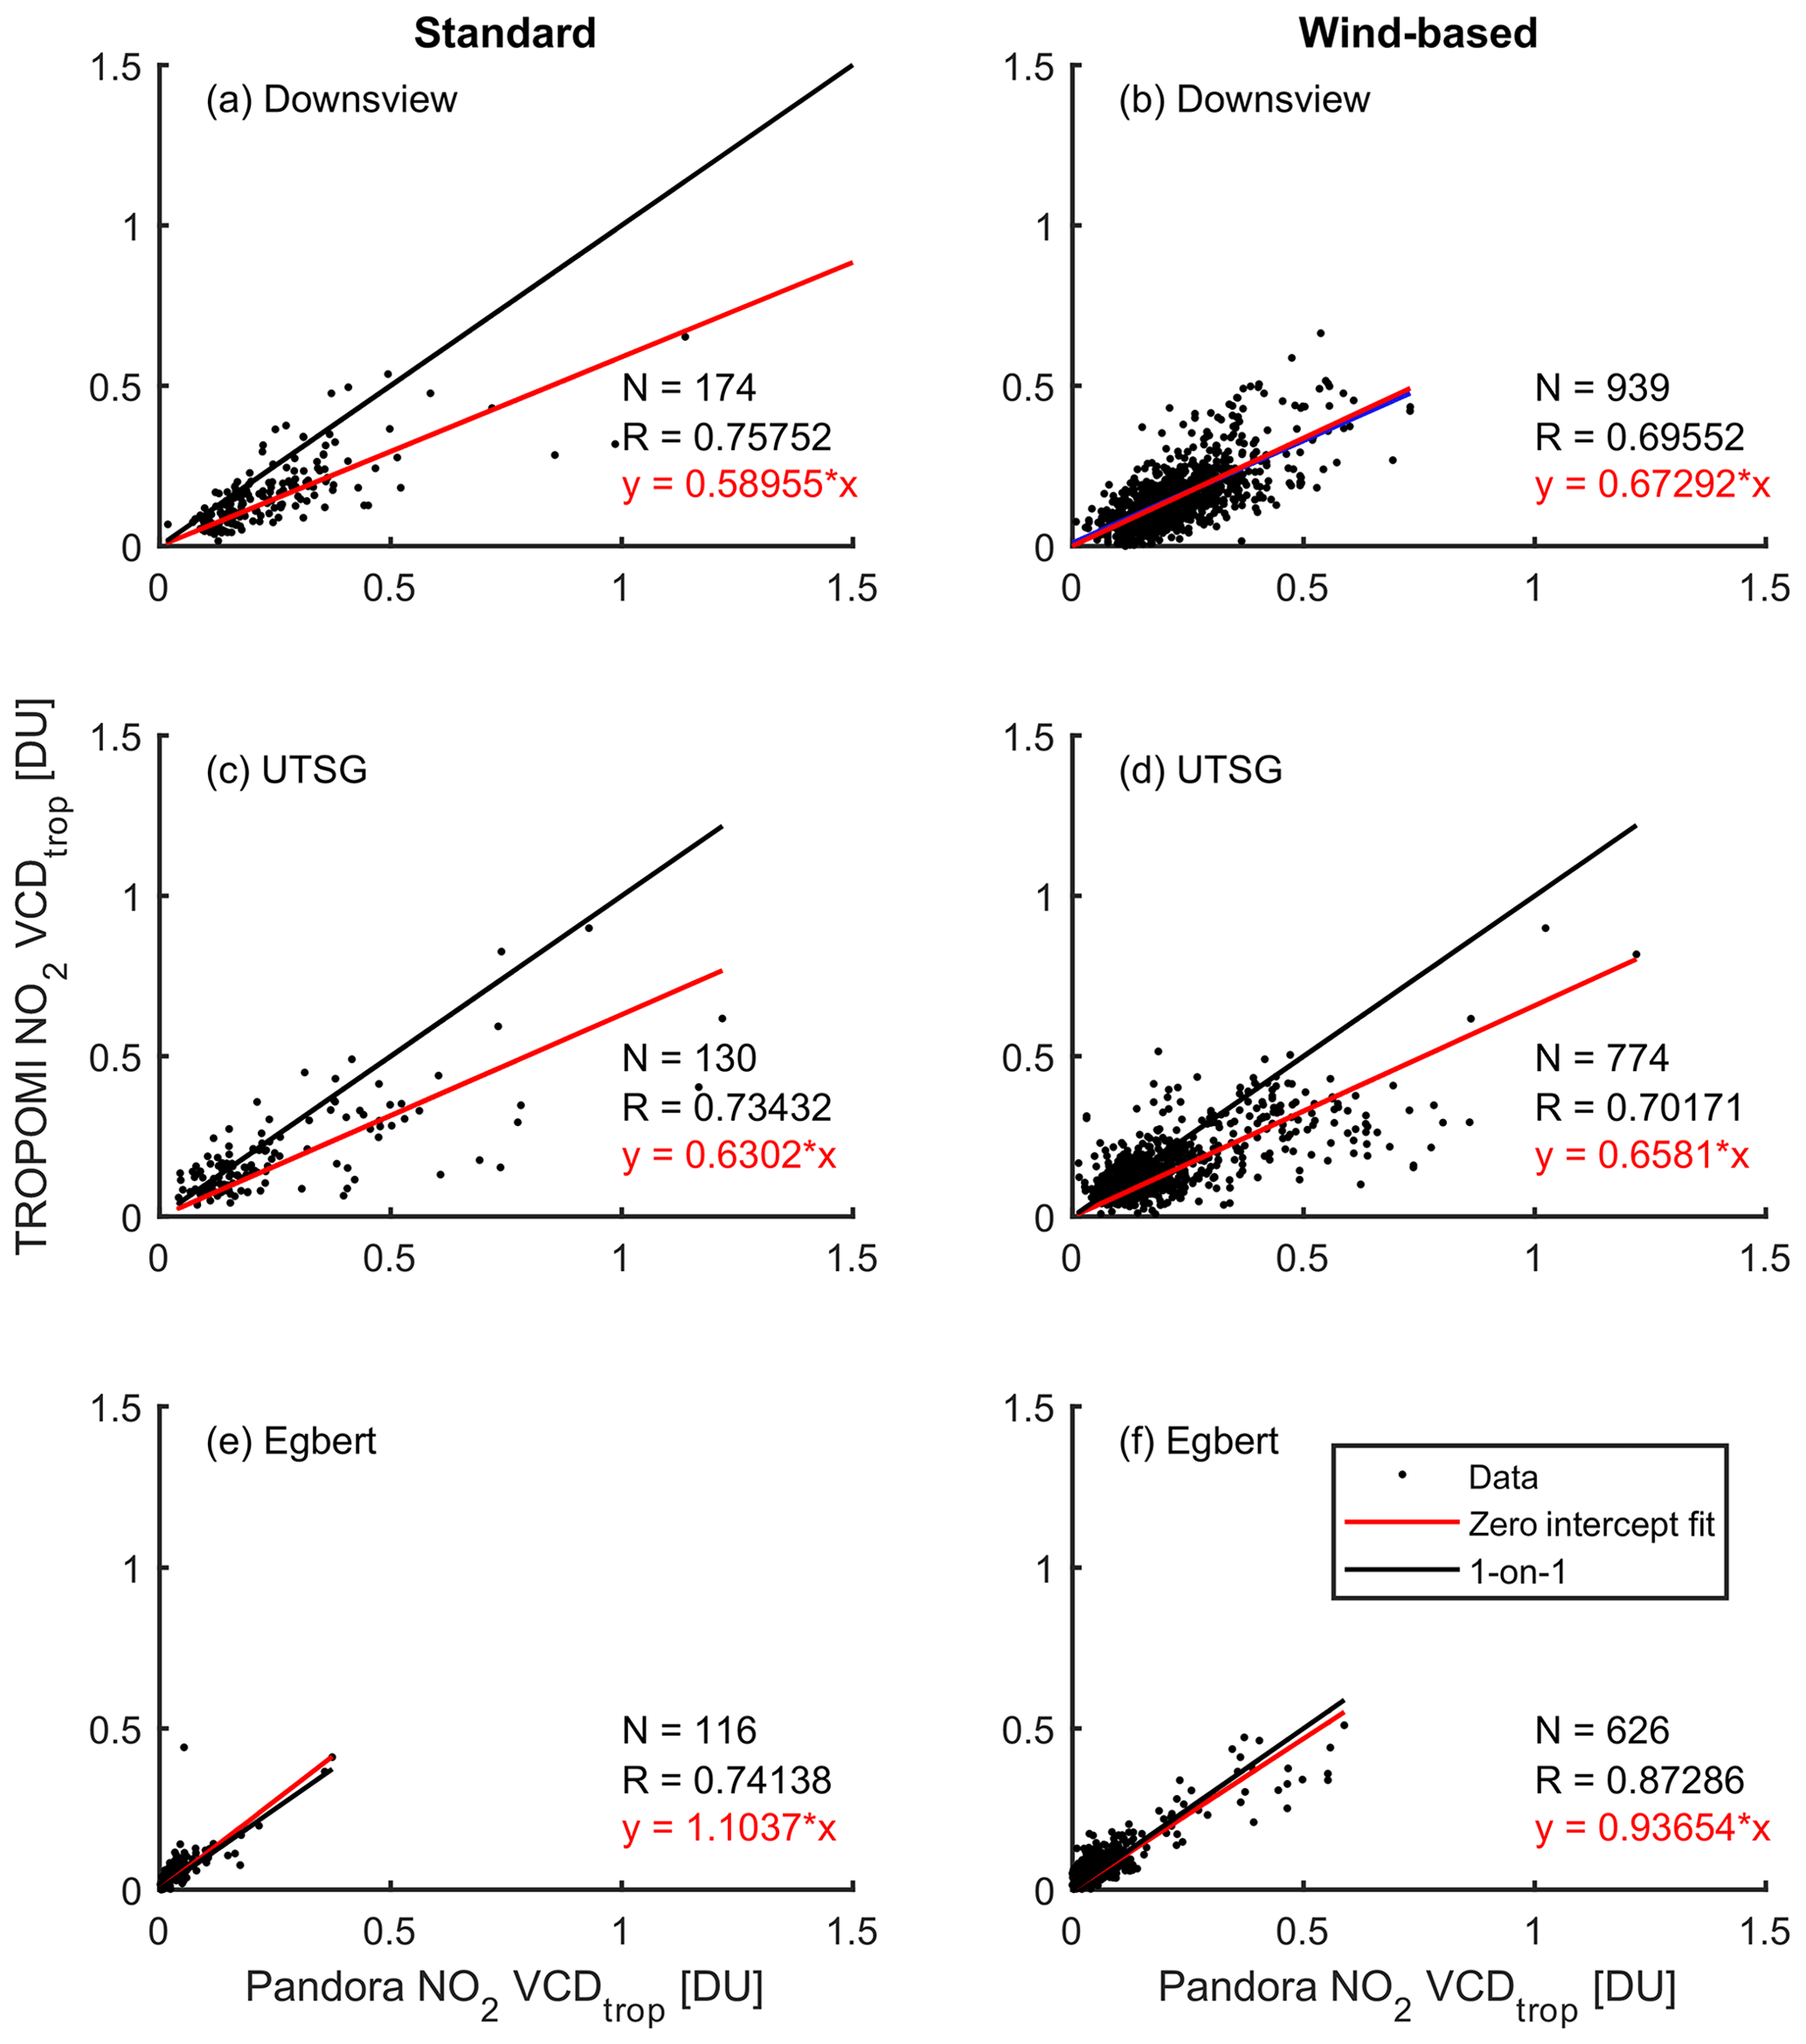
Figure 4TROPOMI (KNMI) vs. Pandora NO2 total columns measured at Downsview, UTSG, and Egbert, using the standard (a, c, e) and wind-based (b, d, f) coincidence comparison methods. In each scatter plot, the red line is the linear fit with the intercept set to 0, and the black line is the one-to-one line.
4.1 Comparison between standard and new methods
Figure 4 shows the comparison of results obtained using the standard and new wind-based methods for defining coincident measurements. The standard and wind-based methods show similar performance in terms of correlation coefficient. Although the correlation coefficients (R) decreased slightly for two of the three sites (for the Downsview site, it decreased from 0.75 to 0.71; for the UTSG site, it decreased from 0.71 and 0.65), the R increased for the Egbert site (from 0.78 to 0.89). Egbert, as a rural area, has much lower NO2 total columns than the values in urban and suburban areas. Compared to Downsview and UTSG, the correlation coefficients between TROPOMI and Pandora data are improved by the wind-based method due to increased observations of transported pollution events. In general, the number of coincident measurements (N) increased for all sites by about a factor of 5 (e.g., from 174 to 939 for Downsview) when using the wind-based method.
For Downsview, Fig. 4a and b show that the multiplicative biases between TROPOMI and Pandora total column NO2 data (indicated by the slopes of the fitted lines, with fixed zero intercept) are −30 % and −23 % for the standard and wind-based methods, respectively. The results for UTSG and Egbert are shown in Fig. 4c to f. Similarly to Downsview, TROPOMI data show −28 % (standard) and −24 % (wind-based) multiplicative biases relative to the Pandora at UTSG. However, in contrast to Downsview, where TROPOMI data show negative bias relative to Pandora data, TROPOMI NO2 observations have 10 % (standard) and 4 % (wind-based) positive multiplicative biases at Egbert. The positive bias at Egbert might be due to TROPOMI overestimating stratospheric NO2 (e.g., Wang et al., 2020). Other typical satellite validation metrics, including absolute differences, relative mean differences, and regression slopes, are provided in Appendix A.
In general, Fig. 4 shows that the larger number of coincident measurements paired by the wind-based method maintained similar good quality to the ones paired by the standard method. Further sensitivity tests on the parameters used in the wind-based method are shown in Appendix B. It is expected that the local emissions will be more significant than transported NO2 in downtown Toronto, whereas the transported NO2 is more significant than local emissions in Egbert. Thus, the wind-based method's sensitivity is dependent on local pollution patterns. Details about the sensitivity distance are discussed in Appendix B. In general, for individual sites, a unique sensitivity distance should be evaluated and applied to achieve the best balance between the number of coincident measurements and representativeness of the enlarged dataset (i.e., whether or not the expanded dataset can represent the real local or regional conditions).
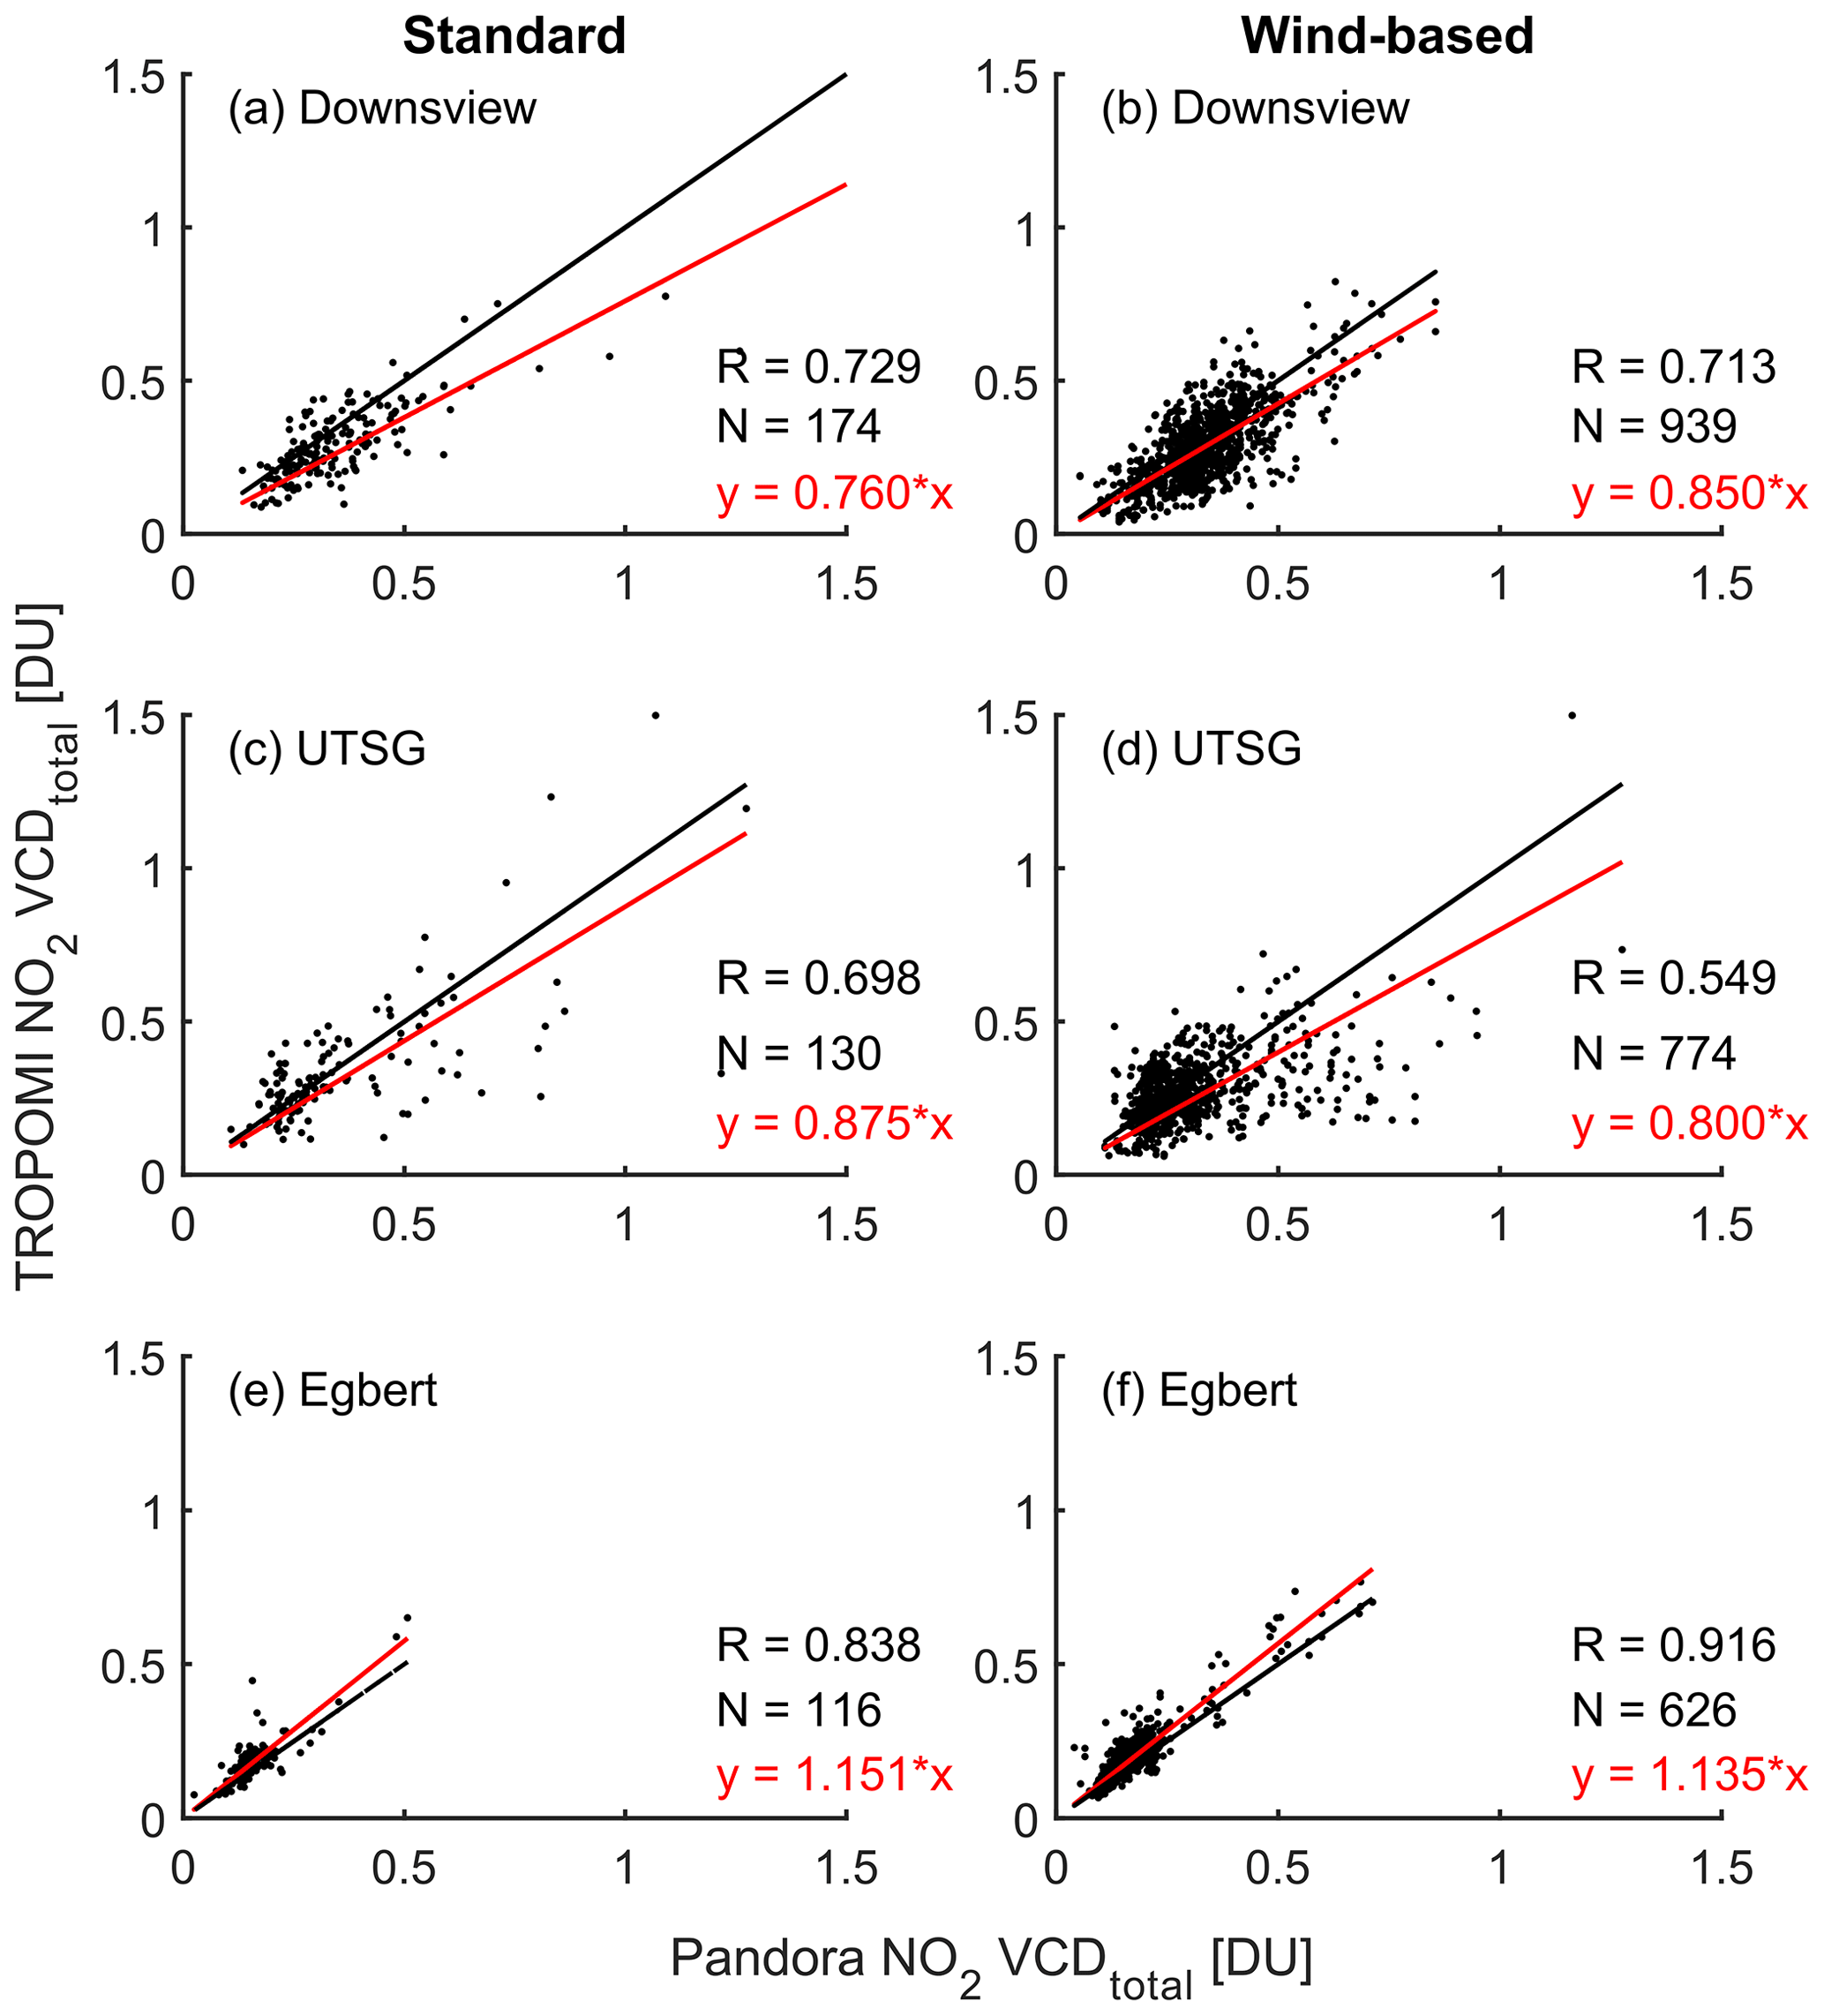
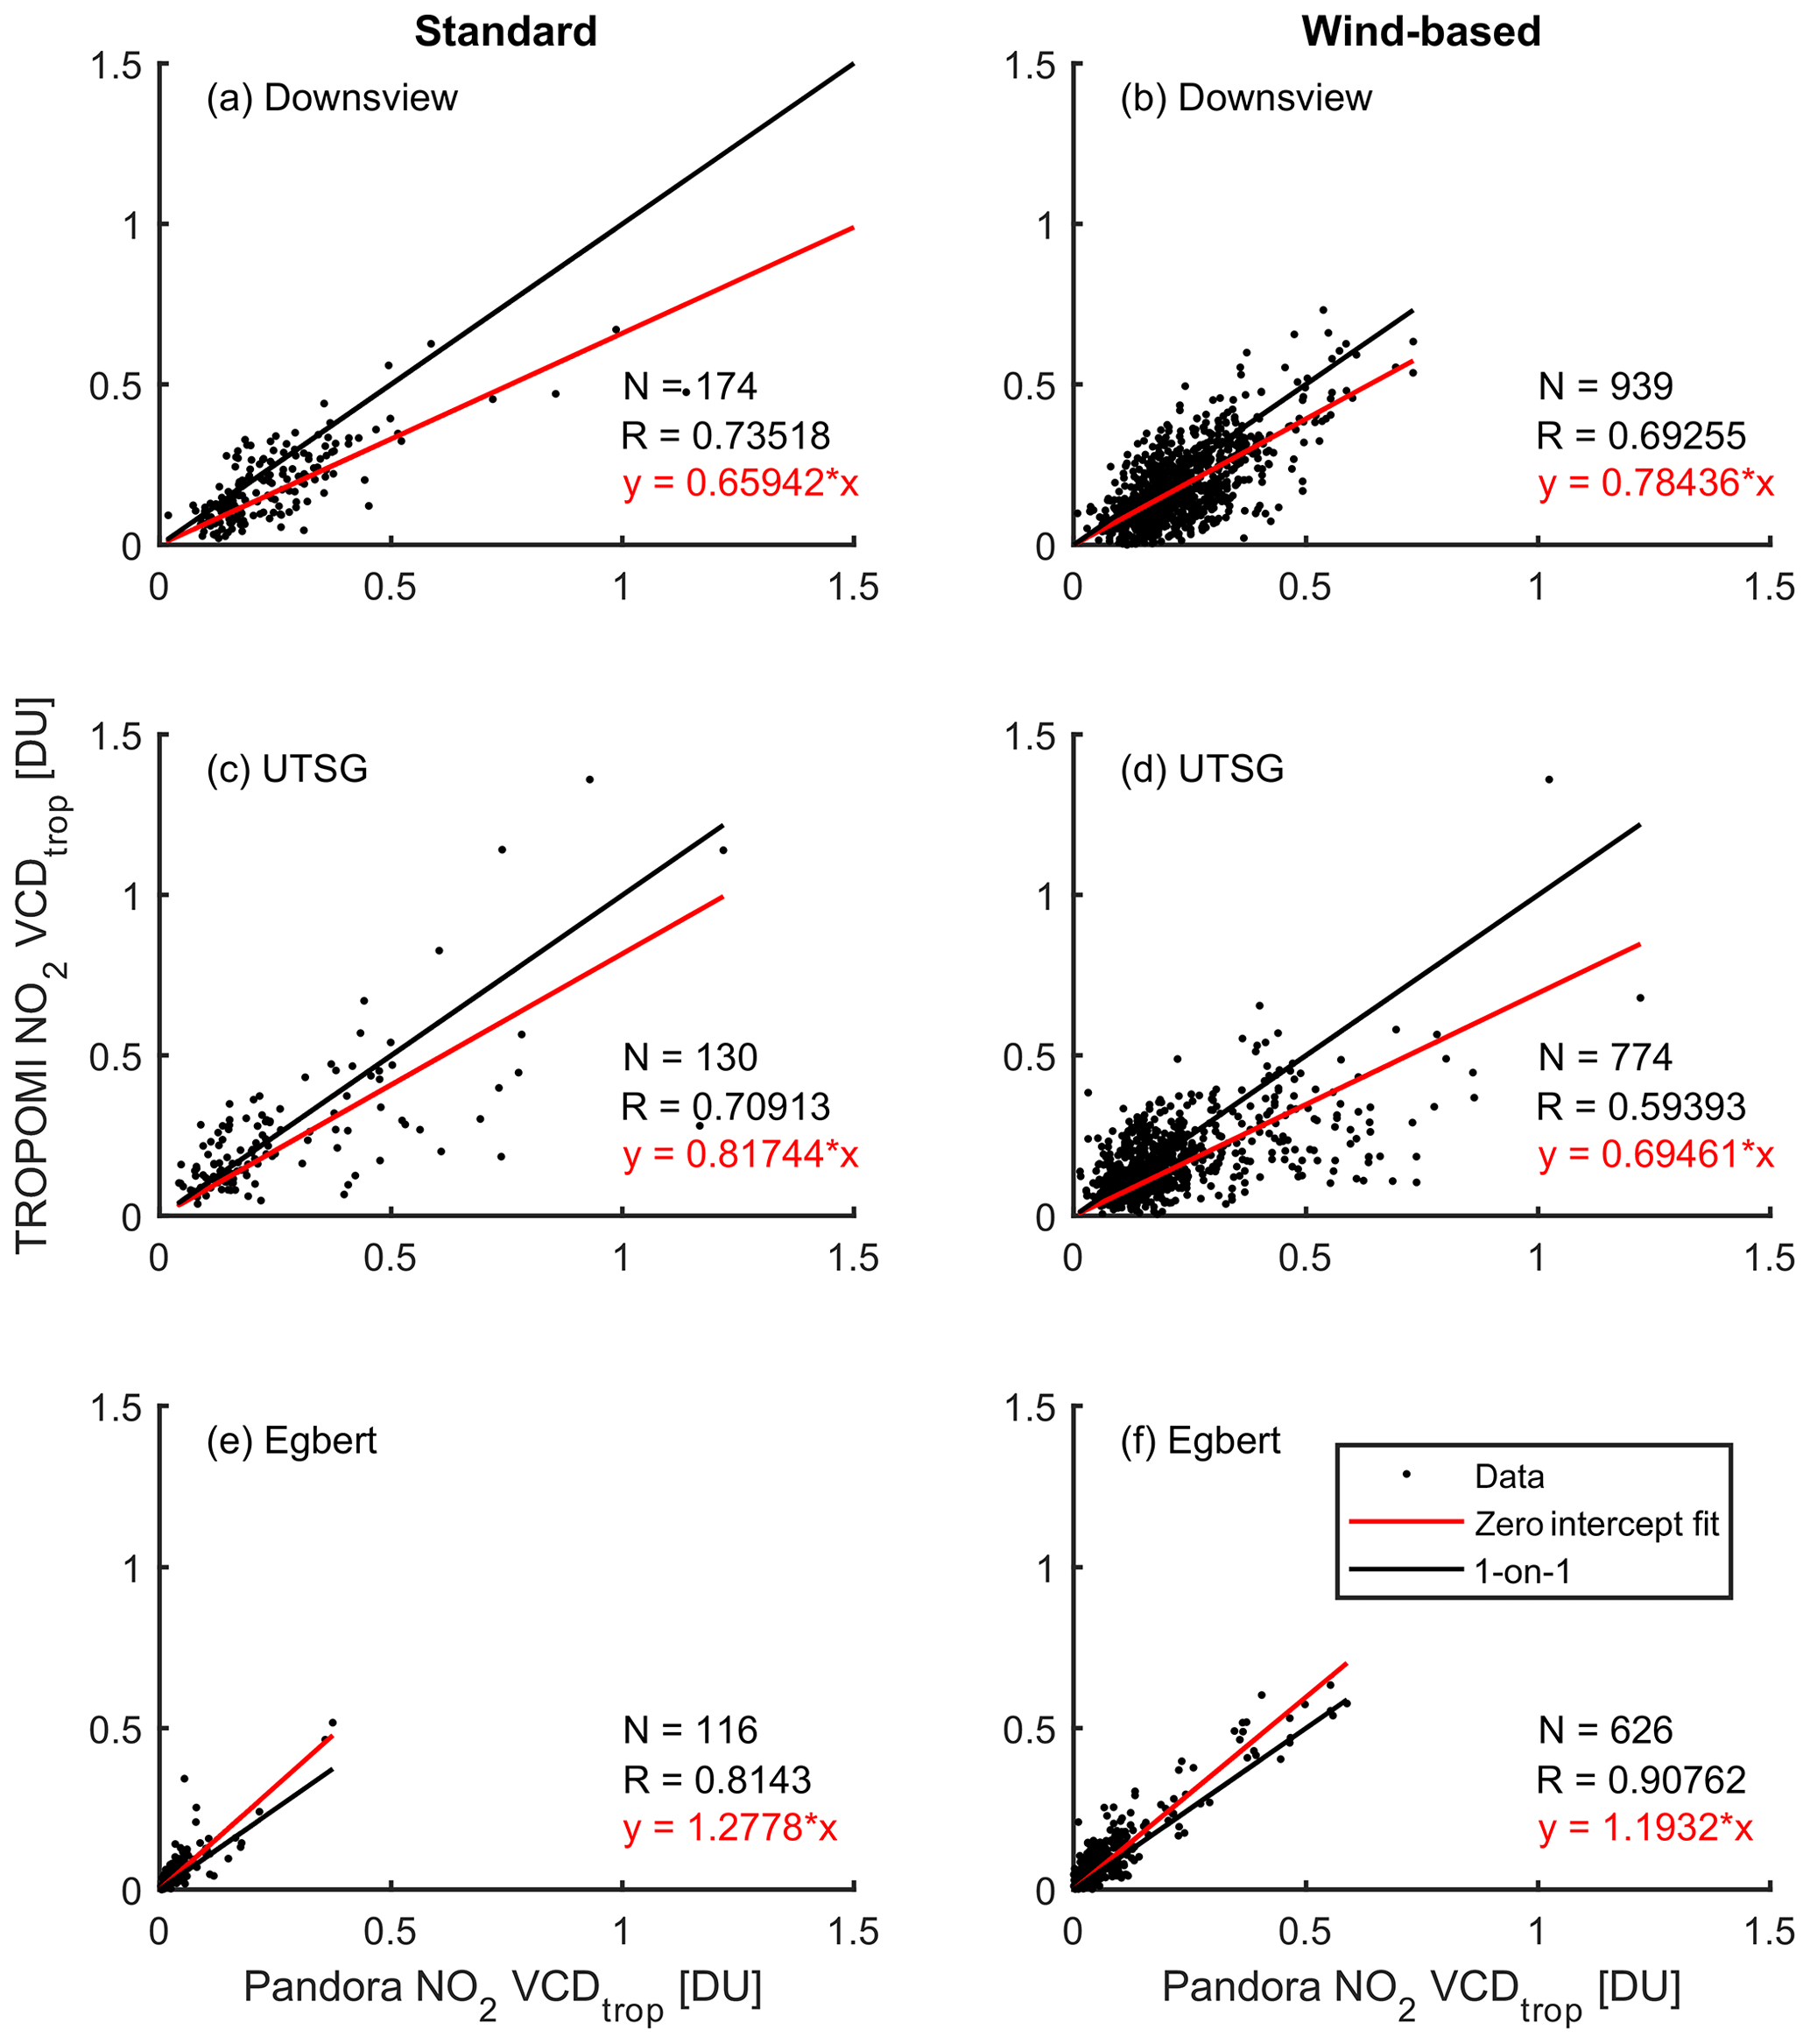
Figure 5TROPOMI (ECCC) vs. Pandora NO2 VCDtotal measured at Downsview, UTSG, and Egbert, using the standard (a, c, e) and wind-based (b, d, f) methods. In each scatter plot, the red line is the linear fit with the intercept set to 0, and the black line is the one-to-one line.
4.2 ECCC products
The ECCC TROPOMI NO2 data product was also compared to the Pandora measurements. The results from the three sites are shown in Fig. 5. A clear difference between the KNMI version and the ECCC version of TROPOMI data is the multiplicative bias. In general, ECCC data, which are based on a model with much higher spatial resolution, show a positive shift of the fitted slopes for all three sites by roughly 5 % to 15 %. For Downsview, ECCC data decreased the multiplicative bias between satellite and Pandora data from 24 %–28 % to 15 %–24 %. For UTSG, similar improvement was found as the multiplicative bias decreased from 24 %–28 % to 13 %–20 %. However, for the clean background (rural) site in Egbert, ECCC data increased the multiplicative bias from 4 %–10 % to 14 %–15 %. Thus, the results show that ECCC data have a positive shift in the total column values compared to KNMI data when compared to Pandora measurements. The ECCC NO2 product has a better representation of the albedo for snow-covered areas (Griffin et al., 2019). However, for this period of measurements, the snow-covered satellite ground pixels are too sparse. Future studies will be performed to evaluate the performance of the ECCC data in snow-covered conditions, after accumulating a sufficient number of snow-covered pixels. More comparison results, such as the absolute difference and relative difference between TROPOMI ECCC data and Pandora data, are shown in Appendix A. In general, TROPOMI ECCC data have smaller absolute and relative differences (compared with Pandora data) at Downsview and Egbert but slightly larger differences at UTSG.
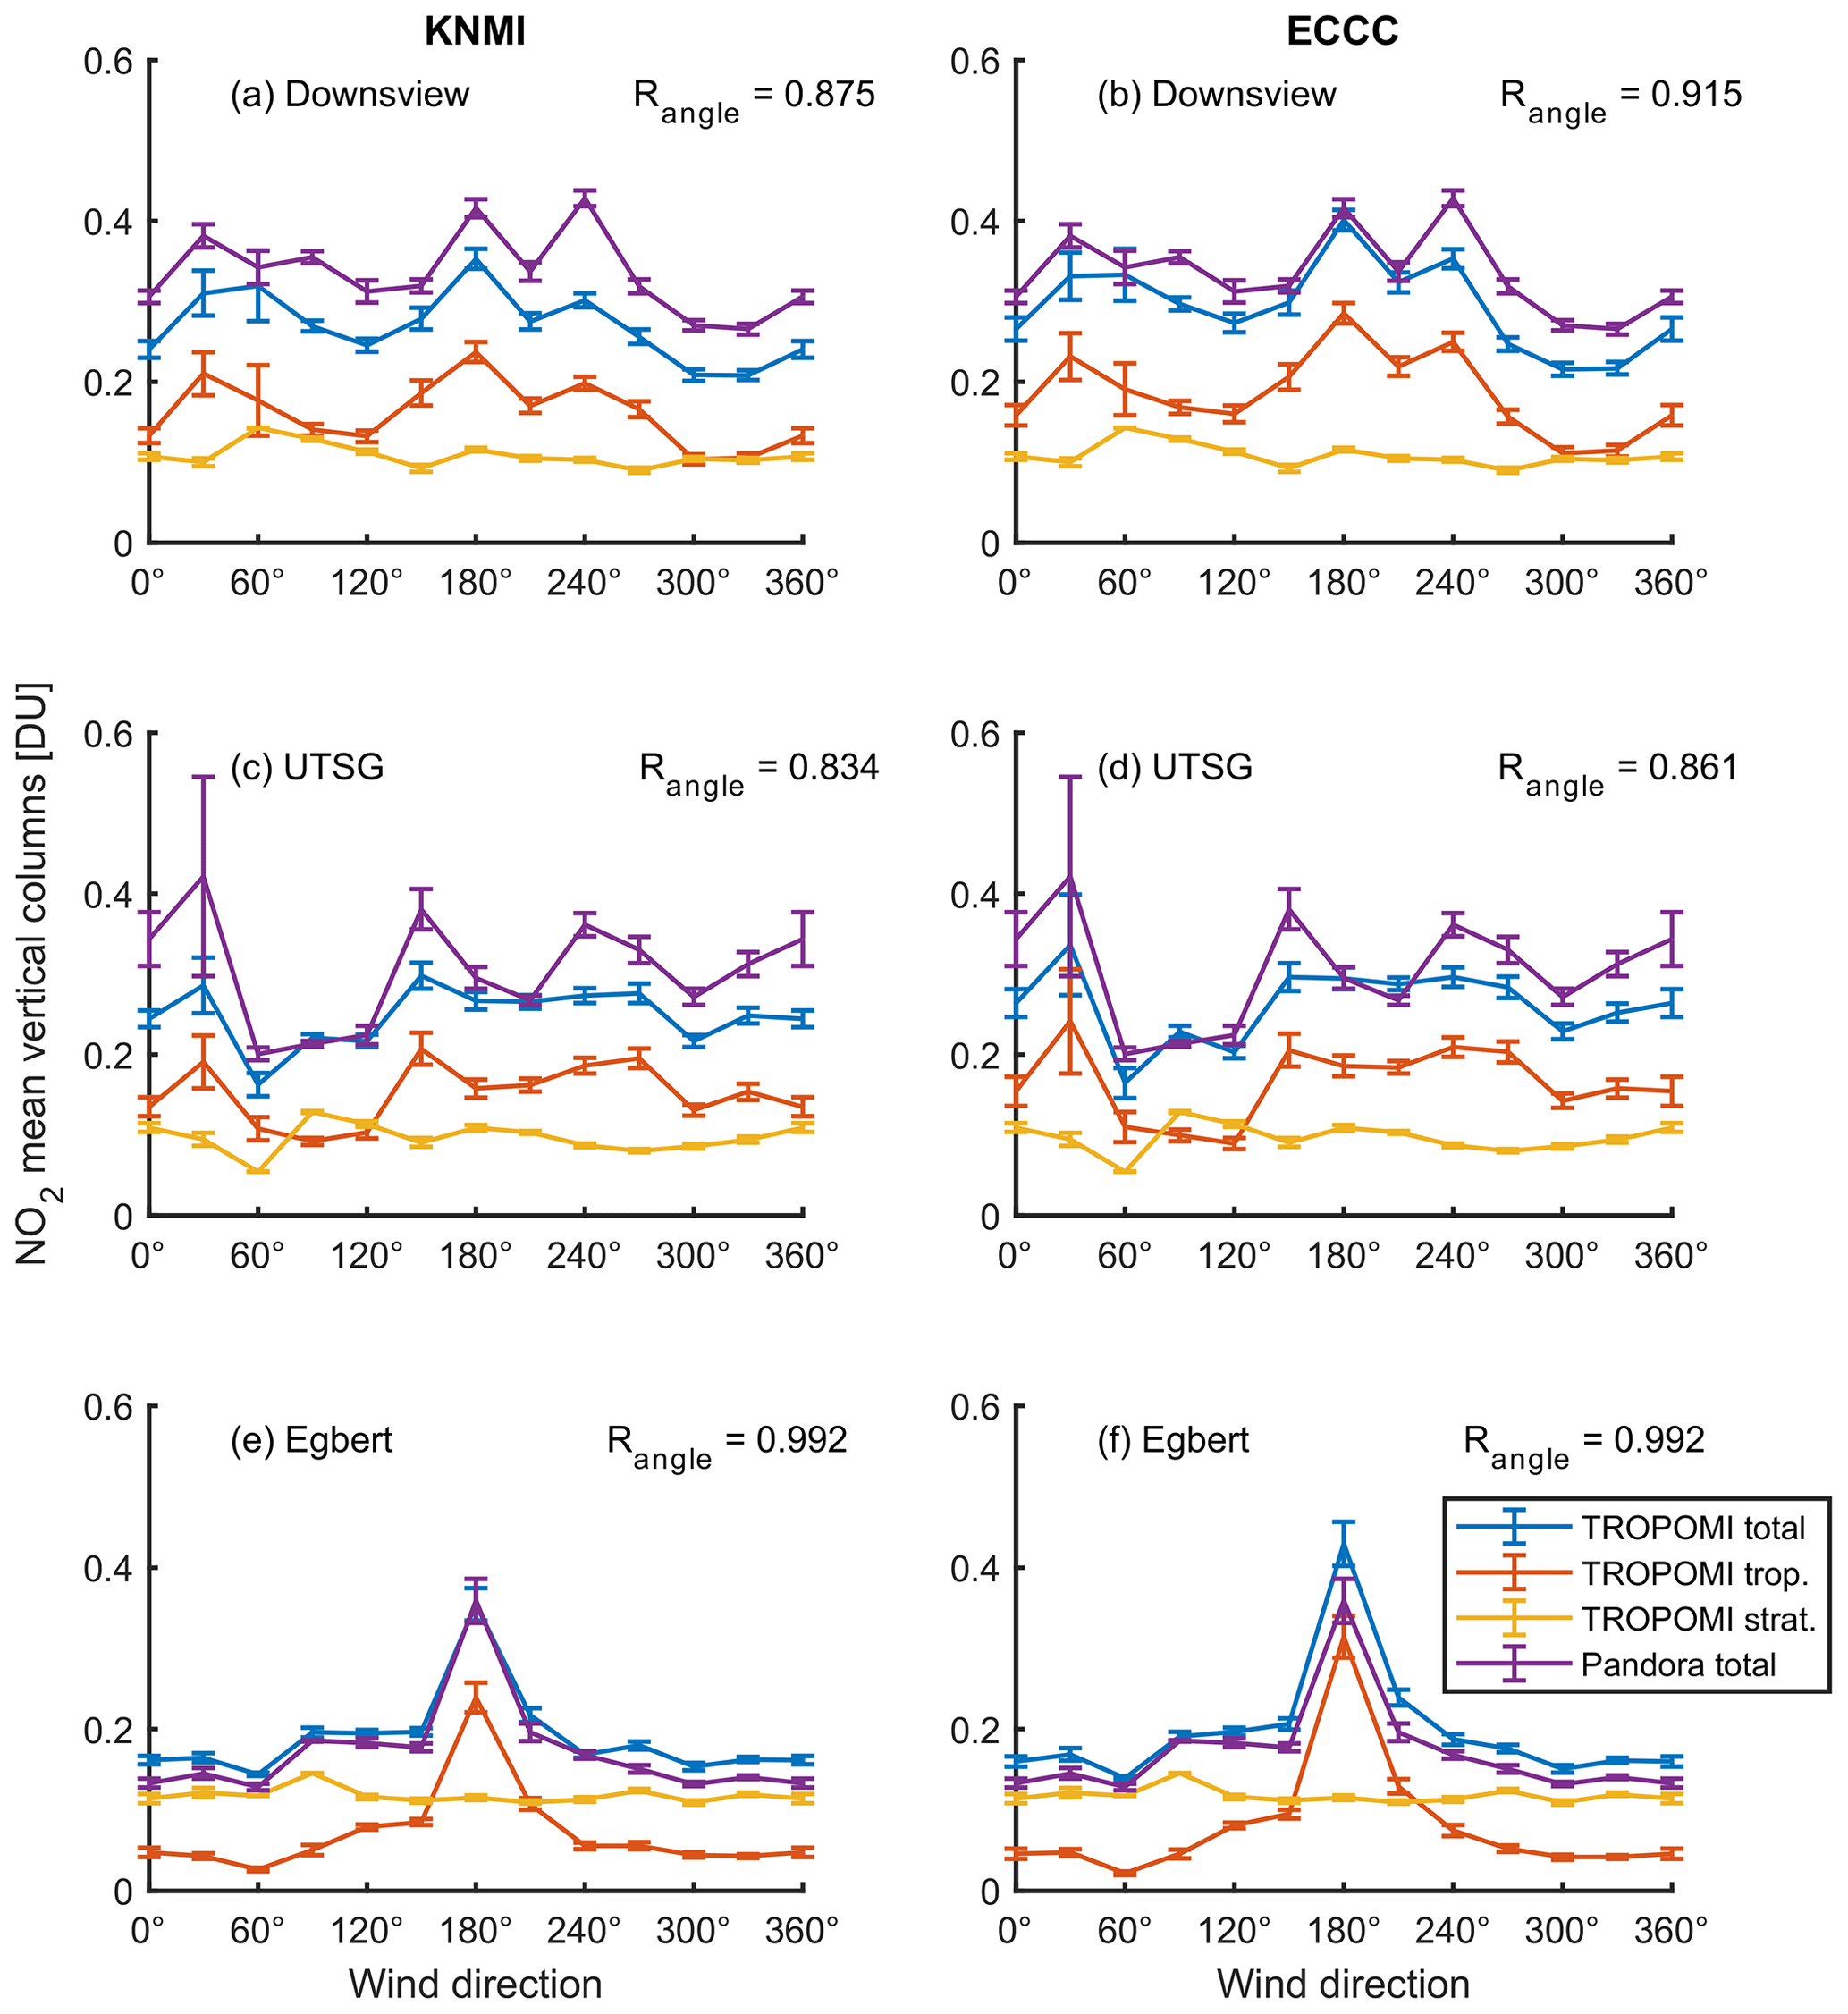
Figure 6TROPOMI and Pandora coincident measurements from three sites, binned by wind direction. TROPOMI data in (a), (c), and (e) are KNMI products; (b), (d), and (f) are ECCC products. Blue, red, and yellow lines are TROPOMI total, tropospheric, and stratospheric columns, respectively. Purple lines are Pandora total columns. Error bars are the standard error of the mean. The correlation coefficient between TROPOMI (blue line) and Pandora total column NO2 (purple line) is shown in each panel.
5.1 NO2 spatial distribution and transport patterns
One motivation to increase the number of coincident measurements is to study NO2 spatial distribution and local air quality conditions. In Fig. 6, the coincident TROPOMI and Pandora data are grouped by wind direction, and the mean values of each group are shown as a function of wind direction. For example, Fig. 6a shows the NO2 results from the Downsview site; the purple line with error bars is Pandora no. 104 total columns, the blue line is TROPOMI KNMI total columns, and the red and yellow lines are the TROPOMI tropospheric and stratospheric components. Although there is a clear offset between the purple and blue lines, indicating an offset between TROPOMI and Pandora NO2 total columns, the general pattern between two datasets is similar. Figure 6a reveals several peaks in the mean NO2 total columns at Downsview, such as at wind directions 180 and 240∘, which correspond to the directions from downtown Toronto and the major city airport (Toronto Pearson International Airport, referred to here as YYZ by its airport code, the largest and busiest airport in Canada; in the city of Mississauga, 0.72 million population), respectively. In addition, high Pandora NO2 values for the wind direction of 240∘ may be related to vehicle emissions from a busy local street located about 100 m from the site. Meanwhile, low mean NO2 values are found in the 270–360∘ range, which corresponds to the direction of suburban Downsview, a relatively clean area (in the northern part of the city of Toronto). Here we define the clean wind direction by using TROPOMI stratospheric and tropospheric NO2. For a given site, any direction that has TROPOMI VCDtrop≤ VCDstrat is considered a clean wind direction. In general, for clean wind directions, the mean difference between TROPOMI and Pandora total columns is within ±0.05 DU and the mean relative differences are typically within ±20 %. Here, the mean relative difference is defined as
where N is the number of measurements. We select M1 to be TROPOMI measurements and M2 to be Pandora measurements. Figure 6b shows the results from TROPOMI ECCC data. It is clear that the offset between TROPOMI ECCC data and Pandora data has decreased for most polluted wind directions.
The results for the UTSG and Egbert sites are shown in Fig. 6c to f. For Egbert, almost all wind directions are considered clean air directions, except for 180∘. These results highlight that, compared to the GTA, other nearby small cities, such as Barrie (see Fig. 1, 0.14 million population; 15 km away from Egbert, within the 30∘ wind direction bin), are not significant NO2 sources to Egbert. The UTSG site experiences relatively clean air from 60 to 120∘. The major NO2 peak at 150∘ is linked to the direction from the city's central business district (2 km away from the measurement site). The second peak at 240 to 270∘ is likely linked to the direction of a large diesel train yard for the local train service and the YYZ airport (18 km away from the measurement site).
The similarity of the NO2 horizontal distribution patterns observed by TROPOMI and Pandora is also evaluated. The correlation coefficients between TROPOMI (blue lines) and Pandora (purple lines) angular total column NO2 data (as a function of wind direction) are shown in Fig. 6, referred to here as Rangle. In general, the patterns show high similarity between satellite and ground-based results, with Rangle larger than 0.8 for all three sites, and TROPOMI ECCC data have equal or higher correlation coefficients with Pandora data compared to TROPOMI KNMI data.
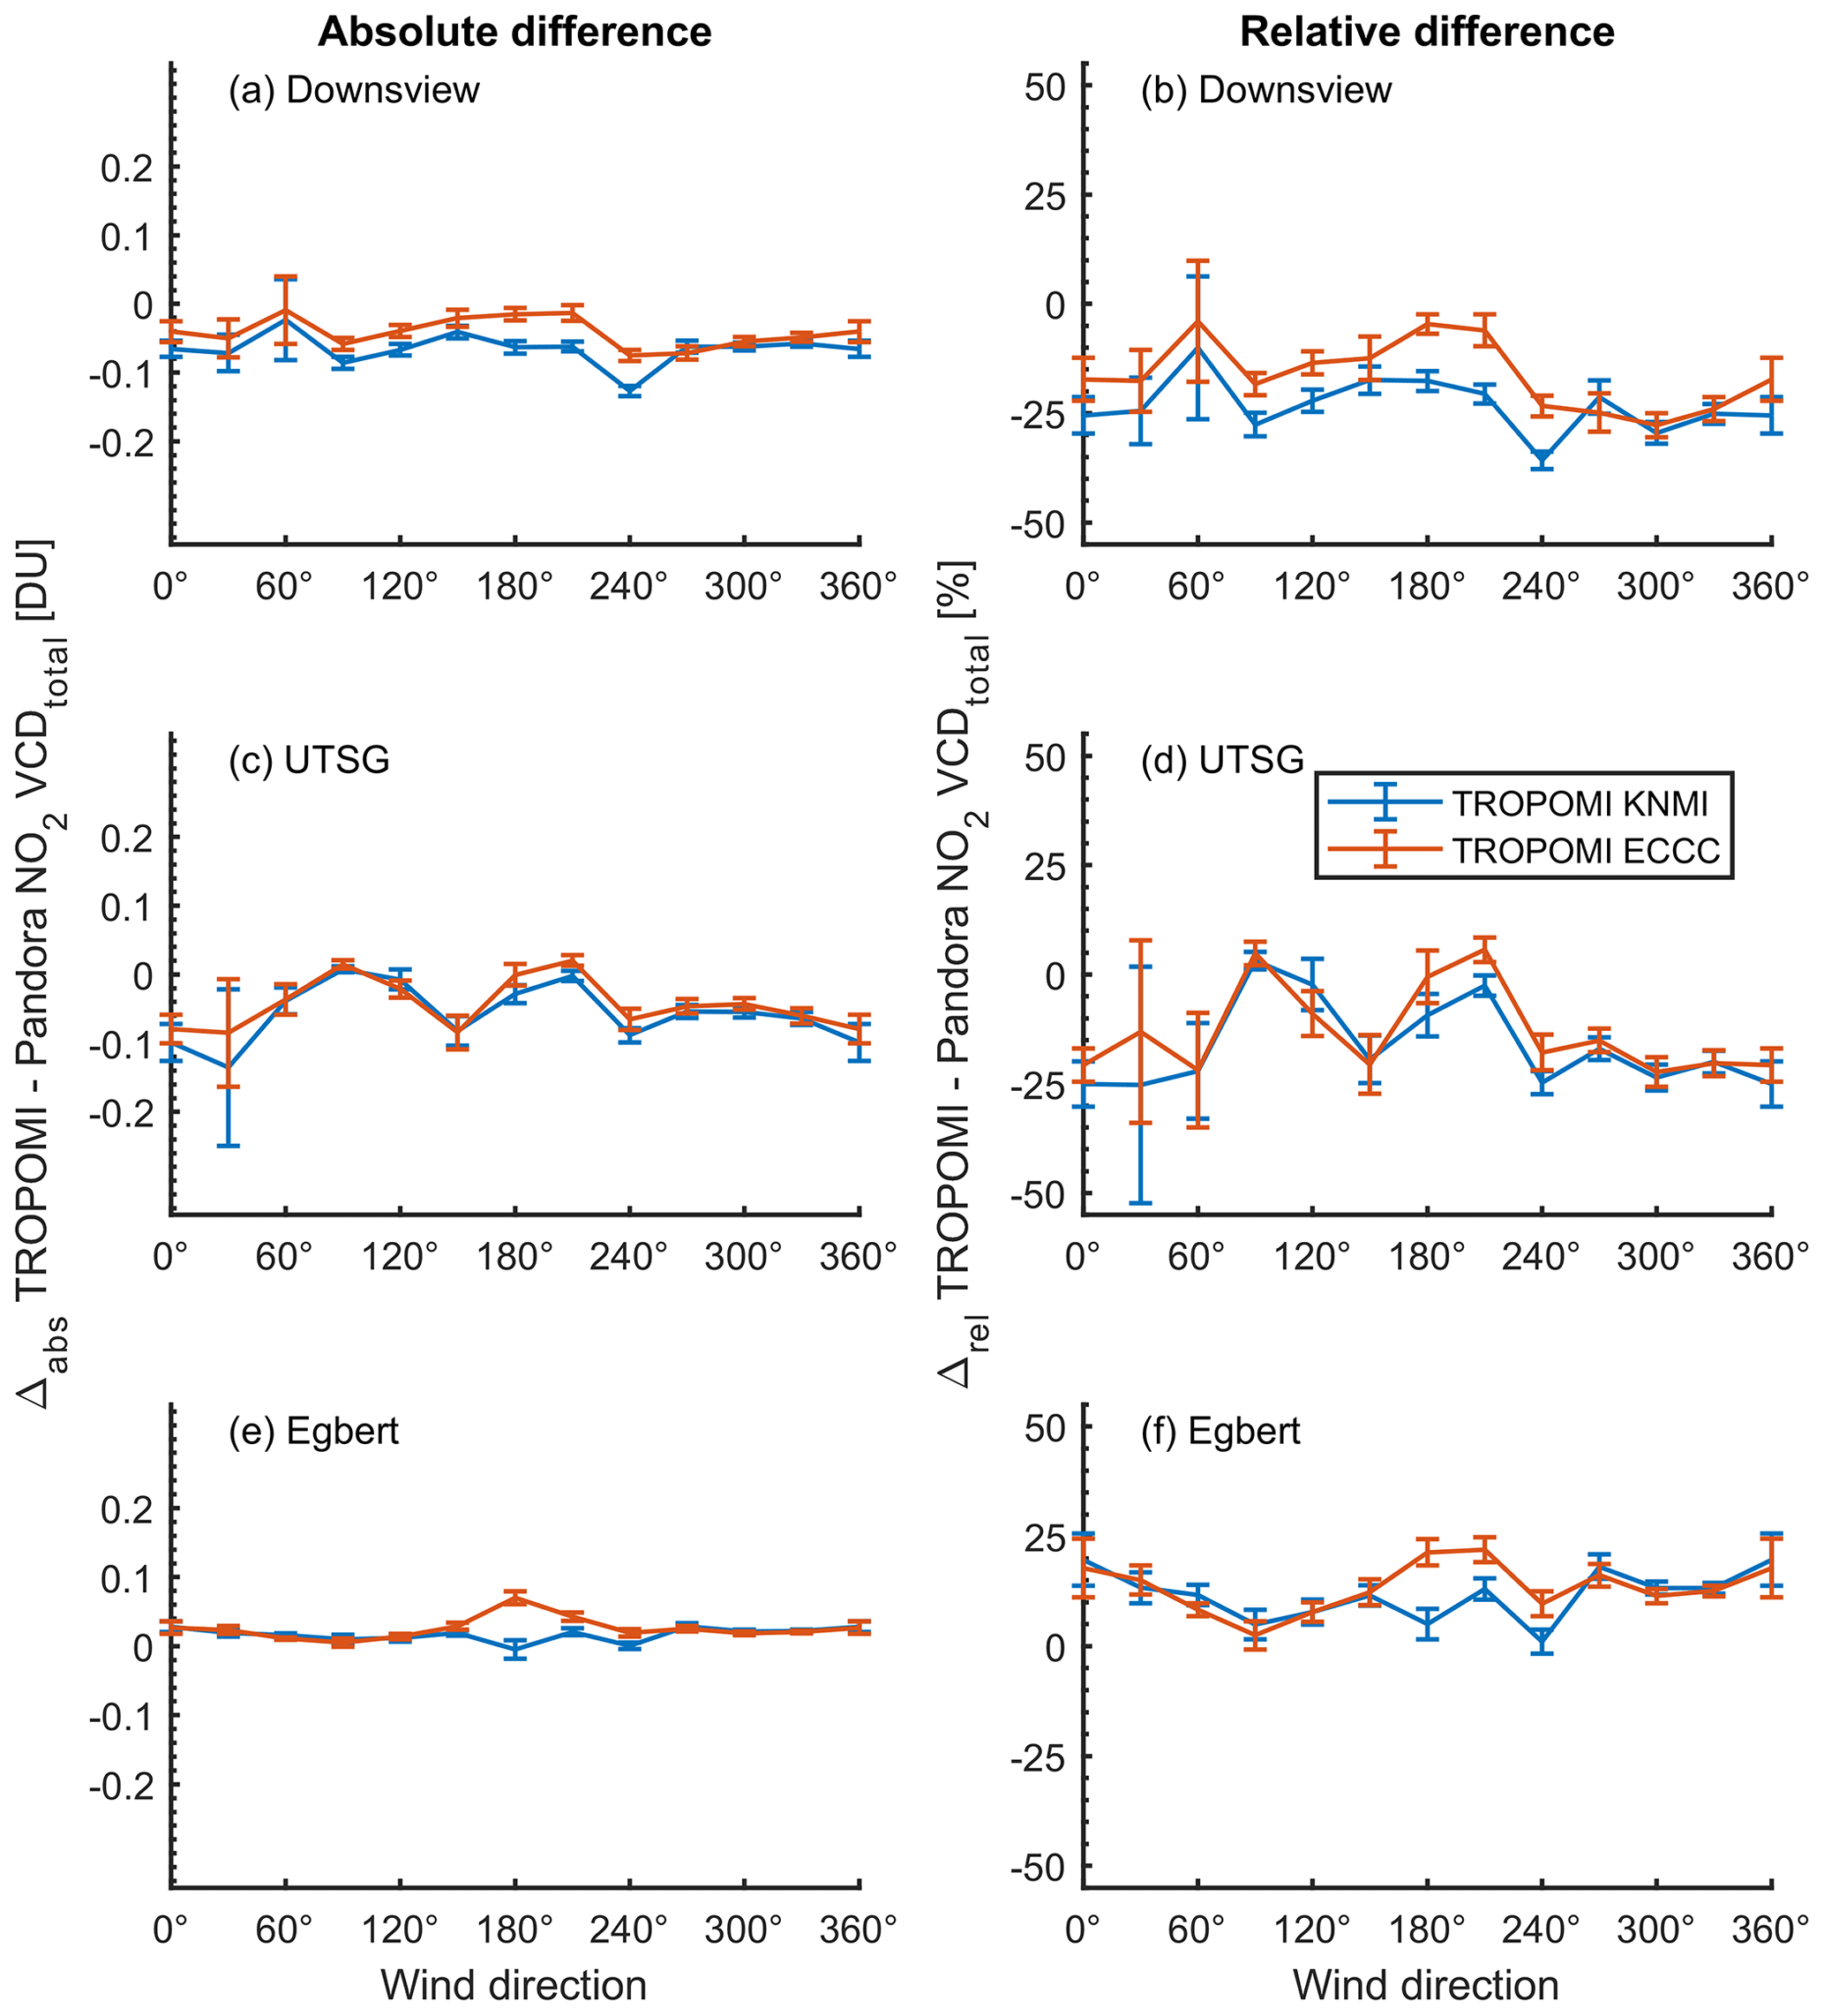
Figure 7The absolute and relative differences between TROPOMI and Pandora coincident measurements from three sites, binned by wind direction. TROPOMI and Pandora absolute differences are shown in (a), (c), and (e); their relative differences are shown in (b), (d), and (f). Blue lines are differences calculated using TROPOMI KNMI data products, and red lines are their counterparts using ECCC data products. Error bars are the standard error of the mean.
To further evaluate the agreement between sets of coincident measurements, the mean difference and mean relative difference between satellite and ground-based results are shown in Fig. 7. The mean differences between TROPOMI and Pandora are within ±0.1 DU, except for Downsview data from the 240∘ wind direction. For Downsview, the highest relative difference is found to be −36 % for the 240∘ wind direction. Similarly, the largest discrepancies between Pandora and TROPOMI at Egbert and UTSG are found at the wind directions with the highest NO2 values, such as 240∘ for UTSG and 180∘ for Egbert. For the clean air direction, such as 270–360∘ for Downsview, the mean relative differences are typically within ±30 %. TROPOMI ECCC data performed better for the Downsview and UTSG sites, whereas TROPOMI KNMI data performed slightly better for the Egbert site.
The discrepancies between TROPOMI and Pandora mean differences also indicate the types of NO2 sources. A NO2 peak value is more likely from a regionally transported NO2 source (e.g., a few ground pixels away) if the mean difference between Pandora and TROPOMI is small (i.e., both Pandora and TROPOMI measured the peak). If the mean difference is large (i.e., Pandora measured the peak, whereas TROPOMI did not), then the measured NO2 peak is likely from a localized source (e.g., within or around one ground pixel). For example, in Fig. 7a for Downsview, the 180∘ peak shows −0.06 DU mean difference, whereas the 240∘ peak shows −0.13 DU mean difference. Thus, the 240∘ peak is more influenced by some near-local NO2 source (e.g., nearby heavy traffic roads). Similarly, in Fig. 6b at Egbert, the 180∘ peak shows only −0.005 DU mean difference. Thus this peak is more weighted by a far-transported NO2 source. In general, this NO2 distribution study shows that combining Pandora and satellite measurements can be a powerful tool to study local or regional air quality.
The number of coincident pairs and the number of unique days for each wind bin are shown in Fig. A1. In general, due to the uneven distribution of wind direction, some binned wind directions have a limited number of coincident pairs between TROPOMI and Pandora, e.g., 60∘. Thus, the interpretation of results from these bins is difficult. However, for other bins, such as the 180∘ bin for Egbert, there are 46 coincident measurements from 7 d. Thus, we can be confident about the sharp peak signal observed in Fig. 6e and f and conclude that for Egbert, the main pollution events are transported from the Toronto area.
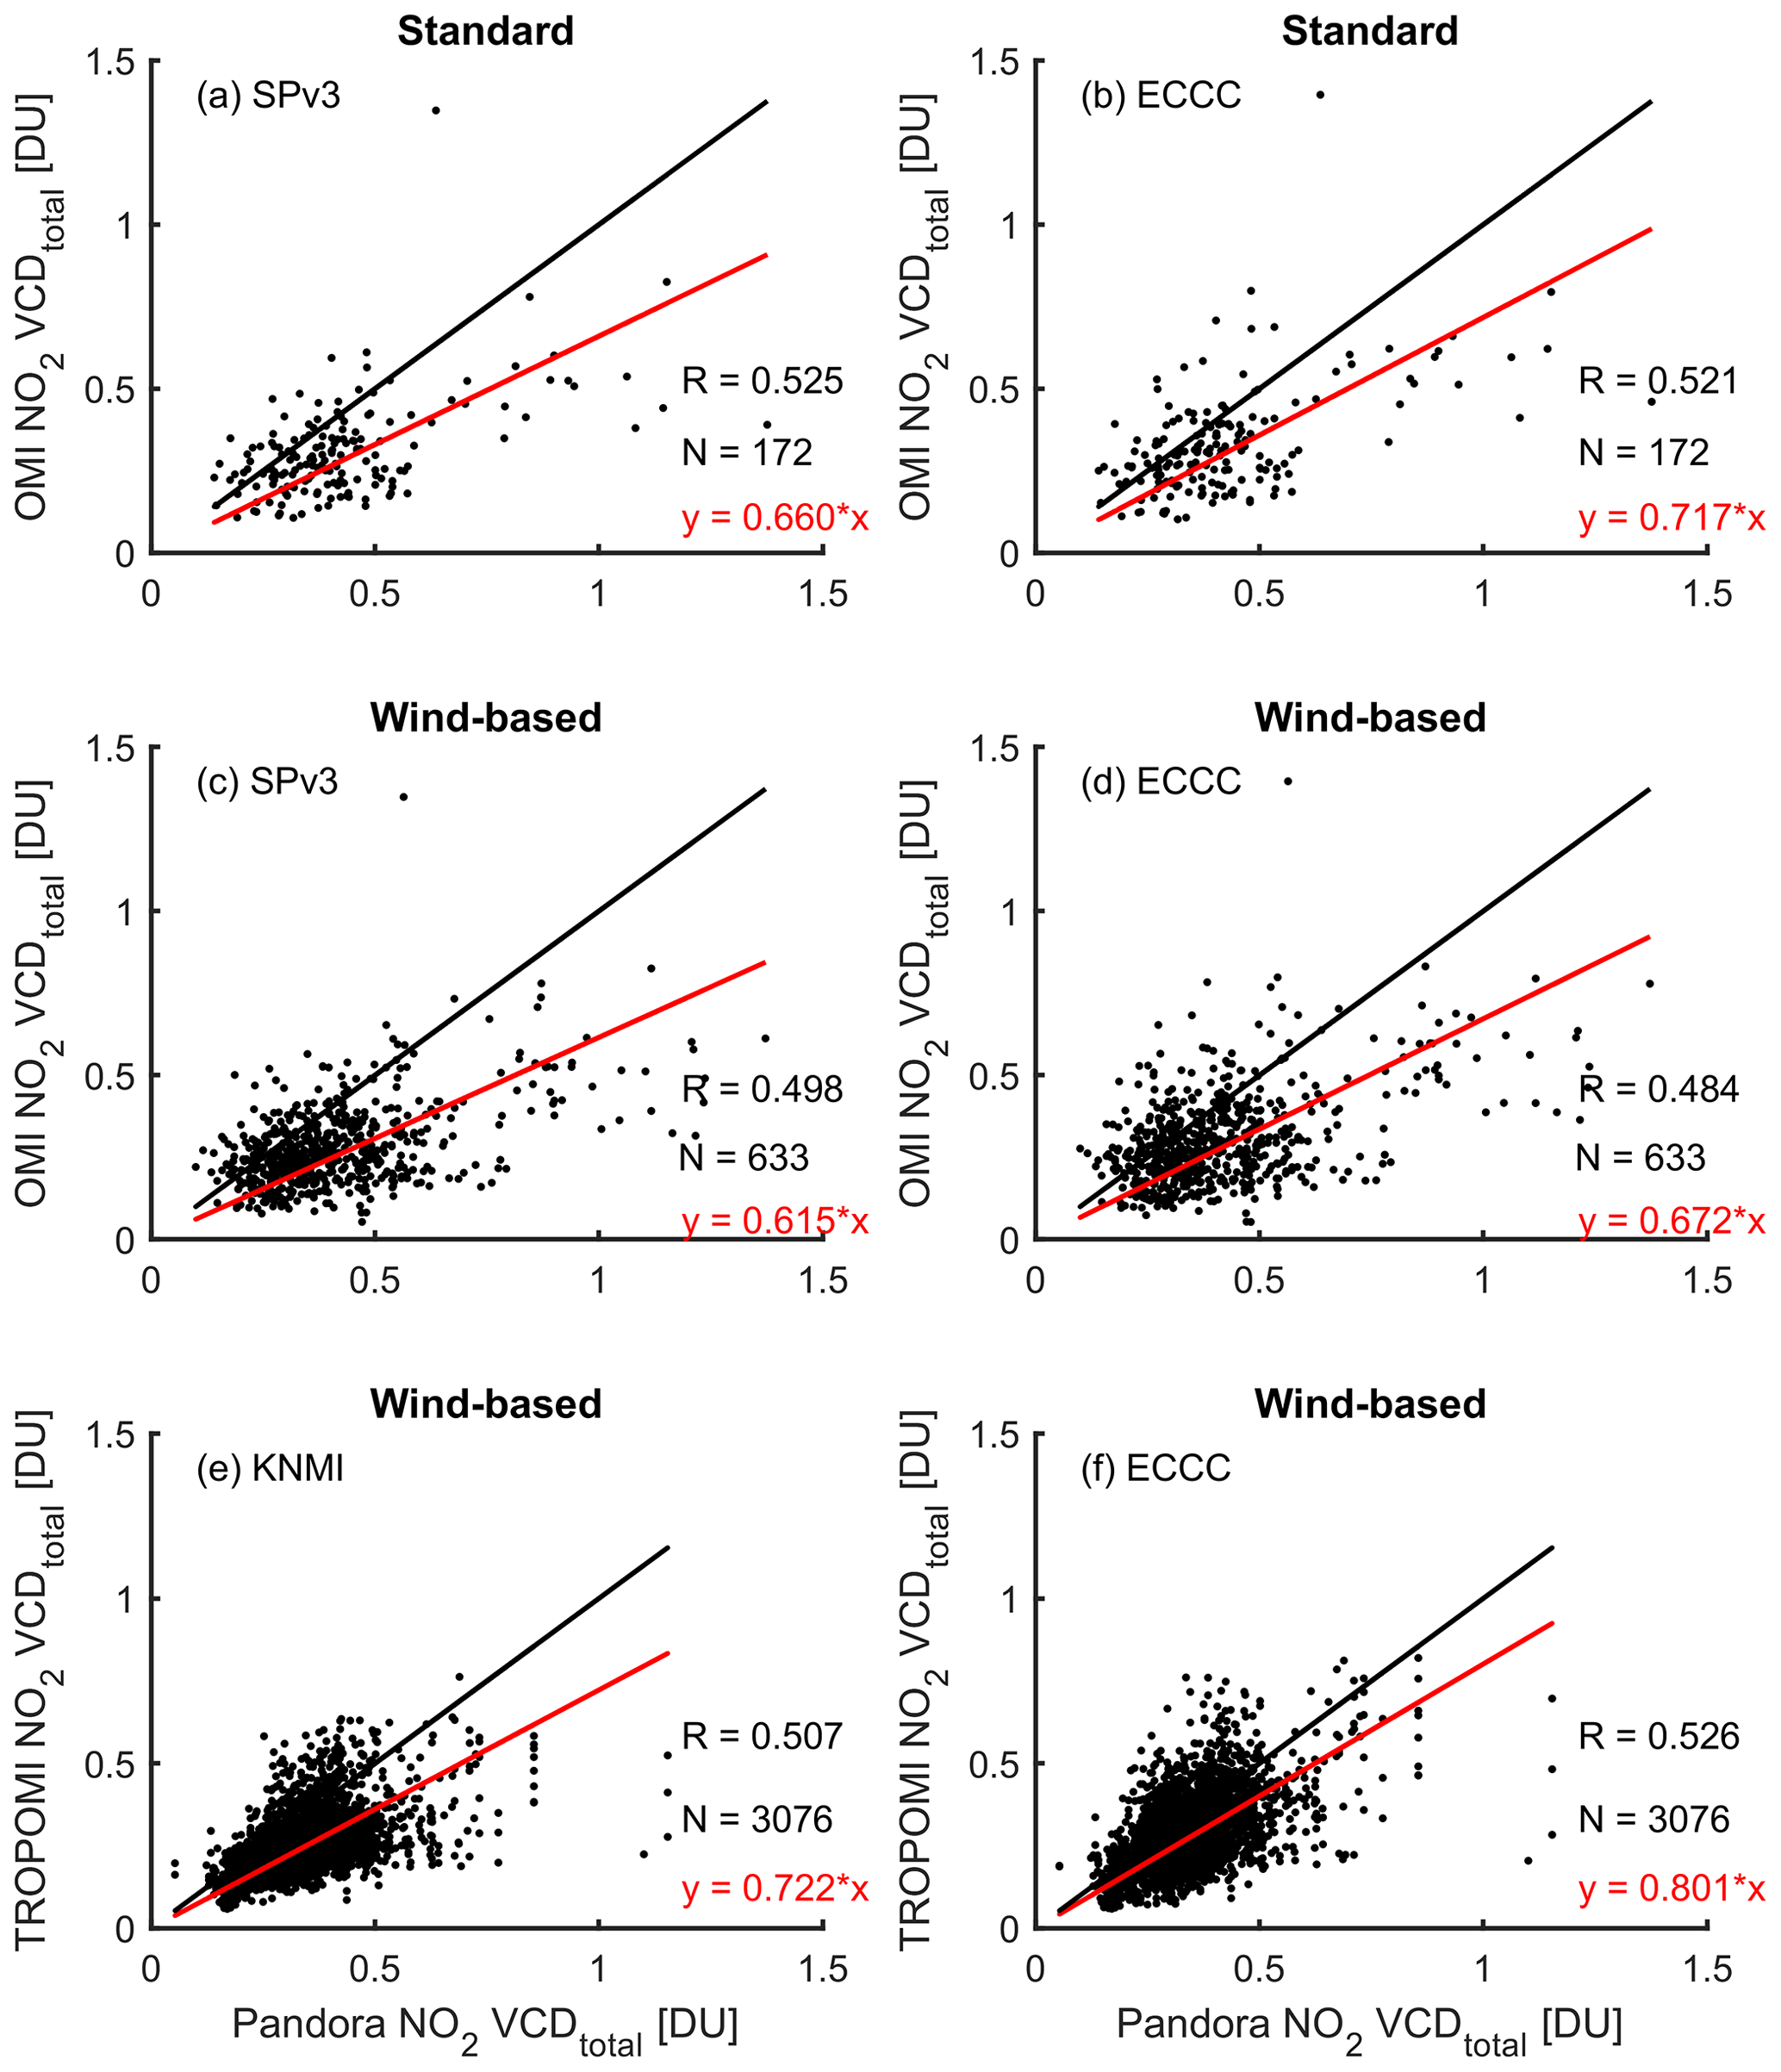
Figure 8OMI and TROPOMI vs. Pandora no. 104 (Downsview) NO2 total columns, using (a, b) the standard coincidence comparison method for OMI SPv3 and OMI ECCC, respectively; (c, d) wind-based method for OMI SPv3 and OMI ECCC, respectively. (e) and (f) are results using the wind-based method for TROPOMI KNMI and ECCC, respectively, with an extended yrotate range. In each scatter plot, the red line is the linear fit with the intercept set to 0, and the black line is the one-to-one line.

Figure 9TROPOMI, OMI, and coincident Pandora measurements from Downsview, binned by wind direction. TROPOMI data in (a) are from KNMI products and in (b) are from ECCC products (2018). OMI data in (c) are from NASA SPv3 products and in (d) are from ECCC products (2015–2018). Blue, red, and yellow lines are TROPOMI or OMI total, tropospheric, and stratospheric columns. Purple lines are Pandora total columns. Error bars are the standard error of the mean.
5.2 Application on a medium-resolution satellite (OMI)
The standard and wind-based methods for determining coincidences were also applied to OMI NO2 observations. In this study, we used OMI and Pandora no. 104 measurements from 2015 to 2018 at Downsview. By extending the observation period by a factor of 4 (i.e., only 1 year of TROPOMI observations were used in Sects. 4 and 5.1, while 4 years of OMI observations were used here), OMI measurements can reveal similar NO2 spatial distributions to those of TROPOMI (i.e., results in Sect. 5.1).
Figure 9a to d show the results of applying the standard and wind-based methods to OMI data. Figure 9a and b show the results using the standard method and the OMI SPv3 NO2 and OMI ECCC NO2 data products (see Sect. 2.2), respectively. The general performances of OMI SPv3 and OMI ECCC data are similar, and OMI ECCC data have a slightly lower multiplicative bias (28 %) than OMI SPv3 (34 %). Due to the lower spatial resolution of OMI, we modified the coincident criteria used above for TROPOMI. For the wind-based method, the ρ value criterion was changed from 5 to 20 km, and ttravel was changed from 1 to 3 h, compared to the criteria used for TROPOMI (see Sect. 3.3). The correlations of OMI and Pandora total columns are smaller than those found in Sect. 4 (using TROPOMI and the ERA-5 wind field). To make the comparison between OMI and TROPOMI consistent, these modified wind-based criteria (ρ and ttravel value) are also applied to TROPOMI data (see Fig. 8e). Similarly to other studies (e.g., Eskes and Eichmann, 2019), OMI data show a larger multiplicative bias relative to Pandora than TROPOMI. Although TROPOMI data used in this work only cover 1 year and OMI data cover 4 years, TROPOMI data have about 5 times the number of coincident measurements compared to OMI data (see Fig. 9c and e). In general, the proposed wind-based method is more powerful for high-spatial-resolution satellite instruments than medium-resolution instruments. The same tests were performed on the OMI ECCC data products, as shown in Fig. 9b, d, and f. Similarly to the results in Sect. 4, OMI ECCC and TROPOMI ECCC data have lower multiplicative biases relative to Pandora NO2 total columns than do OMI SPv3 or TROPOMI KNMI data.
Another motivation for applying the wind-based method to OMI is to assess whether the spatial distribution of NO2 in this area (Downsview) has had any significant changes over this 4-year period. Binning the data by wind direction (see Fig. 9) shows that the NO2 spatial distribution patterns revealed by OMI and TROPOMI are similar; i.e., the main pollution sources are from the south (from downtown Toronto) and southwest (from the YYZ airport), and clean air from the north (from the suburban area).
For 2018, depending on the wind direction, absolute differences of up to 0.13–0.15 DU can be observed by Pandora and TROPOMI (indicated by Fig. 10b and c). From 2015 to 2018, absolute differences of up to 0.17 DU can be seen for Pandora and 0.12 and 0.13 DU for OMI SPv3.1 and OMI ECCC, respectively (indicated by Fig. 10c and d). In general, OMI data for 2015–2018 and TROPOMI data for 2018 demonstrate a similar dependence on the wind direction.
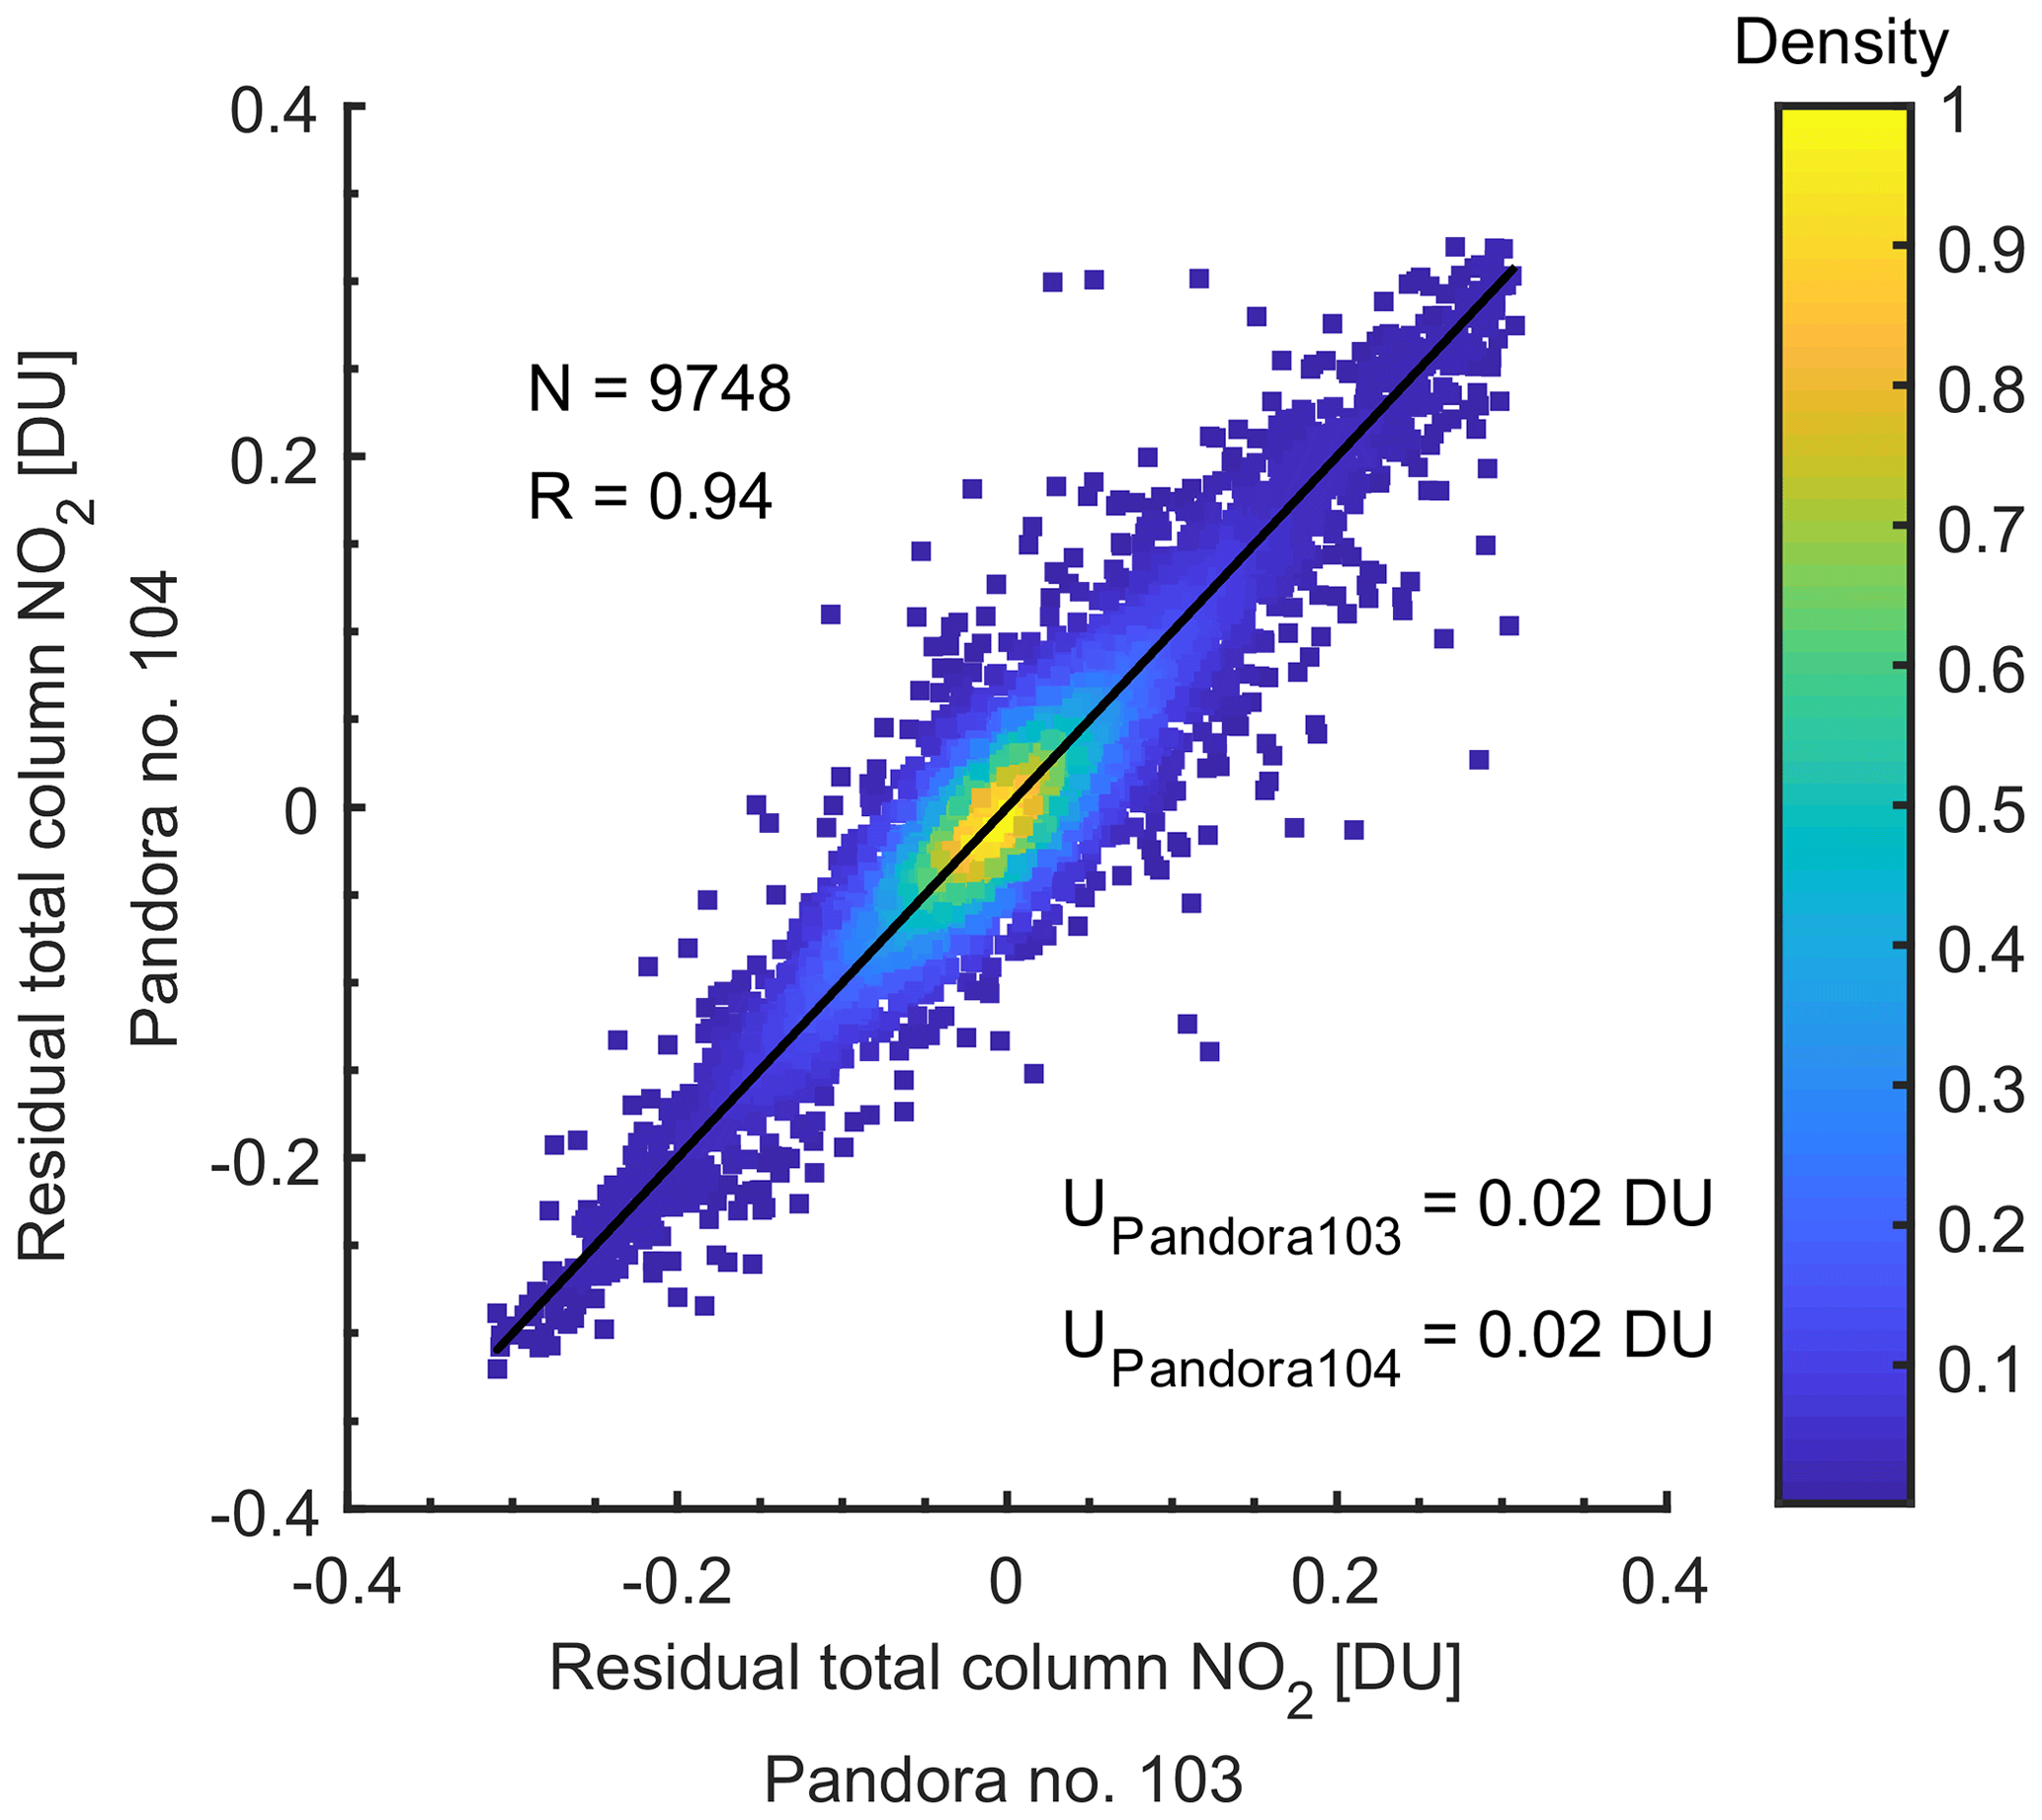
Figure 10Scatter plot of residual total column NO2 measured by Pandora nos. 103 and 104 (December 2017 to June 2019), colour-coded by the normalized density of the points. The black line is the one-to-one line.
5.3 Precision and accuracy
To further assess the quality of TROPOMI KNMI and TROPOMI ECCC NO2 data products and to determine whether they meet the TROPOMI design bias and precision requirements (Eskes and Eichmann, 2019), we performed statistical uncertainty and bias estimations for TROPOMI and Pandora data. In general, by comparing the same quantity retrieved from different remote sensing instruments, we can characterize the differences between them, which are a combination of random uncertainties and systematic bias. Theoretically, information about the random uncertainties can be derived from the measurements (Fioletov et al., 2006; Grubbs, 1948; Toohey and Strong, 2007; Zara et al., 2018; Zhao et al., 2016, 2019a).
As an example, we define the two measured NO2 total column data (denoted as M1 and M2, for Pandora nos. 103 and 104 measurements, respectively) as simple linear functions of the true NO2 total column value (X) and instrument random uncertainties (δ1 and δ2) and assume that there is no multiplicative or additive bias between the two Pandora datasets, giving
Note that these two Pandora instruments are located at the same site, i.e., Downsview. If we assume that the instrument random uncertainties are independent of the measured NO2 total column, the variance of M is the sum of the variances of X (around the mean of the dataset) and δ,
If the difference between two Pandoras does not depend on X (no multiplicative bias) and the random uncertainties of the two instruments are not correlated, then the variance of the difference is equal to the sum of the variance of the random uncertainties,
Then, the variance of the instrument random uncertainties can be solved by
Equation (10) can be used to estimate the standard deviation of instrument random uncertainties ( and ). The variances and can be estimated from the available measurements (with some uncertainty). The uncertainties of the and estimates depend on the sum of all three variances , , and and can be high even if the estimated variance itself is low (but one or more of the variances , , and are high). Thus, the estimates are only as accurate as the least accurate of these parameters. Following the method in Zhao et al. (2016), the variance estimates can be improved by increasing the number of data points or by reducing variance of X by removing some of its natural variability. Thus, the M1 and M2 used in the statistical uncertainty estimation are replaced by so-called residual NO2, which is defined as the difference between the measured NO2 total column and its daily mean. Figure 11 shows the scatter plots for residual NO2 total columns from Pandora nos. 103 and 104. The model-estimated NO2 total column random uncertainties (UPandora103 and UPandora104) for the two instruments are the same, 0.02 DU, indicating the good consistency between the two co-located instruments. Compared to the TROPOMI NO2 total column random uncertainty requirement (0.032 DU; see Table 1), this result shows Pandora instruments have sufficient precision for the TROPOMI NO2 data product validation work.
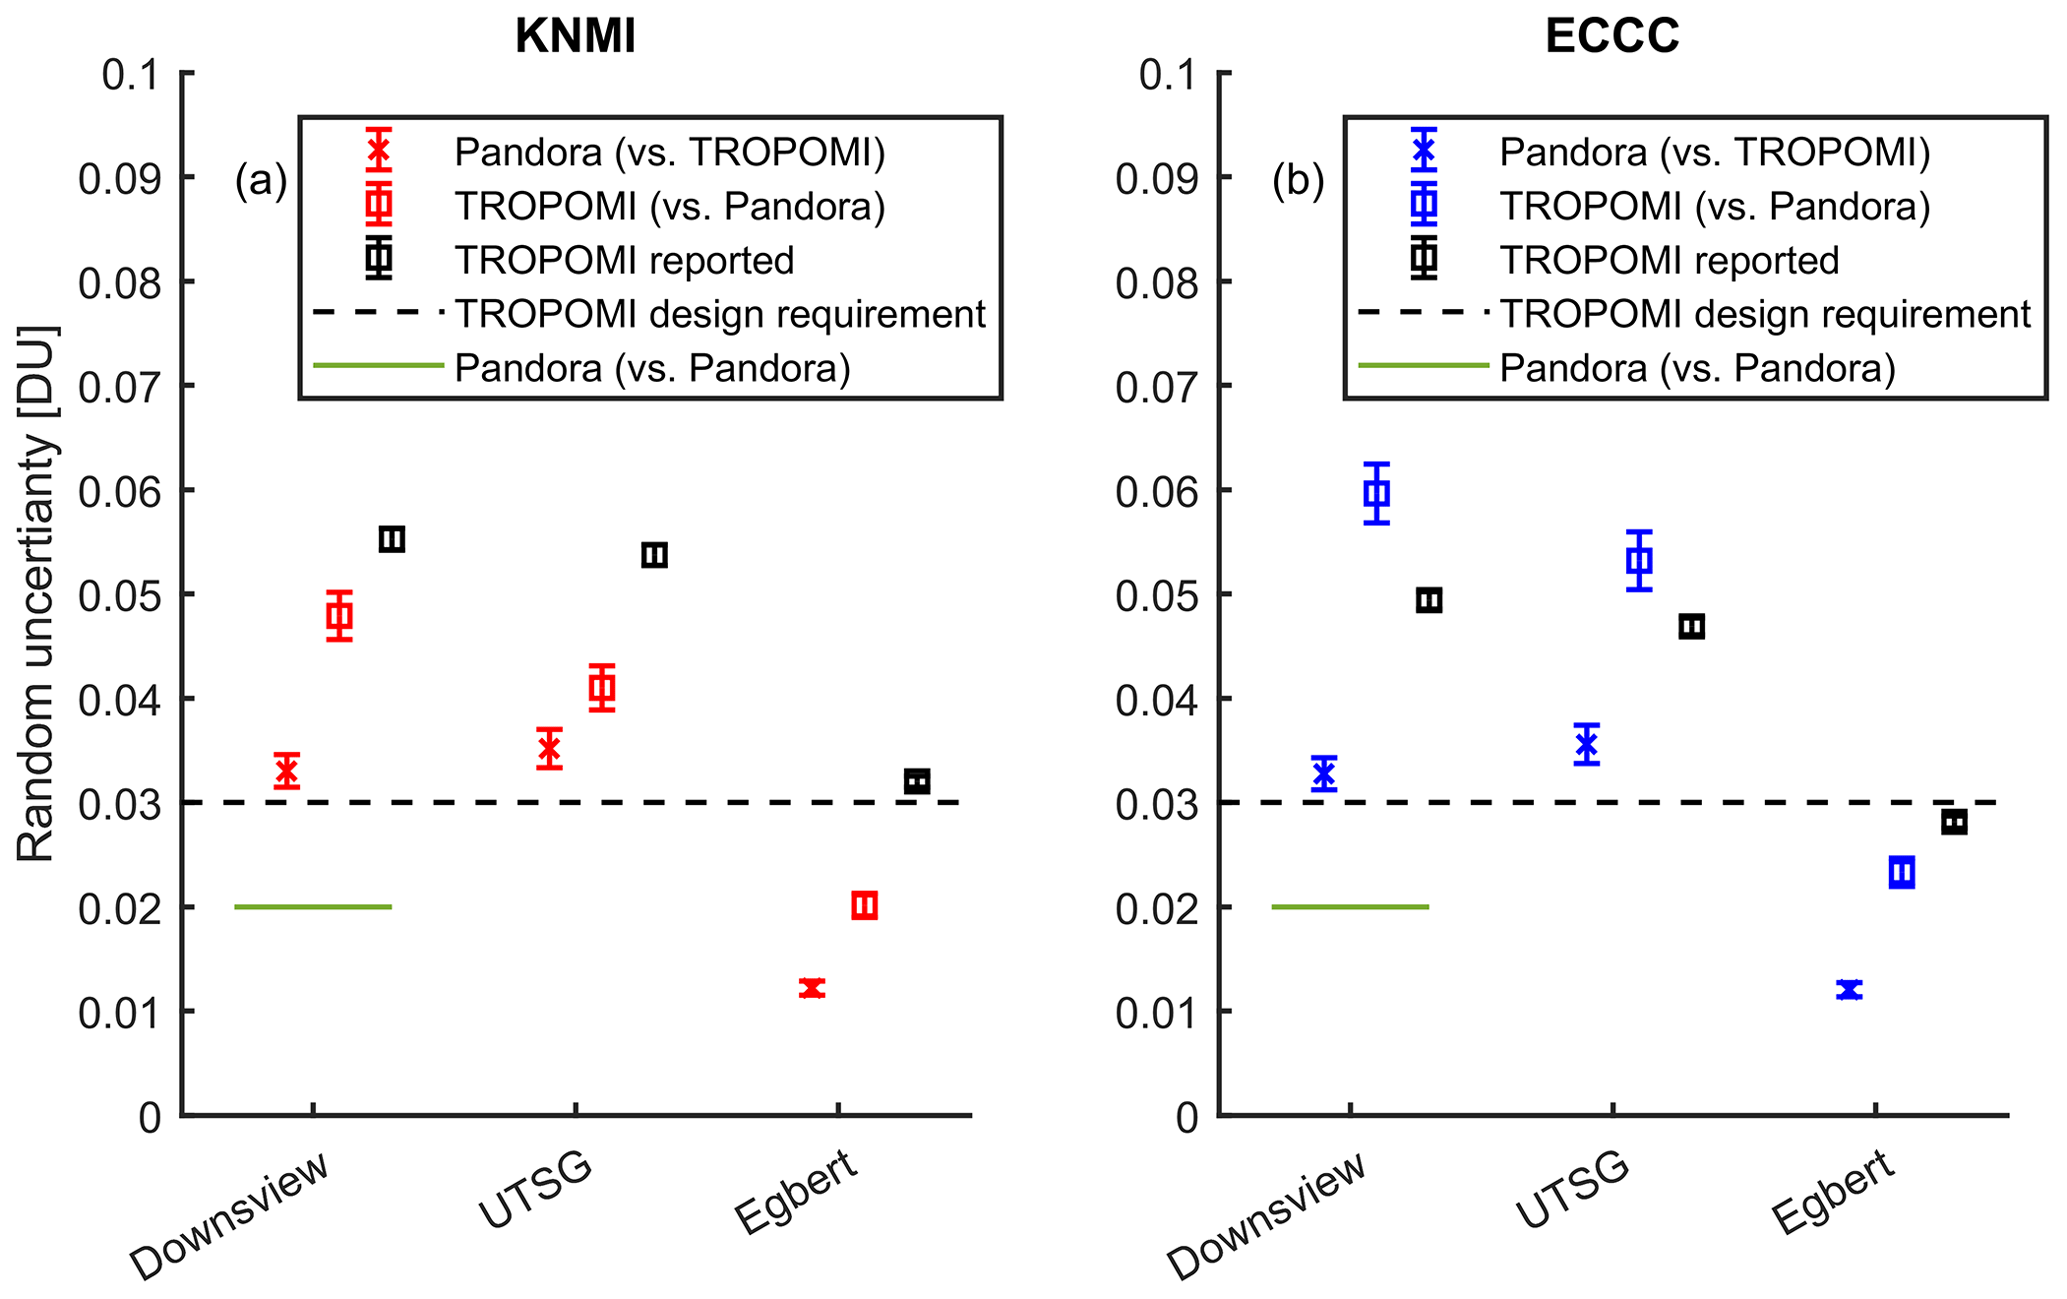
Figure 11Statistical uncertainty estimations for TROPOMI and Pandora total column NO2, using their coincident measurements paired by wind-based methods. (a) TROPOMI KNMI vs. Pandoras at three sites (site names are on the x axis); the estimated statistical random uncertainties are shown in red with estimated errors. Black squares represent the mean of reported uncertainties for TROPOMI KNMI NO2 data, with error bars representing the uncertainty of the mean. (b) TROPOMI ECCC vs. Pandoras at three sites (x axis); the estimated statistical random uncertainties are shown in blue with estimated errors. Black squares represent the mean of reported uncertainties for TROPOMI ECCC NO2 data, with error bars representing the uncertainty of the mean. The black dashed line is the TROPOMI design requirement for precision, while the green line is the Pandora instrument precision estimated independently (statistical estimation using co-located Pandoras at Downsview).
The statistical uncertainty estimation model was also applied to TROPOMI NO2 total column data. Note that the dataset used is the TROPOMI (both KNMI and ECCC products) and Pandora coincident NO2 total column data, paired by the wind-based method. Details of TROPOMI statistical uncertainty calculation are shown in Appendix B. The results are summarized in Fig. 11, which indicate that Pandora NO2 data have lower random uncertainties than TROPOMI NO2 data for all the sites. For example, the first column in Fig. 11a shows that the Pandora NO2 measured at Downsview has 0.03 DU random uncertainty (red cross sign with error bar), which is better than the Pandora total column NO2 nominal accuracy (0.05 DU at 1σ level, e.g., Zhao et al., 2019b). At Downsview, the TROPOMI KNMI and TROPOMI ECCC total column data products have random uncertainties of 0.05 DU (red square with error bar, Fig. 11a) and 0.06 DU (blue square with error bar, Fig. 11b), respectively. The mean of the reported TROPOMI KNMI total column precision is 0.06 DU at this site (black square with error bar, Fig. 11a). The black dashed line shows the TROPOMI total column data product precision requirement. The green dashed line shows the Pandora precision that was estimated using two co-located Pandoras at Downsview (Pandora nos. 103 and 104). Note that the estimates, which use the statistical random uncertainty estimation method, are only as accurate as the least accurate of these two instruments. Thus, the statistical model indicates that Pandora has a 0.03 DU precision when compared with TROPOMI, while Pandora has a 0.02 DU precision when compared with another co-located Pandora. The KNMI-reported precisions show that the satellite data product has better precision at Egbert (0.03 DU) than at Downsview and UTSG. The statistical uncertainty estimation also shows similar results for TROPOMI NO2 total column data (i.e., UDownsview > UUTSG > UEgbert), but about 0.01 DU lower than the reported precisions. The TROPOMI slant column has a reported random uncertainty on the order of about 0.022 DU (Eskes and Eichmann, 2019). The reported random uncertainty for the tropospheric column is then derived by dividing the slant column by the tropospheric AMF. Because the tropospheric AMF at Egbert is larger, the derived vertical column random uncertainty will be smaller. Thus, the changes between the three sites (at least partly) reflect differences in tropospheric AMF at these sites.
In general, this result indicates the good quality of TROPOMI-reported precision. The TROPOMI NO2 total column data products, however, did not meet the design random uncertainty requirement (0.032 DU; see Table 1), except for the clean site (Egbert). On the other hand, although the TROPOMI KNMI data products have higher multiplicative biases than the TROPOMI ECCC data products, their random uncertainties are lower by 0.01 DU at Downsview and UTSG and by 0.003 DU at Egbert (Fig. 11, red squares compared with blue squares). However, this result should be taken with caution since TROPOMI and Pandora do not directly measure the same quantities. Pandora measures NO2 slant columns along the line-of-sight between the instrument and the sun, while TROPOMI measures slant columns from a mixture of scattering optical paths. Then, both are converted into vertical columns. Thus, the statistical uncertainty model-estimated random uncertainties (red and blue symbols in Fig. 11) are upper limits of the TROPOMI total column random uncertainty, since the mismatch of the air masses observed between TROPOMI and Pandora (representativity error) will also produce a random-like signal which adds to the estimate. Moreover, the lower spatial resolution of the parameters used in the KNMI AMF calculations may lead to more uniform retrieved values, i.e., to a lower variability of the retrieved NO2 values and, therefore, lower estimated uncertainties.
Besides precision, the bias of the data is estimated for total column and tropospheric column data products. In Sect. 4, Figs. 4 and 5 show that the TROPOMI KNMI and ECCC total column data have negative multiplicative biases up to 30 % and 25 % (negative relative differences up to 26 % and 19 %; see Appendix A), respectively. These results are slightly better than the finding from the S5P NIDFORVAL (NItrogen Dioxide and FORmaldehyde Validation) project, in which the NO2 total column comparisons with more than 10 Pandora instruments showed TROPOMI has a negative bias (up to 45 % lower) and a lower than expected accuracy (Eskes and Eichmann, 2019). Note that the bias is strongly site dependent and will depend on the local gradients in NO2 around the measurement site and the ability of the coarse global TM5-MP model (used by TROPOMI KNMI data, 1∘ resolution) to produce realistic profiles for individual sites. Apparently the AMF produced by the TM5-MP model has good performance in Egbert, away from the city, but has negative biases inside the city of Toronto. For the tropospheric column data, both the TROPOMI KNMI and TROPOMI ECCC products meet the design bias requirement; KNMI and ECCC tropospheric NO2 columns have a negative multiplicative bias relative to the Pandora measurements of up to 41 % and 34 %, respectively (see Appendix B).
This work assessed the quality of the TROPOMI NO2 standard data product developed by KNMI and a TROPOMI NO2 research product developed by ECCC. It was found that both TROPOMI NO2 total column data products met the design bias requirement. Using the statistical uncertainty estimation, the estimated TROPOMI upper-limit precision falls below the design requirement at Egbert but is above this value at the other two sites. Note that the mismatches due to (1) the difference in the line-of-sight between TROPOMI and Pandora and (2) the TROPOMI-averaged NO2 signals (within the 5.9 km×7 km footprint) over a larger area will both add a random component to the comparisons. The TROPOMI KNMI total column data have 24 %–28 % negative multiplicative bias at the suburban site (Downsview) and 23 %–25 % negative bias at the urban site (UTSG). However, the data show 8 %–11 % positive bias at the rural site (Egbert). In contrast, the TROPOMI ECCC total column data show improvement, with decreased multiplicative biases of 14 %–20 % and 7 %–18 % at Downsview and UTSG, respectively. However, the bias between Pandora and TROPOMI ECCC data increased to 16 %–19 % at Egbert. The TROPOMI KNMI and ECCC total column data have 0.02 to 0.06 DU precision at different sites. In general, benefitting from using the high-resolution (both spatial and vertical) regional air quality forecast model in the AMF calculation, the TROPOMI ECCC research data product shows improved agreement with Pandora instruments compared to the TROPOMI standard tropospheric NO2 data product. It was also found that Pandora data have at least 0.01 to 0.02 DU higher precision than TROPOMI data. Thus, Pandora instruments are suitable and sufficient for validation of TROPOMI NO2. These findings will help the evaluation and algorithm adjustment work for future TROPOMI NO2 data products. In future, in order to close the uncertainty estimate analysis, a quantification of the variability of NO2 within the TROPOMI footprint would be needed (e.g., aircraft mapping studies can be used to provide such information).
The wind-based validation method used in this work is based on high-spatial-resolution satellite measurements and wind reanalysis data and can be applied to future high-spatial-resolution geostationary satellite validation work. This study shows that, by using the wind-based method, the high-resolution satellite instrument not only can reveal fine pollution sources, but also can reveal the regional and local pollution transport patterns that can be used to identify pollution sources that affect air quality at a particular location. For example, we found that high-NO2 events observed at Egbert only occur for a 180∘ wind direction, corresponding to transported pollutants from Toronto. In addition, no significant local sources were found at Egbert, and the local background NO2 levels from other clean air directions (e.g., north) are below 0.2 DU. In contrast, the wind-direction-based NO2 distributions at Downsview indicate that the enhanced NO2 total columns at this site are linked to both local and transported NO2 pollution. The local background NO2 total column at Downsview is above 0.3 DU. The downtown Toronto site, UTSG, has more localized NO2 pollution, as expected. However, the NO2 spatial distribution at UTSG shows stronger dependency on the wind direction and a larger gradient than other sites (e.g., from 150 to 210∘ wind direction, the mean NO2 decreased from 0.4 to 0.25 DU).
In addition, the wind-based method reveals that the TROPOMI ECCC data show better agreement with Pandora data, especially at wind directions associated with high NO2 levels. This result indicates that the ECCC-recalculated high-spatial-resolution AMFs performed better in capturing the enhanced local NO2 signal. In general, the TROPOMI ECCC product has advantages, such as (1) high spatial resolution a priori, (2) a high-spatial-resolution albedo map, and (3) an improved snow-ice flag. The standard TROPOMI product has advantages such as radiance closure, which involves the use of the same albedo in the AMF and in the cloud retrieval, such that there is a consistency between AMF radiance levels observed by TROPOMI. At present, the TROPOMI algorithm development team is exploring two aspects to reduce the low bias seen in TROPOMI: (1) for Europe, a similar approach to that used for the TROPOMI ECCC product will be implemented, based on hourly CAMS regional model profiles available at 0.1∘ resolution (also about 10 km), and (2) cloud pressures: NO2 retrievals based on different cloud products; e.g., O2 A-band cloud pressure (Fresco) vs. O2−O2 cloud pressure will be evaluated. In future, improvement of Fresco and implementation of O2−O2 for TROPOMI will benefit from the correction of bias in TROPOMI NO2 data.
This work also explored the applicability of the wind-based validation method to a medium-resolution satellite instrument (i.e., OMI). Using 4 years of Pandora and OMI data, we found that the local NO2 distribution and transport patterns have not changed significantly at Downsview. Overall, this work proposed and evaluated new methodologies to assess and validate satellite observations with ground-based measurements and provided a detailed assessment of TROPOMI and Pandora NO2 data products.
The number of coincident pairs and the number of unique days for each wind bin are shown in Fig. A1. Additional validation comparisons were performed to evaluate the quality of TROPOMI NO2 total column data. Tables A1 to A4 present the absolute and relative mean biases between TROPOMI and Pandora calculated for each site. Here, the mean absolute difference is given by
where N is the number of coincident measurements, M1 is the TROPOMI NO2 total column, and M2 is the Pandora NO2 total column. To ensure that this work can be directly compared with other recent Pandora-based satellite validation studies (e.g., Herman et al., 2019; Ialongo et al., 2020), two different types of mean relative difference and several slopes based on different regression methods are calculated. The regression methods used include simple linear regression (SLR), zero intercept regression (ZIR), reduced major axis regression (RMA), and orthogonal linear regression (OLR).

Figure A1The number of coincidences of TROPOMI and Pandora measurements and number of unique days for each wind bin for the data shown in Figs. 6 and 7.
The type-1 mean relative difference, defined with respect to the average of the coincident measurements, is given by
The type-2 mean relative difference, defined with respect to Pandora measurement, is given by
To provide a general assessment of the data quality, the validation results are summarized in Tables A1 (TROPOMI KNMI vs. Pandora, using the standard approach), A2 (TROPOMI ECCC vs. Pandora, using the standard approach), A3 (TROPOMI KNMI vs. Pandora, using the wind-based method), and A4 (TROPOMI ECCC vs. Pandora, using the wind-based method).
Table A1TROPOMI KNMI vs. Pandora total column NO2, using the standard approach.

a Simple linear regression. b Zero intercept regression. c Reduced major axis regression. d Orthogonal linear regression. The errors shown for Δabs, Δrel-1, and Δrel-2 are the standard error.
Table A2TROPOMI ECCC vs. Pandora total column NO2, using the standard approach.
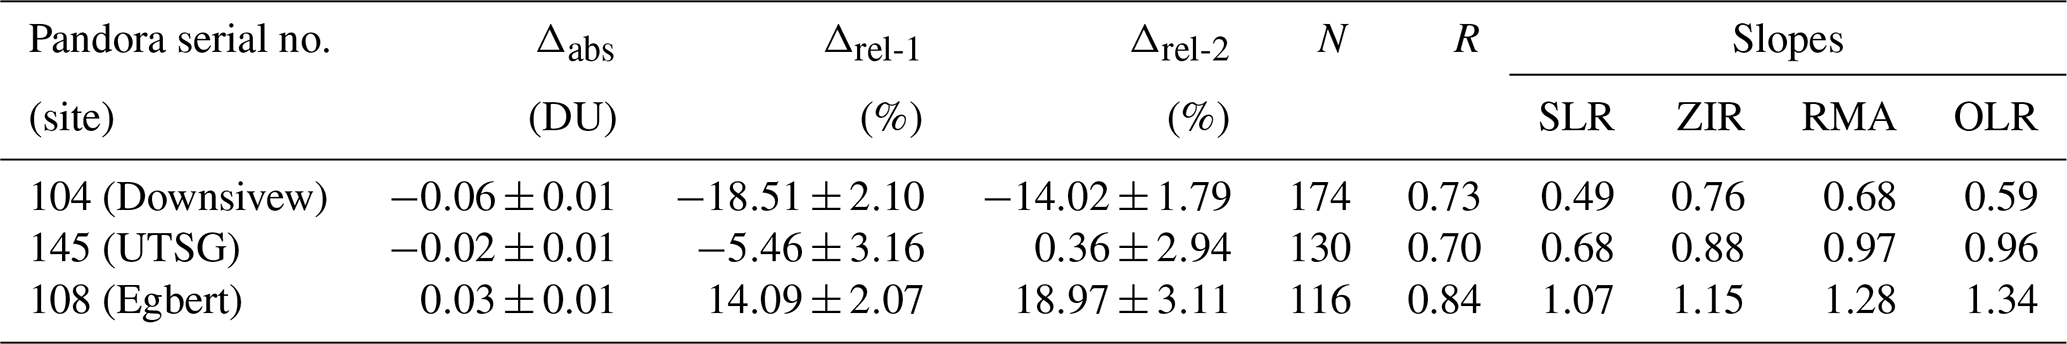
Table A3TROPOMI KNMI vs. Pandora total column NO2, using the wind-based method.
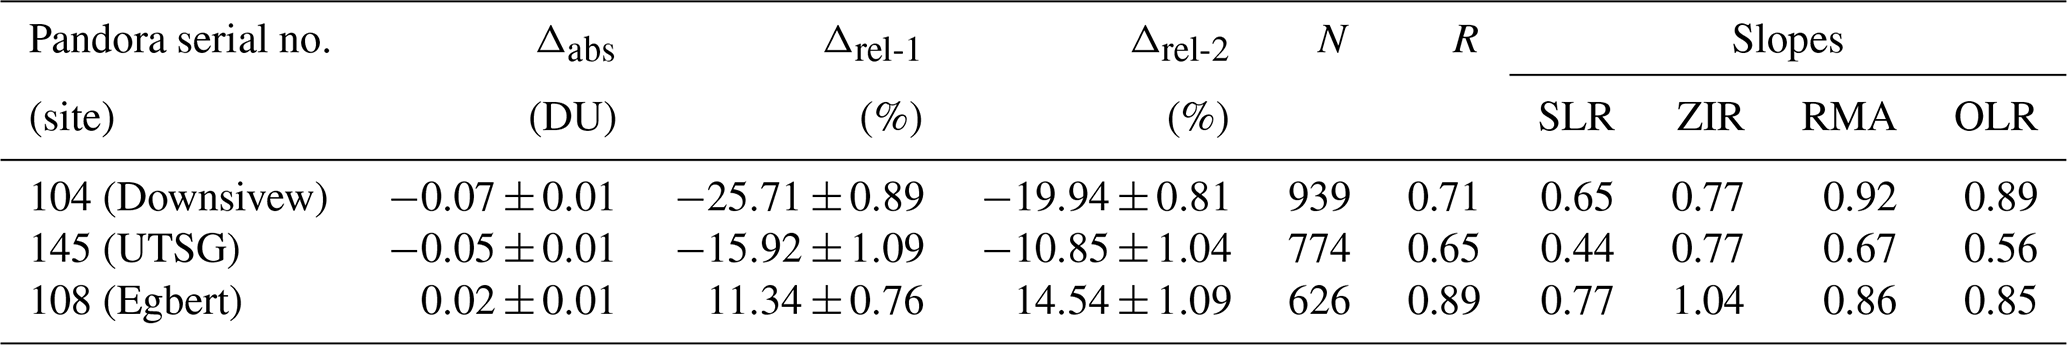
Table A4TROPOMI ECCC vs. Pandora total column NO2, using the wind-based method.
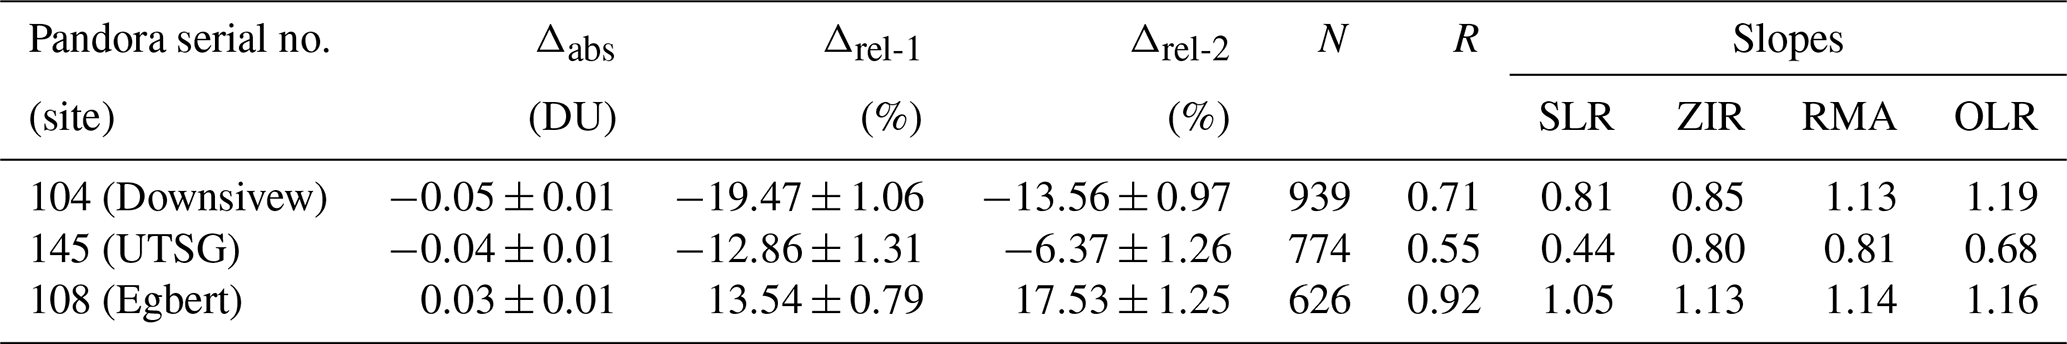
Sensitivity tests were performed to find the optimized values (e.g., ρ and ttravel limits; see Eqs. 4 and 5) that can be used in the wind-based method for determining measurement coincidences. Figure B1 shows an example of sensitivity tests done for measurements at Downsview. In the test, the coincident data (TROPOMI and Pandora) are further collected into five groups based on their distance to the site (i.e., yrotate value), from 0 to 10, 10 to 20, 20 to 30 km, etc. For each group, the mean of the difference between TROPOMI and Pandora data is shown in Fig. B1a; the correlation coefficient is shown in Fig. B1b; the slope is shown in Fig. B1c; and the number for coincident measurements is shown in Fig. B1d. Figure B1 shows that with an extended radius, coincident measurements found by using the wind-based method decreased in quality (i.e., increased difference and bias, and decreased correlation). Also, in the sensitivity test, we used a 2 h pixel travel time limit (ttravel < =2 h; see Sect. 3.3) to filter out the data transported from long distances. In general, including coincident data from a larger radius (e.g., radius larger than 30 km) does not always contribute much useful information for the validation.
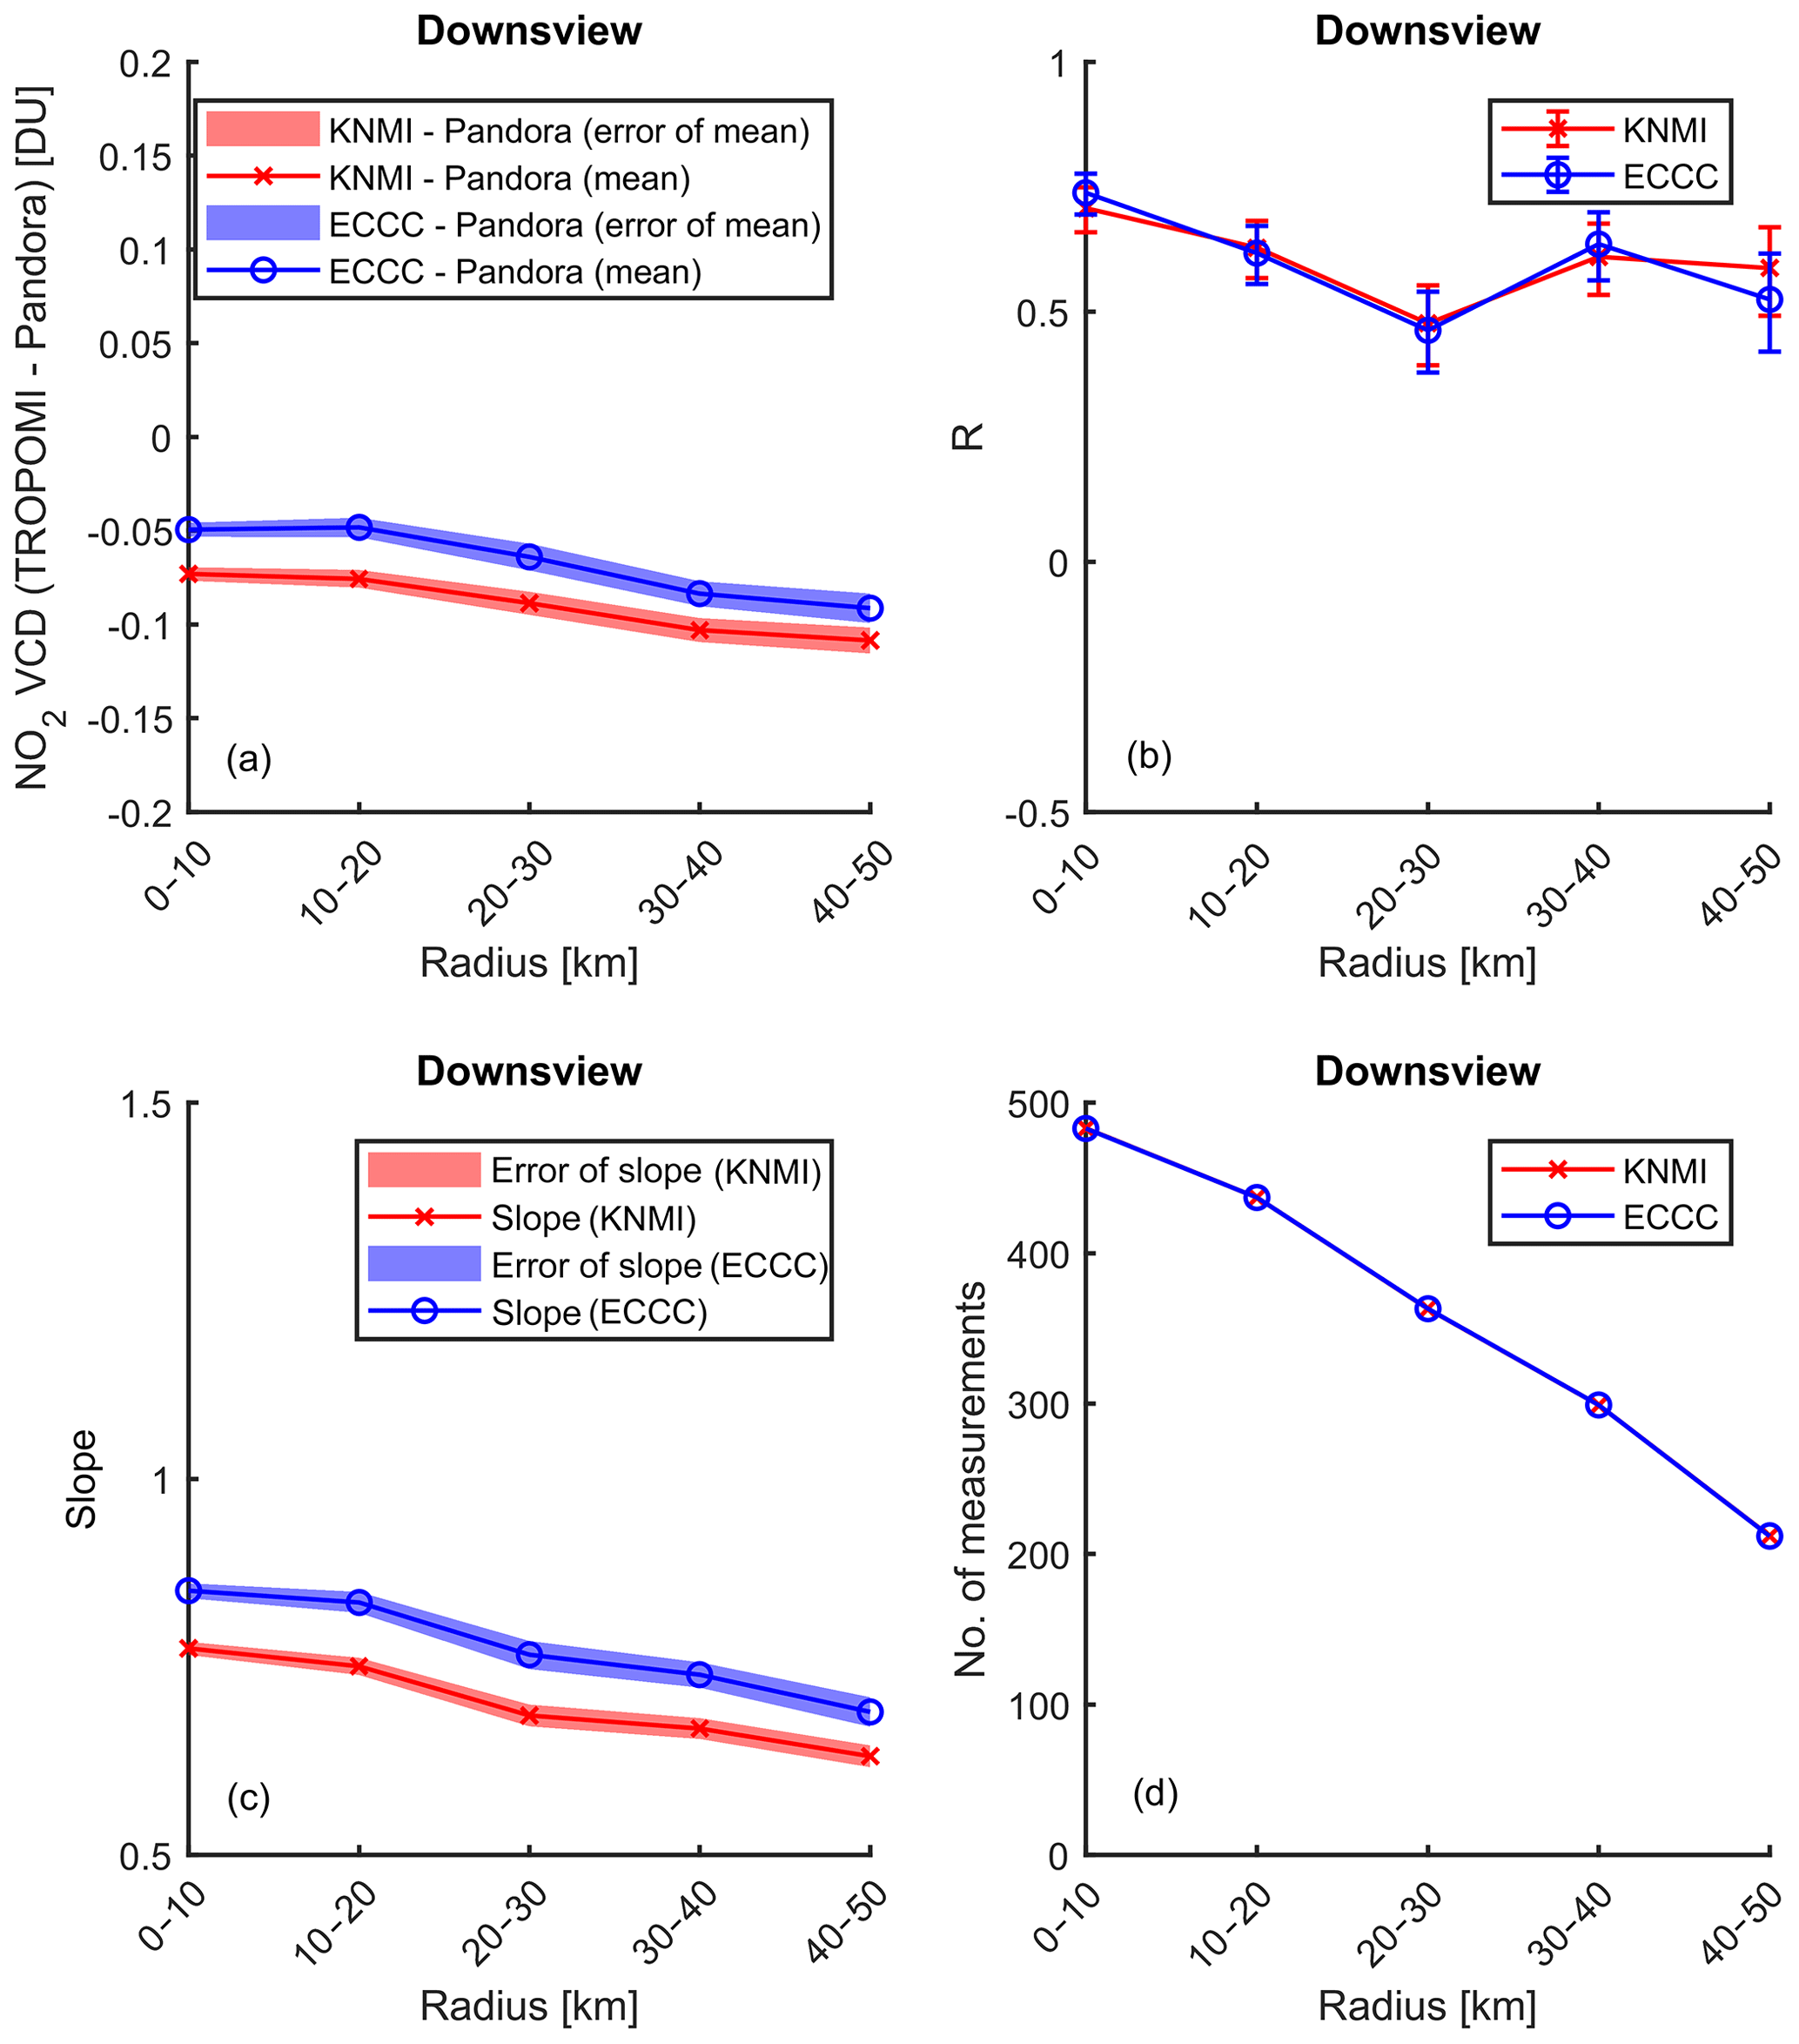
Figure B1Sensitivity test for Pandora no. 104 at Downsview. For data within each radius bin, (a) shows the mean difference between TROPOMI and Pandora NO2 VCDtotal, (b) shows the correlation coefficients, (c) shows the slope (zero offset linear fit), and (d) shows the number of coincident measurements. KNMI data are shown in red and ECCC data are shown in blue. The (a) symmetric standard error of the mean and (c) error of the slope are shown by colour-coded envelopes, indicated by the legends. The asymmetric error of the correlation coefficients is shown by error bars in (b) and (d).
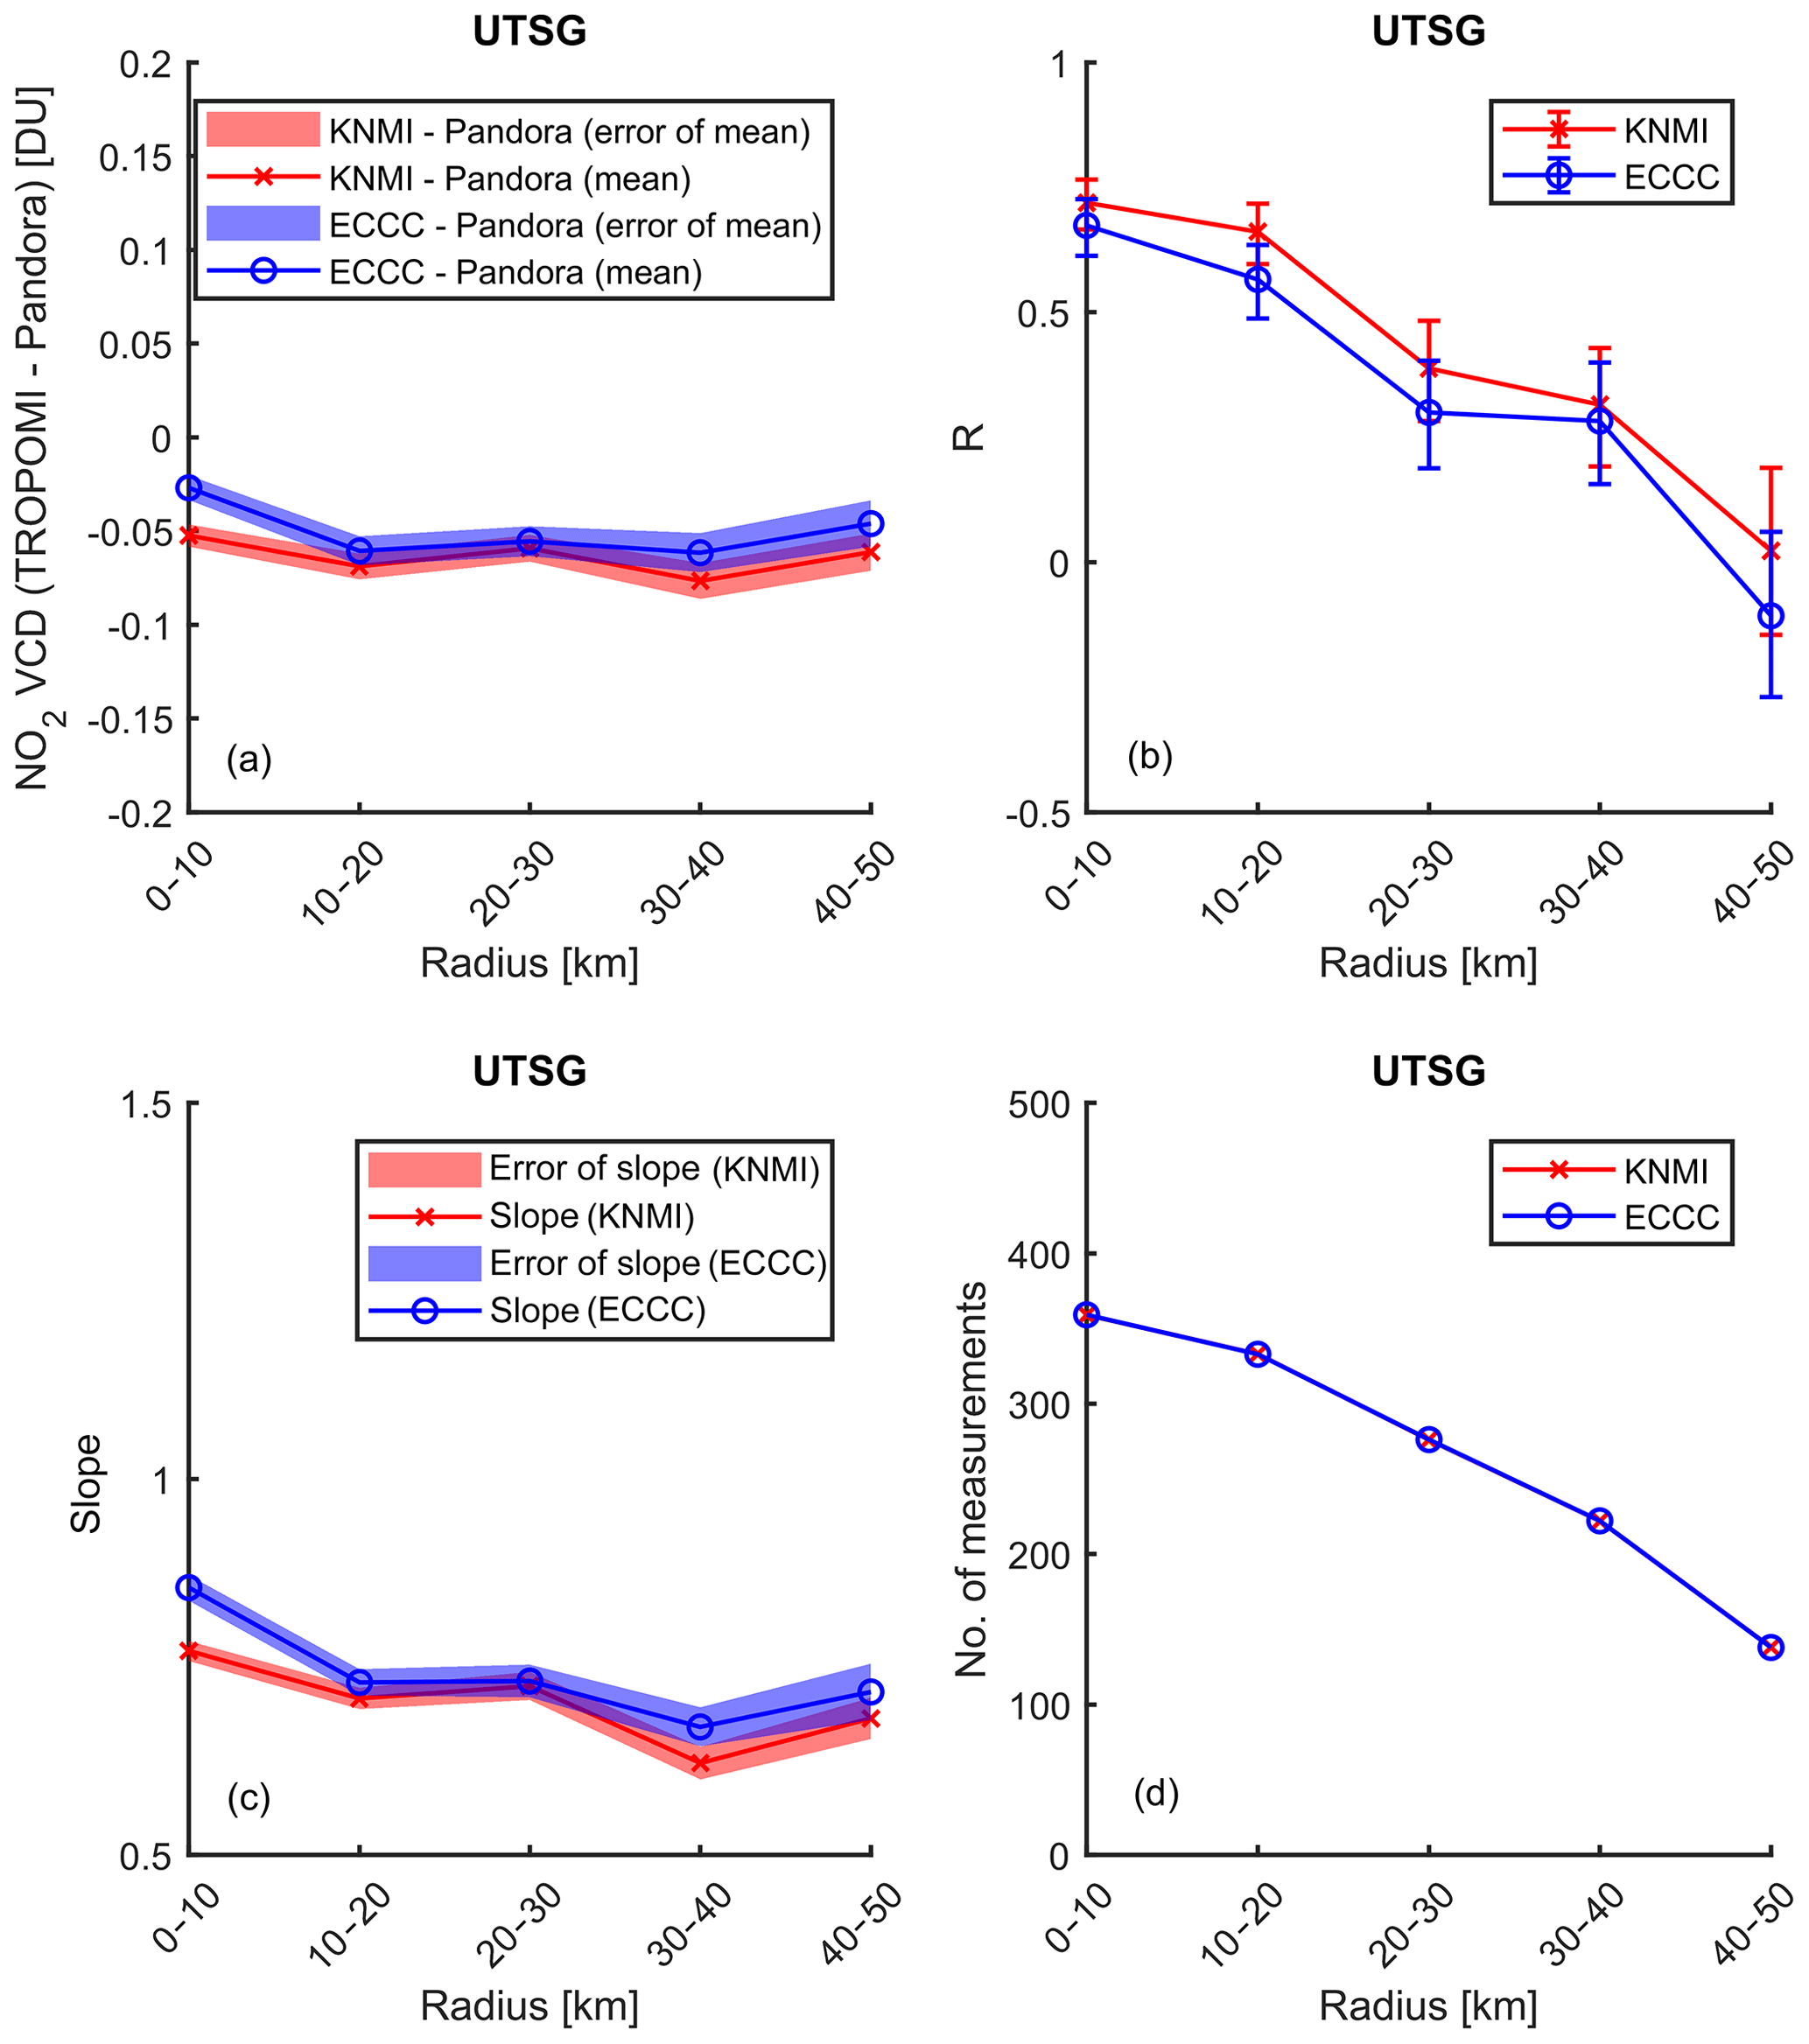
Figure B2Sensitivity test for Pandora no. 145 at UTSG. Descriptions of the legend in Fig. B1.
The same tests were performed for UTSG (Fig. B2) and Egbert (Fig. B3). Based on these tests, for the wind-based method, we only use satellite ground pixels within 30 km. Further tests related to the transport time were performed, such as changing the pixel travel time limit (ttravel) to 1 or 3 h (not shown here). The tests indicate that setting the pixel travel time limit to 1 h (ttravel < =1 h) can provide sufficient coincident data, and the general quality of the data is better with a shorter time limit. Thus, the data shown in this work from the wind-based method (in Sect. 4) all use the same criteria: a 1 h time limit and transport distance within 30 km.
One important message from Figs. B1 to B3 is that the sensitivity distance for each site is different. For example, for TROPOMI KNMI data in Fig. B1b show that for Downsview, the correlation coefficients between TROPOMI and Pandora data drop from 0.70 (0–10 km bin) to 0.35 (20–30 km bin) and then became stable for the 30–40 and 40–50 km radius bins. However, Fig. B3a (Egbert) shows an increase in correlation from 0.61 to 0.80 in the first three radius bins, and Fig. B2a (UTSG) shows a sharper decrease in correlation from 0.67 (10–20 km) to 0.32 (20–30 km) and then a decrease to a negative correlation in the very last radius bin (40–50 km). These features indicate different local NO2 emission and transport patterns. For each correlation curve, the shaper decrease in correlation indicates that those coincident measurements found by the wind-based method start to lose their representativeness; in other words, the assumptions we made in Sect. 3.3 start to lose their validity for pixels that are too far away from the site. However, this sensitivity distance varies from site to site, which depends on the relative weights between local emission and transport of NO2. For clean sites, such as Egbert, transported NO2 is the major source of pollutants. Thus, it shows a longer sensitivity distance. For urban sites, such as UTSG, which sits inside a localized polluted region, the pixels from a far distance (several pixels away) do not represent the local conditions; in other words, the local emission is the dominant source of NO2. More interestingly, the suburban Downsview site has a mixture of sources. The local highways provide strong local emission NO2 signals, whereas the city urban area and airport provide strong transported NO2 signals.
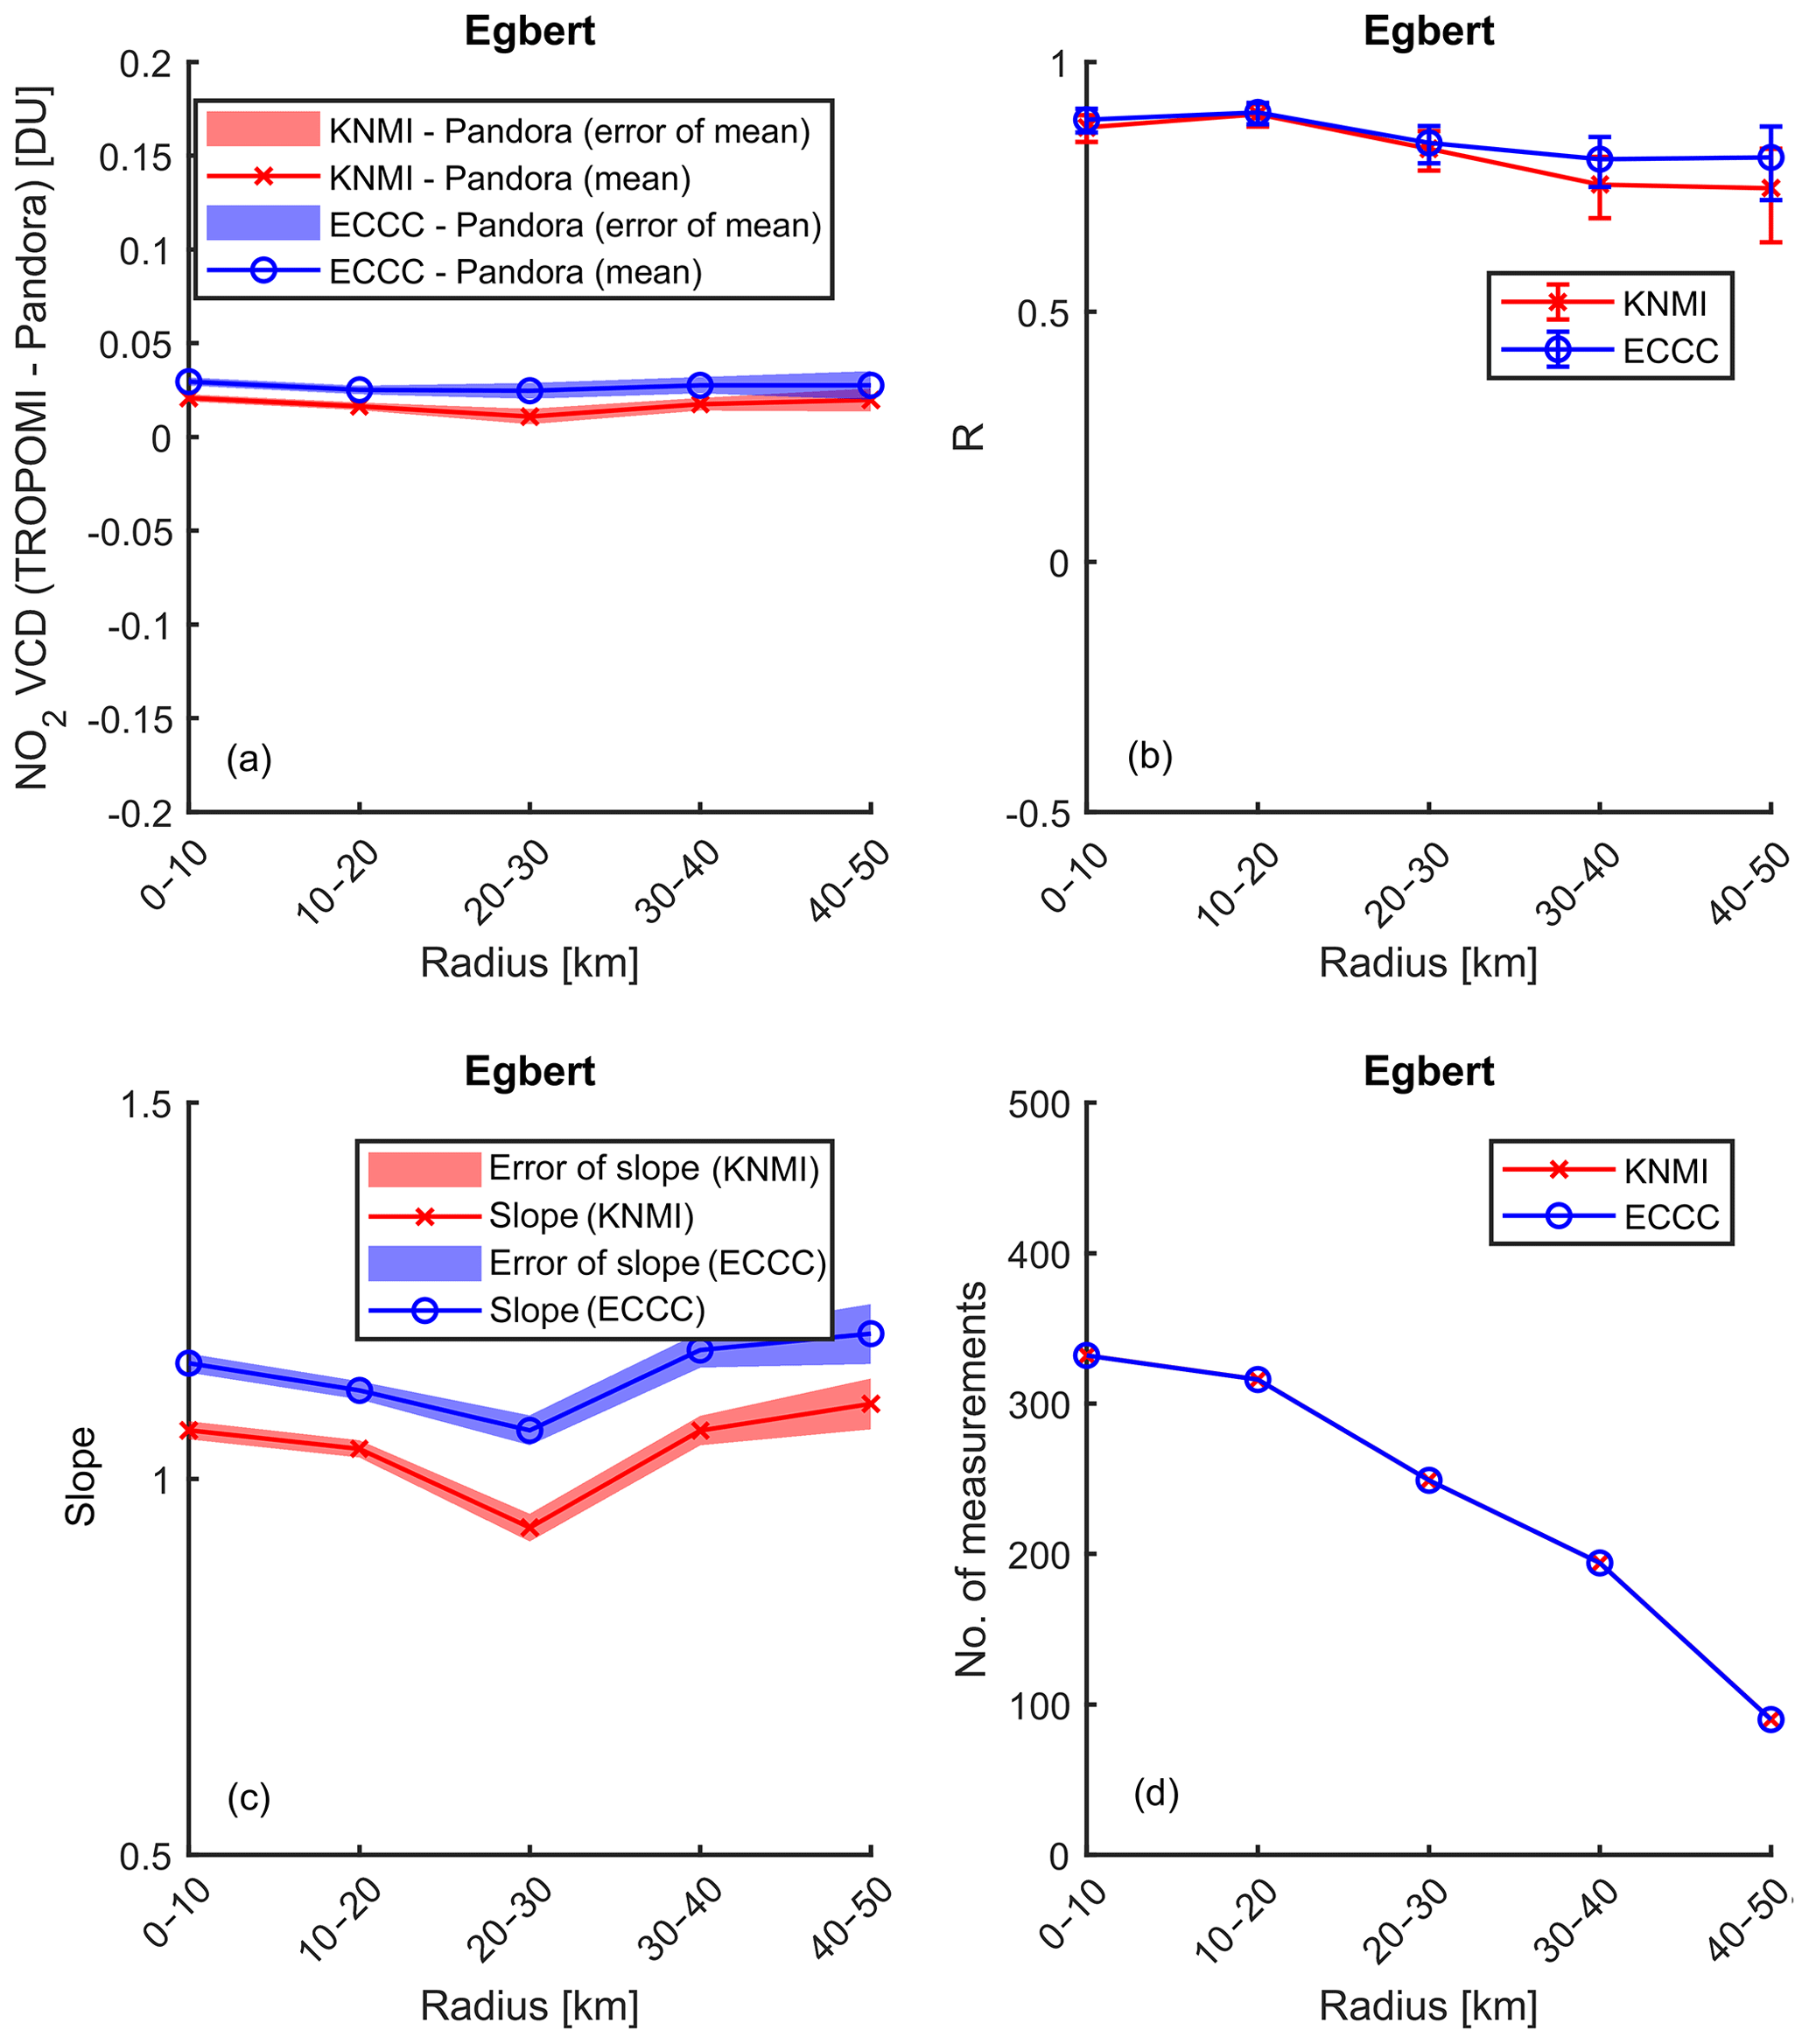
Figure B3Sensitivity test for Pandora no. 108 at Egbert. Descriptions of the legend in Fig. B1.
The comparison between KNMI and ECCC TROPOMI data also reveals some insights into the local air quality differences between these three sites. For example, KNMI and ECCC data show an almost consistent bias at Downsview and Egbert (see Figs. B1c and B3c) for every radius bin. However, Fig. B2c shows that the slopes of KNMI and ECCC data merged at the 20–30 km radius, at UTSG. This result indicates that the high-resolution model used in ECCC data led to very different AMFs at the city centre compared to the surrounding areas. In general, for the Toronto city centre and suburban areas, TROPOMI ECCC data show better agreement with Pandora NO2 total columns. However, its increased bias at the rural site still needs more investigation.
TROPOMI ECCC data only include tropospheric NO2; the total column was calculated as the sum of ECCC tropospheric NO2 and KNMI stratospheric NO2. The precision of TROPOMI and Pandora total column NO2 data is estimated using the statistical uncertainty estimation model:
where is the variance of TROPOMI residual NO2, is the variance of Pandora residual NO2, and is the variance of their difference. The residual NO2 (see Fig. 10) is calculated by using total columns minus the daily mean value. Use of the residual NO2 instead of column NO2 is to remove the influence of daily variations. In Fig. 11, TROPOMI KNMI-reported precisions of stratospheric and tropospheric NO2 are used to calculate the reported precision of the total column (see the black squares in Fig. 11). The ECCC-reported precision of the total column is calculated as the quadrature of ECCC tropospheric NO2 precision and KNMI stratospheric NO2 precision.

Figure C1TROPOMI-reported random uncertainties of (a) tropospheric and (b) stratospheric NO2 columns. Blue squares are KNMI-reported random uncertainties, with error bars from the uncertainty of the mean. Red squares are ECCC-reported random uncertainties. The black dash lines are the design requirements. The black square represents the estimated uncertainty of KNMI stratospheric data.
To better understand the random uncertainty budget, the tropospheric and stratospheric random uncertainties are shown in Fig. C1. The TROPOMI NO2 data product random uncertainty requirements for stratospheric and tropospheric column are 0.019 and 0.026 DU, respectively (Eskes and Eichmann, 2019). The means of the reported values for tropospheric and stratospheric columns are shown in Fig. C1 as blue and red squares. The details of the TROPOMI ECCC tropospheric NO2 random uncertainty calculation can be found in McLinden et al. (2014). The black square in Fig. C1b is the statistical uncertainty model estimated random uncertainty for TROPOMI KNMI stratospheric data. Since we do not have a Pandora stratospheric NO2 data product, this estimation was made by using Pandora measurements in Egbert at clean air conditions (see Sect. 5.1, i.e., excluding measurements when the wind direction is from 90 to 270∘). Comparing the results from Figs. 11 and C1, it is seen that the upper limit of TROPOMI total column NO2 data products did not meet the requirement because of the high random uncertainties in the tropospheric columns.
The bias of TROPOMI tropospheric NO2 column data has been evaluated by comparison with estimated Pandora tropospheric NO2 column data. In this work, Pandora tropospheric NO2 columns are estimated by
where VCDstrat.TROPOMI is the TROPOMI stratospheric column that is coincident (selected by both the standard and wind-based methods) with the corresponding Pandora total column. Figures C2 and C3 show the scatter plots of TROPOMI (KNMI and ECCC) vs. Pandora tropospheric columns. Using the slope of zero-intercept fitting as a proxy for bias, we found that KNMI data have −41 % to 10 % multiplicative bias and that ECCC data have −34 % to 28 % multiplicative bias. This result indicates that both the TROPOMI KNMI and TROPOMI ECCC VCDtrop data products meet the design bias requirement (25 % to 50 % for the NO2 tropospheric column).
Pandora data are available from the Pandonia network (http://pandonia.net/data/; Pandonia Global Network, 2020). OMI NO2 SPv3.1 data are available from https://disc.gsfc.nasa.gov/ (NASA, 2020). Any additional data may be obtained from Xiaoyi Zhao (xiaoyi.zhao@canada.ca). TROPOMI data can be downloaded from https://s5phub.copernicus.eu (ESA, 2020); OMI data are available at https://aura.gesdisc.eosdis.nasa.gov/data/Aura_OMI_Level2/OMNO2.003/. The TROPOMI ECCC research product is available at http://collaboration.cmc.ec.gc.ca/cmc/arqi/ (ECCC, 2020).
XZ analyzed the data and prepared the manuscript, with significant conceptual input from DG, VF, and CM, and critical feedback from all the co-authors. JD, AO, VF, XZ, and SCL operated and managed the Canadian Pandora network. CM and DG generated the TROPOMI and OMI ECCC data products. AC, MT, and MM operated the Pandonia network and provided critical technical support to the Canadian Pandora measurement program and subsequent data analysis. FB and HE provided TROPOMI KNMI data products. KB and KS operated and provided technical support to Pandora measurements at the UTSG site.
The authors declare that they have no conflict of interest.
This article is part of the special issue “TROPOMI on Sentinel-5 Precursor: first year in operation (AMT/ACP inter-journal SI)”. It is not associated with a conference.
We thank Ihab Abboud and Reno Sit from ECCC, Orfeo Colebatch from the University of Toronto, and Daniel Santana Diaz and Manuel Gebetsberger from Pandonia for their technical support of Pandora measurements. We acknowledge the NASA Earth Science Division for providing OMI NO2 SPv3.1 data. The Sentinel 5 Precursor TROPOMI Level 2 product was developed with funding from the Netherlands Space Office (NSO) and processed with funding from the European Space Agency (ESA).
This paper was edited by Ilse Aben and reviewed by two anonymous referees.
Adams, C., Strong, K., Zhao, X., Bassford, M. R., Chipperfield, M. P., Daffer, W., Drummond, J. R., Farahani, E. E., Feng, W., Fraser, A., Goutail, F., Manney, G., McLinden, C. A., Pazmino, A., Rex, M., and Walker, K. A.: Severe 2011 ozone depletion assessed with 11 years of ozone, NO2, and OClO measurements at 80∘ N, Geophys. Res. Lett., 39, L05806, https://doi.org/10.1029/2011gl050478, 2012.
Anenberg, S. C., Henze, D. K., Tinney, V., Kinney, P. L., Raich, Fann, N., Malley, C. S., Roman, H., Lamsal, L., Duncan, B., Martin, R. V., van Donkelaar, A., Brauer, M., Doherty, R., Jonson, J. E., Davila, Y., Sudo, K., and Kuylenstierna, J. C. I.: Estimates of the Global Burden of Ambient PM2.5, Ozone, and NO2 on Asthma Incidence and Emergency Room Visits, Environ. Health. Persp., 126, 107004, https://doi.org/10.1289/EHP3766, 2018.
Boersma, K. F., Jacob, D. J., Trainic, M., Rudich, Y., DeSmedt, I., Dirksen, R., and Eskes, H. J.: Validation of urban NO2 concentrations and their diurnal and seasonal variations observed from the SCIAMACHY and OMI sensors using in situ surface measurements in Israeli cities, Atmos. Chem. Phys., 9, 3867–3879, https://doi.org/10.5194/acp-9-3867-2009, 2009.
Boersma, K. F., Eskes, H. J., Dirksen, R. J., van der A, R. J., Veefkind, J. P., Stammes, P., Huijnen, V., Kleipool, Q. L., Sneep, M., Claas, J., Leitão, J., Richter, A., Zhou, Y., and Brunner, D.: An improved tropospheric NO2 column retrieval algorithm for the Ozone Monitoring Instrument, Atmos. Meas. Tech., 4, 1905–1928, https://doi.org/10.5194/amt-4-1905-2011, 2011.
Boersma, K. F., Eskes, H. J., Richter, A., De Smedt, I., Lorente, A., Beirle, S., van Geffen, J. H. G. M., Zara, M., Peters, E., Van Roozendael, M., Wagner, T., Maasakkers, J. D., van der A, R. J., Nightingale, J., De Rudder, A., Irie, H., Pinardi, G., Lambert, J.-C., and Compernolle, S. C.: Improving algorithms and uncertainty estimates for satellite NO2 retrievals: results from the quality assurance for the essential climate variables (QA4ECV) project, Atmos. Meas. Tech., 11, 6651–6678, https://doi.org/10.5194/amt-11-6651-2018, 2018.
Bourassa, A. E., Degenstein, D. A., and Llewellyn, E. J.: SASKTRAN: A spherical geometry radiative transfer code for efficient estimation of limb scattered sunlight, J. Quant. Spectrosc. Ra., 109, 52–73, https://doi.org/10.1016/j.jqsrt.2007.07.007, 2008.
Brion, J., Chakir, A., Daumont, D., Malicet, J., and Parisse, C.: High-resolution laboratory absorption cross section of O3. Temperature effect, Chem. Phys. Lett., 213, 610–612, https://doi.org/10.1016/0009-2614(93)89169-I, 1993.
Brion, J., Chakir, A., Charbonnier, J., Daumont, D., Parisse, C., and Malicet, J.: Absorption Spectra Measurements for the Ozone Molecule in the 350–830 nm Region, J. Atmos. Chem., 30, 291–299, https://doi.org/10.1023/a:1006036924364, 1998.
Bucsela, E. J., Krotkov, N. A., Celarier, E. A., Lamsal, L. N., Swartz, W. H., Bhartia, P. K., Boersma, K. F., Veefkind, J. P., Gleason, J. F., and Pickering, K. E.: A new stratospheric and tropospheric NO2 retrieval algorithm for nadir-viewing satellite instruments: applications to OMI, Atmos. Meas. Tech., 6, 2607–2626, https://doi.org/10.5194/amt-6-2607-2013, 2013.
Cede, A.: Manual for Blick Software Suite 1.6, available at: https://www.pandonia-global-network.org/home/documents/manuals/, last access: 1 November 2019.
Cede, A., Herman, J., Richter, A., Krotkov, N., and Burrows, J.: Measurements of nitrogen dioxide total column amounts using a Brewer double spectrophotometer in direct Sun mode, J. Geophys. Res., 111, D05304, https://doi.org/10.1029/2005JD006585, 2006.
Celarier, E. A., Brinksma, E. J., Gleason, J. F., Veefkind, J. P., Cede, A., Herman, J. R., Ionov, D., Goutail, F., Pommereau, J.-P., Lambert, J.-C., Roozendael, M. van, Pinardi, G., Wittrock, F., Schönhardt, A., Richter, A., Ibrahim, O. W., Wagner, T., Bojkov, B., Mount, G., Spinei, E., Chen, C. M., Pongetti, T. J., Sander, S. P., Bucsela, E. J., Wenig, M. O., Swart, D. P. J., Volten, H., Kroon, M., and Levelt, P. F.: Validation of Ozone Monitoring Instrument nitrogen dioxide columns, J. Geophys. Res., 113, D15S15, https://doi.org/10.1029/2007JD008908, 2008.
Celarier, E. A., Lamsal, L. N., Bucsela, E. J., Marchenko, S. V., and Krotkov, N. A.: OMNO2 Version 3.0 Level 2 File Description (Document version 3.1), NASA Goddard Space Flight Center, 2016.
Daumont, D., Brion, J., Charbonnier, J., and Malicet, J.: Ozone UV spectroscopy I: Absorption cross-sections at room temperature, J. Atmos. Chem., 15, 145–155, https://doi.org/10.1007/bf00053756, 1992.
Dee, D. P., Uppala, S. M., Simmons, A. J., Berrisford, P., Poli, P., Kobayashi, S., Andrae, U., Balmaseda, M. A., Balsamo, G., Bauer, P., Bechtold, P., Beljaars, A. C. M., van de Berg, L., Bidlot, J., Bormann, N., Delsol, C., Dragani, R., Fuentes, M., Geer, A. J., Haimberger, L., Healy, S. B., Hersbach, H., Hólm, E. V., Isaksen, L., Kållberg, P., Köhler, M., Matricardi, M., McNally, A. P., Monge-Sanz, B. M., Morcrette, J. J., Park, B. K., Peubey, C., de Rosnay, P., Tavolato, C., Thépaut, J. N., and Vitart, F.: The ERA-Interim reanalysis: configuration and performance of the data assimilation system, Q. J. Roy. Meteor. Soc., 137, 553–597, https://doi.org/10.1002/qj.828, 2011.
de Graaf, M., Sihler, H., Tilstra, L. G., and Stammes, P.: How big is an OMI pixel?, Atmos. Meas. Tech., 9, 3607–3618, https://doi.org/10.5194/amt-9-3607-2016, 2016.
Dickerson, R. R., Stedman, D. H., and Delany, A. C.: Direct measurements of ozone and nitrogen dioxide photolysis rates in the troposphere, J. Geophys. Res., 87, 4933, https://doi.org/10.1029/JC087iC07p04933, 1982.
Drosoglou, T., Bais, A. F., Zyrichidou, I., Kouremeti, N., Poupkou, A., Liora, N., Giannaros, C., Koukouli, M. E., Balis, D., and Melas, D.: Comparisons of ground-based tropospheric NO2 MAX-DOAS measurements to satellite observations with the aid of an air quality model over the Thessaloniki area, Greece, Atmos. Chem. Phys., 17, 5829–5849, https://doi.org/10.5194/acp-17-5829-2017, 2017.
Drosoglou, T., Koukouli, M. E., Kouremeti, N., Bais, A. F., Zyrichidou, I., Balis, D., van der A, R. J., Xu, J., and Li, A.: MAX-DOAS NO2 observations over Guangzhou, China; ground-based and satellite comparisons, Atmos. Meas. Tech., 11, 2239–2255, https://doi.org/10.5194/amt-11-2239-2018, 2018.
Dueck, S. R. F., Bourassa, A. E., and Degenstein, D. A.: An efficient algorithm for polarization in the SASKTRAN radiative transfer framework, J. Quant. Spectrosc. Ra., 199, 1–11, https://doi.org/10.1016/j.jqsrt.2017.05.016, 2017.
ECCC: Canadian Environmental Sustainability Indicators: Air Quality. Environment and Climate Change Canada, ISBN 978-0-660-06016-3, 2016.
ECCC: TROPOMI ECCC research product, available at: http://collaboration.cmc.ec.gc.ca/cmc/arqi/, last access: 24 April 2020.
EEA: Air quality in Europe – 2017 report, European Environment Agency, EEA Report No. 13/2017, 2017.
EPA: Air Quality Index-A Guide to Air Quality and Your Health, U.S. Environmental Protection Agency, EPA-454/R-00-005, 2014.
ESA: TROPOMI NO2 data, available at: https://s5phub.copernicus.eu, last access: 24 April 2020.
ESA EOP-GMQ: Sentinel-5 Precursor Calibration and Validation Plan for the Operational Phase, available at: https://sentinel.esa.int/documents/247904/2474724/Sentinel-5P-Calibration-and-Validation-Plan.pdf, (last access: 29 July 2019), 2017.
Eskes, H. J. and Eichmann, K.-U.: S5P Mission Performance Centre Nitrogen Dioxide [L2 NO2] Readme, 2019.
Eskes, H. J., van Geffen, J. H. G. M., Boersma, K. F., Eichmann, K.-U., Apituley, A., Pedergnana, M., Sneep, M., Veefkind, J. P., and Loyola, D.: Sentinel-5 precursor/TROPOMI Level 2 Product User Manual Nitrogendioxide, 2019.
Fioletov, V., McLinden, C. A., Kharol, S. K., Krotkov, N. A., Li, C., Joiner, J., Moran, M. D., Vet, R., Visschedijk, A. J. H., and Denier van der Gon, H. A. C.: Multi-source SO2 emission retrievals and consistency of satellite and surface measurements with reported emissions, Atmos. Chem. Phys., 17, 12597–12616, https://doi.org/10.5194/acp-17-12597-2017, 2017.
Fioletov, V. E., Tarasick, D. W., and Petropavlovskikh, I.: Estimating ozone variability and instrument uncertainties from SBUV (/2), ozonesonde, Umkehr, and SAGE II measurements: Short-term variations, J. Geophys. Res., 111, D02305, https://doi.org/10.1029/2005jd006340, 2006.
Fioletov, V. E., McLinden, C. A., Krotkov, N., Moran, M. D., and Yang, K.: Estimation of SO2 emissions using OMI retrievals, Geophys. Res. Lett., 38, L21811, https://doi.org/10.1029/2011GL049402, 2011.
Fioletov, V. E., McLinden, C. A., Krotkov, N., and Li, C.: Lifetimes and emissions of SO2 from point sources estimated from OMI, Geophys. Res. Lett., 42, 1969–1976, https://doi.org/10.1002/2015GL063148, 2015.
Flynn, C. M., Pickering, K. E., Crawford, J. H., Lamsal, L., Krotkov, N., Herman, J., Weinheimer, A., Chen, G., Liu, X., Szykman, J., Tsay, S.-C., Loughner, C., Hains, J., Lee, P., Dickerson, R. R., Stehr, J. W., and Brent, L.: Relationship between column-density and surface mixing ratio: Statistical analysis of O3 and NO2 data from the July 2011 Maryland DISCOVER-AQ mission, Atmos. Environ., 92, 429–441, https://doi.org/10.1016/j.atmosenv.2014.04.041, 2014.
Garratt, J. R.: The Atmospheric Boundary Layer, Cambridge University Press, 1994.
Griffin, D., Zhao, X., McLinden, C. A., Boersma, K. F., Bourassa, A., Dammers, E., Degenstein, D., A., Eskes, H., Fehr, L., Fioletov, V., Hayden, K. L., Kharol, S. K., Li, S.-M., Makar, P., Martin, R. V., Mihele, C., Mittermeier, R. L., Krotkov, N., Sneep, M., Lamsal, L. N., ter Linden, M., van Geffen, J., Veefkind, P., and Wolde, M.: High resolution mapping of nitrogen dioxide with TROPOMI: First results and validation over the Canadian oil sands, Geophys. Res. Lett., 46, 1049–1060, https://doi.org/10.1029/2018GL081095, 2019.
Grubbs, F. E.: On estimating precision of measuring instruments and product variability, J. Am. Stat. Assoc., 43, 243–264, https://doi.org/10.1080/01621459.1948.10483261, 1948.
Helfrich, S. R., McNamara, D., Ramsay, B. H., Baldwin, T., and Kasheta, T.: Enhancements to, and forthcoming developments in the Interactive Multisensor Snow and Ice Mapping System (IMS), Hydrol. Process., 21, 1576–1586, https://doi.org/10.1002/hyp.6720, 2007.
Hendrick, F., Müller, J.-F., Clémer, K., Wang, P., De Mazière, M., Fayt, C., Gielen, C., Hermans, C., Ma, J. Z., Pinardi, G., Stavrakou, T., Vlemmix, T., and Van Roozendael, M.: Four years of ground-based MAX-DOAS observations of HONO and NO2 in the Beijing area, Atmos. Chem. Phys., 14, 765–781, https://doi.org/10.5194/acp-14-765-2014, 2014.
Herman, J., Cede, A., Spinei, E., Mount, G., Tzortziou, M., and Abuhassan, N.: NO2 column amounts from ground-based Pandora and MFDOAS spectrometers using the direct-sun DOAS technique: Intercomparisons and application to OMI validation, J. Geophys. Res., 114, D13307, https://doi.org/10.1029/2009JD011848, 2009.
Herman, J., Evans, R., Cede, A., Abuhassan, N., Petropavlovskikh, I., and McConville, G.: Comparison of ozone retrievals from the Pandora spectrometer system and Dobson spectrophotometer in Boulder, Colorado, Atmos. Meas. Tech., 8, 3407–3418, https://doi.org/10.5194/amt-8-3407-2015, 2015.
Herman, J., Abuhassan, N., Kim, J., Kim, J., Dubey, M., Raponi, M., and Tzortziou, M.: Underestimation of column NO2 amounts from the OMI satellite compared to diurnally varying ground-based retrievals from multiple PANDORA spectrometer instruments, Atmos. Meas. Tech., 12, 5593–5612, https://doi.org/10.5194/amt-12-5593-2019, 2019.
Ialongo, I., Herman, J., Krotkov, N., Lamsal, L., Boersma, K. F., Hovila, J., and Tamminen, J.: Comparison of OMI NO2 observations and their seasonal and weekly cycles with ground-based measurements in Helsinki, Atmos. Meas. Tech., 9, 5203–5212, https://doi.org/10.5194/amt-9-5203-2016, 2016.
Ialongo, I., Virta, H., Eskes, H., Hovila, J., and Douros, J.: Comparison of TROPOMI/Sentinel-5 Precursor NO2 observations with ground-based measurements in Helsinki, Atmos. Meas. Tech., 13, 205–218, https://doi.org/10.5194/amt-13-205-2020, 2020.
Irie, H., Kanaya, Y., Akimoto, H., Tanimoto, H., Wang, Z., Gleason, J. F., and Bucsela, E. J.: Validation of OMI tropospheric NO2 column data using MAX-DOAS measurements deep inside the North China Plain in June 2006: Mount Tai Experiment 2006, Atmos. Chem. Phys., 8, 6577–6586, https://doi.org/10.5194/acp-8-6577-2008, 2008.
Kleipool, Q., Ludewig, A., Babić, L., Bartstra, R., Braak, R., Dierssen, W., Dewitte, P.-J., Kenter, P., Landzaat, R., Leloux, J., Loots, E., Meijering, P., van der Plas, E., Rozemeijer, N., Schepers, D., Schiavini, D., Smeets, J., Vacanti, G., Vonk, F., and Veefkind, P.: Pre-launch calibration results of the TROPOMI payload on-board the Sentinel-5 Precursor satellite, Atmos. Meas. Tech., 11, 6439–6479, https://doi.org/10.5194/amt-11-6439-2018, 2018.
Kleipool, Q. L., Dobber, M. R., Haan, J. F., and de Levelt, P. F.: Earth surface reflectance climatology from 3 years of OMI data, J. Geophys. Res.-Atmos., 113, D18308, https://doi.org/10.1029/2008JD010290, 2008.
Krotkov, N. A., Lamsal, L. N., Celarier, E. A., Swartz, W. H., Marchenko, S. V., Bucsela, E. J., Chan, K. L., Wenig, M., and Zara, M.: The version 3 OMI NO2 standard product, Atmos. Meas. Tech., 10, 3133–3149, https://doi.org/10.5194/amt-10-3133-2017, 2017.
Lambert, J.-C., Keppens, A., Hubert, D., Langerock, B., Eichmann, K.-U., Kleipool, Q., Sneep, M., Verhoelst, T., Wagner, T., Weber, M., Ahn, C., Argyrouli, A., Balis, D., Chan, K. L., Compernolle, S., De Smedt, I., Eskes, H., Fjæraa, A. M., Garane, K., Gleason, J. F., Goutail, F., Granville, J., Hedelt, P., Heue, K.-P., Jaross, G., Koukouli, M., Landgraf, J., Lutz, R., Niemejer, S., Pazmiño, A., Pinardi, G., Pommereau, J.-P., Richter, A., Rozemeijer, N., Sha, M. K., Stein Zweers, D., Theys, N., Tilstra, G., Torres, O., Valks, P., Vigouroux, C., and Wang, P.: Quarterly Validation Report of theCopernicus Sentinel-5 Precursor Operational Data Products–#02: July 2018–February2019, available at: http://www.tropomi.eu/sites/default/files/files/publicS5P-MPC-IASB-ROCVR-02.0.2-20190411_FINAL.pdf, last access: 5 September 2019.
Lamsal, L. N., Krotkov, N. A., Celarier, E. A., Swartz, W. H., Pickering, K. E., Bucsela, E. J., Gleason, J. F., Martin, R. V., Philip, S., Irie, H., Cede, A., Herman, J., Weinheimer, A., Szykman, J. J., and Knepp, T. N.: Evaluation of OMI operational standard NO2 column retrievals using in situ and surface-based NO2 observations, Atmos. Chem. Phys., 14, 11587–11609, https://doi.org/10.5194/acp-14-11587-2014, 2014.
Lamsal, L. N., Janz, S. J., Krotkov, N. A., Pickering, K. E., Spurr, R. J. D., Kowalewski, M. G., Loughner, C. P., Crawford, J. H., Swartz, W. H., and Herman, J. R.: High-resolution NO2 observations from the Airborne Compact Atmospheric Mapper: Retrieval and validation, J. Geophys. Res., 122, 1953–1970, https://doi.org/10.1002/2016JD025483, 2017.
Lee, A. M., Roscoe, H. K., Oldham, D. J., Squires, J. A. C., Sarkissian, A., Pommereau, J.-P., and Gardiner, B. G.: Improvements to the accuracy of measurements of NO2 by zenith-sky visible spectrometers, J. Quant. Spectrosc. Ra., 52, 649–657, https://doi.org/10.1016/0022-4073(94)90031-0, 1994.
Levelt, P. F., Hilsenrath, E., Leppelmeier, G. W., Van den Oord, G. H., Bhartia, P. K., Tamminen, J., De Haan, J. F., and Veefkind, J. P.: Science objectives of the ozone monitoring instrument, IEEE T. Geosci. Remote, 44, 1199–1208, https://doi.org/10.1109/TGRS.2006.872336, 2006.
Levelt, P. F., Joiner, J., Tamminen, J., Veefkind, J. P., Bhartia, P. K., Stein Zweers, D. C., Duncan, B. N., Streets, D. G., Eskes, H., van der A, R., McLinden, C., Fioletov, V., Carn, S., de Laat, J., DeLand, M., Marchenko, S., McPeters, R., Ziemke, J., Fu, D., Liu, X., Pickering, K., Apituley, A., González Abad, G., Arola, A., Boersma, F., Chan Miller, C., Chance, K., de Graaf, M., Hakkarainen, J., Hassinen, S., Ialongo, I., Kleipool, Q., Krotkov, N., Li, C., Lamsal, L., Newman, P., Nowlan, C., Suleiman, R., Tilstra, L. G., Torres, O., Wang, H., and Wargan, K.: The Ozone Monitoring Instrument: overview of 14 years in space, Atmos. Chem. Phys., 18, 5699–5745, https://doi.org/10.5194/acp-18-5699-2018, 2018.
Lorente, A., Folkert Boersma, K., Yu, H., Dörner, S., Hilboll, A., Richter, A., Liu, M., Lamsal, L. N., Barkley, M., De Smedt, I., Van Roozendael, M., Wang, Y., Wagner, T., Beirle, S., Lin, J.-T., Krotkov, N., Stammes, P., Wang, P., Eskes, H. J., and Krol, M.: Structural uncertainty in air mass factor calculation for NO2 and HCHO satellite retrievals, Atmos. Meas. Tech., 10, 759–782, https://doi.org/10.5194/amt-10-759-2017, 2017.
Marchenko, S., Krotkov, N. A., Lamsal, L. N., Celarier, E. A., Swartz, W. H., and Bucsela, E. J.: Revising the slant column density retrieval of nitrogen dioxide observed by the Ozone Monitoring Instrument, J. Geophys. Res., 120, 5670–5692, https://doi.org/10.1002/2014JD022913, 2015.
Martins, D. K., Najjar, R. G., Tzortziou, M., Abuhassan, N., Thompson, A. M., and Kollonige, D. E.: Spatial and temporal variability of ground and satellite column measurements of NO2 and O3 over the Atlantic Ocean during the Deposition of Atmospheric Nitrogen to Coastal Ecosystems Experiment, J. Geophys. Res., 121, 14175–14187, https://doi.org/10.1002/2016JD024998, 2016.
McLinden, C. A., Fioletov, V., Boersma, K. F., Kharol, S. K., Krotkov, N., Lamsal, L., Makar, P. A., Martin, R. V., Veefkind, J. P., and Yang, K.: Improved satellite retrievals of NO2 and SO2 over the Canadian oil sands and comparisons with surface measurements, Atmos. Chem. Phys., 14, 3637–3656, https://doi.org/10.5194/acp-14-3637-2014, 2014.
McLinden, C. A., Fioletov, V., Shephard, M. W., Krotkov, N., Li, C., Martin, R. V., Moran, M. D., and Joiner, J.: Space-based detection of missing sulfur dioxide sources of global air pollution, Nat. Geosci., 9, 496–500, https://doi.org/10.1038/ngeo2724, 2016.
Moran, M. D., Menard, S., Talbot, D., Huang, P., Makar, P. A., Gong, W., Landry, H., Gong, S., Gravel, S., Crevier, L.-P., and Kallaur, A.: Particulate-matter forecasting with GEM-MACH15, a new Canadian operational air quality forecast model, in 30th NATO/SPS ITM on Air Pollution Modelling and Its Application, 289–293, Springer, San Francisco, 2009.
NASA: OMI NO2 SPv3.1 data, available at: https://disc.gsfc.nasa.gov/, last access: 24 April 2020.
Noxon, J. F.: Nitrogen dioxide in the stratosphere and troposphere measured by ground-based absorption spectroscopy, Science, 189, 547–549, 1975.
Pandonia Global Network: Pandora NO2 column data, available at: http://pandonia.net/data/, last access: 24 April 2020.
Pavlovic, R., Chen, J., Anderson, K., Moran, M. D., Beaulieu, P.-A., Davignon, D., and Cousineau, S.: The FireWork air quality forecast system with near-real-time biomass burning emissions: Recent developments and evaluation of performance for the 2015 North American wildfire season, J. Air Waste Manage., 66, 819–841, https://doi.org/10.1080/10962247.2016.1158214, 2016.
Pendlebury, D., Gravel, S., Moran, M. D., and Lupu, A.: Impact of chemical lateral boundary conditions in a regional air quality forecast model on surface ozone predictions during stratospheric intrusions, Atmos. Environ., 174, 148–170, https://doi.org/10.1016/j.atmosenv.2017.10.052, 2018.
Piters, A. J. M., Boersma, K. F., Kroon, M., Hains, J. C., Van Roozendael, M., Wittrock, F., Abuhassan, N., Adams, C., Akrami, M., Allaart, M. A. F., Apituley, A., Beirle, S., Bergwerff, J. B., Berkhout, A. J. C., Brunner, D., Cede, A., Chong, J., Clémer, K., Fayt, C., Frieß, U., Gast, L. F. L., Gil-Ojeda, M., Goutail, F., Graves, R., Griesfeller, A., Großmann, K., Hemerijckx, G., Hendrick, F., Henzing, B., Herman, J., Hermans, C., Hoexum, M., van der Hoff, G. R., Irie, H., Johnston, P. V., Kanaya, Y., Kim, Y. J., Klein Baltink, H., Kreher, K., de Leeuw, G., Leigh, R., Merlaud, A., Moerman, M. M., Monks, P. S., Mount, G. H., Navarro-Comas, M., Oetjen, H., Pazmino, A., Perez-Camacho, M., Peters, E., du Piesanie, A., Pinardi, G., Puentedura, O., Richter, A., Roscoe, H. K., Schönhardt, A., Schwarzenbach, B., Shaiganfar, R., Sluis, W., Spinei, E., Stolk, A. P., Strong, K., Swart, D. P. J., Takashima, H., Vlemmix, T., Vrekoussis, M., Wagner, T., Whyte, C., Wilson, K. M., Yela, M., Yilmaz, S., Zieger, P., and Zhou, Y.: The Cabauw Intercomparison campaign for Nitrogen Dioxide measuring Instruments (CINDI): design, execution, and early results, Atmos. Meas. Tech., 5, 457–485, https://doi.org/10.5194/amt-5-457-2012, 2012.
Platt, U.: Differential optical absorption spectroscopy (DOAS), in Air Monitoring by Spectroscopic Techniques, 27–84, John Wiley, New York, 1994.
Platt, U. and Stutz, J.: Differential Optical Absorption Spectroscopy: Principles and Applications, Springer, Germany, Berlin, 2008.
Pommier, M., McLinden, C. A., and Deeter, M.: Relative changes in CO emissions over megacities based on observations from space, Geophys. Res. Lett., 40, 3766–3771, https://doi.org/10.1002/grl.50704, 2013.
Reed, A. J., Thompson, A. M., Kollonige, D. E., Martins, D. K., Tzortziou, M. A., Herman, J. R., Berkoff, T. A., Abuhassan, N. K., and Cede, A.: Effects of local meteorology and aerosols on ozone and nitrogen dioxide retrievals from OMI and pandora spectrometers in Maryland, USA during DISCOVER-AQ 2011, J. Atmos. Chem., 72, 455–482, https://doi.org/10.1007/s10874-013-9254-9, 2015.
Roscoe, H. K., Van Roozendael, M., Fayt, C., du Piesanie, A., Abuhassan, N., Adams, C., Akrami, M., Cede, A., Chong, J., Clémer, K., Friess, U., Gil Ojeda, M., Goutail, F., Graves, R., Griesfeller, A., Grossmann, K., Hemerijckx, G., Hendrick, F., Herman, J., Hermans, C., Irie, H., Johnston, P. V., Kanaya, Y., Kreher, K., Leigh, R., Merlaud, A., Mount, G. H., Navarro, M., Oetjen, H., Pazmino, A., Perez-Camacho, M., Peters, E., Pinardi, G., Puentedura, O., Richter, A., Schönhardt, A., Shaiganfar, R., Spinei, E., Strong, K., Takashima, H., Vlemmix, T., Vrekoussis, M., Wagner, T., Wittrock, F., Yela, M., Yilmaz, S., Boersma, F., Hains, J., Kroon, M., Piters, A., and Kim, Y. J.: Intercomparison of slant column measurements of NO2 and O4 by MAX-DOAS and zenith-sky UV and visible spectrometers, Atmos. Meas. Tech., 3, 1629–1646, https://doi.org/10.5194/amt-3-1629-2010, 2010.
Schaaf, C. B., Gao, F., Strahler, A. H., Lucht, W., Li, X., Tsang, T., Strugnell, N. C., Zhang, X., Jin, Y., Muller, J.-P., Lewis, P., Barnsley, M., Hobson, P., Disney, M., Roberts, G., Dunderdale, M., Doll, C., d'Entremont, R. P., Hu, B., Liang, S., Privette, J. L., and Roy, D.: First operational BRDF, albedo nadir reflectance products from MODIS, Remote Sens. Environ., 83, 135–148, https://doi.org/10.1016/S0034-4257(02)00091-3, 2002.
Sun, K., Zhu, L., Cady-Pereira, K., Chan Miller, C., Chance, K., Clarisse, L., Coheur, P.-F., González Abad, G., Huang, G., Liu, X., Van Damme, M., Yang, K., and Zondlo, M.: A physics-based approach to oversample multi-satellite, multispecies observations to a common grid, Atmos. Meas. Tech., 11, 6679–6701, https://doi.org/10.5194/amt-11-6679-2018, 2018.
Szykman, J., Swap, R. J., Lefer, B., Valin, L., Lee, S. C., Fioletov, V., Zhao, X., Davies, J., Williams, D., Abuhassan, N., Shalaby, L., Cede, A., Tiefengraber, M., Mueller, M., Kotsakis, A., Santos, F., and Robinson, J.: Connecting in-situ and Satellite Monitoring in Support of the Canada–U.S. Air Quality Agreement, EM: Air and Waste Management Association's Magazine for Environmental Managers, 7, 2019.
Toohey, M. and Strong, K.: Estimating biases and error variances through the comparison of coincident satellite measurements, J. Geophys. Res., 112, D13306, https://doi.org/10.1029/2006JD008192, 2007.
Tzortziou, M., Herman, J. R., Cede, A., and Abuhassan, N.: High precision, absolute total column ozone measurements from the Pandora spectrometer system: Comparisons with data from a Brewer double monochromator and Aura OMI, J. Geophys. Res., 117, D16303, https://doi.org/10.1029/2012JD017814, 2012.
Vandaele, A. C., Hermans, C., Simon, P. C., Carleer, M., Colin, R., Fally, S., Mérienne, M. F., Jenouvrier, A., and Coquart, B.: Measurements of the NO2 absorption cross-section from 42 000 cm−1 to 10 000 cm−1 (238 -1000 nm) at 220 K and 294 K, J. Quant. Spectrosc. Ra., 59, 171–184, https://doi.org/10.1016/s0022-4073(97)00168-4, 1998.
van Geffen, J. H. G. M., Boersma, K. F., Van Roozendael, M., Hendrick, F., Mahieu, E., De Smedt, I., Sneep, M., and Veefkind, J. P.: Improved spectral fitting of nitrogen dioxide from OMI in the 405–465 nm window, Atmos. Meas. Tech., 8, 1685–1699, https://doi.org/10.5194/amt-8-1685-2015, 2015.
van Geffen, J. H. G. M., Eskes, H. J., Boersma, K. F., Maasakkers, J. D., and Veefkind, J. P.: TROPOMI ATBD of the total and tropospheric NO2 data products, available at: https://sentinel.esa.int/documents/247904/2476257/Sentinel-5P-TROPOMI-ATBD-NO2-data-products (last access: 24 April 2020), 2019.
Vaughan, G., Roscoe, H. K., Bartlett, L. M., OConnor, F. M., Sarkissian, A., Van Roozendael, M., Lambert, J. C., Simon, P. C., Karlsen, K., Hoiskar, B. A. K., Fish, D. J., Jones, R. L., Freshwater, R. A., Pommereau, J. P., Goutail, F., Andersen, S. B., Drew, D. G., Hughes, P. A., Moore, D., Mellqvist, J., Hegels, E., Klupfel, T., Erle, F., Pfeilsticker, K., and Platt, U.: An intercomparison of ground-based UV-visible sensors of ozone and NO2, J. Geophys. Res., 102, 1411–1422, https://doi.org/10.1029/96JD00515, 1997.
Veefkind, J. P., Aben, I., McMullan, K., Förster, H., De Vries, J., Otter, G., Claas, J., Eskes, H. J., De Haan, J. F., and Kleipool, Q.: TROPOMI on the ESA Sentinel-5 Precursor: A GMES mission for global observations of the atmospheric composition for climate, air quality and ozone layer applications, Remote Sens. Environ., 120, 70–83, 2012.
Wang, P., Piters, A., van Geffen, J., Tuinder, O., Stammes, P., and Kinne, S.: Shipborne MAX-DOAS measurements for validation of TROPOMI NO2 products, Atmos. Meas. Tech., 13, 1413–1426, https://doi.org/10.5194/amt-13-1413-2020, 2020.
Wang, S., Pongetti, T. J., Sander, S. P., Spinei, E., Mount, G. H., Cede, A., and Herman, J.: Direct Sun measurements of NO2 column abundances from Table Mountain, California: Intercomparison of low- and high-resolution spectrometers, J. Geophys. Res., 115, D13305, https://doi.org/10.1029/2009JD013503, 2010.
Wenig, M. O., Cede, A. M., Bucsela, E. J., Celarier, E. A., Boersma, K. F., Veefkind, J. P., Brinksma, E. J., Gleason, J. F., and Herman, J. R.: Validation of OMI tropospheric NO2 column densities using direct-Sun mode Brewer measurements at NASA Goddard Space Flight Center, J. Geophys. Res., 113, D16S45, https://doi.org/10.1029/2007JD008988, 2008.
WHO: Evolution of WHO air quality guidelines: past, present and future, WHO Regional Office for Europe, Copenhagen, 2017.
Williams, J. E., Boersma, K. F., Le Sager, P., and Verstraeten, W. W.: The high-resolution version of TM5-MP for optimized satellite retrievals: description and validation, Geosci. Model Dev., 10, 721–750, https://doi.org/10.5194/gmd-10-721-2017, 2017.
Zara, M., Boersma, K. F., De Smedt, I., Richter, A., Peters, E., van Geffen, J. H. G. M., Beirle, S., Wagner, T., Van Roozendael, M., Marchenko, S., Lamsal, L. N., and Eskes, H. J.: Improved slant column density retrieval of nitrogen dioxide and formaldehyde for OMI and GOME-2A from QA4ECV: intercomparison, uncertainty characterisation, and trends, Atmos. Meas. Tech., 11, 4033–4058, https://doi.org/10.5194/amt-11-4033-2018, 2018.
Zawada, D. J., Dueck, S. R., Rieger, L. A., Bourassa, A. E., Lloyd, N. D., and Degenstein, D. A.: High-resolution and Monte Carlo additions to the SASKTRAN radiative transfer model, Atmos. Meas. Tech., 8, 2609–2623, https://doi.org/10.5194/amt-8-2609-2015, 2015.
Zhao, X., Fioletov, V., Cede, A., Davies, J., and Strong, K.: Accuracy, precision, and temperature dependence of Pandora total ozone measurements estimated from a comparison with the Brewer triad in Toronto, Atmos. Meas. Tech., 9, 5747–5761, https://doi.org/10.5194/amt-9-5747-2016, 2016.
Zhao, X., Bognar, K., Fioletov, V., Pazmino, A., Goutail, F., Millán, L., Manney, G., Adams, C., and Strong, K.: Assessing the impact of clouds on ground-based UV–visible total column ozone measurements in the high Arctic, Atmos. Meas. Tech., 12, 2463–2483, https://doi.org/10.5194/amt-12-2463-2019, 2019a.
Zhao, X., Griffin, D., Fioletov, V., McLinden, C., Davies, J., Ogyu, A., Lee, S. C., Lupu, A., Moran, M. D., Cede, A., Tiefengraber, M., and Müller, M.: Retrieval of total column and surface NO2 from Pandora zenith-sky measurements, Atmos. Chem. Phys., 19, 10619–10642, https://doi.org/10.5194/acp-19-10619-2019, 2019b.
- Abstract
- Introduction
- Datasets
- Validation schemes
- Validation results
- Discussion
- Conclusions
- Appendix A: Validation metrics and results
- Appendix B: Sensitivity tests
- Appendix C: Precision and accuracy
- Data availability
- Author contributions
- Competing interests
- Special issue statement
- Acknowledgements
- Review statement
- References