the Creative Commons Attribution 4.0 License.
the Creative Commons Attribution 4.0 License.
 | 20 May 2020
Airborne measurement of peroxy radicals using chemical amplification coupled with cavity ring-down spectroscopy: the PeRCEAS instrument
Midhun George
Maria Dolores Andrés Hernández
Vladyslav Nenakhov
Yangzhuoran Liu
John Philip Burrows
Hydroperoxyl (HO2) and organic peroxy (RO2) radicals have an unpaired spin and are highly reactive free radicals. Measurements of the sum of HO2 and RO2 provide unique information about the chemical processing in an air mass. This paper describes the experimental features and capabilities of the Peroxy Radical Chemical Enhancement and Absorption Spectrometer (PeRCEAS). This is an instrument designed to make measurements on aircraft from the boundary layer to the lower stratosphere. PeRCEAS combines the amplified conversion of peroxy radicals to nitrogen dioxide (NO2) with the sensitive detection of NO2 using cavity ring-down spectroscopy (CRDS) at 408 nm. PeRCEAS is a dual-channel instrument, with two identical reactor–detector lines working out of phase with one another at a constant and defined pressure lower than ambient at the aircraft altitude. The suitability of PeRCEAS for airborne measurements in the free troposphere was evaluated by extensive characterisation and calibration under atmospherically representative conditions in the laboratory. The use of alternating modes of the two instrumental channels successfully captures short-term variations in the sum of peroxy radicals, defined as (, with R being an organic chain) in ambient air. For a 60 s measurement, the detection limit is < 2 pptv for a minimum (2σ) NO2 detectable mixing ratio < 60 pptv, under laboratory conditions in the range of atmospheric pressures and temperatures expected in the free troposphere. PeRCEAS has been successfully deployed within the OMO (Oxidation Mechanism Observations) and EMeRGe (Effect of Megacities on the transport and transformation of pollutants on the Regional and Global scales) missions in different airborne campaigns aboard the High Altitude LOng range research aircraft (HALO) for the study of the composition of the free troposphere.
- Article
(4684 KB) - Full-text XML
-
Supplement
(678 KB) - BibTeX
- EndNote


Hydroperoxyl (HO2) and organic peroxy (RO2) radicals that have an unpaired spin are highly reactive free radicals. They play important roles in the tropospheric chemistry. During the day, they are formed in the atmosphere following the oxidation of carbon monoxide (CO), methane (CH4) and many volatile organic compounds (VOCs). They participate in catalytic cycles, which produce and destroy ozone (O3). Their temperature-dependent reactions form temporary reservoirs, e.g. peroxynitrates such as peroxyacetyl nitrate (PAN; CH3COO2NO2), which are transported in the troposphere. In the presence of sufficient NOx (nitrogen monoxide, NO, plus nitrogen dioxide, NO2), the reaction of HO2 with NO forms NO2 and the hydroxyl radical (OH) which is the most important tropospheric oxidising agent. The organic oxy-radicals (RO), which contain hydrogen atoms, often react with molecular oxygen (O2) to form HO2 and oxygenated volatile organic compounds (OVOCs), such as aldehydes and ketones. The latter are oxidised by OH and photolysed to ultimately produce HO2 and RO2.
Overall, HO2 and RO2 influence the amounts and distributions of OH and O3 and thus the oxidising capacity of the troposphere. Consequently, knowledge about the spatial distribution and concentration of HO2 and RO2 is essential to test the present understanding of the tropospheric chemistry.
The HO2 and RO2 concentrations and mixing ratios are small because of their high reactivity. Consequently, their measurement requires sensitive and accurate techniques. With the exception of the freezing of air and subsequent use of the matrix isolation electron spin resonance technique (MIESR; Mihelcic et al., 1985), there are no direct spectroscopic measurements of HO2 or RO2, which have been applied successfully in ambient air. Alternatively, indirect measurement techniques have been developed. The chemical amplification technique (Cantrell and Stedman, 1982; Hastie et al., 1991) has been used to measure the sum of peroxy radicals. Peroxy radical chemical amplification (PeRCA) converts by addition of NO and CO, HO2 and most atmospherically significant RO2 to NO2. The OH formed in the reaction cell reacts with CO to reform HO2 in a chain reaction. Hydroxyl, alkoxyl, hydroperoxyl and alkylperoxyl radicals () are converted into NO2. As the RO and OH abundances in the troposphere are much lower than those of HO2 and RO2, PeRCA measures to a good approximation the sum of peroxy radicals collectively known as (; R being any organic chain), which convert NO to NO2. The rate coefficients of the HO2 and RO2 reactions with NO are very similar (Lightfoot et al., 1992). Large RO2 which do not react with NO to form NO2 are not detected and are assumed to be negligibly small compared to the sum of concentrations. HO2 and CH3O2 are the dominant peroxy radicals present in an air mass in most conditions.
A variant on the CO chemical amplification is used in the Ethane Chemical AMPlifier (ECHAMP). As its name implies, this uses ethane (C2H6) rather than CO for the amplification of atmospheric peroxy radicals (Wood et al., 2017). Although the amplification is lower than for CO, the chain length appears to be less sensitive to humidity effects (Duncianu et al., 2020). Chemical amplification using a CO and SO2 chain conversion in combination with chemical ionisation mass spectrometry (CIMS) has been used for the measurement of (Reiner et al., 1997; Hanke et al., 2002). In a further development, Edwards et al. (2003) and Hornbrook et al. (2011) described a PerCIMS instrument with two measurement modes (HO2 and ΣRO2). The separation is achieved by varying NO, SO2 and O2 concentrations, which changes the relative sensitivities to HO2 and RO2. Recently, the use of iodide and bromide as primary ions in CIMS for the measurement of HO2 has been reported (Sanchez et al., 2016; Albrecht et al., 2019). Further investigation on the instrumental background signal is required before deploying this technique in the field.
HO2 has also been successfully measured by the conversion of HO2 to OH, which is then measured by laser-induced fluorescence (LIF). The technique, also known as fluorescence assay by gas expansion (FAGE), was pioneered by Hard et al. (1984) and further modified by several scientific groups (Creasy et al., 1997; Kanaya et al., 1999; Holland et al., 2003; Faloona et al., 2004). Potential spectral and chemical interferences have been investigated in detail (Ren et al., 2004). The interference by some RO2 radicals into the HO2 signal reported by Fuchs et al. (2009, 2010, 2011) is minimised by controlling the NO concentration added for conversion into OH (Whalley et al., 2013; Lew et al., 2018).
In the last decades, ground-based measurements of and HO2 have been successfully made in a variety of environments (Monks et al., 1998, 2009 and references herein; Burkert et al., 2001a, b; Carslaw et al., 2002; Fleming et al., 2006a, b; Emmerson et al., 2007; Qui et al., 2007; Kanaya et al., 2007, 2012; Hofzumahaus et al., 2009; Andrés-Hernández et al., 2009, 2010; Mao et al., 2010; Kukui et al., 2014; Lelieveld et al., 2018; Tan et al., 2017). The majority of measurements of or HO2 were made in field campaigns which studied different aspects of the chemistry in the lower troposphere. These case studies have considerably improved the knowledge of the role of HO2 and RO2 in tropospheric boundary layer chemistry. In contrast, the number of unequivocal measurements of peroxy radicals in the free troposphere is still quite limited.
Airborne measurements offer a unique opportunity to measure HO2 and RO2 in the free troposphere. However, the temporal and spatial variability in the chemical composition of the air masses make the measurement from airborne platforms challenging. High instrumental accuracy, sensitivity and specificity are required to unequivocally identify and quantify potential spectral and chemical interferences (Green et al., 2002, 2006; Zanis et al., 2003; Clemitshaw, 2004 and references herein; Heard 2006, and references herein; Stone et al., 2012 and references herein; Ren et al., 2012). In addition, each particular airborne platform has unique capabilities but also limitations (e.g. mechanical, electrical and safety constraints) compared to ground-based or ship-board platforms. As a result of the above, instruments to measure airborne HO2 and are usually designed and optimised for use on a specific aircraft platform.
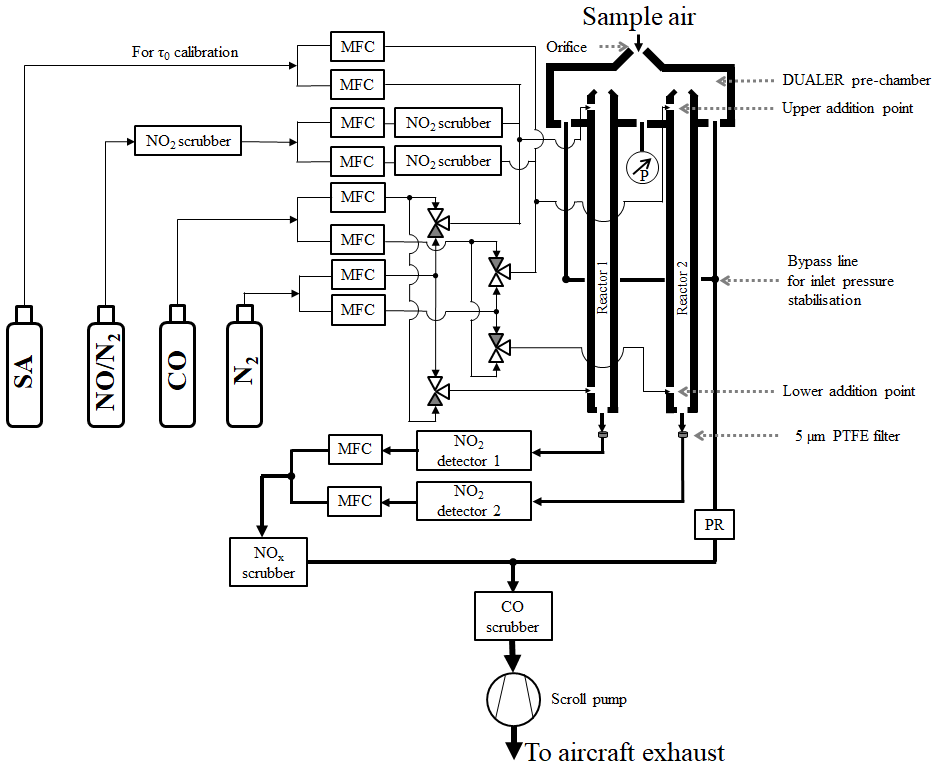
Figure 1Schematic diagram of the PeRCEAS instrument. SA: synthetic air; NO∕N2: mixture of NO in N2.
The Peroxy Radical Chemical Enhancement and Absorption Spectrometer (PeRCEAS) was designed by the Institute of Environmental Physics of the University of Bremen (IUP-UB) for the airborne measurement of in the free troposphere and lower stratosphere and for its deployment aboard the High Altitude LOng range research aircraft (HALO; http://www.halo.dlr.de, last access: 7 April 2020). PeRCEAS combines the PeRCA and the cavity ring-down spectroscopy (CRDS) techniques in a dual-channel instrument for the determination of . The principle of these well-known techniques and their application to the measurement have been described in detail in a previous publication (Hortsjann et al., 2014).
In an instrument using the PeRCA technique, the probed radicals are converted into an amplified amount of NO2 by adding NO and CO in excess to the sampled air in the inlet. A modulated NO2 signal is obtained by alternating the position of the CO addition between the so-called amplified or amplification and non-amplified or background modes. These modes respectively facilitate or suppress the conversion of radicals into NO2. Sampled O3 is converted to NO2 in the reactor. The background signal comprises the sum of ambient NO2, O3 and any NO2 produced within the system (e.g. from the thermal decomposition of peroxyacyl nitrates like PAN). The instrumental amplification factor, the so-called effective chain length (eCL = , where ΔNO2 is the NO2 formed by the chemical amplification), depends on loss of peroxy radicals during the sample passage through the instrument to the detector by physical processes or chemical reactions resulting in non-radical products. As a result, the specific instrumental characteristics and the measurement conditions determine the eCL (Cantrell and Stedman, 1982; Cantrell et al., 1984, 1996; Hastie et al., 1991; Clemitshaw et al., 1997; Kartal et al., 2010).
In CRDS (O'Keefe and Deacon, 1988; Atkinson, 2003; Brown, 2003; Berden and Engel, 2010 and references herein), which is now a well-established spectroscopic measurement technique, a monochromatic electromagnetic radiation pulse is trapped inside a high-finesse optical cavity and the time decay of the intensity is measured. The concentration of an absorber of interest is calculated from the decay times of the electromagnetic radiation pulse to 1∕eth of its initial value, the so-called ring-down time, for a resonator containing (τ) or not containing (τ0) the absorber. In PeRCEAS, the absorber of interest is NO2, which is formed in both the amplification and the background modes.
The ambient concentrations measured by PeRCEAS are then retrieved from the difference in the ring-down times of the background and amplification modes of operation, provided that τ0 and the total scattering do not change substantially during two consecutive sampling modes:
where α1,τ1 and α2, τ2 are, respectively, the absorption coefficients and ring-down times for the background and amplification modes in the inlet, n is the refractive index of the medium, c0 is the speed of light in vacuum, is the absorption cross section of NO2, and eCL is characteristic for each particular setup.
PeRCA and absorption spectroscopy using high-finesse optical cavities have been recently used for ground-based measurements of radicals (Liu et al., 2009; Wood and Charest, 2014; Chen et al., 2016). PeRCEAS addresses the particular constrains related to airborne measurement by optimising the conversion of probed radicals in the reactor and the accuracy of the NO2 measurement.
In this study, the specifications and airborne performance of PeRCEAS are described, based on thorough and extensive laboratory characterisations and calibrations. The present study builds on the experience gained from the PeRCEAS deployment in three airborne measurement campaigns in the framework of the Oxidation Mechanism Observations (OMO; see https://www.mpic.de/3599603/OMO, last access: 9 May 2020) mission in 2015 and Effect of Megacities on the transport and transformation of pollutants on the Regional and Global scales (EMeRGe; see http://www.iup.uni-bremen.de/emerge/, last access: 7 April 2020) missions in 2017 and 2018 aboard the HALO platform.
The PeRCEAS airborne instrument, shown schematically in Fig. 1, comprises essentially the DUALER (DUal channel Airborne peroxy radical Chemical AmplifiER) inlet installed inside a pylon located on the outside of the HALO fuselage and two CRDS NO2 detectors mounted in a rack inside the HALO cabin. The first laboratory prototype reported by Hortsjann et al. (2014) has been significantly improved using the experience gained from the deployments in HALO missions. The following description of the instrument focuses on the modified and optimised features of PeRCEAS.
Briefly, sample air enters PeRCEAS through the DUALER pre-chamber, which is at a lower pressure than that outside of the HALO, through an orifice in a truncated cone, i.e. a nozzle. From this pre-chamber, the air is pumped simultaneously through the two flow reactors and a bypass line. At the upper addition point, a mixture of CO or N2 and NO enters each reactor. At the lower addition point, a flow of N2 or CO enters each reactor. This enables the CO and N2 flows in the two reactors within the DUALER to be switched simultaneously but to be out of phase with one another from the upper to the lower addition point. At the addition points, the reagent gases enter the reactor through eight circular distributed 1 mm holes to facilitate the rapid mixing with the sampled air. During measurements, the pressure in the pre-chamber and both reactors is held constant. However, there is a small pressure fluctuation during the switching of flows between the upper and lower mixing point. The flow passing through each reactor enters a CRDS NO2 detector. Afterwards, the sample flows together with the air from the bypass line are scrubbed for CO and NOx and exhausted by the pump.
The DUALER inlet comprises two PeRCA chemical reactors having alternating measurement modes, which are out of phase with one another. During the first part of the measurement cycle, the first reactor and detector are in amplification mode, while simultaneously the second reactor and detector are in background mode. In the second part of the cycle, the CO addition point in both reactors is switched. Consequently, the first reactor and detector are then in background mode while the second reactor and detector are in amplification mode. In the analysis of the measurements, the amplification and background signals from both detectors are combined appropriately. This improves accuracy and temporal resolution of the resultant data set (see Sect. 3.1).
In the DUALER, a stable pressure in the pre-chamber is achieved by a pressure regulator, which controls the flow through the bypass line. The flow rate through the reactors is held constant during measurements. Consequently, when the outside air pressure varies, the bypass flow rate from the pre-chamber changes. The outer dimensions, shape, form and weight of the DUALER are constrained by the inlet pylon in use with the research aircraft HALO. After the first version of the DUALER (from now on called DUALER I) was flown, the inner dimensions of the pre-chamber were further optimised to reduce wall losses and turbulence in the pre-chamber. For this, in DUALER II, the volume of the pre-chamber was increased by extending its vertical extent, the length of the truncated cone on top of the reactors was reduced by 3 mm, and the volume of the reactors was increased to 130.5 mL from the 112 mL in DUALER I. These changes resulted in a higher eCL and improved pressure stability in DUALER II as compared to DUALER I. Figure 2 shows the upper part of both DUALER I and DUALER II.

Figure 2Graphical 3D representation of the upper part of the DUALER I and DUALER II inlets. Pre-chamber volume DUALER I is 75.25 cm3; reactor volume DUALER I is 112 cm3; pre-chamber volume DUALER II is 119.57 cm3; reactor volume DUALER II is 130.5 cm3.
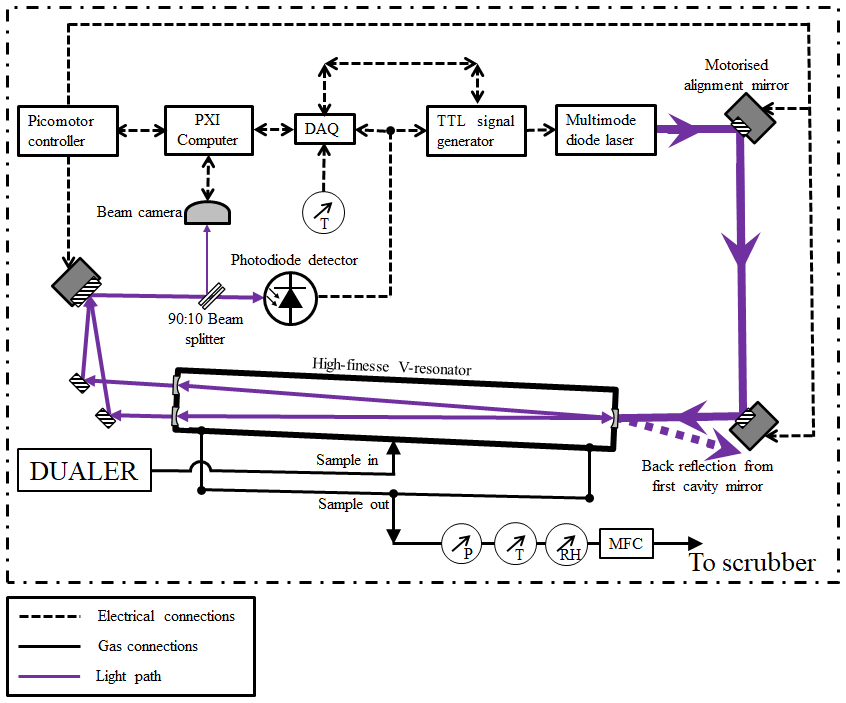
The improvements of the PeRCEAS CRDS detectors for NO2 targeted the signal stability and the in-flight adjustment of the optical alignment. The optical cavity remains similar to that described in Horstjann et al. (2014); i.e. a V resonator of approximately 100 cm3 volume formed between glued highly reflective mirrors (reflectivity, R, of 99.995 %; diameter, d, of 0.5”(1.27 cm); radius of curvature, roc, of 100 cm, AT Films, USA) on the side of a Teflon-coated aluminium cuboid. As shown in Fig. 3, the current NO2 detector houses a 100 mW continuous wave multimode diode laser (Stradus 405, wavelength approximately 408 nm, max 100 mW output power, Vortran Laser Technology Inc.). With this, the fine adjustment of the laser is simplified and improved, and the piezoelectric stack used to achieve mode matching between the single-mode laser and the optical cavity in Hortsjann et al. (2014) becomes unnecessary and is removed. The laser is aligned to the V resonator using two motorised alignment mirrors (0.5” aluminium mirrors mounted on Newport 8885 Picomotor actuated pint-sized centre mounts). These enable the correction of any misalignment arising from mechanical displacement of the optical elements with respect to the V resonator due to vibration or mechanical shocks during transport, installation or in-flight measurement. During alignment procedures and for test purposes, a beam camera (BM-USB-SP907-OSI, Ophir Spiricon Europe GmbH) monitors the beam profile and simplifies the identification of misalignments or loss of performance of the optical system.
Concerning the data acquisition and processing, the system is equipped with the current National Instruments PXI-8840 computer with two PXI-6132 DAQ cards working with 1 M sample s−1 to measure the ring-down signal from both detectors. Other sensor data such as pressure, flow, temperature and humidity are measured with a PXI-6129 DAQ card at a rate of 1 sample s−1.
Three identical interchangeable detectors, hereafter named Abbé (AB), Fraunhofer (FH) and Fresnel (FR), have been constructed and characterised at the IUP-UB, of which two are always simultaneously deployed in measurement campaigns.
Additional components used to operate PeRCEAS such as mass flow and pressure sensors/controllers, gas cylinders and electronics are mounted in the main rack, as described in Hortsjann et al. (2014). The instrument rack in the aircraft cabin is connected to the DUALER through an aperture plate. Other ancillary parts of the PeRCEAS, such as the vacuum pump, a secondary containment for dangerous gases (CO), a scrubber unit for NOx∕CO and the rest of gas cylinders, are also installed in the aircraft cabin.
The mode of operation of PeRCEAS is optimised by systematically investigating the short- and long-term stability of the detector signal and the effect of potential interferences. Factors affecting the overall performance of PeRCEAS for airborne measurements are discussed in the following sections.

Figure 4PeRCEAS measurement cycle during the laboratory measurement of 15 pptv of HO2; panels (a) and (b) show the ring-down time of detectors 1 (D1) and 2 (D2) in both amplification (AP) and background (BG) modes, and the retrieved ΔNO2. The ΔNO2 and the eCL of the respective reactors are used to retrieve the HO2 mixing ratio in panel (c). The blue shading in panel (c) corresponds to the calculated HO2 mixing ratio produced in the source (2σ uncertainty).
3.1 Measurement modes: integration time
The mode time is defined as the time selected for the measurement in either amplification or background mode. The modulation time is the time taken for a complete measurement cycle, which comprises the sum of one amplification and one background mode. The PeRCEAS measurement cycle is illustrated in Fig. 4. The ΔNO2 for each detector is calculated from the ring-down time of two consecutive modes using Eq. (1). If the mode time is adequately selected, the retrieved per measurement cycle is identical in both measurement lines, as the two reactors are operated out of phase with one another. The final data are calculated as the mean of the determined from the ΔNO2 and the eCL of both detectors for a given measurement cycle. The time resolution of the measurement is then equal to the mode time. After switching modes, a small pressure pulse leads to an oscillation of the NO2 signal. Consequently, the first 20 s of each mode are not used in data analysis. The time lag arising from the time taken for the sample flow between the CRDS detector and the point of switching is typically less than 8 s.
Typically, 650 to 800 ring-down times of the NO2 absorption are averaged per second and the measurement of NO2 is made at 1 Hz. Individual ring-down times are occasionally saved for sensitivity studies. Modulation and mode times are selected empirically. The optimised values are a compromise between the time taken for the detector signal to stabilise after the CO∕N2 flow is switched between the addition points and the temporal variability of the chemical composition of the air probed.
To optimise the mode time and the modulation cycle, the Allan variance (Allan, 1966; Werle et al., 1993) was analysed for PeRCEAS. Given a time series of N elements and a total measurement time tacq, , where facq is the frequency of acquisition, the Allan variance is defined as
where xi is the mean over a time interval of a length τ, being ; and m the number of elements in a selected interval. The use of 〈…〉 denotes the arithmetic mean. The square root of the Allan variance is the Allan deviation. For random noise, the Allan deviation at any given integration time determines the detection limit of the measurement.
The Allan variance plot for measurements of 5.6 ppbv NO2 at 200 mbar and 23 ∘C is shown in Fig. 5. As can be seen, the optimal averaging time for the three PeRCEAS detectors is in the range between 20 and 50 s. The corresponding minimum (2σ) detectable mixing ratio is < 60 pptv (3.15×10⁸ molec. cm−3 for these P and T conditions). Slow temperature drifts over longer averaging times impact both the laser and the resonator characteristics. This behaviour is observed for averaging times longer than 60 s.
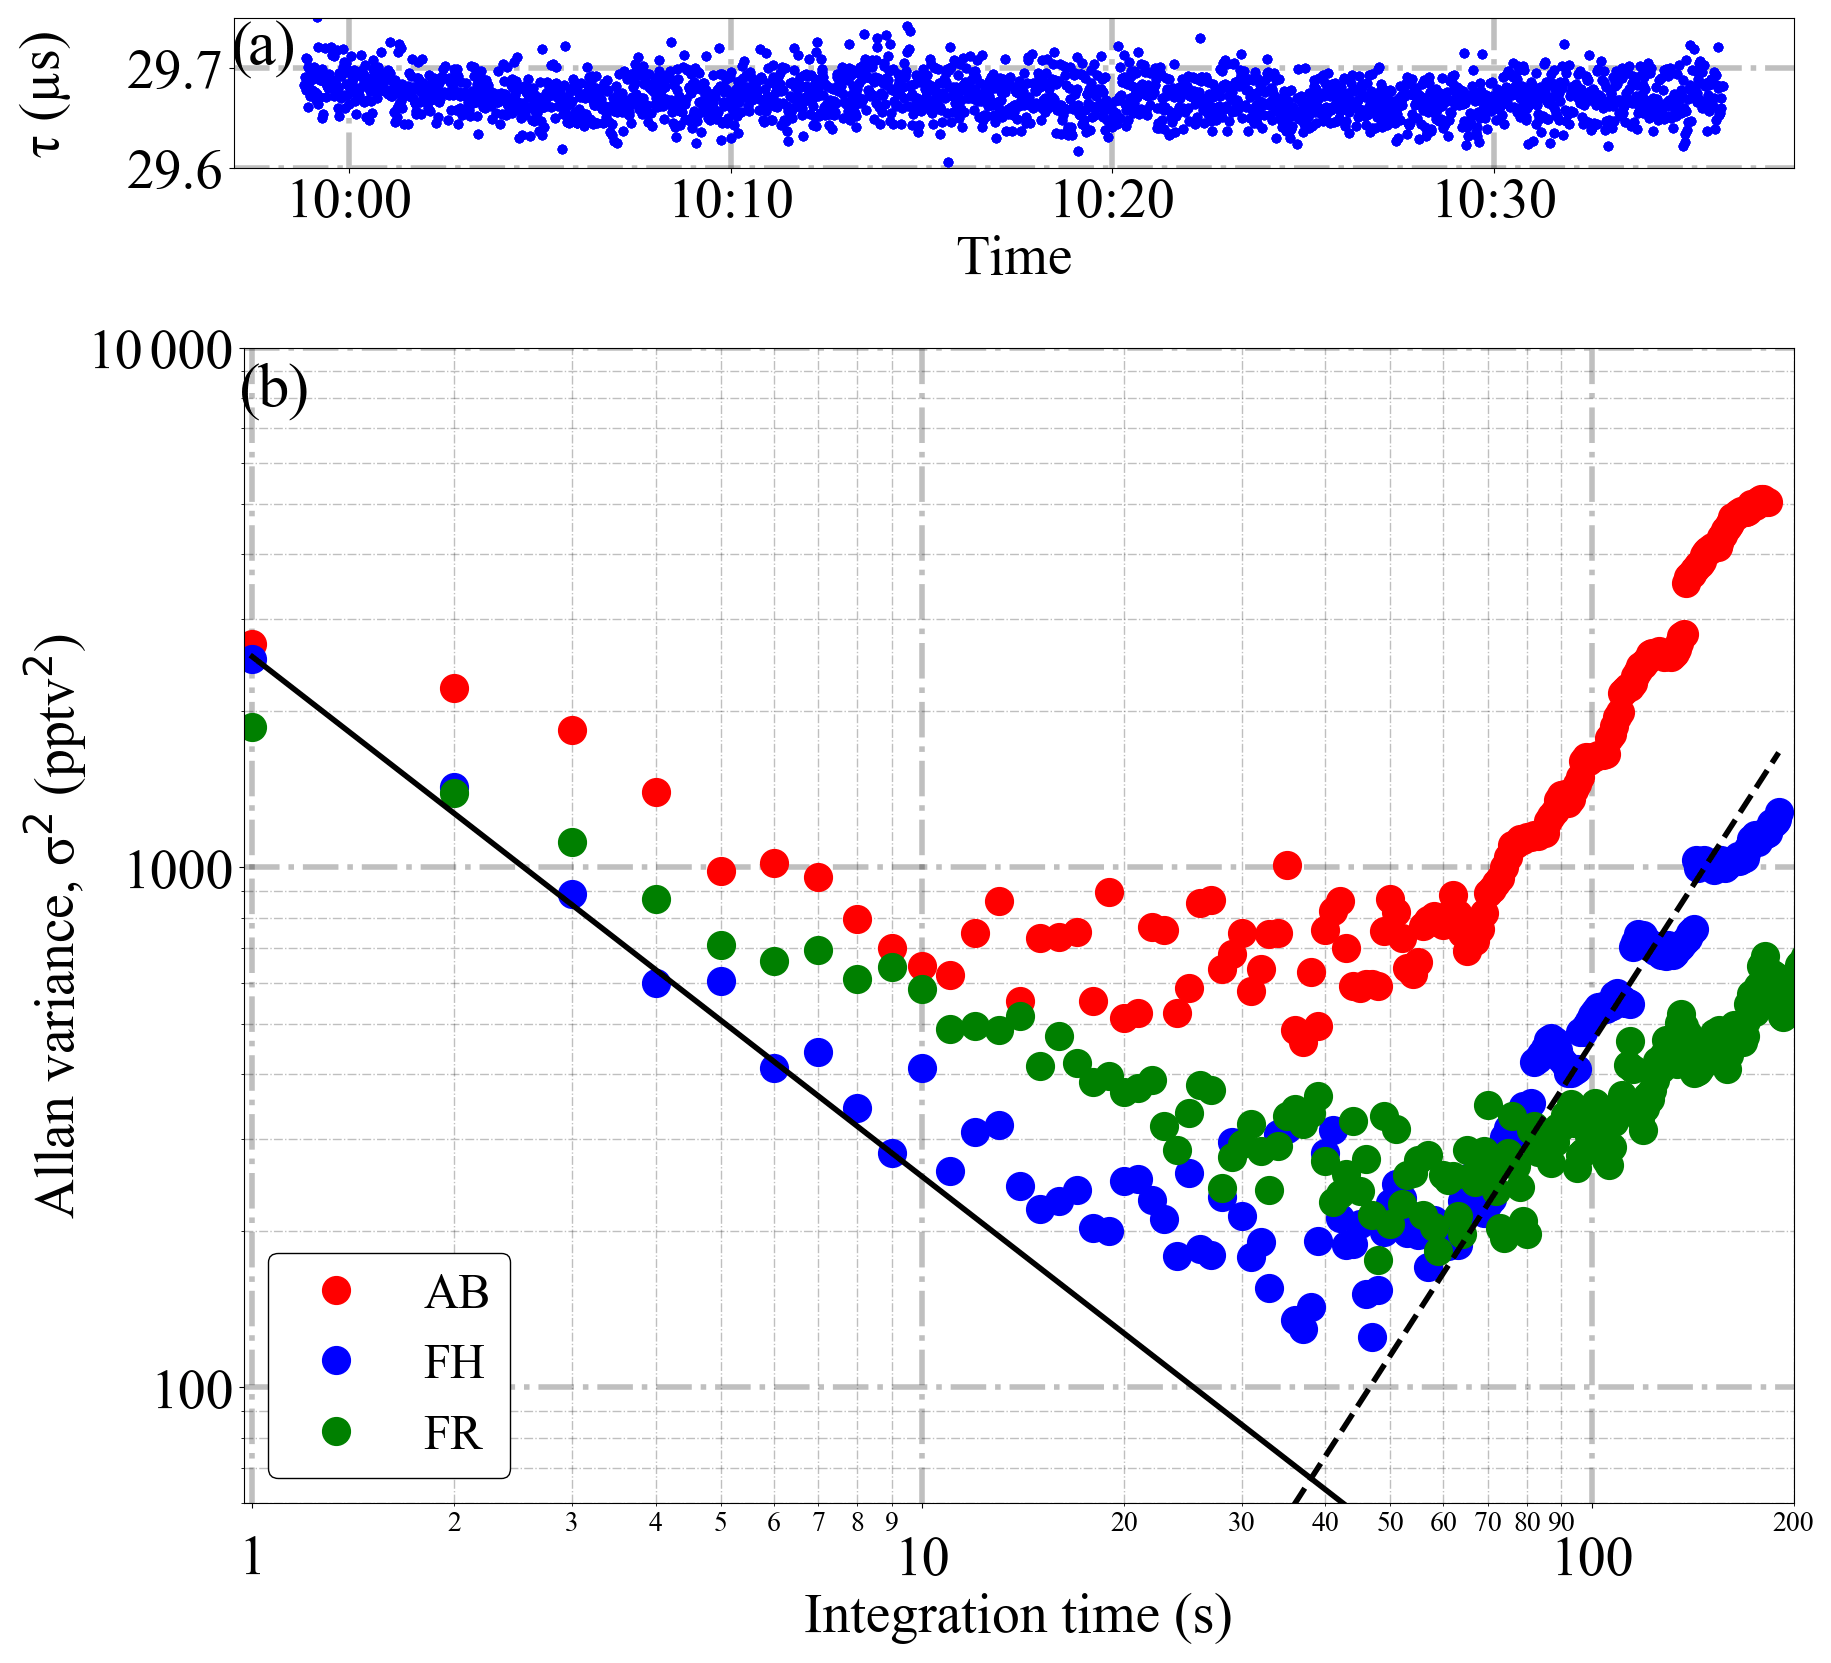
Figure 5Analysis of the Allan variance of PeRCEAS measurements made in the laboratory: (a) 40 min of data from detector FH used for the calculations, (b) Allan variance for a mixture of 5.6 ppbv of NO2 in air at 200 mbar and 23 ∘C sampled by the AB, FH and FR PeRCEAS detectors. The solid and dashed lines show, respectively, the theoretical behaviour of random noise (i.e. photon shot noise) and the noise attributed to longer timescale drifts.
In addition to random noise, systematic noise in the measurement arises from instability of the laser and or that of the detector response over the modulation time. This is decisive for the overall accuracy of the determination. As mentioned in the introduction, the ambient concentrations are calculated from the CRDS detector signals using Eq. (1). This assumes that the variation of τ0 has a negligible impact over two consecutive modulation periods.
Temperature changes of the detector affect (i) the diode laser emission, both its amplitude and wavelength, and (ii) the mode matching between laser and detector, and consequently the τ0. The effect of the variations in τ, resulting from changes in room or HALO cabin air temperatures, on the accuracy and precision of the ΔNO2 determination was investigated by a series of laboratory experiments. For this, modulated concentrations of NO2 in the flow were generated by alternating between two selected NO2 concentrations once per minute. The temperature of the CRDS detector (T) and τ were then measured. Detector temperature gradients over a time t, i.e. ΔT∕Δt, determined by the temperature within the detector housing close to the photodiode, were induced by controlled changes in the room temperature.

Figure 6Effect of varying room temperature on the ring-down time τ and the ΔNO2 accuracy: (a) detector temperature, (b) τ for a modulated NO2 flow and the corresponding NO2 mixing ratios, and (c) ratio of the measured to the set ΔNO2. The error bars in panel (c) are estimates of the total uncertainty of the retrieved ΔNO2. The inset in panel (b) is a magnification of three modulation cycles. The first 20 s of each signal after a change in the NO2 mixing ratio are not used in the analysis (see text).
Figure 6 shows the effect of introducing temperature perturbations in a modulated NO2 signal between 11.5 and 12.1 ppbv measured at 200 mbar and 23 ∘C. As can be seen in the figure, a temperature perturbation affects both precision and accuracy of the retrieved ΔNO2. For temperature gradients up to ∘C h−1, the experimental precision of the ΔNO2 determination (2σ) remains within 150 pptv ( molec. cm−3 at 200 mbar and 23 ∘C).
Using the results from the sensitivity and calibration studies above, a 60 s mode time and a 120 s modulation time is selected as providing the optimal signal to noise ratio of the ΔNO2 at a significance level for 2σ error < 3.15×10⁸ molec. cm−3.
3.2 Sample flows and residence times
Sample and reagent gas flows have different and related impacts on the sensitivity of the PeRCEAS measurements. The rate of the sample flows determines the residence time in different parts of the flow system, which in turn determines the reaction time for the conversion of to NO2, the titration of the O3 in the sampled ambient air and the thermal decomposition of peroxynitrates, and peroxynitric acid (HO2NO2), which can produce an NO2 interfering signal. Interferences are minimised by a short residence time, facilitated by a rapid flow. Conversely, the to NO2 conversion rate in the DUALER is determined by the concentration of the CO and NO reagent gases added. The eCL increases with the increase in CO added to the sample (Reichert et al., 2003). Laboratory tests comparing the performance of PeRCEAS using alternative gases showed that CO is the most suitable gas to convert OH back to HO2 in the chain reaction used in the chemical amplification. However, CO is a toxic and flammable gas with a lower explosive limit (LEL) in air of 12.5 % v∕v at room temperature and atmospheric pressure. This LEL is the minimum concentration necessary to support the gas combustion along with an ignition source such as a spark or flame (Zabetakis, 1965). Consequently, safety considerations limit the maximum flow of CO.
NO participates in both the chain carrier and chain termination reactions as explained in detail elsewhere (e.g. Hastie et al., 1991; Mihele et al., 1999). For a constant CO concentration, these reactions of NO determine the eCL at different pressures. Increasing NO in the reactor changes the sensitivity of the amplification to different peroxy radicals due to the termolecular reaction of RO with NO forming RONO2. Also, the termolecular reaction of RO2 with NO leading to RONO2 increases with increasing size for alkylperoxy radicals but remains < 20 % (Lightfoot et al., 1992; Tyndall et al., 2001).
The rate of titration of the sampled O3 by NO to form NO2 also depends on the concentration of NO added to the sample flow and the time for reaction before reaching the detector.
As a result of the above, the flows of the sampled ambient air, NO and CO and the pressure in the DUALER are selected for each deployment of PeRCEAS. The selections are a compromise between safety requirements, which limit the amount and concentration of gases aboard HALO, and the values of eCL achieved for a particular residence time.
3.2.1 Effective chain length
The eCL of the DUALER reactors is determined in the laboratory by using a calibrated source of peroxy radicals. The latter uses the photolysis of water vapour at 184.9 nm (Schultz et al., 1995). Briefly, a known water vapour–air mixture is photolysed by a low-pressure mercury (Hg) lamp. A nitrous oxide (N2O) absorption filter attenuates the intensity of 184.9 nm radiation. This is achieved by varying the N2O∕N2 ratio in the filter absorption zone. The photolysis of H2O makes OH and H. In air, the H reacts with O2 in a termolecular reaction to make HO2. The photolysis of oxygen molecules yield oxygen atoms (O), which react with O2 in a termolecular reaction to make O3 (Reichert et al., 2003). CO is added to the gas mixture in the source to convert the OH into HO2 radicals. As a result, each absorbed photon by a water vapour molecule generates two HO2 molecules. Alternatively, the addition of a hydrocarbon (RH) leads to the conversion of OH to a RO2 and consequently to a 1:1 mixture of HO2 and RO2 for calibration. The concentration of HO2 or RO2, and O3 is thus proportional to the intensity of the 184.9 nm electromagnetic radiation. As the absorption coefficient of N2O (Cantrell et al., 1997) does not change significantly around 185 nm ( cm2 molec.−1 at 25 ∘C with a cm2 molec.−1 K−1, temperature dependency), different HO2 and RO2 radical amounts can be produced for a constant H2O concentration. A flow reactor providing a known amount of HO2 or in a laminar flow is placed inside a pressure chamber, having a vacuum-sealed connection to the DUALER inlet. This setup is described in detail elsewhere (Kartal et al., 2009; Horstjann et al., 2014). For the HO2 calibration configuration, the HO2 concentrations are calculated using
The value for the absorption cross section of H2O at 184.9 nm, cm2 molec.−1, is taken from Cantrell et al. (1997) and Hofzumahaus et al. (1997), while the O2 effective cross section is determined experimentally for the particular Hg lamp used for calibration and the measurement conditions (Creasey et al., 2000; Hofzumahaus et al., 1997; Kartal et al., 2010).
HO2 and 1:1 HO2:CH3O2 mixtures are generated at controlled pressures within expected airborne concentration ranges by adding 0.35 % of CO or CH4, respectively, to the humidified air in the calibration flow tube. Radical mixing ratios are changed every 10 min and stepwise from 8 to 150 pptv. The PeRCEAS eCL is determined as the slope of the measured NO2 versus the calculated radical mixing ratios in the calibration flow tube. The O3 generated by the radical source is converted in the DUALER to NO2 by its reaction with NO, which is in excess. Therefore, the O3 entering the reactor during the radical calibration is detected as NO2 in the background and amplified signals.
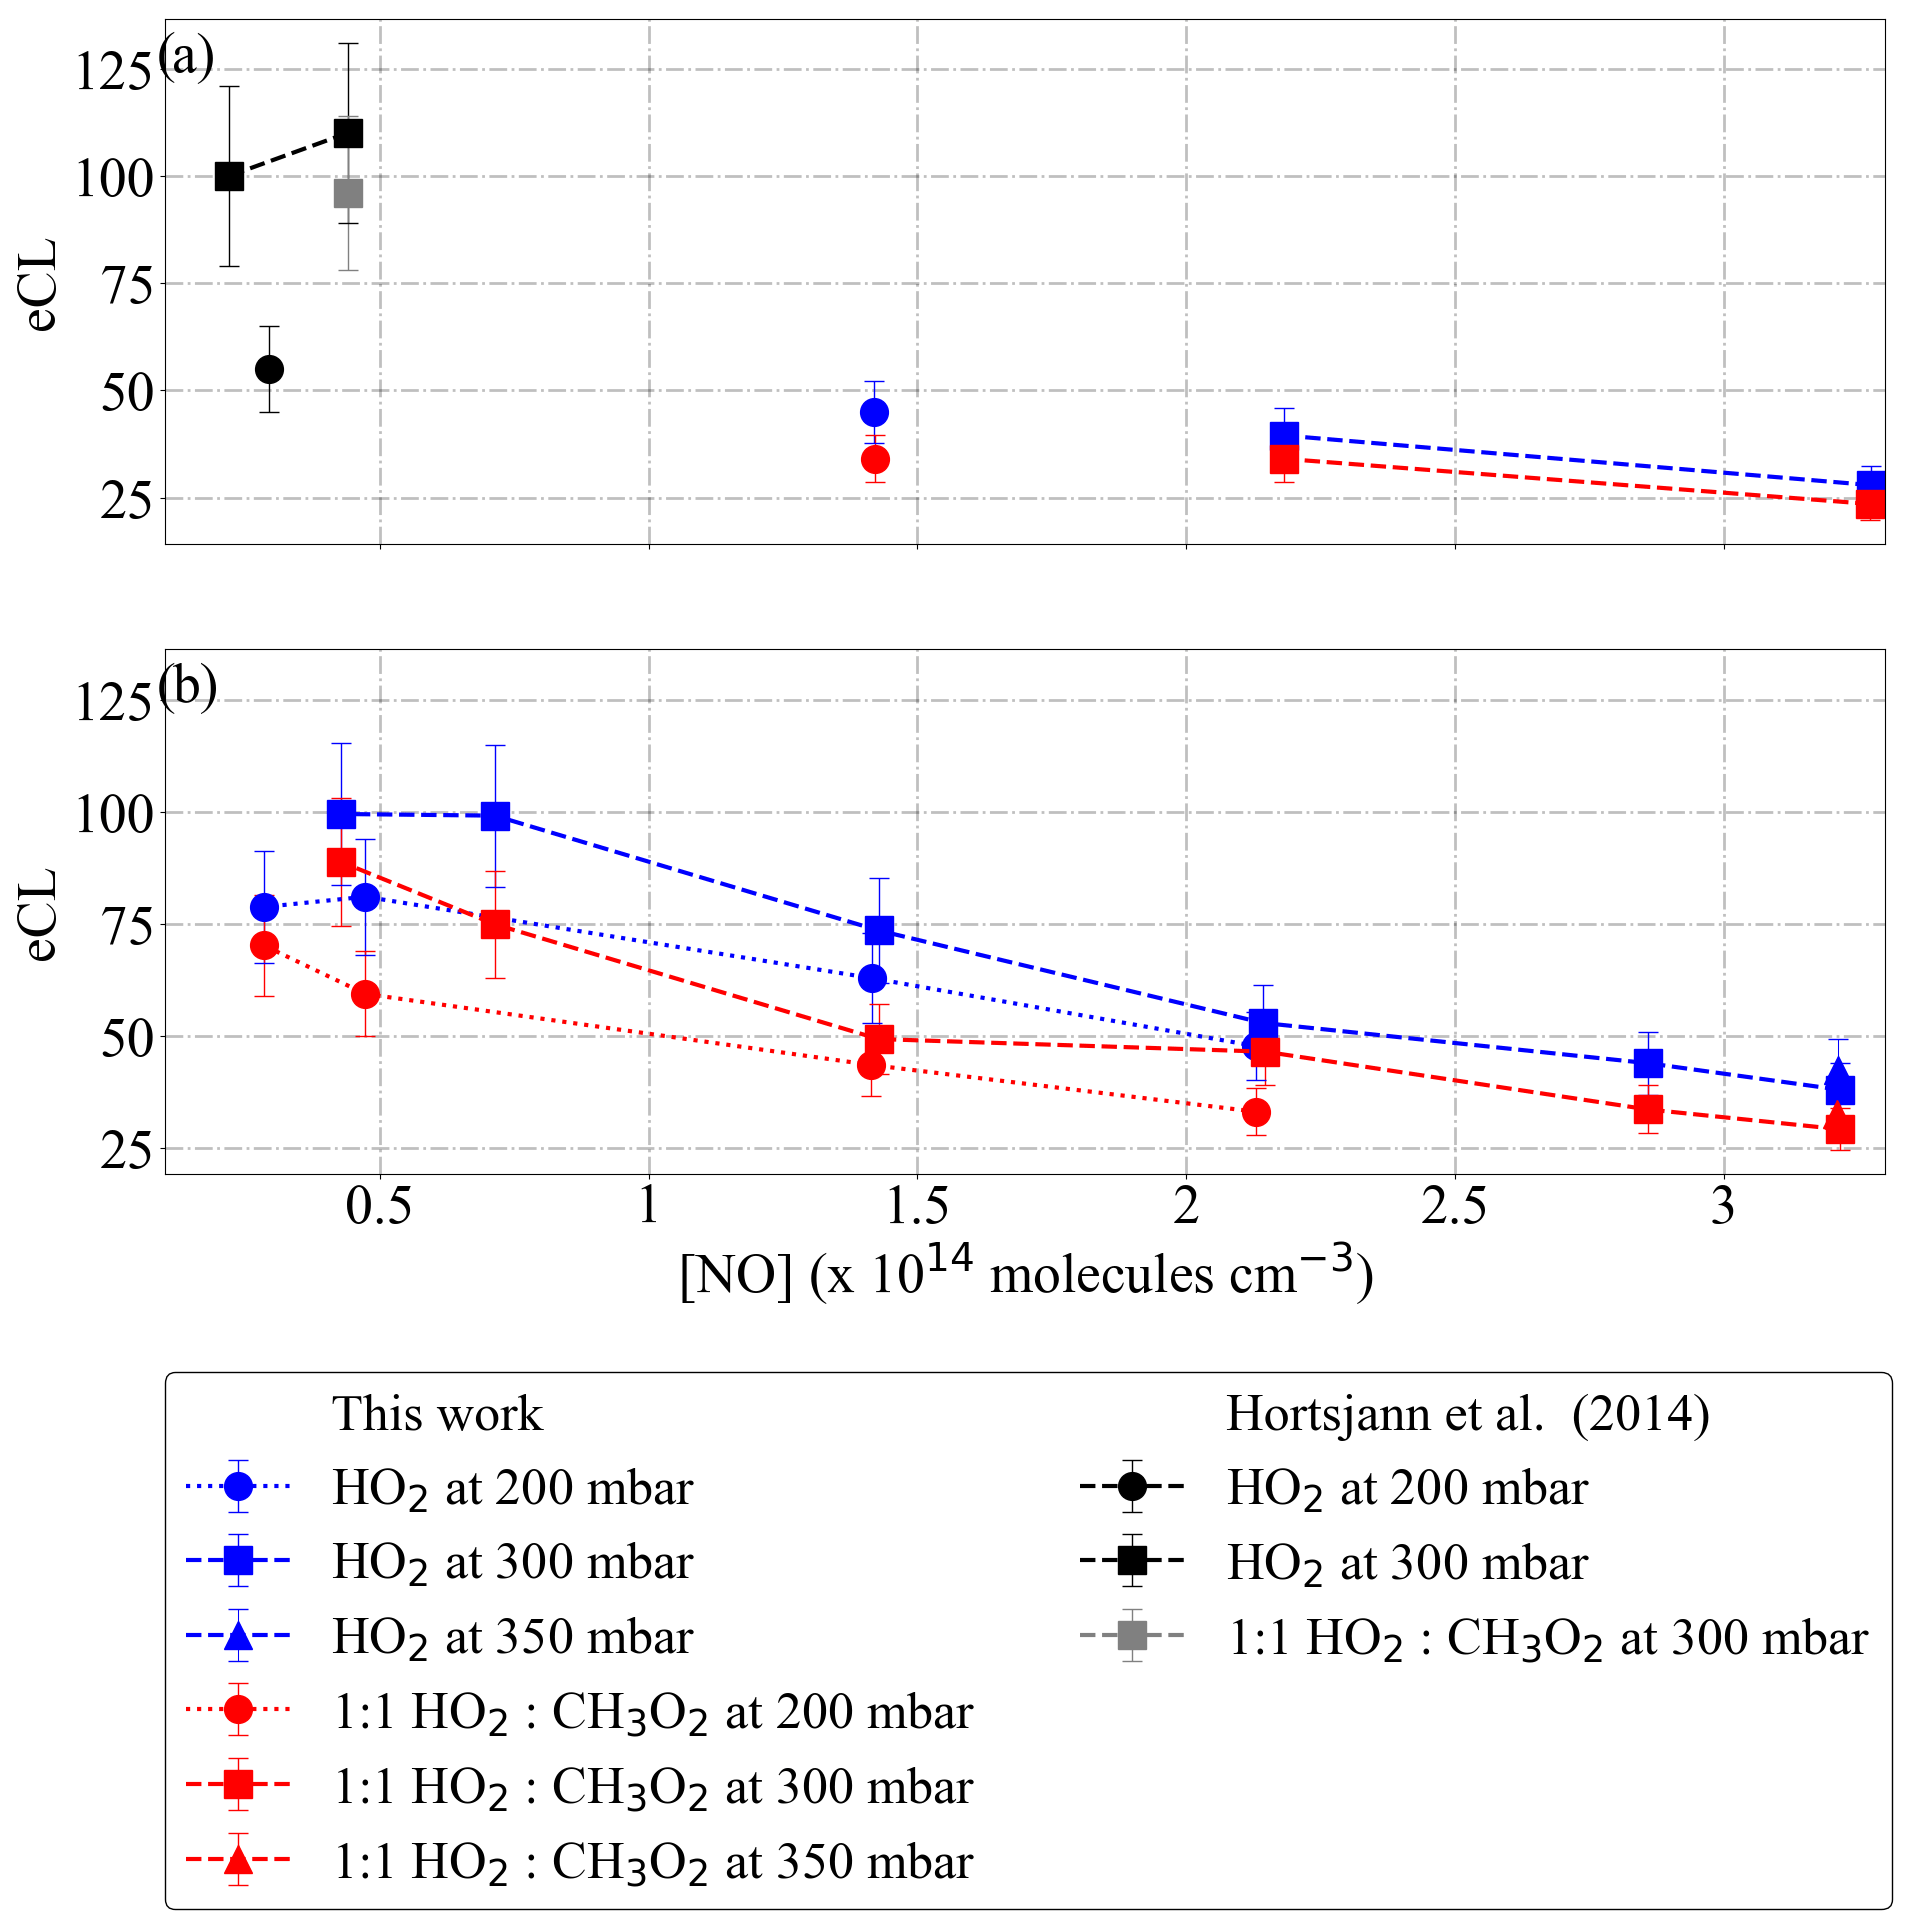
Figure 7eCL versus [NO] measured for (a) DUALER I and (b) DUALER II at inlet pressures between 200 and 350 mbar. The radical source flow tube is held at a pressure of 500 mbar. The results from Horstjann et al. (2014) are also depicted for comparison.
Figure 7 depicts the PeRCEAS eCL versus the NO concentration obtained experimentally for inlet pressures between 200 and 350 mbar. As expected, the eCL decreases with increasing NO concentration. This is attributed to the increase in the rate of the termination reactions forming HONO and CH3ONO. The latter also causes the eCL to be lower for the 1:1 HO2:CH3O2 radical mixture. The experimentally determined eCL is higher for DUALER II, as expected from the reduction of radical losses in the pre-chamber respect to DUALER I. For a constant NO number concentration, eCL values increase with increasing pressure. The overall observed behaviour of eCL versus [NO] in these experiments is in good agreement with the results reported by Kartal et al. (2010).
Table 1Reactions used in a box model for the eCL simulation in the DUALER inlet.
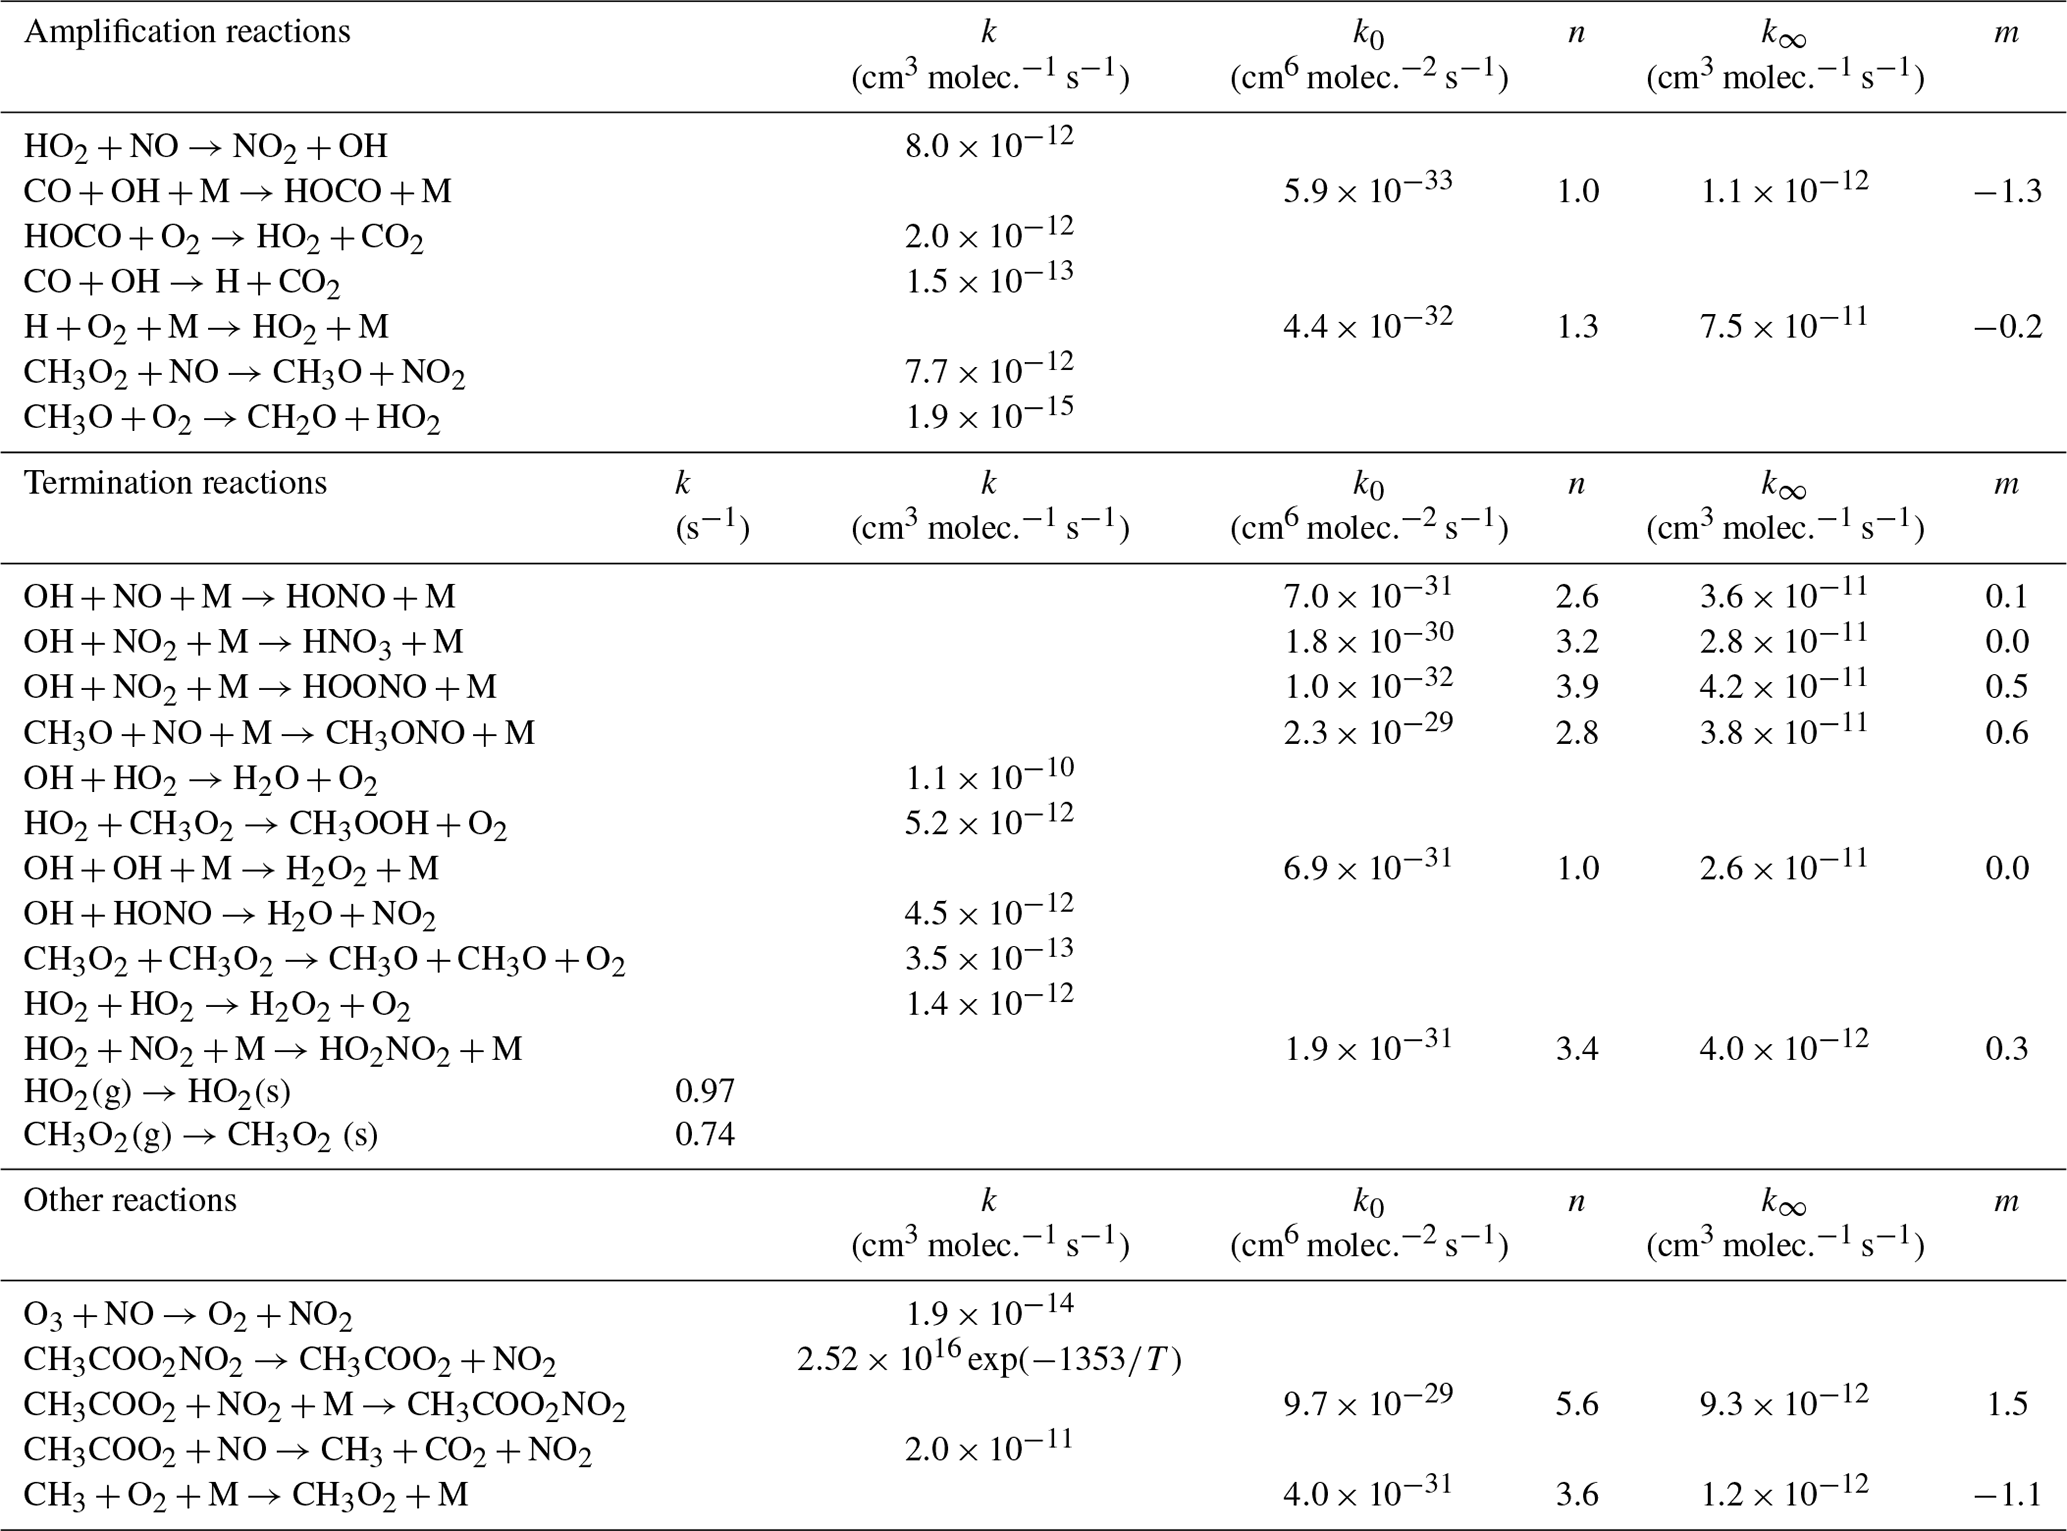
A simple chemical box model was developed using the Kintecus software (Ianni, 2013, 2017; http://www.kintecus.com, last access: 7 April 2020) to simulate the peroxy radical amplification in the DUALER inlets. The model comprises two consecutive modules to simulate the pre-chamber and the reactors separately. The first module takes into account radical terminating reactions prior to the addition of reagent gases. The second module includes the relevant amplification and terminating reactions taking place in the reactor, as listed in Table 1. The rate coefficients used are taken from Burkholder et al. (2015). The first module is initialised with 50 pptv HO2 (6.07×10⁸ molec. cm−3 at 500 mbar) or a 50 pptv HO2 plus 50 pptv CH3O2 mixture. The second module is initialised with the radical output of the first module and calculates the eCL at different pressures for the conditions used in the calibration setup at 500 mbar (9 % CO and 3 ppbv O3) and a series of NO concentrations. According to sensitivity studies, the amount of O3 used for initialising the model does not affect the eCL value calculated.
As in previous work (Kartal, 2009; Chrobry, 2013), the radical wall loss rates (kw) in the DUALER reactors are estimated by using the expression from Murphy et al. (1987) and Hayman (1997) for a cylindrical reactor:
where S is the surface area in cm2, V the volume in cm3, L the length and d the diameter of the flow tube in cm, v the velocity of the gas in cm s−1, and D is the diffusion coefficient, calculated to be and in cm2 s−1.
Using Eq. (4) values for and are estimated to be, respectively, 0.97 and 0.74 s−1 for the DUALER reactors at a pressure of 300 mbar. The kw for the pre-chamber cannot be calculated by Eq. (4) due to its complex geometry and flow dynamics. Consequently, different values of kw are used in module 1 to account for radical losses in the pre-chamber matching the eCL obtained experimentally.
Figure 8 shows the eCL obtained experimentally for the DUALER II at 300 mbar inlet pressure, 500 mL min−1 sample flow and different NO mixing ratios added to the inlet. The best agreement between modelled and experimental data is obtained for the calculated kw in the reactor, and 64 % HO2 and 54 % CH3O2 radical losses in the pre-chamber. This is in agreement with previous results reported by Kartal et al. (2010) for a similar configuration.
Table 2PeRCEAS eCL simulated at 300 mbar for HO2, CH3O2 and a 1:1 radical mixture (eCLmix).
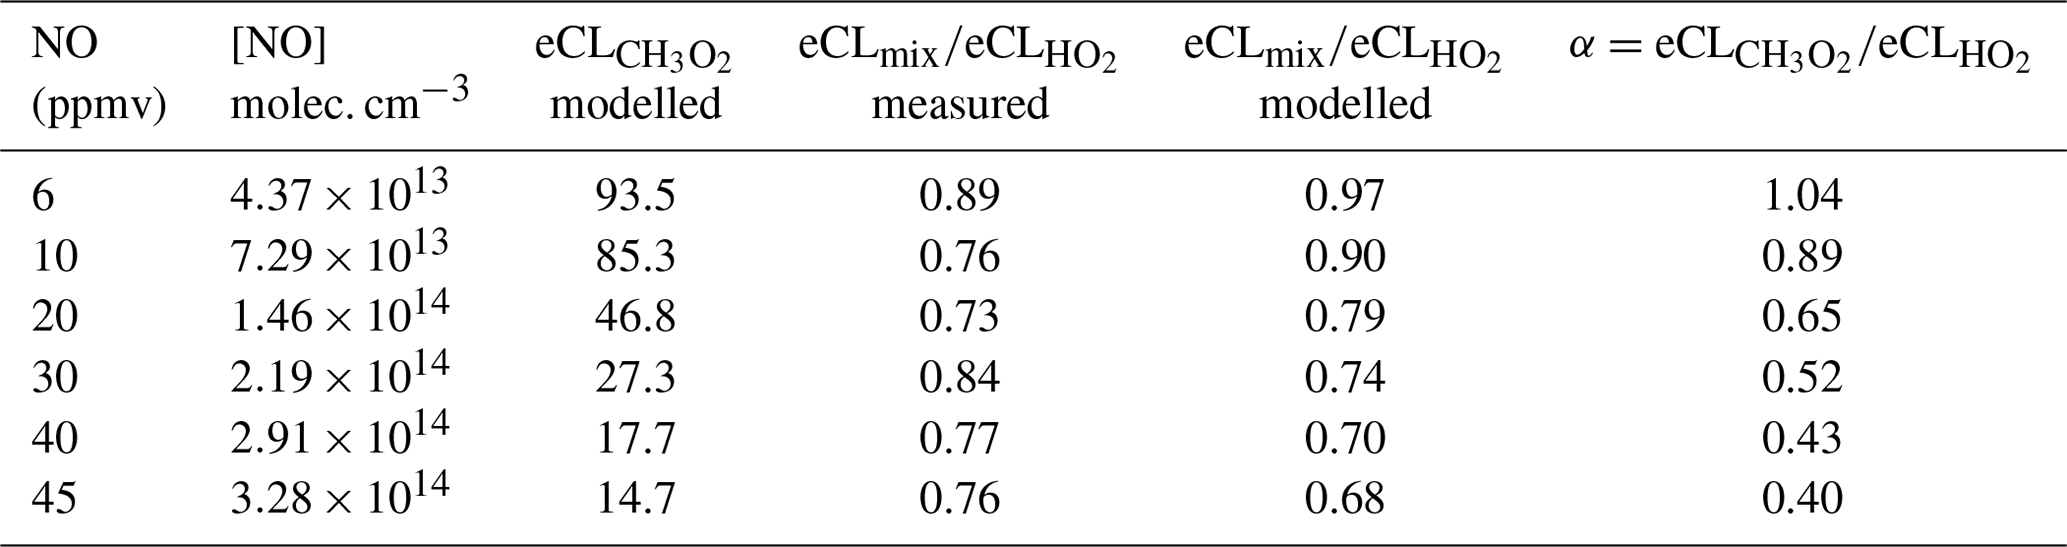
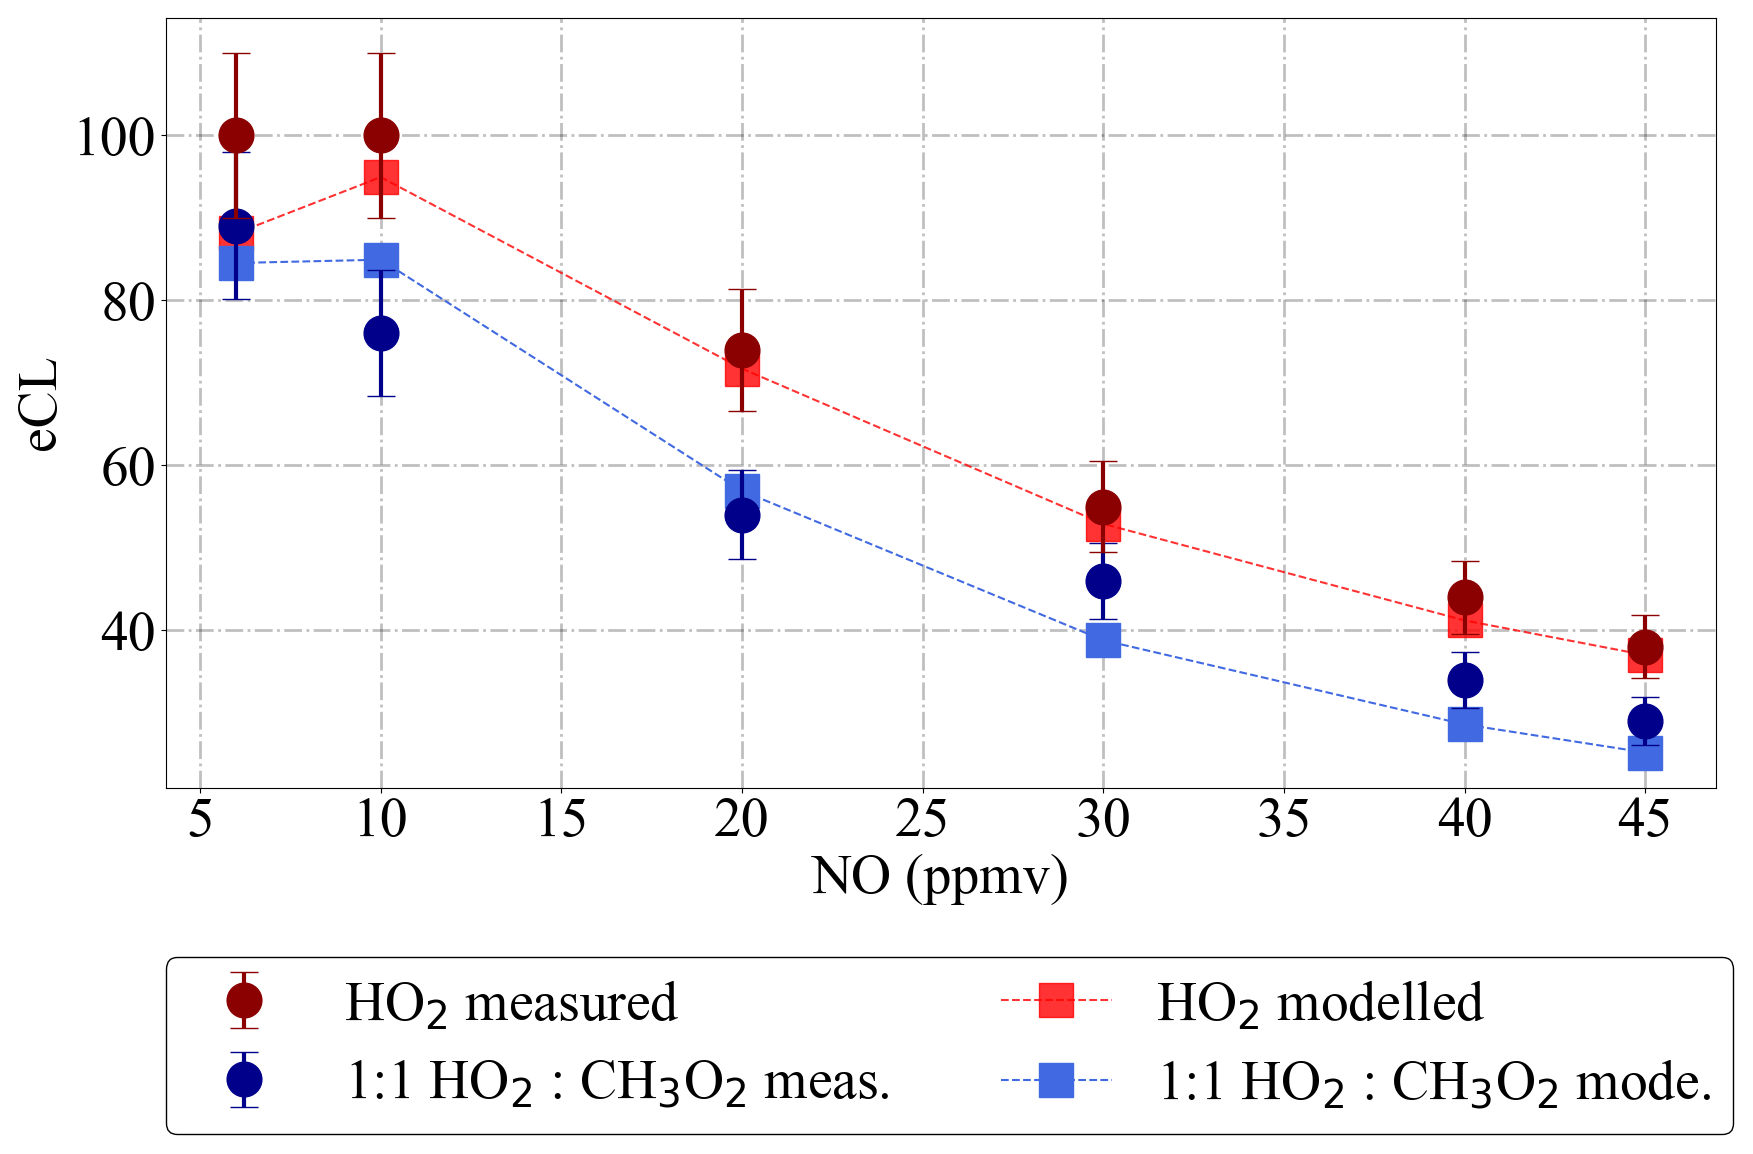
Figure 8PeRCEAS eCL values retrieved experimentally at 300 mbar for HO2 (red circles) and a 1:1 HO2:CH3O2 radical mixture (blue circles) for different NO mixing ratios in DUALER II. Modelled eCL values obtained for the same conditions are also depicted for comparison. The simulations use calculated values of and s−1, and assume 64 % HO2 and 54 % CH3O2 radical losses in the pre-chamber.
Table 2 summarises the simulated PeRCEAS sensitivity for the HO2 and CH3O2 detection for different NO mixing ratios in the reactor at 300 mbar. Up to 10 ppmv NO ([NO] 7.29×10¹³ molec. cm−3) the difference in sensitivity remains within the PeRCEAS uncertainty. The ratio of the is defined as α. Estimated values of α from modelling and measurements are given in Table 2. For the assessment of air masses, the measurements of HO2+αRO2, where αRO2≈αCH3O2, are compared with atmospheric model values of .
The present results confirm that the determination of the eCL in the laboratory for each particular setup and measurement condition is essential.
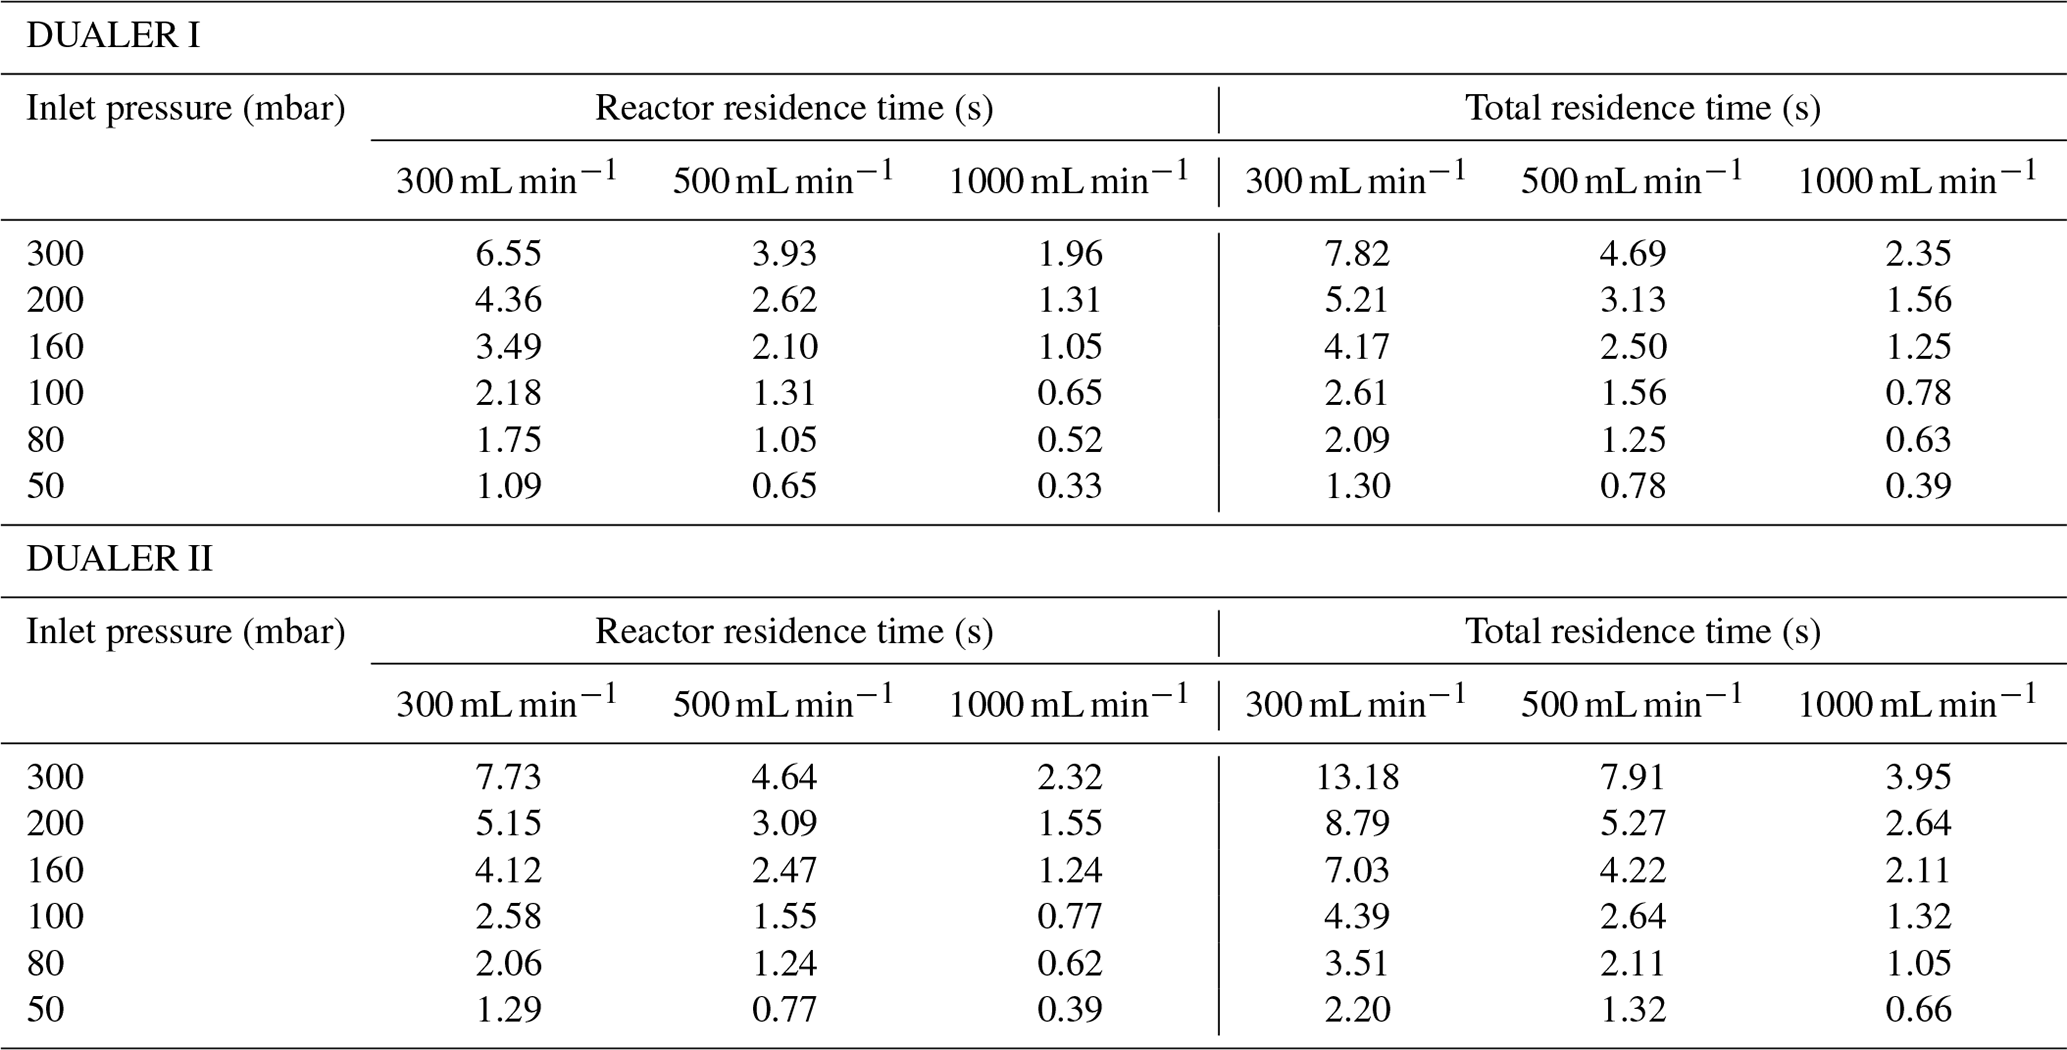
Table 3Sample residence times in PeRCEAS for different operating total flows and pressures. Reactor residence time: residence time between the first and the second addition points in each reactor; total residence time: residence time between the first addition point in each reactor and the corresponding detector. The inner volumes up to the detector are 132 cm3 in DUALER I and 220 cm3 in DUALER II.
3.2.2 Conversion of ambient O3 into NO2
As explained in Sect. 3.1, the simultaneous use of two detectors measuring out of phase results in the temporal resolution of the data being 60 s. In this way, the horizontal resolution of the PeRCEAS airborne measurements, which depends on the speed and altitude of HALO, is typically between 7 and 15 km. Modulation cycles longer than 120 s result in noisy and unrepresentative averages for ambient measurements in air masses having significant short-term variability of O3 and NO2. To keep the temporal resolution of the data equal to the mode time, a rapid and complete conversion of ambient O3 into NO2 within the PeRCEAS is required. For this, the NO concentration added at the inlet has to be sufficient for a complete titration of the sampled O3 before reaching the detector. Figure 9 depicts the O3 decay simulated for 100 and 200 ppbv sampled O3, i.e. molec. cm−3 at 200 and 300 mbar, respectively, assuming the titration to be completed for a rest of [O3] molec. cm−3. The O3 absorption at 408 nm is assumed to be a negligible source of systematic error. These results are in agreement with a series of laboratory measurements made at 300 mbar for DUALER II with a total flow of 500 mL min−1, as shown in Fig. 10. After 8 s in PeRCEAS, the O3 is titrated for mixing ratios above 10 ppmv at the conditions investigated (i.e. molec. cm−3 at 200 and 300 mbar, respectively). The sample residence times for both DUALER inlets are summarised in Table 3.

Figure 9Time evolution of the O3 decay for different NO mixing ratios added at the PeRCEAS reactors as simulated by a box model for 200 and 300 mbar. OC1: 100 ppbv O3 at 200 mbar inlet pressure; OC2: 200 ppbv O3 at 200 mbar inlet pressure; OC3: 100 ppbv O3 at 300 mbar inlet pressure; OC4: 200 ppbv O3 at 300 mbar inlet pressure. The sample residence times for 500 mL min−1 sample flow in the DUALER I and II are also depicted for reference.
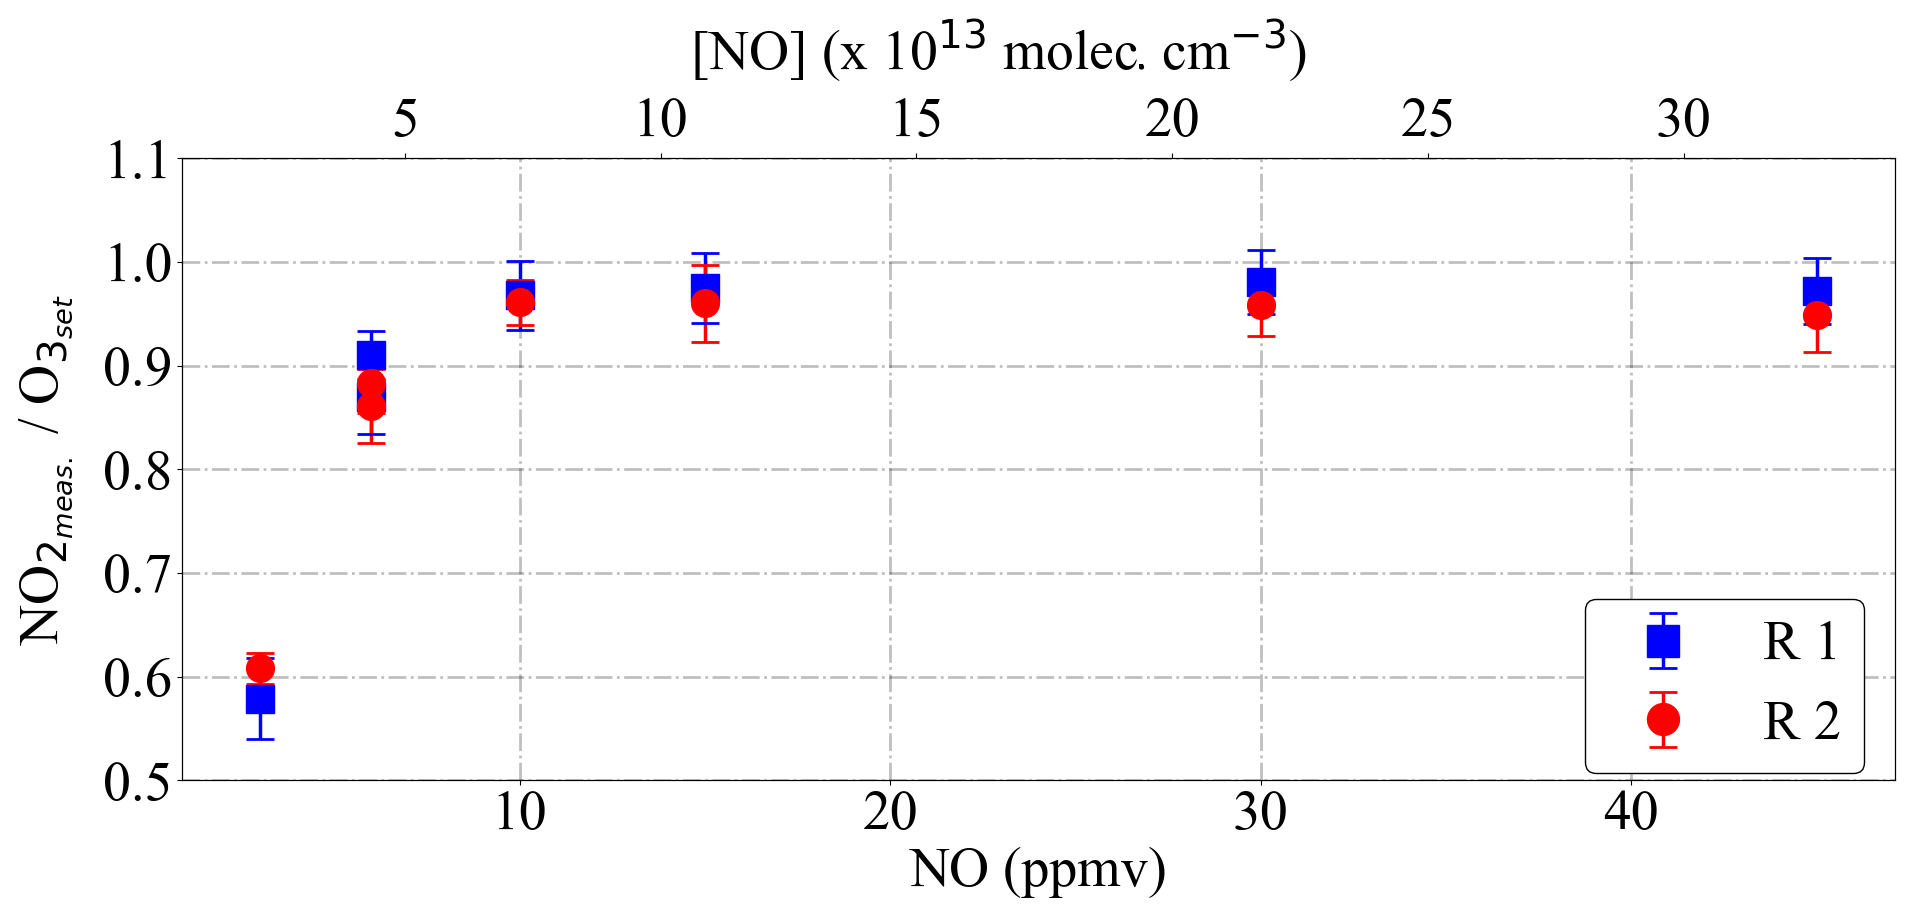
Figure 10PeRCEAS measurement of O3 mixing ratios up to 100 ppbv for different [NO] in the addition gas using DUALER II. NO is scaled in ppmv and molec. cm−3. The O3 conversion is completed when the NO2 measured∕O3set ratio at the calibrator reaches unity. R1: PeRCEAS reactor 1 (blue squares); R2: PeRCEAS reactor 2 (red circles).
3.2.3 Peroxyacyl nitrates thermal decomposition
Peroxyacyl nitrates (RC(O)OONO2) such as PAN and peroxypropionyl nitrate can decompose thermally inside PeRCEAS. The extent of the decomposition to peroxy radicals and NO2 depends on time and temperature. If the thermal decomposition occurs at shorter timescales than the modulation time, they can be a significant interfering source of radicals which are chemically amplified and lead to additional NO2. In a rapidly changing background, the determination might be affected depending on the temperatures and sample residence times between the gas addition points in the DUALER (Table 3).
To evaluate this effect, the production of peroxy radicals from the thermal decomposition of 1 ppbv PAN at different temperatures and pressures has been simulated. The results obtained with a box model (Ianini, 2003), including the reactions
are depicted in Fig. 11. The rate coefficients used are taken from Burkholder et al. (2015).
For the same temperature, the [CH3O2] produced does not vary significantly at the pressures investigated. As the temperature of the PeRCEAS reactors during flight generally remains under 290 K, this source of radicals is considered to be negligible for most operating conditions. The thermal stability of the PAN analogues is similar to that of PAN but they are usually at much lower concentrations than PAN in the atmosphere. They are therefore also assumed to be a negligible source of error.
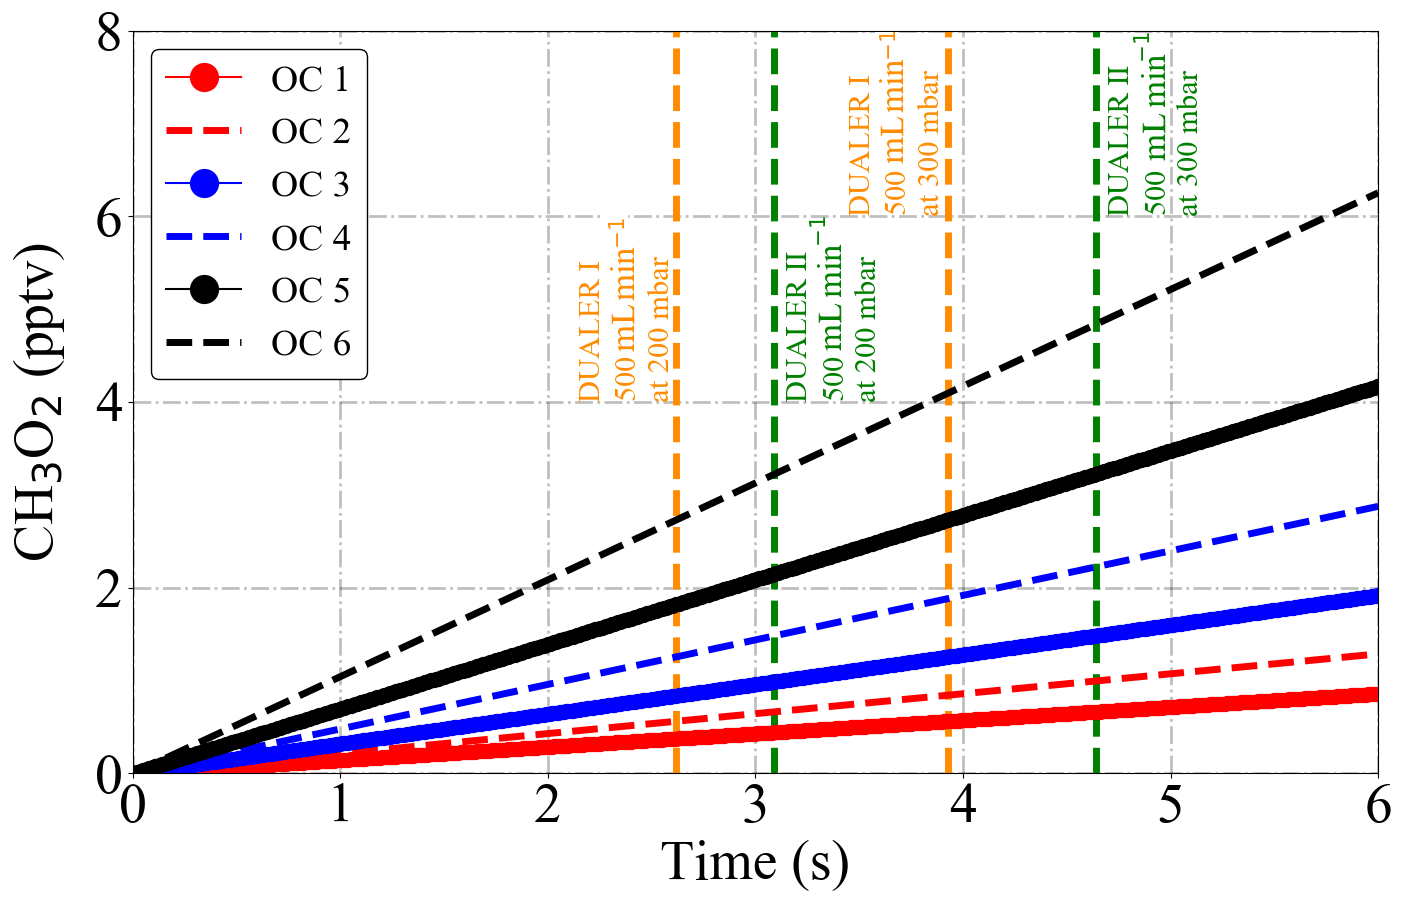
Figure 11CH3O2 radical production from the thermal decomposition of 1 ppbv PAN as simulated by a box model between 288 and 298 K at 200 and 300 mbar. OC1: 288 K and 300 mbar; OC2: 288 K and 200 mbar; OC3: 293 K and 300 mbar; OC4: 293 K and 200 mbar; OC5: 298 K and 300 mbar; OC6: 298 K and 200 mbar. The sample residence times for 500 mL min−1 sample flow in the DUALER I and II are also depicted for reference.
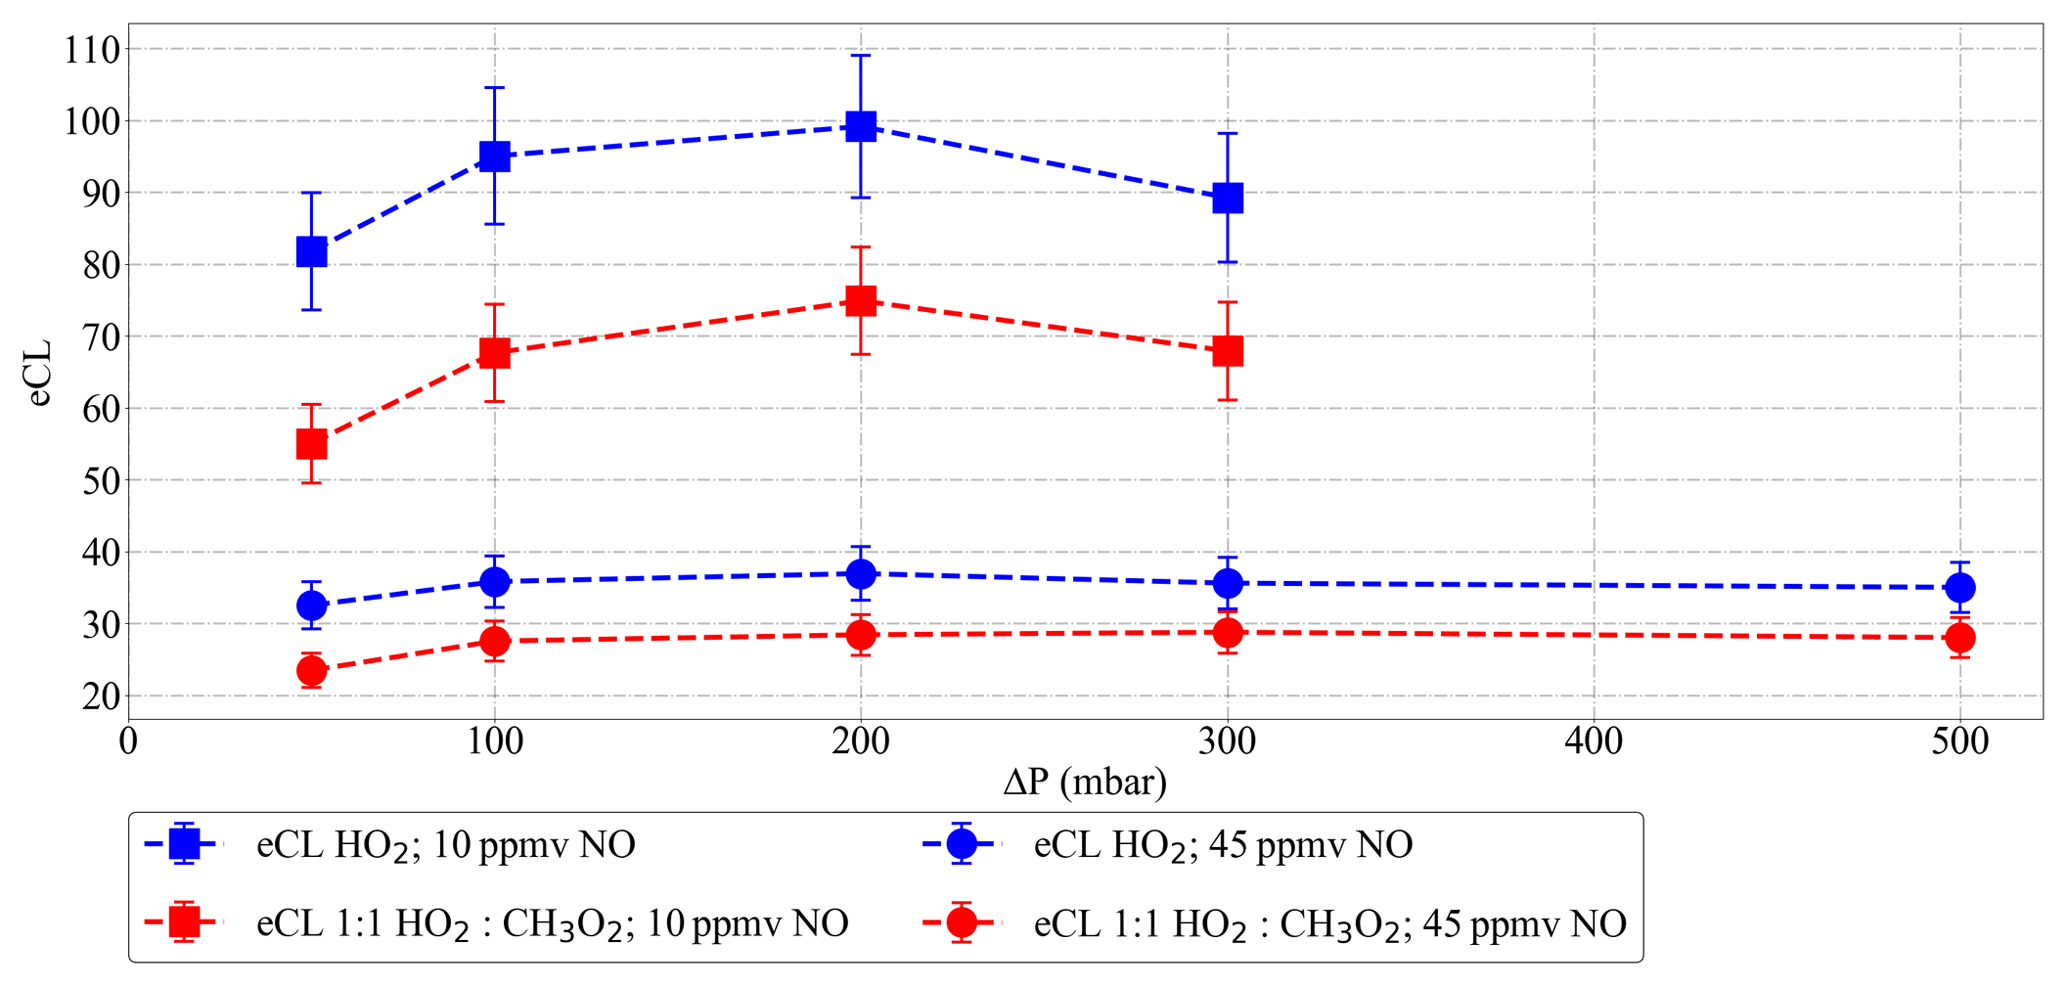
Figure 12Dependency of eCL on ΔP () as determined for PeRCEAS under controlled laboratory conditions for 10 ppmv (squares) and 45 ppmv (circles) NO at 300 mbar inlet pressure. The error bars are 1σ deviation of eCL values obtained by identical calibrations at each ΔP.
3.3 Operating pressure: radical losses and absolute humidity in DUALER
As explained in Sect. 2, the PeRCEAS operating pressure is held constant and below ambient pressure to have a constant radical chemical conversion in the DUALER reactors during the flight. However, the is different at different flight altitudes and leads to changes in the physical losses and the humidity in the pre-chamber. These potentially may have a significant effect in the eCL, as reported by Kartal et al. (2010).
To evaluate this effect for PeRCEAS, different ΔP values were experimentally generated by changing the pressure in the pressure chamber while keeping inlet conditions like pressure, mixing ratios of the reagent gases (NO, CO and N2), sampling gas velocity (flow) and relative humidity invariable.
Figure 12 shows the variation of the eCL for 10 and 45 ppmv NO within a pressure range of 50 mbar mbar. As can be seen in the figure, the eCL remains within 10 % of the mean value except for the values at ΔP < 100 mbar. This might be the result of variations in the relative importance of terminating processes (e.g. wall losses versus chemical reactions) with the sample velocity through the pre-chamber (Kartal et al., 2010), as indicated by the differences in the eCL pattern for NO 10 ppmv and 45 ppmv below 100 mbar. Consequently ΔP=100 mbar is defined as the minimum operating pressure for PeRCEAS airborne measurements. With this limitation, measurements of at flight altitudes up to 12 km can be successfully made.
The effect of changes in the sampled air humidity on the eCL has been reported and studied by Mihele and Hastie (1998) and Mihele et al. (1999). Reichert et al. (2003) investigated the dependency of the eCL for ground-based measurements at 20 and 30 ∘C, i.e. keeping the relative humidity but almost doubling the absolute water concentration. The obtained eCL values did not differ within the experimental error and confirmed the dependency of eCL on the relative humidity. All these measurements were performed at 1 atm and for 3.3 ppmv NO ([NO] 8.12×10¹³ molec. cm−3).
In this work, radical mixtures were sampled at 25 ∘C for relative humidity between 2 % and 25 %. This leads to approximately a factor of 20 increase in the absolute [H2O]. These conditions cover the [H2O] expected for a larger T range (−20 to 30 ∘C) during airborne measurements in the free troposphere at 200 and 300 mbar inlet pressures. Figure 13 shows the [H2O] in the air probed versus the [H2O] in the inlet for real measurements aboard the HALO aircraft. The results in Fig. 14 for 45 ppmv ([NO] 3.28×10¹⁴ molec. cm−3 at 300 mbar) indicate that variations in the sample humidity do not lead to additional uncertainty in the retrieval, as the PeRCEAS eCL remains invariable within the experimental error up to [H2O] molec. cm−3. In contrast, for 10 and 30 ppmv NO in the reactor ([NO] 7.29×10¹³ and 2.19×10¹⁴ molec. cm−3 at 300 mbar), the eCL shows a clear dependence on the ambient [H2O]. The comparison with the eCL values obtained by Reichert et al. (2003) at 1 atm indicates a eCL dependency on [H2O], temperature and pressure having a different pattern for 45 ppmv NO in the reactor. This is explained by invoking the competition in the amplification chain length (CL) between HO2 and OH removal rates, as explained in Hastie et al. (1991) and Reichert et al. (2003). At [NO] molec. cm−3, the CL begins to be dominated by the rate of the termination termolecular reaction of OH with NO, which is independent of water vapour. This eCL dependency has to be taken into account in the analysis of ambient air measurements.
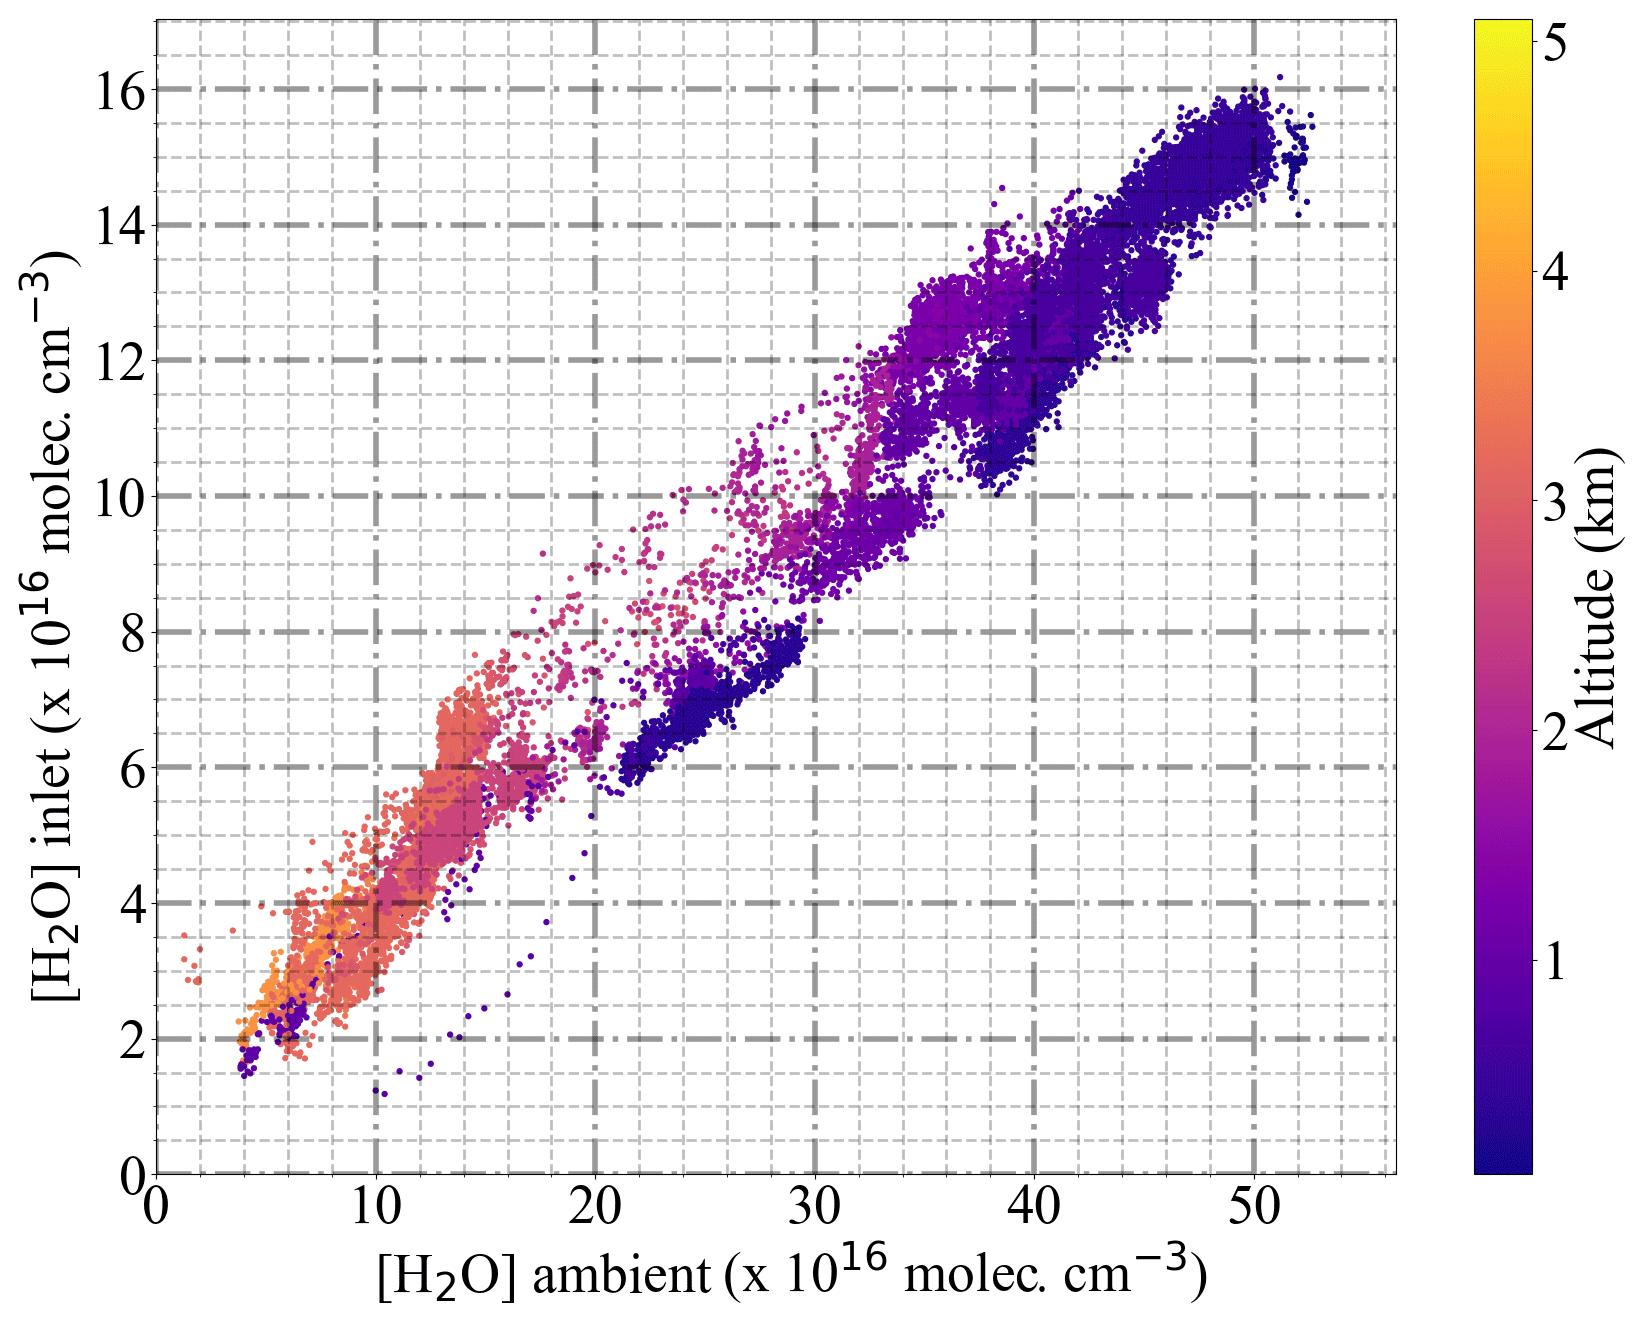
Figure 13Comparison of the [H2O] measured by the BAsic HALO Measurement And Sensor system (BAHAMAS) instrument aboard HALO and inside the DUALER inlet on 17 March 2018 during the EMeRGe campaign in Asia. The colour scale indicates the altitude of the aircraft during the measurement.
The determination of concentrations from PeRCEAS measurements is subject to two types of errors which either (a) are intrinsic to the CRDS and PeRCA techniques and can be characterised under controlled conditions in the laboratory or (b) result from the in-flight variability in the temperature, velocity and pressure conditions and cannot be readily reproduced in the laboratory.
4.1 Errors related to the CRDS technique
Provided that the NO2 absorption is the dominant process leading to the extinction of light at ∼408 nm in the optical cavity of each detector, the absorption coefficient can be calculated from Eq. (1) by considering τ1 and τ2 as the cavity ring-down times with and without a sample, respectively. However, the effective , τ and τ0 can differ from one detector to another.
The effective for each PeRCEAS NO2 detector has been determined by using the convolution of the NO2 absorption cross section from Vandaele et al. (2002) with the normalised laser spectra from the corresponding detector. The values obtained have been verified by regular sampling of NO2 mixtures of known concentration in synthetic air.
The PeRCEAS lasers are operated at the maximum 100 mW power to achieve the best Gaussian profile for the emission and are digitally modulated during operation. The laser emission spectrum is measured periodically in the laboratory by using a calibrated spectrometer (AvaSpec-ULS2048x64; 295–535 nm grating; 0.132 nm resolution) to verify the long-term spectral stability. A sample comparison of spectra obtained for the three PeRCEAS detectors is included in the Supplement (Fig. S1).
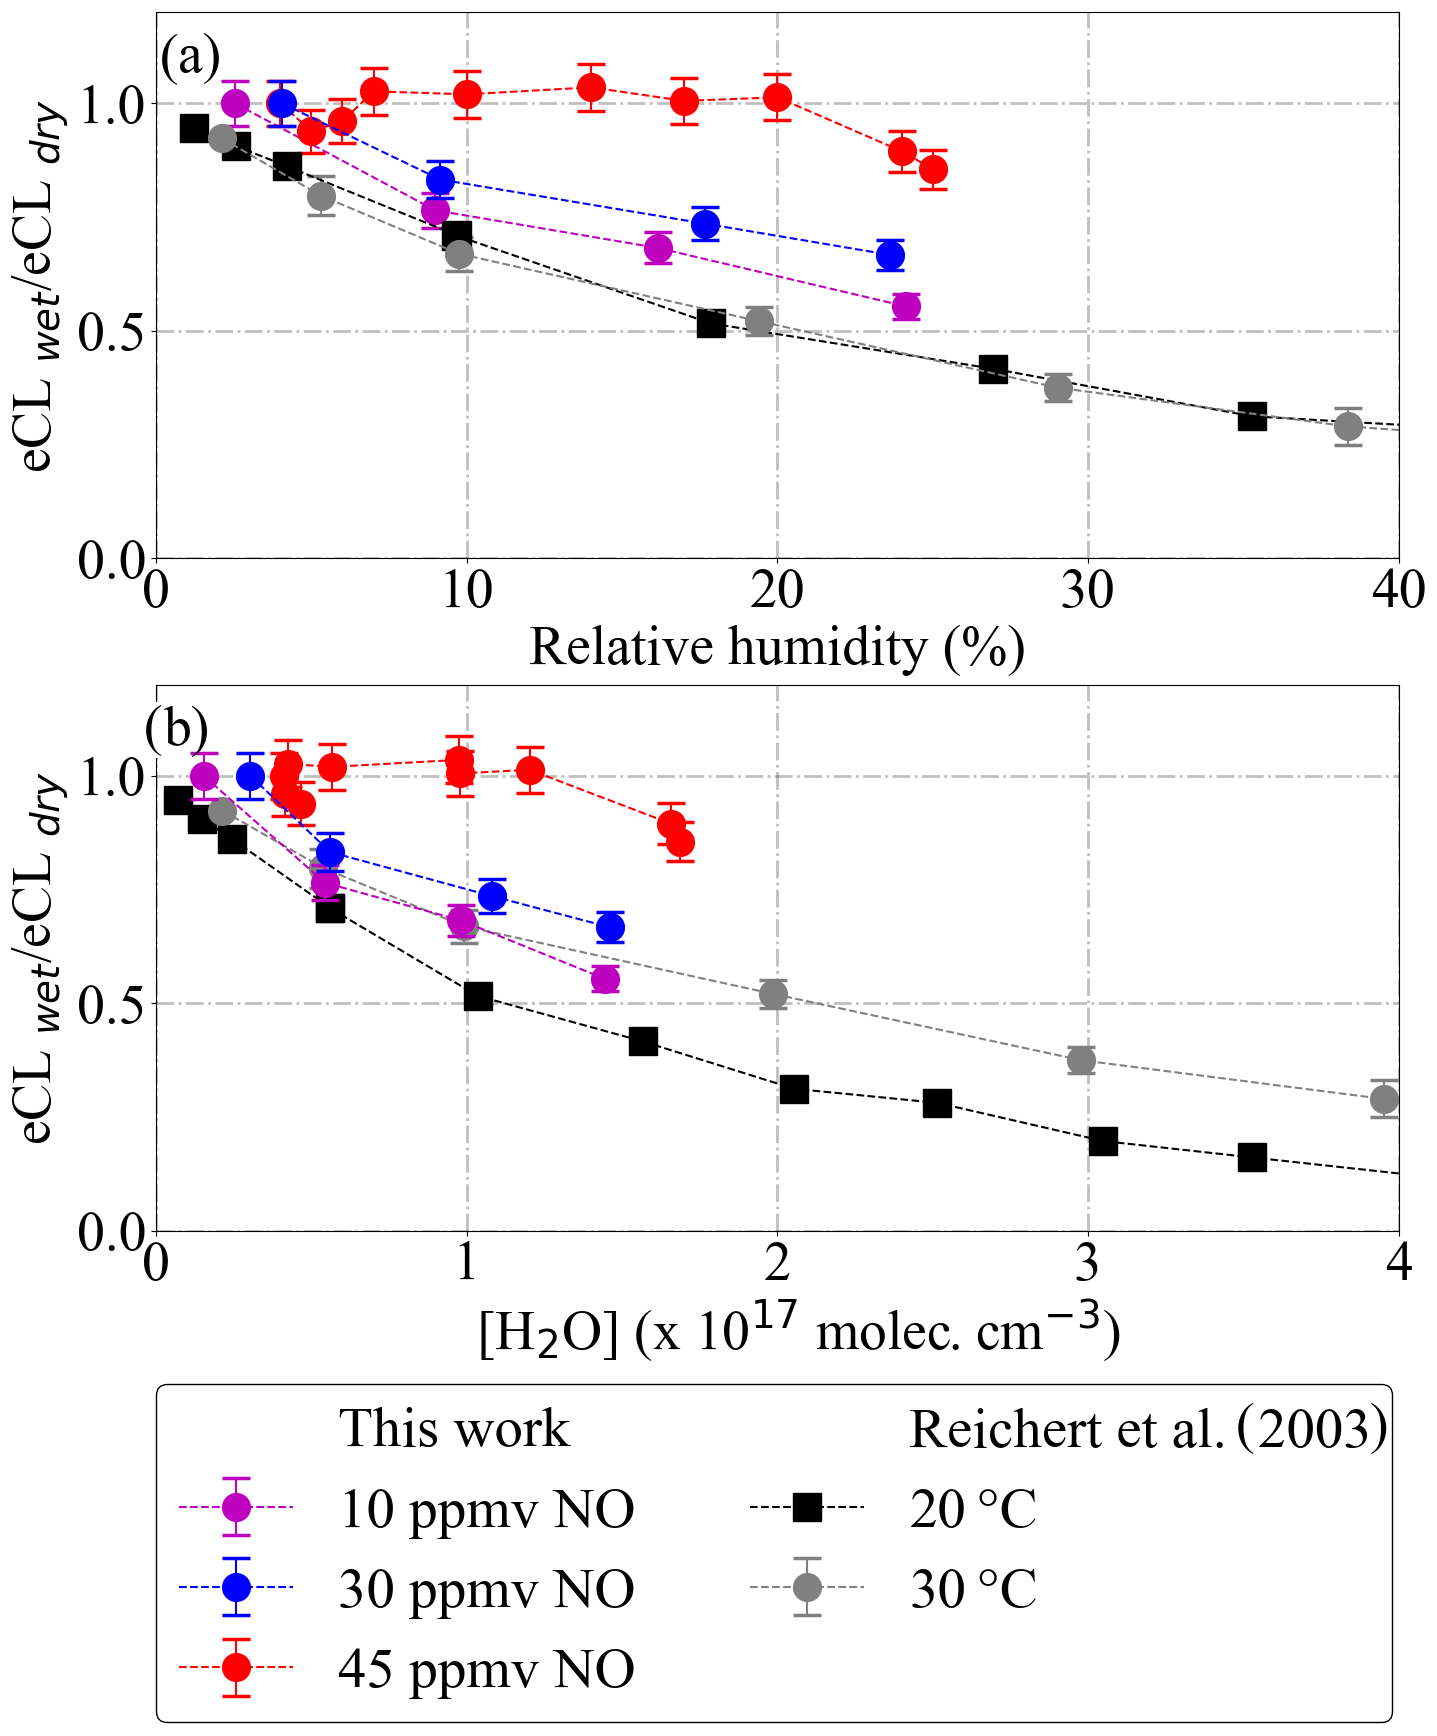
Figure 14Dependency of PeRCEAS eCL (a) on inlet humidity and (b) on [H2O], at constant sampling flow, inlet pressure, ΔP, [CO] and [N2], measured at 300 mbar and for 10 ppmv (magenta), 30 ppmv (blue) and 45 ppmv (red) NO (respectively, 7.29×10¹³, 2.19×10¹⁴ and 3.28×10¹⁴ molec. cm−3 [NO]). The values from Reichert et al. (2003) obtained for 3.3 ppmv NO at 1 atm (8.12×10¹³ molec. cm−3 [NO]) are also plotted for comparison.
By integrating under the normalised laser spectrum, the effective are calculated to be , and cm2 molec.−1 for the AB, FH and FR detectors, respectively. The errors are calculated from the 2σ variation in the 1 h average of 10 samples s−1 laser emission spectrum measured and the error reported for the high-resolution NO2 spectra.
According to Eq. (5), the effective NO2 absorption cross section is 1∕c0 times the slope of the inverse of the measured τ versus the NO2 number concentration:
The result of applying Eq. (5) to the PeRCEAS detectors is depicted in Fig. 15. The detectors sampled known mixtures of NO2 from commercial gas cylinders in synthetic air at 200 mbar, as shown in the Supplement (Fig. S2). The effective obtained agrees within 5 % with the values derived by integrating under the normalised laser spectrum as described above.
The y intercept in Fig. 15 corresponds to 1∕τ0, which is different for each detector. This is attributed to slight differences in the mirror reflectivity and in the overall alignment of the optical cavities. The value of τ0 for a particular detector is not expected to vary significantly under laboratory conditions.
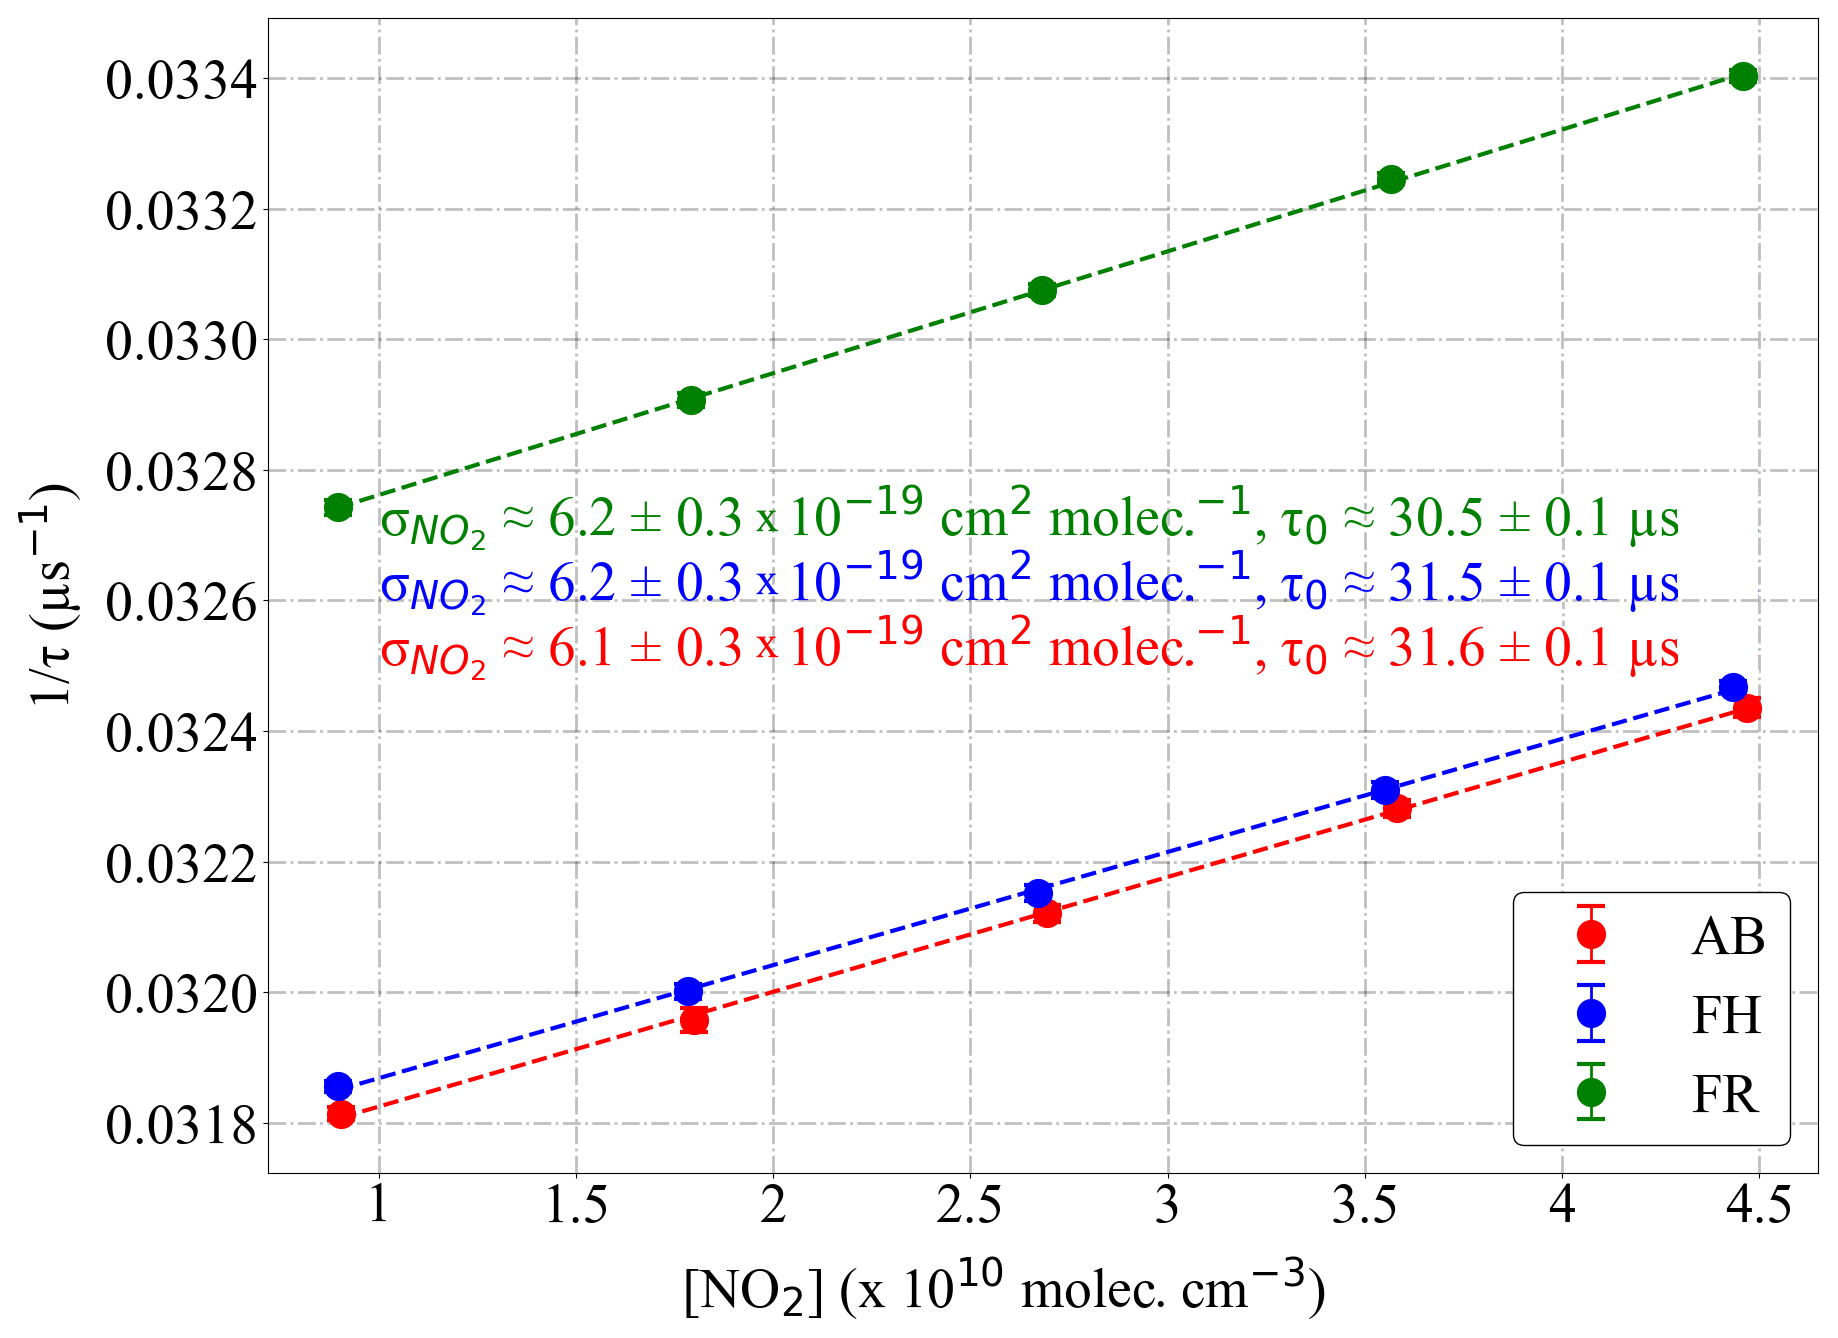
Figure 15Determination of the effective absorption cross section () from the measurement of mixtures of known concentration of NO2 in synthetic air. Values obtained for the PeRCEAS detectors: AB (red), FH (blue) and FR (green) at 200 mbar are indicated in the plot. Linear fits are also shown by dashed lines.
4.2 Errors related to the PeRCA technique
The determination of mixing ratios from the ΔNO2 measurement requires accurate knowledge of the eCL which depends upon physical parameters, such as temperature, pressure, wall losses, residence time in the reactor and the operating conditions, as discussed in Sect. 3. Generally, in-flight variations in the HALO cabin temperature minimally affect the accuracy of the determination.
The main sources of uncertainty in the eCL determination are the radical generation and the NO2 determination from CRDS due to the accuracy of the , which is estimated to be 5 % (2σ) (see Sect. 4.1). In the current setup, the generation of peroxy radicals (Eq. 3) has a precision < 3 pptv (2σ). Based on the experimental reproducibility of radical calibrations the eCL precision is within 3 % under all conditions investigated. In addition to this, the experimental determination of eCL has a 15 % uncertainty, dominated by the 10 % uncertainty of both [O3] and determinations using the calibration setup (Creasy et al., 2000; Kartal et al., 2009). Other errors associated with the determination of [H2O] (0.05 %), [O2] (0.5 %) and the literature value (1.4 %) are significantly lower.
Figure 16 shows the calculated eCL from six radical calibrations carried out over 6 months for 300 mbar pressure, ΔP=200 mbar and 1 % relative humidity, adding reagent gases to achieve 9 % CO and 30 ppmv NO within the DUALER II inlet. For HO2, the obtained eCL values are 60±9 and 61±9 for reactor 1 and reactor 2, respectively. The eCL values for radical mixtures are 46±7 and 44±7, respectively. The errors refer to the experimental precision (2σ) of the measurements.

Figure 16Experimental eCL determination of the DUALER II (a) reactor 1 and (b) reactor 2 from a series of six calibrations with generated mixing ratios of HO2 (blue) and a (1:1) HO2:CH3O2 radical mixture (red) at 200 mbar inlet pressure, 300 mbar ΔP and NO 30 ppmv within the inlet.
Table 4State-of-the-art instruments for the airborne measurement of peroxy radicals. Ground-based instruments are also included for comparison.
4.3 Errors related to in-flight variability of air composition: DUALER approach and retrieval
The in-flight dynamical stability of PeRCEAS is influenced by the stability of the sampling flows and pressures. This stability depends on pressure variations experienced by the instrument when the aircraft is turning, ascending or descending, as well as in the presence of turbulence. The noise in the NO2 signal is generally larger in flight. This is attributed to the impact of mechanical vibration and temperature variation. Concerning the effect of temperature, during the instrumental preparation on the ground prior to the flight, the cabin temperature may increase up to 40 ∘C. This affects the stability of the ring-down time signal and the accuracy of the reference measurements. However, the in-flight temperature in the HALO cabin remains reasonably constant.
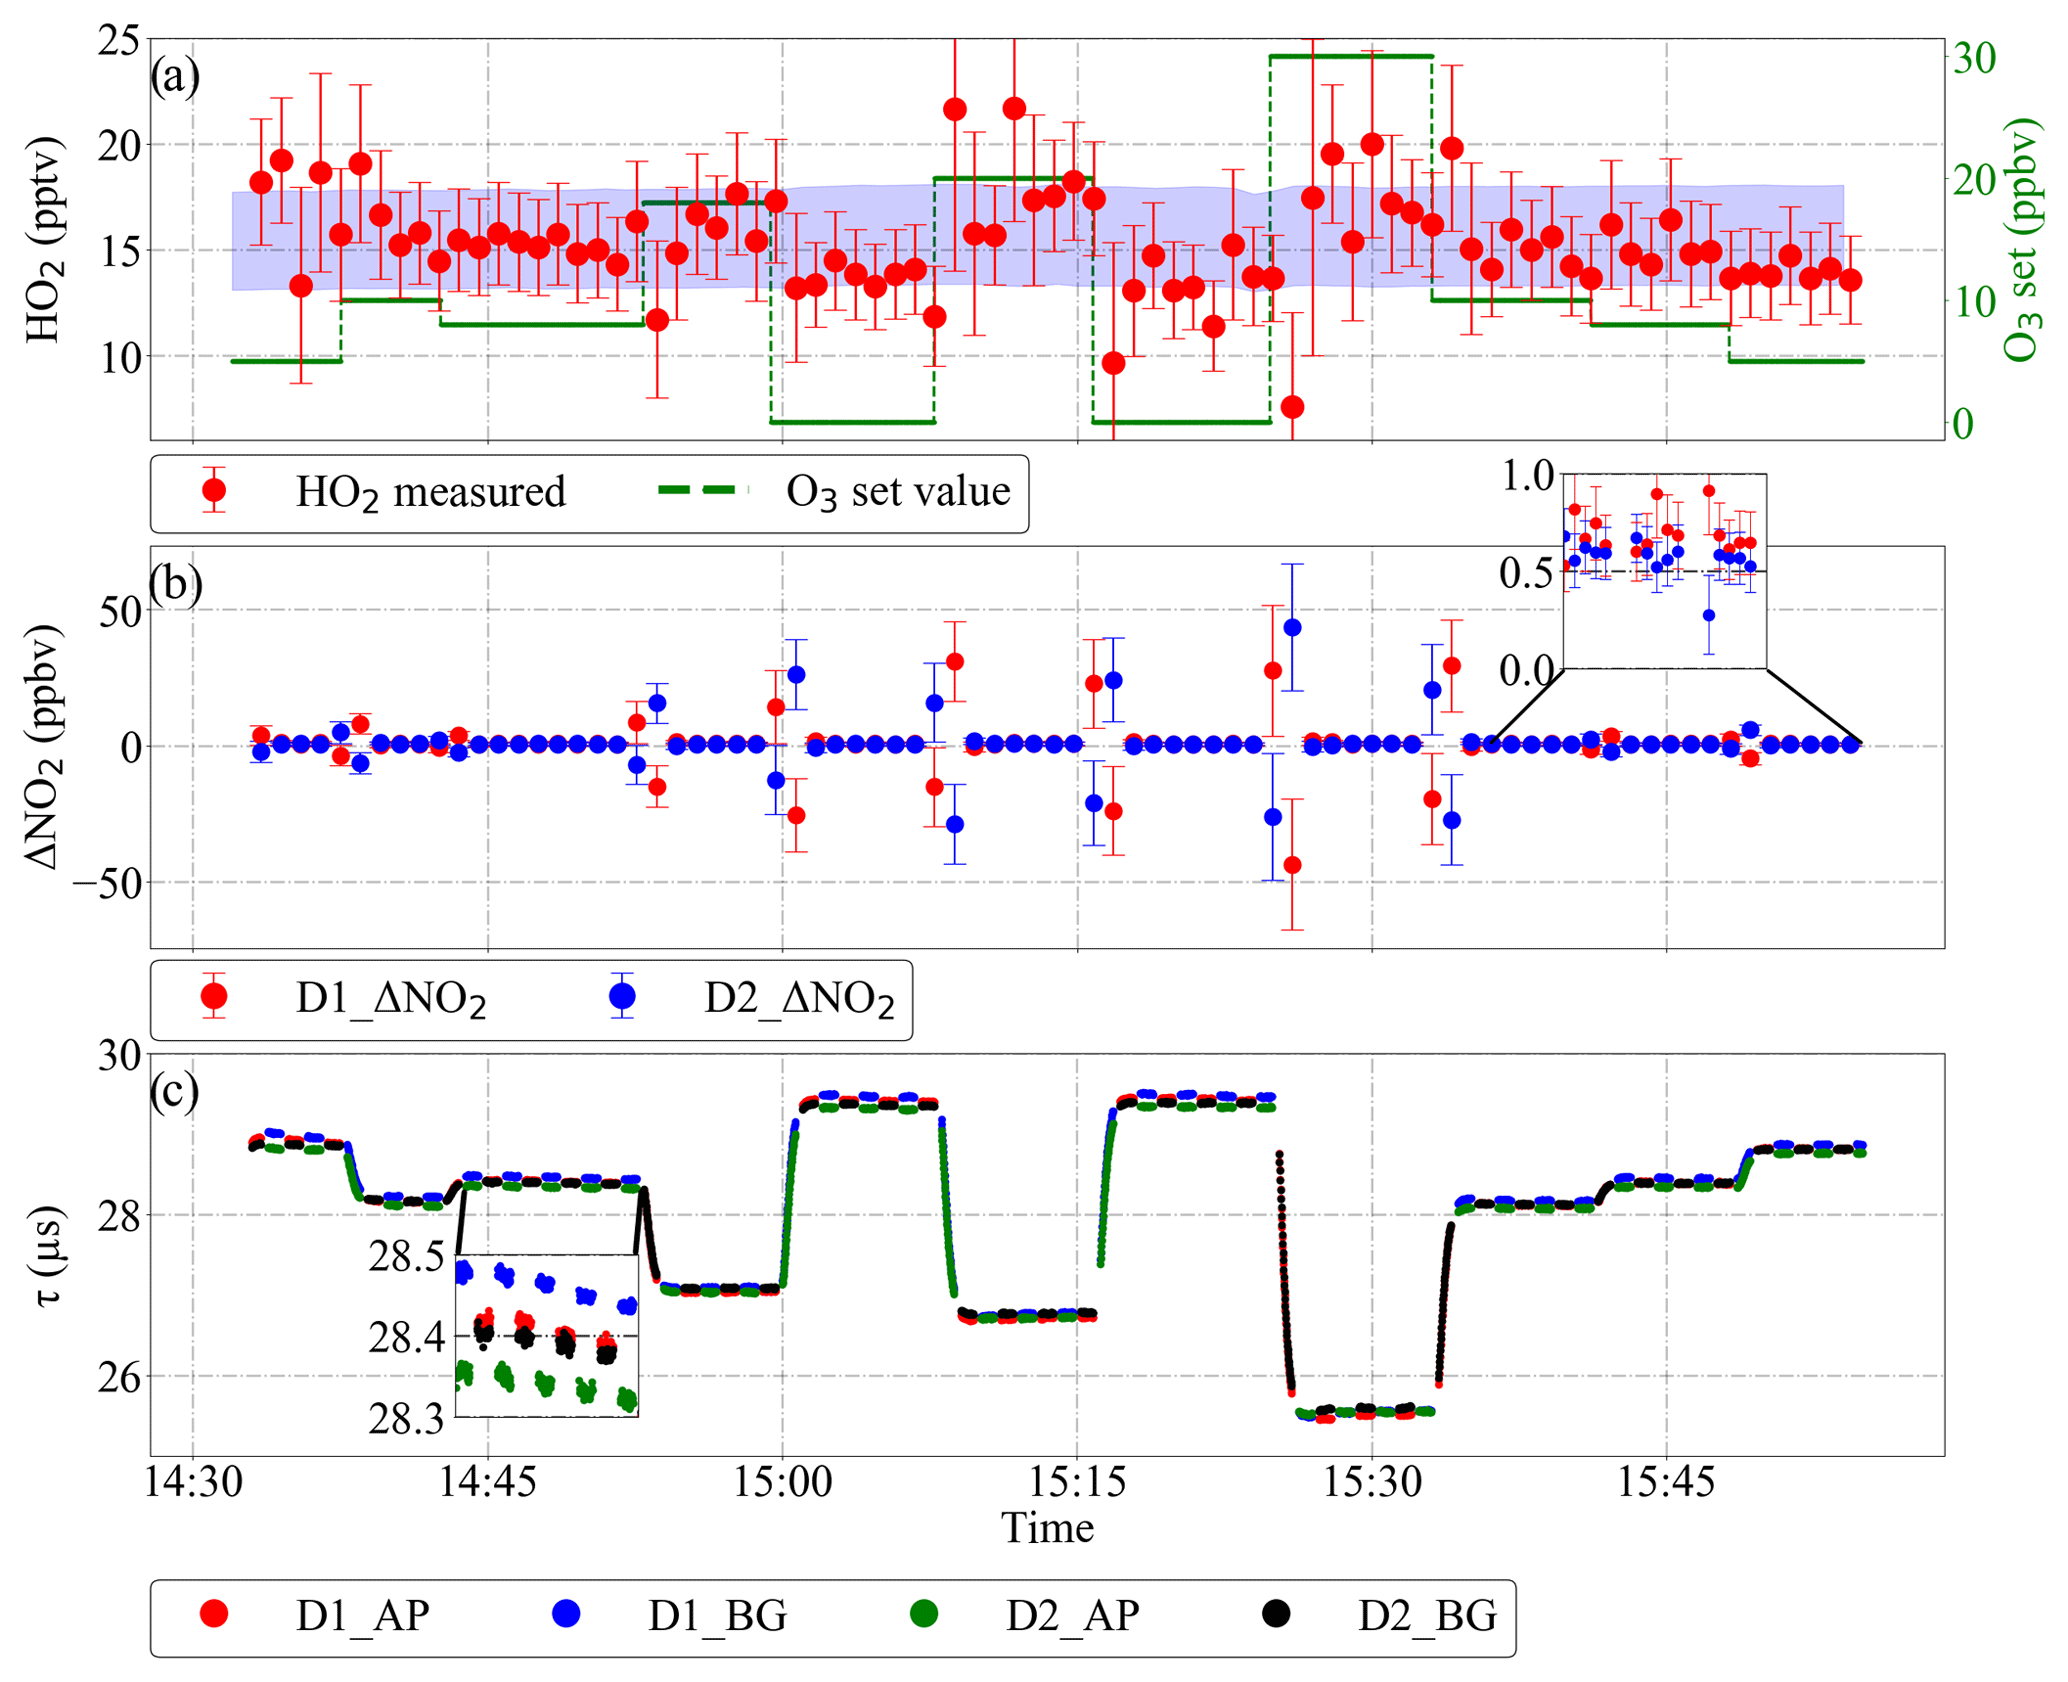
Figure 17HO2 retrieval under controlled changing of the O3 background concentration using DUALER I: (a) retrieved HO2 and O3 variation. The blue shaded area in panel (a) shows the HO2 produced in the radical source (15 %, i.e. 2σ, uncertainty); (b) ΔNO2 retrieved from detector 1 (red) and detector 2 (blue); (c) ring-down time from both detectors. D1: detector 1; D2: detector 2; AP: amplification mode, BG: background mode.
In addition to the above, the retrieval of the ambient mixing ratios requires a reliable discrimination of the interfering signals resulting from the variation of NO2, O3, PAN and any other molecules in the sampled air leading to additional absorption or scattering at ∼408 nm. As mentioned before, changes in the composition faster than two consecutive measurement modes might lead to erroneous peroxy radical retrievals. In the case of aircraft measurements, this effect might be important due to the relative motion of the aircraft with respect to the air mass. The reliability of the PeRCEAS retrieval technique to effectively remove short-term background variations was investigated in the laboratory by sampling HO2 generated at a constant mixing ratio of 16±2 pptv in synthetic air, while varying O3 up to 30 ppbv. The DUALER I inlet was stabilised at 200 mbar and all other parameters like chamber pressure, mixing ratios of the reagent gases (30 ppmv NO, 9 % CO and 9 % N2), sampling flows (500 mL min−1) and relative humidity (< 3 %) were controlled and held constant.
As can be seen in Fig. 17, the ΔNO2 calculated from both detector signals remains around 700 pptv for a constant O3 concentration, which is eCL times the HO2 set value (i.e. pptv). O3 variations within 1 min lead to opposite deviations from the 700 pptv value in the ΔNO2 calculated from each system. This causes the HO2 calculated from each system to deviate in the same manner from the actual value. Because the two reactors are operated out of phase with one another, the final HO2 data are the mean of the HO2 determined by each detector from their respective ΔNO2 using Eq. (1).
The ΔNO2 calculated over 1 min has a standard deviation of the order of the variation of O3 converted into NO2 through the NO titration in the reactor, as shown in the retrieved ΔNO2 plot of Fig. 17. In the case of short-term O3 changes up to 30 ppbv, the 16 pptv HO2 mixing ratio set (7.8×10⁷ molec. cm−3 at 200 mbar and 25 ∘C) can be retrieved with a maximum deviation of 6 pptv (2.9×10⁷ molec. cm−3 at 200 mbar and 25 ∘C). The error in the retrieved HO2 data results from the 15 % uncertainty of the eCL and the background NO2 variation within 1 min caused by the O3 variations. This result is valid for all the background signal variations during a real-time measurement and proves the robustness of the DUALER approach for the retrieval of in a rapidly changing environment.
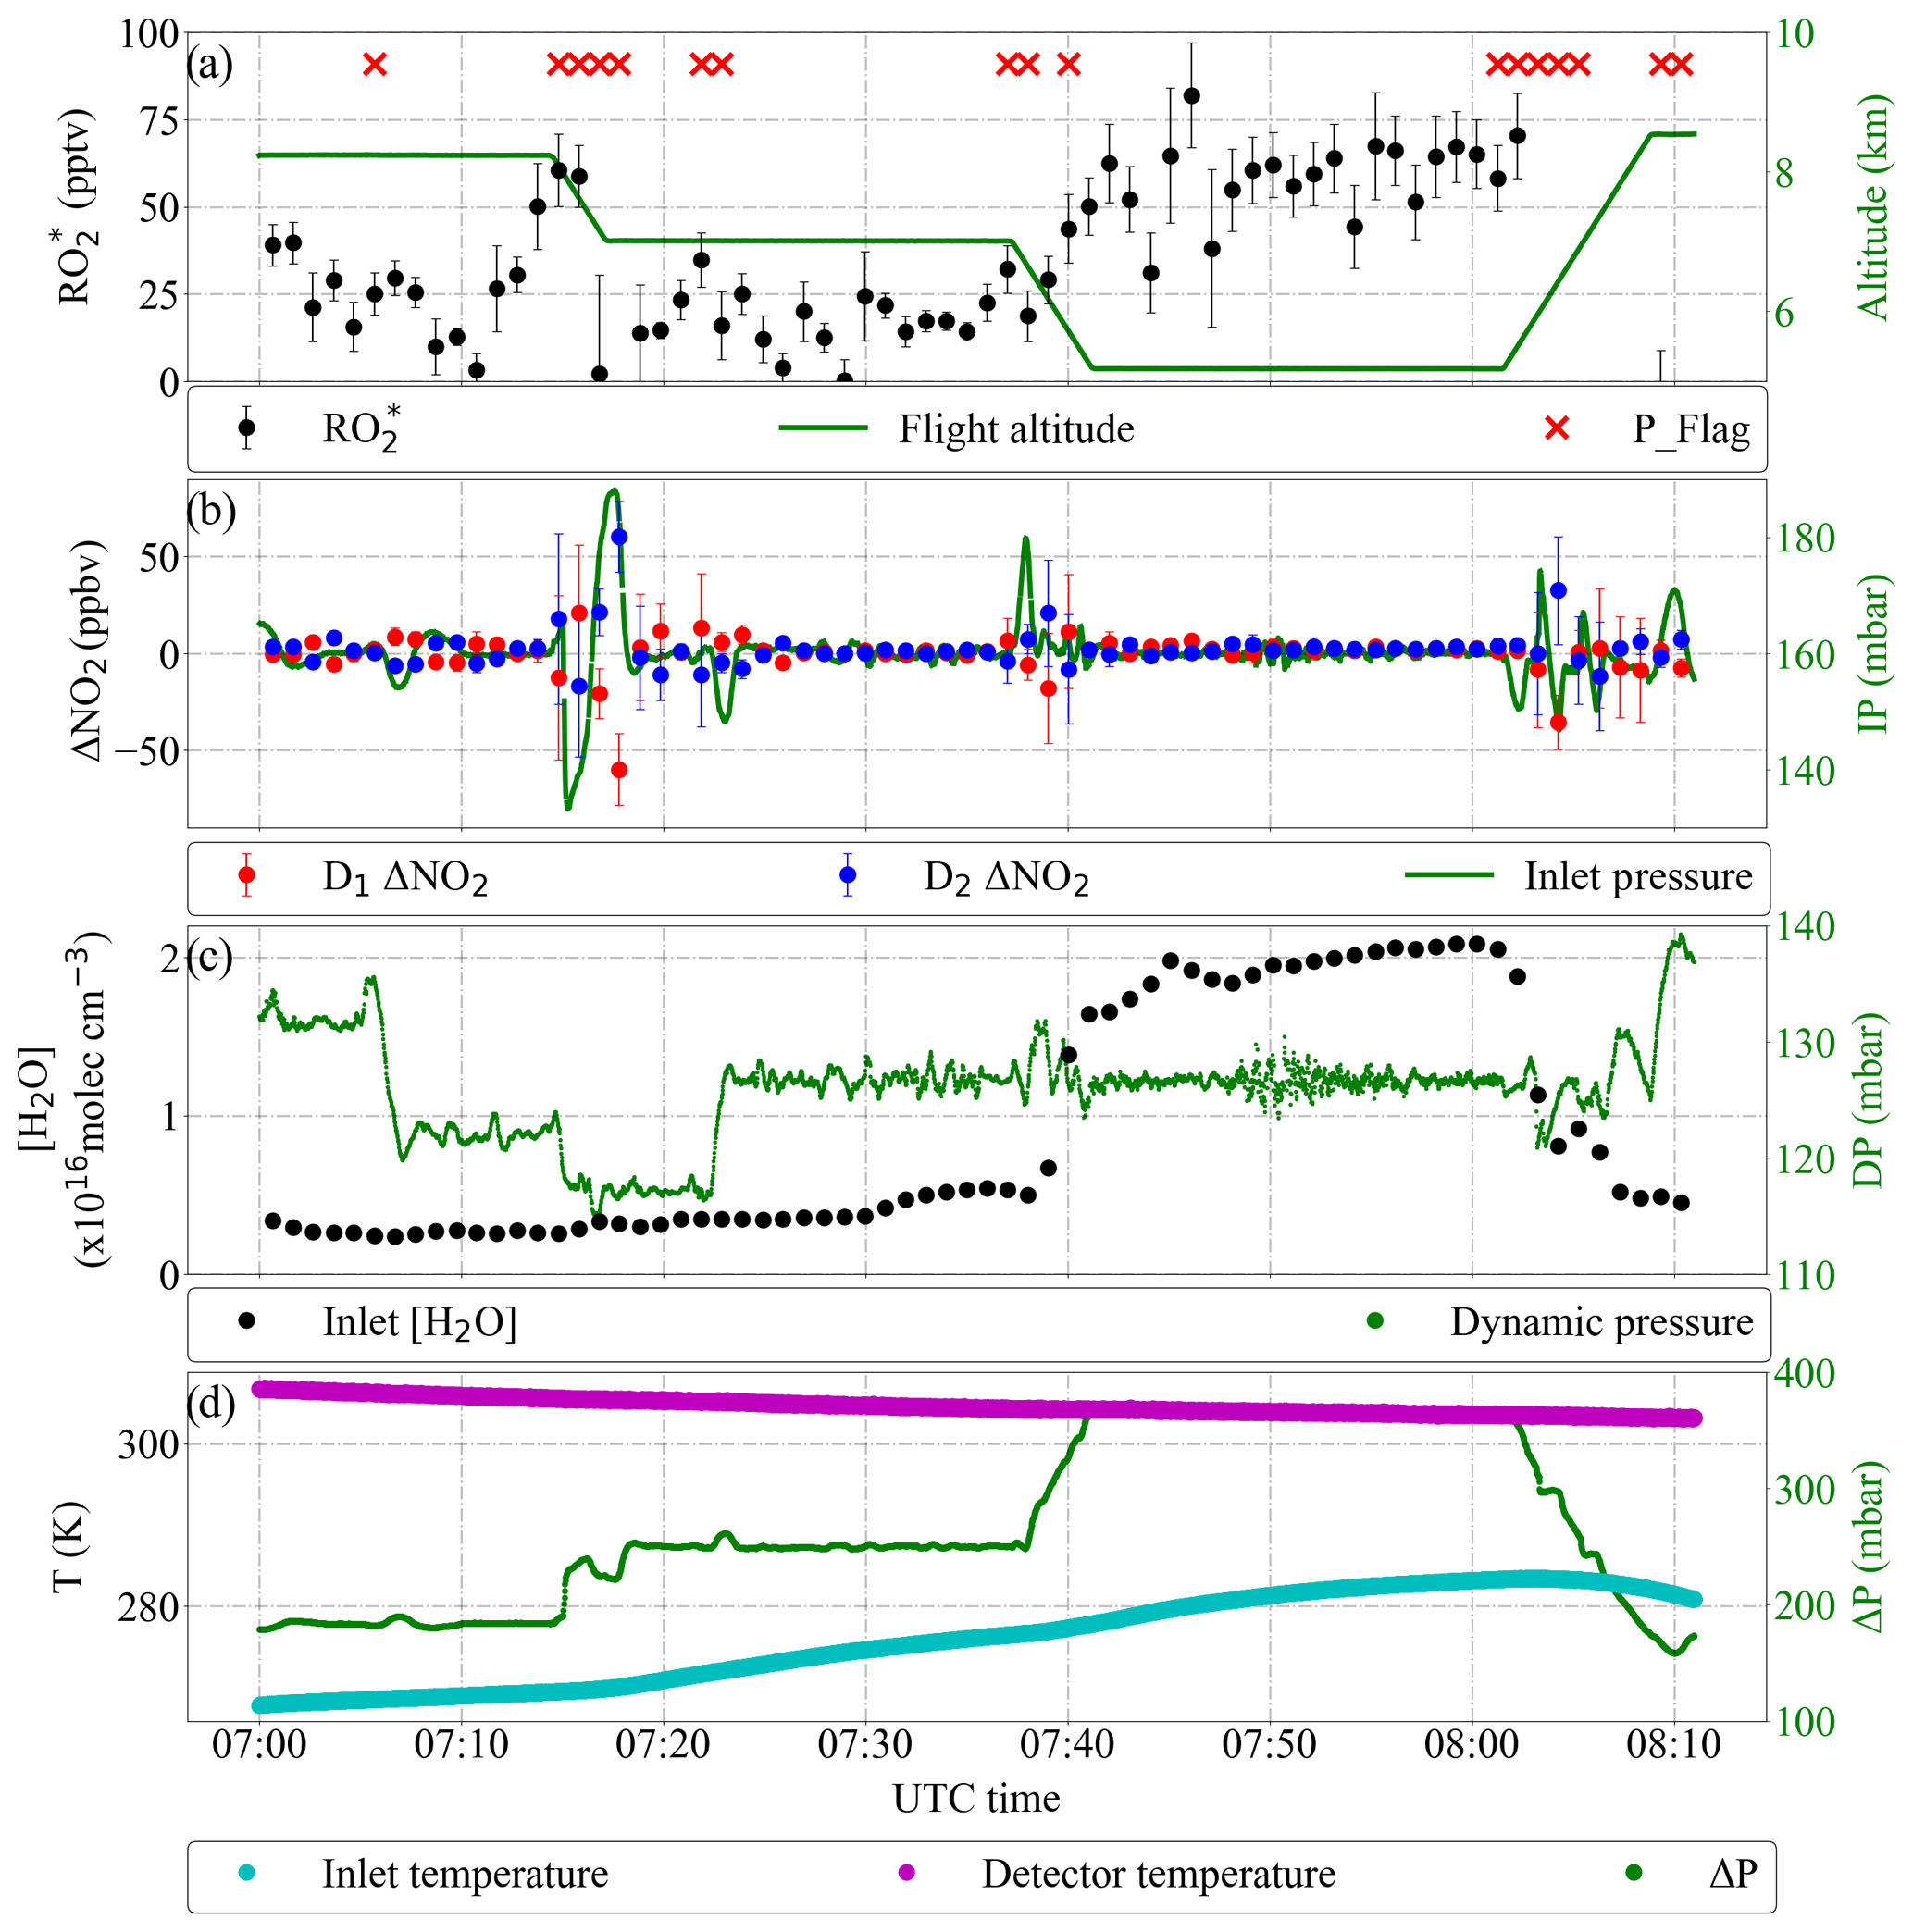
Figure 18Detail of PeRCEAS measurements during the OMO flight on 25 August 2015. The DUALER I inlet was operated with 15 ppmv NO and at 160 mbar. (a) Retrieved and flight altitude. Pressure variations with 1 min standard deviation > 2 mbar are flagged (red crosses); (b) ΔNO2 calculated from detector 1 (red dots), detector 2 (blue dots) and DUALER pressure. (c) Water number concentration in DUALER and dynamical pressure experienced by the aircraft. (d) DUALER inlet, detector temperature and pressure difference between inlet and outside pressure (ΔP).
4.4 detection limit and accuracy
The PeRCEAS detection limit for RO is calculated by dividing the NO2 detection limit by the corresponding eCL for each measurement condition set in the laboratory. Provided that is 60 pptv NO2 (3.15×10⁸ molec. cm−3 at 200 mbar and 23 ∘C), 2σ over 1 min as mentioned in Sect. 3.1, the varies between 1 and 2 pptv for the eCL values expected under dominant conditions in the free troposphere. The can additionally be determined from the eCL calibration curves at different measurement conditions, according to
Sa is the standard deviation of the y intercept and m is the slope of the NO2 versus HO2 calibration curve, as in Fig. 16. For controlled laboratory conditions, the is 5.3×10⁶ molec. cm−3 (≤2 pptv in all conditions investigated for DUALER I and DUALER II). As stated in Sect. 4.2, the accuracy is mainly dominated by the uncertainty in the eCL determination for each condition and amounts ∼15 %.
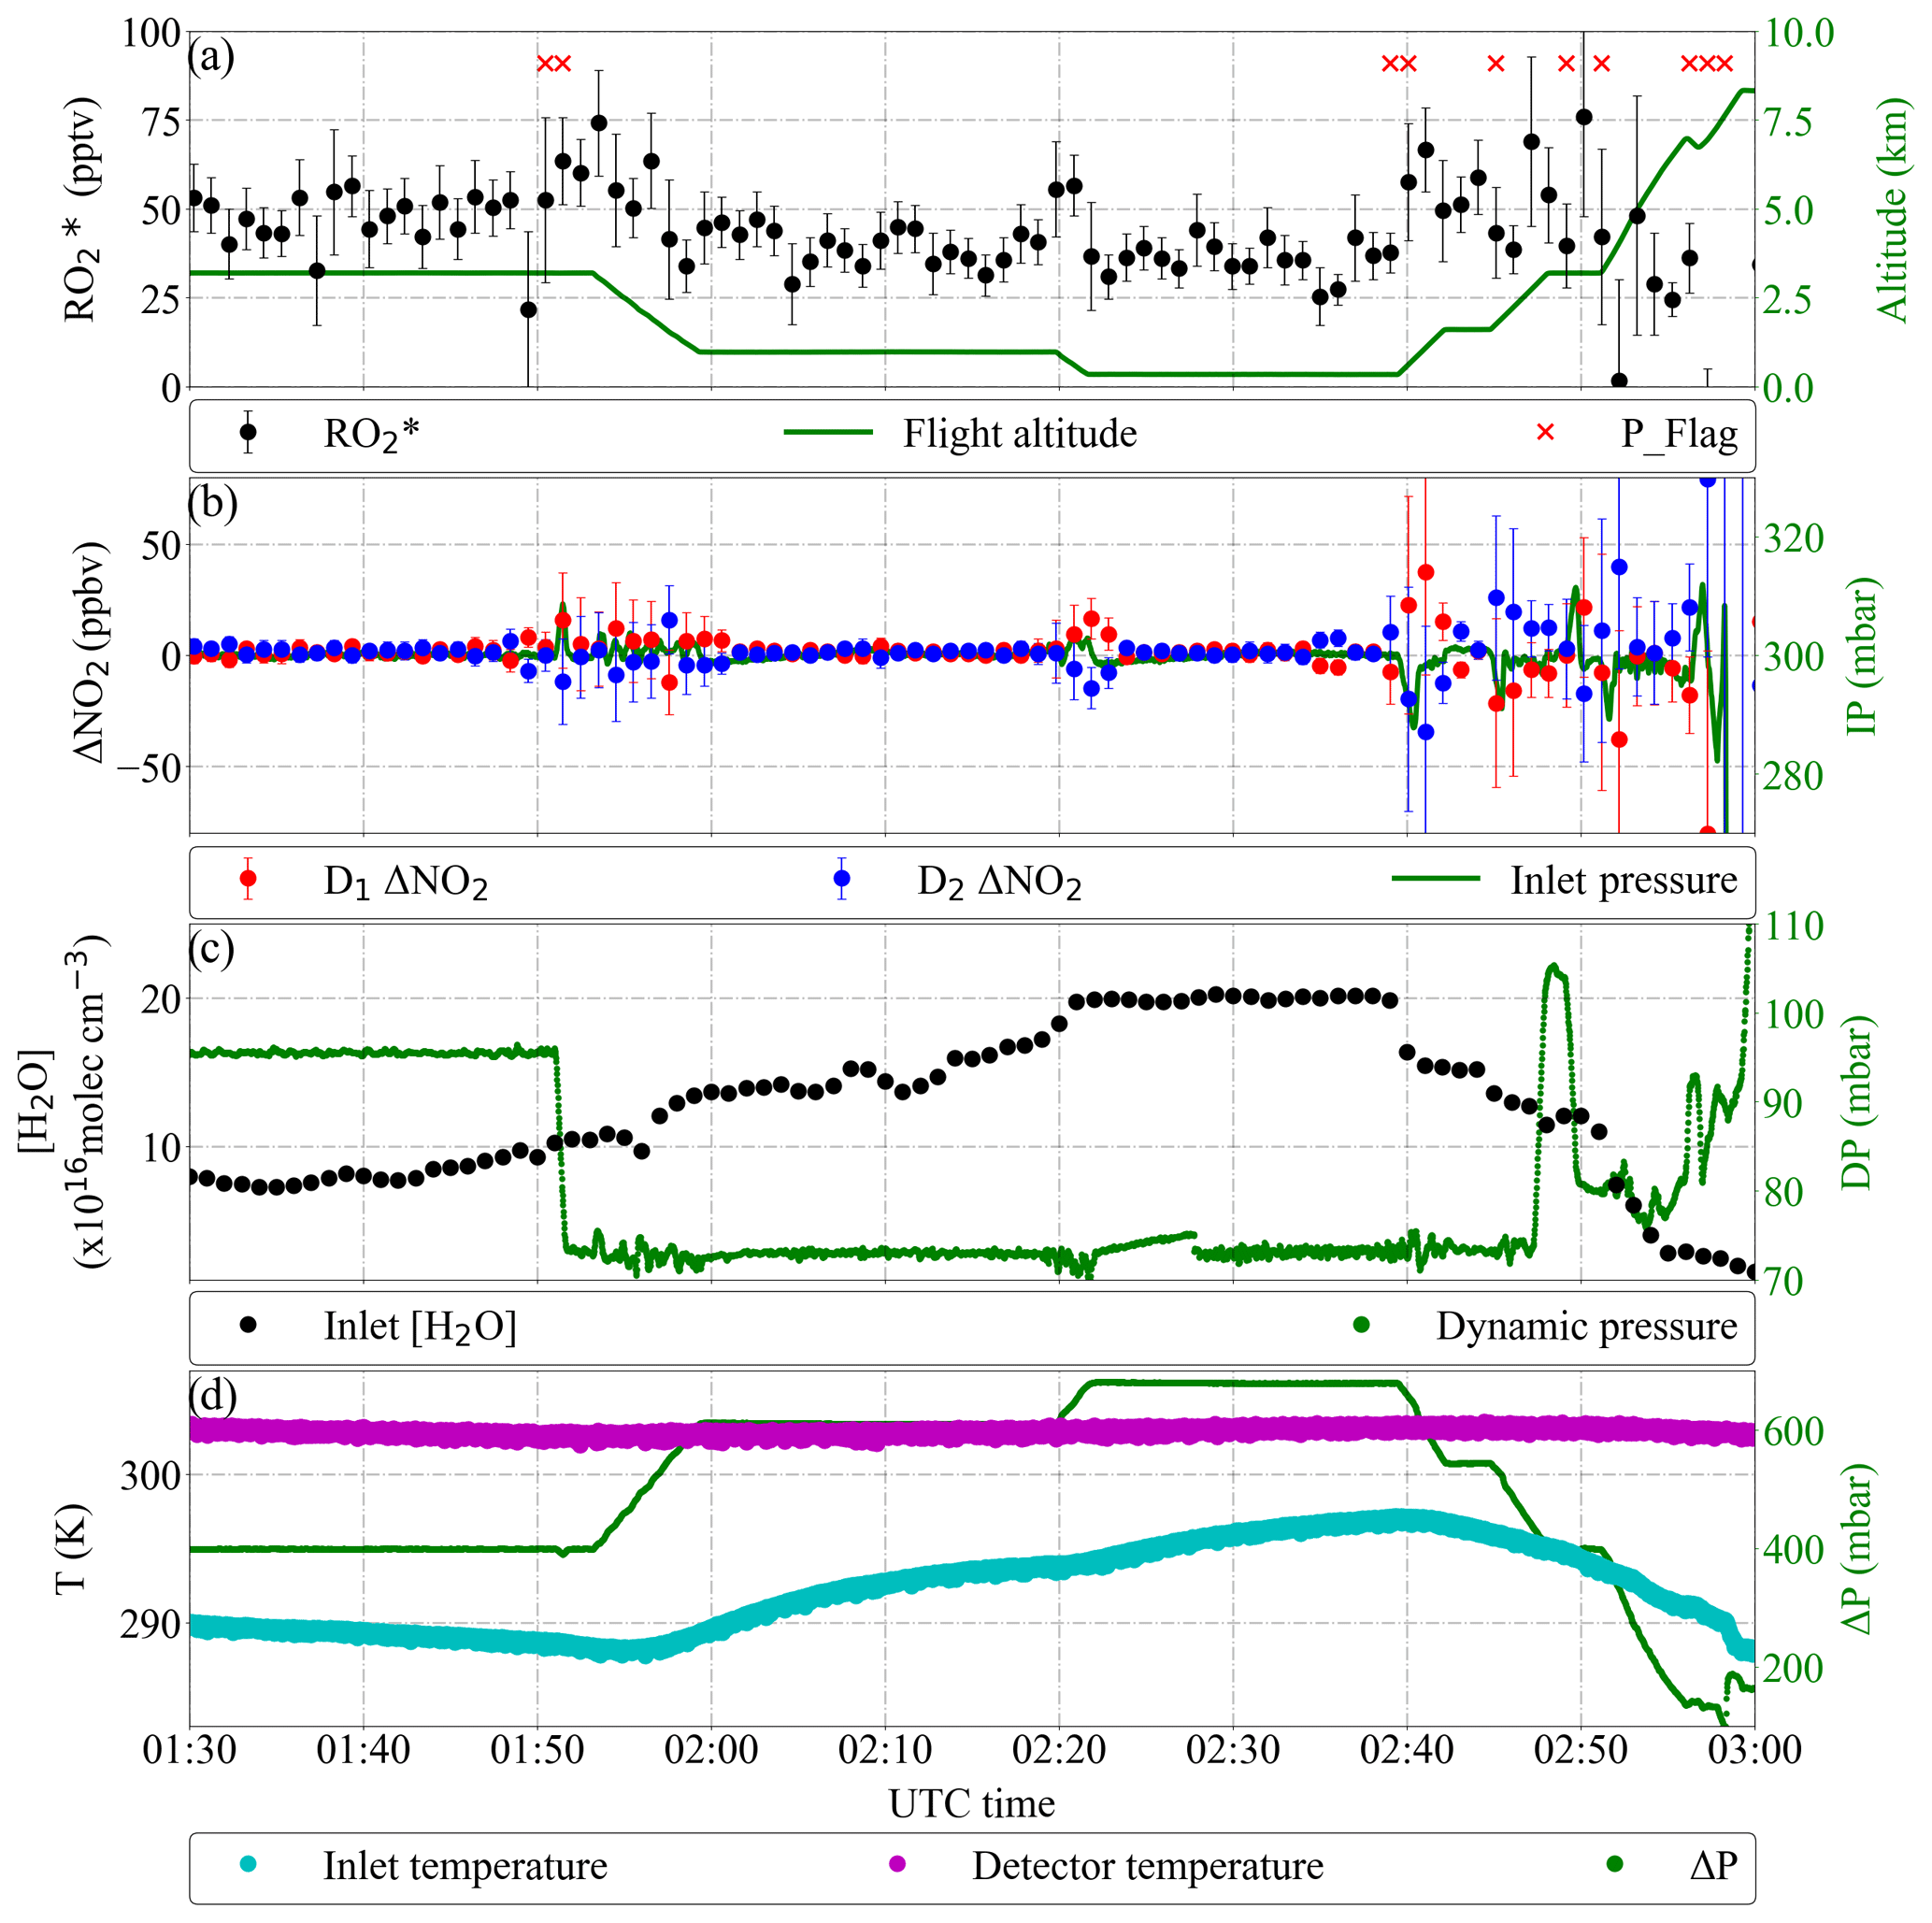
Figure 19Detail of PeRCEAS measurements during the EMeRGe flight in Asia on 19 March 2018. The DUALER II inlet was operated with 45 ppmv NO and at 300 mbar. (a) Retrieved and flight altitude. Pressure variations with 1 min standard deviation > 2 mbar are flagged (red crosses). (b) ΔNO2 calculated from detector 1 (red dots), detector 2 (blue dots) and DUALER pressure. (c) Water number concentration in DUALER and dynamical pressure experienced by the aircraft. (d) DUALER inlet, detector temperature and pressure difference between inlet and outside pressure (ΔP).
Conversely, as stated in previous sections, the in-flight PeRCEAS detector signals can be significantly affected by instabilities in physical parameters like pressure, temperature, flows, mechanical vibration and chemical composition which increase the uncertainty of the measurement. Therefore, the in-flight error in the measurement is calculated by taking into account the uncertainty of the eCL and the background variation in the signal within one modulation period as discussed in Sect. 4.3.
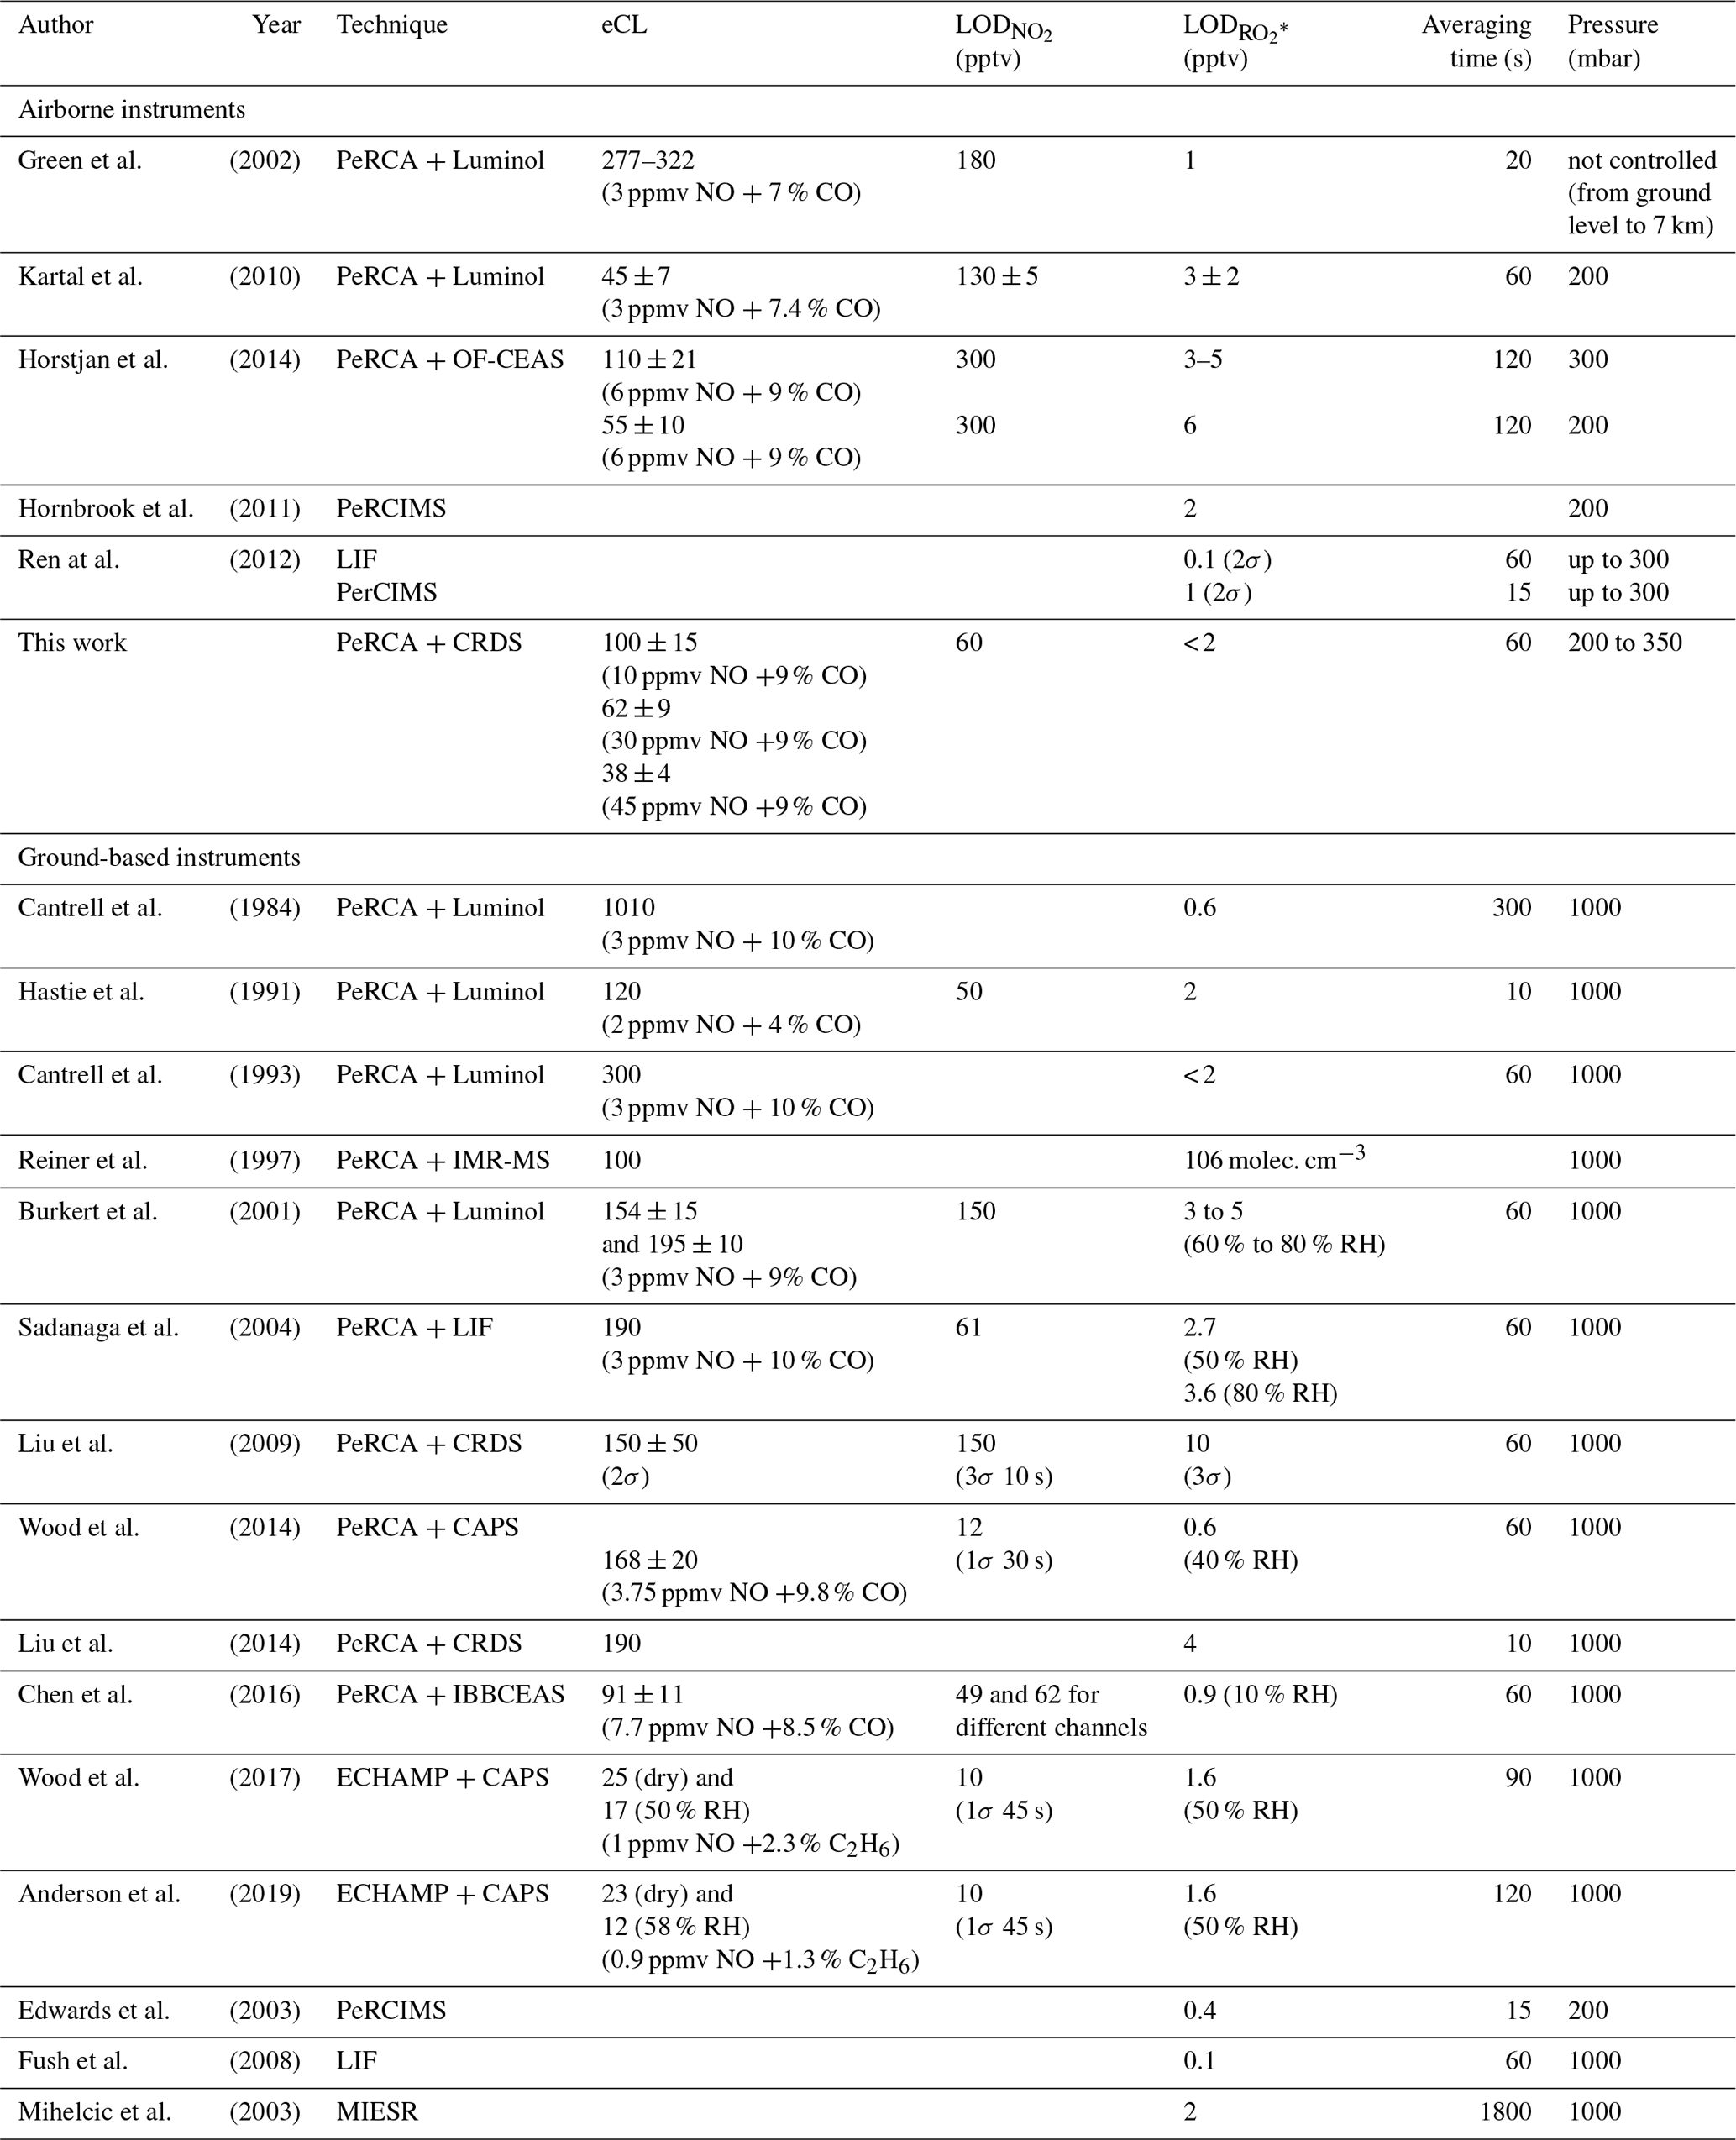
The current sensitivity of PeRCEAS on HALO is competitive with similar airborne peroxy radical instruments. Table 4 summarises the specifications of state-of-the-art instruments for the airborne measurement of peroxy radicals. Ground-based instruments are also included for comparison. Due to the differences in physical and chemical operating conditions, a direct comparison between methods is challenging and only possible for time resolution and detection limits related to well-defined and controlled measurement conditions. As mentioned in the introduction, MIESR, though being the only direct measurement technique of high precision, is not suitable for airborne measurements and is difficult to implement in field campaigns.
The pressure regulation in PeRCA based airborne instruments results in lower eCL than ground-based ones. This is attributed to radical losses in the pre-chamber prior to the addition of reagent gases for the radical chemical amplification. The modulation time limits the resolution, except in the case of continuous measurement of background and amplification signal by different detectors (e.g. Liu and Zhang, 2014). The increase in resolution is however associated with errors caused by differences in detector accuracy. In addition to this, during ambient measurement, the detection limit and uncertainty of PeRCA based instruments are dependent on the variation of O3 and NO2 in the sampled air mass. The speciation between HO2 and ∑ RO2 is challenging. LIF-based instruments have a better detection limit but are subject to interferences from RO2 in the sample (Fuchs et al., 2011).
4.5 PeRCEAS for airborne measurements of
PeRCEAS has up to date been successfully deployed in three airborne measurement campaigns aboard the HALO aircraft.
Figure 18 shows sample data of measured on 25 August 2015 over Egypt from 5 to 8.5 km during the first flight deployment of PeRCEAS in the OMO campaign. The ΔP () and [H2O] in the inlet remained below the calculated yield values to affect the eCL stability.
As can be seen in Fig. 18, the dynamic pressure variations experienced by the aircraft influence the stability of the inlet pressure. The effect of inlet pressure instabilities on the retrieved ΔNO2 is not exactly identical for both detector signals. This leads to additional uncertainty in the determination when using the procedure discussed in Sect. 4.3. For the data analysis, pressure spikes within 1 min standard deviation higher than 2 mbar are identified and flagged. This approach enables data with large error due to dynamic pressure changes to be identified. Overall, the error in the retrieved is around 20 % in the measurement period shown in Fig. 18.
In Fig. 19, 2 h of measurements from the flight on 19 March 2018 are shown in Fig. 19 as an example of the third airborne deployment of PeRCEAS within the EMeRGe campaign in Asia. As can be seen in the figure, pressure fluctuations due to dynamic pressure changes have been reduced by up to 80 % in the improved PeRCEAS. Although the measured ΔNO2 is affected by altitude changes, the value of the retrieved does not change significantly except for the maximum climbing rate directly after take-off. Furthermore, the beam camera and the motorised mirror mounts enable the identification and immediate correction of small misalignments. This improves significantly the instrumental performance while simplifying maintenance.
The results show the capability of PeRCEAS to capture variations even in rapidly changing air masses from the boundary layer to the upper troposphere. The instrument performance is stable over the 7 h of the mission flights, indicating the robustness of the instrument towards mechanical vibrations and temperature variations. Further analysis of data obtained during measurement campaigns together with models and other trace gas measurements is ongoing.
The accurate measurement of peroxy radicals is essential to improve the present understanding of the chemistry in the free troposphere. The PeRCEAS instrument has been designed, developed and thoroughly characterised for the measurement of the total sum of peroxy radicals aboard airborne platforms. Parameters expected to affect the precision and accuracy of the measurement have been investigated in detail. Variations in the composition of the air mass within the modulation time are well captured when keeping the reactors out of phase and in alternating background/amplification modes with detectors of similar signal to noise ratio stability. Under controlled conditions in the laboratory, the detection limit remains around 5.3×10⁶ molec. cm−3 (≤2 pptv) over a 60 s integration time for instrumental pressures from 160 to 350 mbar.
The performance of the PeRCEAS instrument has been proven to be suitable for airborne measurements during different campaigns aboard HALO. The in-flight precision and detection limit depends critically on the features of the flight like pressure, temperature, flows, mechanical vibration, water number concentration and short-term variations in the chemical composition and must be calculated for each particular flight track. Therefore, the optimisation of the instrument had a particular focus on the robustness of the dynamical and detector signal stabilities, which makes PeRCEAS a reliable instrument for most flying conditions in the free troposphere.
The data published in this manuscript can be obtained upon request to the first author.
The supplement related to this article is available online at: https://doi.org/10.5194/amt-13-2577-2020-supplement.
MG and MDAH designed the experiments; MG, VN and YL carried them out. VN carried out the implementation in the HALO aircraft. MG prepared the manuscript with contributions from all co-authors. MDAH and JPB originated the measurement concept and participated in the research and the data analysis presented.
The authors declare that they have no conflict of interest.
This article is part of the special issue “Effect of Megacities on the Transport and Transformation of Pollutants at Regional and Global Scales (EMeRGe) (ACP/AMT inter-journal SI)”. It is not associated with a conference.
The authors acknowledge funding for this study by the University of Bremen, the state of Bremen and the HALO SPP 1294 grant from the DFG Deutsche Forschungsgemeinschaft. Special thanks are given to the mechanical workshop of the University of Bremen and to Wilke Thomssen for the support in the construction and certification of the PeRCEAS instrument. The authors explicitly thank the Max Planck Institute in Mainz Air Chemistry Department (director: Jos Lelieveld) for the provision of the secondary containment for HALO and the HALO SSC for recommending the funding its improvement and further optimisation. The authors also explicitly thank Enviscope GmbH for their flexible support in helping to deliver the flight worthiness certification of PeRCEAS, the secondary gas containment for use in HALO and the provision of support during the OMO and EMeRGe campaigns. The authors also thank their colleagues in the OMO and EMeRGe communities for their collaboration, helpful discussions and support during the HALO flight campaigns. The authors express their gratitude towards the associate editor, Anna Novelli, and the anonymous referees for the valuable comments which helped to improve the quality of the manuscript.
The authors acknowledge funding for this study by the University of Bremen,
the state of Bremen and the HALO SPP 1294 grant from the DFG Deutsche
Forschungsgemeinschaft.
The article processing charges for this open-access publication were covered by the University of Bremen.
This paper was edited by Anna Novelli and reviewed by two anonymous referees.
Albrecht, S. R., Novelli, A., Hofzumahaus, A., Kang, S., Baker, Y., Mentel, T., Wahner, A., and Fuchs, H.: Measurements of hydroperoxy radicals (HO2) at atmospheric concentrations using bromide chemical ionisation mass spectrometry, Atmos. Meas. Tech., 12, 891–902, https://doi.org/10.5194/amt-12-891-2019, 2019.
Allan, D. W.: Statistics of atomic frequency standards, Pr. Inst. Electr. Elect., 54, 221–230, 1966.
Anderson, D. C., Pavelec, J., Daube, C., Herndon, S. C., Knighton, W. B., Lerner, B. M., Roscioli, J. R., Yacovitch, T. I., and Wood, E. C.: Characterization of ozone production in San Antonio, Texas, using measurements of total peroxy radicals, Atmos. Chem. Phys., 19, 2845–2860, https://doi.org/10.5194/acp-19-2845-2019, 2019.
Andrés-Hernández, M. D., Kartal, D., Reichert, L., Burrows, J. P., Meyer Arnek, J., Lichtenstern, M., Stock, P., and Schlager, H.: Peroxy radical observations over West Africa during AMMA 2006: photochemical activity in the outflow of convective systems, Atmos. Chem. Phys., 9, 3681–3695, https://doi.org/10.5194/acp-9-3681-2009, 2009.
Andrés-Hernández, M. D., Stone, D., Brookes, D. M., Commane, R., Reeves, C. E., Huntrieser, H., Heard, D. E., Monks, P. S., Burrows, J. P., Schlager, H., Kartal, D., Evans, M. J., Floquet, C. F. A., Ingham, T., Methven, J., and Parker, A. E.: Peroxy radical partitioning during the AMMA radical intercomparison exercise, Atmos. Chem. Phys., 10, 10621–10638, https://doi.org/10.5194/acp-10-10621-2010, 2010.
Atkinson, D. B.: Solving chemical problems of environmental importance using cavity ring-down spectroscopy, Analyst, 128, 117–125, 2003.
Berden, G. and Engeln, R.: Cavity Ring-Down Spectroscopy: Techniques and Applications, John Wiley & Sons Ltd, The Atrium, Southern Gate, Chichester, West Sussex, UK, https://doi.org/10.1002/9781444308259.fmatter, 2010.
Brown, S.: Absorption Spectroscopy in High-Finesse Cavities for Atmospheric Studies, Chem. Rev., 103, 5219–5238, 2003.
Burkert, J., Behmann, T., Andrés Hernández, M. D., Weissenmayer, M., Perner, D., and Burrows, J. P.: Measurements of peroxy radicals in a forested area in Portugal, Chemosphere, 3, 3327–3338, 2001a.
Burkert, J., Andrés Hernández, M. D., Stöbener, D., Burrows, J. P., Weissenmayer, M., and Kraus, A.: Peroxy radical and related trace gas measurement in the marine boundary layer above the Atlantic Ocean, J. Geophys. Res., 106, 5457–5477, 2001b.
Burkholder, J. B., Sander, S. P., Abbatt, J., Barker, J. R., Huie, R. E., Kolb, C. E., Kurylo, M. J., Orkin, V. L. Wilmouth, D. M., and Wine P. H.: Chemical Kinetics and Photochemical Data for Use in Atmospheric Studies, Evaluation No. 18, JPL Publication 15-10, Jet Propulsion Laboratory, Pasadena, available at: http://jpldataeval.jpl.nasa.gov (last access: 7 April 2020), 2015.
Cantrell, C. A. and Stedman, D. H.: A possible technique for the measurement of atmospheric peroxy radicals, Geophys. Res. Lett., 9, 846–849, 1982.
Cantrell, C. A., Stedman, D. H., and Wendel, G. J.: Measurement of atmospheric peroxy radicals by chemical amplification, Anal. Chem., 56, 1496–1502, 1984.
Cantrell, C. A., Shetter, R. E., Lind, A. J., McDaniel, A. H., and Calvert, J. G.: An improved chemical amplifier technique for peroxy radical measurements, J. Geophys. Res, 98, 2897–2909, 1993.
Cantrell, C. A., Shetter, R. E., and Calvert, J. G.: Dual-inlet chemical amplifier for atmospheric peroxy radical measurements, Anal. Chem., 68, 4194–4199, 1996.
Cantrell, C. A., Zimmer, A., and Tyndall, G. S.: Absorption cross sections for water vapour from 183 to 193 nm, Geophys. Res. Lett., 24, 2195–2198, 1997.
Carslaw, N., Creasey, D. J., Heard, D. E., Jacobs, P. J., Lee, J. D., Lewis, A. C., Bauguitte, S., Penkett, S. A., Monks, P. S., and Salisbury, G.: Eastern atlantic spring experiment 1997 (EASE97) 2. Comparisons of model concentrations of OH, HO2, and RO2 with measurements, J. Geophys. Res., 107, 4190, https://doi.org/10.1029/2001JD001568, 2002.
Chen, Y., Chengqian, Y., Zhao, W., Fang, B., Xuezhe, X., Gai, Y., Lin, X., Chend, W., and Zhang, W.: Ultra-sensitive measurement of peroxy radicals by chemical amplification broadband cavity-enhanced spectroscopy, Analyst, 141, 5870, https://doi.org/10.1039/c6an01038e, 2016.
Chrobry, A.: Development and laboratory characterization of a sampling system for airborne measurements of peroxy radicals using chemical amplification, PhD dissertation, University of Bremen, Bremen, 2013.
Clemitshaw, K. C.: A review of instrumentation and measurement techniques for ground-based and airborne field studies of gas-phase tropospheric chemistry, Crit. Rev. Env. Sci. Tec., 34, 1–108, https://doi.org/10.1080/10643380490265117, 2004.
Clemitshaw, K. C., Carpenter, L. J., Penkett, S. A., and Jenkin M. E.: A calibrated peroxy radical chemical amplifier for ground-based tropospheric measurements, J. Geophys. Res., 102, 25405–25416, 1997.
Creasey, D., Heard, D. E., and Lee, J. D.: Absorption cross-section measurements of water vapour and oxygen at 185 nm. Implications for the calibration of field instruments to measure OH, HO2 and RO2 radicals, Geophys. Res. Lett., 27, 1651–1654, 2000.
Creasey, D. J., Heard, D. E., Halford-Maw, P. A., Pilling, M. J., and Whitaker, B. J.: Implementation and initial deployment of a field instrument for measurement of OH and HO2 in the troposphere by laser-induced fluorescence, J. Chem. Soc. Faraday T., 93, 2907–2913, 1997.
Duncianu, M., Lahib, A., Alexandre, T., Stevens, P. S., and Dusanter, S.: Characterisation of a chemical amplifier for peroxy radical measurements in the atmosphere, Atmos. Environ., 222, 117106, https://doi.org/10.1016/j.atmosenv.2019.117106, 2020.
Edwards, G. D., Cantrell, C. A., Stephens, S., Hill, B., Goyea, O., Shetter, R. E., Mauldin, R. L., Kosciuch, E., Tanner, D. J., and Eisele, F. L.: Chemical ionization mass spectrometer instrument for the measurement of tropospheric HO2 and RO2, Anal. Chem., 75, 5317–5327, https://doi.org/10.1021/ac034402b, 2003.
Emmerson, K. M., Carslaw, N., Carslaw, D. C., Lee, J. D., McFiggans, G., Bloss, W. J., Gravestock, T., Heard, D. E., Hopkins, J., Ingham, T., Pilling, M. J., Smith, S. C., Jacob, M., and Monks, P. S.: Free radical modelling studies during the UK TORCH Campaign in Summer 2003, Atmos. Chem. Phys., 7, 167–181, https://doi.org/10.5194/acp-7-167-2007, 2007.
Faloona, I. C., Tan, D., Lesher, R. L., Hazen, N., Frame, C. L., Simpas, J. B., Harder, H., Martinez, M., Di Carlo, P., Ren, X., and Brune, W. H.: A Laser- induced Fluorescent Instrument for detecting Tropospheric OH and HO2; Characteristics and Calibration, J. Atmos. Chem. 47, 139–167, 2004.
Fleming, Z. L., Monks, P. S., Rickard, A. R., Bandy, B. J., Brough, N., Green, T. J., Reeves, C. E., and Penkett, S. A.: Seasonal dependence of peroxy radical concentrations at a Northern hemisphere marine boundary layer site during summer and winter: evidence for radical activity in winter, Atmos. Chem. Phys., 6, 5415–5433, https://doi.org/10.5194/acp-6-5415-2006, 2006a.
Fleming, Z. L., Monks, P. S., Rickard, A. R., Heard, D. E., Bloss, W. J., Seakins, P. W., Still, T. J., Sommariva, R., Pilling, M. J., Morgan, R., Green, T. J., Brough, N., Mills, G. P., Penkett, S. A., Lewis, A. C., Lee, J. D., Saiz-Lopez, A., and Plane, J. M. C.: Peroxy radical chemistry and the control of ozone photochemistry at Mace Head, Ireland during the summer of 2002, Atmos. Chem. Phys., 6, 2193–2214, https://doi.org/10.5194/acp-6-2193-2006, 2006b.
Fuchs, H., Brauers, T., Häseler, R., Holland, F., Mihelcic, D., Müsgen, P., Rohrer, F., Wegener, R., and Hofzumahaus, A.: Intercomparison of peroxy radical measurements obtained at atmospheric conditions by laser-induced fluorescence and electron spin resonance spectroscopy, Atmos. Meas. Tech., 2, 55–64, https://doi.org/10.5194/amt-2-55-2009, 2009.
Fuchs, H., Brauers, T., Dorn, H.-P., Harder, H., Häseler, R., Hofzumahaus, A., Holland, F., Kanaya, Y., Kajii, Y., Kubistin, D., Lou, S., Martinez, M., Miyamoto, K., Nishida, S., Rudolf, M., Schlosser, E., Wahner, A., Yoshino, A., and Schurath, U.: Technical Note: Formal blind intercomparison of HO2 measurements in the atmosphere simulation chamber SAPHIR during the HOxComp campaign, Atmos. Chem. Phys., 10, 12233–12250, https://doi.org/10.5194/acp-10-12233-2010, 2010.
Fuchs, H., Bohn, B., Hofzumahaus, A., Holland, F., Lu, K. D., Nehr, S., Rohrer, F., and Wahner, A.: Detection of HO2 by laser-induced fluorescence: calibration and interferences from RO2 radicals, Atmos. Meas. Tech., 4, 1209–1225, https://doi.org/10.5194/amt-4-1209-2011, 2011.
Green, T. J., Brough, N., Reeves, C. E., Edwards, G. D., Monks P. S., and Penkett, S. A.: Airborne measurements of peroxy radicals using the PERCA technique, J. Environ. Monitor., 5, 75–83, 2002.
Green, T. J., Reeves, C. E., Fleming, Z. L., Brough, N., Rickard, R. A., Bandy, B. J., Monks, P. S., and Penkett, S. A.: An improved dual channel PERCA instrument for atmospheric measurements of peroxy radicals, J. Environ. Monitor., 8, 530–536, https://doi.org/10.1039/b514630e, 2006.
Hanke, M., Uecker, J., Reiner, T., and Arnold, F.: Atmospheric peroxy radicals: ROXMAS, a new mass-spectrometric methodology for speciated measurements of HO2 and RO2 and first results, Int. J. Mass Spectrom., 213, 91–99, https://doi.org/10.1016/S1387-3806(01)00548-6, 2002.
Hard, T. M., O'Brien, R. J., Chan, C. Y., and Mehrabzadeh, A. A.: Tropospheric free radical determination by FAGE, Environ. Sci. Technol., 18, 768–777, 1984.
Hastie, D. R., Weissenmayer, M., Burrows, J. P., and Harris, G. W.: Calibrated chemical amplifier for atmospheric ROx measurements, Anal. Chem., 63, 2048–2057, 1991.
Hayman, G. D.: Numerical Model of the Calibration Source of a PERCA Instrument, AEAT-24737/20410001/001, 1997.
Heard, D.: Analytical Techniques for Atmospheric Measurement, Blackwell Publishing Ltd, Oxford, UK, 528 pp., https://doi.org/10.1002/9780470988510, 2006.
Hofzumahaus, A., Brauers, T., Aschmutat, U., Brandenburger, U.,Dorn, H. P., Hausmann, M., Heßling, M., Holland, F., PlassDulmer, C., Sedlacek, M., Weber, M., and Ehhalt, D. H.: Reply, Geophys. Res. Lett., 24, 3039–3040, 1997.
Hofzumahaus, A., Rohrer, F., Lu, K., Bohn, B., Brauers, T., Chang, C.-C., Fuchs, H., Holland, F., Kita, K., Kondo, Y., Li, X., Lou, S., Shao, M., Zeng, L., Wahner, A., and Zhang, Y.: Amplified trace gas removal in the troposphere, Science, 324, 1702–1704, https://doi.org/10.1126/science.1164566, 2009.
Holland, F., Hofzumahaus, A., Schäfer, J., Kraus, A., and Pätz, H.-W.: Measurements of OH and HO2 radical concentrations and photolysis frequencies during BERLIOZ, J. Geophys. Res.-Atmos., 108, 8246, https://doi.org/10.1029/2001jd001393, 2003.
Hornbrook, R. S., Crawford, J. H., Edwards, G. D., Goyea, O., Mauldin III, R. L., Olson, J. S., and Cantrell, C. A.: Measurements of tropospheric HO2 and RO2 by oxygen dilution modulation and chemical ionization mass spectrometry, Atmos. Meas. Tech., 4, 735–756, https://doi.org/10.5194/amt-4-735-2011, 2011.
Horstjann, M., Andrés Hernández, M. D., Nenakhov, V., Chrobry, A., and Burrows, J. P.: Peroxy radical detection for airborne atmospheric measurements using absorption spectroscopy of NO2, Atmos. Meas. Tech., 7, 1245–1257, https://doi.org/10.5194/amt-7-1245-2014, 2014.
Ianni, J. C.: A Comparison of the Bader-Deuflhard and the Cash-Karp Runge-Kutta Integrators for the GRI-MECH 3.0 Model Based on the Chemical Kinetics Code Kintecus, 1368–1372, Computational Fluid and Solid Mechanics 2003, edited by: Bathe, K. J., Elsevier Science Ltd., Oxford, UK, 2003.
Ianni, J. C.: Kintecus, Windows Version 6.01, available at: http://www.kintecus.com (last access: 7 April 2020), 2017.
Kanaya, Y., Sadanaga, Y., Matsumoto, J., Sharma, U. K.,Hirokawa, J., Kajii, Y., and Akimoto, H.: Nighttime observation of the HO2 radical by an LIF based instrument on Oki island, Japan, and its possible origins, Geophys. Res. Lett., 26, 2179–2182, 1999.
Kanaya, Y., Cao, R., Akimoto, H., Fukuda, M., Komazaki, Y., Yokouchi, Y., Koike, M., Tanimoto, H., Takegawa, N., and Kondo, Y.: Urban photochemistry in central Tokyo: 1. Observed and modeled OH and HO2 radical concentrations during the winter and summer of 2004, J. Geophys. Res., 112, D21312, https://doi.org/10.1029/2007JD008670, 2007.
Kanaya, Y., Hofzumahaus, A., Dorn, H.-P., Brauers, T., Fuchs, H., Holland, F., Rohrer, F., Bohn, B., Tillmann, R., Wegener, R., Wahner, A., Kajii, Y., Miyamoto, K., Nishida, S., Watanabe, K., Yoshino, A., Kubistin, D., Martinez, M., Rudolf, M., Harder, H., Berresheim, H., Elste, T., Plass-Dülmer, C., Stange, G., Kleffmann, J., Elshorbany, Y., and Schurath, U.: Comparisons of observed and modeled OH and HO2 concentrations during the ambient measurement period of the HOxComp field campaign, Atmos. Chem. Phys., 12, 2567–2585, https://doi.org/10.5194/acp-12-2567-2012, 2012.
Kartal, D.: Characterization and optimization optimisation of a dual channel PERCA for the investigation of the chemistry of peroxy radicals in the upper troposphere, PhD thesis, University of Bremen, Germany, 2009.
Kartal, D., Andrés-Hernández, M. D., Reichert, L., Schlager, H., and Burrows, J. P.: Technical Note: Characterisation of a DUALER instrument for the airborne measurement of peroxy radicals during AMMA 2006, Atmos. Chem. Phys., 10, 3047–3062, https://doi.org/10.5194/acp-10-3047-2010, 2010.
Kukui, A., Legrand, M., Preunkert, S., Frey, M. M., Loisil, R., Gil Roca, J., Jourdain, B., King, M. D., France, J. L., and Ancellet, G.: Measurements of OH and RO2 radicals at Dome C, East Antarctica, Atmos. Chem. Phys., 14, 12373–12392, https://doi.org/10.5194/acp-14-12373-2014, 2014.
Lelieveld, J., Bourtsoukidids, E., Brühl, C., Fischer, H., Fuchs, H., Harder, H., Hofzumahaus, A, Holland, F., Marno, D., Neumeier, M., Pozzer, A., Schlager, H., Williams, J., Zahn, A., and Ziereis, H.: The South Asian monsoon–Pollution pump and purifier, Science, https://doi.org/10.1126/science.aar2501, 2018.
Lew, M. M., Dusanter, S., and Stevens, P. S.: Measurement of interferences associated with the detection of the hydroperoxy radical in the atmosphere using laser-induced fluorescence, Atmos. Meas. Tech., 11, 95–109, https://doi.org/10.5194/amt-11-95-2018, 2018.
Lightfoot, P. D., Cox, R. A., Crowley, J. N., Destriau, M., Hayman, G. D., Jenkin, M. E., Moortgat, G. K., and Zabel, F.: Organic Peroxy Radicals, kinetics, spectroscopy and tropospheric chemistry, Atmos. Environ., 26A, 1805–1961, 1992.
Liu, Y. and Zhang, J.: Atmospheric Peroxy Radical Measurements Using Dual-Channel Chemical Amplification Cavity Ringdown Spectroscopy, Anal. Chem., 86, 5391–5398, 2014.
Liu, Y., Morales-Cueto, R., Hargrove, J., Medina, D., and Zhang, J.: Measurements of peroxy radicals using chemical amplification cavity ring down spectroscopy, Environ. Sci. Technol., 43, 7791–7796, 2009.
Mao, J., Jacob, D. J., Evans, M. J., Olson, J. R., Ren, X., Brune, W. H., Clair, J. M. St., Crounse, J. D., Spencer, K. M., Beaver, M. R., Wennberg, P. O., Cubison, M. J., Jimenez, J. L., Fried, A., Weibring, P., Walega, J. G., Hall, S. R., Weinheimer, A. J., Cohen, R. C., Chen, G., Crawford, J. H., McNaughton, C., Clarke, A. D., Jaeglé, L., Fisher, J. A., Yantosca, R. M., Le Sager, P., and Carouge, C.: Chemistry of hydrogen oxide radicals (HOx) in the Arctic troposphere in spring, Atmos. Chem. Phys., 10, 5823–5838, https://doi.org/10.5194/acp-10-5823-2010, 2010.
Mihelcic, D., Müsgen, P., and Ehhalt, D. H.: An improved method of measuring tropospheric NO2 and RO2 by matrix isolation and electron spin resonance, J. Atmos. Chem., 3, 341–361, 1985.
Mihelcic, D., Holland, F., Hofzumahaus, A., Hoppe, L., Konrad, S., Müsgen, P., Pätz, H.-W., Schäfer, H.-J., Schmitz. T., Volz-Thomas, A., Bächmann, K., Schlomski, S., Platt, U., Gezer, A., Alicke, B., and Moortgat G. K.: Peroxy radicals during BERLIOZ at Pabstthum: Measurements, radical budgets and ozone production, J. Geophys. Res., 108, 8254, https://doi.org/10.1029/2001JD001014, 2003.
Mihele, C. M. and Hastie, D. R.: The sensitivity of the radical amplifier to ambient water vapour, Geophys. Res. Lett., 25, 1911–1913, 1998.
Mihele, C. M., Mozurkewich, M., and Hastie, D. R.: Radical loss in a chain reaction of CO and NO in the presence of water: Implications for the radical amplifier and atmospheric chemistry, Int. J. Chem. Kinet., 31, 145–152, 1999.
Monks, P. S., Carpenter, L. J., Penkett, S. A., Ayers, G. P., Gillett, R. W., Galbally, I. E., and Meyer, C. P.: Fundamental ozone photochemistry in the remote marine boundary layer: the SOAPEX experiment, measurement and theory, Atmos. Environ., 32, 3647–3664, 1998.
Monks, P. S., Granier, C., Fuzzi, S., Stohl, A., Williams, M. L., Akimoto, H., Amann, M., Baklanov, A., Baltensperger, U., Bey, I., Blake, N., Blake, R. S., Carslaw, K., Cooper, O. R., Dentener, F., Fowler, D., Fragkou, E., Frost, G. J., Generoso, S., Ginoux, P., Grewe, V., Guenther, A., Hansson, H. C., Henne, S., Hjorth, J., Hofzumahaus, A., Huntrieser, H., Isaksen, I. S. A., Jenkin, M . E., Kaiser, J., Kanakidou, M., Klimont, Z., Kulmala, M., Laj, P., Lawrence, M. G., Lee, J. D., Liousse, C., Maione, M., McFiggans, G., Metzger, A., Mieville, A., Moussiopoulos, N. Orlandou, J. J., O'Dowd, C. D., Palmer, P. I., Parrish, D. D., Petzold, A., Platt, U., Pöschl, U., Prévôt, A. S. H., Reeves, C. E., Reimann, S., Rudich, Y., Sellegri, K., Steinbrecher, R., Simpson, D., ten Brink, H., Theloke, J., van der Werf, G. R., Vautard, R., Vestreng, V., Vlachokostas, C., and von Glasow, R.,: Atmospheric composition change-global and regional air quality, Atmos. Environ., 43, 5268–5350, https://doi.org/10.1016/j.atmosenv.2009.08.021, 2009.
Murphy D. M. and Fahey D. W.: Mathematical treatment of the wall loss of a trace species in denuder and catalytic converter tubes, Anal. Chem., 1987, 59, 2753–2759, https://doi.org/10.1021/ac00150a006, 1987.
O'Keefe, A. and Deacon, D. A. G.: Cavity ring-down optical spectrometer for absorption measurements using pulsed laser sources, Rev. Sci. Instrum., 59, 2544–2551, 1988.
Qi, B., Kanaya, Y., Takami, A., Hatakeyama, S. Kato, S., Sadanaga, Y., Tanimoto, H., and Kajii, Y.: Diurnal peroxy radical chemistry at a remote coastal site over the sea of Japan, J. Geophys. Res., 112, D17306, https://doi.org/10.1029/2006JD008236, 2007.
Reichert, L., Andrés Hernández, M. D., Stöbener, D., Burkert, J., and Burrows, J. P.: Investigation of the effect of water complexes in the determination of peroxy radical ambient concentrations: implications for the atmosphere, J. Geophys. Res, 108, 4017–4032, 2003.
Reiner, T., Hanke, M., and Arnold, F.: Atmospheric peroxy radical measurements by ion molecule reaction mass spectrometry: A novel analytical method using amplifying chemical conversion to sulfuric acid, J. Geophys. Res.-Atmos., 102, 1311–1326, https://doi.org/10.1029/96JD02963, 1997.
Ren, X., Harder, H., Martinez, M., Faloona, I. C., Tan, D., Lesher, R. L., DI Carlo, P., Simpas, J. B., and Brune, W. H.: Interference Testing for Atmospheric HOx Measurements by Laser-induced Fluorescence, J. Atmos. Chem., 47, 169–190, 2004.
Ren, X., Mao, J., Brune, W. H., Cantrell, C. A., Mauldin III, R. L., Hornbrook, R. S., Kosciuch, E., Olson, J. R., Crawford, J. H., Chen, G., and Singh, H. B.: Airborne intercomparison of HOx measurements using laser-induced fluorescence and chemical ionization mass spectrometry during ARCTAS, Atmos. Meas. Tech., 5, 2025–2037, https://doi.org/10.5194/amt-5-2025-2012, 2012.
Sadanaga, Y., Matsumoto, J., Sakurai, K., Isozaki, R., Kato, S., Nomaguchi, T., Bandow, H., and Kajii, Y.: Development of a measurement system of peroxy radicals using a chemical amplification/laser-induced fluorescence technique, Rev. Sci. Instrum., 75, 864–872, https://doi.org/10.1063/1.1666985, 2004.
Sanchez, J., Tanner, D. J., Chen, D., Huey, L. G., and Ng, N. L.: A new technique for the direct detection of HO2 radicals using bromide chemical ionization mass spectrometry (Br-CIMS): initial characterization, Atmos. Meas. Tech., 9, 3851–3861, https://doi.org/10.5194/amt-9-3851-2016, 2016.
Schultz, M., Heitlinger, M., Mihelcic, D., and Volz-Thomas, A.: A calibration source for peroxy radicals with built-in actinometry using H2O and O2 photolysis at 185nm, J. Geophys. Res. 100, 18811–18816, 1995.
Stone, D., Whalley, L. K., and Heard, D. E.: Tropospheric OH and HO2 radicals: field measurements and model comparisons, Critical Review, Chem. Soc. Rev., 41, 6348–6404, 2012.
Tan, Z., Fuchs, H., Lu, K., Hofzumahaus, A., Bohn, B., Broch, S., Dong, H., Gomm, S., Häseler, R., He, L., Holland, F., Li, X., Liu, Y., Lu, S., Rohrer, F., Shao, M., Wang, B., Wang, M., Wu, Y., Zeng, L., Zhang, Y., Wahner, A., and Zhang, Y.: Radical chemistry at a rural site (Wangdu) in the North China Plain: observation and model calculations of OH, HO2 and RO2 radicals, Atmos. Chem. Phys., 17, 663–690, https://doi.org/10.5194/acp-17-663-2017, 2017.
Tyndall, G. S., Cox, R. A., Granier, C, Lesclaux, R., Moortgat, G. K., Pilling, M. J., Ravishankara, A. R., and Wallington, T. J.: Atmospheric chemistry of small organic peroxy radicals, J. Geophy. Res., 106, 12157–12182, 2001.
Vandaele, A. C., Hermans, C., Fally, S., Carleer, M., Colin, R., Mérienne, M.-F., Jenouvrier, A., and Coquart, B.: High resolution Fourier transform measurement of the NO2 visible and near-infrared absorption cross-section: temperature and pressure effects, J. Geophys. Res., 107, 4348, https://doi.org/10.1029/2001JD000971, 2002.
Werle, P., Mücke, R., and Slemr, F.: The Limits of Signal Averaging in Atmospheric Trace-Gas Monitoring by Tunable Diode-Laser Absorption Spectroscopy (TDLAS), Appl. Phys. B, 57, 131–139, 1993.
Whalley, L. K., Blitz, M. A., Desservettaz, M., Seakins, P. W., and Heard, D. E.: Reporting the sensitivity of laser-induced fluorescence instruments used for HO2 detection to an interference from RO2 radicals and introducing a novel approach that enables HO2 and certain RO2 types to be selectively measured, Atmos. Meas. Tech., 6, 3425–3440, https://doi.org/10.5194/amt-6-3425-2013, 2013.
Wood, E. C. and Charest, J. R.: Chemical Amplification – Cavity Attenuated Phase Shift Spectroscopy Measurements of Atmospheric Peroxy Radicals, Anal. Chem., 86, 10266–10273, 2014.
Wood, E. C., Deming, B. L., and Kundu, S.: Ethane-Based Chemical Amplification Measurement Technique for Atmospheric Peroxy Radicals Environ. Sci. Technol. Lett., 4, 15–19, 2017.
Zabetakis, M. G.: Flammability characteristics of combustible gases and vapors, Washington U.S. Dept of the Interior, Bureau of Mines, Bulletin 627, 1965.
Zanis, P., Monks, P. S., Green, T. J., Schuepbach, E., Carpenter, L. J., Mills, G. P., Rickard, A. R., and Penkett, S. A.: Seasonal variation of peroxy radicals in the lower free troposphere based on observations from the FREE Tropospheric EXperiments in the Swiss Alps, Geophys. Res. Lett., 30, 1497, https://doi.org/10.1029/2003GL017122, 2003.
- Abstract
- Introduction
- PeRCEAS general description: mechanical and electrical setup
- PeRCEAS mode of operation
- PeRCEAS determination: error calculation, detection limit and accuracy
- Summary and conclusion
- Data availability
- Author contributions
- Competing interests
- Special issue statement
- Acknowledgements
- Financial support
- Review statement
- References
- Supplement