the Creative Commons Attribution 4.0 License.
the Creative Commons Attribution 4.0 License.
 | 11 Jun 2020
Evaluation of the 15-year ROM SAF monthly mean GPS radio occultation climate data record
Kent B. Lauritsen
Johannes K. Nielsen
Stig Syndergaard
We here present results from an evaluation of the Radio Occultation Meteorology Satellite Application Facility (ROM SAF) gridded monthly mean climate data record (CDR v1.0), based on Global Positioning System (GPS) radio occultation (RO) data from the CHAMP (CHAllenging Minisatellite Payload), GRACE (Gravity Recovery and Climate Experiment), COSMIC (Constellation Observing System for Meteorology, Ionosphere, and Climate), and Metop satellite missions. Systematic differences between RO missions, as well as differences of RO data relative to ERA-Interim reanalysis data, are quantified. The methods used to generate gridded monthly mean data are described, and the correction of monthly mean RO climatologies for sampling errors, which is essential for combining data from RO missions with different sampling characteristics, is evaluated.
We find good overall agreement between the ROM SAF gridded monthly mean CDR and the ERA-Interim reanalysis, particularly in the 8–30 km height interval. Here, the differences largely reflect time-varying biases in ERA-Interim, suggesting that the RO data record has a better long-term stability than ERA-Interim. Above 30–40 km altitude, the differences are larger, particularly for the pre-COSMIC era.
In the 8–30 km altitude region, the observational data record exhibits a high degree of internal consistency between the RO satellite missions, allowing us to combine data into multi-mission records. For global mean bending angle, the consistency is better than 0.04 %, for refractivity it is better than 0.05 %, and for global mean dry temperature the consistency is better than 0.15 K in this height interval. At altitudes up to 40 km, these numbers increase to 0.08 %, 0.11 %, and 0.50 K, respectively. The numbers can be up to a factor of 2 larger for certain latitude bands compared to global means. Below about 8 km, the RO mission differences are larger, reducing the possibilities to generate multi-mission data records. We also find that the residual sampling errors are about one-third of the original and that they include a component most likely related to diurnal or semi-diurnal cycles.
- Article
(12200 KB) - Full-text XML
- BibTeX
- EndNote


Radio occultation (RO) measurements, exploiting radio signals emitted by Global Navigation Satellite System (GNSS) satellites, are increasingly making important contributions to the global observing system. RO data now have a significant impact in weather forecasting (e.g., Healy et al., 2005; Cardinali and Healy, 2014) and in atmospheric reanalysis (Poli et al., 2010; Simmons et al., 2017), and as the RO data records become longer, they are also increasingly useful for climate monitoring and climate studies (e.g., Steiner et al., 2011; Anthes, 2011). The RO measurement technique has a number of attractive features: it provides geophysical information with high vertical resolution throughout the troposphere and stratosphere, it is insensitive to clouds and the underlying surface, and it has an intrinsic long-term stability that does not rely on intercalibration between satellites or instruments (Kursinski et al., 1997; Leroy et al., 2006). The latter feature is particularly important for climate applications where small differences in atmospheric properties that develop over decades are monitored.
The RO Meteorology Satellite Application Facility (ROM SAF), which is a decentralized operational RO processing center under the European Organisation for the Exploitation of Meteorological Satellites (EUMETSAT), has recently undertaken reprocessing of RO data from four satellite missions: CHAMP (CHAllenging Minisatellite Payload; Wickert et al., 2001), GRACE (Gravity Recovery and Climate Experiment; Beyerle et al., 2005), COSMIC (Constellation Observing System for Meteorology, Ionosphere, and Climate; Anthes et al., 2008), and Metop (Luntama et al., 2008). The reprocessed RO data cover the time period from late 2001 to the end of 2016. Over the last few years, reprocessing activities including these four RO missions, or subsets of them, have been undertaken by several processing centers in a joint effort to quantify the structural uncertainty of RO data. The results have been described in Ho et al. (2009, 2012) and Steiner et al. (2013), where the impacts of using different processing schemes were investigated. At low latitudes and midlatitudes between 8 and 25 km, the associated structural uncertainties were found to be small enough for RO data to be used in climate change detection studies. For higher altitudes and latitudes, there are mission-specific limitations that need to be considered.
RO data from the four satellite missions included in the ROM SAF reprocessing have somewhat different characteristics related to instrumental noise, signal-tracking methods and accuracies, data numbers, and spatiotemporal sampling characteristics. The low-level data (excess phase, amplitude, and satellite orbit data) may also exhibit subtle differences depending on the source of those data. If such differences propagate to the retrieved geophysical monthly mean data, and are large enough, the evolution of the global RO constellation may lead to spurious long-term variability as new satellite missions replace older ones. However, despite differences between the RO missions, there is an expectation that measurements from different missions can be combined without any adjustments or intercalibrations to form long time series of RO data, provided that they use the same processing scheme (e.g., Foelsche et al., 2011; Angerer et al., 2017). Multi-mission RO time series have been used in several studies, implicitly assuming inter-mission consistency, e.g., in studies of atmospheric temperature trends (Ladstädter et al., 2011; Khaykin et al., 2017; Leroy et al., 2018), in climate model evaluation studies (Lackner et al., 2011; Ao et al., 2015; Schmidt et al., 2016), and in studies of atmospheric structure and dynamics (Scherllin-Pirscher et al., 2012, 2014; Rieckh et al., 2014; Wilhelmsen et al., 2018).
In this paper, we present results from an evaluation of the ROM SAF monthly mean climate data records (CDRs) provided on a two-dimensional latitude–height grid, with a focus on the temporal stability of the data series and on the differences between the RO missions. The evaluation is largely limited to the stratosphere and the upper troposphere, above about 8 km. The methods used to generate the gridded monthly mean data and the de-seasonalized anomalies are described, including the sampling-error correction method. The observational RO data time series are compared to the ERA-Interim reanalysis. The consistency of climatologies obtained from different RO missions during mission overlap periods are studied, with a view to identify systematic differences that may have an impact on data series constructed from multiple RO missions. We also evaluate the sampling-error correction, which is essential for combining data from RO missions with different sampling characteristics.
Section 2 provides an overview of the data that are being evaluated, and the data used as a reference for the evaluation. In Sect. 3, the processing of the data to gridded monthly mean climatologies is described, including a discussion of the time evolution of bending angle quality and the quality screening of the data. Section 4 describes a comparison with ERA-Interim reanalysis data, while in Sect. 5 the consistency of climatologies obtained from different RO missions is analyzed. The study results are discussed and the main conclusions are summarized in Sect. 6.
Table 1Low-level input data to ROM SAF CDR v1.0.
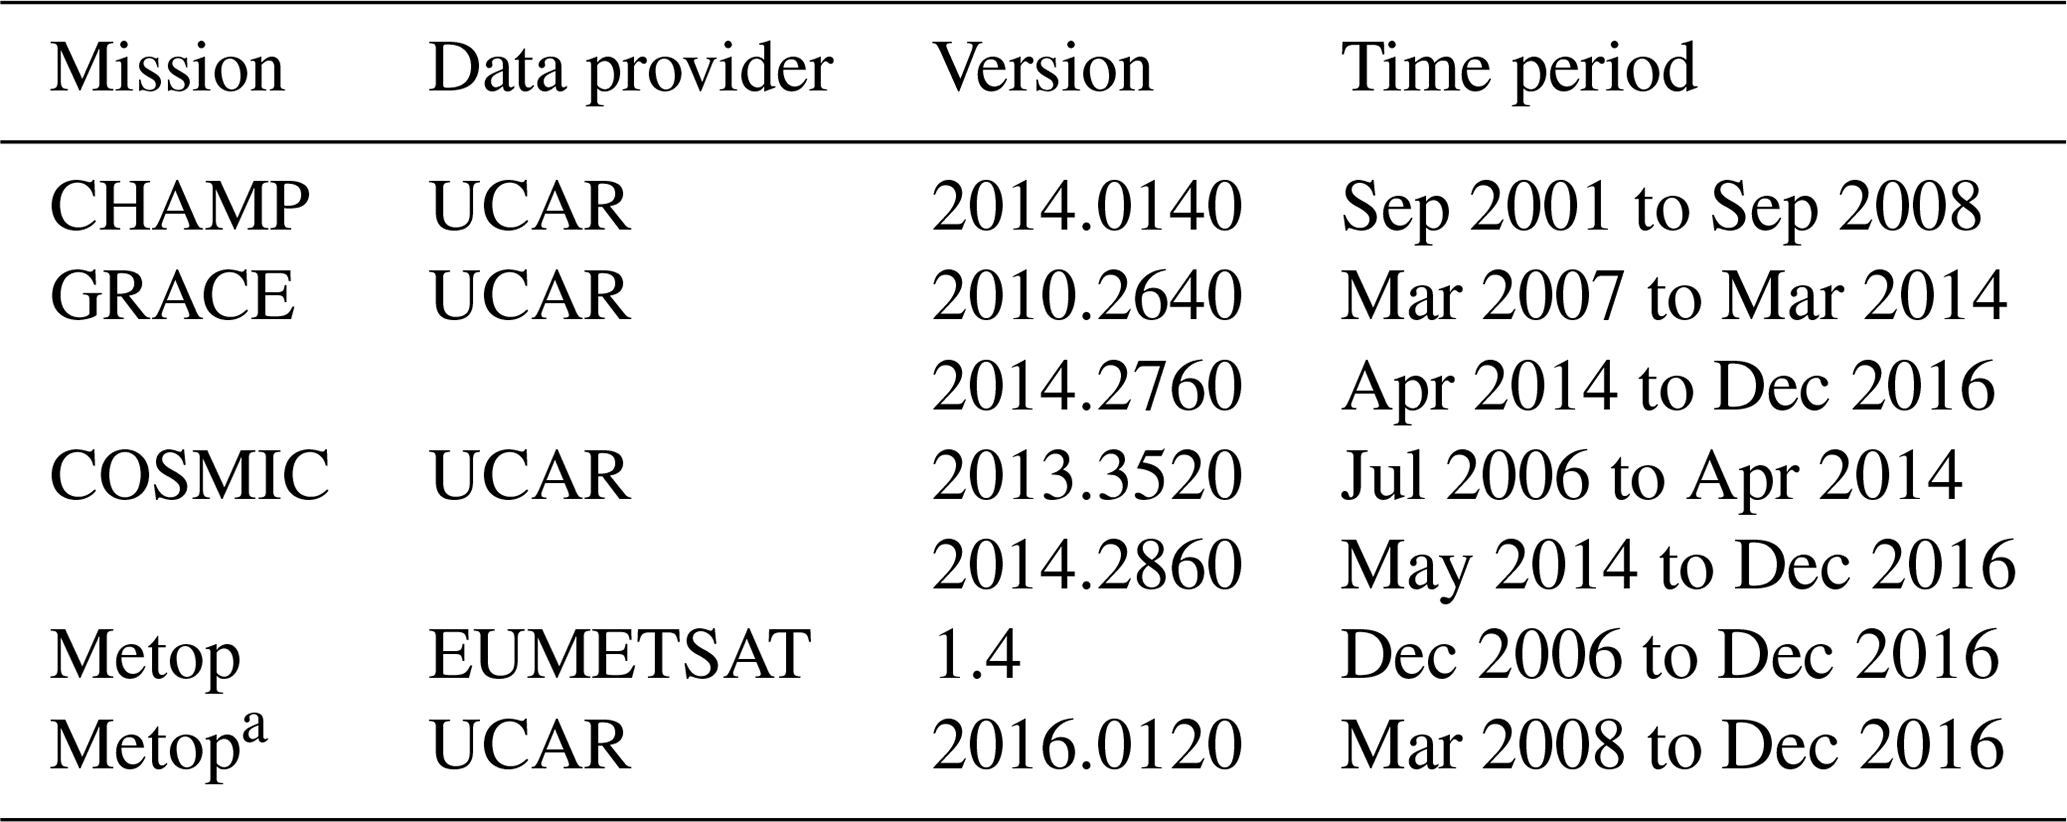
a Not a formal part of CDR v1.0.
2.1 GPS radio occultation measurements
The ROM SAF CDR v1.0 includes data from four RO missions: CHAMP, GRACE, COSMIC, and Metop. The processing of data from the first three missions was based on low-level input data from the University Corporation for Atmospheric Research (UCAR), while the Metop data were processed with input data from EUMETSAT. In addition, we also processed Metop data using input data from UCAR to allow for investigation of differences related to the low-level input data. The low-level input data consist of amplitude and excess phase data, together with positions and velocities for Global Positioning System (GPS) and low-Earth-orbit (LEO) satellites. The input data versions are shown in Table 1. During the studied time period, there were version updates of the COSMIC and GRACE input data involving low-level processing software changes at UCAR.
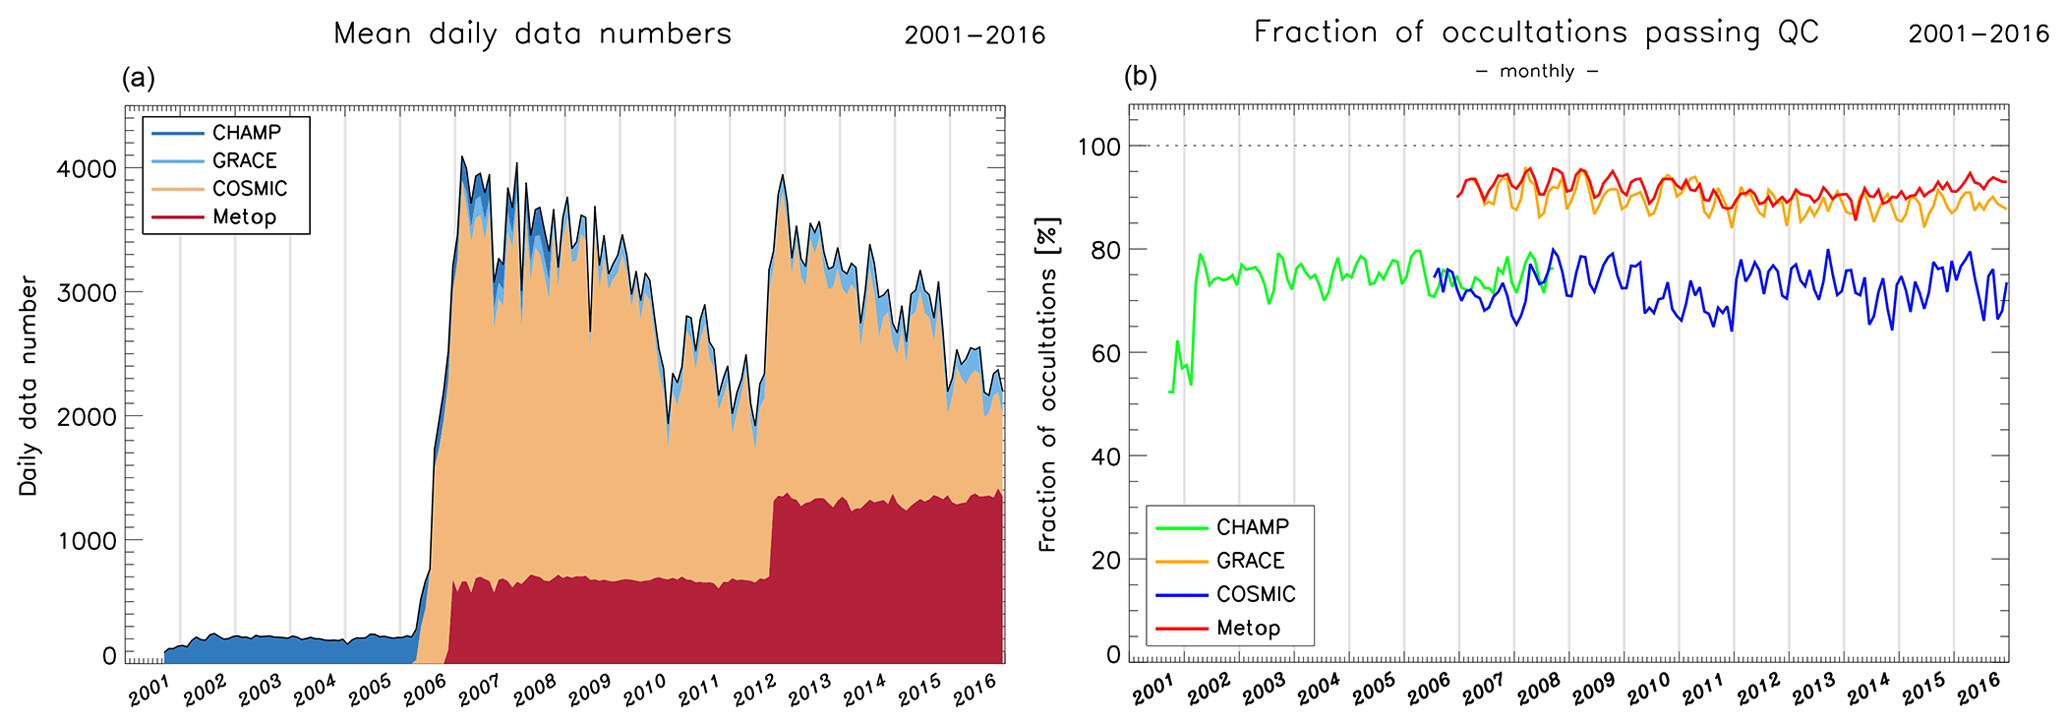
Figure 1(a) Mean daily number of occultation events used in the generation of the ROM SAF climate data record, based on the four RO missions (CHAMP, GRACE, COSMIC, and Metop). (b) Fraction of occultations available for the generation of gridded monthly mean data, after quality screening of the input profile data.
The input data were processed to geophysical data using the ROM SAF GNSS Processing and Archiving Center (GPAC) v2.3.0, with the Radio Occultation Processing Package (ROPP) v8.1 as an integral part. The variables discussed in the present article are bending angle, refractivity, and dry temperature (the concept of “dry” variables is described in Sect. 3.1). The ROM SAF CDRs also contain dry pressure and dry geopotential height (the geopotential heights of dry-pressure surfaces) as well as temperature and humidity in atmospheric regions where humidity has a significant influence on the refractivity. The CDRs also include tropopause height derived from the dry temperature profiles, as well as from bending angle and refractivity profiles.
In total, the four RO missions include nearly 12 million occultations collected from September 2001 to December 2016. Figure 1 shows that the mean daily number of occultations peaked at well above 3000 during 2007–2009. The launch of the second Metop satellite, in combination with an update of the operational mode of the COSMIC mission, led to a second peak in the daily data numbers in 2013. After removal of data based on quality screening, about 10 million atmospheric profiles remain for generation of the CDRs.
2.2 ERA-Interim reanalysis data
We used ERA-Interim reanalysis (Dee et al., 2011) data as a reference in the evaluation. To avoid the direct impact of the observed data on our comparison reference (RO data are assimilated by ERA-Interim), we used the reanalysis forecasts rather than analyses. ERA-Interim provides forecasts at 3 h intervals, initialized at 00:00 and 12:00 UTC. Hence, the shortest possible forecast time varies from 3 to 12 h. For each RO event, a co-located vertical profile of model data was obtained by interpolation in the global forecast fields representing the atmospheric state at 3 h intervals (00:00, 03:00 UTC, and so on) on a 1.0∘ × 1.0∘ latitude–longitude grid.
The vertical profiles of model data (pressure, temperature, and humidity as a function of geopotential height) are forward modeled to the set of geophysical variables used in this study. The model refractivity is calculated from the Smith–Weintraub equation, and the bending angles are obtained by an Abel integral over the refractivity profile assuming an exponential decay above the model top (Healy and Thépaut, 2006). Dry temperature profiles are computed from the model refractivities using the same method as for the observed profiles (see Sect. 3.1). This is followed by interpolation onto an equidistant 200 m height grid and monthly averaging in latitude bins using the methods described in Sect. 3.4.
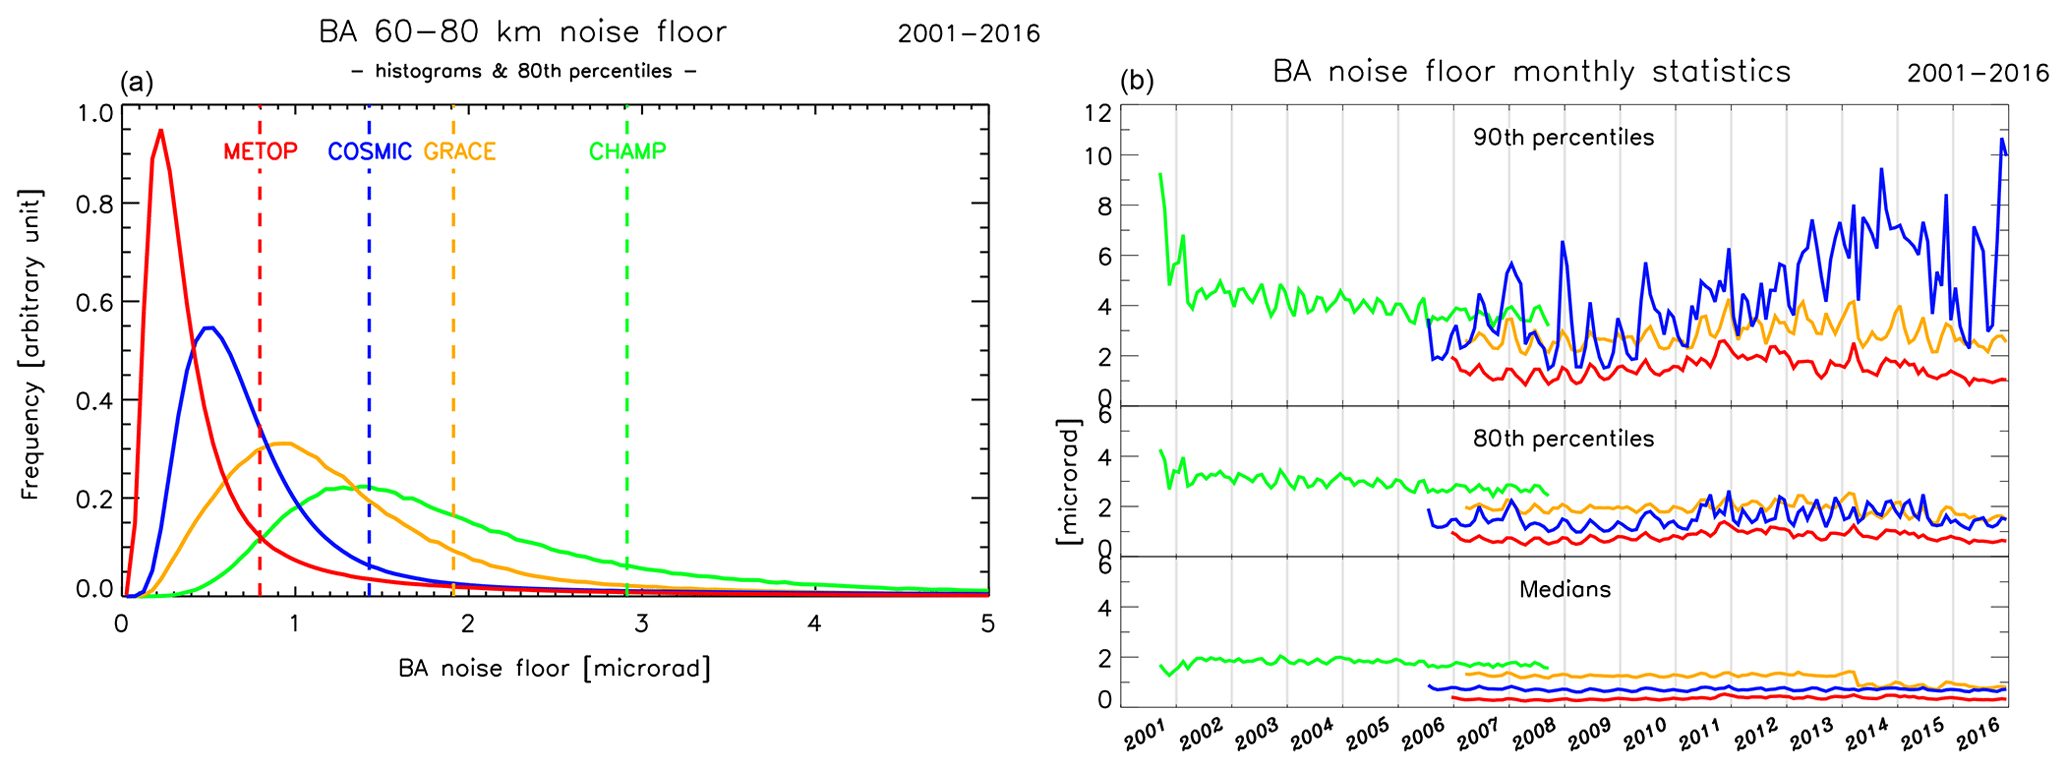
Figure 2Bending angle (BA) noise floor for the four RO missions (CHAMP, GRACE, COSMIC, and Metop): overall distributions (a) and the time evolution of the associated medians, 80th, and 90th percentiles (b). The statistics include all data, including those that are rejected in the quality screening.
This section provides a short description of the processing of RO measurements to atmospheric profiles of bending angles and associated geophysical variables, and further on to the gridded monthly mean data. The quality of the bending angles and the quality screening are also briefly discussed.
3.1 Processing to atmospheric profiles
The input data to the ROM SAF processing consist of amplitude and excess phase time series collected during the satellite occultation events, together with precise orbits for the GPS and LEO satellites. The input data were obtained from EUMETSAT (for the Metop mission) and from UCAR (for the CHAMP, GRACE, COSMIC, and Metop missions).
Bending angles at the two GPS frequencies L1 (1575.42 MHz) and L2 (1227.60 MHz) are calculated from the excess phase and amplitude data through a geometrical optics approach (Kursinski et al., 1997) above 25 km, a wave optics approach (Gorbunov and Lauritsen, 2004) below 20 km, and a gradual transition in between. After correction for ionospheric effects through a linear combination of the L1 and L2 bending angles, we obtained the so-called “raw” ionospheric corrected bending angle. With optimal linear combination (Gorbunov, 2002), using a bending angle climatology (Scherllin-Pirscher et al., 2015), we obtain statistically optimized bending angle profiles that can be used to further retrieve geophysical information. Under the assumption of local spherical symmetry in the vicinity of the occultation point, we use the Abel transform (Fjeldbo et al., 1971) to compute a vertical refractivity profile from the bending angles. Details of the processing steps can be found in algorithm theoretical baseline documents (ATBDs) at the ROM SAF website (http://www.romsaf.org/product_documents.php, last access: 20 August 2019).
For a dry atmosphere, the refractivity is directly proportional to air density. Dry pressure is retrieved from refractivity under the assumption of hydrostatic equilibrium and by ignoring the presence of water vapor. The corresponding dry temperatures are obtained by applying the ideal gas law. The “dry” approximation is a valid assumption in the upper troposphere and stratosphere, where the dry variables are accurate approximations for the corresponding physical variables (Danzer et al., 2014).
Under moister conditions, the dry–wet ambiguity can be resolved by a one-dimensional variational (1D-Var) retrieval (Healy and Eyre, 2000), using additional information from co-located ERA-Interim short-term forecasts. This gives estimates of the “wet” (physical) temperature and humidity, appropriate for atmospheric regions where humidity has a significant influence on the refractivity. The tropospheric variables retrieved through a 1D-Var algorithm are not discussed further in this paper.
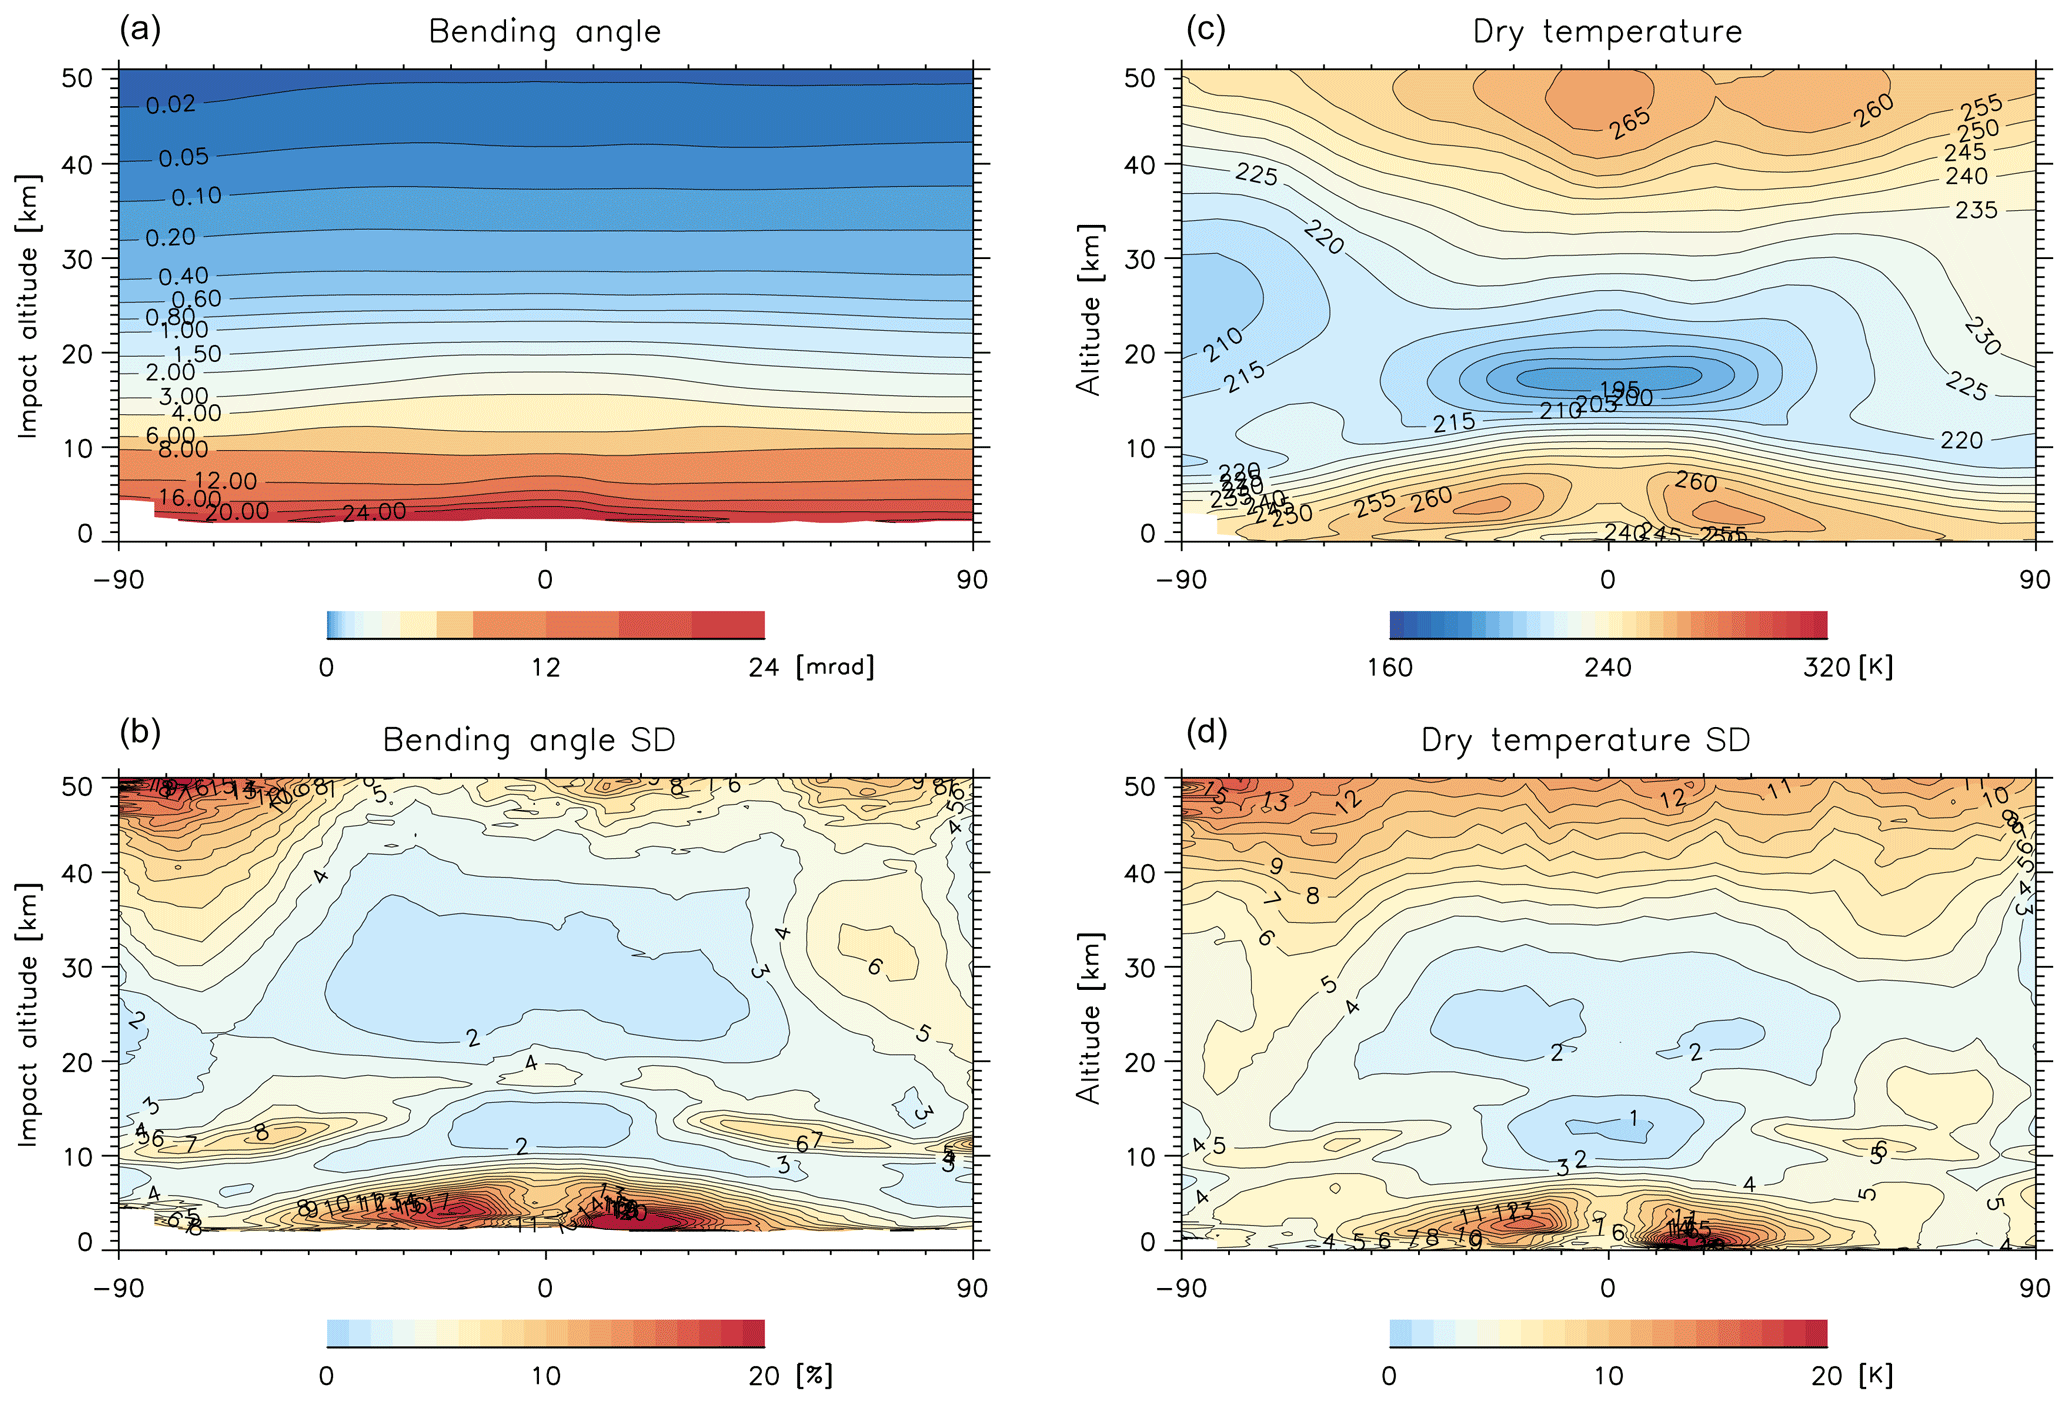
Figure 3Zonally gridded monthly means and standard deviations for bending angle (a, b) and dry temperature (c, d) in April 2014. The monthly means were sampling-error corrected and include data from the Metop-A and Metop-B satellites.
3.2 Bending angle quality
The quality of the retrieved bending angles differs between RO missions. In addition to the effects of residual ionospheric noise, the quality depends on RO instrument characteristics as well as on the data processing; the use of single or double differencing of excess phases (e.g., Schreiner et al., 2010; von Engeln et al., 2011) and filtering of the data applied at different steps in the processing (Schreiner et al., 2011). The bending angle noise between 60 and 80 km, an altitude range where bending due to the neutral atmosphere is small, provides an indication of the bending angle quality (Schreiner et al., 2011; Li et al., 2015; Angerer et al., 2017). For each occultation, we compute the standard deviation of the bending angle difference with respect to a fitted background. The smallest standard deviation over any 7.5 km interval between 60 and 80 km is referred to as the bending angle noise floor for an occultation.
High noise levels and other errors may lead to occultations being rejected by the quality screening. Any errors in the retained bending angles may propagate further down the processing chain, as these are the starting point for the retrieval of the other geophysical variables. In particular, bending angle data in the upper stratosphere are affected by residual ionospheric errors resulting in errors in refractivity and dry temperature lower down in the stratosphere.
Figure 2 shows the noise floor distributions for the four RO missions and the time evolution of the associated medians and percentiles. The lower panels on the right show that 50 % (80 %) of the bending angle profiles have noise floors smaller than about 1.8 (2.9) µrad for CHAMP, 1.2 (1.9) µrad for GRACE, 0.7 (1.4) µrad for COSMIC, and 0.4 (0.8) µrad for Metop. These numbers are somewhat smaller than those found by Schreiner et al. (2011) and Angerer et al. (2017) due to their use of standard deviations computed over the whole 60–80 and 65–80 km height intervals, respectively.
The bulk of the noise floor distributions are relatively constant, as shown by the time evolution of the medians. However, as indicated by the 80th and 90th percentile time series in Fig. 2, the number of high-noise profiles is more variable. CHAMP exhibits increased noise levels during the first months of the data record. Following an instrument software update in March 2002, the bending angle noise settles at an almost constant level but with the number of high-noise profiles slowly declining. The bending angle noise in the GRACE data is relatively constant, except for a sudden decrease in April 2014 which affects the bulk of the profiles, not only the number of noisy profiles. This stepwise change is related to a switch of input data version (Table 1) involving several changes in UCAR's processing software (Douglas Hunt, personal communication, 2020).
For COSMIC, there is a substantial increase with time of the number of profiles with very high bending angle noise, mainly attributed to rising occultations (not shown here). Metop exhibits a somewhat larger number of high-noise profiles for rising than for setting occultations and also shows an interesting pattern which may be related to the solar cycle. A similar pattern may be discernible in the GRACE data.
3.3 Data quality screening
Before processing the atmospheric profiles to gridded monthly mean data, all profiles are checked against a set of quality criteria. The quality criteria include tests to identify occultations that (a) do not provide any meaningful bending angles or only provide bending angles in a limited height range, (b) have degraded bending angles indicated by increased noise in the L2 signal or by certain types of deviation from a bending angle climatology, (c) could be regarded as outliers as quantified by comparison with ECMWF reanalysis data, or (d) encounter problems in the 1D-Var processing. More detailed descriptions of the data quality screening are found in the series of validation reports available at the ROM SAF website (http://www.romsaf.org/product_documents.php).
If an occultation does not pass one or several of the tests in (a), (b), or (c), the bending angle, refractivity, and dry variables are marked as non-nominal. Otherwise, they are regarded as nominal and the refractivity profiles are passed on to the 1D-Var processing. The fraction of data rejected in the quality screening varies with time (Fig. 1). On average, around 10 %–20 % of the occultations are rejected, although with large differences between the RO missions. Metop and GRACE show the highest throughput of data; almost no data are rejected by criterion (a) and about 5 %–10 % are rejected by criteria (b) and (c). COSMIC and CHAMP have roughly similar overall rejection rates. However, for COSMIC, about 5 %–10 % of data are rejected by criterion (a), while for CHAMP that criterion removes about 15 % or even more of the data.
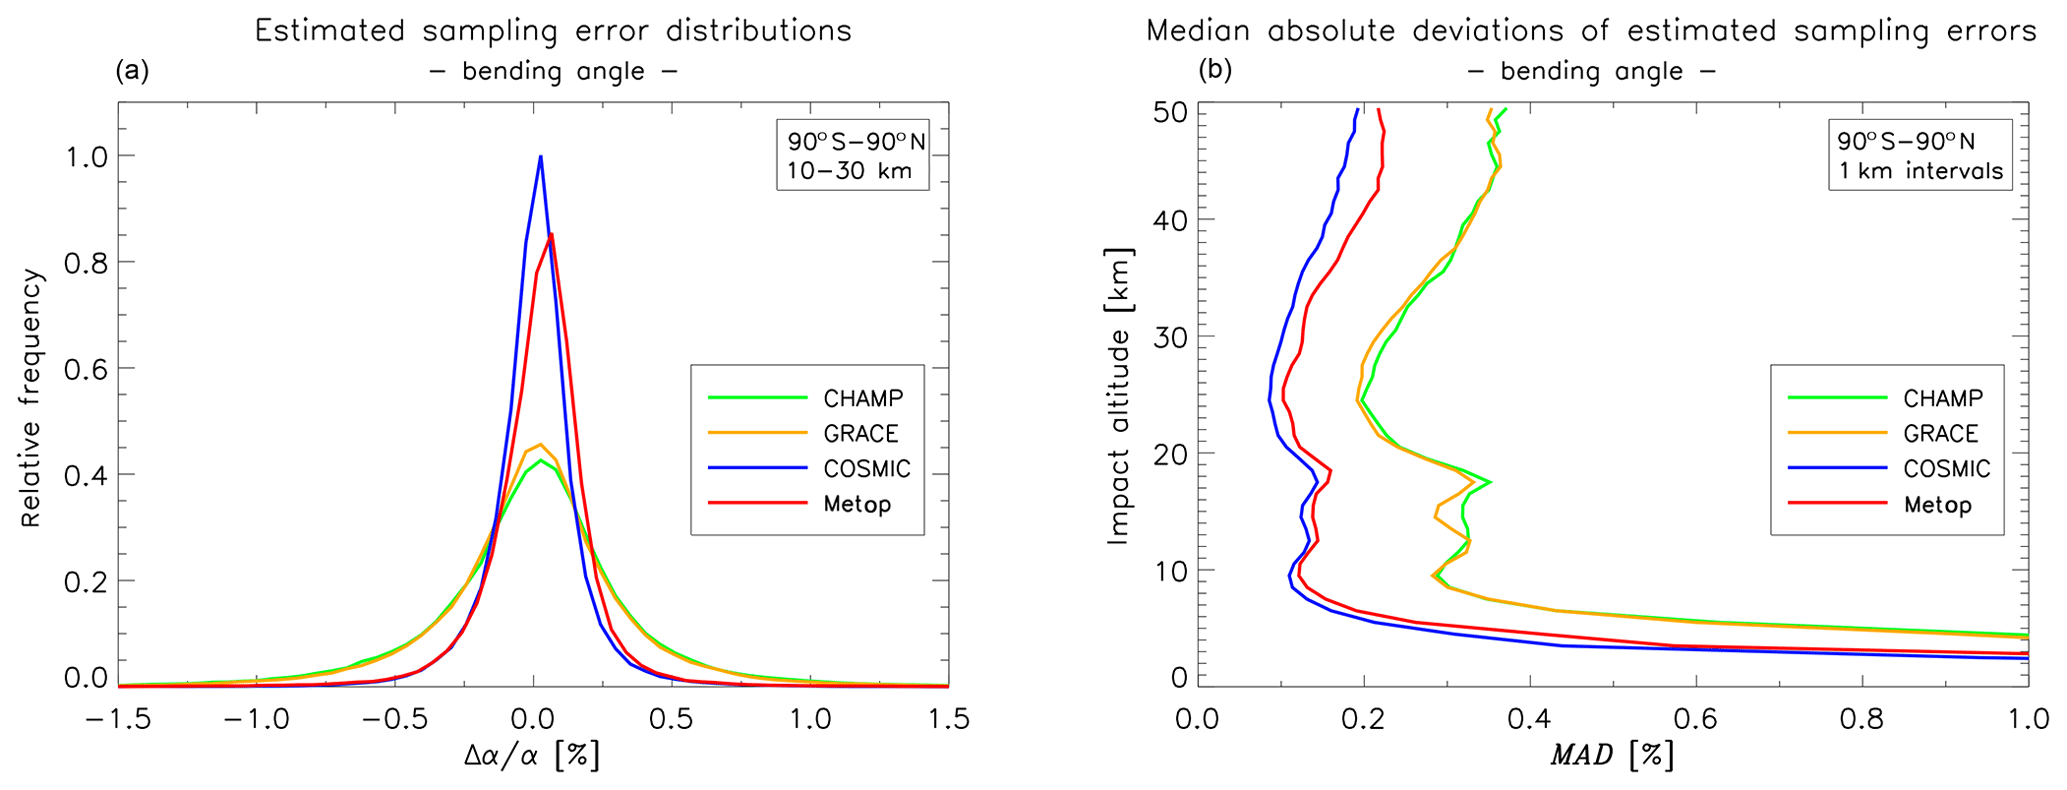
Figure 4(a) Distributions of estimated bending angle sampling errors based on all monthly bins in the 10–30 km height interval, for the four RO missions (CHAMP, GRACE, COSMIC, and Metop). The spread of the distributions, as quantified by the median absolute deviation (MAD), is about 0.3 % for CHAMP and GRACE, and 0.1 % for COSMIC and Metop. (b) The MADs for height-resolved sampling-error distributions.
3.4 Monthly averaging in latitude bins
The gridded monthly mean data are obtained by a simple binning-and-averaging technique in which all occultations within each RO mission are taken into account. Each occultation is assigned to a 5∘ latitude band and calendar month. The RO profiles that pass the quality screening are interpolated onto an equidistant 200 m height grid (the height variable is impact altitude for bending angles, a logarithmic pressure variable referred to as “pressure height” for dry geopotential height, and mean-sea-level altitude for the other geophysical variables). At each height, and within each bin, the data undergo a weighted averaging. The purpose of the weighting is to reduce the effects of a non-uniform spatial sampling density across a grid box, in order to better approximate an area-weighted mean. The distribution of observations in longitude is nearly uniform and is not explicitly addressed. The distribution of observations in latitude, on the other hand, can be highly non-uniform. This is addressed by subdividing each 5∘ latitude bin into two sub-bins, and giving each data point, i, a weight, wi, according to which sub-bin, s, it belongs to:
where A and n are the total area and data number for the bin, and As and ns are area and data number for sub-bin s. Within each latitude bin and calendar month, a weighted arithmetic average is computed as
where Xi is a geophysical quantity, and is the corresponding monthly mean for the latitude bin. The corresponding weighted standard deviation is given by
using the same weights as in Eq. (2). The dependency of the weights, wi, and the data numbers, n, on height is not shown explicitly in the above equations. Figure 3 shows an example of bending angle and dry temperature means and standard deviations for Metop data from April 2014.
3.5 Sampling errors and sampling-error correction
The finite number of observations is not enough to fully account for all variability within the time–latitude bins, leading to a sampling error in the monthly means. The sampling error, εsamp, can be estimated by sampling a model atmosphere at the same times and locations as the observations, and then subtract the true model monthly mean from the monthly mean based on the sampled model data:
The sampled monthly mean in Eq. (4) is constructed similarly to the observed monthly mean, using the methods described in Sect. 3.4. The true model mean for a monthly bin is computed from the full four-dimensional reanalysis model field:
where φk is the latitude at a model grid point, and the summation loops over all model grid points located within the 5∘ latitude band for that calendar month. Similar techniques for sampling-error estimation have been described by, e.g., Foelsche et al. (2003, 2008), Scherllin-Pirscher et al. (2011a), and Ho et al. (2009). In the ROM SAF CDR, sampling errors are estimated from ECMWF reanalysis short-term forecast fields (currently, ERA-Interim) at a 2.5∘ × 2.5∘ latitude–longitude grid and a 6 h time step.
The accuracy of the estimated sampling error, εsamp, depends on the ability of the model to describe the true atmospheric variability within the monthly bins, at the spatiotemporal resolution of the observations. This includes both synoptic-scale variability as well as various modes of cyclic variability, e.g., the atmospheric diurnal and semi-diurnal cycles. The accuracy of the model mean state within the bins is less important as it is largely removed by the subtraction in Eq. (4).
The magnitude of the sampling error depends on how well the dominating modes of variability are sampled. The errors are smaller for COSMIC than for CHAMP or GRACE, mainly due to larger data numbers but also due to a better sampling of the diurnal cycle. Figure 4a shows the distributions of estimated sampling errors for the four RO missions, computed from all monthly bins within a core region of 10–30 km. The bending angle spread, as measured by the median absolute deviation (MAD), is about 0.3 % for CHAMP and GRACE and 0.1 % for COSMIC and Metop. The corresponding numbers for dry temperature are 0.3 and 0.1 K, respectively (not shown here). However, a small number of bins have much larger sampling errors, mainly associated with wintertime midlatitude and high-latitude variability. Figure 4b shows the deviations for height-resolved sampling-error distributions. The estimated sampling errors are smallest in a region between 10 and 35 km.
The estimation of sampling errors by means of a model provides an opportunity to do a partial correction of this important class of error. Such a correction, or adjustment, can potentially reduce systematic biases between climatologies obtained from different RO missions with different sampling characteristics and reduce systematic bias changes as the global RO constellation changes with time. Sampling-error-corrected means are computed by subtracting the estimated sampling error from the observed mean:
The consequence of the correction is clearly seen when comparing gridded monthly means computed from disjoint sets of RO observations, e.g., monthly means computed from different RO missions during overlap periods. This is further discussed in Sect. 5.3, where it is shown that sampling-error correction significantly decreases inter-mission differences, leaving a residual sampling error, εresamp, that may be handled as a quasi-random statistical error.
3.6 Anomaly data time series
The gridded monthly mean RO data records discussed in this paper can be described as time series of variables on a two-dimensional latitude–height grid:
where is a monthly mean climate variable (e.g., refractivity or dry temperature). Indices i and j denote the latitude and height bins (with reference latitude, φi, and height, hj, respectively) and m denotes the time (a running month number). The anomalies are defined as the deviations from a climatological seasonal cycle, , where is the season (month of the year). Hence, the anomalies are given by
and the fractional anomalies are given by
where the latter is the preferred expression for variables that have a dominating exponential altitude dependence.
The mean seasonal cycle, i.e., the long-term mean state as a function of latitude, height, and season, is constructed from RO data, although it may be based on a different combination of RO missions:
where Nyr is the number of years used in the generation of the climatology. In the generation of anomaly time series, the same seasonal cycle should be used for all missions and throughout the time series. This is particularly important for investigations of differences between RO missions.
The anomalies depend on latitude, altitude, and time. Averaging over a latitude band, properly weighting the latitude bins proportional to their areas, gives a two-dimensional time–altitude data set (see Fig. 7), while averaging over both a latitude band and a height layer gives a one-dimensional time series (see Figs. 9 and 10).

Figure 5Globally averaged monthly mean bending angle (left panels) and refractivity (right panels) differences with respect to ERA-Interim, for the four RO missions included in the ROM SAF CDR. From bottom to top, the panels show vertically averaged differences in the 4–8, 8–12, 12–20, 20–30, 30–40, and 40–50 km intervals, where the height coordinate is impact altitude for bending angle and altitude for refractivity. Note that for the lowest bending angle panel (left column), the vertical axis has been compressed to accommodate the larger differences between the missions.
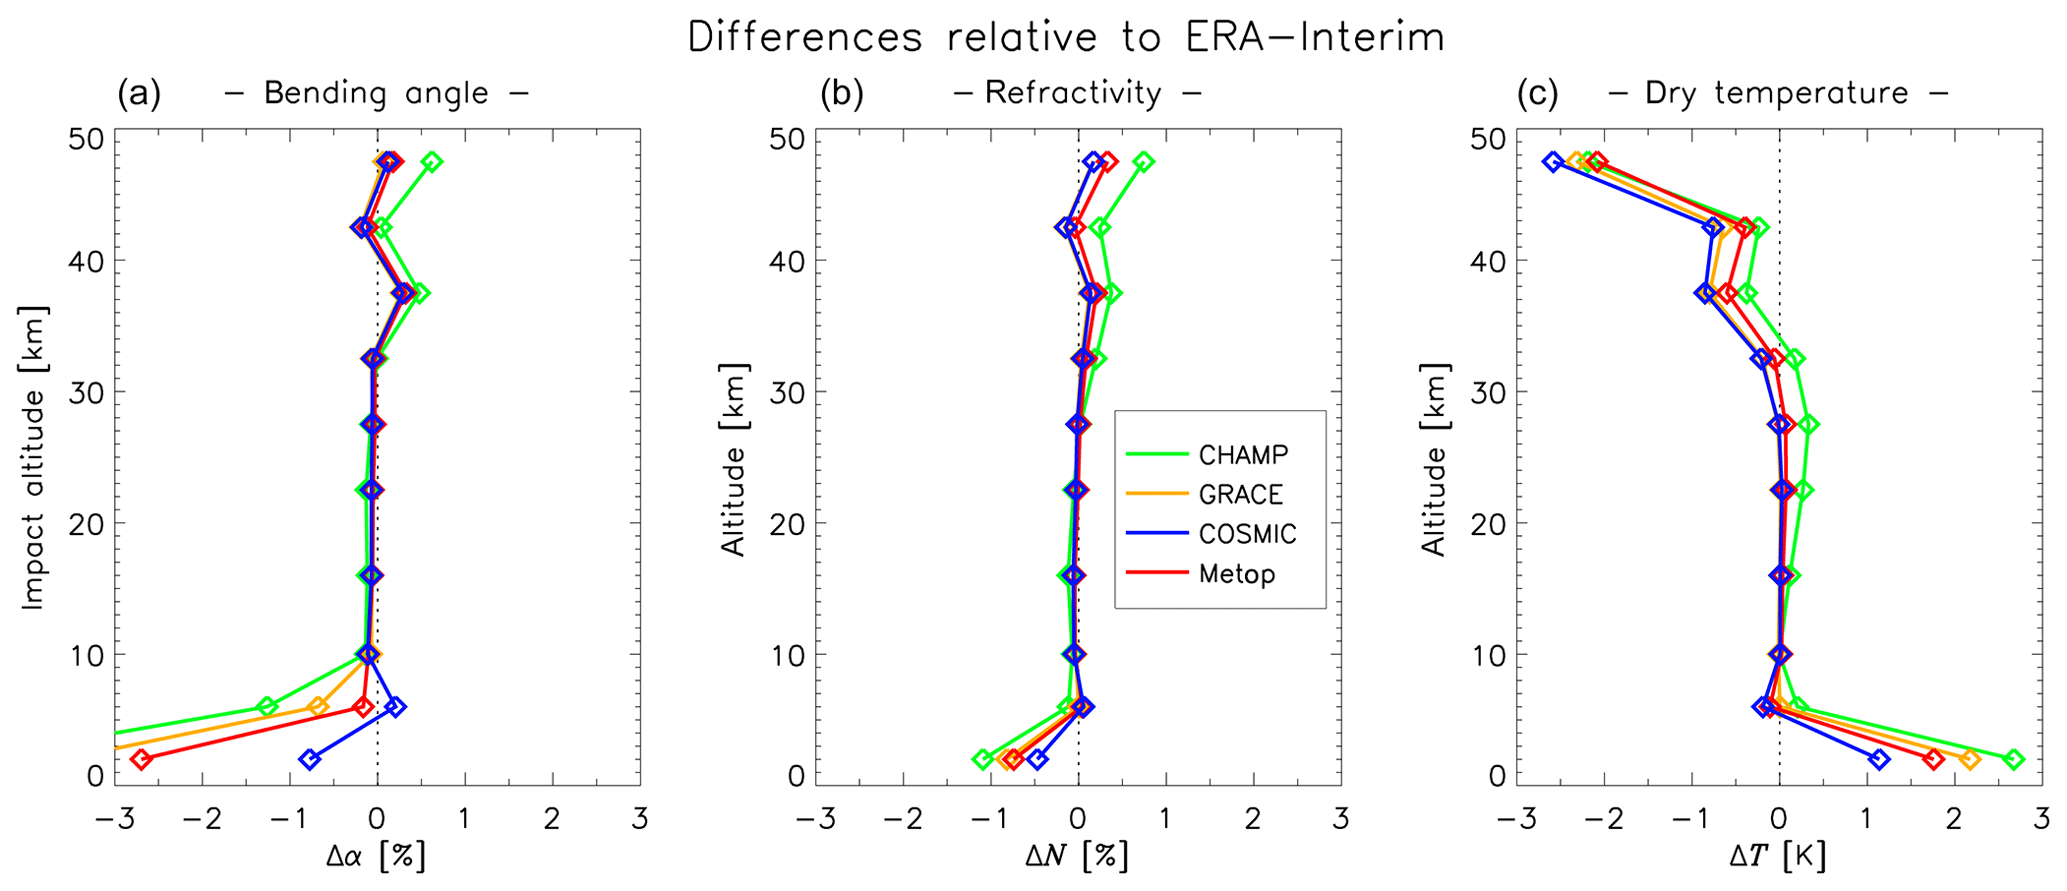
Figure 6Globally averaged monthly mean bending angle (a), refractivity (b), and dry temperature (c) differences relative to ERA-Interim, for the four RO missions included in the ROM SAF CDR. The profiles show time averages, with the averaging period chosen as the full length of the respective satellite mission.
The ROM SAF CDR is evaluated using the ERA-Interim reanalysis as a reference, with the purpose to provide a better understanding of the time evolution of the RO data and the stability in time. As a side effect, time-varying biases and sudden bias shifts in the ERA-Interim reanalysis data are identified. In addition, the comparison of all four RO missions against the same reference provides an indication of the consistency of RO climatologies generated from different missions.
Figure 5 shows globally averaged relative differences of observed bending angle and refractivity with respect to ERA-Interim for the four RO missions and for six altitude layers from 4 to 50 km. The smallest differences are found at altitudes between about 8 and 30 km. In this altitude region, the dominating features in the difference time series reflect bias shifts in the ERA-Interim data. In December 2006, the magnitude of the bias suddenly decreased in the 12–20 and 30–40 km intervals, even though it remained slightly negative in the 12–20 km range throughout the time period. In November 2009, there was a shift from a small negative bias to a near-zero difference in the 20–30 km interval. Then, in late 2013, the difference suddenly dropped back to a small negative bias level during a few weeks. These events are most likely related to the start of assimilation of COSMIC data in 2006 (Dee et al., 2011), an update of the COSMIC data processing in October 2009 (Healy, 2013), and a temporary dropout of RO data from the ERA-Interim assimilation system in late 2013 (Sean Healy, personal communication, 2018). Above 30 km, the differences between RO and ERA-Interim are larger, particularly for the earlier pre-COSMIC time period, when the impact of RO on the reanalysis was weaker due to lower data numbers.
In the 8 to 40 km altitude interval, the spread amongst the RO missions is generally smaller than the differences between RO and ERA-Interim. In combination with the fact that the dominating shifts in the difference time series can be attributed to ERA-Interim, this suggests that the RO data have better long-term stability than the ERA-Interim data. At the highest altitudes, above 40 km, the larger differences in the earlier time period and the smaller differences later on lead to a long-term trend in the differences. Below 8 km, the spread amongst the RO missions are larger, with the COSMIC and Metop data showing a better match to ERA-Interim than the CHAMP and GRACE data. The CHAMP data series exhibits bias shifts in March 2002 and in July 2006. The former shift coincides with a firmware update of the GPS-RO instrument aboard the CHAMP satellite (Jens Wickert, personal communication, 2019).
Figure 6 shows the RO versus ERA-Interim differences in the form of global time-averaged vertical profiles for bending angle, refractivity, and dry temperature. The profiles for the different missions do not represent identical time periods, as the time averaging is done over the full length of the respective satellite mission. In line with the findings in Fig. 5, the CHAMP profiles deviate somewhat from the profiles of the other satellite missions, particularly above 35 km for bending angle and refractivity and also at lower altitudes for dry temperature. Of the four RO missions, CHAMP also exhibits the largest lower-tropospheric biases relative to ERA-Interim.
Regarding the stability in time, it should be noted that even though the ERA-Interim reanalysis system in itself does not change with time, the evolving global observing system leads to time-varying biases (Dee et al., 2011). ERA-Interim does not provide a stable enough reference against which to accurately measure temporal stability of the RO data. Between about 8 and 30 km, the RO data records are likely to have a better temporal stability than ERA-Interim. At higher and lower altitudes, the long-term temporal stability of the multi-mission RO time series is limited by the evolving global RO constellation and depends on the magnitude and character of the differences between the RO satellite missions. This is discussed in Sect. 5.
Differences in the monthly means obtained from RO missions that overlap in time are due to a combination of random profile errors, sampling errors, and systematic errors of instrumental or data-processing origin. While random errors contribute to a general degradation of the quality of the climatologies, they do not prevent us from combining data from different missions. Systematic errors on the other hand can, potentially, introduce time-evolving biases in combined multi-mission data records. In this section, some of the RO mission differences, detected from mission overlaps, are identified. The influence of these differences on time series of bending angle and dry temperature anomalies is assessed. The sampling-error correction method, described in Sect. 3.5, is also evaluated and its efficiency in reducing differences between the RO missions is investigated.
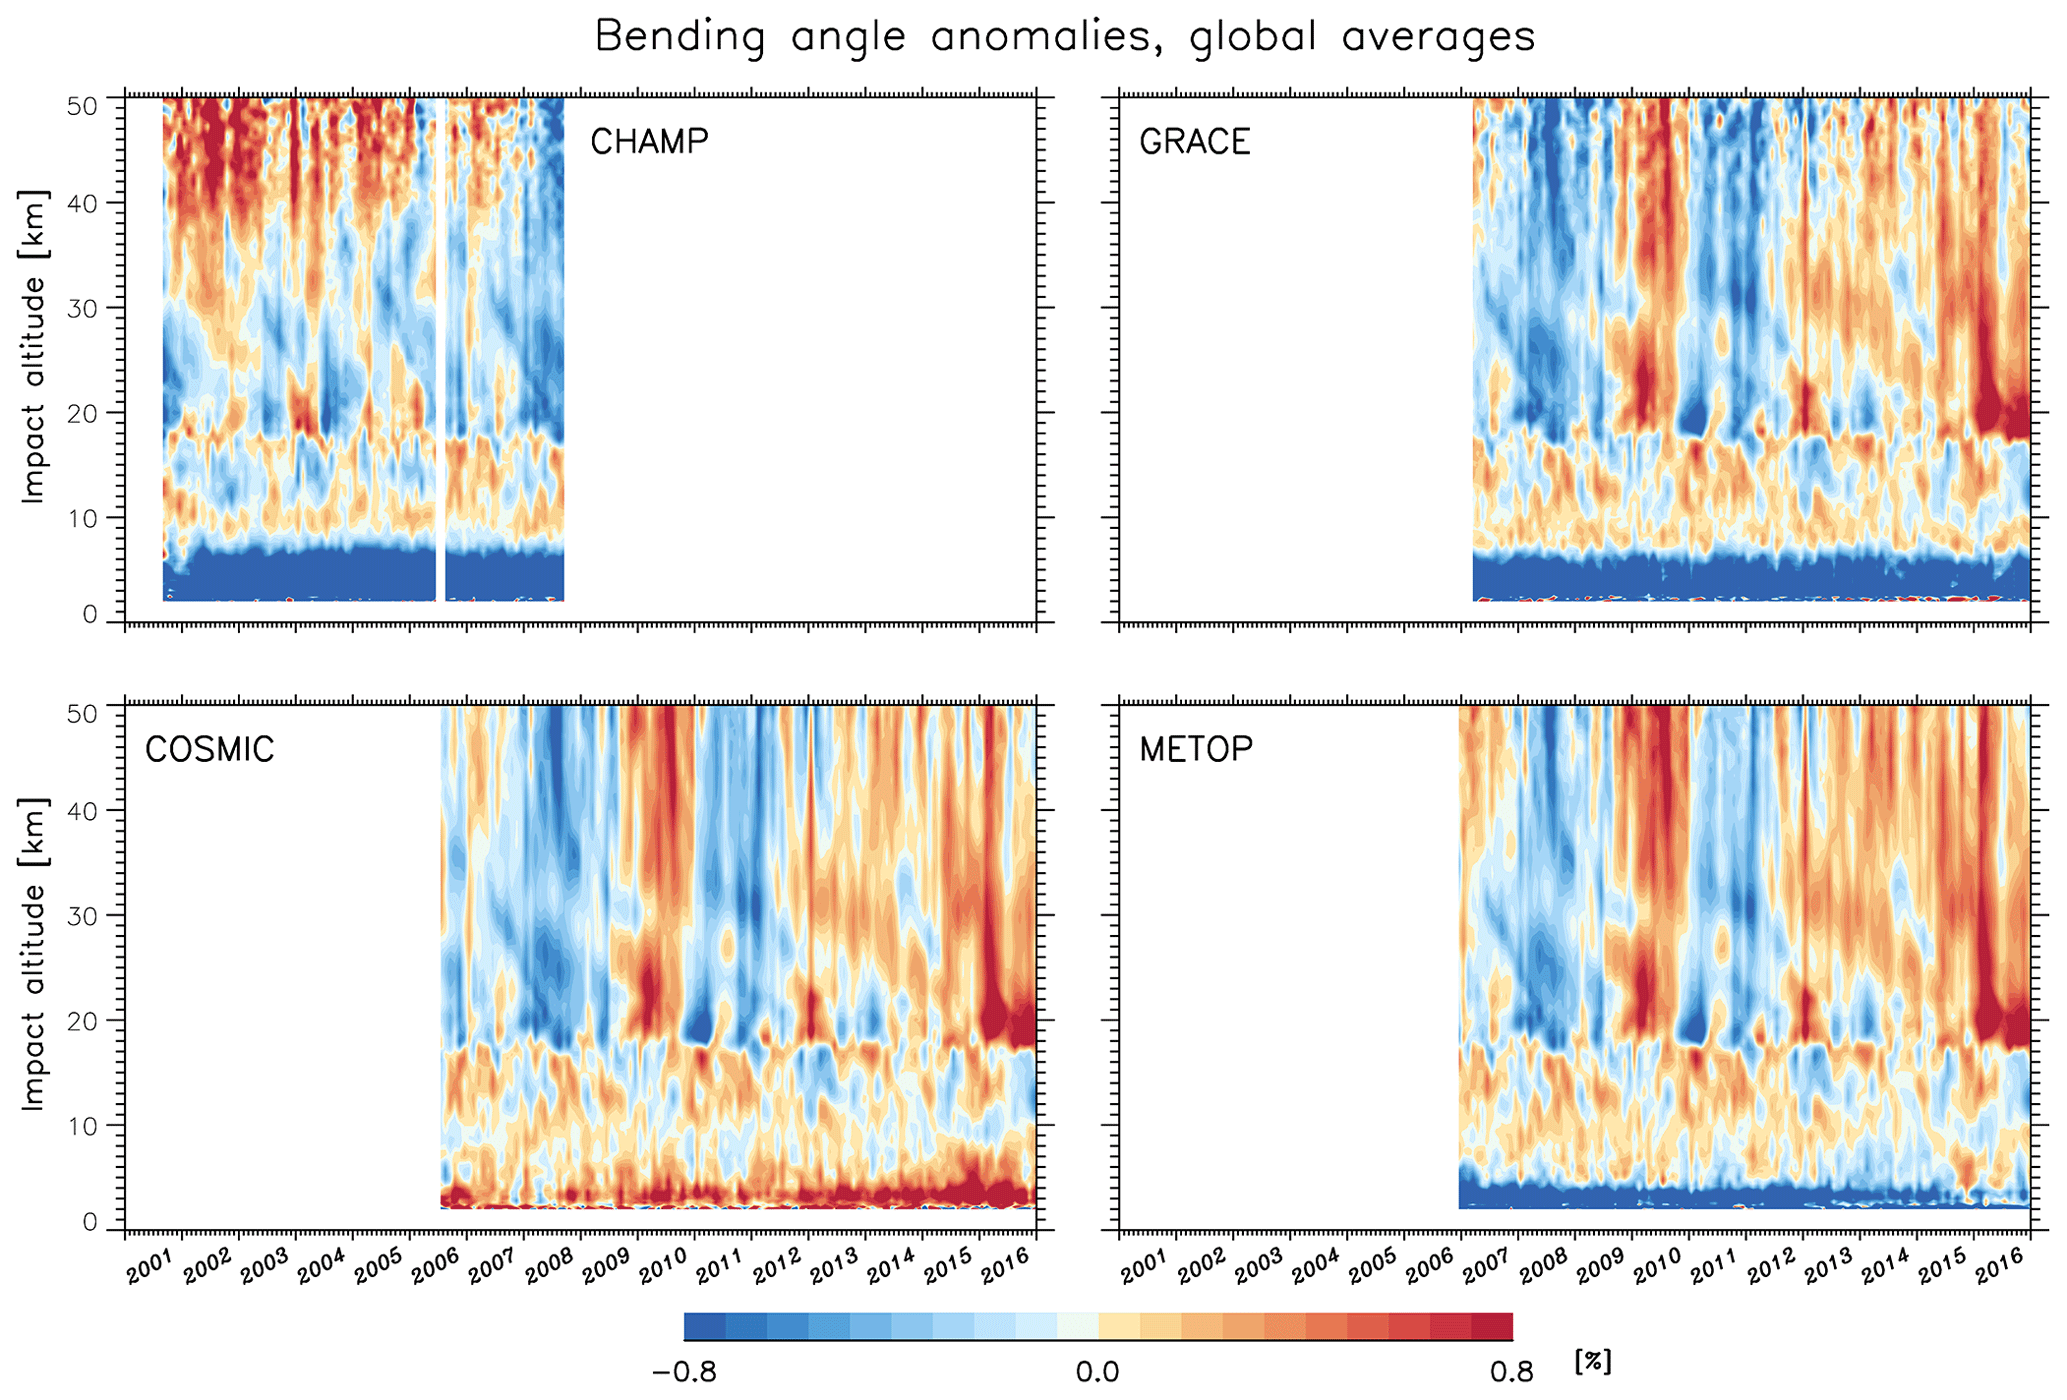
Figure 7Global monthly mean bending angle anomalies, for the four RO missions included in the ROM SAF CDR v1.0. There is overlap between CHAMP and COSMIC from August 2006 to September 2008, between GRACE and COSMIC from March 2007 to December 2016, and between Metop and COSMIC from December 2006 to December 2016. Data are given on a 5∘ by 200 m latitude–altitude grid and have been sampling-error corrected. The anomalies for the four satellite missions are computed based on the same reference climatology, obtained from RO data.
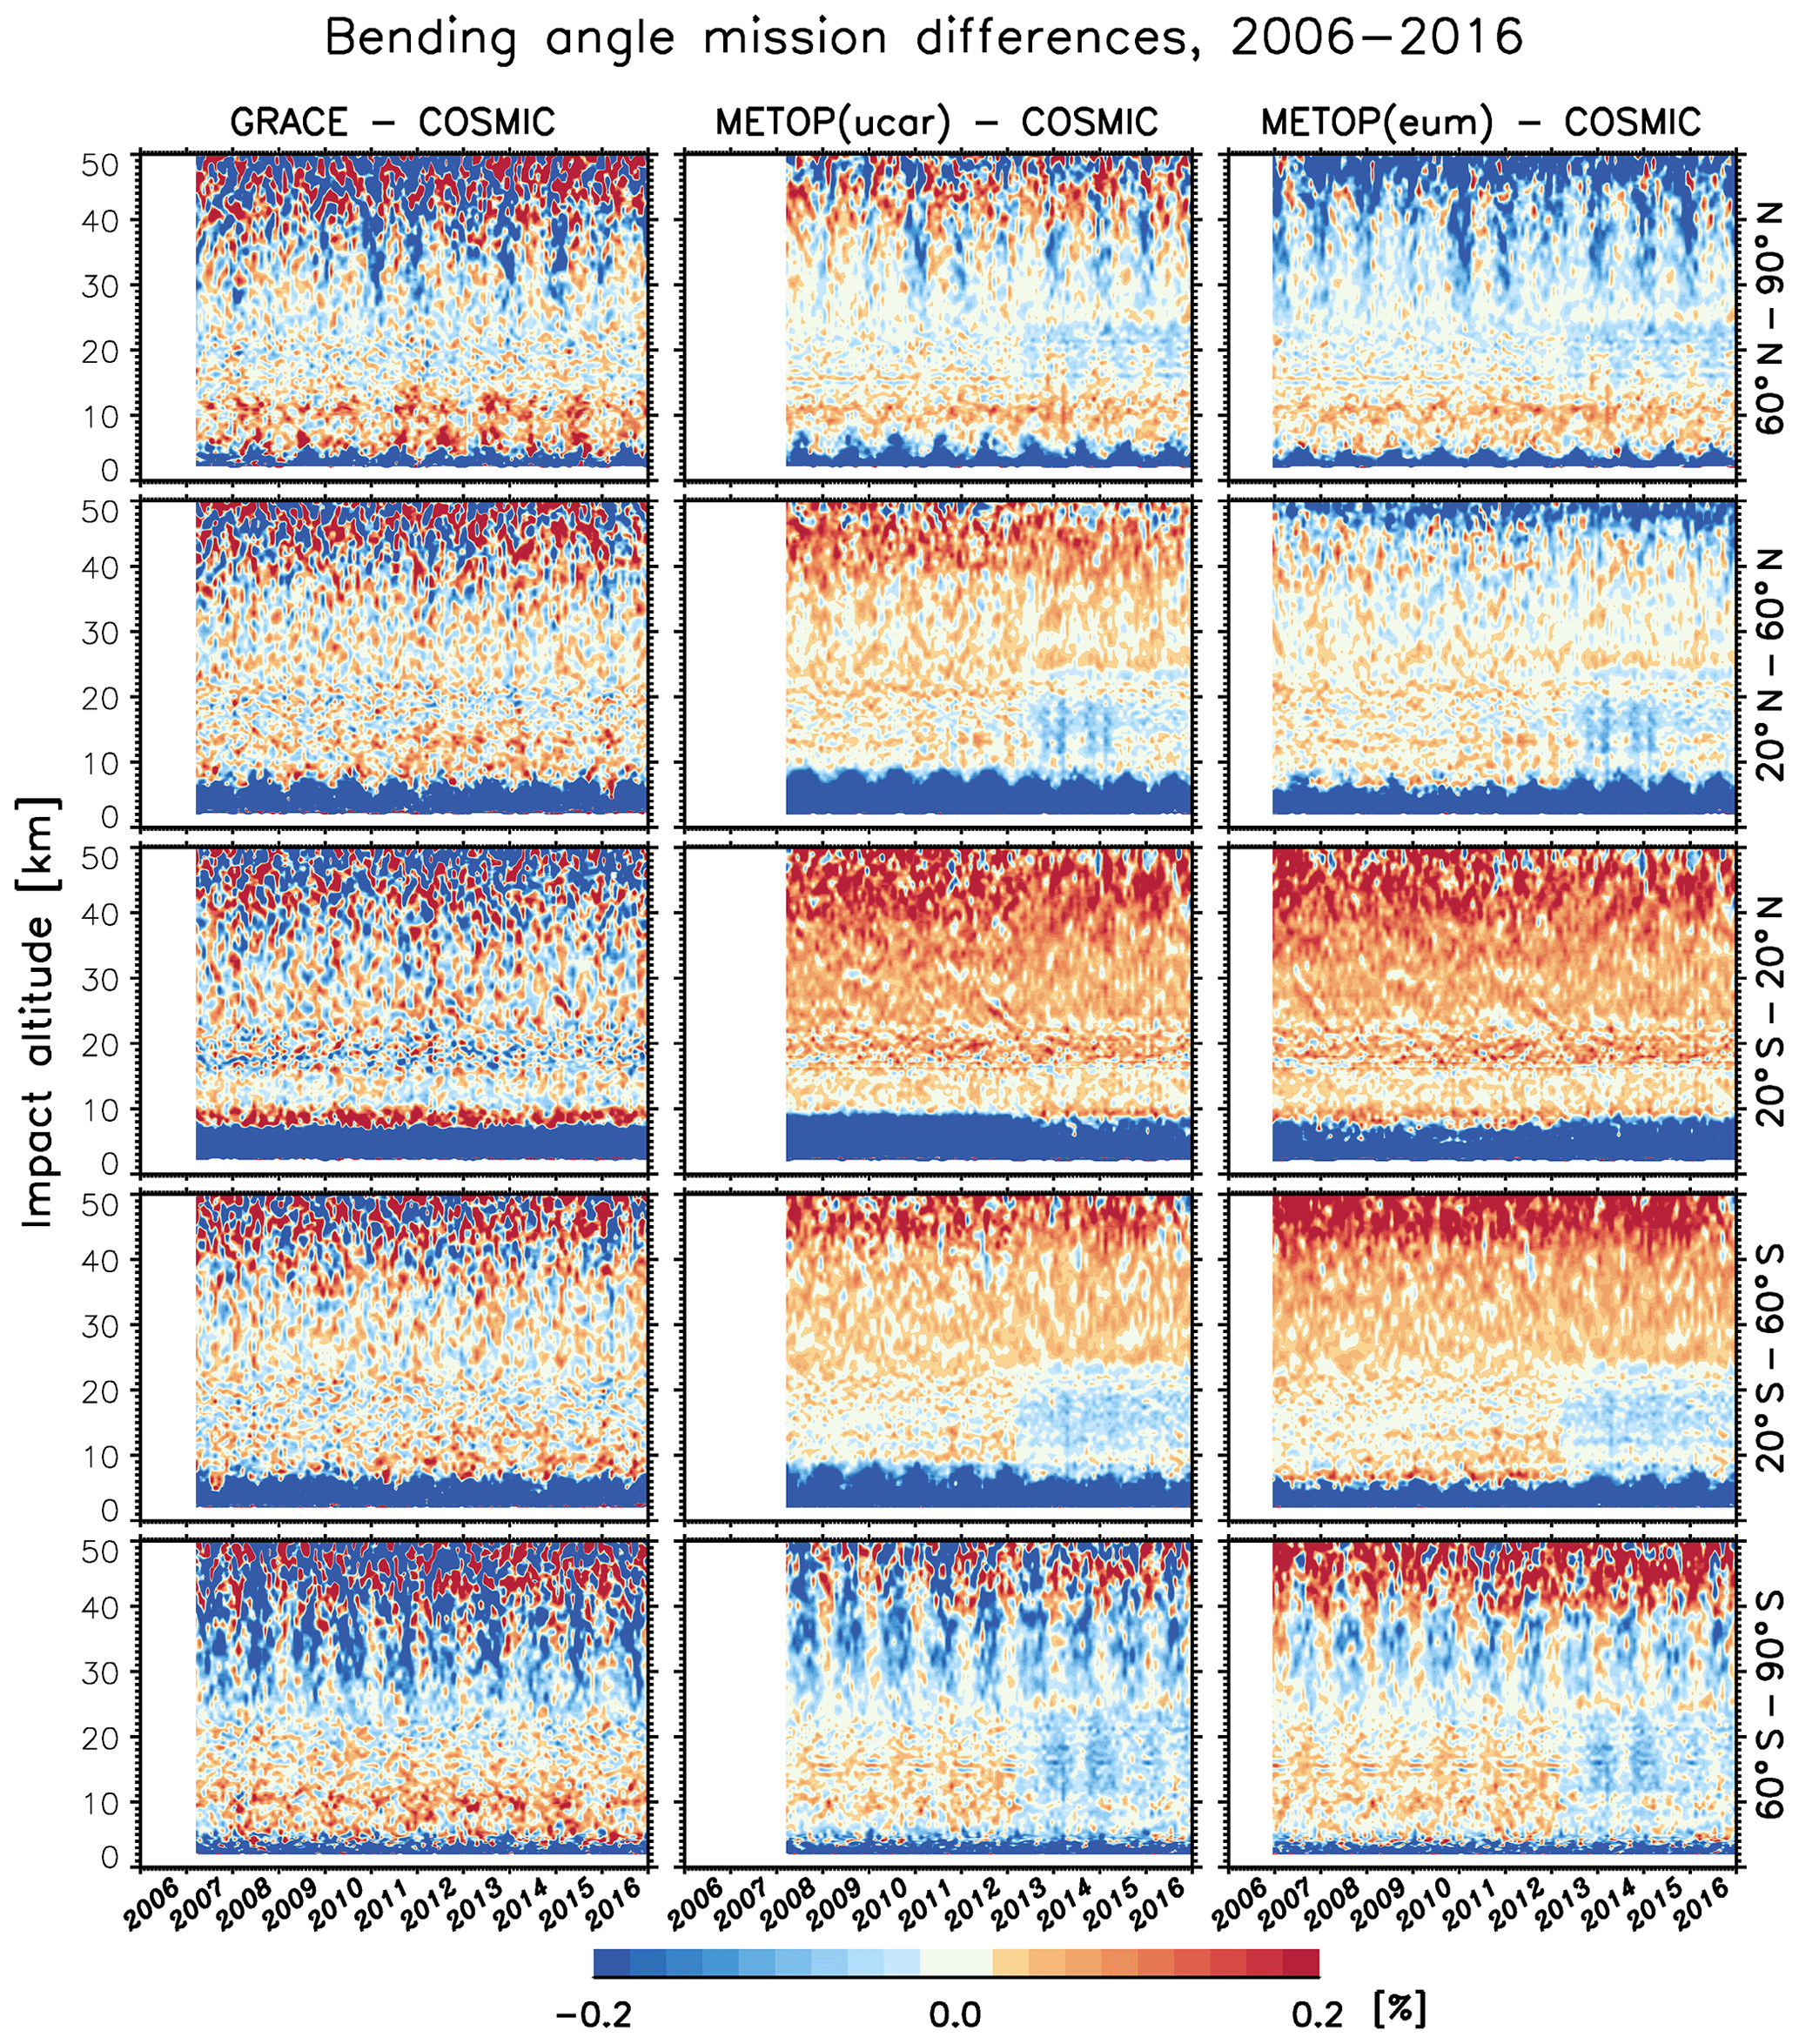
Figure 8Differences between monthly mean bending angle climatologies retrieved from different missions; between GRACE and COSMIC (left column), between Metop(ucar) and COSMIC (middle column), and between Metop(eum) and COSMIC (right column), where Metop(ucar) is processed by ROM SAF based on input data from UCAR, and Metop(eum) is based on input data from EUMETSAT. Differences are shown in five latitude bands, south to north from lowest panel to top panel.
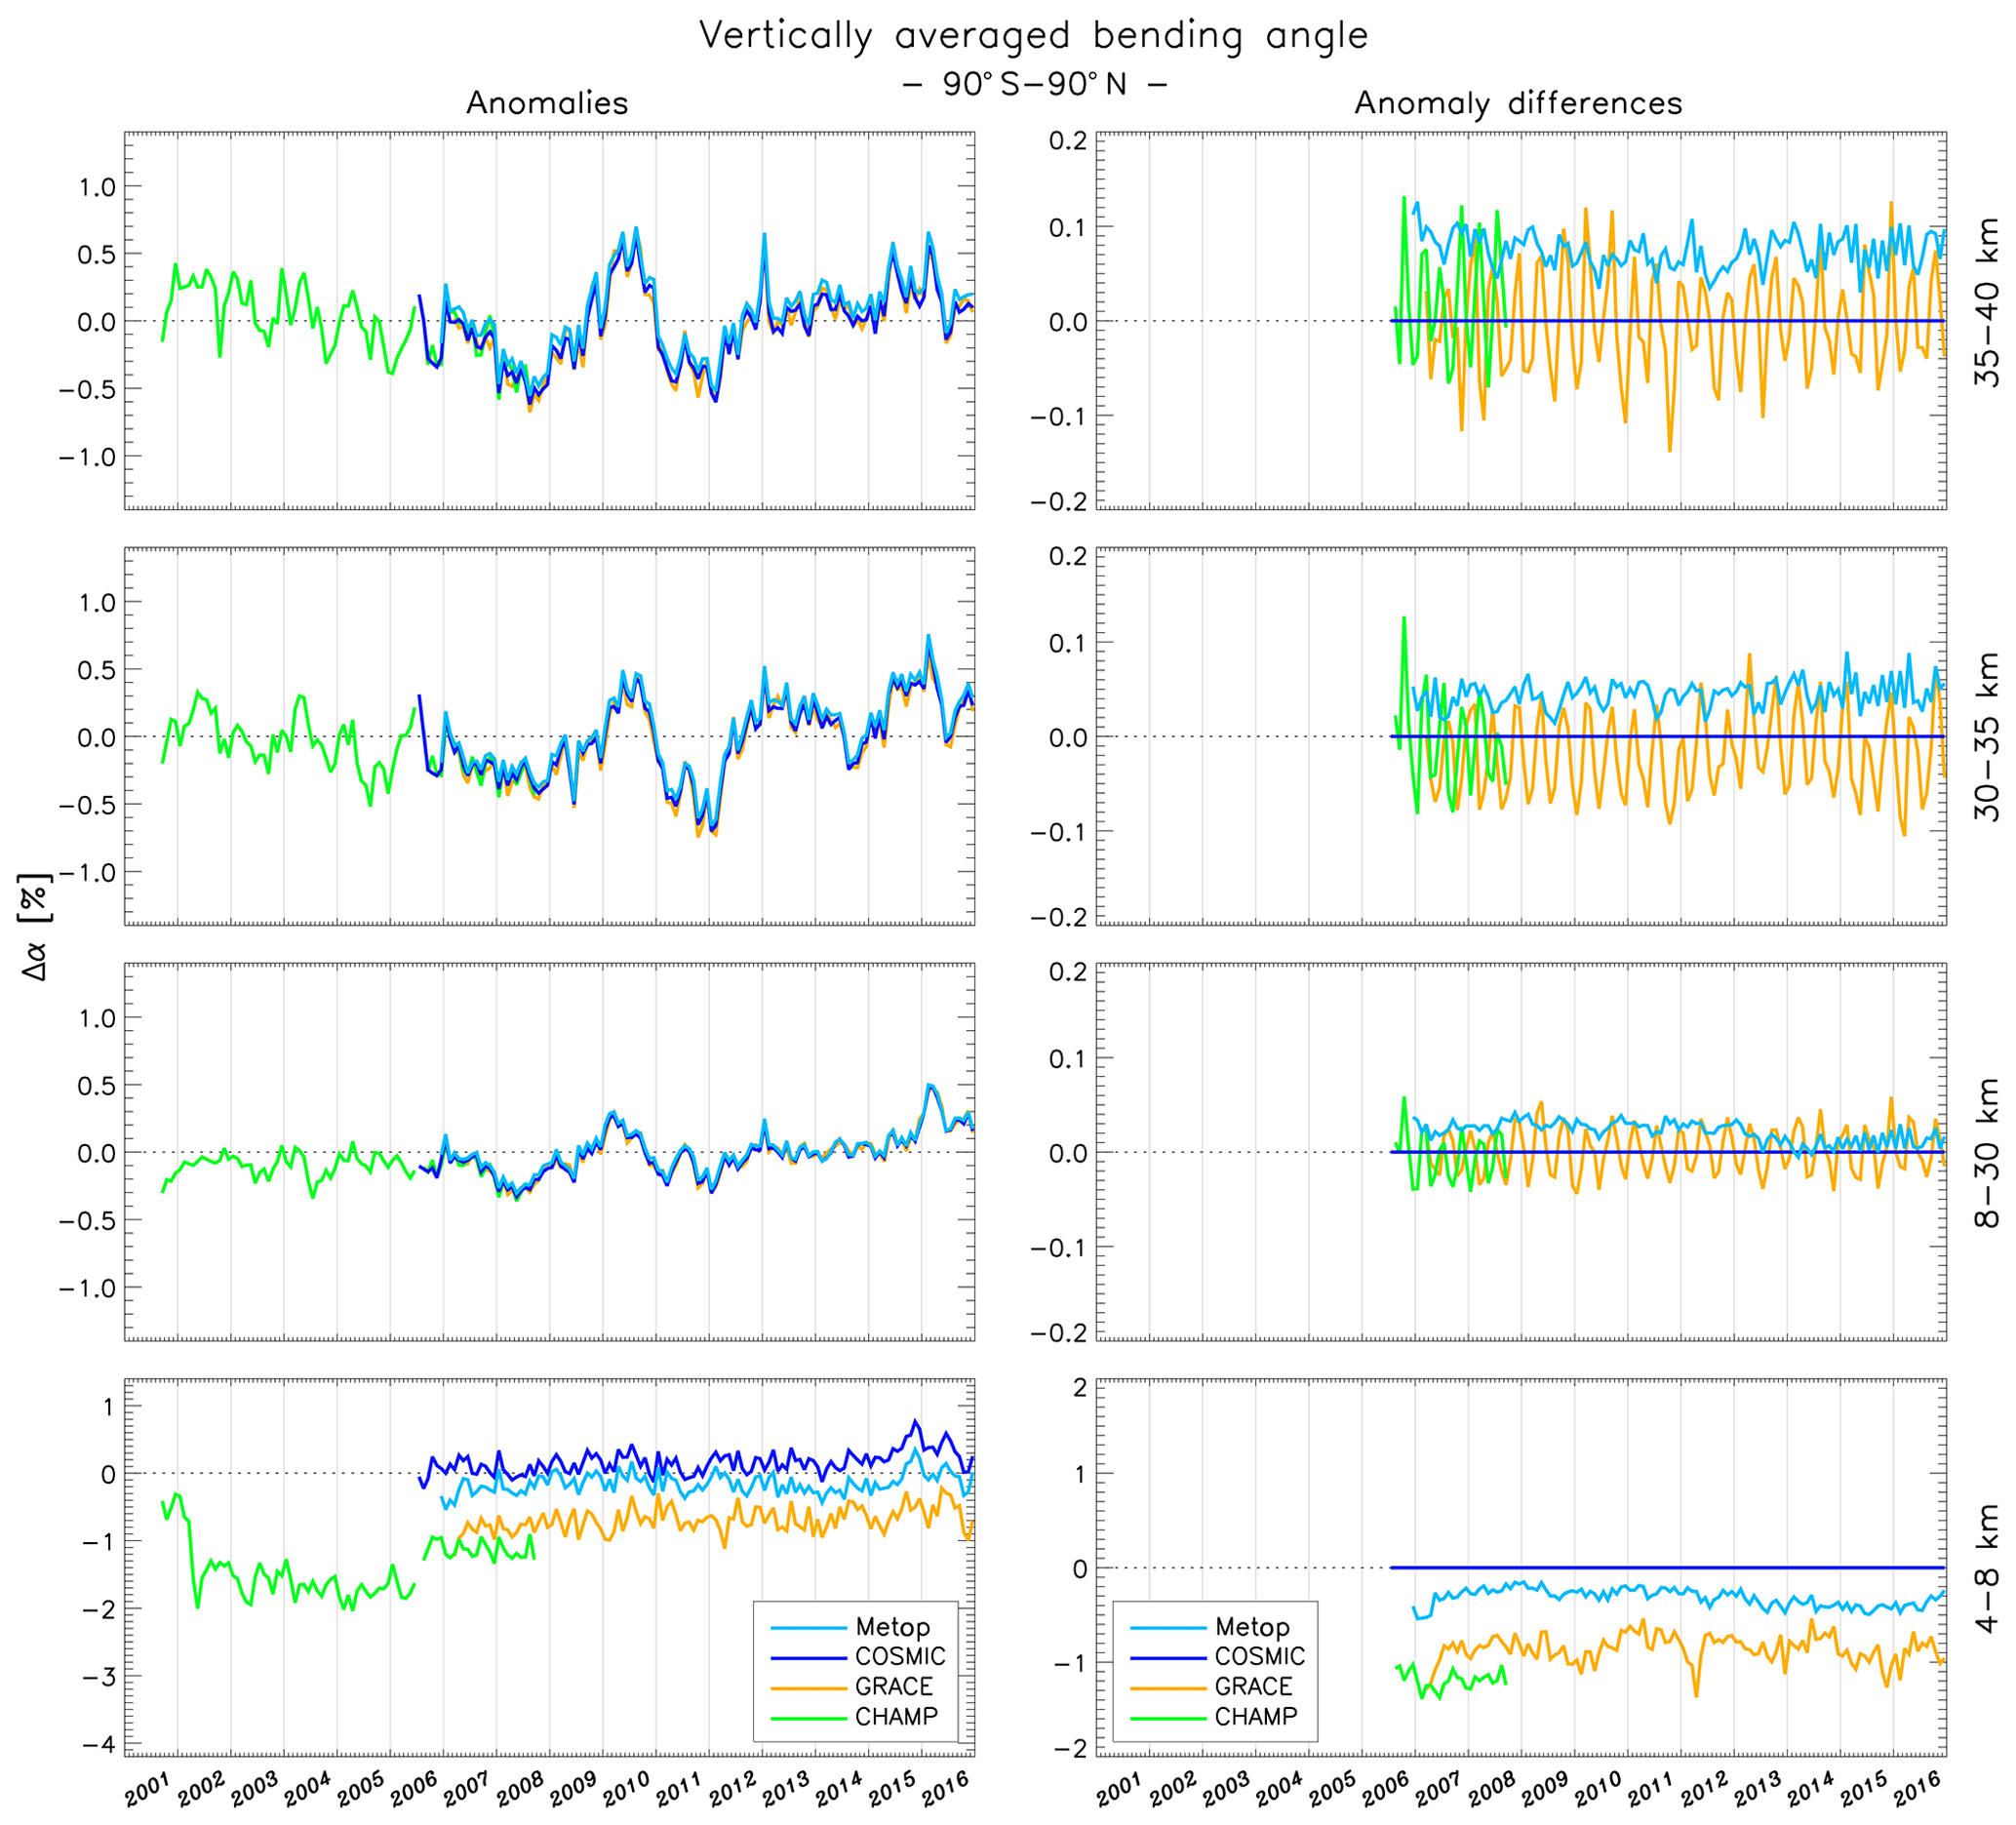
Figure 9Monthly mean bending angle anomalies for the four RO missions (left panels) and differences of CHAMP, GRACE, and Metop with respect to COSMIC (right panels). From bottom to top, the panels show the 4–8, 8–30, 30–35, and 35–40 km height layers. Note that for the lowest plots, the vertical axes have been compressed to accommodate the larger differences between the missions.
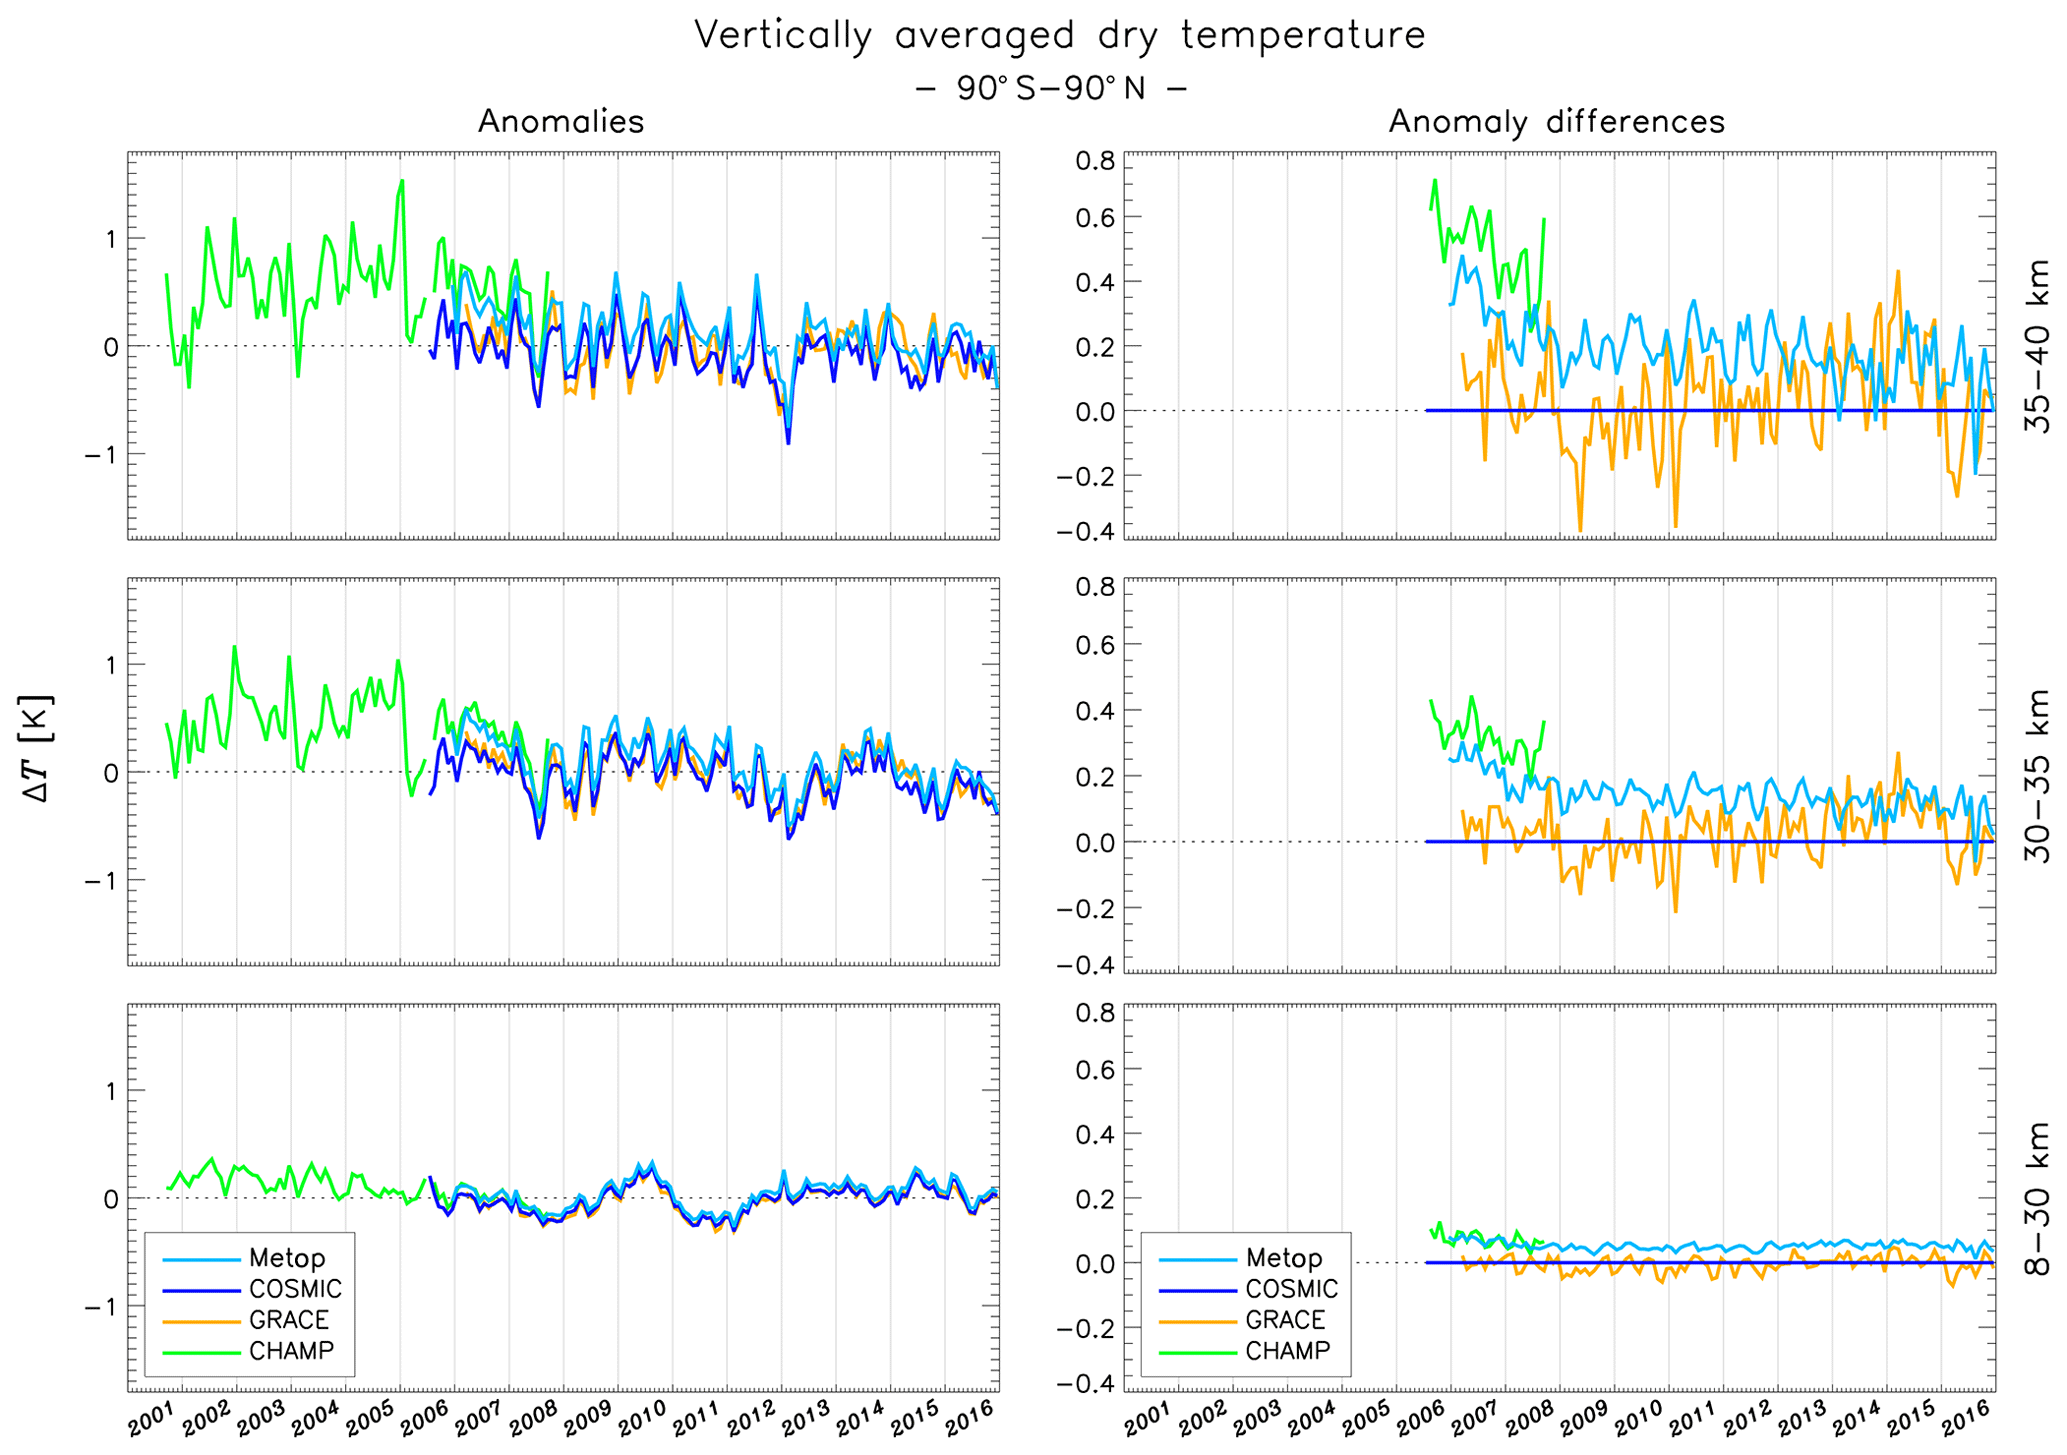
Figure 10Monthly mean dry temperature anomalies for the four RO missions (left panels) and differences of CHAMP, GRACE, and Metop with respect to COSMIC (right panels). From bottom to top, the panels show the 8–30, 30–35, and 35–40 km height layers.
5.1 Time–altitude bending angle plots
Figure 7 shows global monthly mean bending angle anomalies for the four RO missions. The four data records are structurally very similar above about 8 km and below about 35–40 km impact altitude. This altitude span encompasses the core region from the middle troposphere to the lower/middle stratosphere, where RO measurements are known to have the highest quality (e.g., Kuo et al., 2005; Scherllin-Pirscher et al., 2011b). In the lowest few kilometers, there are known biases in bending angle observations obtained in moist low-latitude regions, leading to substantial differences between the missions. Throughout the stratosphere, Metop and COSMIC are qualitatively very similar, while GRACE and CHAMP exhibit quasi-random, noise-like structures above about 35 km.
Figure 8 shows bending angle differences between GRACE and COSMIC (left column), between Metop and COSMIC with Metop based on input data from UCAR (middle column), and between Metop and COSMIC with Metop based on input data from EUMETSAT (right column). COSMIC is chosen as comparison reference because it provides the longest record of the four missions, and because it has a good local-time coverage. Above 8 km impact altitude, the differences between the RO missions are small (note that the bending angle color range in the plots only spans ±0.2 %). A large fraction of the variability in the difference plots consists of a quasi-random, noise-like pattern, with a broad minimum between 10 and 25 km altitude. This pattern is most evident in the GRACE–COSMIC plots (Fig. 8, left column). The quasi-random pattern is also present in the Metop–COSMIC plots (Fig. 8, middle and right columns) but is less visible as it is superposed on an almost uniform positive bias level (red colors) at low latitudes and midlatitudes.
The difference plots in Fig. 8 reveal a range of systematic differences between RO missions that cannot be explained by random profile errors or by quasi-random sampling effects. We identify the following systematic bending angle biases:
-
Biases in the lower troposphere are up to a few percent (out of scale). The biases are stronger and have a larger vertical extent at low latitudes, and are believed to be linked to signal-tracking issues in moist regions of the atmosphere (e.g., Sokolovskiy et al., 2010).
-
Seasonally varying biases are up to 0.1 %–0.2 % at high altitudes (>30 km) and high latitudes (>60∘ latitude).
-
Bias shifts are on the order of 0.1 % below about 20 km in the Metop–COSMIC differences in 2013. These shifts are related to firmware upgrades of the RO instruments aboard Metop-B (in April 2013) and Metop-A (July 2013). The tracking of the GPS signals for the Metop rising occultations was changed, which had the effect that a minor bias due to the L2 extrapolation in the ROM SAF processing suddenly appeared (described in the series of ROM SAF validation reports at http://www.romsaf.org/product_documents.php).
-
Large-scale hemispherically asymmetric (north–south) Metop–COSMIC bias is on the order of 0.1 % above 35–40 km and increasing upward. Only seen in the plots with Metop data based on input from EUMETSAT (Fig. 8, rightmost column). This difference is believed to be related to differences in LEO satellite orbits from the two sources of input data.
-
Relatively uniform Metop–COSMIC difference at low latitudes and midlatitudes is on the order of 0.03 % at 20 km and increasing upward (0.1 % at 40 km). This difference is believed to be related to undersampling of the diurnal cycle, in combination with imperfect sampling-error correction of the Metop data.
-
GRACE–COSMIC and CHAMP–COSMIC cyclic differences (the latter not shown here) at low latitudes and midlatitudes are on the order of 0.03 % at 20 km and increasing upward. This is a weak effect and is just barely seen in Fig. 8 (vertical averaging makes this effect more easily detected; see Fig. 9). The cycle period is around 5 months for GRACE–COSMIC and 4 months for CHAMP–COSMIC. These differences are believed to be related to undersampling of the diurnal cycle, in combination with imperfect sampling-error correction.
Most of these RO mission differences are caused by systematic errors in the underlying profile data that are propagated to the gridded monthly means. The exception is the sampling errors that are intrinsic to the gridded data.
5.2 Anomaly time series
The RO mission differences have so far been described in terms of bending angles. However, the identified differences are also relevant for the geophysical variables retrieved from bending angle, e.g., refractivity and temperature. Generally, errors in bending angle propagate downward to lower altitudes in the retrieval chain. This becomes evident in the anomaly time series discussed below.
5.2.1 Bending angle
The left column of Fig. 9 shows globally averaged monthly mean anomalies of bending angle, vertically averaged in four height layers: 4–8, 8–30, 30–35, and 35–40 km. Each plot includes data for the four RO missions. The corresponding panels in the left column of Fig. 9 show the differences of CHAMP, GRACE, and Metop with respect to COSMIC. During the years 2008 to 2014, the six-satellite COSMIC constellation also had a nearly complete local-time coverage, which is important for detecting the impact of undersampling the diurnal cycle in the other missions.
In 8–30 km vertically averaged data (Fig. 9, third row from top), the four time series show a very close match. How well the overlapping time series match must be evaluated in relation to the variability of the time series. There is variability on a broad range of timescales, from short-range intra-seasonal variations to interannual and decadal variability, and long-term climatological trends. We find that for the 8–30 km time series, the mean (time-averaged) differences between the missions are −0.005 %, 0.001 %, and 0.02 %, respectively, for CHAMP, GRACE, and Metop relative to COSMIC. This is much smaller than the intrinsic variability of the time series – the total range of global monthly mean bending angle anomalies in this height range is about 1 %. Metop shows a relatively steady bias relative to COSMIC, with a stepwise decrease of the bias in mid-2013 and with a tendency to oscillations after 2014. The CHAMP and GRACE differences with respect to COSMIC exhibit strong oscillating behavior with peaks that reach about the same magnitude as the Metop–COSMIC bias. The cycle periods for the oscillating difference time series are about 4 and 5 months, respectively, closely corresponding to the precession rate of the respective satellite orbit. This could be explained as a consequence of the sampling-error correction not being able to fully compensate for the effects of undersampling the diurnal and semi-diurnal cycles. It would also be consistent with the near-constant Metop–COSMIC biases because of the Sun-synchronous Metop orbit.
Above the middle troposphere, the mean differences in Fig. 9 increase with altitude and for Metop–COSMIC the differences are about 0.04 % in the 30–35 km interval and 0.08 % in the 35–40 km interval. The mean GRACE–COSMIC differences are small, while the mean CHAMP–COSMIC differences increase to 0.02 % in the 35–40 km interval. The magnitude of the CHAMP–COSMIC and GRACE–COSMIC oscillations increases with altitude, such that the peak biases of these two mission differences reach about the same values as the Metop–COSMIC biases.
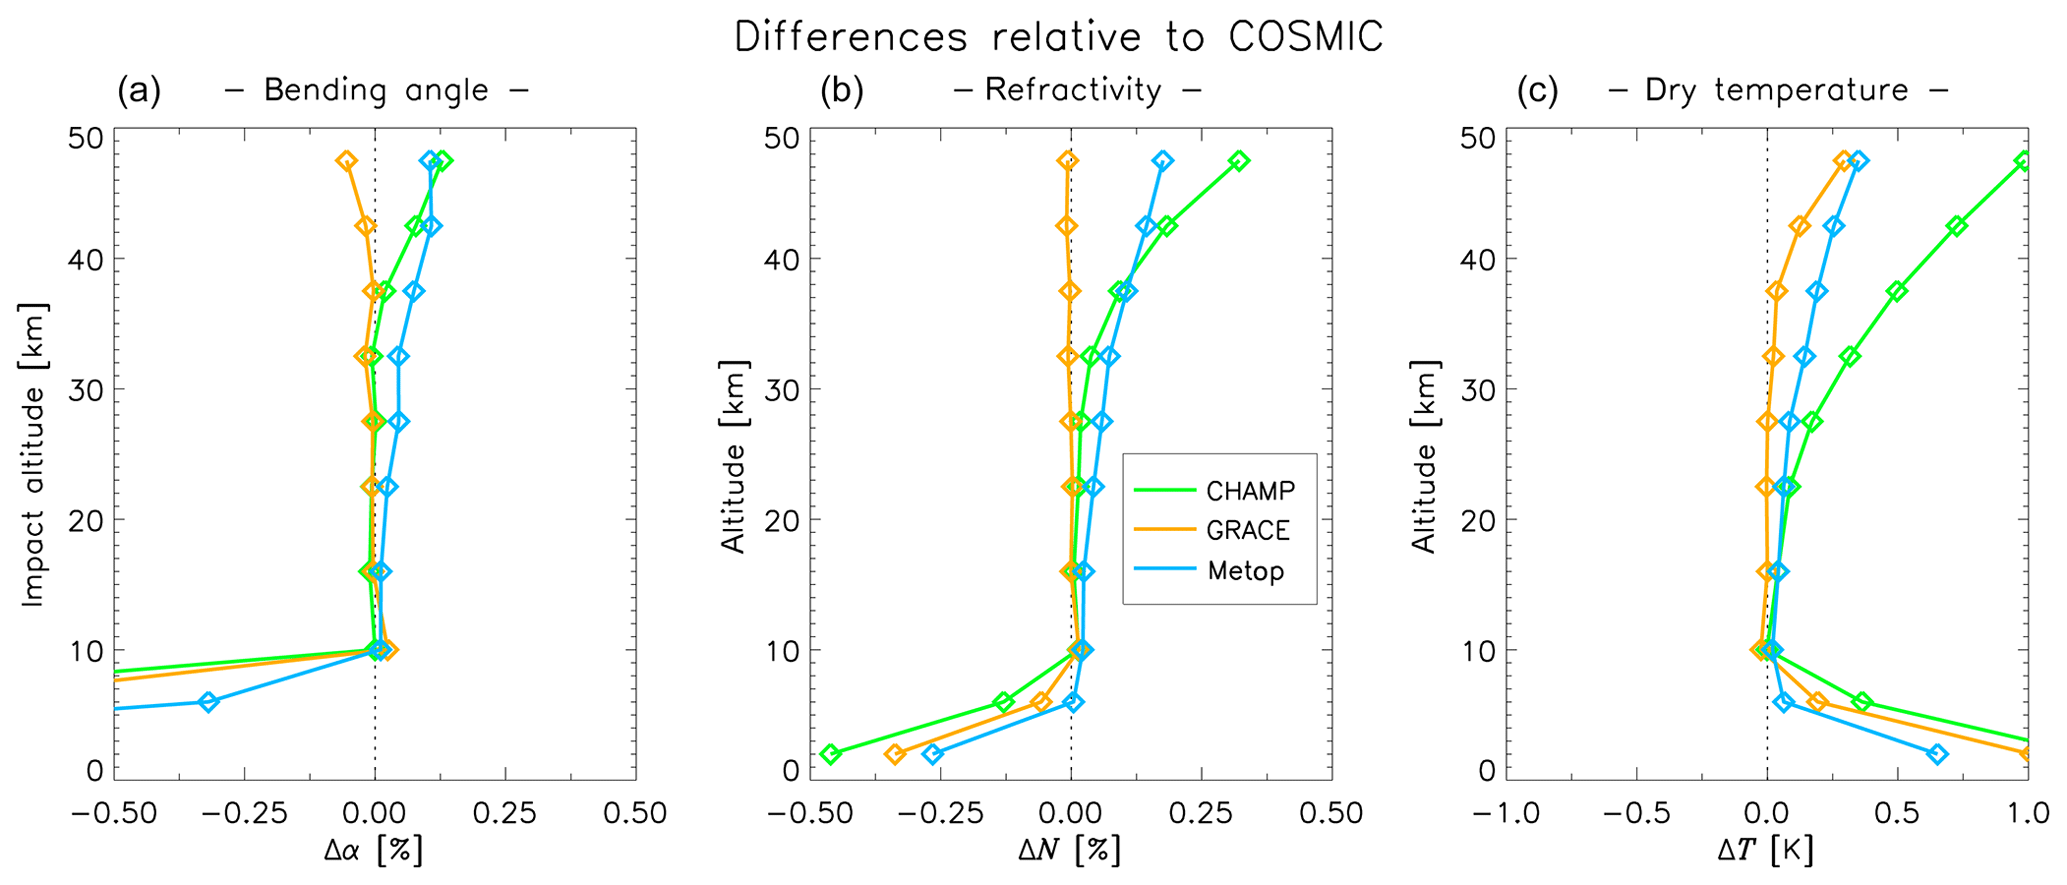
Figure 11Summary of global CHAMP, GRACE, and Metop differences relative to COSMIC, quantified by the time averages of the mission differences computed over the respective overlap period. The RO data have been binned, averaged, sampling-error corrected, and converted to anomalies according to the methods described in Sect. 3.
In the tropospheric 4–8 km impact altitude interval (Fig. 9, left column), we find relatively large biases between the missions. Monthly global averages of CHAMP and GRACE bending angles are about 1 % smaller than the corresponding COSMIC data, while Metop bending angles are about 0.3 % smaller. It should also be noted that the CHAMP data record shows substantial bias shifts in 2002 and 2006.
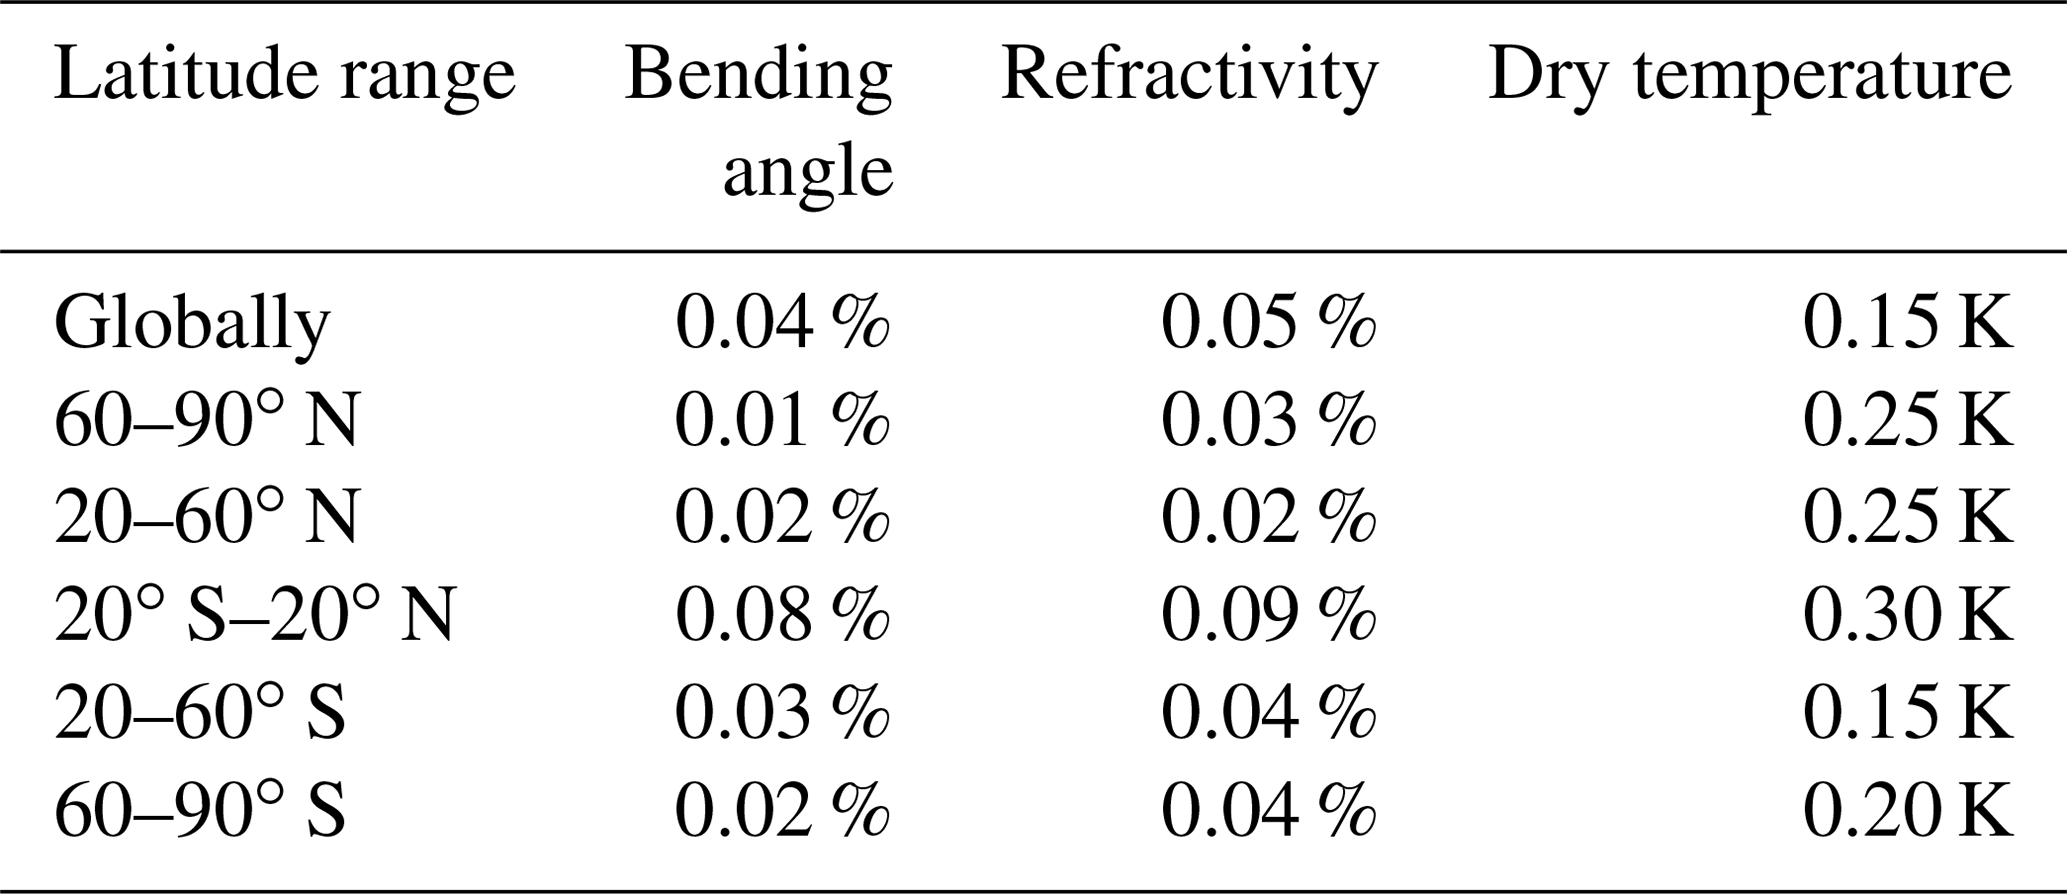
Figure 11a summarizes the mission differences for global mean bending angle anomalies. The summary is based on the time-averaged differences computed over the respective overlap period. The RO mission consistency, defined as the largest time-averaged difference between any two missions, is about 0.04 % above 8 km and below 30 km, increasing to 0.08 % below 40 km, and about 0.18 % below 50 km. These numbers can be up to a factor of 2 larger for 30∘ latitude bands compared to global means (Table 2).
Table 2RO mission consistency above 8 km and below 30 km. Consistency is here defined as the largest time-averaged difference between any two RO satellite missions.
5.2.2 Refractivity
Similarly to the bending angle anomalies, the global refractivity anomalies for the four RO missions show a very close match in the 8–30 km vertically averaged data (not shown here). The differences of the refractivity anomalies for Metop relative to COSMIC are nearly constant (about 0.04 %) over the 10 years of overlap, with just a small decrease of the differences after mid-2013 and with a tendency to short timescale oscillations towards the end of the time period. The differences of CHAMP and GRACE relative to COSMIC show similar, steady oscillation patterns as the corresponding bending angle time series.
Vertically averaged global refractivity anomalies for 5 km layers from 30 to 50 km show a systematic increase of the mission differences with height (not shown here). This is similar to the bending angles, although the differences are larger for refractivity due to the downward propagation of errors in the Abel transform (Sect. 3.1).
Figure 11b summarizes the mission differences for global mean refractivity anomalies. The consistency is about 0.05 % between 8 and 30 km, increasing to 0.11 % below 40 km, and about 0.32 % below 50 km. These numbers can be up to a factor of 2 larger for 30∘ latitude bands compared to global means (Table 2).
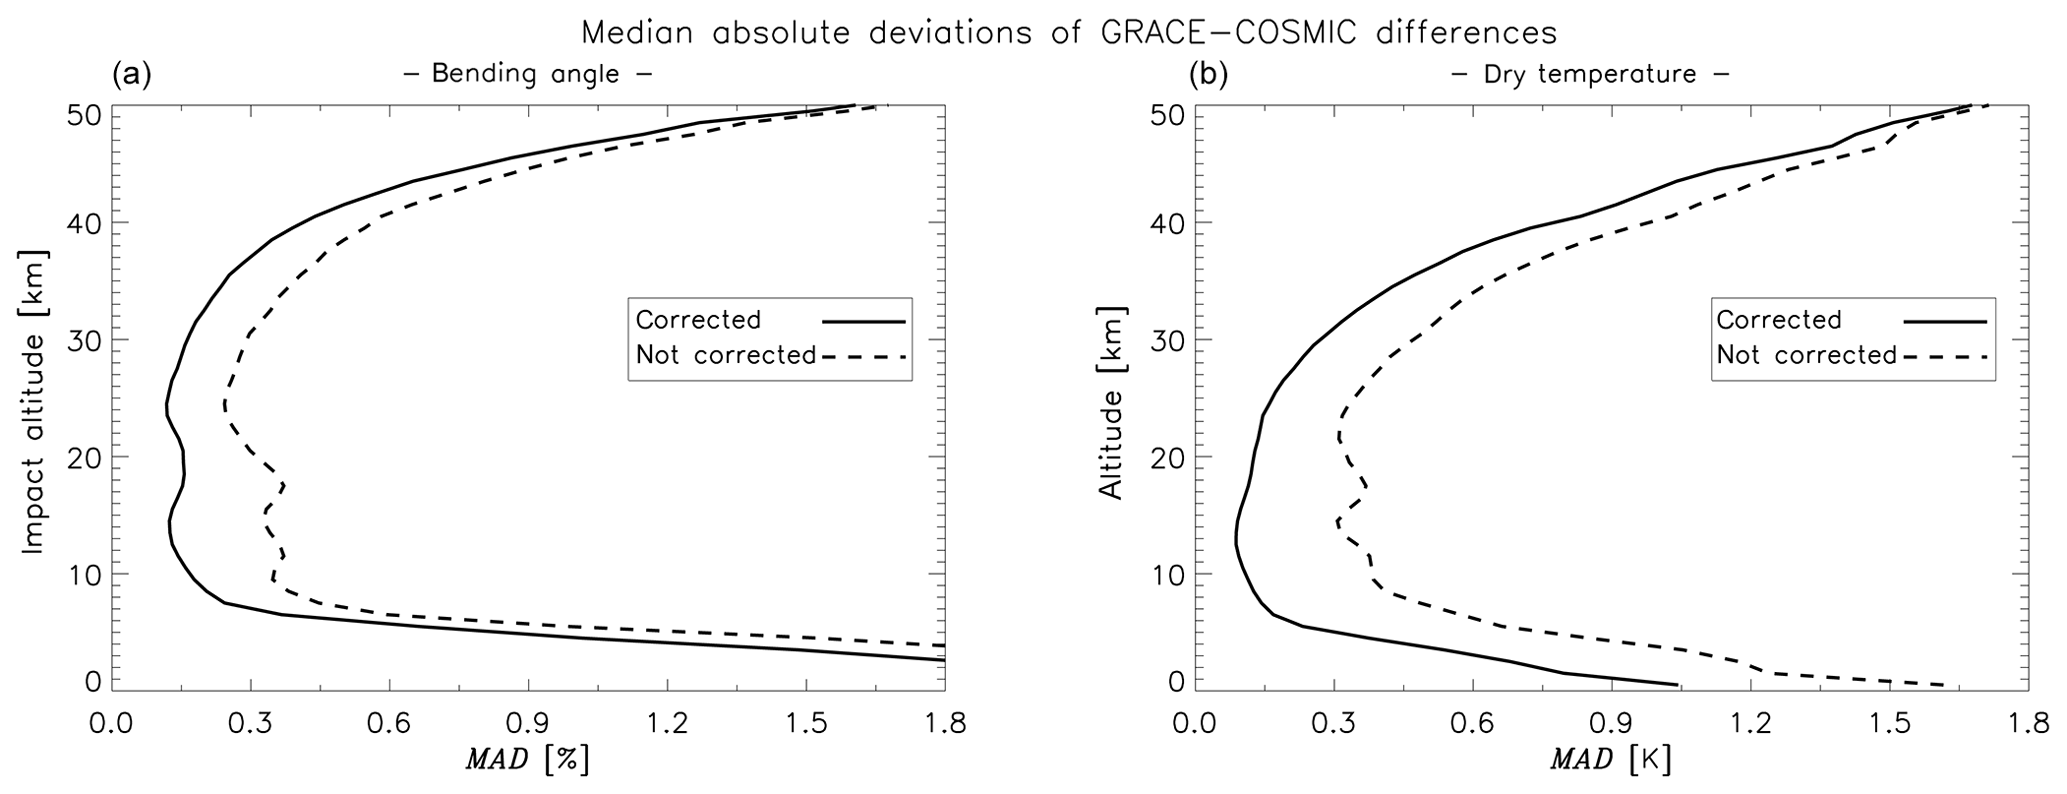
Figure 12Median absolute deviations of GRACE–COSMIC differences computed from all monthly bins in 1 km height intervals during the mission overlap period from March 2007 to December 2016: deviations for bending angles (a) and for dry temperature (b). The solid lines show deviations with sampling-error correction applied, and the dashed lines show deviations without correction.
5.2.3 Dry temperature
The globally averaged dry temperature anomalies are shown in Fig. 10. The RO differences in the 8–30 km vertical averages are smaller than 0.10 K. We note that the oscillating behavior seen in the bending angle and refractivity differences for CHAMP and GRACE relative to COSMIC is there also for dry temperature but is less obvious as it has a much more irregular appearance. At higher altitudes, the dry temperature anomalies in 5 km layers from 30 to 50 km show increasingly larger differences between the RO missions. In addition to the errors propagated from bending angle to refractivity, there is also a downward propagation of errors due to the hydrostatic integration used in the retrieval of dry temperature.
Figure 11c summarizes the mission differences for global mean dry temperature anomalies. The RO mission consistency is about 0.15 K between 8 and 30 km, increasing to 0.30 K up to 40 km, and 0.50 K up to 40 km. These numbers can be up to a factor of 2 larger for 30∘ latitude bands compared to global means (Table 2).
5.3 Evaluation of the sampling-error correction
Mission differences during overlap periods allow us to investigate some of the consequences of sampling-error correction and to assess the magnitude of the residual sampling errors remaining after correction. Figure 12 shows the median absolute deviations of GRACE–COSMIC differences based on all monthly bins in 1 km height intervals during the mission overlap period March 2007 to December 2016. The solid lines are computed from GRACE and COSMIC data with sampling-error correction applied, while the dashed lines are computed from data without correction. The application of sampling-error correction substantially reduces the GRACE–COSMIC differences, both for bending angle and dry temperature, as well as for other geophysical variables (not shown).
The deviations remaining after sampling-error correction (indicated by the solid lines in Fig. 12) are due to a combination of GRACE and COSMIC random profile errors, residual sampling errors, and any systematic differences between the RO missions that have a sufficiently strong variation with time and/or latitude. In the core region (8–30 km), random profile errors can at most explain a part of the 0.1 %–0.2 % deviations for the bending angles and the 0.10–0.15 K deviations for dry temperature. Assuming, conservatively, that these remaining errors are due solely to residual sampling errors, we find that around one-third of the original sampling error remain after sampling-error correction. This is roughly in line with the findings of Scherllin-Pirscher et al. (2011a).
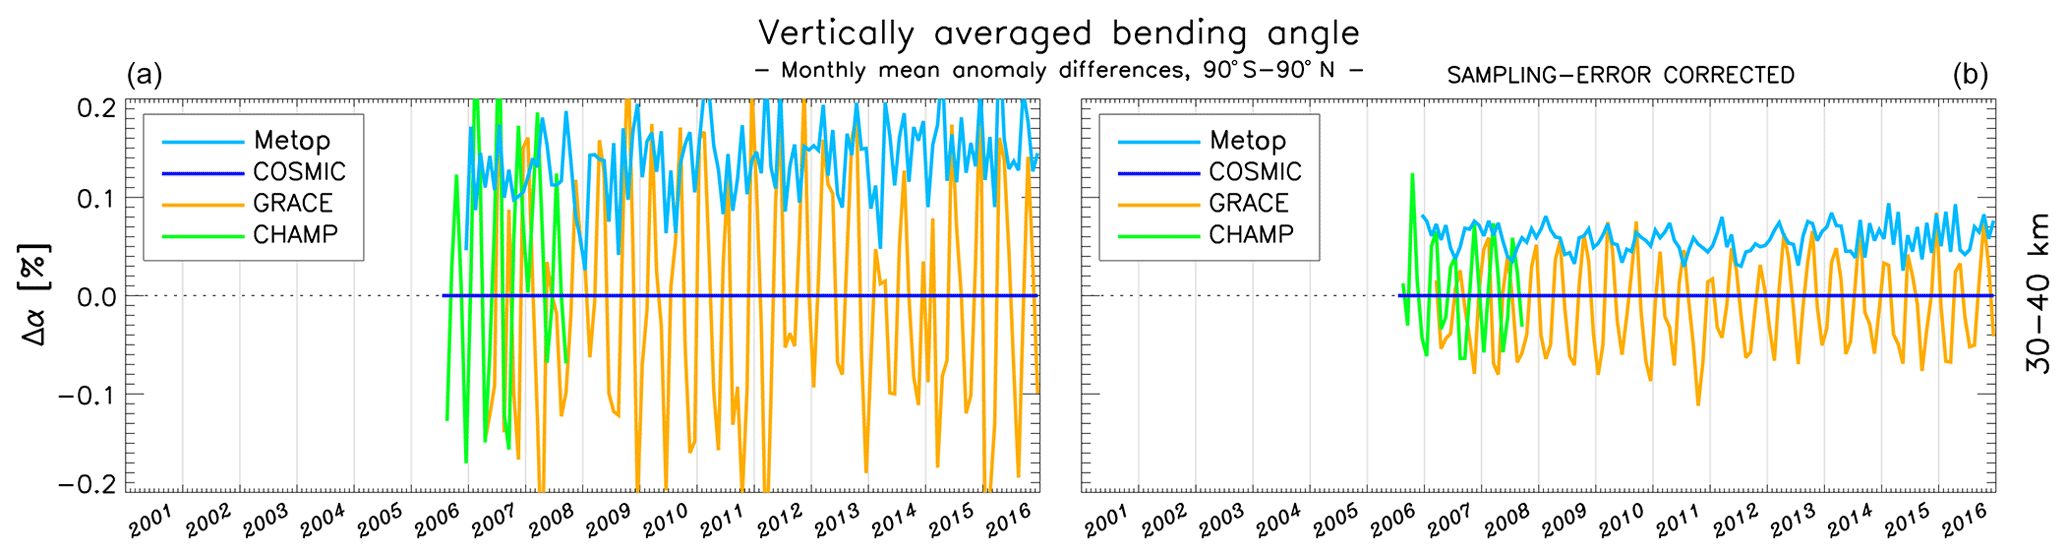
Figure 13Differences between monthly mean CHAMP, GRACE, and Metop refractivity anomalies relative to COSMIC, globally averaged in the 30–40 km altitude layer (a) without sampling-error correction and (b) with sampling-error correction applied.
Figure 13 shows an example of the consequences of sampling-error correction for the mission differences. Figure 13a shows mission difference anomaly time series without correction, and Fig. 13b shows the same differences with the correction applied. The CHAMP and GRACE differences relative to COSMIC are dominated by a periodic oscillation, presumably due to aliasing between the LEO satellite orbital precession and diurnal or semi-diurnal cycles in the atmosphere. The magnitude of these oscillations are substantially reduced by the sampling-error correction. However, the fact that they are not entirely removed indicates that the estimated sampling errors, based on sampling ERA-Interim reanalysis fields, are not able to fully capture the diurnal and/or semi-diurnal cycles. Unlike the case with CHAMP and GRACE, the differences between Metop and COSMIC are not periodic. Given the Sun-synchronous orbit of Metop, the errors resulting from undersampling of the diurnal cycle are expected to be near constant in time, which is roughly in line with the findings.
In this study, we present results from an evaluation of the 15-year ROM SAF CDR v1.0 consisting of separate data records from four different RO satellite missions: CHAMP, GRACE, COSMIC, and Metop. The processing of the RO data to gridded monthly means is described, including the sampling-error correction of the monthly mean data. The observed bending angle, refractivity, and dry temperature records are compared to the ERA-Interim short-term forecasts. The four RO data records are also intercompared during mission overlap periods and the impact of the sampling-error correction, applied to the gridded monthly mean data, is evaluated.
In general, there is good overall agreement between the ROM SAF gridded monthly mean CDR and the ERA-Interim reanalysis, particularly in the 8–30 km height interval. Here, the differences appear to mainly reflect time-varying biases in ERA-Interim, as indicated from the timing of the bias shifts and the fact that the spread amongst the RO missions is smaller than the differences between RO and ERA-Interim. We interpret this as a better temporal stability in the RO data records than in the ERA-Interim time series. At high altitudes, above 30–40 km, we find larger differences between RO and reanalysis, and also a long-term trend in the difference time series. At altitudes below 8 km, the differences are again larger, particularly for bending angle, with a relatively large spread amongst the RO missions.
To fully exploit the RO data records scientifically requires combining the data records from several RO missions into multi-mission data records. There is an expectation that this can be done without any adjustments or intercalibrations. However, any differences between the missions in the retrieved geophysical data may lead to time-varying biases in the multi-mission data record as new satellite missions replace older ones. We investigated the presence of such differences during mission overlap periods and found that there is a high degree of consistency between the RO satellite missions in the 8–30 km altitude region. The remaining differences in this altitude interval are predominantly oscillatory or highly variable for CHAMP and GRACE relative to COSMIC, while for Metop the differences relative to COSMIC largely consist of small, but stable, offsets. These differences should be considered in the generation of multi-mission data records. At higher altitudes, the differences between the RO missions become increasingly larger, and at altitudes below 8 km we find biases and bias shifts that substantially reduce the inter-mission consistency.
The cause of the inter-mission biases can in many cases be identified from difference plots during the mission overlap periods. In this study, we have identified the most dominating bending angle biases that are propagated from the input data or from the geophysical profile data to the gridded monthly means: lower-tropospheric biases linked to moist regions of the atmosphere, seasonally varying biases at high altitudes and high latitudes, Metop–COSMIC bias shifts related to firmware upgrades, and a high-altitude hemispherically asymmetric bias related to small differences between the UCAR and EUMETSAT low-level input data. We also find systematic residual sampling errors that appear to be caused by the undersampling of diurnal or semi-diurnal cycles not being fully corrected for by the sampling-error correction method.
The results presented here also affect the other geophysical variables retrieved from RO measurements, which are not explicitly discussed in the present study: dry pressure, dry geopotential heights, temperature, and humidity. For the latter two variables, obtained through a 1D-Var retrieval using additional information from a model background (see Sect. 3.1), the relatively large inter-mission biases in the lower troposphere will have an impact on the temperature and humidity data records, which was not investigated here.
This study shows that above the lower troposphere and below about 30 km, data records from different RO satellite missions exhibit only small systematic differences. Further reduction of these differences most likely requires an improved sampling-error correction. Reducing the inter-mission differences at higher altitudes also requires reduced impacts from subtle differences in the input data, and from the statistical optimization of the bending angles, as well as an understanding of the cause of the high-altitude, high-latitude seasonally varying differences. A continued reduction of the relatively small, but systematic, inter-mission biases, is important for the generation of long-term stable, homogeneous RO-based CDRs extending to higher altitudes.
The data used in the analysis are available at http://www.romsaf.org/product_archive (last access: 20 August 2019) (EUMETSAT, 2019).
The data were generated as a team effort including contributions from all four authors. HG designed the study, performed the main analysis, and generated the figures. HG also prepared the manuscript with contributions from KBL, JKN, and SS both during the initial writing and during the peer review process.
The authors declare that they have no conflict of interest.
This work was carried out as part of the Radio Occultation Meteorology Satellite Application Facility (ROM SAF), which is a decentralized operational RO processing center under EUMETSAT. The authors are members of the ROM SAF team.
This paper was edited by Peter Alexander and reviewed by Richard Anthes and one anonymous referee.
Angerer, B., Ladstädter, F., Scherllin-Pirscher, B., Schwärz, M., Steiner, A. K., Foelsche, U., and Kirchengast, G.: Quality aspects of the Wegener Center multi-satellite GPS radio occultation record OPSv5.6, Atmos. Meas. Tech., 10, 4845–4863, https://doi.org/10.5194/amt-10-4845-2017, 2017. a, b, c
Anthes, R. A.: Exploring Earth's atmosphere with radio occultation: contributions to weather, climate and space weather, Atmos. Meas. Tech., 4, 1077–1103, https://doi.org/10.5194/amt-4-1077-2011, 2011. a
Anthes, R. A., Bernhardt, P. A., Chen, Y., Cucurull, L., Dymond, K. F., Ector, D., Healy, S. B., Ho, S.-P., Hunt, D. C., Kuo, Y.-H., Liu, H., Manning, K., McCormick, C., Meehan, T. K., Randel, W. J., Rocken, C., Schreiner, W. S., Sokolovskiy, S. V., Syndergaard, S., Thompson, D. C., Trenberth, K. E., Wee, T.-K., Yen, N. L., and Zeng, Z.: The COSMIC/FORMOSAT-3 mission: Early results, B. Am. Meteorol. Soc., 89, 313–333, https://doi.org/10.1175/BAMS-89-3-313, 2008. a
Ao, C. O., Jiang, J. H., Mannucci, A. J., Su, H., Verkhoglyadova, O., Zhai, C., Cole, J., Donner, L., Iversen, T., Morcrette, C., Rotstayn, L., Watanabe, M., and Yukimoto, S.: Evaluation of CMIP5 upper troposphere and lower stratosphere geopotential height with GPS radio occultation observations, J. Geophys. Res., 120, 1678–1689, https://doi.org/10.1002/2014JD022239, 2015. a
Beyerle, G., Schmidt, T., Michalak, G., Heise, S., Wickert, J., and Reigber, C.: GPS radio occultation with GRACE: Atmospheric profiling utilizing the zero difference technique, Geophys. Res. Lett., 32, L13806, https://doi.org/10.1029/2005GL023109, 2005. a
Cardinali, C. and Healy, S.: Impact of GPS radio occultation measurements in the ECMWF system using adjoint-based diagnostics, Q. J. Roy. Meteor. Soc., 140, 2315–2320, https://doi.org/10.1002/qj.2300, 2014. a
Danzer, J., Foelsche, U., Scherllin-Pirscher, B., and Schwärz, M.: Influence of changes in humidity on dry temperature in GPS RO climatologies, Atmos. Meas. Tech., 7, 2883–2896, https://doi.org/10.5194/amt-7-2883-2014, 2014. a
Dee, D. P., Uppala, S. M., Simmons, A. J., Berrisford, P., Poli, P., Kobayashi, S., Andrae, U., Balmaseda, M. A., Balsamo, G., Bauer, P., Bechtold, P., Beljaars, A. C. M., van de Berg, L., Bidlot, J., Bormann, N., Delsol, C., Dragani, R., Fuentes, M., Geer, A. J., Haimberger, L., Healy, S. B., Hersbach, H., Hólm, E. V., Isaksen, L., Kållberg, P., Köhler, M., Matricardi, M., McNally, A. P., Monge‐Sanz, B. M., Morcrette, J. J., Park, B.-K., Peubey, C., de Rosnay, P., Tavolato, C., Thépaut, J.-N., and Vitart, F.: The ERA-Interim reanalysis: configuration and performance of the data assimilation system, Q. J. Roy. Meteor. Soc., 137, 553–597, 2011. a, b, c
EUMETSAT: ROM SAF Product Archive, available at: http://www.romsaf.org/product_archive, last access: 20 August 2019. a
Fjeldbo, G., Kliore, A. J., and Eshleman, V. R.: The neutral atmosphere of Venus as studied with the Mariner V radio occultation experiments, Astron. J., 76, 123–140, 1971. a
Foelsche, U., Kirchengast, G., and Steiner, A. K.: Global climate monitoring based on CHAMP/GPS radio occultation data, in: First CHAMP Mission Results for Gravity, Magnetic and Atmospheric studies, edited by: Reigber, C., Luhr, H., and Schwintzer, P., Springer, Berlin, 397–407, 2003. a
Foelsche, U., Borsche, M., Steiner, A. K., Gobiet, A., Pirscher, B., Kirchengast, G., Wickert. J., and Schmidt, T.: Observing upper troposphere-lower stratosphere climate with radio occultation data from the CHAMP satellite, Clim. Dynam., 31, 49–65, https://doi.org/10.1007/s00382-007-0337-7, 2008. a
Foelsche, U., Scherllin-Pirscher, B., Ladstädter, F., Steiner, A. K., and Kirchengast, G.: Refractivity and temperature climate records from multiple radio occultation satellites consistent within 0.05 %, Atmos. Meas. Tech., 4, 2007–2018, https://doi.org/10.5194/amt-4-2007-2011, 2011. a
Gorbunov, M. E.: Ionospheric correction and statistical optimization of radio occultation data, Radio Sci., 37, 1084, https://doi.org/10.1029/2000RS002370, 2002. a
Gorbunov, M. E. and Lauritsen, K. B.: Analysis of wave fields by Fourier integral operators and their application for radio occultations, Radio Sci., 39, 4010, https://doi.org/10.1029/2003RS002971, 2004. a
Healy, S. B.: Surface pressure information retrieved from GPS radio occultation measurements, Q. J. Roy. Meteor. Soc., 139, 2108–2118, 2013. a
Healy, S. B. and Eyre, J. R.: Retrieving temperature, water vapor and surface pressure information from refractive-index profiles derived by radio occultation: A simulation study, Q. J. Roy. Meteor. Soc., 126, 1661-1683, 2000. a
Healy, S. B. and Thépaut, J.-N.: Assimilation experiments with CHAMP GPS radio occultation measurements, Q. J. Roy. Meteor. Soc., 132, 605–623, 2006. a
Healy, S. B., Jupp, A. M., and Marquardt, C.: Forecast impact experiment with GPS radio occultation measurements, Geophys. Res. Lett., 32, L03804, https://doi.org/10.1029/2004GL020806, 2005. a
Ho, S.-P., Kirchengast, G., Leroy, S., Wickert, J., Mannucci, A. J., Steiner, A. K., Hunt, D., Schreiner, W., Sokolovskiy, S., Ao, C., Borsche, M., von Engeln, A., Foelsche, U., Heise, S., Iijima, B., Kuo, Y.-H., Kursinski, R., Pirscher, B., Ringer, M., Rocken, C., and Schmidt, T.: Estimating the uncertainty of using GPS radio occultation data for climate monitoring: Intercomparison of CHAMP refractivity climate records for 2002 to 2006 from different data centers, J. Geophys. Res., 114, D23107, https://doi.org/10.1029/2009JD011969, 2009. a, b
Ho, S.-P., Hunt, D., Steiner, A. K., Mannucci, A. J., Kirchengast, G., Gleisner, H., Heise, S., von Engeln, A., Marquardt, C., Sokolovskiy, S., Schreiner, W., Scherllin-Pirscher, B., Ao, C., Wickert, J., Syndergaard, S., Lauritsen, K. B., Leroy, S., Kursinski, E. R., Kuo, Y.-H., Foelsche, U., Schmidt, T., and Gorbunov, M.: Reproducibility of GPS radio occultation data for climate monitoring: Profile-to-profile inter-comparison of CHAMP climate records 2002 to 2008 from six data centers, J. Geophys. Res., 117, D18111, https://doi.org/10.1029/2012JD017665, 2012. a
Khaykin, S. M., Funatsu, B. M., Hauchecorne, A., Godin-Beekmann, S., Claud, C., Keckhut, P., Pazmino, A., Gleisner, H., Nielsen, J. K., Syndergaard, S., and Lauritsen, K. B.: Post-millennium changes in stratospheric temperature consistently resolved by GPS radio occultation and AMSU observations, Geophys. Res. Lett., 44, 7510–7518, https://doi.org/10.1002/2017GL074353, 2017. a
Kuo, Y.-H., Schreiner, W. S., Wang, J., Rossiter, D. L., and Zhang, Y.: Comparison of GPS radio occultation soundings with radiosondes, Geophys. Res. Lett., 32, L05817, https://doi.org/10.1029/2004GL021443, 2005. a
Kursinski, E. R., Hajj, G., Schofield, J., Linfield, R., and Hardy, K.: Observing Earth's atmosphere with radio occultation measurements using the Global Positioning System, J. Geophys. Res., 102, 23429–23465, 1997. a, b
Lackner, B. C., Steiner, A. K., Hegerl, G. C., and Kirchengast, G.: Atmospheric climate change detection by radio occultation data using a fingerprinting method, J. Climate, 24, 5275–5291, https://doi.org/10.1175/2011JCLI3966.1, 2011. a
Ladstädter, F., Steiner, A. K., Foelsche, U., Haimberger, L., Tavolato, C., and Kirchengast, G.: An assessment of differences in lower stratospheric temperature records from (A)MSU, radiosondes, and GPS radio occultation, Atmos. Meas. Tech., 4, 1965–1977, https://doi.org/10.5194/amt-4-1965-2011, 2011. a
Leroy, S. S., Dykema, J. A., and Anderson, J. G.: Climate benchmarking using GNSS occultation, Atmosphere and Climate, Springer, Berlin Heidelberg, 287–301, 2006. a
Leroy, S. S., Ao, C., and Verkhoglyadova, O. P.: Temperature trends and anomalies in modern satellite data: infrared sounding and GPS radio occultation, J. Geophys. Res., 123, 11431–11444, https://doi.org/10.1029/2018JD028990, 2018. a
Li, Y., Kirchengast, G., Scherllin-Pirscher, B., Norman, R., Yuan, Y. B., Fritzer, J., Schwaerz, M., and Zhang, K.: Dynamic statistical optimization of GNSS radio occultation bending angles: advanced algorithm and performance analysis, Atmos. Meas. Tech., 8, 3447–3465, https://doi.org/10.5194/amt-8-3447-2015, 2015. a
Luntama, J.-P., Kirchengast, G., Borsche, M., Foelsche, U., Steiner, A., Healy, S. B., von Engeln, A., OClerigh, E., and Marquardt, C.: Prospects of the EPS GRAS mission for operational atmospheric applications, B. Am. Meteorol. Soc., 89, 1863–1875, https://doi.org/10.1175/2008BAMS2399.1, 2008. a
Poli, P., Healy, S., and Dee, D. P.: Assimilation of Global Positioning System Radio Occultation data in the ECMWF ERA-Interim reanalysis, Q. J. Roy. Meteor. Soc., 136, 1972–1990, https://doi.org/10.1002/qj.722, 2010. a
Rieckh, T., Scherllin-Pirscher, B., Ladstädter, F., and Foelsche, U.: Characteristics of tropopause parameters as observed with GPS radio occultation, Atmos. Meas. Tech., 7, 3947–3958, https://doi.org/10.5194/amt-7-3947-2014, 2014. a
Scherllin-Pirscher, B., Kirchengast, G., Steiner, A. K., Kuo, Y.-H., and Foelsche, U.: Quantifying uncertainty in climatological fields from GPS radio occultation: an empirical-analytical error model, Atmos. Meas. Tech., 4, 2019–2034, https://doi.org/10.5194/amt-4-2019-2011, 2011a. a, b
Scherllin-Pirscher, B., Steiner, A. K., Kirchengast, G., Kuo, Y.-H., and Foelsche, U.: Empirical analysis and modeling of errors of atmospheric profiles from GPS radio occultation, Atmos. Meas. Tech., 4, 1875–1890, https://doi.org/10.5194/amt-4-1875-2011, 2011b. a
Scherllin-Pirscher, B., Deser, C., Ho, S.-P., Chou, C., Randel, W., and Kuo, Y.-H.: The vertical and spatial structure of ENSO in the upper troposphere and lower stratosphere from GPS radio occultation measurements, Geophys. Res. Lett., 39, L20801, https://doi.org/10.1029/2012GL053071, 2012. a
Scherllin-Pirscher, B., Steiner, A. K., and Kirchengast, G.: Deriving dynamics from GPS radio occultation: Three-dimensional wind fields for monitoring the climate, Geophys. Res. Lett., 41, 7367–7374, https://doi.org/10.1002/2014GL061524, 2014. a
Scherllin-Pirscher, B., Syndergaard, S., Foelsche, U., and Lauritsen, K. B.: Generation of a bending angle radio occultation climatology (BAROCLIM) and its use in radio occultation retrievals, Atmos. Meas. Tech., 8, 109–124, https://doi.org/10.5194/amt-8-109-2015, 2015. a
Schmidt, T., Schoon, L., Dobslaw, H., Matthes, K., and Thomas, M.: UTLS temperature validation of MPI-ESM decadal hindcast experiments with GPS radio occultations, Meteorol. Z., 25, 673–683, https://doi.org/10.1127/metz/2015/0601, 2016. a
Schreiner, W., Rocken, C., Sokolovskiy, S., and Hunt, D.: Quality assessment of COSMIC/FORMOSAT-3 GPS radio occultation data derived from single- and double-difference atmospheric excess phase processing, GPS Solut., 14, 13–22, https://doi.org/10.1007/s10291-009-0132-5, 2010. a
Schreiner, W., Sokolovskiy, S., Hunt, D., Rocken, C., and Kuo, Y.-H.: Analysis of GPS radio occultation data from the FORMOSAT-3/COSMIC and Metop/GRAS missions at CDAAC, Atmos. Meas. Tech., 4, 2255–2272, https://doi.org/10.5194/amt-4-2255-2011, 2011. a, b, c
Simmons, A. J., Berrisford, P., Dee, D. P., Hersbach, H., Hirahara, S., and Thépaut, J.-N.: A reassessment of temperature variations and trends from global reanalyses and monthly surface climatology datasets, Q. J. Roy. Meteor. Soc., 143, 101–119, https://doi.org/10.1002/qj.2949, 2017. a
Sokolovskiy, S., Rocken, C., Schreiner, W., and Hunt, D.: On the uncertainty of radio occultation inversions in the lower troposphere, J. Geophys. Res., 102, D22111, https://doi.org/10.1029/2010JD014058, 2010. a
Steiner, A. K., Lackner, B. C., Ladstädter, F., Scherllin‐Pirscher, B., Foelsche, U., and Kirchengast, G.: GPS radio occultation for climate monitoring and change detection, Radio Sci., 46, RS0D24, https://doi.org/10.1029/2010RS004614, 2011. a
Steiner, A. K., Hunt, D., Ho, S.-P., Kirchengast, G., Mannucci, A. J., Scherllin-Pirscher, B., Gleisner, H., von Engeln, A., Schmidt, T., Ao, C., Leroy, S. S., Kursinski, E. R., Foelsche, U., Gorbunov, M., Heise, S., Kuo, Y.-H., Lauritsen, K. B., Marquardt, C., Rocken, C., Schreiner, W., Sokolovskiy, S., Syndergaard, S., and Wickert, J.: Quantification of structural uncertainty in climate data records from GPS radio occultation, Atmos. Chem. Phys., 13, 1469–1484, https://doi.org/10.5194/acp-13-1469-2013, 2013. a
von Engeln, A., Andres, Y., Marquardt, C., and Sancho, F.: GRAS radio occultation on-board of Metop, Adv. Space Res., 47, 336–347, https://doi.org/10.1016/j.asr.2010.07.028, 2011. a
Wickert, J., Reigber, C., Beyerle, G., König, R., Marquardt, C., Schmidt, T., Grunwaldt, L., Galas, R., Meehan, T., Melbourne, W., and Hocke, K.: Atmosphere sounding by GPS radio occultation: First results from CHAMP, Geophys. Res. Lett., 28, 3263–3266, 2001. a
Wilhelmsen, H., Ladstädter, F., Scherllin-Pirscher, B., and Steiner, A. K.: Atmospheric QBO and ENSO indices with high vertical resolution from GNSS radio occultation temperature measurements, Atmos. Meas. Tech., 11, 1333–1346, https://doi.org/10.5194/amt-11-1333-2018, 2018. a