the Creative Commons Attribution 4.0 License.
the Creative Commons Attribution 4.0 License.
 | 30 Jun 2020
Evaluation of the OMPS/LP stratospheric aerosol extinction product using SAGE III/ISS observations
Zhong Chen
Pawan K. Bhartia
Omar Torres
Glen Jaross
Robert Loughman
Matthew DeLand
Peter Colarco
Robert Damadeo
Ghassan Taha
The Ozone Mapping and Profiler Suite Limb Profiler (OMPS/LP) has been taking limb-scattered measurements since April 2012. It is designed to produce ozone and aerosol vertical profiles at a 1.6 km vertical resolution over the entire sunlit globe. The Version 1.5 (V1.5) aerosol extinction retrieval algorithm provides aerosol extinction profiles using observed radiances at 675 nm. The algorithm assumes Mie theory and a gamma function aerosol size distribution for the stratospheric aerosol that is derived from results calculated by the Community Aerosol and Radiation Model for Atmospheres (CARMA). In this paper, we compare V1.5 LP aerosol profiles with SAGE III/ISS solar occultation observations for the period from June 2017 to May 2019, when both measurements were available to evaluate our ability to characterize background aerosol conditions. Overall, LP extinction profiles agree with SAGE III/ISS data to within ±25 % for altitudes between 19 and 27 km, even during periods perturbed by volcanic eruptions or intense forest fires. In this altitude range, the slope parameter of linear fitting of LP extinction values with respect to SAGE III/ISS measurements is close to 1.0, with Pearson correlation coefficients of r≥0.95, indicating that the LP aerosol data are reliable in that altitude range. Comparisons of extinction time series show that both instruments capture the variability of the stratospheric aerosol layer quite well, and the differences between the two instruments vary from 0 % to ±25 % depending on altitude, latitude, and time. In contrast, we find erroneous seasonal variations in the OMPS/LP Version 1.5 dataset, which usually exist below 20 km in the Southern Hemisphere due to the lack of sensitivity to particles when the scattering angle (SA) is greater than 145∘. We also find that LP-retrieved extinction is systematically higher than SAGE III/ISS observations at altitudes above 28 km and systematically lower below 19 km in the tropics with significant biases up to ±13 %. This is likely due in part to the fact that the actual aerosol size distribution is altitude dependent. There are also other reasons related to cloud contamination, wavelength limitations, aerosol loading, and the influence of the viewing configuration.
- Article
(9737 KB) - Full-text XML
- BibTeX
- EndNote


The stratospheric aerosol layer is an important component of Earth's atmosphere through its impacts on climate and stratospheric ozone physico-chemistry (Vernier et al., 2011; Ridley et al., 2014; Bingen et al., 2017). The stratospheric aerosol layer was first observed by Junge in 1960 (Junge et al., 1961). Stratospheric aerosols that mainly originate from volcanic sources are described as liquid droplets composed of a mixture of the sulfuric acid, H2SO4, and water, H2O (Kremser et al., 2016). Recent measurements show that the background stratospheric aerosol layer is variable rather than constant, and that changes in the stratospheric aerosol layer have caused observable changes in recent tropospheric warming rates (Solomon et al., 2011), indicating that it is important to monitor the stratospheric aerosol layer over the long term. The importance of possible changes in the background stratospheric aerosol layer led to the analysis of each volcanically quiescent period (Deshler et al., 2006). For the considered period from January 1979 through to the end of 2004, the variability of stratospheric aerosol layer is explored using measurements from space-based instruments such as SAGE II (Thomason et al., 2008), CALIPSO (Winker et al., 2010), GOMOS/Envisat (Vanhellemont et al., 2010), SCIAMACHY (von Savigny et al., 2015), OSIRIS/Odin (Bourassa et al., 2007), SAGE III/ISS (Chu and Veiga, 1998), and OMPS/LP (Loughman et al., 2018).
The Ozone Mapping and Profiler Suite (OMPS) Limb Profiler (LP) is one of three OMPS instruments onboard the Suomi National Polar-orbiting Partnership (S-NPP) satellite (Flynn et al., 2007). S-NPP was launched in October 2011, into a sun-synchronous polar orbit with a 13:30 local Equator crossing time. The LP instrument collects limb-scattered radiance data on a 2-D charge-coupled device (CCD) array over a wide spectral range (290–1000 nm) and a wide vertical extent (0–80 km) through three parallel vertical slits. These spectra are primarily used to retrieve vertical profiles of ozone (Rault and Loughman, 2013; Kramarova et al., 2018), the aerosol extinction coefficient (Loughman at al., 2018; Chen et al., 2018), and cloud-top height (Chen et al., 2016). The vertical sampling of LP measurements is about 1 km, and the vertical resolution of the retrieved profiles is approximately 1.6 km. More details about the OMPS/LP instrument design and capabilities are provided in Jaross et al. (2014).
Recently, a new aerosol size distribution (ASD) based on a gamma function that is derived from results calculated by the Community Aerosol and Radiation Model for Atmospheres (CARMA) was introduced into the Version 1.5 OMPS/LP aerosol extinction retrieval algorithm (Chen et al., 2018). The assumed ASD is designed to represent the long-term background stratospheric aerosol loading. We use the CARMA model output to take advantage of its large range of simulated particle size information, and we find that a gamma size distribution represents a significantly better fit to its size distribution than a lognormal distribution. In a recent study, Nyaku et al. (2020) confirmed that the CARMA model agrees well with the Wyoming optical particle counter (OPC) measurements. Chen et al. (2018) tested the Version 1.5 algorithm by comparing 7 months of data (June–December 2017) between the OMPS/LP and the Stratospheric Aerosol and Gas Experiment III instrument onboard the International Space Station (SAGE III/ISS). The limited comparison showed the consistency of the aerosol extinction measurements from both instruments, with a correlation coefficient of 0.97 and slope of 1.05. The Version 1.5 OMPS/LP aerosol products are now being processed routinely, and additional SAGE III/ISS data are available.
This work extends the previous results shown in Chen et al. (2018) to evaluate LP aerosol extinction profiles through comparison with independent datasets from SAGE III/ISS. The central scope of the paper is the evaluation of the LP algorithm performance for background aerosol situations. Here, we document a more comprehensive evaluation of this new version of the OMPS/LP aerosol product. The latest versions, i.e., Version 1.5 of LP and Version 5.1 of SAGE III/ISS, are used. The objective of this comparison is to assess the reliability of the LP Version 1.5 algorithm and to identify potential problems. The differences in the aerosol extinction values observed by the two instruments are analyzed and discussed. Our analysis of SAGE III/ISS data specifically addresses possible biases with OMPS/LP results arising from differences in vertical resolution and possible ozone contamination. The impact of volcanic perturbations on the retrievals is also investigated.
The previous Version 1 aerosol retrieval algorithm for OMPS/LP is described in detail by Loughman et al. (2018). Here, we provide a brief description of key changes implemented in the retrieval algorithm for processing the V1.5 dataset.
In the V1.5 algorithm, a gamma-function-based ASD is assumed (Chen et al., 2018):
where n(r) is the number of particles N per unit volume with a size between radius r and r+dr (cm−3 µm−1), N0 is the total number density of aerosols (cm−3), Γ is Euler's gamma function, α is the shape parameter, and β (µm−1) is the scale parameter. At small radii this function follows a power law, whereas at large radii it follows an exponential function. The cross section and aerosol scattering phase function (PF) are then calculated using Mie theory assuming liquid sulfate spherical particles with a refractive index from Russell et al. (1996). The α and β parameters are determined by fitting the gamma distribution to size distributions for stratospheric sulfate simulated by the Community Aerosol and Radiation Model for Atmospheres (CARMA) module running online in the Goddard Earth Observing System (GEOS) global model (after English et al., 2011; Colarco et al., 2014). The fitted ASD yields an Ångström exponent (AE) of 2.08 and an effective radius (reff) of 0.18 µm; these values are similar to the average values determined from SAGE II Version 7.0 aerosol extinction data (Thomason et al., 2008; Damadeo et al., 2013) between 20 and 25 km (red and green dots in Fig. 1), from measurements at 525 and 1020 nm taken during the period from 2000 to 2005, which is characterized by a low volcanic background. This was a period when the stratosphere was relatively clean and roughly similar to the present-day stratosphere. Note that the average SAGE II AE values at 30 km (blue dots in Fig. 1) are larger than those at lower altitudes. Other time periods known to have low aerosol loading (e.g., 1989–1990) show lower AE values between 20 and 25 km in the SAGE II dataset. Thus, the reference ASD adopted here for LP retrievals may produce a bias in the extinction values derived during medium or high volcanic aerosol loading. The variability in aerosol properties with altitude observed by SAGE II is related to variability in temperature and humidity fields that affects the aerosol size distribution and refractive index (Steele and Hamill, 1981; Russell et al., 1996), both of which have a direct effect on the PF. This variability also (and more significantly) depends on the aerosol load in the stratosphere, especially if a large time period is considered (as in Fig. 1). Assuming that the aerosol signal in line of sight radiances is roughly proportional to the PF, aerosol extinction profiles at 675 nm are retrieved using an iterative technique (see Sect. 4.2 of Loughman et al., 2018), based on Chahine's non-linear relaxation technique (Chahine, 1970). Atmospheric pressure and temperature profiles used in this retrieval algorithm are obtained from the GEOS atmospheric analyses produced by the NASA Goddard Space Flight Center (GSFC) Global Modeling Assimilation Office (GMAO). For the LP aerosol product, retrievals are only performed for daytime observations (a solar zenith angle, SZA, less than 88∘).
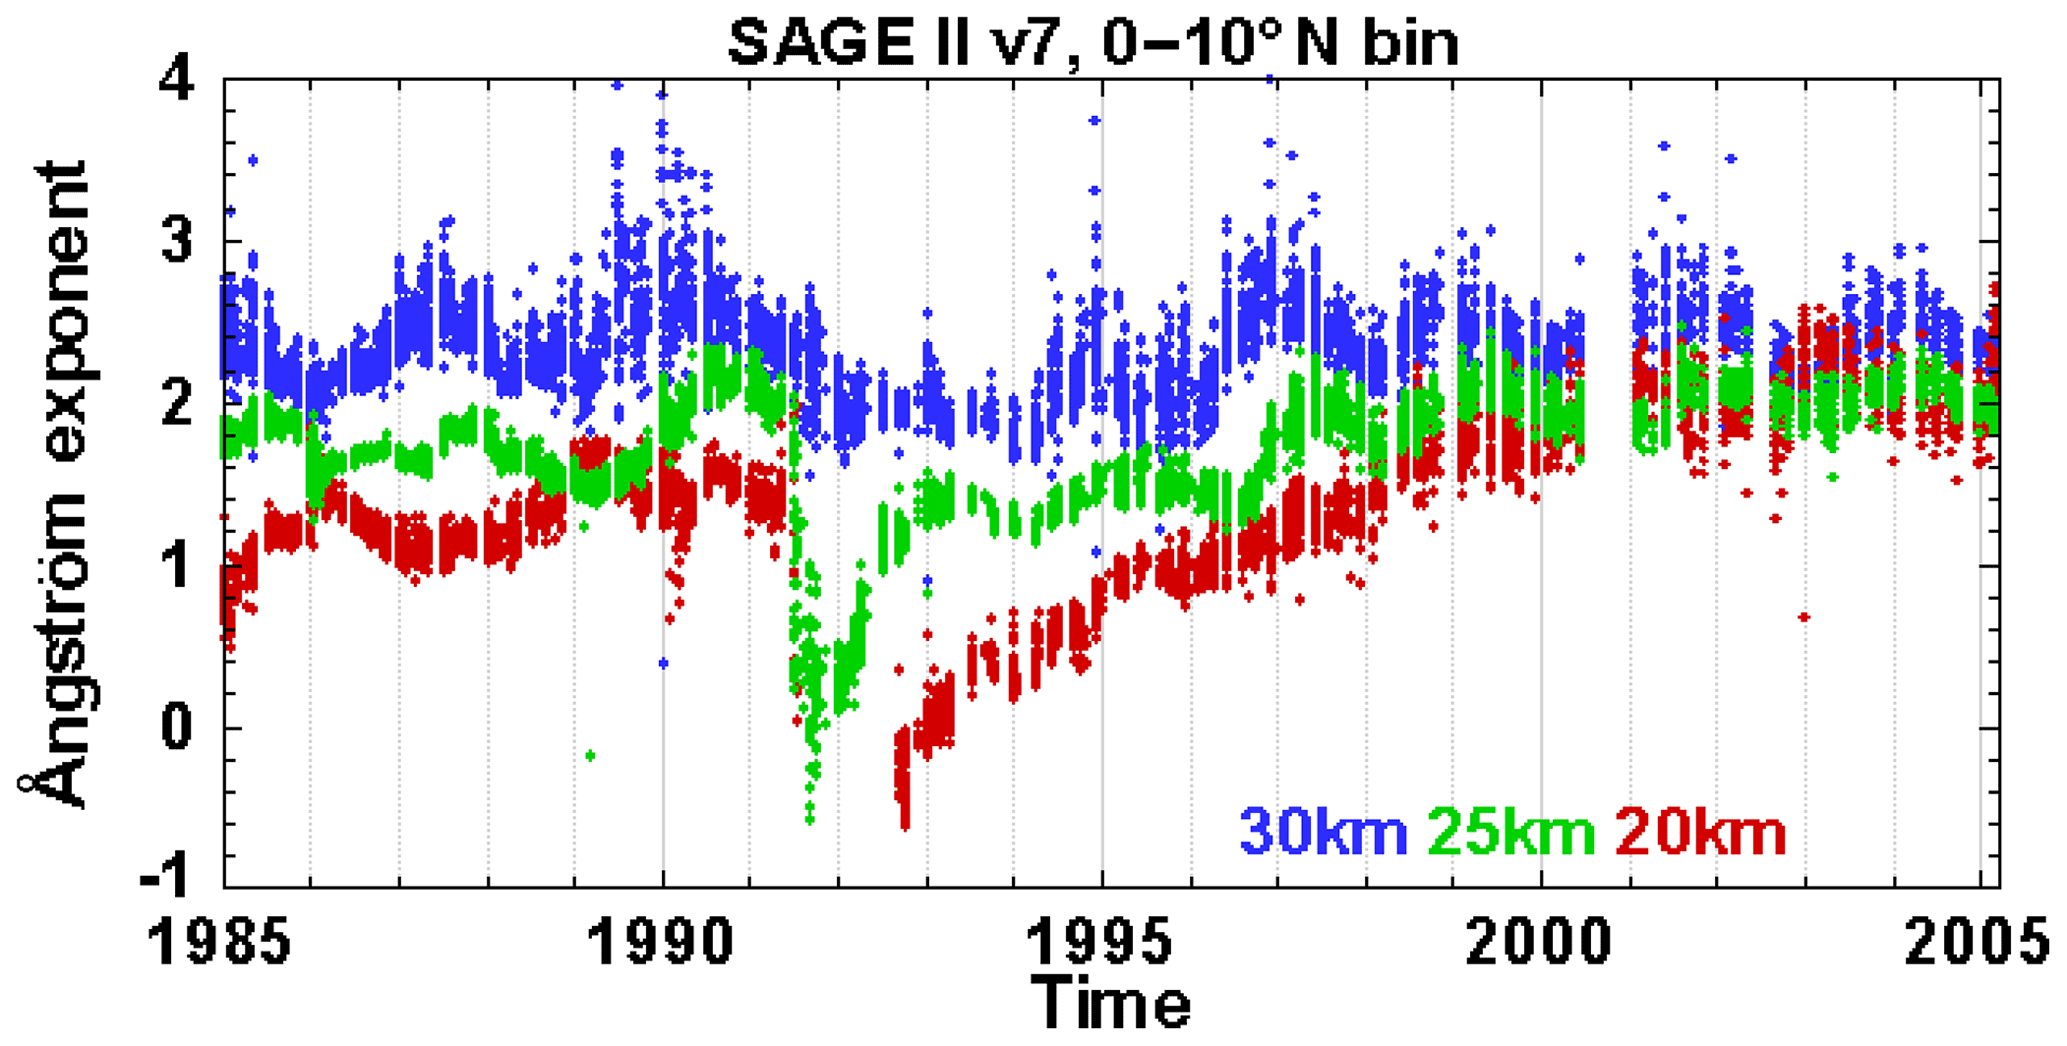
Figure 1Time series of the SAGE II Ångström exponent (AE) derived from the aerosol extinction coefficients measured at 525 and 1020 nm for altitudes of 30 km (blue), 25 km (green), and 20 km (red). This figure shows SAGE II Version 7.0 data for the 0–10∘ N latitude band during the period from 1986 to 2005. While the Pinatubo eruption in 1991 produced a significant decrease in the AE, the smaller volcanic eruptions, such as Ruang and Reventador in 2002 and Manam in 2005, which are visible in the extinction time series (not shown), did not appreciably affect AE values. The AE values appear to stabilize after 2000, suggesting that a background state exists. The AE is quite scattered at 30 km compared with lower altitudes, which is related to the reduced quality of the aerosol retrieval for low aerosol loading.
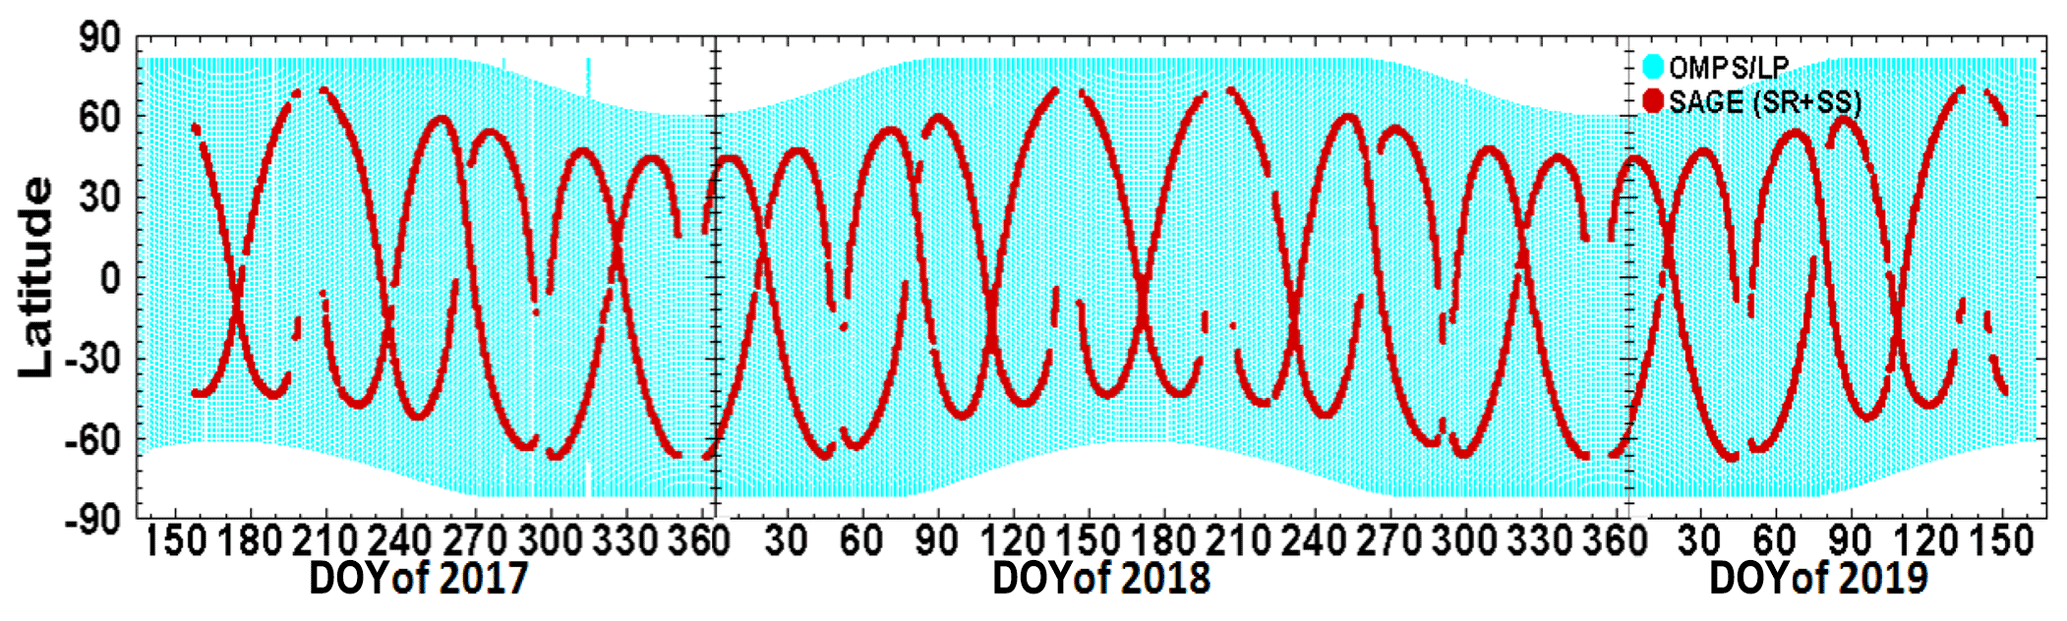
Figure 2Time–latitude sampling pattern for OMPS/LP (light blue) and SAGE III/ISS (red) during the period from June 2017 to May 2019.
3.1 SAGE III/ISS data
The SAGE III/ISS developed by the NASA Langley Research Center (LaRC) was launched to the International Space Station in February 2017. SAGE III/ISS makes sunrise and sunset occultation measurements of aerosols and gas concentrations in the stratosphere and upper troposphere (Chu et al., 1998). The ISS travels in a low-Earth orbit at an altitude of 330–435 km and an inclination of 51.6∘. With these orbital parameters, solar occultation measurement opportunities cover a large range of latitudes (between 70∘ S and 70∘ N). The instrument measures up to 31 combined sunrise and sunset profiles each day. A general description of the solar occultation measurement technique is provided by McCormick et al. (1979). Aerosol extinction at nine wavelengths (384.2, 448.5, 520.5, 601.6, 676.0, 756.0, 869.2, 1021.2, and 1544.0 nm) are provided by SAGE III/ISS from the surface or cloud top to an altitude of 45 km, with a vertical resolution of 0.5 km at the tangent point location. The SAGE III/ISS series of aerosol occultation measurements have been extensively evaluated and compared with other space-based instruments, and they have been found to have relatively high precision and accuracy (Thomason et al., 2010, 2018; Bourassa et al., 2012; Kovilakam and Deshler, 2015; von Savigny et al., 2015; Rieger et al., 2018). In this work, we use SAGE III/ISS Version 5.1 data, including both sunrise and sunsets, which were collected during the period from June 2017 to May 2019. Figure 2 shows the spatial and temporal coverage of the available datasets during the 2017–2019 period considered in this study.
3.2 Methodology
Chen et al. (2018) described previous LP–SAGE III/ISS comparisons using SAGE III/ISS Version 5.0 data for the 7-month period from June to December of 2017. The first comparison was conducted in two steps: first, all data were binned and averaged in 10∘ latitude bins for each altitude for groups of 1–3 consecutive days depending on the number of SAGE III/ISS samples; second, the averaged extinction profiles at 675 nm for LP and at 676 nm for SAGE III/ISS were compared directly. In this work, both datasets were averaged zonally for each 5∘ latitude band per day at each of their respective altitudes. The daily averaged data in the same latitude bin and on the same day were used for the comparison with an assumption that the variation with longitudinal band is much smaller than the variation with latitudinal band. For background aerosol situations, the longitudinal variation of stratospheric aerosol could be small because of efficient mixing in the zonal direction and strong horizontal transport prevailing in the region (Sunilkumar et al., 2011). In cases of medium to large volcanic eruptions, however, longitudinal differences could be large and a restriction should be placed on longitude to capture the signature of potential longitudinal variation. Only LP data from the center slit were taken into consideration because the center slit has better stray-light and tangent height corrections compared with the left and right slits (Moy et al., 2017; Kramarova et al., 2018). The current cloud detection algorithm (Chen et al., 2016) detects cloud-top height from the OMPS/LP measurements using the spectral dependence of the vertical gradient of radiances at 675 and 868 nm. Cloud-top height is identified when the gradient difference increases above 0.15. All LP data below the cloud-top height were rejected because extinction changes abruptly at cloud top.
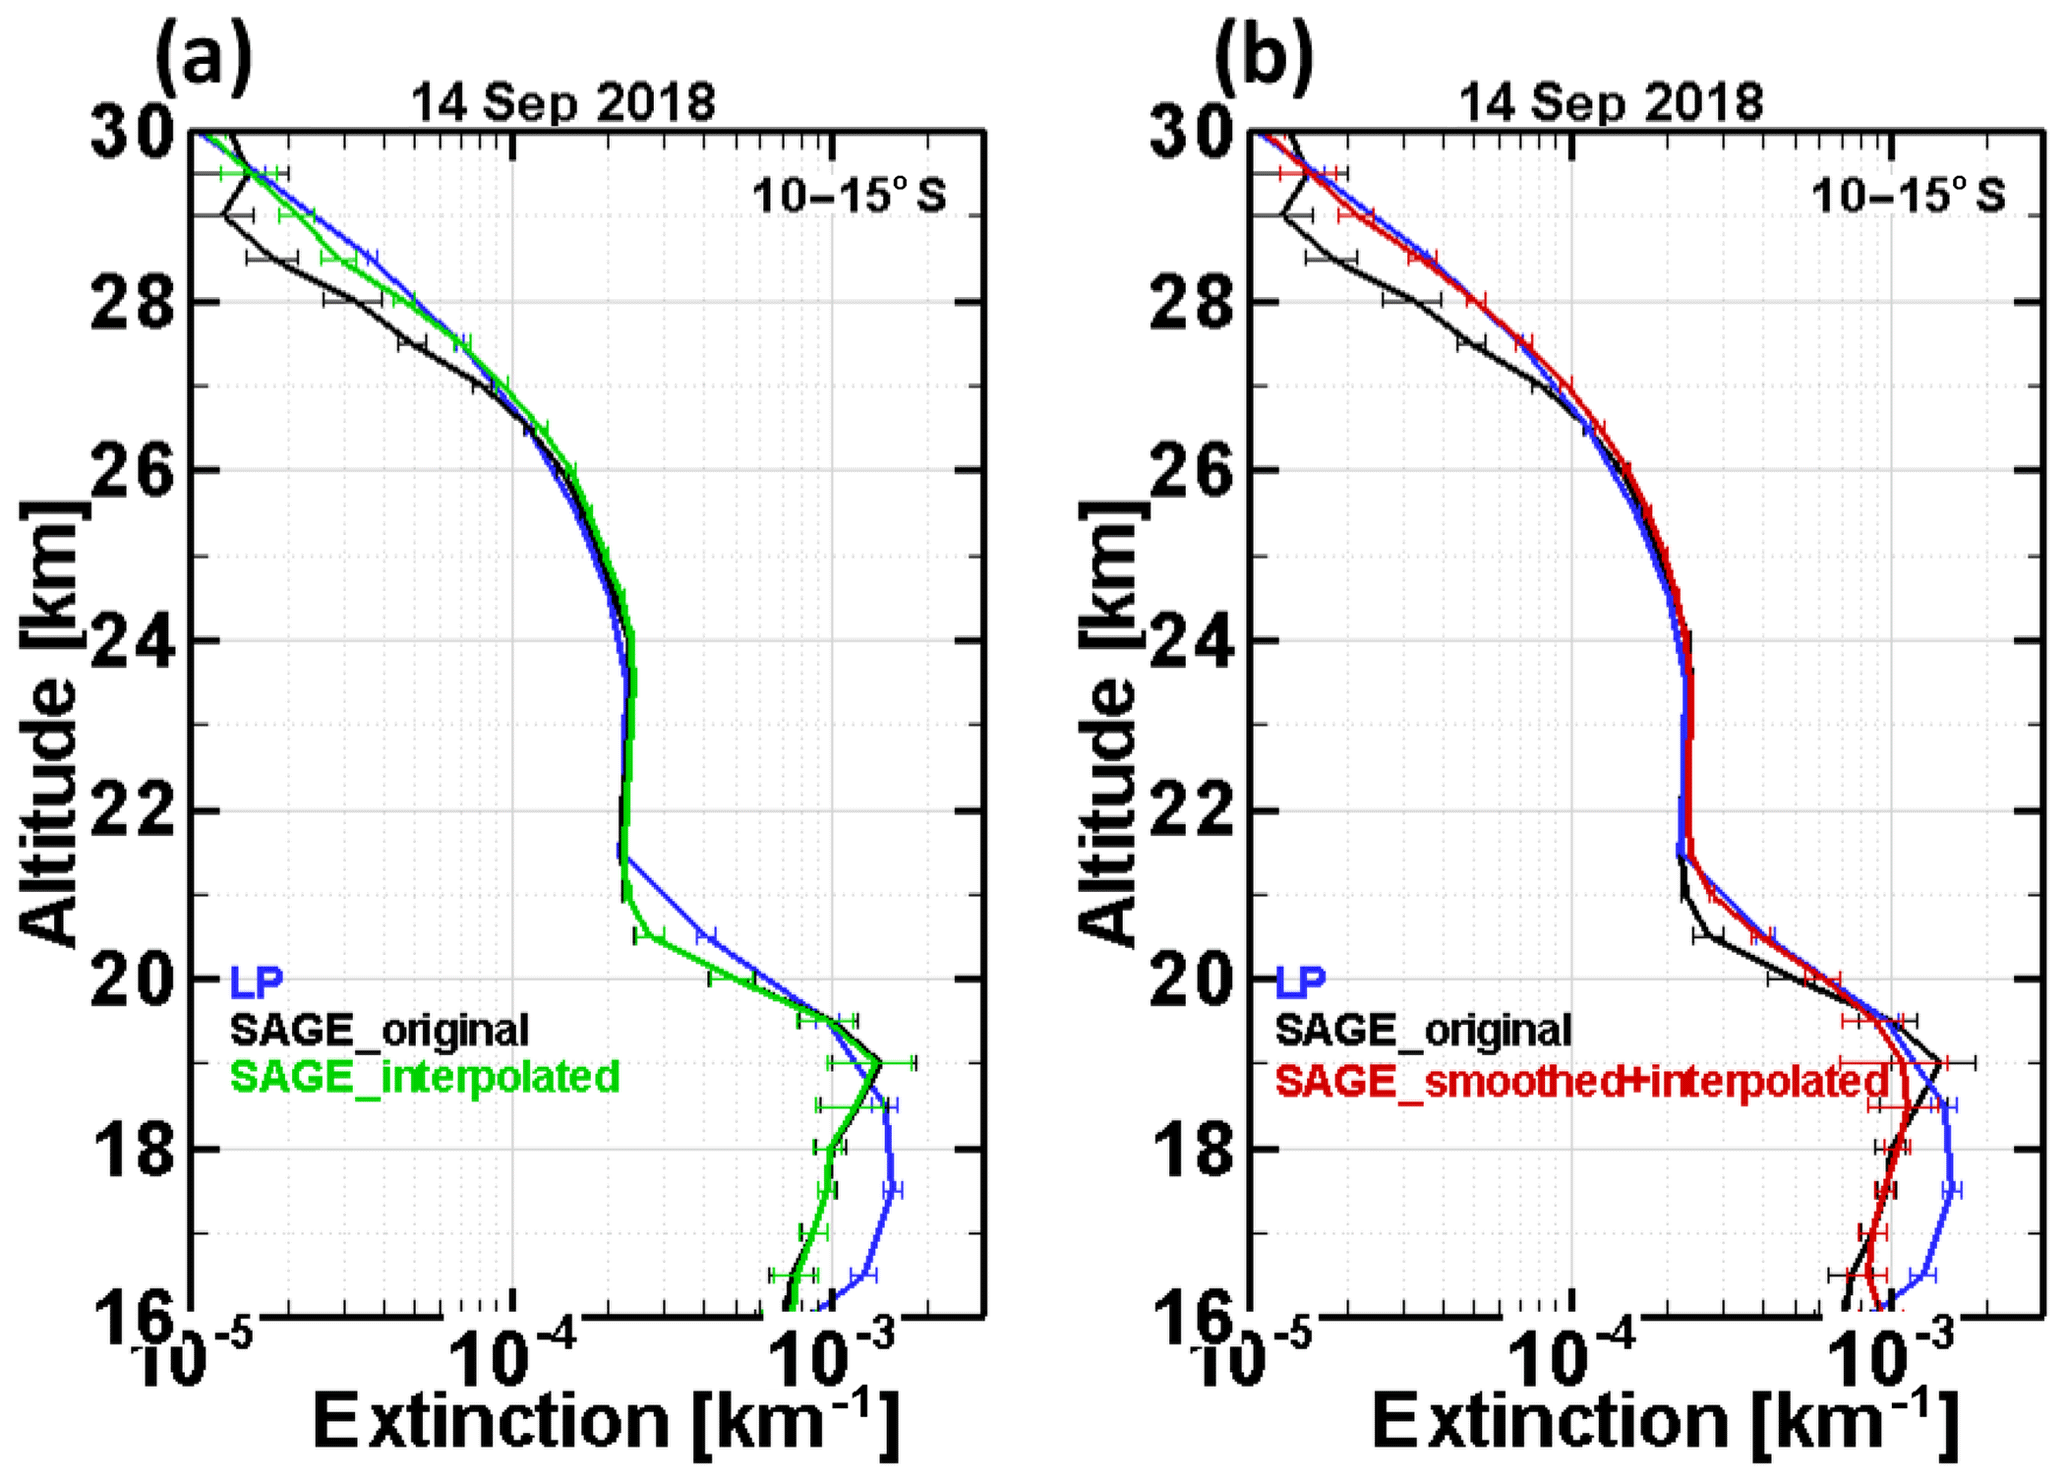
Figure 3An example LP–SAGE comparison of average extinction profiles in the 10–15∘ S latitude band for 1 d, 14 September 2018. (a) Comparison of extinction profiles among original SAGE (black), interpolated SAGE (green), and retrieved LP (blue). (b) Comparison of extinction profiles between the smoothed version of the recalculated SAGE profile (red) and the LP retrieval profile. Applying a combination of the smoothing and interpolation approaches to the original SAGE data improves the comparison above 19 km. The horizontal error bars on the mean extinction profiles indicate the standard error of the mean, .
As the SAGE III/ISS science team pointed out (Larry W. Thomason, personal communication, 2019; Wang et al., 2020), the reported SAGE III/ISS aerosol extinction is retrieved as a residual of using a spectrally focused fitting (i.e., it derives from the “MLR” ozone product), and any bias in ozone would result in a bias in the aerosol extinction values in the vicinity of the Chappuis bands depending upon altitude and ozone concentration. To avoid possible biases in the 676 nm aerosol extinction reported by SAGE III/ISS, associated with remaining ozone absorption effects, the aerosol channels at 449 and 756 nm were used in this study to interpolate to 675 nm SAGE III/ISS extinction profiles using a log-linear interpolation. Figure 3a shows SAGE III/ISS profiles of the reported 675 nm aerosol extinction (black line) and the 675 nm aerosol extinction recalculated by spectral interpolation (green line) at 0.5 km vertical resolution. Large differences between the reported and recalculated SAGE III/ISS extinction values are apparent above 27 km. The extinction minimum at 29 km in the original data is not present in the interpolated profile. Also shown is the corresponding LP profile (blue line) at a 1.0 km sampling grid. Since the SAGE III/ISS data are given at 0.5 km intervals, while the vertical resolution of LP is around 1.6 km, the vertical resolution of SAGE III/ISS was then degraded to match the OMPS/LP vertical resolution using a seven-point binomial smoothing function given by the following expression:
where k is the extinction, w is the weighing factor, and z is the altitude grid point. This procedure approximates a Gaussian smoothing of continuous data with a full width at half maximum of about 1.6 km. This spectrally interpolated and vertically smoothed SAGE III/ISS data are used for all comparisons in this paper. Figure 3b provides an example of the comparison of extinction profiles between the LP-retrieval profile (blue line) and the smoothed version of the recalculated SAGE profiles (red line). The figure shows how LP and the smoothed+interpolated SAGE III/ISS profile are similar above 19.5 km and have more disagreement below this altitude. In the upper troposphere–lower stratosphere (UTLS), particularly in the tropics, the presence of thicker aerosol layers may have an impact on the retrieved extinction levels (Bourassa et al., 2012; Fromm et al., 2014; Kremser et al., 2016). In addition, sea salt can also increase the particle size in the UTLS due to water uptake (Brühl et al., 2018). Cirrus cloud contamination could be another issue in the lower stratosphere below about 19 km. Clouds appear as discontinuities of the limb radiance vertical profiles, which will tend to bias the retrieved result. Although most clouds are detected and filtered from the LP retrievals, it is not always possible to completely eliminate cloud contamination. Furthermore, large differences (about 60 %) between the two instruments are expected at lower altitudes near and below the tropopause due to larger variability in the transport of air masses.
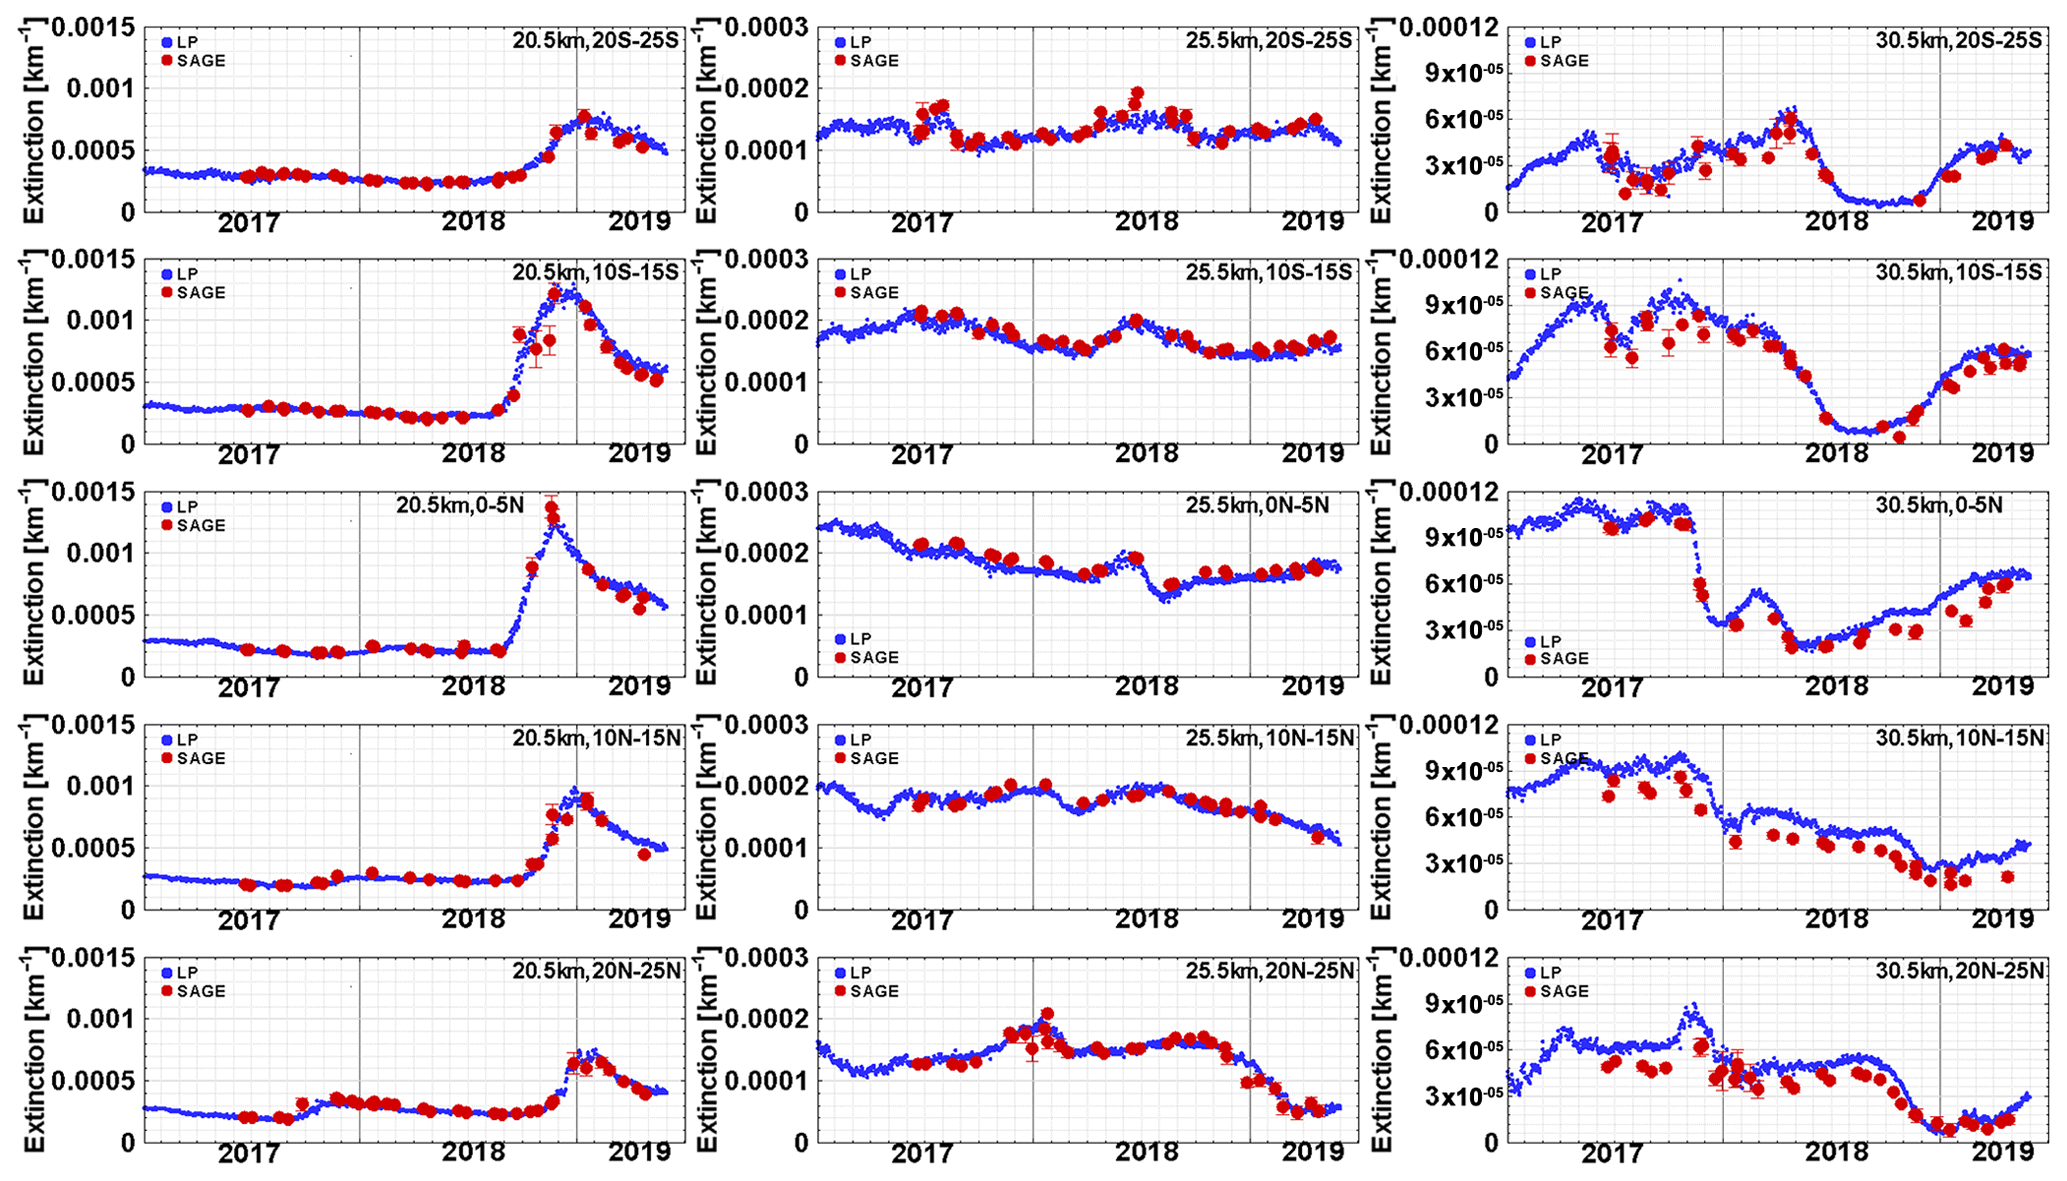
Figure 4Comparison of the daily zonal mean time series of LP V1.5 (blue) and SAGE III/ISS V5.1 (red) extinction values at 675 nm for an altitude of 20.5 km (left column), 25.5 km (middle column), and 30.5 km (right column) for 5∘ latitude bands in the tropics (20–25∘ S, 10–15∘ S, 0–5∘ N, 10–15∘ N, and 20–25∘ N, from the top to bottom) during the period from June 2017 to May 2019. Vertical error bars on the SAGE measurements indicate the standard error of the mean, .
4.1 Aerosol extinction variability
Figure 4 depicts the time series of Version 1.5 OMPS/LP (blue symbols) and SAGE III/ISS (red symbols) at 20.5, 25.5, and 30.5 km in the tropics from June 2017 through May 2019. The time-dependent variability of each dataset is similar, and data features associated with specific aerosol events observed by SAGE III/ISS are also present in the LP record. The observed large aerosol extinction increase at 20 km apparent in both data records by the end of 2018 is associated with the eruption of Mt. Ambae (June 2018 at 15∘ S). For the background aerosol condition based on the June 2017 to June 2018 period, LP and SAGE III/ISS are within 20 % of each other at 20.5 and 25.5 km, indicating that the assumed ASD in the LP V1.5 algorithm is adequate in this altitude range. The large temporal variability present in both datasets at 30.5 km is suggestive of a quasi-biennial oscillation (QBO) signal, although there is a shift in phase between latitude bands. At 30.5 km, the agreement is not quite as good, and LP retrievals are systematic higher than SAGE III/ISS extinctions for all latitude bins with positive biases up to 50 %. The large biases reflect the very small aerosol load at altitudes above 30 km. Under low aerosol conditions, both instruments are less sensitive to smaller particles (Rieger et al., 2018). For example, the AE values from SAGE II are quite scattered at 30 km compared with lower altitudes (see Fig. 1), which may be related to the reduced quality of the aerosol retrieval for low aerosol loading. In contrast, the systematic positive bias between LP and SAGE III/ISS may be due in part to the fact that the actual ASD and refractive index, which depend on temperature and humidity (Steele and Hamill, 1981; Russell et al, 1996), are not truly independent of height as currently assumed in the LP algorithm. While the SAGE III/ISS algorithm does not require any assumptions about aerosol microphysics, aerosol extinction profiles from OMPS/LP suffer from uncertainties due to assumed ASD and refractive index. Additionally, uncertainties in LP radiance measurements are assumed to be 1 % (Kramarova et al., 2018), and the primary source of error in LP radiance measurements is the stray-light error which increases with altitude. At higher altitudes where LP radiance is small, the stray-light error becomes most significant.
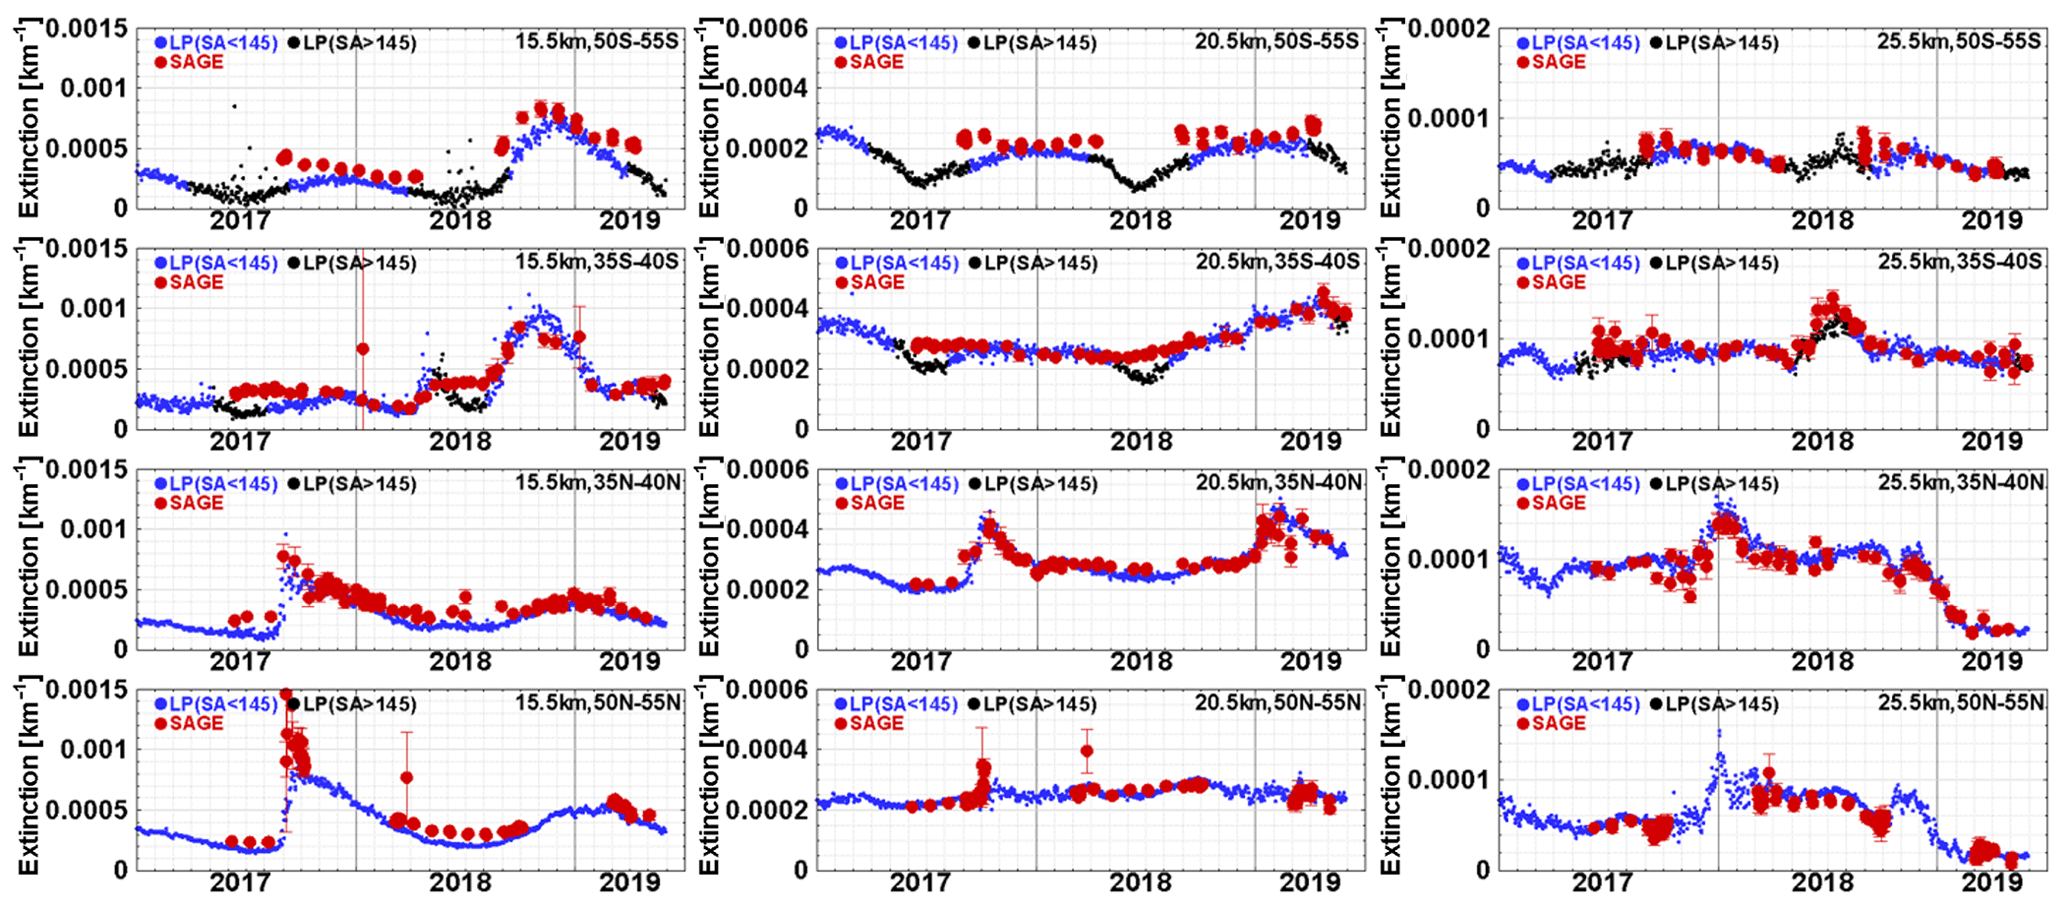
Figure 5Same as Fig. 4 but for altitudes at 15.5 km (left), 20.5 km (middle), and 25.5 km (right) for latitude bands outside the tropics (50–55∘ S, 35–40∘ S, 35–40∘ N, and 50–55∘ N, from the top to bottom). The blue and black dots represent LP extinction values at scattering angles (SA) less than 145∘ and greater than 145∘, respectively. The LP extinction below 20 km at southern latitudes (35–55∘ S) shows the presence of erroneous seasonal variations due to the lack of sensitivity to aerosol when the SA is greater than 145∘.
Figure 5 shows the time series comparison between OMPS/LP and SAGE III/ISS measurements at 15.5 km (left column), 20.5 km (middle column), and 25.5 km (right column) for different latitude bands outside the tropics where clouds are not an issue. The blue and black dots in Fig. 5 represent the LP extinction calculated at scattering angles (SA) of less than 145∘ and greater than 145∘, respectively. Again, the highly variable nature of the stratospheric aerosols with time and latitude is well represented by the two instruments. Canadian pyrocumulonimbus (PyroCb) was most probably responsible for the increasing aerosol extinction values at 15.5 and 20.5 km in the 35–55∘ N latitude bands in late 2017, and the effect of Mt. Ambae can be seen in the 35–55∘ S time series in late 2018. Good agreement is found between both instruments at 20.5 and 25.5 km, although there are some negative biases in the Southern Hemisphere (SH). In contrast to the results for altitude at 30.5 km (right column in Fig. 4), the LP values at 15.5 km are systematically smaller than those from SAGE III/ISS. A discussion of this systematic difference is given in Sect. 4.3.
A notable feature in Fig. 5 is that the comparisons in the Northern Hemisphere (NH) are generally better than in the SH. In the southern midlatitudes (35–55∘ S), the LP retrievals show significant seasonal variations at 20.5 and 25.5 km that are not seen by SAGE III/ISS. The obvious seasonal variability in the differences with the amplitudes of winter minima was observed to be about 25 % at 20.5 km and as much as 200 % at 15.5 km. The presence of erroneous seasonal variations in the OMPS/LP dataset is mostly caused by the limitation of the wavelength at 675 nm when observing under backscattering conditions at extremely large scattering angles. These results lead us to recommend filtering LP data below 20 km with an SA greater than 145∘. The limitations of the LP retrievals at 675 nm will be addressed in Sect. 4.5.
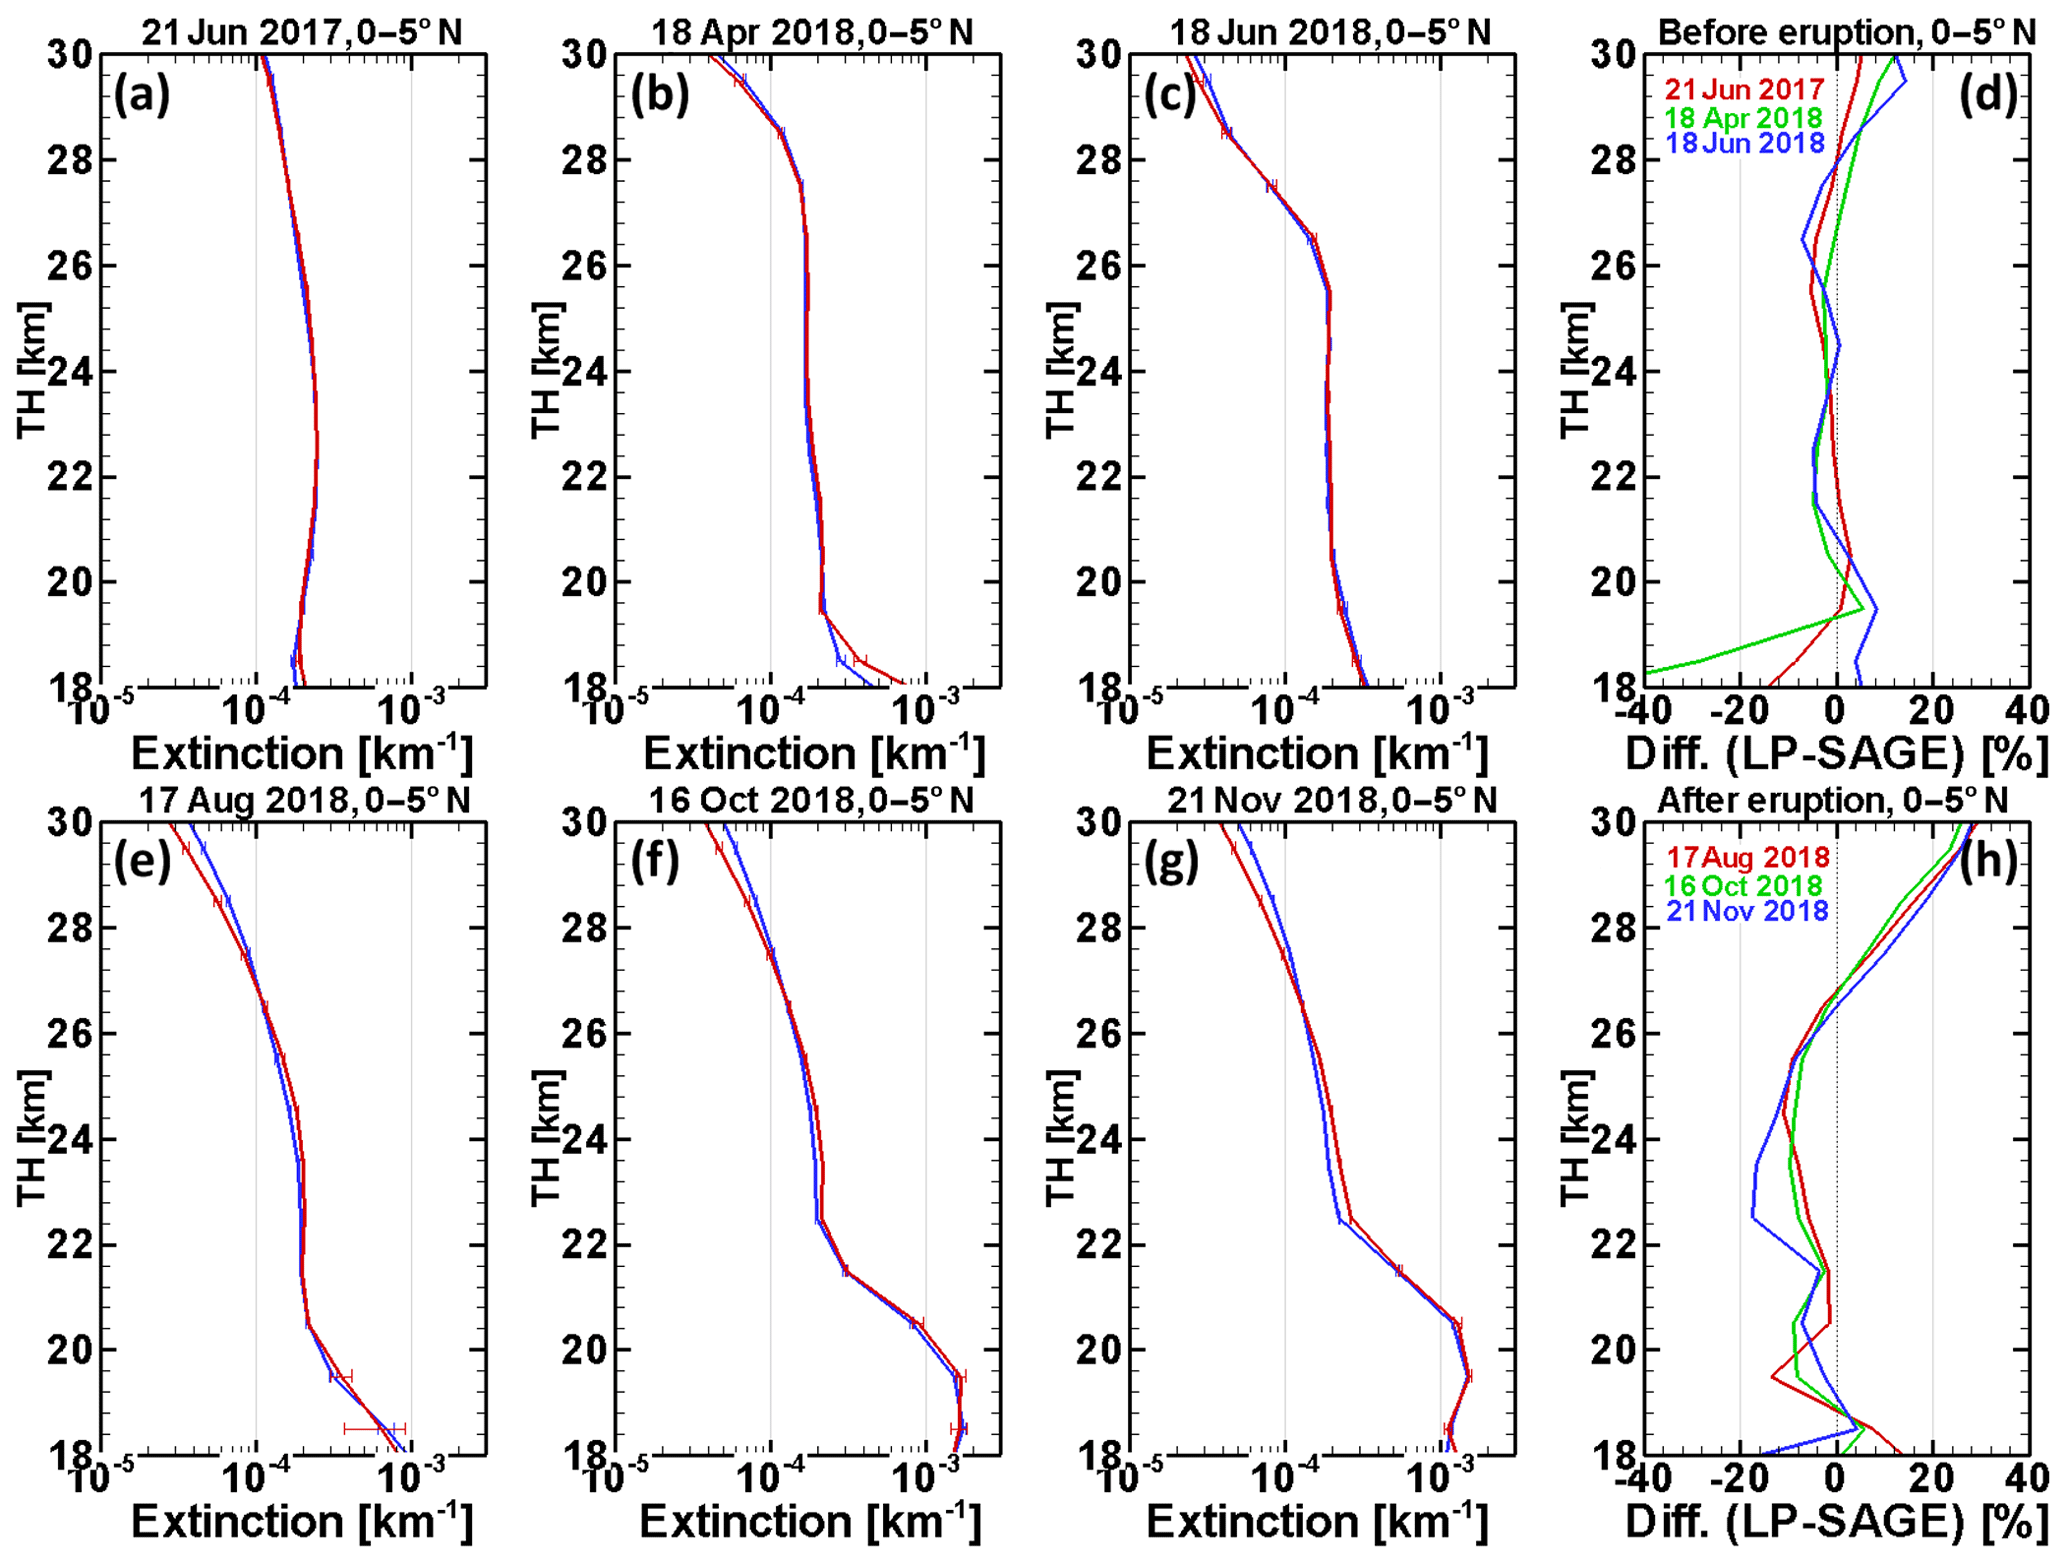
Figure 6Comparison of daily zonal mean of OMPS/LP (blue) and SAGE III/ISS (red) aerosol extinction profiles in the 0–5∘ N latitude bin for 6 individual days prior to (a)–(c) and after (e)–(g) the Ambae eruption on 27 July 2018. The corresponding relative differences between LP and SAGE are also shown in panels (d) and (h). The horizontal error bars on the mean extinction profiles indicate the standard error of the mean, . Enhanced extinction values around 20 km after the eruption (e)–(g) are observed compared with before the eruption (a)–(c).
4.2 Effect of volcanic eruptions and PyroCbs
To investigate the impacts of volcanic eruptions and intense wildfires on the LP retrievals, aerosol extinction profiles from OMPS/LP and SAGE III/ISS were intercompared in the aftermath of the eruption of Mt. Ambae (2018) and the Canadian wildfires (2017) sampled by these instruments.
Volcanic eruptions are the largest source of long-lived aerosols in the stratosphere (Vernier et al., 2011; Kremser et al., 2016; Bingen et al., 2017). The Ambae eruption occurred on 27 July 2018, on Ambae Island, located near 15∘ S, 167∘ E, and had a clear impact on the stratospheric aerosol load. Figure 6a–d show comparisons of LP and SAGE III zonally averaged stratospheric aerosol profiles between 0–5∘ N on 3 d before the eruption (Fig. 6a, b, c), along with the relative differences on each day (Fig. 6d). Pre-eruption LP measurements agree within 5 % of SAGE III/ISS observations over the 20–25 km altitude range. SAGE III/ISS measurements were not available at 0–5∘ N until approximately 3 weeks after the eruption, due to the complex sampling pattern shown in Fig. 2. OMPS/LP data show significant longitudinal transport of the stratospheric aerosol plume during this period; thus, we have also used zonal mean averages to compare post-eruption results. Larger differences (up to 20 %) are observed for post-eruption conditions as shown in Fig. 6e–h. The enhanced extinction around 20 km after the eruption was captured by both OMPS/LP and SAGE III/ISS observations. Much larger differences between the two datasets are apparent below 20 and above 25 km both before and after the volcanic eruption.
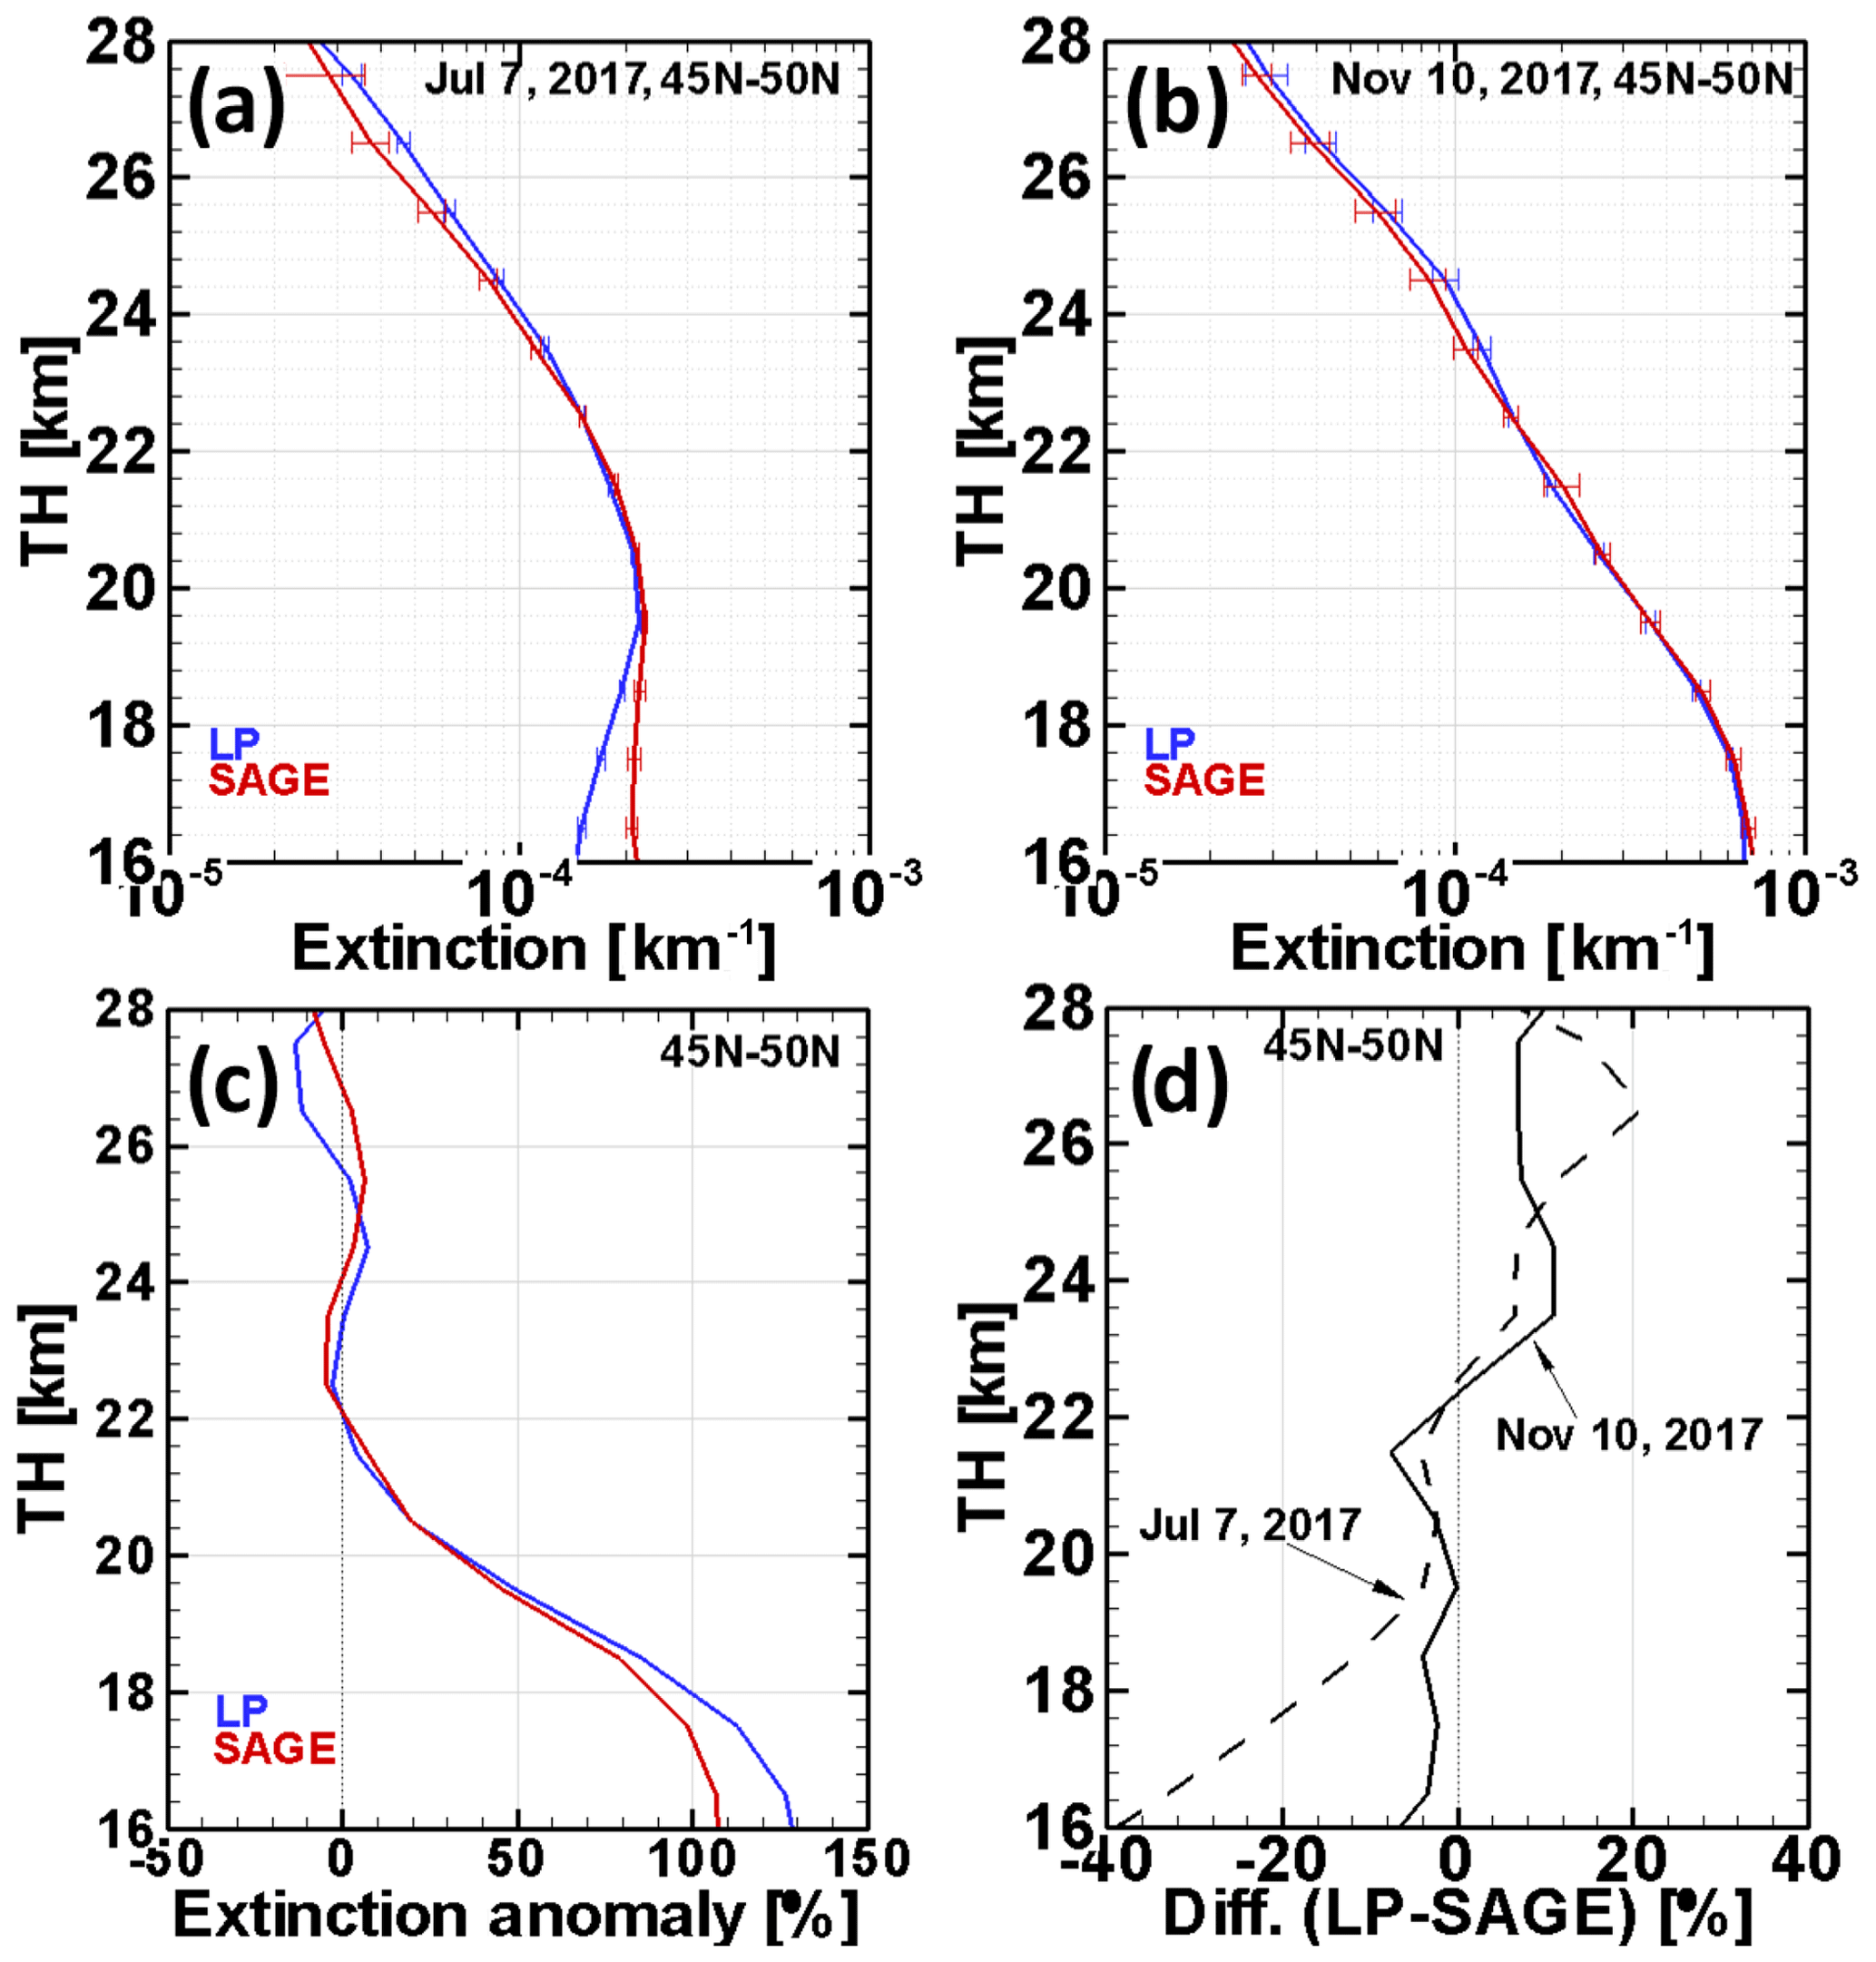
Figure 7Comparison of the daily zonal mean of OMPS/LP (blue) and SAGE III/ISS (red) aerosol extinction profiles in the 45–50∘ N latitude bin (a) before (7 July 2017) and (b) after (10 November 2017) the Canadian PyroCb event in late 2017 as well as the (c) extinction anomaly (defined as the deviation from the before case) and (d) the corresponding relative differences between LP and SAGE. The horizontal error bars on the mean extinction profiles indicate the standard error of the mean, . Enhanced extinction values below 22 km after the fire are observed in panel (c).
In addition to volcanic eruptions, intense wildfires can also cause aerosol perturbations in the UTLS. The occurrence of PyroCbs triggered by intense wildfires in British Columbia, Canada, were reported on 12 August 2017. Within 2 months of injection, the plume can reach up to nearly 22 km (Peterson et al., 2018; Torres et al., 2020) and can be transported globally (Kloss et al., 2019). A before and after analysis was carried out to evaluate the performance of the LP algorithm following the stratospheric injection of carbonaceous aerosols. Zonal averages of the SAGE III/ISS and LP aerosol extinction retrievals for the 45–50∘ N latitude band before and after the aerosol injection effect were compared. Figure 7 highlights the emergence of new stratospheric aerosol layers before and after the fire event in Canada in late 2017. Both instruments clearly captured the stratospheric aerosol perturbation triggered by the reported PyroCb. We chose 7 July 2017 as the “before” case (Fig. 7a). SAGE III/ISS observations at high northern latitudes were not available until September 2017, during which time the enhanced stratospheric aerosol spread rapidly in longitude. SAGE III/ISS results in September–October 2017 at 50∘ N show significantly increased scatter. Therefore, we calculated the difference for LP and SAGE III/ISS separately using 10 November 2017 as the “after” case (Fig. 7b) to show the anomaly results. As expected, Fig. 7c shows large positive extinction anomalies of up to 140 % below 22 km. The comparison also shows good agreement between LP-retrieved extinction profiles and observations from SAGE III/ISS within ±20 % at 18–28 km. Since the LP algorithm assumes a fixed refractivity index which is dependent on aerosol type, the wrong aerosol type (sulfate instead of carbonaceous aerosols) leads to an incorrect phase function, which then produces an error in the retrieved extinction. For SAGE III/ISS, this assumption is not needed, so there is less impact.
4.3 LP retrievals above 27 km and below 19 km
All comparisons shown in Figs. 4–7 have some features in common. The best agreement is found for the altitude range roughly between 19 and 27 km, but systematic and significant differences are observed above 28 and below 19 km. These systematic differences change with altitude and may be associated with the algorithm assumption of a time- and altitude-independent aerosol model (i.e., refractive index and ASD) and the corresponding PF. SAGE III/ISS cannot measure the PF, but the aerosol spectrum (in this case the approximation of the AE) can be used as an effective qualitative indicator of particle size (Hayashida and Horikawa, 2001; Schuster et al., 2006; Damadeo et al., 2013; Rieger et al., 2018).
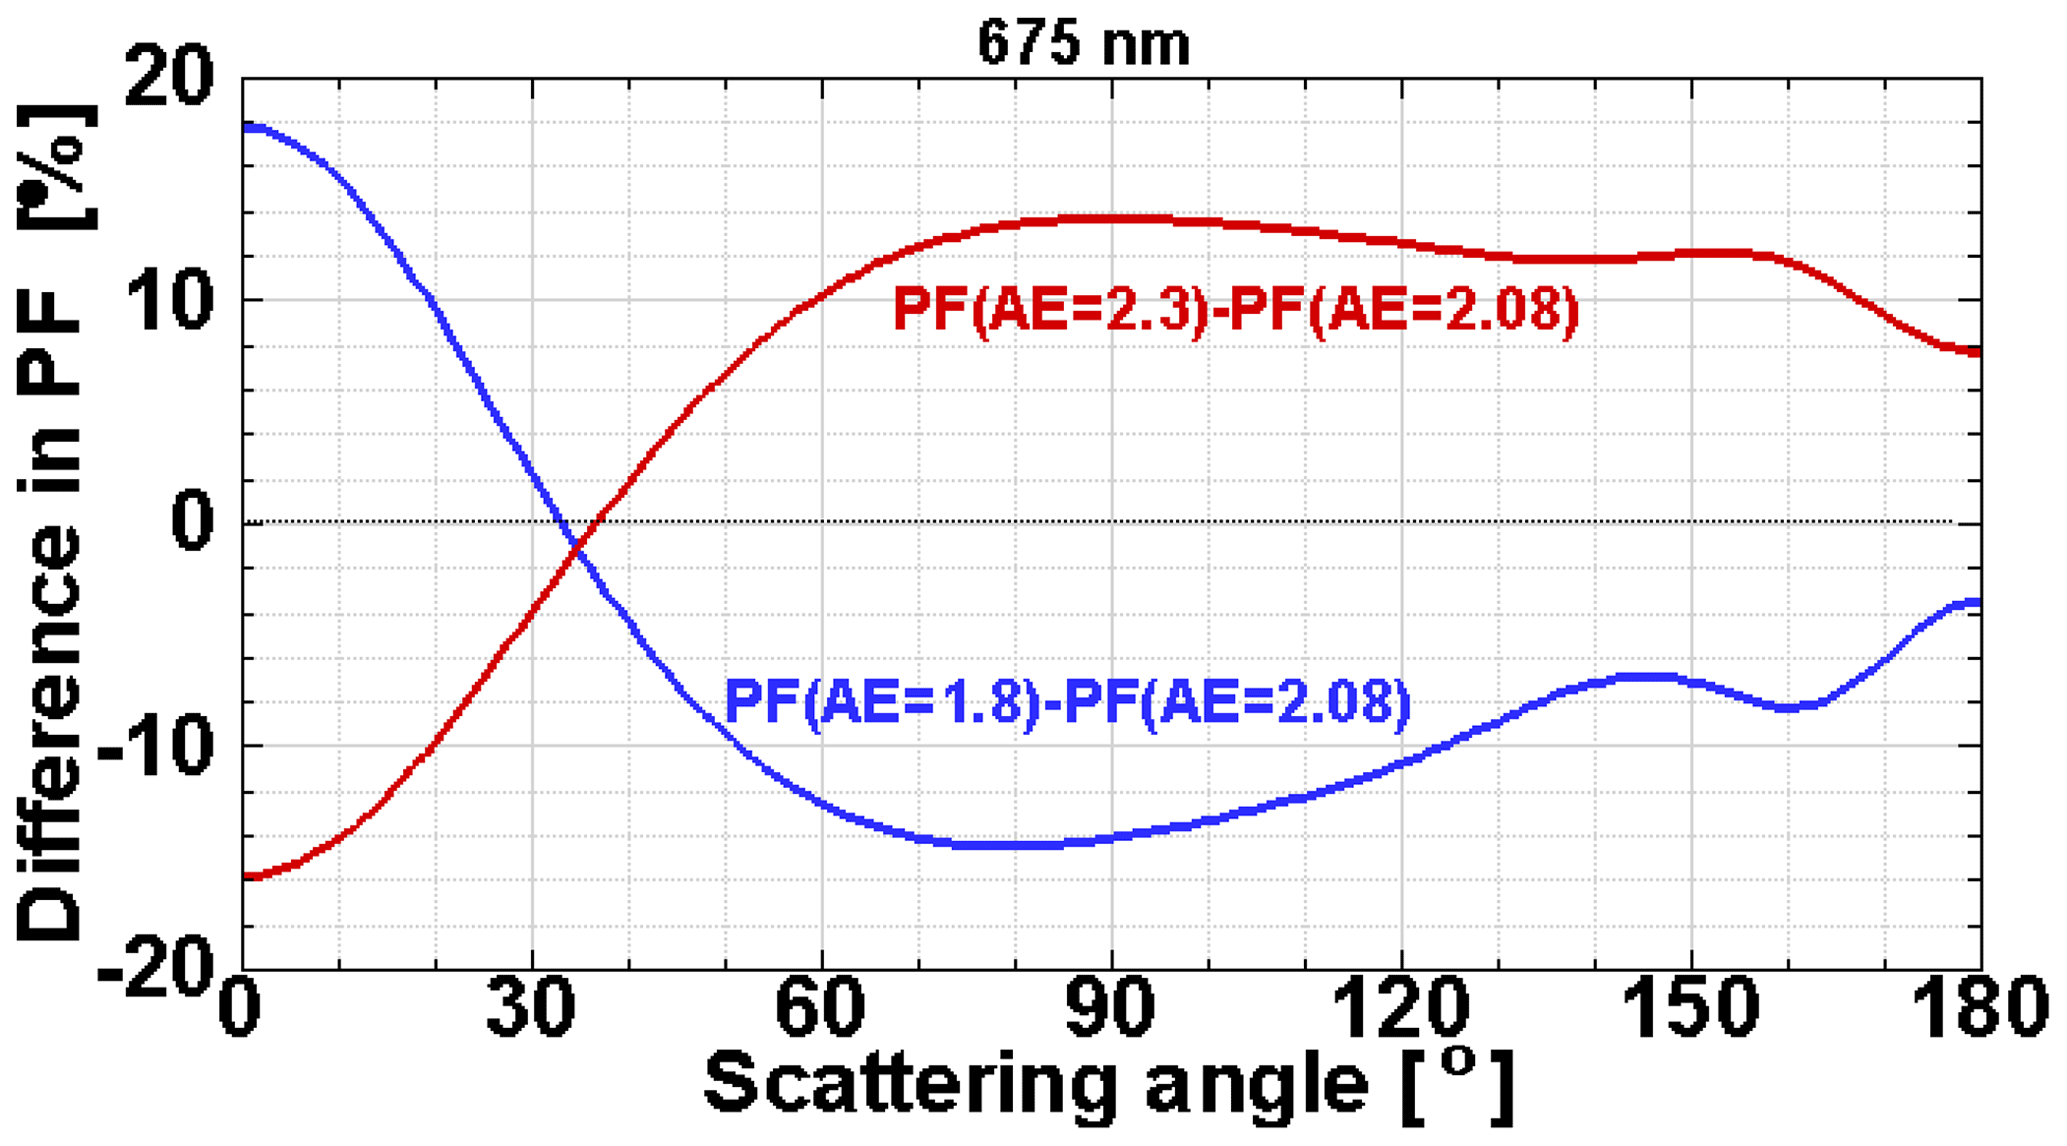
Figure 8This figure shows how the aerosol phase function (PF) at 675 nm changes when the AE is perturbed by ±10 % of the baseline value of 2.08.
To examine the LP algorithm performance of the aerosol retrieval due to the assumed ASD, we perturbed the nominal gamma ASD fitting parameters so that the resulting AE yielded values of 2.3 and 1.8 (about ±10 % of the algorithm's baseline value of 2.08). The 2.3 value is close to the reported average SAGE II AE at 30 km for the period from 2000 to 2005 (blue dots in Fig. 1), whereas the AE value of 1.8 resembles a similar SAGE II average at 18 km in the case of reduced aerosol load. The perturbed ASDs, associated with AE values of 1.8 and 2.3, were used to estimate the resulting effect on the calculated 675 nm PF (as shown in Fig. 8). A ±10 % change in the AE can produce about a ±15 % change in the PF. The results of the sensitivity analysis in Fig. 8 indicate that changes in the assumed PF will result in significant changes in the retrieved aerosol extinction values.
Figure 9 shows that the use of the baseline AE value (2.08) produces significant error (up to ±13 %) in the retrieved extinction at 30.5 and 18.5 km relative to the outcome when using AE values comparable to those from SAGE II v7.0 data. The results of this sensitivity analysis show that when taking the altitude dependency of stratospheric aerosol properties into account, the LP algorithm performance improves at those levels. Figure 10 shows differences in aerosol extinction between OMPS/LP and SAGE III/ISS at 30.5 km in the tropics (Fig. 10a) and at 18.5 km in northern midlatitudes (Fig. 10b) plotted as a function of the LP scattering angle (SA) for the entire comparison period to examine if the assumed ASD is reasonable. As discussed earlier, if the assumed ASD is correct, the difference in the extinction should be SA independent in the SA range from 50 to 100∘. The differences shown in Fig. 10 vary significantly with the SA in the abovementioned range, suggesting that the currently assumed ASD in the LP algorithm does not adequately represent the actual ASD for altitudes of 30.5 and 18.5 km. As a result, the potential ASD error propagates into extinction uncertainties above 28 and below 19 km. Another important aspect that influences the comparison below 19 km is the presence of clouds and thicker aerosol layers, as discussed earlier (Fig. 3). Near or below the tropopause, big disagreements between the two instruments can also be expected due to the variability in the transport of air masses.
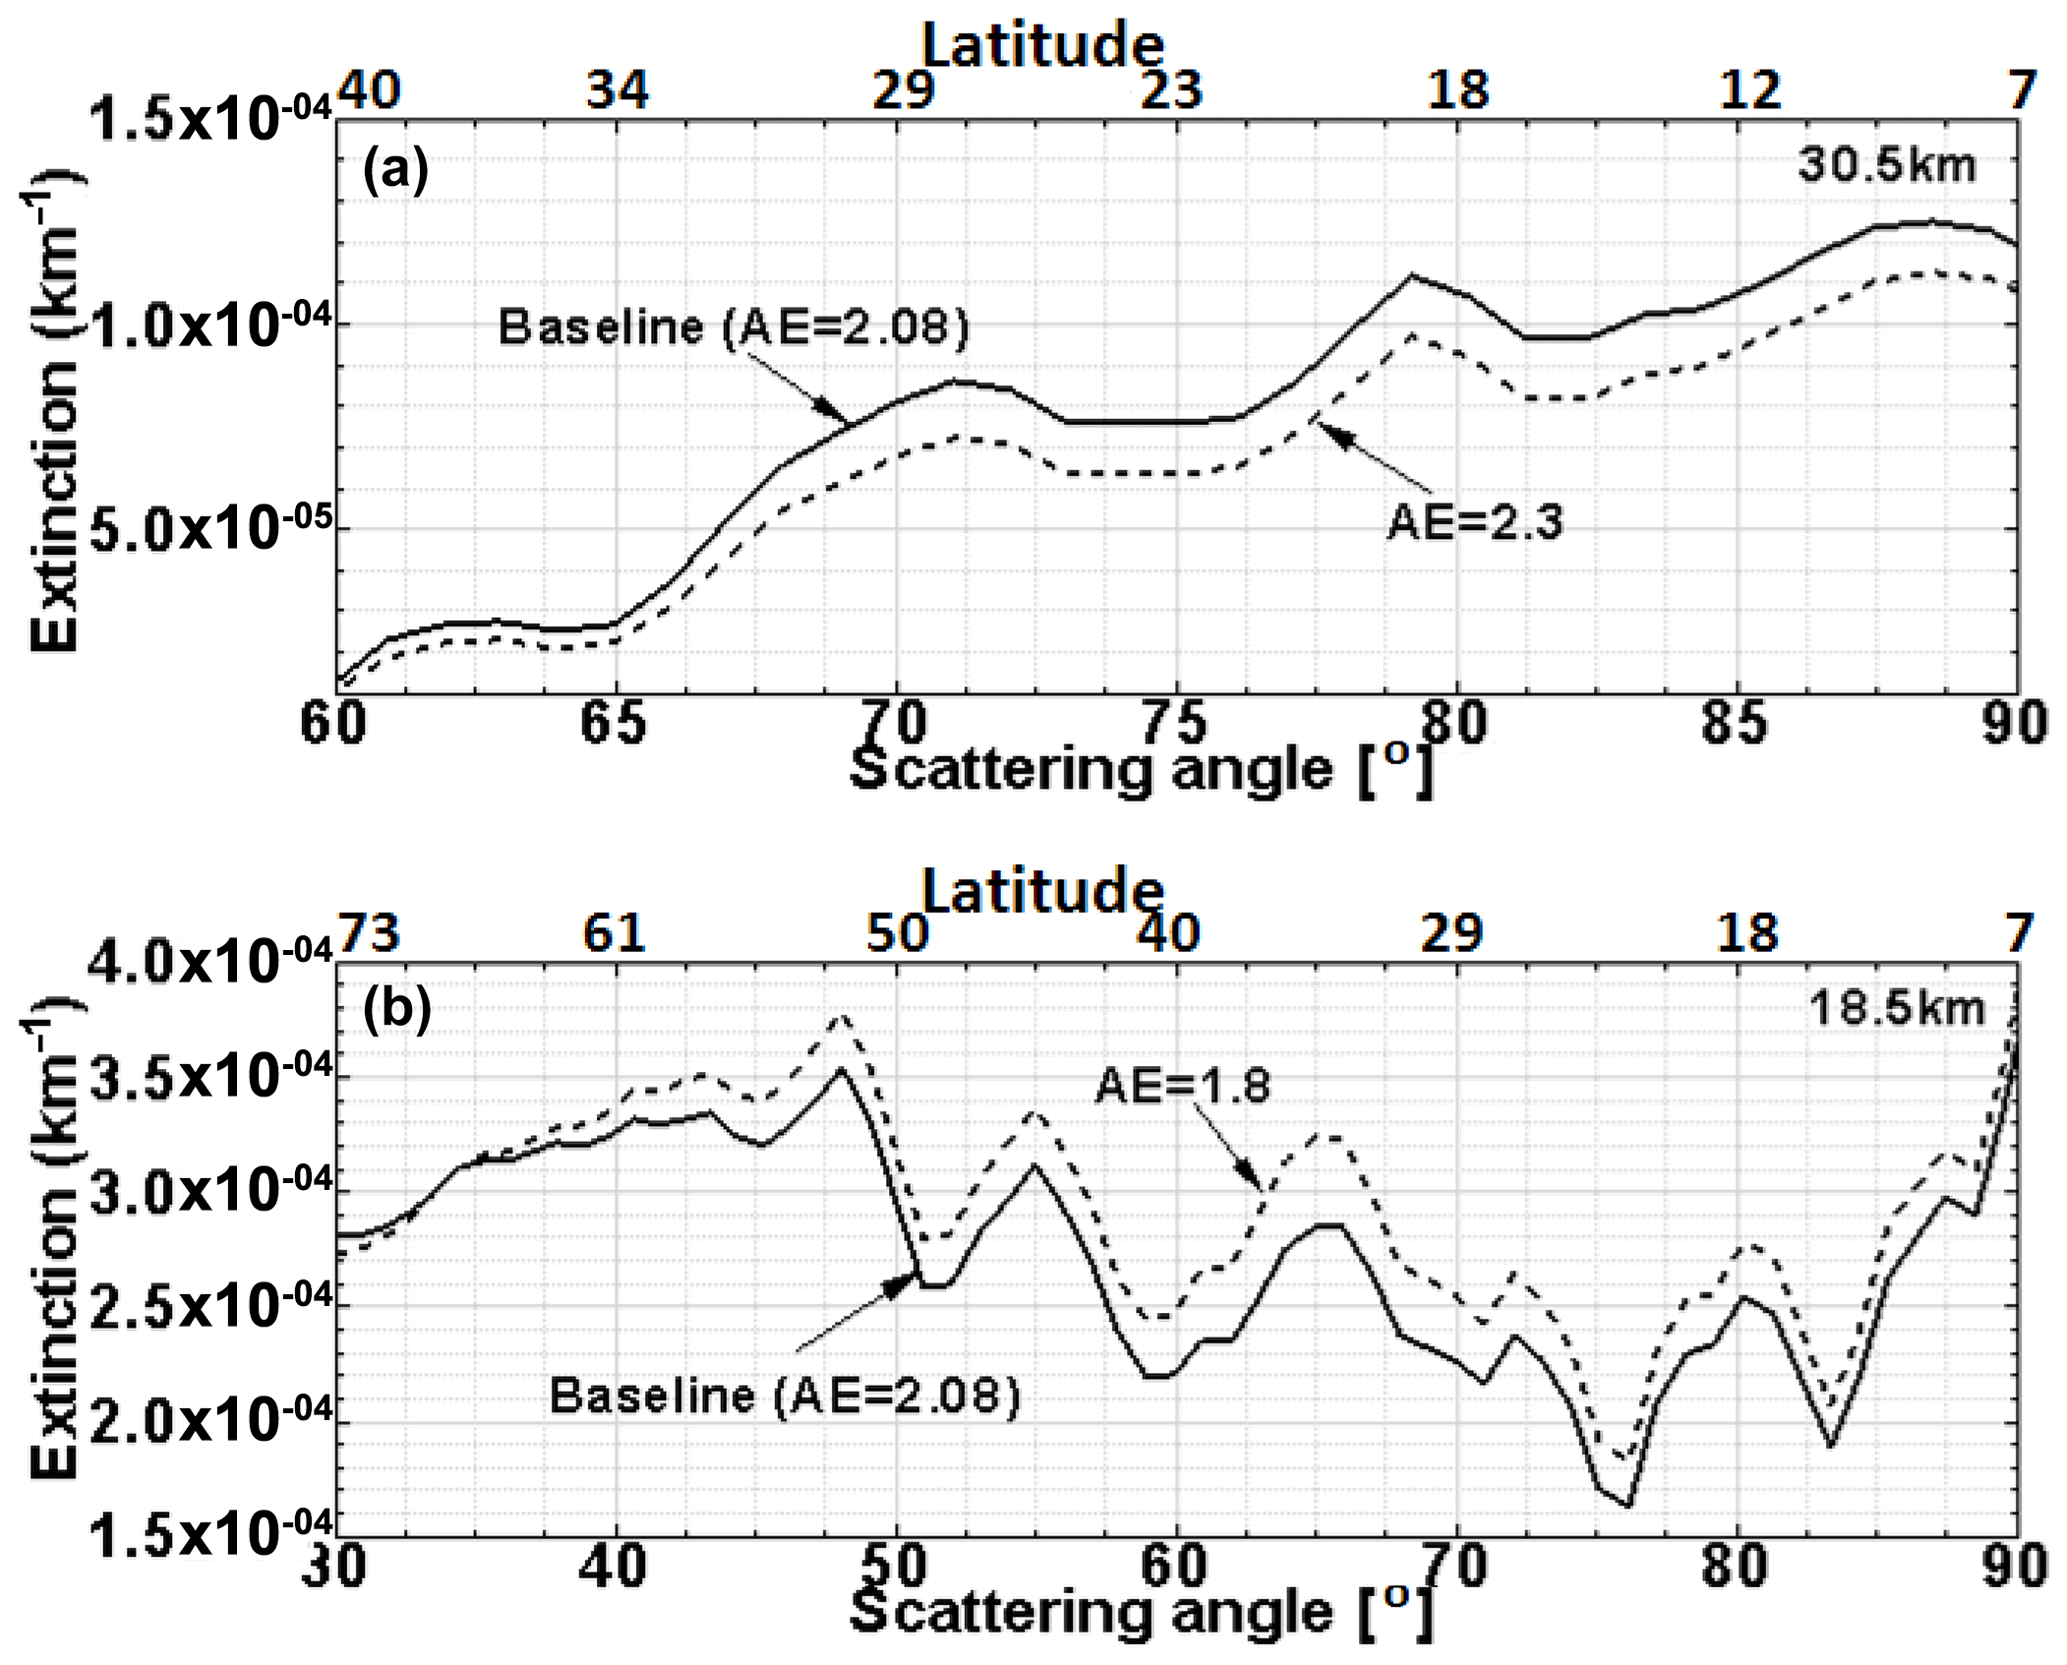
Figure 9LP-retrieved extinction values from the baseline particle size distribution (solid line) and from the same with the Ångström exponent (AE) adjusted by ±10 % (dashed line) for an altitude of 30.5 km (a) and 18.5 km (b) as a function of scattering angle (bottom x axis) and latitude (top x axis) using OMPS/LP measurements for a single orbit on 12 September 2016. While extinction values at 30.5 km with an AE of 2.3 are lower than the baseline, extinction values at 18.5 km with an AE of 1.8 are higher than the baseline.
The sensitivities given in Figs. 8–10 suggest that the differences in extinctions between the two instruments could be partly explained by the variation in the AE. Figure 11 illustrates how the AE varies. In the figure, the monthly mean AE (Fig. 11a) derived from the vertically smoothed SAGE III/ISS data calculated using Eq. (2) and the differences between the SAGE III/ISS and OMPS/LP extinction values at 675 nm (Fig. 11b) are plotted as a function of altitude and time at different latitude bands in the tropics. To draw a corollary to SAGE II, the AE is derived using the aerosol extinction values at 520 and 1020 nm. However, to avoid potential bias, the aerosol extinction is first interpolated to 520 nm using a second-order polynomial in log–log space (extinction versus wavelength) with extinction values at 448, 756, 869, and 1020 nm. The computed AE is plotted on a color scale with the baseline value of 2.08 used for the OMPS/LP algorithm at its center. Thus, the red colors in Fig. 11a represent SAGE III/ISS AE values larger than the OMPS/LP AE value, whereas blue colors represent AE values smaller than the OMPS/LP value. AE values above the baseline are possibly associated with the volcanic eruption of Mt. Ambae below 25 km (note transport from the QBO in the lower center of the panels in Fig. 11a) and aerosol evaporation at higher altitudes, particularly in the tropics (Schuster et al., 2006; Kremser et al., 2016; Rieger et al., 2018; Malinina et al., 2019). The AE values are typically below the baseline through the mid-stratosphere under non-volcanic conditions, although the smallest values in the upper troposphere are possibly associated with clouds (and a minor influence from the PyroCb in the lower stratosphere at the northern extent of the plotted data in late 2017). SAGE III/ISS data suggest that the overall AE throughout most of the stratosphere is slightly below the baseline value of 2.08 used by the OMPS/LP algorithm. The similar structure between AE variations shown in Fig. 11a and the extinction differences shown in Fig. 11b suggest that the use of an altitude-dependent ASD in the LP retrieval is a significant component of the observed extinction differences, although other factors may also contribute. Section 4.5 provides further discussion on how the assumed LP phase function and LP measurement geometry can result in latitude-dependent variations in extinction differences with SAGE III/ISS.

Figure 10Relative differences in the aerosol extinction between LP and SAGE III/ISS along with the median difference (solid line) as a function of the LP scattering angle for an altitude of 30.5 km in the 20∘ S–20∘ N (a) latitude bin and an altitude of 18.5 km in 25–50∘ N latitude bin (b) during the period from June 2017 to May 2019. The differences in aerosol extinction values vary significantly with scattering angle between 50 and 100∘.
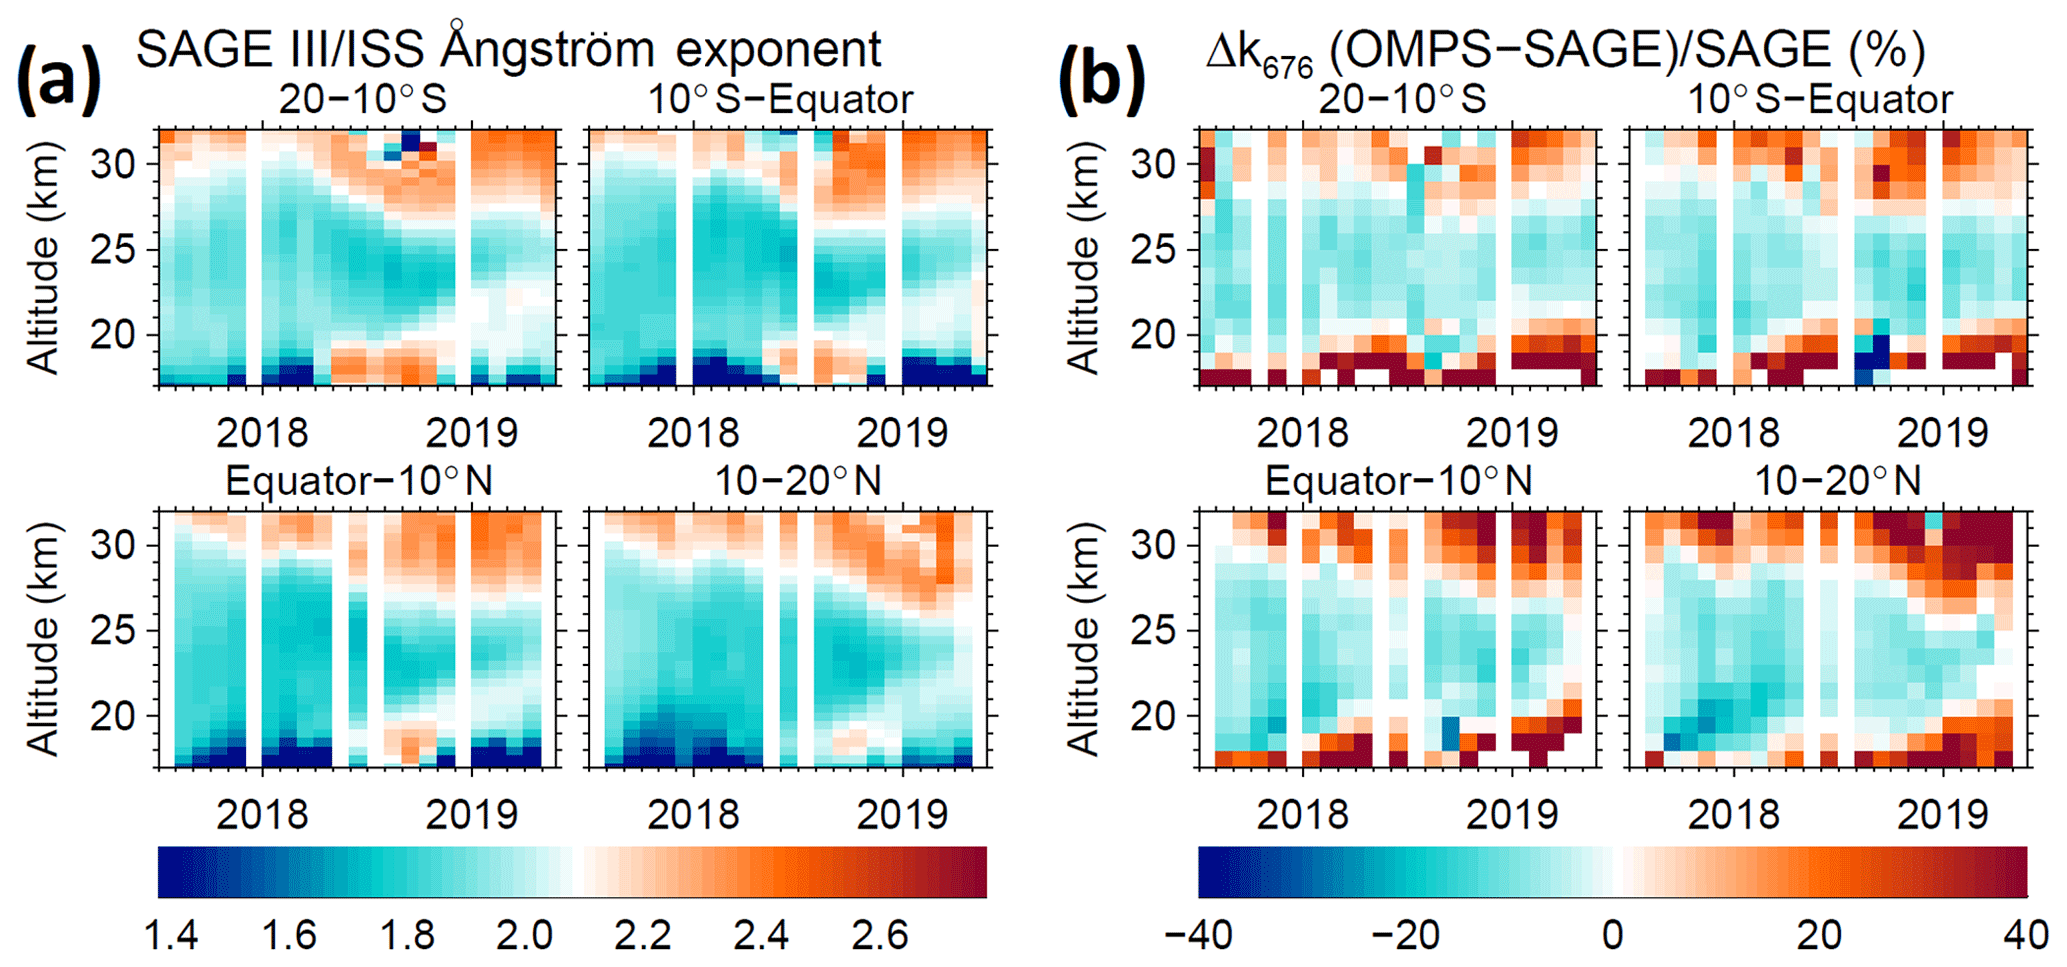
Figure 11(a) Monthly mean AE and (b) the differences between the SAGE III/ISS and OMPS/LP extinction values at 675 nm (in %) as a function of altitude and time for four latitude bands in the tropics. The AE is derived from vertically smoothed SAGE III/ISS data using the aerosol extinction values at 520 nm (interpolated) and 1020 nm (reported) plotted on a color scale with the baseline value of 2.08 used for the OMPS/LP algorithm at its center.

Figure 12Scatter plot of the SAGE III/ISS and OMPS/LP daily zonal means of extinction values between 19.5 and 27.5 km for 60–30∘ S (a), 30∘ S–30∘ N (b), and 30–60∘ N (c) for the entire time period from June 2017 to May 2019, illustrating the correlation between the two instruments. The red line shows the linear regression between the data points, and the blue line represents a 1:1 relationship. The correlation coefficient r, the standard deviation of the differences (x−y) σ, and the number of elements N used to compute r are also shown.
4.4 Regression analysis
Figure 12 shows scatter plots of the individual daily zonal mean extinction values from OMPS/LP and SAGE III/ISS for 5∘ latitude bands for 60–30∘ S (Fig. 12a), 30∘ S–30∘ N (Fig. 12b), and 30–60∘ N (Fig. 12c). The corresponding comparison statistics are written within the plot. While the overall impression from these results is encouraging, the agreement changes with latitude. In the tropics and northern midlatitudes (30∘ S–30∘ N and 30–60∘ N, respectively), there is good agreement between the results from both instruments, with most observations close to the 1:1 line and a correlation coefficient greater than 0.96. This result gives further quantitative evidence that the assumed ASD is appropriate for the OMPS/LP aerosol extinction retrievals in most of the stratosphere for background aerosol. In the southern midlatitudes, between 60 and 30∘ S, zonal means from LP and SAGE III/ISS are in fair agreement with a correlation coefficient of 0.95, but large systematic differences (SAGE III/ISS greater than LP) are observed for the aerosol extinction, k > 0.0001 m−1. These positive deviations of up to 25 % could be related to wavelength limitations (see Sect. 4.5).
4.5 Wavelength dependence on OMPS/LP aerosol sensitivity
In Figs. 5 and 12, the comparison shows asymmetry between the hemispheres below 20.5 km, with much better agreement in the NH than in the SH, and OMPS/LP extinction values are significantly biased at southern midlatitudes below 20 km due to erroneous seasonal variations in the OMPS/LP dataset. This suggests that the LP measurements are more sensitive to aerosols in the NH and less sensitive to those in the SH, especially at lower altitudes. Here, we shall examine the sensitivity of the LP radiances to aerosol.

Figure 13Example of aerosol weighting functions at a wavelength of 675 nm for an altitude of 60∘ S (a), 8∘ S (b), and 62∘ N (c). Each curve represents the sensitivity of the modeled LP radiance, I, at a given tangent height, TH, altitude, to a typical aerosol extinction, k, at each 1 km altitude layer from 10 to 40 km. The weighting functions are positive (black line) and peaked at different altitude ranges. At lower TH altitudes and for larger SA, the 675 nm weighting functions become negative (red line) and lose sensitivity to aerosol extinction at lower TH altitudes.
As mentioned before, the LP V1.5 algorithm uses OMPS/LP radiances at a single wavelength of 675 nm to retrieve the extinction profile. This wavelength was selected primarily to minimize aerosol-related errors in the ozone retrieval and to reduce stray-light contamination (Loughman et al., 2018). However, as indicated in Sect. 4.1 and 4.4, it is difficult to retrieve reliable aerosol extinction below 20 km in the SH due to the lack of sensitivity to aerosol. Figure 13 shows an example of aerosol weighting functions at 675 nm for three latitudes. The aerosol weighting function, which determines how the calculated radiance (I) at a given wavelength changes with a change in aerosol extinction (k), is denoted by
The derivatives are calculated for all altitudes for a change at each tangent height, and each curve in the figure shows the sensitivity of the radiance at a given tangent height to extinction perturbations of a 1 km layer at a range of altitudes. It can be seen that the sensitivity to aerosol varies with latitude and altitude. The LP radiance at 675 nm is most sensitive to the aerosol extinction over the 20–30 km altitude range in the tropics and the northern midlatitudes, but it is less sensitive to aerosol in the southern midlatitudes. Therefore, uncertainties in OMPS/LP aerosol retrievals at 675 nm increase with reduced sensitivity to aerosol extinction because lower sensitivities to aerosol may result in noise amplification. This behavior is consistent with the results shown in Figs. 5 and 12 that the LP retrievals are in better agreement with the SAGE III/ISS data in the NH than those in the SH.
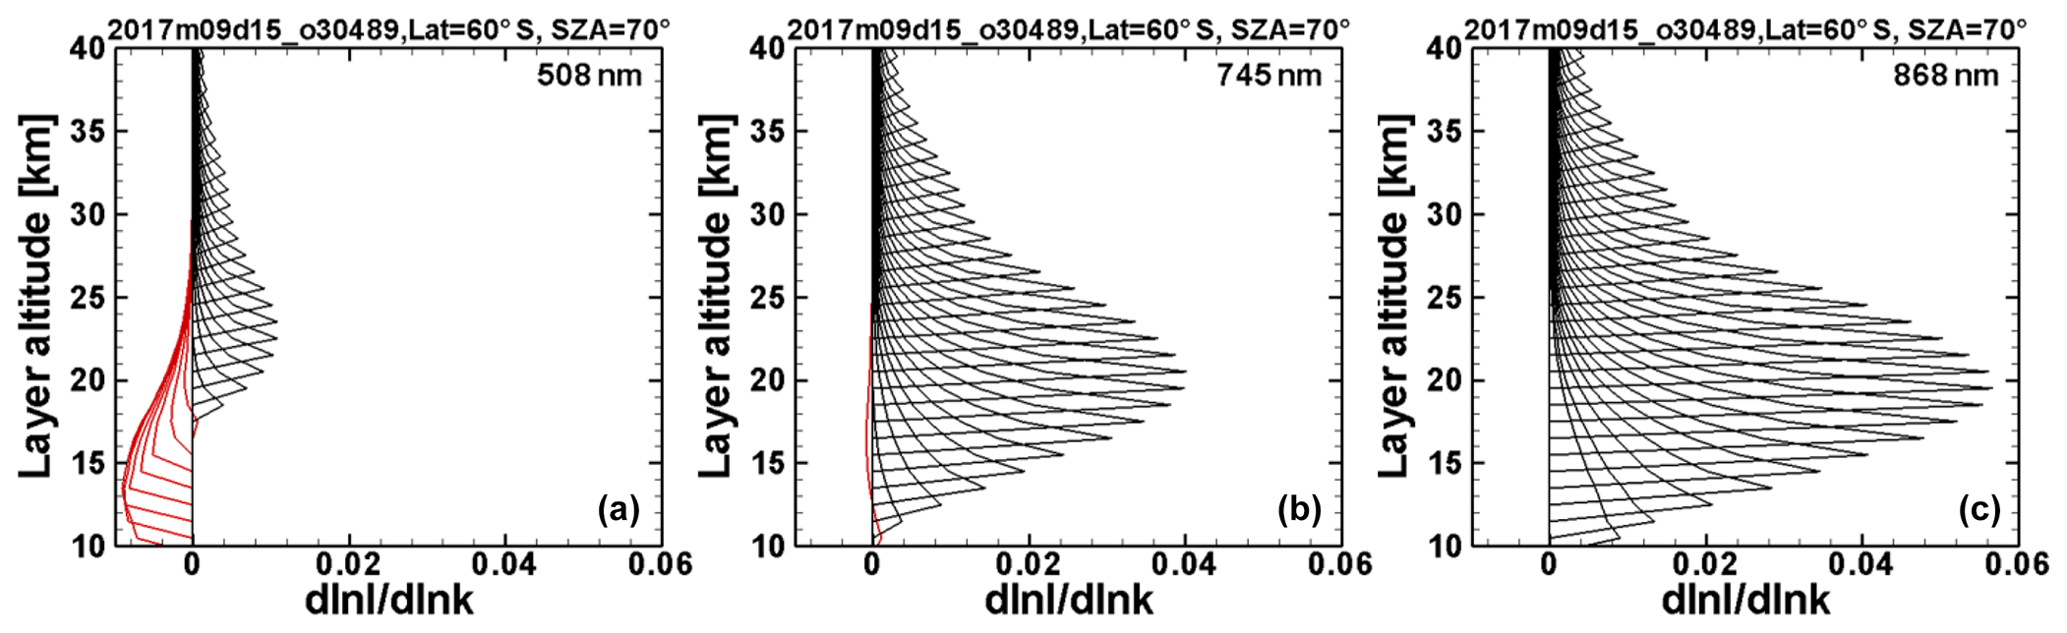
Figure 14Example of aerosol weighting functions at 60∘ S for wavelengths of 508 nm (a), 745 nm (b), and 868 nm (c). Each curve represents the sensitivity of the modeled LP radiance, I, at a given tangent altitude, TH, to a typical aerosol extinction, k, at each 1 km altitude layer from 10 to 40 km. The weighting functions are positive (black line) and peaked at different altitude ranges. At lower altitudes, the weighting functions at 508 and 745 nm become negative (red line) and lose sensitivity to aerosol extinction.
In the limb-scattering technique, in contrast, the aerosol signal in the limb radiance at a given tangent height is roughly proportional to the product of the aerosol extinction in that layer and the PF at the tangent point. OMPS/LP is installed in a fixed orientation relative to the S-NPP spacecraft. Therefore, southern midlatitudes are observed at backscattering geometries, whereas NH observations are carried under forward scattering conditions (see Loughman et al., 2018, Fig. 2). The aerosol scattering phase function is at least 50 times smaller for OMPS limb viewing in the SH than in the NH. Due to the variation in the PF with latitude and season, the LP observations are most sensitive to aerosols in the NH winter and least sensitive to those in the SH. LP scattering angles typically vary between 15 and 165∘. For the selected wavelength of 675 nm and the assumed ASD, the PF has much smaller values at larger scattering angles (see Chen et al., 2018; blue line in Fig. 2), corresponding to the larger solar azimuth angles at southern latitudes. This leads to a smaller relative contribution of aerosol scattering with respect to Rayleigh scattering. At extremely large scattering angles (> 145∘) where Rayleigh scattering is high and the value of the aerosol phase function is close to its minimum, the LP radiances at 675 nm are nearly insensitive to aerosol at lower altitudes. Therefore, the SA upper limit (of 145∘) should be used to filter the data. Outside of this SA range, LP extinction values will tend to bias the retrieved result, as revealed in Fig. 5. This could explain the presence of erroneous seasonal variations in the OMPS/LP dataset.
Since the sensitivity to aerosol increases at longer wavelengths (Taha et al., 2011), the uncertainties in the southern midlatitudes at lower altitudes may be reduced by using longer wavelengths. Figure 14 illustrates the sensitivity of the limb radiances to the aerosol extinction at three wavelengths for a latitude of 60∘ S (solar zenith angle, SZA, of 70∘). The sensitivity to aerosol is seen to increase with increasing wavelength. The increased sensitivity of the limb radiances to aerosol at longer wavelengths is partly due to the fact that the Mie scattering from aerosol particles does not decrease as rapidly with wavelength as the Rayleigh scattering from air molecules (Bourassa et al., 2007).
To extend our previous validation of the OMPS/LP aerosol products, OMPS/LP Version 1.5 extinction profiles have been compared against SAGE III/ISS Version 5.1 aerosol data over the period from June 2017 to May 2019. For the comparison, both LP and SAGE III/ISS extinction profiles in this paper are in the form of daily averages for a 5∘ latitude bin at each altitude. To evaluate the 675 nm extinction profiles from OMPS/LP, the original SAGE III/ISS extinction values at 449 and 756 nm are used to interpolate to the extinction profiles at 675 nm, in order to avoid contamination from potential biases in the SAGE III/ISS “MLR” ozone product, and then degraded vertically to the same 1.6 km vertical resolution as OMPS/LP. Using SAGE III/ISS aerosol channels away from the Chappuis bands and matching the vertical resolution of the instruments significantly improves the comparisons.
Overall, results show very good agreement for extinction profiles between 19 and 27 km, to within ±25 %, and show systematic differences (LP–SAGE III/ISS) above 28 km and below 19 km (> ±25 %). The results show that the LP retrievals are in better agreement with the SAGE III/ISS data in the NH than those in the SH, and the agreements change with time and altitude. Comparisons of time series show that both instruments detect changes in stratospheric aerosol layer well during the entire time period from June 2017 to May 2019. To investigate the impact of volcanic perturbations on the retrievals, the differences in extinction profiles measured by LP and SAGE III/ISS in the same latitude bin and on the same day are analyzed before and after the occurrence of the Mt. Ambae volcanic eruption and the Canadian PyroCb. The results show that both instruments can capture the volcanic aerosol and PyroCb well, and their discrepancies are small (< ±10 %), indicating that the LP-retrieved extinction profiles are reliable under these conditions. In order to better quantify the difference in the variability observed in the OMPS/LP and SAGE III/ISS measurements, a total of 9862 data points between 19.5 and 27.5 km were used to perform a linear regression analysis. The regression results show very high correlations with a linear correlation coefficient greater than 0.95, and most observations lie close to the 1:1 line, except for the southern midlatitudes where large positive differences of up to 25 % are observed due to differences in retrieval techniques and the sensitivity issue. These comparisons are consistent with the previous analysis performed by Chen et al. (2018) that demonstrated a good agreement between the extinction profiles in the range from 19 to 29 km and much larger differences above 30 km and below 19 km.
At altitudes above 28 km (below 19 km), LP extinction values were systematically higher (lower) than SAGE III/ISS observations. These significant and systematic biases between LP and SAGE III/ISS are partly due to the fact that the actual ASD is both altitude and time dependent. To evaluate the LP performance of the aerosol retrieval from the assumed ASD, the averaged Ångström exponent (AE) derived from SAGE II V7.0 data under background aerosol conditions was compared with the baseline AE derived from the assumed ASD. The analysis indicates that the baseline AE is underestimated (overestimated) above 28 km (below 19 km) under background conditions; thus, the assumed ASD provides a less accurate representation at altitudes above 28 km (below 19 km), tending to overestimate (underestimate) extinction values above (below) this level. Our sensitivity analysis shows that the ASD error propagates into extinction uncertainty by as much as 13 %. This suggests that a dynamic model for ASD is needed to accurately retrieve aerosol extinction profiles. There are three other possible causes for the discrepancies. First, most of the remaining discrepancies in the comparison are possibly attributed to the inherent uncertainties associated with the measurement techniques. In principle, the differences in the measurement techniques affect the instrument sensitivity to aerosols (Malinina et al., 2019). While SAGE III/ISS uses the solar occultation measuring technique which is self-calibrating and derives extinction directly, OMPS/LP employs the limb-scattering technique where retrieved extinction depends on instrument calibration and tangent height registration as well as the inversion algorithm and its several assumptions, including the assumed aerosol microphysics. Uncertainties in these assumptions can also affect the LP extinction product. Second, some discrepancies at higher altitudes could be also caused by reduced aerosol loading and, hence, reduced retrieval accuracy for both instruments. The limb radiance is also more susceptible to additive stray-light contamination at high altitudes, where absolute radiance values are smaller. Third, large differences between LP and SAGE III/ISS at lower altitudes of as much as 60 % may also be associated with thin cirrus clouds, a thick aerosol layer, and air mass transport at various locations and levels.
Another significant finding in this study is that the comparison shows asymmetry between the hemispheres below 20.5 km, with better agreement in the NH than in the SH, and erroneous seasonal variations at southern latitudes in the OMPS/LP dataset with an estimated uncertainty of a factor of up to 2. The reason for this is identified as the fact that the LP radiances at 675 nm are nearly insensitive to aerosol at extremely large scattering angles. This problem can be solved by using longer wavelengths to retrieve aerosol extinction. In the meantime, we recommend filtering LP data below 20 km with an SA greater than 145∘. When the SA exceeds this limit, the LP algorithm starts to give obviously incorrect results.
OMPS/LP Version 1.5 aerosol profiles are freely available to the international research community at https://doi.org/10.5067/GZJJYA7L0YW2 (Bhartia and Torres, 2019).
ZC performed the analyses and prepared the article with significant contributions from all co-authors. PKB led the development of the algorithms for the OMPS/LP Level 2 products and provided scientific guidance on the paper. OT and MD provided suggestions and edited the paper. GJ, RL, and GT provided expert advice on the OMPS/LP aerosol observation. PC provided the CARMA model output. RD produced Fig. 11 and participated in scientific discussions.
The authors declare that they have no conflict of interest.
We thank the OMPS/LP team at NASA Goddard and Science Systems and Applications, Inc. (SSAI) for help with producing the data used in this study. We also thank Larry Thomason at the NASA Langley Research Center for his insights into the stratospheric aerosol problem and Philippe Xu and Tong Zhu for their technical support. SAGE III/ISS is a mission led by NASA Langley and funded by the NASA Science Mission Directorate within the Earth Systematic Missions Program. The enabling partners are the NASA Human Exploration and Operations Mission Directorate, the International Space Station Program, and the European Space Agency. Finally, we thank the editor and the reviewers for their helpful comments that improved this paper.
Funding for this work was provided in part by NASA through the OMPS/LP science team program.
This paper was edited by Christian von Savigny and reviewed by three anonymous referees.
Bhartia, P. K. and Torres, O. O.: OMPS-NPP L2 LP Aerosol Extinction Vertical Profile swath daily 3slit V1.5, Greenbelt, MD, USA, Goddard Earth Sciences Data and Information Services Center (GES DISC), https://doi.org/10.5067/GZJJYA7L0YW2, 2019.
Bingen, C., Robert, C. E., Stebel, K., Brühl, C., Schallock, J., Vanhellemont, F., Mateshvili, N., Höpfner, M., Trickl, T., Barnes, J. E., Jumelet, J., Vernier, J.-P., Popp, T., de Leeuw, G., and Pinnock, S.: Stratospheric aerosol data records for the climate change initiative: Development, validation and application to chemistry-climate modelling, Remote Sens. Environ., 203, 296–321, https://doi.org/10.1016/j.rse.2017.06.002, 2017.
Bourassa, A. E., Degenstein, D. A., Gattinger, R. L., and Llewellyn, E. J.: Stratospheric aerosol retrieval with optical spectrograph and infrared imaging system limb scatter measurements, J. Geophys. Res., 112, D10217, https://doi.org/10.1029/2006JD008079, 2007.
Bourassa, A. E., Rieger, L. A., Lloyd, N. D., and Degenstein, D. A.: Odin-OSIRIS stratospheric aerosol data product and SAGE III intercomparison, Atmos. Chem. Phys., 12, 605–614, https://doi.org/10.5194/acp-12-605-2012, 2012.
Brühl, C., Schallock, J., Klingmüller, K., Robert, C., Bingen, C., Clarisse, L., Heckel, A., North, P., and Rieger, L.: Stratospheric aerosol radiative forcing simulated by the chemistry climate model EMAC using Aerosol CCI satellite data, Atmos. Chem. Phys., 18, 12845–12857, https://doi.org/10.5194/acp-18-12845-2018, 2018.
Chahine, M.: Inverse problems in radiative transfer: A determination of atmospheric parameters, J. Atmos. Sci., 27, 960–967, 1970.
Chen, Z., DeLand, M., and Bhartia, P. K.: A new algorithm for detecting cloud height using OMPS/LP measurements, Atmos. Meas. Tech., 9, 1239–1246, https://doi.org/10.5194/amt-9-1239-2016, 2016.
Chen, Z., Bhartia, P. K., Loughman, R., Colarco, P., and DeLand, M.: Improvement of stratospheric aerosol extinction retrieval from OMPS/LP using a new aerosol model, Atmos. Meas. Tech., 11, 6495–6509, https://doi.org/10.5194/amt-11-6495-2018, 2018.
Chu, W. and Veiga, R.: SAGE III/EOS, Proc. SPIE 3501, Optical Remote Sensing of the Atmosphere and Clouds, 52–60, https://doi.org/10.1117/12.577943, 1998.
Colarco, P. R., Nowottnick, E. P., Randles, C. A., Yi, B., Yang, P., Kim, K.-M., Smith, J. A., and Bardeen, C. G.: Impact of radiatively interactive dust aerosols in the NASA GEOS-5 climate model: Sensitivity to dust particle shape and refractive index, J. Geophys. Res.-Atmos., 119, 753–786, https://doi.org/10.1002/2013JD020046, 2014.
Damadeo, R. P., Zawodny, J. M., Thomason, L. W., and Iyer, N.: SAGE version 7.0 algorithm: application to SAGE II, Atmos. Meas. Tech., 6, 3539–3561, https://doi.org/10.5194/amt-6-3539-2013, 2013.
Deshler, T. R., Sprecher, A., Jäger, H., Barnes, J., D. J. Hofmann, D. J., Clemesha, B., Simonich, Osborn, D. M., Grainger, R. G., and Beekmann, S. G.: Trends in the non volcanic component of stratospheric aerosol over the period 1971–2004, J. Geophys. Res., 111, D01201, https://doi.org/10.1029/2005JD006089, 2006.
English, J. M., Toon, O. B., Mills, M. J., and Yu, F.: Microphysical simulations of new particle formation in the upper troposphere and lower stratosphere, Atmos. Chem. Phys., 11, 9303–9322, https://doi.org/10.5194/acp-11-9303-2011, 2011.
Flynn, L. E., Seftor, C. J., Larsen, J. C., and Xu, P.: The Ozone Mapping and Profiler Suite, in: Earth Science Satellite Remote Sensing, edited by: Qu, J. J., Gao, W., Kafatos, M., Murphy, R. E., and Salomonson, V. V., Springer, Berlin, 279–296, https://doi.org/10.1007/978-3-540-37293-6, 2007.
Fromm, M., Kablick III, G., Nedoluha, G., Carboni, E., Grainger, R., Campbell, J. and Lewis, J.: Correcting the record of volcanic stratospheric aerosol impact: Nabro and Sarychev Peak, J. Geophys. Res.-Atmos., 119, 10343–10364, https://doi.org/10.1002/2014JD021507, 2014.
Hayashida, S. and Horikawa, M.: Anti-Correlation between stratospheric aerosol extinction and the Ångström parameter from multiple wavelength measurements with SAGE II–A characteristic of the decay period following major volcanic eruptions, Geophys. Res. Lett., 28, 4063–4066, doi.org/10.1029/2000GL012826, 2001.
Jaross, G., Bhartia, P. K., Chen, G., Kowitt, M., Haken, M., Chen, Z., Xu, P., Warner, J., and Kelly, T.: OMPS Limb Profiler instrument performance assessment, J. Geophys. Res.-Atmos., 119, 4399–4412, https://doi.org/10.1002/2013JD020482, 2014.
Junge, C. E., Chagnon, C. W., and Manson, J. E.: A world-wide stratospheric aerosol layer, Science, 133, 1478–1479, 1961.
Kloss, C., Berthet, G., Sellitto, P., Ploeger, F., Bucci, S., Khaykin, S., Jégou, F., Taha, G., Thomason, L. W., Barret, B., Le Flochmoen, E., von Hobe, M., Bossolasco, A., Bègue, N., and Legras, B.: Transport of the 2017 Canadian wildfire plume to the tropics via the Asian monsoon circulation, Atmos. Chem. Phys., 19, 13547–13567, https://doi.org/10.5194/acp-19-13547-2019, 2019.
Kovilakam, M. and Deshler, T.: On the accuracy of stratospheric aerosol extinction derived from in situ size distribution measurements and surface area density derived from remote SAGE II and HALOE extinction measurements, J. Geophys. Res.-Atmos., 120, 8426–8447, https://doi.org/10.1002/2015JD023303, 2015.
Kramarova, N. A., Bhartia, P. K., Jaross, G., Moy, L., Xu, P., Chen, Z., DeLand, M., Froidevaux, L., Livesey, N., Degenstein, D., Bourassa, A., Walker, K. A., and Sheese, P.: Validation of ozone profile retrievals derived from the OMPS LP version 2.5 algorithm against correlative satellite measurements, Atmos. Meas. Tech., 11, 2837–2861, https://doi.org/10.5194/amt-11-2837-2018, 2018.
Kremser, S., Thomason, L. W., Hobe, M., Hermann, M., Deshler, T., Timmreck, C., Toohey, M., Stenke, A., Schwarz, J. P., Weigel, R., Fueglistaler, S., Prata, F. J., Vernier, J.-P., Schlager, H., Barnes, J. E., Antuna-Marrero, J.-C., Fairlie, D., Palm, M., Mahieu, E., Notholt, J., Rex, M., Bingen, C., Vanhellemont, F., Bourassa, A., Plane, J. M. C., Klocke, D., Carn, S. A., Clarisse, L., Trickl, T., Neely, R., James, A. D., Rieger, L., Wilson, J. C., and Meland, B.: Stratospheric aerosol-Observations, processes, and impact on climate, Rev. Geophys., 54, 278–335, 2016.
Loughman, R., Bhartia, P. K., Chen, Z., Xu, P., Nyaku, E., and Taha, G.: The Ozone Mapping and Profiler Suite (OMPS) Limb Profiler (LP) Version 1 aerosol extinction retrieval algorithm: theoretical basis, Atmos. Meas. Tech., 11, 2633–2651, https://doi.org/10.5194/amt-11-2633-2018, 2018.
Malinina, E., Rozanov, A., Rieger, L., Bourassa, A., Bovensmann, H., Burrows, J. P., and Degenstein, D.: Stratospheric aerosol characteristics from space-borne observations: extinction coefficient and Ångström exponent, Atmos. Meas. Tech., 12, 3485–3502, https://doi.org/10.5194/amt-12-3485-2019, 2019.
McCormick, M. P., Hamill, P., Pepin, T. J., Chu, W. P., Swissler, T. J., and McMaster, L. R.: Satellite studies of the stratospheric aerosol, B. Am. Meteorol. Soc., 60, 1038–1047, https://doi.org/10.1175/1520-0477(1979)060<1038:SSOTSA>2.0.CO;2, 1979.
Moy, L., Bhartia, P. K., Jaross, G., Loughman, R., Kramarova, N., Chen, Z., Taha, G., Chen, G., and Xu, P.: Altitude registration of limb-scattered radiation, Atmos. Meas. Tech., 10, 167–178, https://doi.org/10.5194/amt-10-167-2017, 2017.
Nyaku, E., Loughman, R., Bhartia, P. K., Deshler, T., Chen, Z., and Colarco, P. R.: A comparison of lognormal and gamma size distributions for characterizing the stratospheric aerosol phase function from optical particle counter measurements, Atmos. Meas. Tech., 13, 1071–1087, https://doi.org/10.5194/amt-13-1071-2020, 2020.
Peterson, D. A., Campbell, J. R., Hyer, E. J., Fromm, M. D., Kablick, G. P., Cossuth, J. H., and DeLand, M. T.: Wildfire-driven thunderstorms cause a volcano-like stratospheric injection of smoke, Npj Climate and Atmospheric Science, 1, 30, https://doi.org/10.1038/s41612-018-0039-3, 2018.
Rault, D. F. and Loughman, R. P.: The OMPS Limb Profiler Environmental Data Record algorithm theoretical basis document and expected performance, IEEE T. Geosci. Remote, 51, 2505–2527, 2013.
Ridley, D. A., Solomon, S., Barnes, J. E., Burlakov, V. D., Deshler, T., Dolgii, S. I., Herber, A. B., Nagai, T., Neely III, R. R., Nevzorov, A. V., Ritter, C., Sakai, T., Santer, B. D., Sato, M., Schmidt, A., Uchino, O., and Vernier, J. P.: Total volcanic stratospheric aerosol optical depths and implications for global climate change, Geophys. Res. Lett., 41, 7763–7769, https://doi.org/10.1002/2014GL061541, 2014.
Rieger, L. A., Malinina, E. P., Rozanov, A. V., Burrows, J. P., Bourassa, A. E., and Degenstein, D. A.: A study of the approaches used to retrieve aerosol extinction, as applied to limb observations made by OSIRIS and SCIAMACHY, Atmos. Meas. Tech., 11, 3433–3445, https://doi.org/10.5194/amt-11-3433-2018, 2018.
Russell, P. B., Livingston, J. M., Pueschel, R. F., Bauman, J. J., Pollack, J. B., Brooks, S. L., Hamill, P., Thomason, L. W., Stowe, L. L., Deshler, T., Dutton, E. G., and Bergstrom, R. W.: Global to microscale evolution of the Pinatubo volcanic aerosol, derived from diverse measurements and analyses, J. Geophys. Res, 101, 18745–18763, 1996.
Schuster, G. L., Dubovik, O., and Holben, B. N.: Angstrom exponent and bimodal aerosol size distributions, J. Geophys. Res.-Atmos., 111, D07207, https://doi.org/10.1029/2005JD006328, 2006.
Solomon, S., Daniel, J. S., Neely III, R. R., Vernier, J.-P., Dutton, E. G., and Thomason, L. W.: The persistently variable “background” stratospheric aerosol layer and global climate change, Science, 333, 866–870, 2011.
Steele, H. and Hamill, P.: Effects of temperature and humidity on the growth and optical properties of sulphuric acid-water droplets in the stratosphere, J. Aerosol Sci., 12, 517–528, 1981.
Sunilkumar, S. V., Parameswaran, K., Thampi, B. V., and Ramkumar, G.: Variability in background stratospheric aerosols over the tropics and its association with atmospheric dynamics, J. Geophys. Res., 116, D13204, https://doi.org/10.1029/2010JD015213, 2011.
Taha, G., Rault, D. F., Loughman, R. P., Bourassa, A. E., and von Savigny, C.: SCIAMACHY stratospheric aerosol extinction profile retrieval using the OMPS/LP algorithm, Atmos. Meas. Tech., 4, 547–556, https://doi.org/10.5194/amt-4-547-2011, 2011.
Thomason, L. W., Burton, S. P., Luo, B.-P., and Peter, T.: SAGE II measurements of stratospheric aerosol properties at non-volcanic levels, Atmos. Chem. Phys., 8, 983–995, https://doi.org/10.5194/acp-8-983-2008, 2008.
Thomason, L. W., Moore, J. R., Pitts, M. C., Zawodny, J. M., and Chiou, E. W.: An evaluation of the SAGE III version 4 aerosol extinction coefficient and water vapor data products, Atmos. Chem. Phys., 10, 2159–2173, https://doi.org/10.5194/acp-10-2159-2010, 2010.
Thomason, L. W., Ernest, N., Millán, L., Rieger, L., Bourassa, A., Vernier, J.-P., Manney, G., Luo, B., Arfeuille, F., and Peter, T.: A global space-based stratospheric aerosol climatology: 1979–2016, Earth Syst. Sci. Data, 10, 469–492, https://doi.org/10.5194/essd-10-469-2018, 2018.
Torres, O., Bhartia, P. K., Taha, G., Jethva, H., Das, S., Colarco, P., Krotkov, N., Omar, A., and Ahn, C.: Stratospheric injection of massive smoke plume from Canadian boreal fires in 2017 as seen by DSCOVR‐EPIC, CALIOP, and OMPS‐LP observations, J. Geophys. Res.-Atmos., 125, e2020JD032579, https://doi.org/10.1029/2020JD032579, 2020.
Vanhellemont, F., Fussen, D., Mateshvili, N., Tétard, C., Bingen, C., Dekemper, E., Loodts, N., Kyrölä, E., Sofieva, V., Tamminen, J., Hauchecorne, A., Bertaux, J.-L., Dalaudier, F., Blanot, L., Fanton d'Andon, O., Barrot, G., Guirlet, M., Fehr, T., and Saavedra, L.: Optical extinction by upper tropospheric/stratospheric aerosols and clouds: GOMOS observations for the period 2002–2008, Atmos. Chem. Phys., 10, 7997–8009, https://doi.org/10.5194/acp-10-7997-2010, 2010.
Vernier, J.-P., Thomason, L. W., Pommereau, J.-P., Bourassa, A., Pelon, J., Garnier, A., Hauchecorne, A., Blanot, L., Trepte, C., Degenstein, D., and Vargas, F.: Major influence of tropical volcanic eruptions on the stratospheric aerosol layer during the last decade, Geophys. Res. Lett., 38, L12807, https://doi.org/10.1029/2011GL047563, 2011.
von Savigny, C., Ernst, F., Rozanov, A., Hommel, R., Eichmann, K.-U., Rozanov, V., Burrows, J. P., and Thomason, L. W.: Improved stratospheric aerosol extinction profiles from SCIAMACHY: validation and sample results, Atmos. Meas. Tech., 8, 5223–5235, https://doi.org/10.5194/amt-8-5223-2015, 2015.
Wang, H. J., Damadeo, R., Flittner, D., Kramarova, N., Taha, G., Davis, S., Thompson, A. M., Strahan, S., Wang, Y., Froidevaux, L., Degenstein, D., Bourassa, A., Steinbrecht, W., Walker, K., Querel, R., Leblanc, T., Godin-Beekmann, S., Hurst, D., and Hall, E. J.: Validation of SAGE III/ISS Solar Ozone Data with Correlative Satellite and Ground Based Measurements, J. Geophys. Res.-Atmos., 125, e2020JD032430, https://doi.org/10.1029/2020JD032430, 2020.
Winker, D. M., Pelon, J., Coakley Jr., J. A., Ackerman, S. A., Charlson, R. J., Colarco, P. R., Flamant, P., Fu, Q., Hoff, R., Kittaka, C., Kubar, T. L., Le Treut, H., McCormick, M. P., Mégie, G., Poole, L., Powell, K., Trepte, C., Vaughan, M. A., and Wielicki, B. A.: The CALIPSO Mission: A Global 3D View Of Aerosols And Clouds, B. Am. Meteorol. Soc., 91, 1211–1229, https://doi.org/10.1175/2010BAMS3009.1, 2010.