the Creative Commons Attribution 4.0 License.
the Creative Commons Attribution 4.0 License.
 | 23 Jul 2020
Recommendations for spectral fitting of SO2 from miniature multi-axis differential optical absorption spectroscopy (MAX-DOAS) measurements
Zoë Y. W. Davis
Robert McLaren
Fitting sulfur dioxide (SO2) differential slant column densities (dSCDs) from multi-axis differential optical absorption spectroscopy (MAX-DOAS) measurements of scattered sunlight is challenging because actinic light intensity is low in the wavelength regions where the SO2 absorption features are strongest. SO2 dSCDs were fit with different wavelength windows (λlow to λhigh) from ambient measurements with calibration cells of 2.2×10¹⁷ and 2.2×10¹⁶ molec. cm−2 inserted in the light path at different viewing elevation angles using an Ocean Optics USB2000 spectrometer in a miniature MAX-DOAS instrument. SO2 dSCDs were the least accurate, and fit errors were highest for fitting windows with λlow < 307 or λlow > 312 nm. The SO2 dSCDs also exhibited an inverse relationship with the depth of the differential features in the SO2 absorption cross section for fitting windows with λlow < 307 nm. Spectra measured at low viewing elevation angles (i.e., ) exhibited less accurate SO2 dSCDs for the same fitting windows compared with higher angles. The use of a 400 nm short-pass filter or a polynomial to account for stray light (the offset function) increased the accuracy of the SO2 dSCDs for many different fitting windows, decreased fit errors, and decreased the dSCDs' dependence on the depth of the SO2 differential absorption features. These results suggest that the radiance at shorter wavelengths was increased by stray light. The inaccuracies at lower fitting wavelengths were increased by stray light originating from light with λ > 400 nm. Deviation of the SO2 dSCD from the true value depended on the SO2 concentration for some fitting windows rather than exhibiting a consistent bias. Uncertainties in the SO2 dSCD reported by the fit algorithm were more than 50 % less than the true error for many windows, particularly for the measurements without the filter or offset function. For retrievals with the filter or offset function, increasing λhigh > 320 nm tended to decrease the reported fit uncertainty but did not increase the accuracy. Based on the results of this study, a short-pass filter and a fitting window of 307.5 < λ < 319 nm are recommended for the retrieval of SO2 SCDs from miniature MAX-DOAS measurements. If a filter is not available or conflicts with other species to be determined (e.g., NO2 or HCHO), the offset function should be enabled, and a fit window 307.5 < λ < 319 nm is still recommended.
- Article
(7522 KB) - Full-text XML
-
Supplement
(1079 KB) - BibTeX
- EndNote


The differential optical absorption spectroscopy (DOAS) technique has been used since its introduction by Brewer et al. (1973), Noxon (1975), Perner et al. (1976), and Platt et al. (1979) to measure atmospheric species with narrowband structures of absorption in the visible and near-UV wavelength region. A major challenge for the successful determination of the trace gases of slant column densities (SCDs) using the DOAS method is the optimization of the retrieval parameters (Platt and Stutz, 2008; Vogel et al., 2013). These parameters depend on the atmospheric composition, measurement conditions, and which DOAS instrument is used. The wavelength range of the retrieval (the “fitting window”) is a key parameter that depends on the differential absorption features of the trace gas in question (Vogel et al., 2013). Retrieval of the differential SCDs (dSCDs) of sulfur dioxide (SO2) from multi-axis DOAS (MAX-DOAS) measurements is challenging in a number of ways, such as the fact that the SO2 absorption features are strongest in the wavelength region where the intensity of solar light becomes relatively small. There are three major regions of photo-absorption by SO2 in the UV range: the very weak absorption in the A band from 340 to 390 nm, the moderately strong B band from 260 to 340 nm, and the strongest C band from 180 to 240 nm. MAX-DOAS spectroscopy commonly uses the SO2 B band in the near UV, which has absorption peaks of increasing strength with decreasing wavelength (Hermans et al., 2009; Xie et al., 2013). Retrievals of SO2 dSCDs in the 300–325 nm range are complicated by the low intensity of scattered sunlight that results in high photon shot noise (Bobrowski et al., 2010). Actinic flux at the surface level of the Earth decreases by several orders of magnitude in the 320–290 nm region due to a steep increase in O3 absorption with decreasing wavelengths (Kreuter and Blumthaler, 2009). O3 differential absorption features can also cause interference in the fit due to the similarity to the SO2 differential absorption features between 315 and 326 nm (Rix et al., 2012). An additional challenge due to the low UV intensity is that stray light in spectrometers can be a significant proportion of the measured signal, causing an underestimation of the true optical density (and dSCD) and reducing fit accuracy (Bobrowski et al., 2010; Kreuter and Blumthaler, 2009). Stray light impacts tend to be severe for the widely used compact spectrometers, such as the instrument from Ocean Optics utilized in this study (Bobrowski et al., 2010).
The optimal fitting window for the retrieval of SO2 column densities from MAX-DOAS spectra must have a lower wavelength (λlow) that is small enough to include strong features of SO2 absorption but large enough to ensure enough solar signal and prevent significant stray light effects. The upper wavelength of the fit range (λhigh) should ensure that the fitting window includes multiple SO2 absorption structures while excluding wavelengths where SO2 absorption features are so weak that degrees of freedom (DOF) are unnecessarily increased, increasing the fitting uncertainty. MAX-DOAS fit windows must be relatively narrow compared with direct sun-viewing applications, as the air mass factors used to convert SCDs to vertical column densities (VCD) differ with wavelength due to scattering (Fioletov et al., 2016). An overly broad fit window also risks the inclusion of strong absorption features from other gases (Vogel et al., 2013) and increased errors due to insufficient correction of the broadband terms (Marquard et al., 2000; Pukite et al., 2010). However, an overly narrow fit window can lead to cross-correlation between the reference absorption cross sections (Vogel et al., 2013). Inclusion of upper wavelengths with weak SO2 in the fit can improve the fit results by allowing a better distinction between SO2 absorption features and other fit components (e.g., O3 absorption features and Ring spectrum).
A further complication is that for measurements of very large column densities of SO2 (e.g., from volcanic studies), the optimal wavelength window may be present at higher wavelengths where SO2 absorption features are weaker (Bobrowski et al., 2010). High optical densities below 320 nm from large column densities can cause nonlinearities in the relationship between the column density and the measured optical density in the fit. This phenomenon occurs for large (actual) optical densities if the cross section in the fit was not recorded with the same spectrometer as the measurements, which is common, and the instrument's spectral resolution is too low to completely resolve the absorption bands (Kern, 2009; Platt and Stutz, 2008). Large column densities of SO2 result in optical densities in the B band that can exceed unity, violating the assumption in the standard DOAS retrieval of weak absorption with optical depths of less than ∼0.1 (Bobrowski et al., 2010; Bobrowski and Platt, 2007; Fickel and Delgado Granados, 2017; Kern, 2009; Platt and Stutz, 2008). Compact spectrometers typically have an insufficient spectral resolution for the optical density of the SO2 absorption bands to be proportional after convolution for large column densities (Bobrowski et al., 2010; Platt and Stutz, 2008). Consequently, the true column density can be underestimated because the differential absorption line depths from the standard DOAS convolution approximation can be greater than mathematically correct convolution (Bobrowski et al., 2010; Kern, 2009; Yang et al., 2007). Underestimation has been shown to increase with decreasing wavelength from 320 to 300 nm and increasing column density of SO2 (Kern, 2009). This effect is important for volcanic plume studies and in the most polluted urban and industrial environments
Despite the importance of using an optimal fitting window, various windows have been used to retrieve MAX-DOAS SO2 SCDs in the literature, and few studies have attempted to assess the impact of the window's wavelength range on the SO2 SCDs (Vogel et al., 2013). Fitting windows in previous MAX-DOAS studies include 305–317.5 nm (Tan et al., 2018), 307.5–328 nm (Schreier et al., 2015), 307.6–325 nm (Jin et al., 2016), 307.8–330 nm (Wang et al., 2017), 310–320 (Irie et al., 2011), and 307.5 to 315.0 nm (Bobrowski and Platt, 2007). Salerno et al. (2009) examined the sensitivity of SO2 SCDs to the fitting window in the 300–320 nm region using calibration cells of SO2 of 3.2×10¹⁷ and 8.5×10¹⁷ molec. cm−2. An optimal fitting window of 306.7–314.7 nm was determined based on the smallest SCD errors by varying the wavelengths of the fit window. However, the variations of the lower and upper window limits were only conducted for a single fixed upper limit and lower limit, respectively. Moreover, as the column densities were relatively large, which is more representative of volcanic plumes, the determined fitting window may not be ideal for the smaller SO2 column densities often observed in urban studies. Fickel and Delgado Granados (2017) observed a high dependence of SO2 SCDs from measurements of a volcanic plume on the fitting window, particularly for large column densities. The authors suggested using different fitting windows for different column densities: 310–322 nm for SO2 column densities < 1017 molec. cm−2, 322–334 nm for column densities > 1018 molec. cm−2, and 314.7–326.7 nm for intermediate column densities. A modelling study by Bobrowski et al. (2010) suggested using fitting windows in the higher 360–390 nm range for column densities on the order of 1019 molec. cm−2 because the SO2 absorption features are much weaker. Therefore, DOAS retrievals of SO2 from instruments that observe a wide range of column densities can switch fitting windows depending on the magnitude of the retrieved SCDs. For example, TROPOMI satellite retrievals of SO2 use 312–326 nm as a baseline window but use 325–335 nm for SO2 SCDs > 4×10¹⁷ molec. cm−2 and 360–390 nm for SCDs > 6.7×10¹⁸ molec. cm−2 (Theys et al., 2017).
In this study, MAX-DOAS measurements of two different calibration gas cells with column densities of SO2 representative of polluted urban conditions were conducted to examine the variation in the retrieved SO2 dSCDs with (1) different fitting windows, (2) different viewing elevation angles (α), (3) the use of a 400 nm short-pass filter, and (4) the offset function enabled.
The miniature MAX-DOAS instrument (Hoffmann Messtechnik GmbH model no. 16127) consisted of a sealed metal box with a UV fibre-coupled spectrometer and all of the electronics inside. Incident scattered sunlight received by the cylindrical black telescope in front of the entrance optics is focused into the quartz fibre by a cylindrical quartz lens with a focal length of 40 mm. The MAX-DOAS instrument used a relatively low-cost and commonly employed compact spectrometer, an Ocean Optics USB2000 spectrograph. The spectrometer has a 50 µm wide entrance slit and a Sony ILX511 linear silicon charge-coupled device (CCD) array detector (2048 pixels, with a pixel size of 14 µm ×200 µm; signal-to-noise ratio at full signal is 250:1). The spectral range of the spectrometer is 290–433 nm, with a resolution of ∼0.7 nm full width at half maximum (FWHM) in the fitting range used. A Peltier stage cooled the spectrograph to maintain the chosen temperature of 5 ∘C. A stepper motor mounted underneath allowed the instrument to point at different α above the horizon. The instrument was connected to a laptop via USB to transfer spectrometric data and allow automated measurements using JScript programs using the DOASIS software package.
MAX-DOAS spectra of scattered solar light were recorded with an SO2 calibration gas cell (Resonance Ltd.) inserted in the light path (in the telescope tube). The two cylindrical gas cells with a 22 mm diameter and 14.13 mm thickness had calibrated slant column densities (SCDs) of 2.2×10¹⁷ molec. cm−2 (higher) and 2.2×10¹⁶ (lower) (±10 %) molec. cm−2 respectively. Active DOAS measurements of the SO2 gas cells confirmed the SCDs. These SCDs would be equivalent to an air mass with SO2 mixing ratios of 41 and 4 ppb, respectively, for an measurement within a homogeneous boundary layer of 1 km, assuming the measurement was fit against a zenith-pointing reference spectrum observing outside of the SO2-polluted zone, calculated using Eq. (2) in Davis et al. (2019). For each cell, spectra were recorded around solar noon in September in Toronto (43.773∘ N, −79.506∘ W), Ontario, between 12:53 and 13:26 LT (local time) at α=90, 30, 15, 8, 4, and 2∘ above the horizon, followed by a 90∘ measurement without the gas cell. This second zenith measurement was used as the Fraunhofer reference spectrum (FRS) in the fit. The time between the 2 and 90∘ measurements in one sequence (both containing the SO2 cell) was less than 13 min. The FRS were obtained less than 35 min after the beginning of the respective sequence of cell measurements. Each recorded spectrum was the average of 1000 spectra with an integration time of ∼115 ms. The experiment was repeated for both gas cells by placing a 400 nm short-pass filter (Edmund Optics TECHSPEC® OD 2 no. 47-285) within the telescope between the MAX-DOAS lens and the SO2 gas cell. The fused silica filter had a thickness of 3 mm, a cut-off wavelength of 400 nm, and a transmission wavelength range of 250–385 nm. The blocking optical density was ≥2.0, and the transmission was > 85 % in the transmission range. Spectra collected using the filter were fit against a FRS collected by measuring a 90∘ spectrum without a gas cell but including the filter.
Trace gas differential slant column densities (dSCDs) were obtained using the DOAS method (Platt and Stutz, 2008) with the DOASIS software (Institute of Environmental Physics, Heidelberg University, 2009). All spectra were corrected for dark current and electronic offset and were wavelength calibrated using measurements of a mercury (Hg) lamp. A Fraunhofer reference spectrum (FRS), a Ring spectrum, a third-order polynomial, and absorption cross sections of SO2 at 293 K and O3 at 293 and 223 K were included in all fits (Bogumil et al., 2003). The shift and squeeze terms were allowed for the fit components with the Ring spectrum terms linked to the FRS terms and the O3 cross section terms linked to the SO2 cross section terms (shift limited to −0.2 to 0.2 nm). The shift and squeeze terms are included in the DOAS analyses to compensate for wavelength shifts due to instrumental instabilities, such as temperature changes during measurements altering the pixel-to-wavelength calibration (Lampel et al., 2017; Stutz and Platt, 1996). In the case of the FRS, the shift and squeeze terms also compensate for the “tilt effect” that increases fit residuals by artificially shifting the spectral positions of Fraunhofer and molecular absorptions lines between the measurement and reference spectra that have different viewing elevation angles (Lampel et al., 2017). The tilt effect arises because atmospheric modification of the spectral structures in the spectrum occurs before convolution with the instrument slit function, and the modifications are noncommutative but are applied in the reverse order by the analysis procedure (Lampel et al., 2017). The cross sections were obtained from the MPI-MAINZ UV/VIS Spectral Atlas of Gaseous Molecules of Atmospheric Interest (Keller-Rudek et al., 2013). The reported uncertainty in the SO2 absorption cross section is ∼3 % (Bogumil et al., 2003). DOASIS fits dSCDs using an iterative algorithm based on the Levenberg–Marquardt method that finds the optimal solution by minimizing a cost function. The cost function includes the deviation between the measured spectrum and the spectrum modelled using the components included in the fit. Details on the DOASIS fitting algorithm can be found in Kraus (2006). The SO2 dSCDs were fit in DOASIS with varying fitting windows using λlow=303–318 and λhigh=310–340 nm in ∼0.2 nm increments. The “retrieval interval mapping” technique (Vogel et al., 2013) was used to visualize and systematically evaluate the variations in the SO2 dSCDs. The dSCDs are displayed as contour plots where λlow and λhigh are the first and second dimensions, and the dSCDs are denoted using a colour scale.
For each calibration gas cell (higher and lower), four scenarios were fit: (i) the base case “B” with no filter and no offset function, (ii) no filter with the offset function enabled “B+O”, (iii) with the filter and offset disabled “B+F”, and (iv) with both the filter and offset enabled “B+ F+O”. SO2 dSCDs were considered “accurate” if they were within ±10 % of the higher calibration cell value and ±50 % of the lower calibration cell value, 2.2×10¹⁷ and 2.2×10¹⁶ molec. cm−2, respectively. The background SO2 in the atmosphere in Toronto was assumed to be negligible (< 1 ppb) because there are currently no significant sources in Toronto (ECCC, 2018). A few industrial sources of < 1600 t yr−1 of SO2 were present south-west of Toronto (ECCC, 2018), but the measurements were conducted under north-easterly wind conditions. Typical hourly average mixing ratios of SO2 in northern Toronto are < 0.5 ppb (Ontario Ministry of the Environment, 2019).
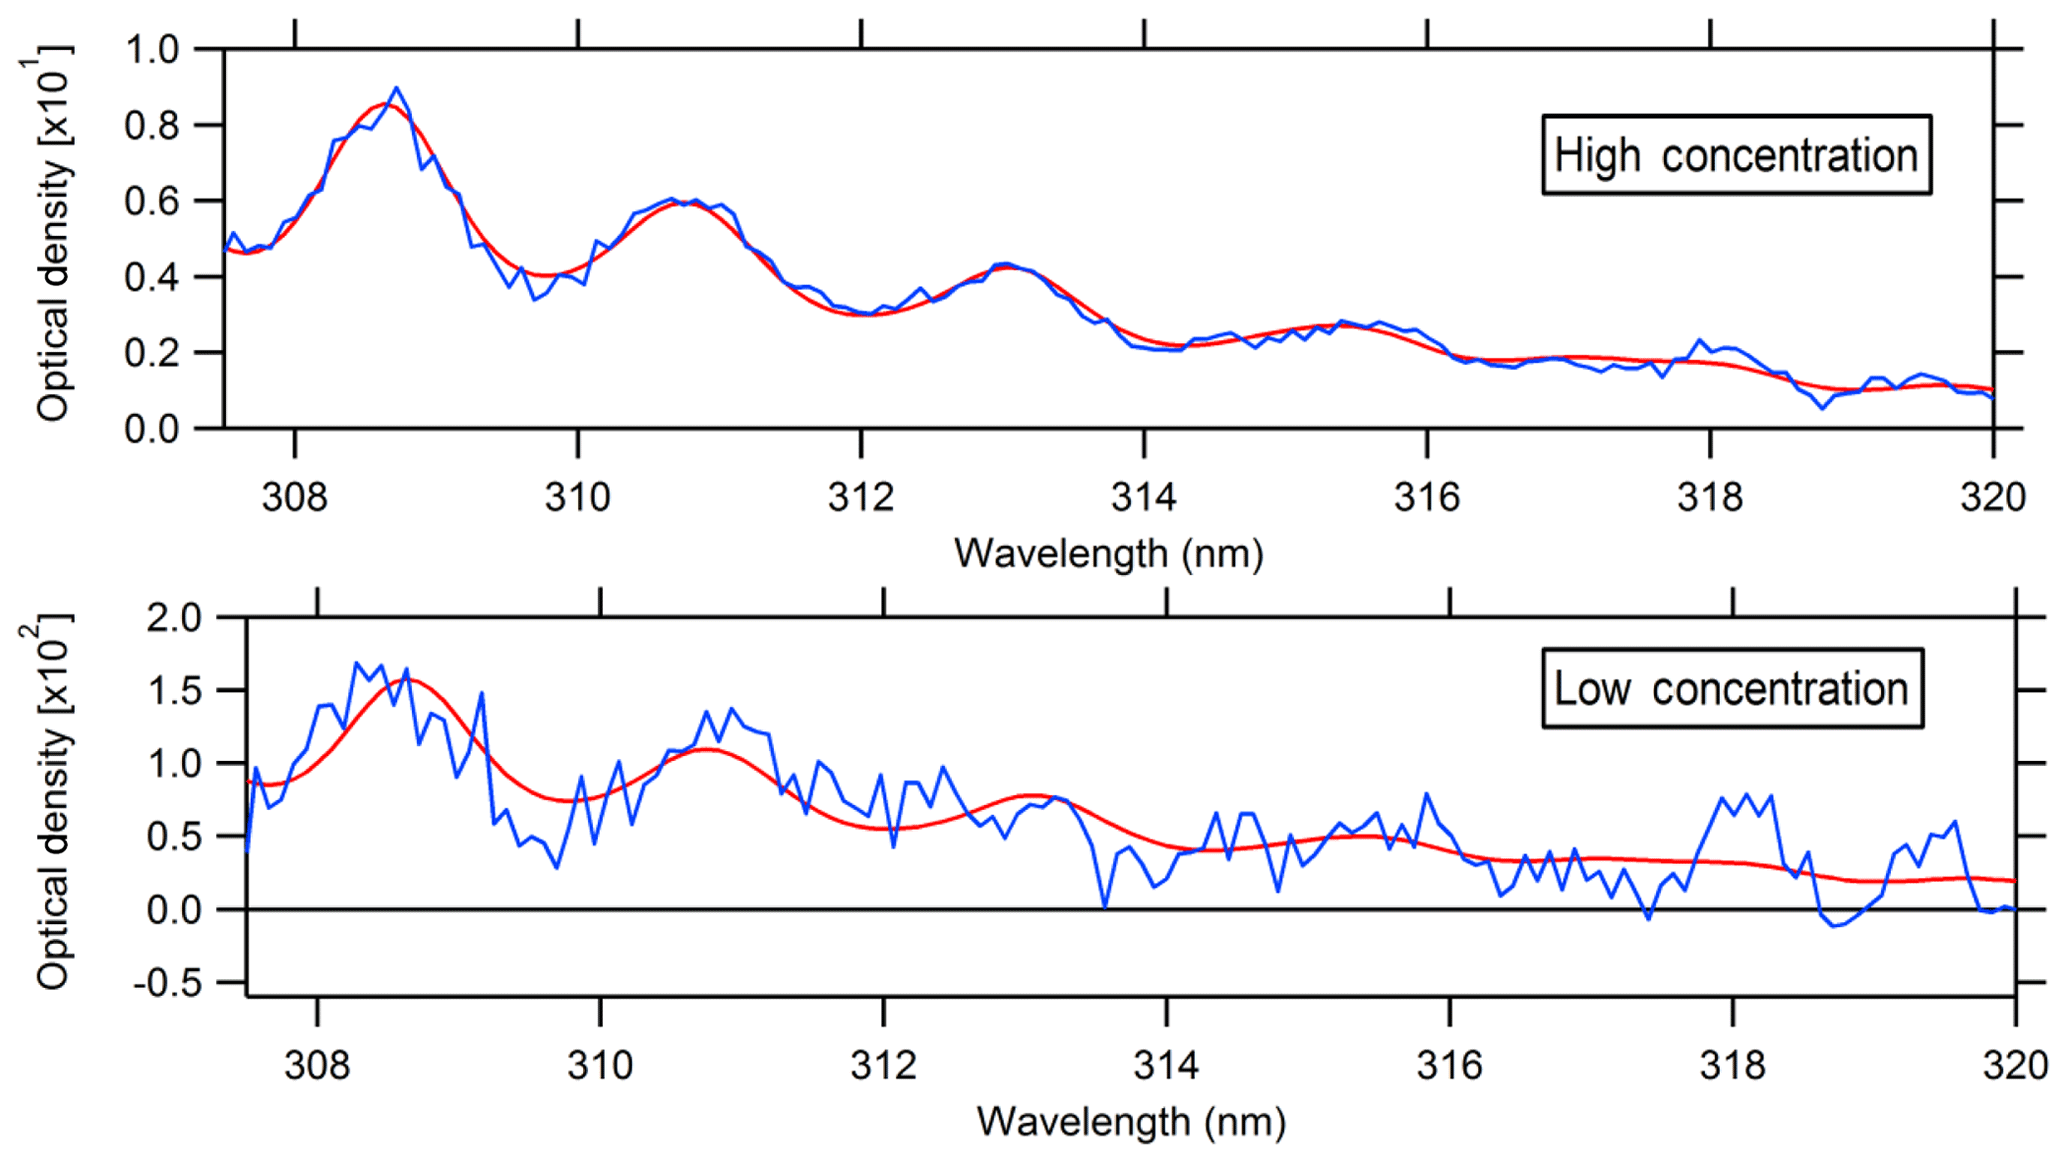
Figure 1Examples of spectral retrievals of SO2 from the base case (no filter and the offset function disabled) from spectra measured at a 2∘ viewing elevation angle using the 307.5–320 nm fitting window. Retrieved dSCDs were 2.23(±0.08)×1017 and 4.10(±0.66)×1016 molec. cm−2 for the higher and lower concentration measurements, respectively.
Examples of spectral retrievals of SO2 from the spectrum in the base case (no filter and the offset function disabled) are shown in Fig. 1.
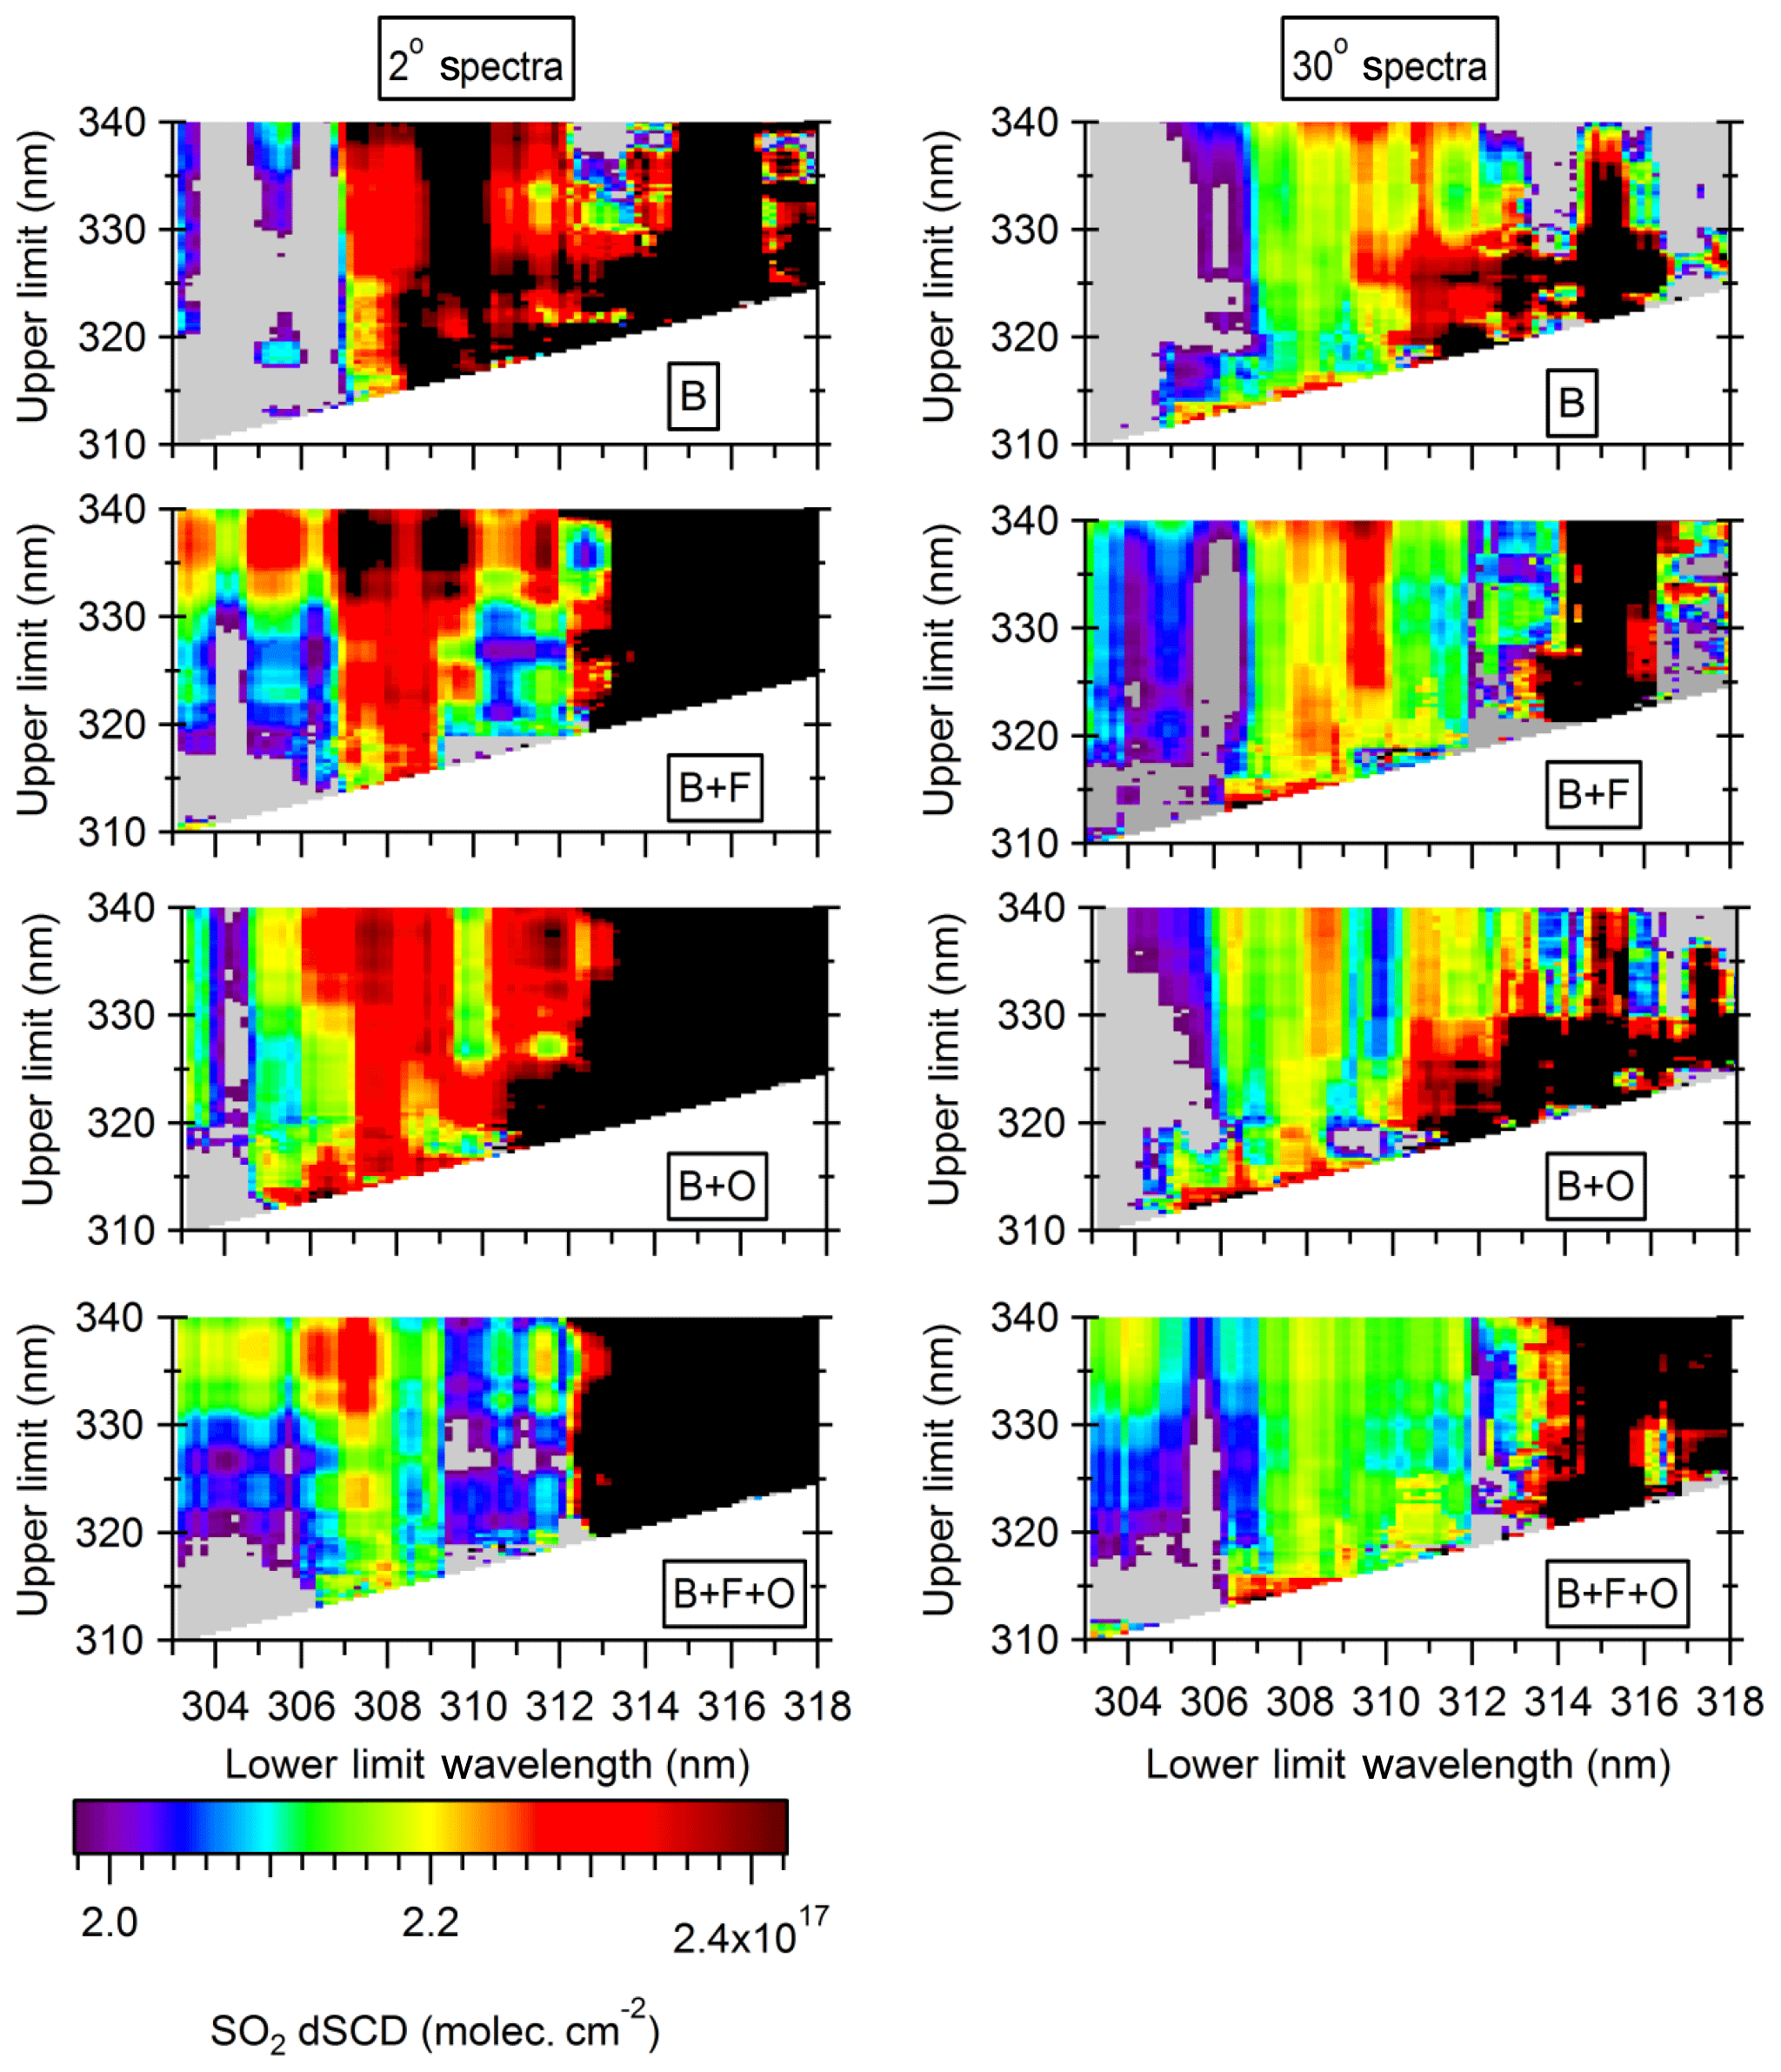
Figure 2The SO2 dSCDs' fit from higher concentration measurements at 2∘ (left column) and 30∘ (right column) elevation angles for the base case, B; with the offset, B+O; with the filter, B+F; and with the filter and offset, B+F+O. Grey and black areas indicate that dSCDs were > 10 % less and > 10 % more than the expected value, respectively. The true value of the cell is 2.2×10¹⁷ molec. cm−2 (yellow).
3.1 Higher concentration reference cell
The SO2 dSCDs' fit from the α=2 and measurements using the higher concentration cell are shown in Fig. 2 with varying fitting windows for the four scenarios. The deviations of the SO2 dSCDs from the expected value of 2.2×10¹⁷ molec. cm−2 (fit errors) are shown in Fig. 3, where the purple and green colours indicate under- and overestimation, respectively. Grey and black areas indicate that the dSCD under- and overestimated the expected value by more than 8×10¹⁶ molec. cm−2, respectively. For the base case, the windows with λlow < 307 nm (“low wavelengths”) underestimated the expected SO2 dSCD, as indicated by the grey areas in Fig. 2 (B) and the purple areas in Fig. 3 (B). The addition of the short-pass filter increased the accuracy of the SO2 dSCDs for most windows, especially in the low wavelengths (Figs. 2, 3; B+F). These results suggest that stray light originating from wavelengths > 400 nm increased the underestimation of SO2 dSCDs at low wavelengths. Stray light is a well-known source of interference in spectroscopic measurements that reduces accuracy and can obscure weak spectral lines (Kristensson et al., 2014). Ideally, a spectrometer's detector receives only light with the correct spectral bandwidth window at each pixel (Lindon et al., 2000). Stray light is additional light of an incorrect wavelength that enhances the background signal in ways that can vary across the spectral range (Kristensson et al., 2014). Sources of stray light include imperfections in the diffraction grating, leakage of light into the instrument, and scattering off mirrors and dust inside the instrument (Lindon et al., 2000). Stray light results in apparent negative deviations from Beer's law (Choudhury and Prayagi, 2015), causing an underestimation of the retrieved SO2 dSCD by “filling in” the measured intensity reduced by SO2 absorption features and an underestimation of the real optical density (Bobrowski et al., 2010). Stray light has an enhanced effect at low wavelengths because of the low measured signal and sensitivity near the lower end of the actinic spectral range (Choudhury and Prayagi, 2015). Many fitting windows with λlow < 307 and λhigh < 320 nm still underestimated the SO2 dSCD even with the filter (Fig. 2; B+F). The remaining underestimation is likely due to stray light originating from < 400 nm and the effects of nonlinearity between the column density and measured optical density because of the relatively large differential optical densities of SO2 of > 0.08 in the regions of strong absorption below 307 nm (Fig. 1; Kern, 2009; Platt and Stutz, 2008). See Fig. 3.21 in Kern (2009) for the percentages of underestimation by the retrieved column density of the actual column densities (1×10¹⁷ to 1×10¹⁹ SO2 molec. cm−2) for windows in the 300–320 nm region and a spectrometer with similar spectral resolution (0.8 nm). Enabling the offset function increased the accuracy of the SO2 dSCDs of many windows compared with the base case (Figs. 2, 3; B+O). The offset function resulted in slightly more windows with accurate dSCDs than the filter for windows with λlow < 311 nm because the offset function attempts to compensate for all the stray light, not just the stray light originating from > 400 nm (Fig. 2; B+F and B+O). The use of both the offset function and the filter slightly improved the dSCD accuracy for a few windows compared with the filter or offset function alone, mostly for windows with large λhigh, > 324 nm (Fig. 2; B+F+O).
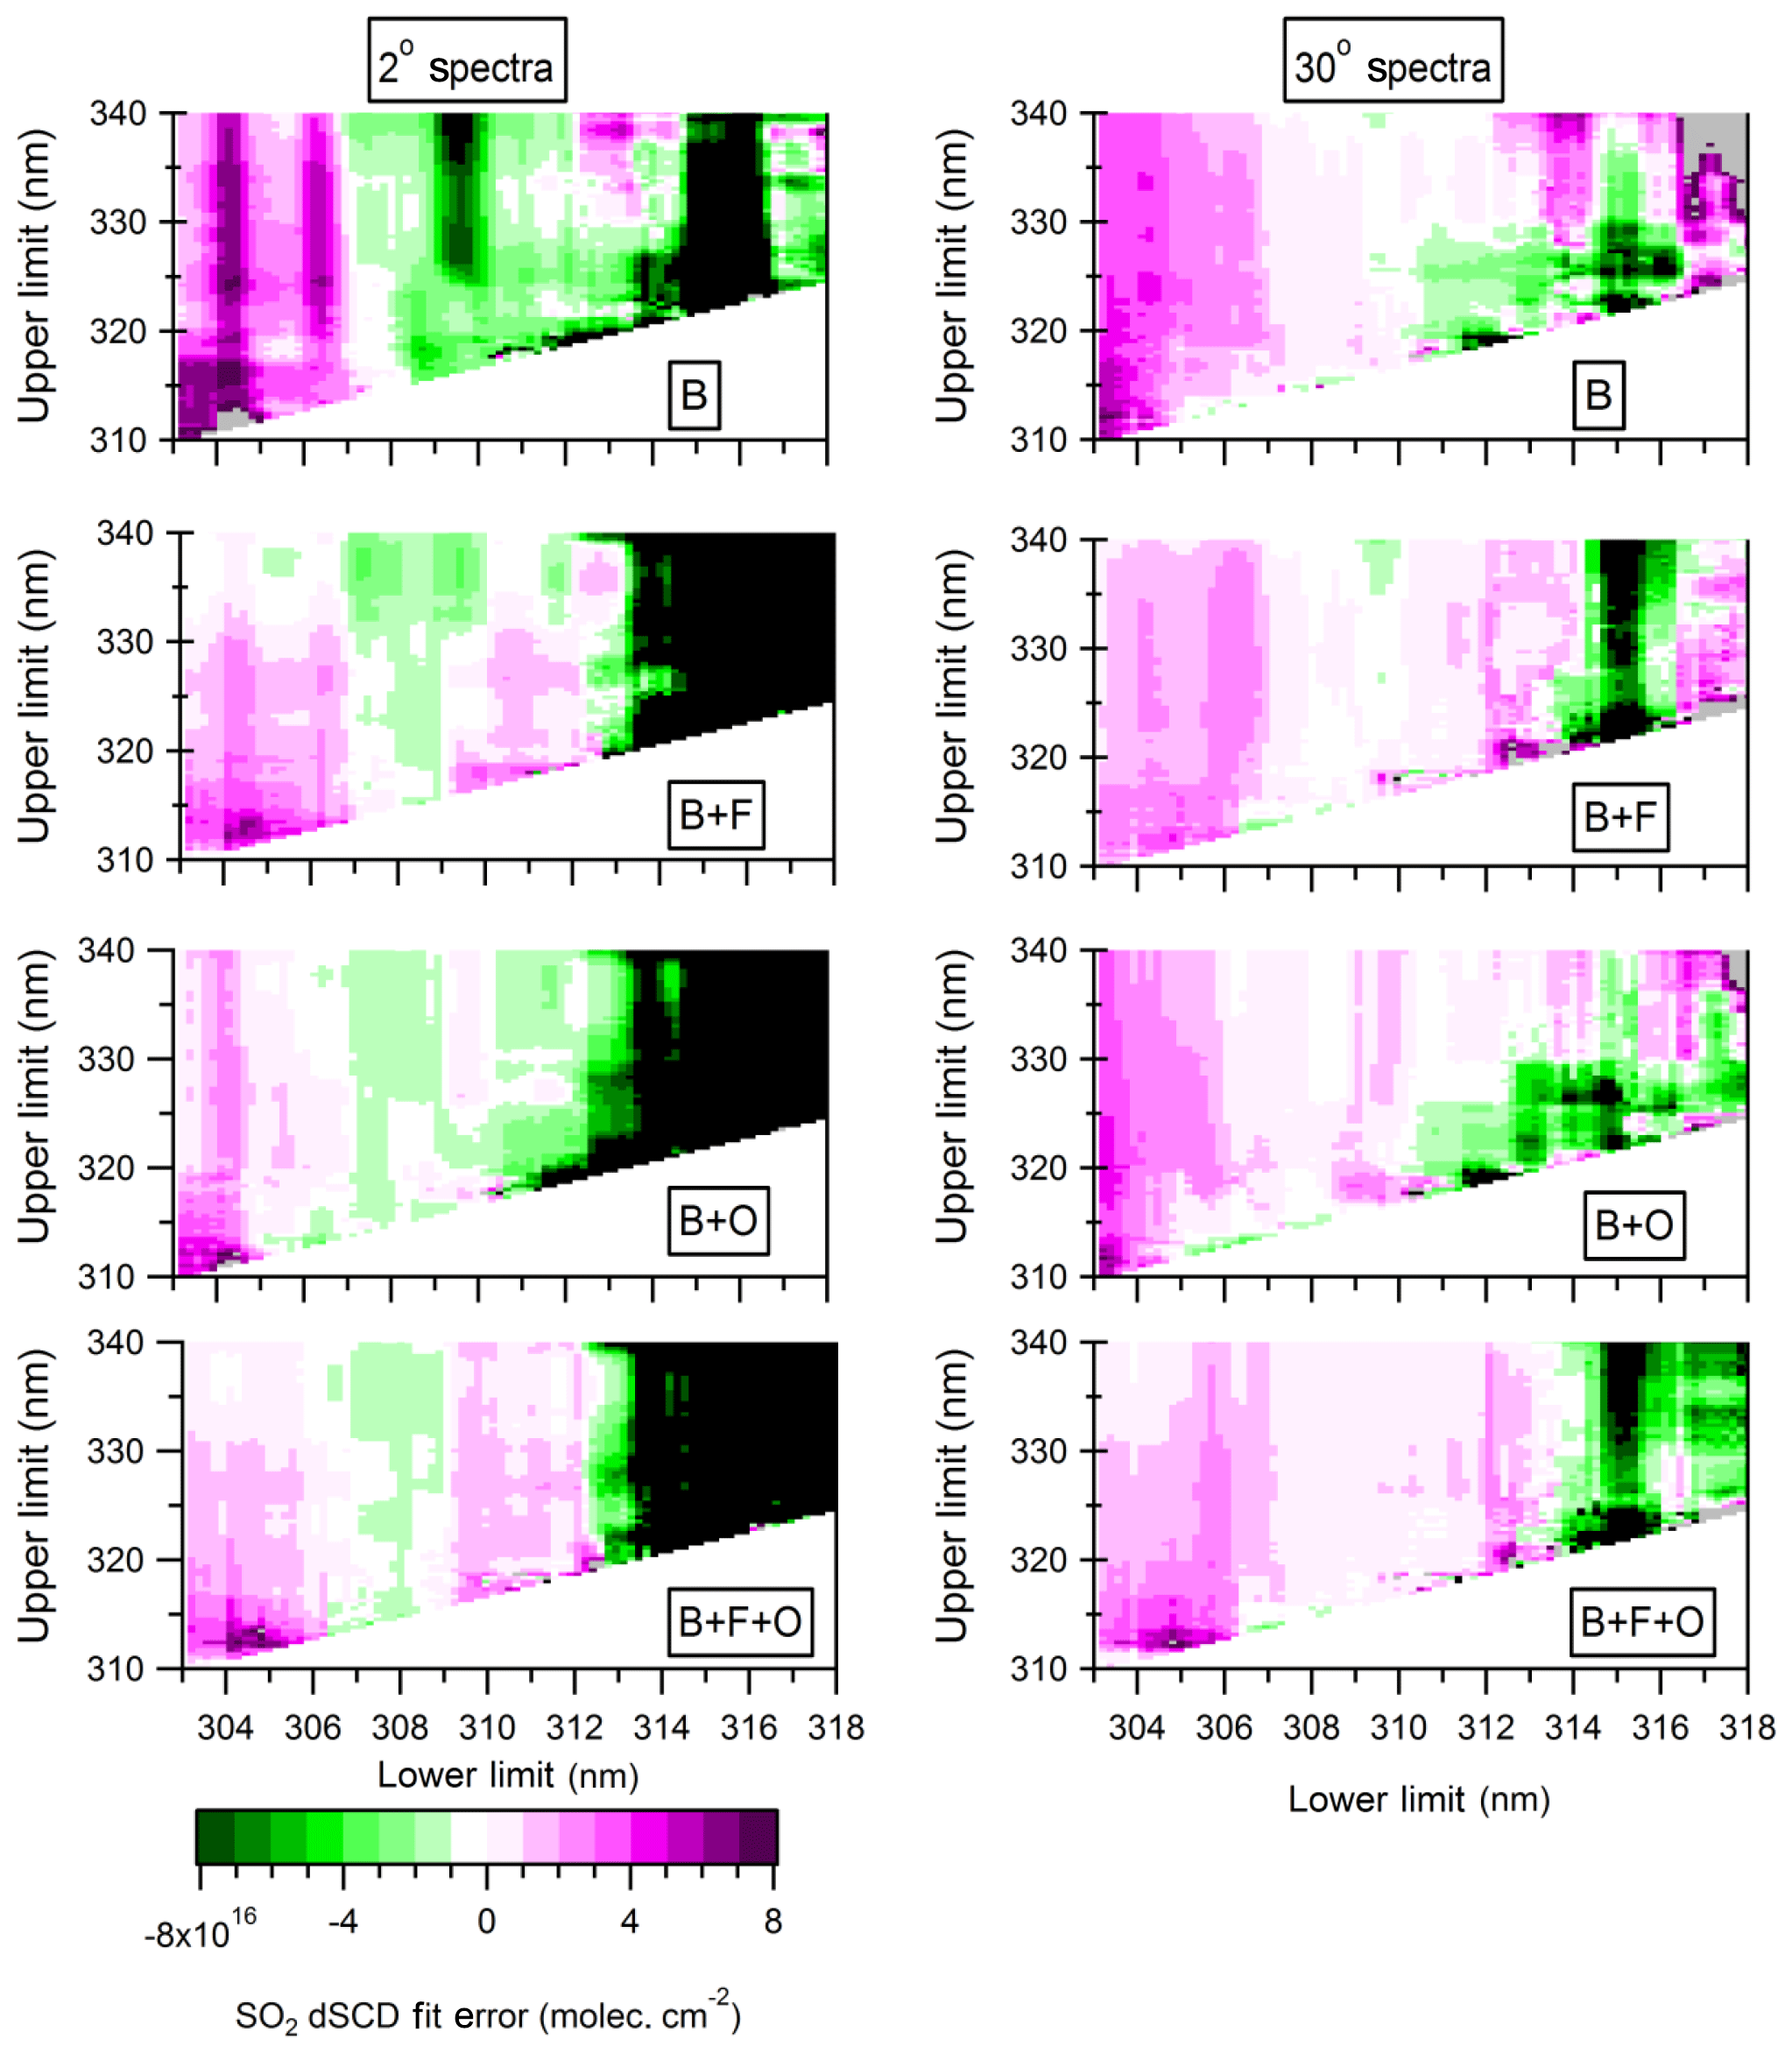
Figure 3Higher concentration fit errors (deviations of SO2 dSCDs from the expected value of 2.2×10¹⁷ molec. cm−2) from the measurements at 2∘ (left column) and 30∘ (right column) elevation angles for the base case, B; with the offset, B+O; with the filter, B+F; and with the filter and offset, B+F+O. Purple and green areas indicate under- and overestimation of the expected value, respectively. Black and grey areas indicate dSCDs over- and underestimated by more than 8.0×10¹⁶ molec. cm−2, respectively.
Fitting windows produced more accurate SO2 dSCDs from spectra measured at higher α (90 and 30∘) compared with the lowest α (2 and 4∘) in the base case (B in Figs. 2 and 3, and S1 in the Supplement). Windows with λlow < 307 nm underestimated SO2 dSCDs more from the 2∘ than from the 30∘ measurements (B in Fig. 3). The spectra collected at higher α are expected to produce more accurate SO2 dSCDs because of the greater UV signal intensity (Fig. 4). The impact of stray light on fits from the lower angle spectra is further increased because the visible light intensity, which is a potential source of stray light, is the same or higher than for measurements at higher α (Fig. 4). The difference in the accuracy of SO2 dSCDs between low and high α spectra decreased with the use of the filter or the offset function (Figs. 2, 3), which was an expected result.
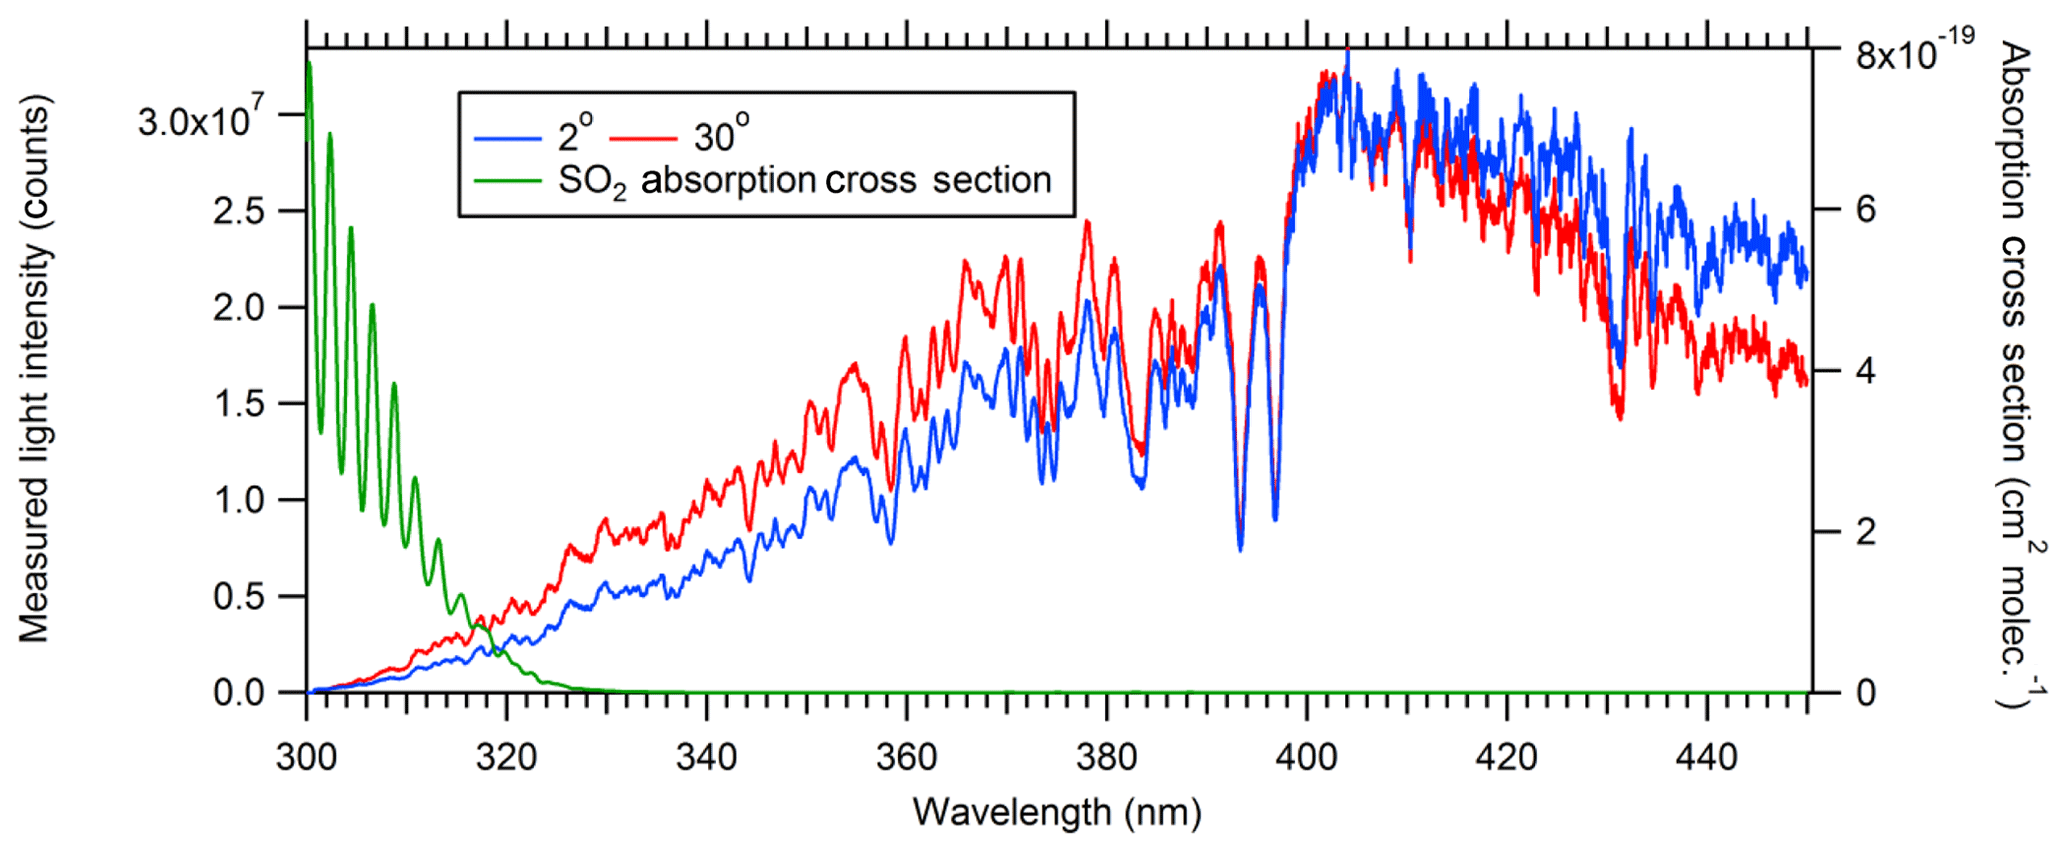
Figure 4Comparison of the measured spectral intensity for the 2 and 30∘ viewing elevation angle spectra with the lower concentration cell without the short-pass filter, and the absorption cross section of SO2 smoothed to the spectral resolution of the instrument.
Fitting windows with λlow > 312 nm often overestimated the SO2 dSCDs for all scenarios, as indicated by the green and black areas in Fig. 3, probably because the SO2 absorption features become relatively weak (Fig. 4). Fickel and Delgado Granados (2017) proposed the use of the higher wavelength fitting window of 314.7–326.7 rather than 310–322 nm for SO2 column densities between 1017 and 1018 molec. cm−2. In contrast, the results of this study found that SO2 dSCDs from the higher range were less accurate than those from the lower range. The threshold for using fitting windows with higher wavelengths due to large optical densities may be greater than 1017 molec. cm−2.
The SO2 dSCDs exhibited a dependence on the features of the SO2 absorption cross section for λlow < 307 nm for the base case (B in Figs. 2 and 3) that will be discussed in Sect. 3.3.
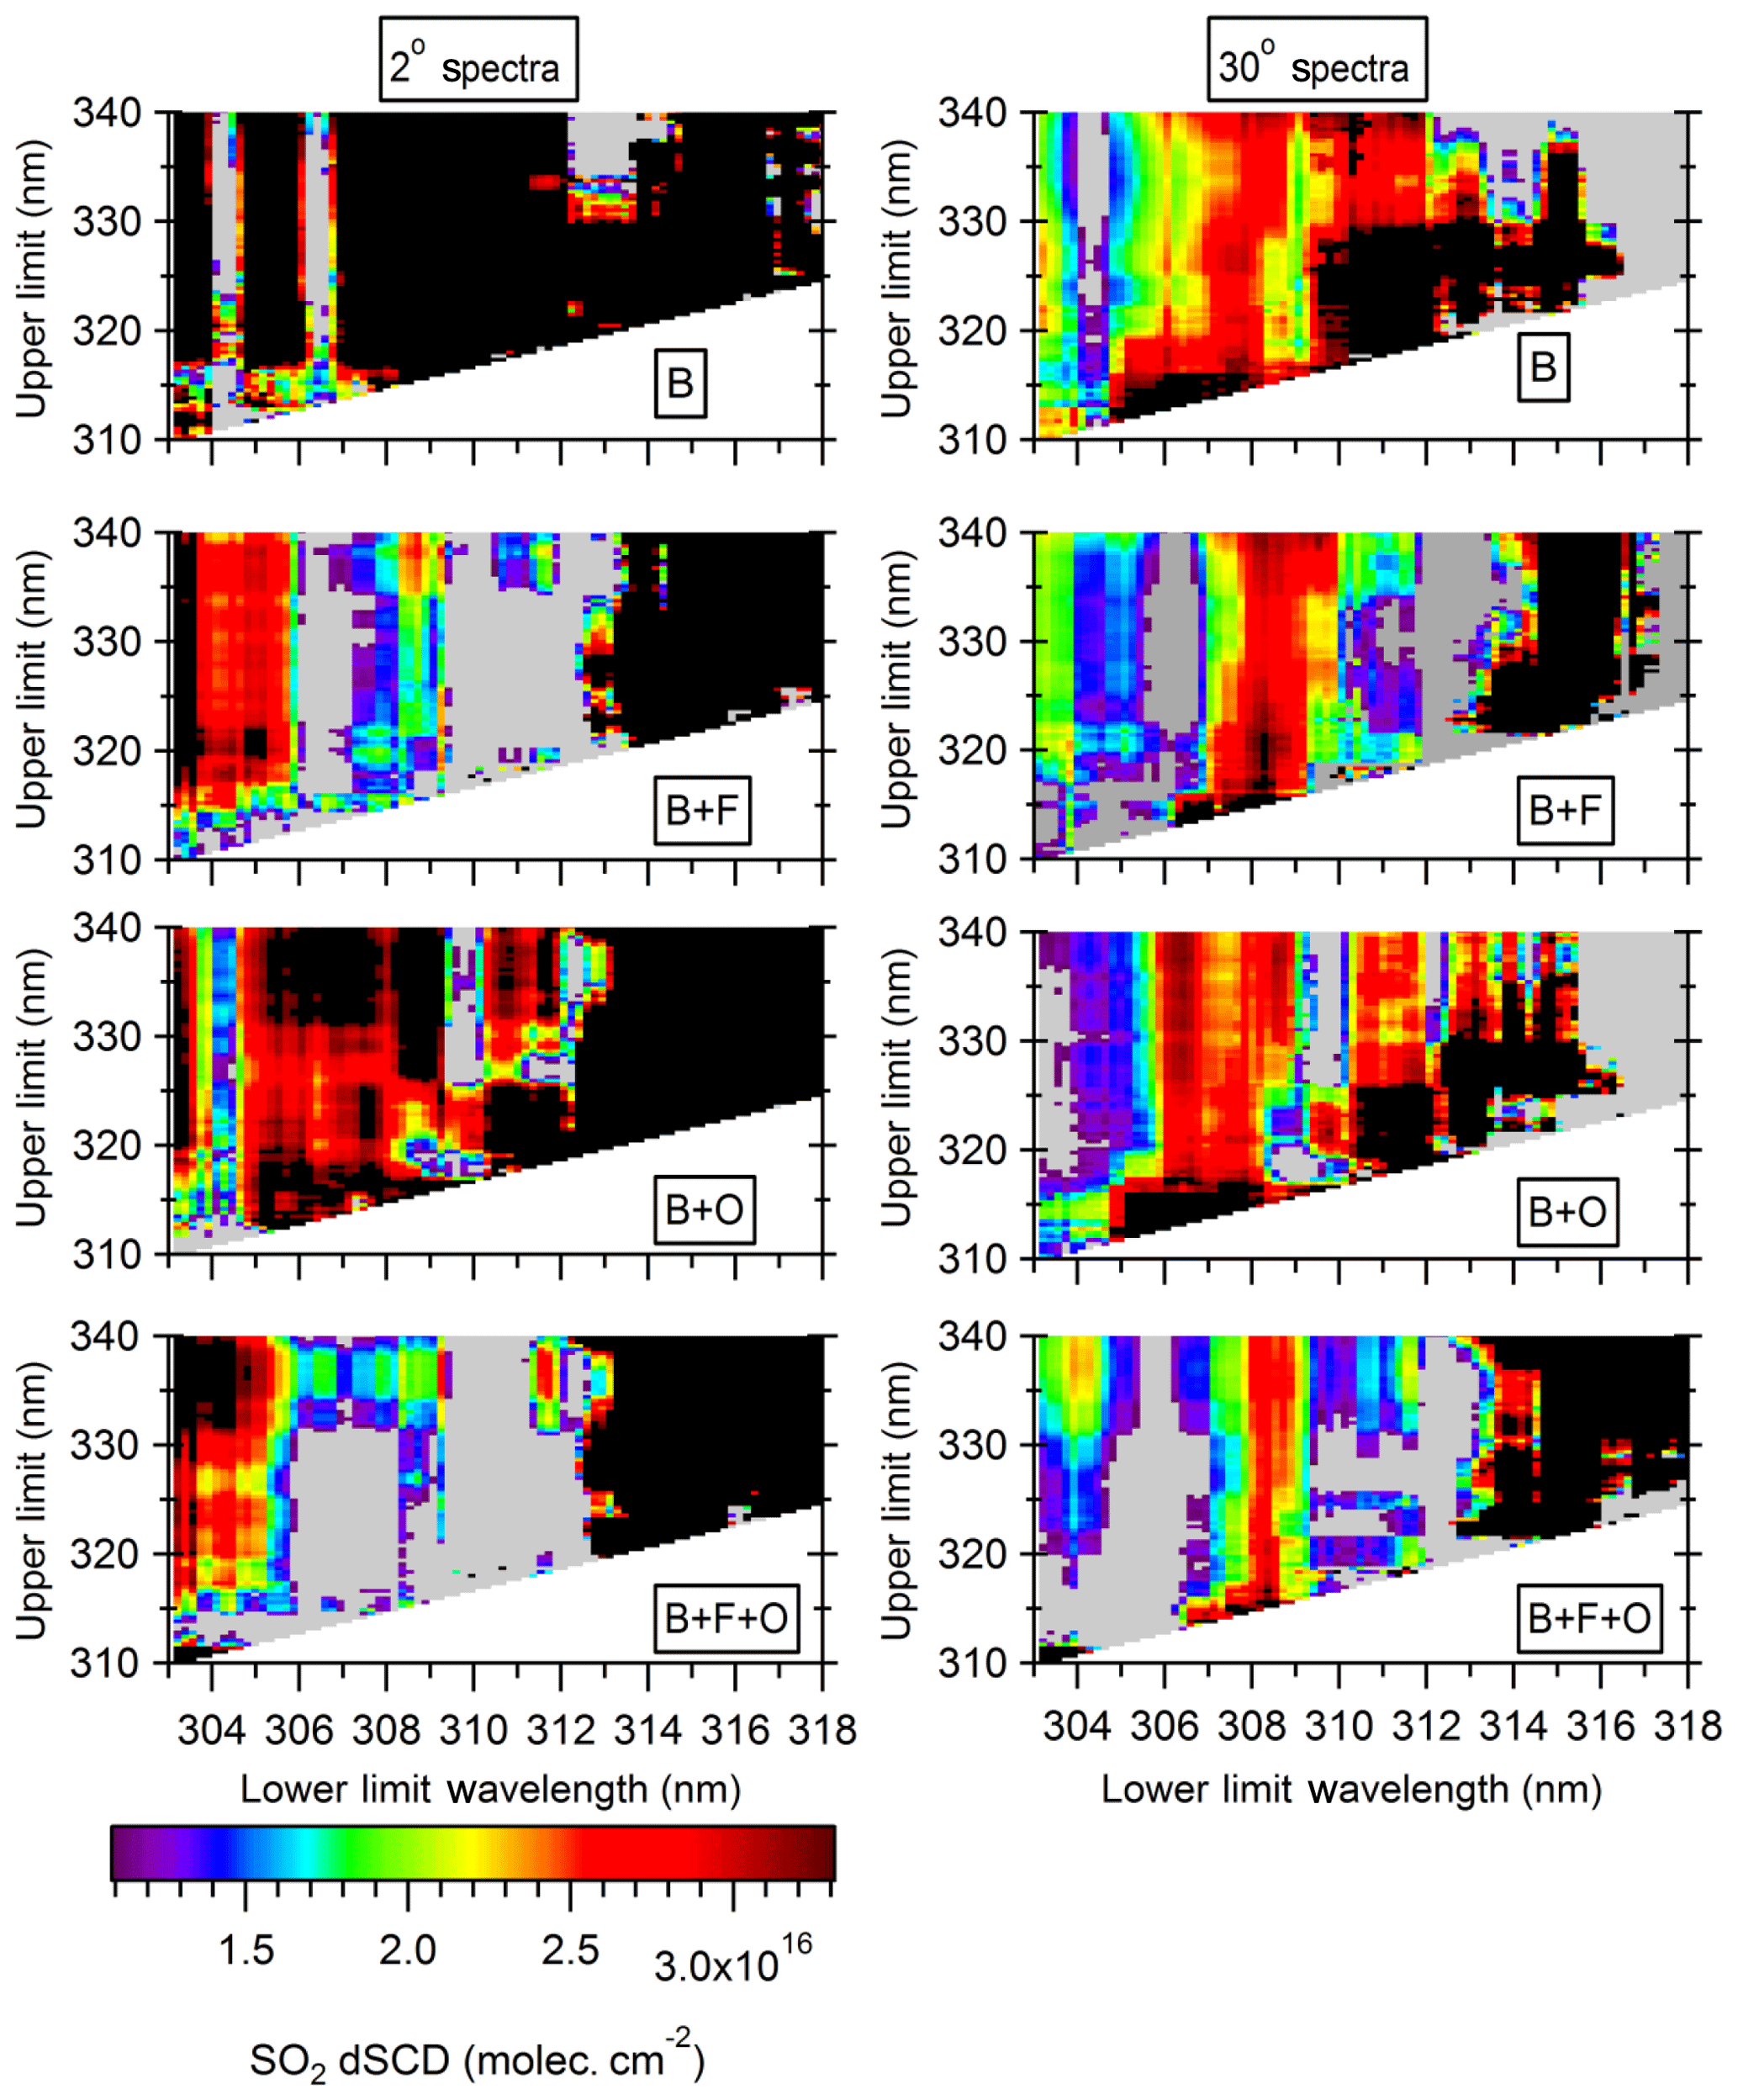
Figure 5SO2 dSCDs' fit from the lower concentration measurements at 2∘ (left column) and 30∘ (right column) elevation angles for the base case, B; with the offset, B+O; with the filter, B+F; and with the filter and offset, B+F+O. Grey and black areas indicate dSCDs that were < 50 % less and > 50 % more than the expected value, respectively. The true value of the higher concentration cell is 2.2×10¹⁶ molec. cm−2 (yellow).
3.2 Lower concentration reference cell
Figures 5 and 6 show the SO2 dSCDs and their deviations from the expected value (fit error), respectively, for the lower concentration measurements for all the scenarios. Purple and green areas in Fig. 6 indicate dSCDs were under- and overestimated, respectively. Black and grey areas indicate dSCDs that were over- and underestimated by more than 2.0×10¹⁶ molec. cm−2, respectively. The SO2 dSCDs from the base case exhibited a dependence on the SO2 absorption that will be discussed in Sect. 3.3. In the base case, the lower concentration measurements had fewer windows that produced accurate SO2 dSCDs compared with the higher concentration measurements (B in Figs. 2 and 5). Most of the fitting windows produced SO2 dSCDs that were > 100 % over- or underestimated for the lower concentration 2∘ spectrum (B in Figs. 5 and 6, and S1). In contrast, the lower concentration 90∘ measurement exhibited accurate SO2 dSCDs for all fitting windows with λlow < 311 nm (Fig. S1). This difference highlights that measurements at lower α experience greater inaccuracies from the reduced solar intensity and greater impact of stray light. While the higher concentration dSCDs from the 2∘ measurements were consistently underestimated for windows with λlow < 307 nm, the lower concentration measurements often overestimated the dSCDs (B in Figs. 5 and 6). This overestimation in spite of the influence of stray light could be due to interference from O3, as the similarity between the absorption features of SO2 and O3 can introduce instability in the retrieval (Kraus, 2006; Rix et al., 2012). The deviation of the dSCD from the true value can depend on the SO2 concentration rather than exhibiting a consistent bias for a fitting window. The use of the filter or offset function increased the accuracy of the SO2 dSCDs for most windows for spectra measured at angles (Figs. 3, 6; B+F and B+O). The improved accuracy due to the filter indicates that stray light originating from wavelengths > 400 nm significantly decreased the accuracy of the SO2 dSCDs for fitting windows at both lower and higher wavelengths. Unexpectedly, the use of both the filter and offset function for the 30∘ measurement reduced the accuracy of the SO2 dSCDs compared with the base case for some windows with λlow < 307 and λhigh < 320 nm (Fig. 6; B+F+O). As the stray light to signal ratio is expected to be lower for the higher elevation measurements, and the filter already reduced the stray light, the offset function may have incorrectly estimated the relatively small amount of remaining stray light at some wavelengths. The offset function may have added unnecessary freedom to the fit, increasing instability and inaccuracy in the dSCD. Moreover, the offset function compensates for stray light by assuming the stray light is proportional to the measured intensity (see Eqs. 11–12 in Supplement). If light from wavelengths outside the fitting window contributes to stray light, this assumption is invalid, and the offset function may increase uncertainty in the fit. The short-pass filter may be the preferred method of reducing the impact of stray light compared with the offset function because the filter directly addresses rather than modelling the source of the problem. However, the problems from using both the filter and offset function can be mitigated by using a fitting window with λlow > 307 nm.
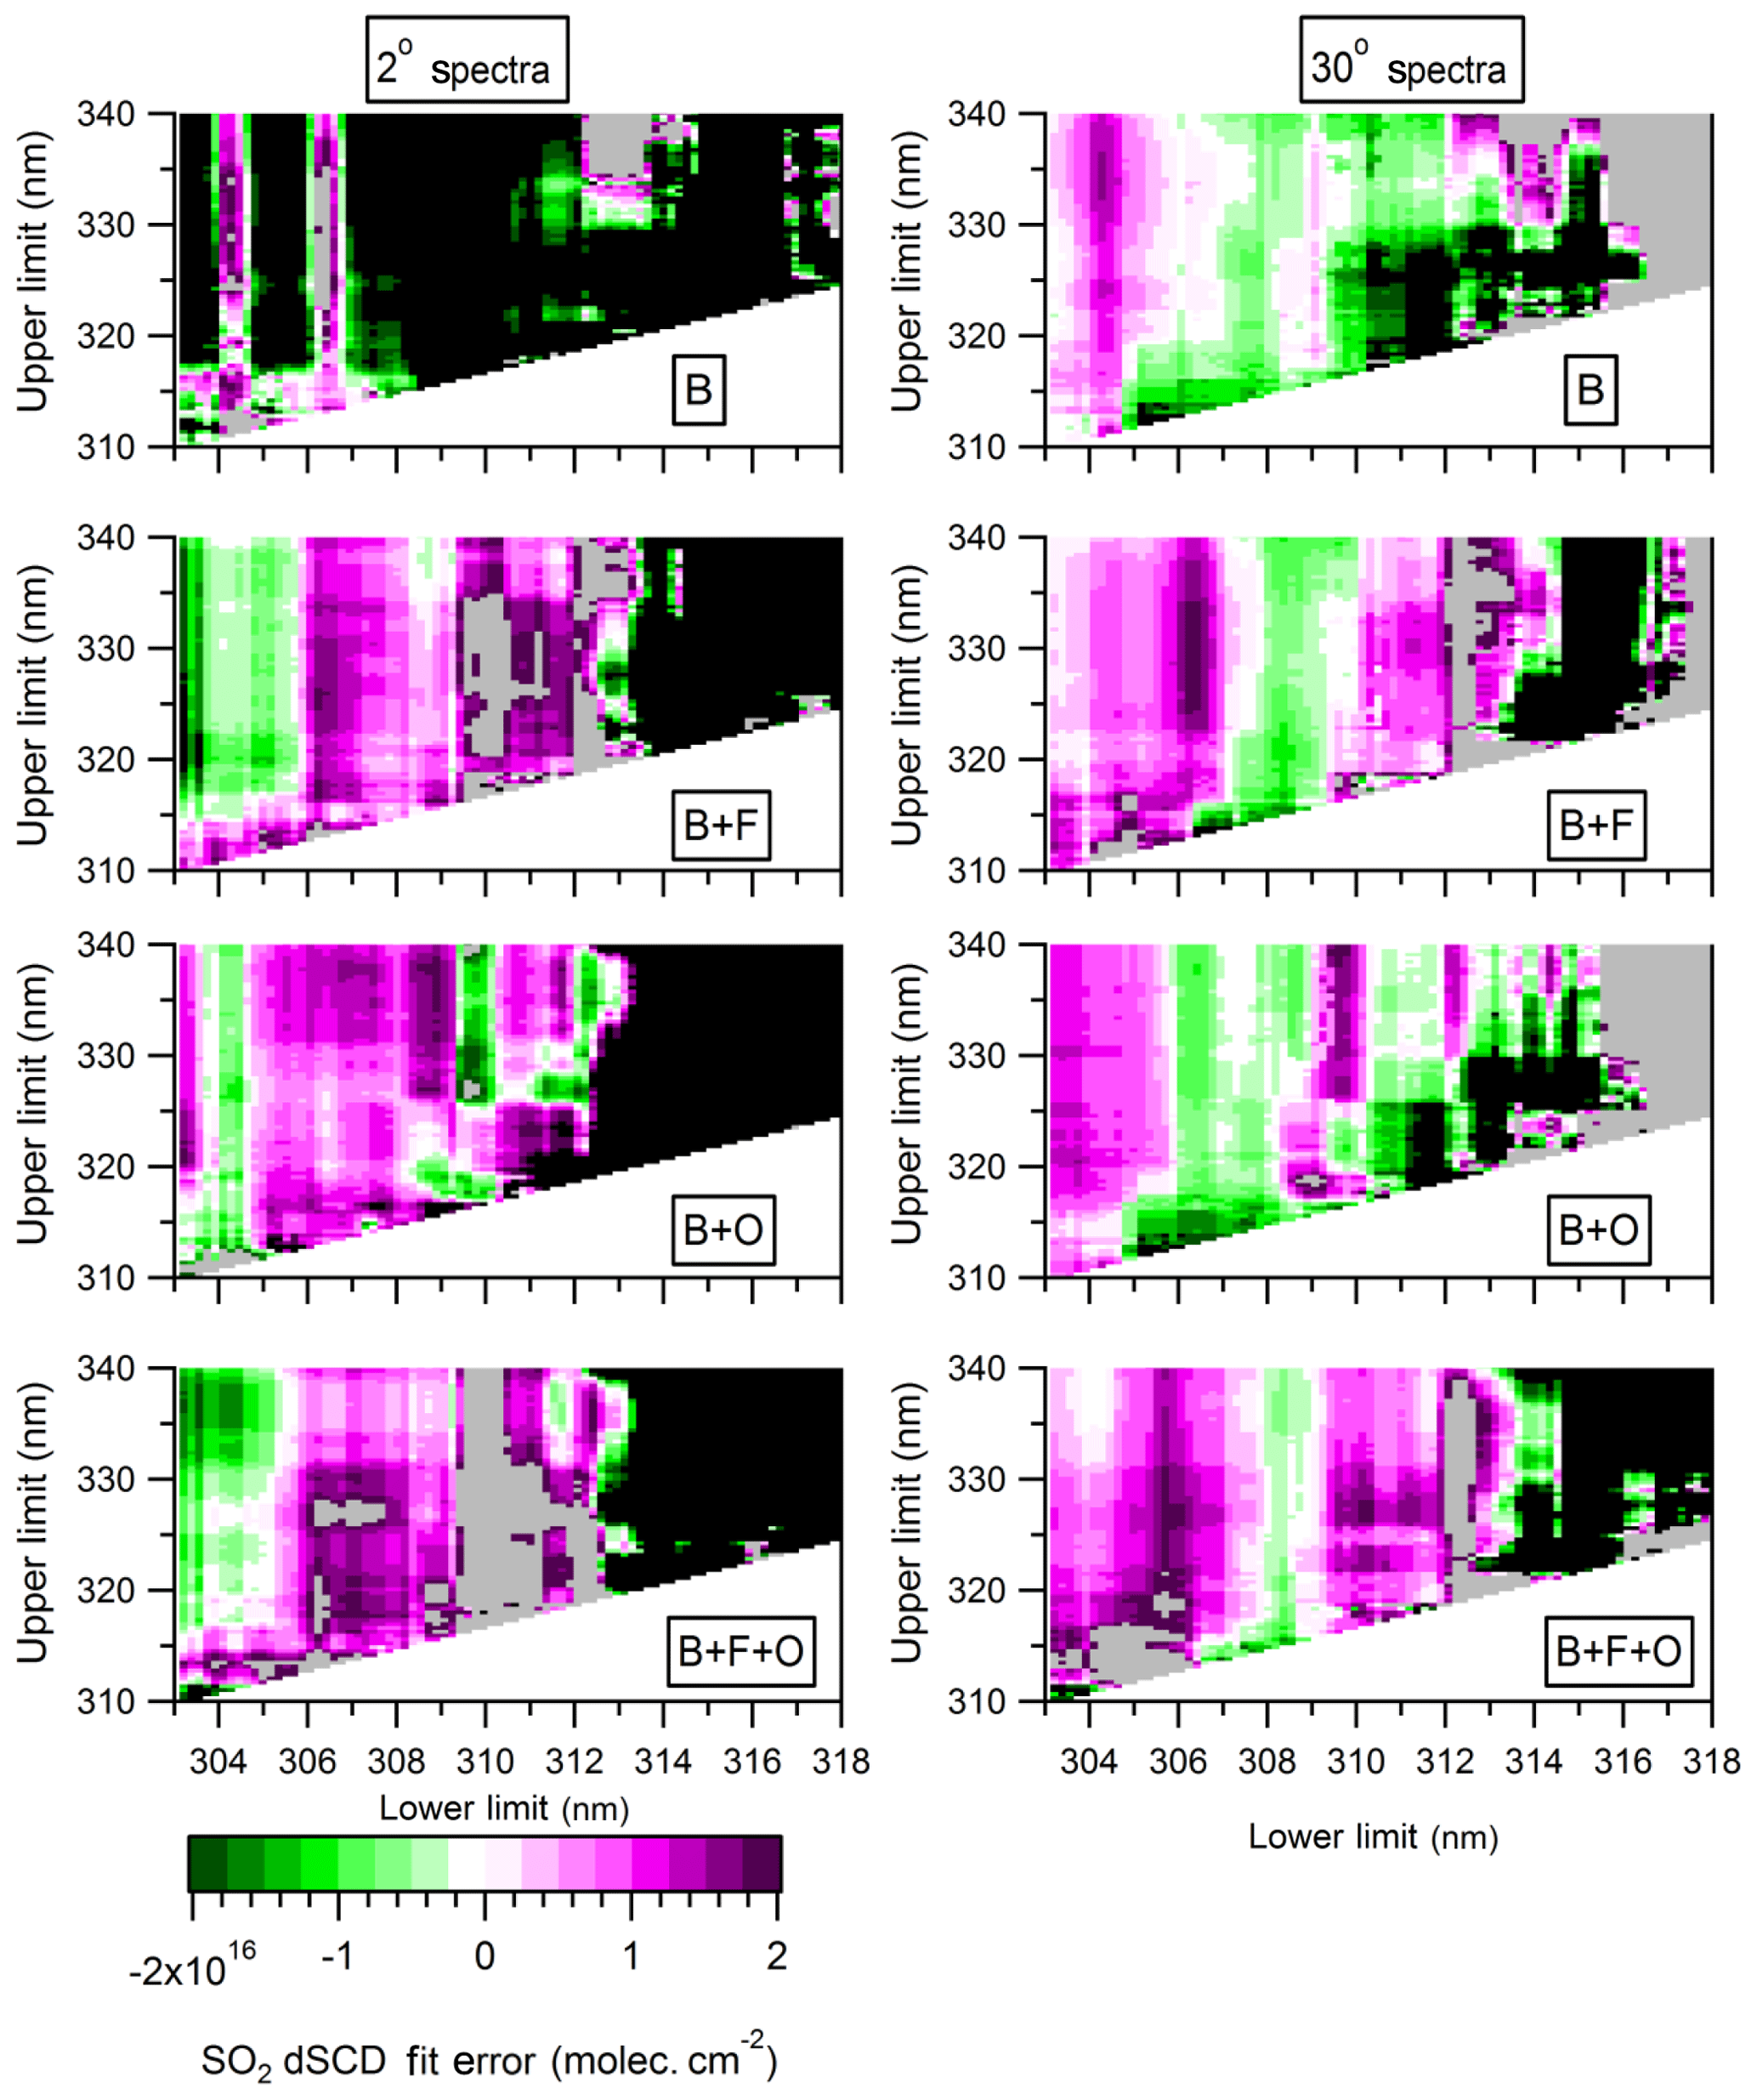
Figure 6Lower concentration fit errors (deviations of SO2 dSCDs from the expected value of 2.2×10¹⁶ molec. cm−2) from the measurements at 2∘ (left column) and 30∘ (right column) elevation angles for the base case, B; with the offset, B+O; with the filter, B+F; and with the filter and offset, B+F+O. Purple and green areas indicate that dSCDs were under- and overestimated, respectively. Black and grey areas indicate that dSCDs were over- and underestimated by more than 2.0×10¹⁶ molec. cm−2, respectively.
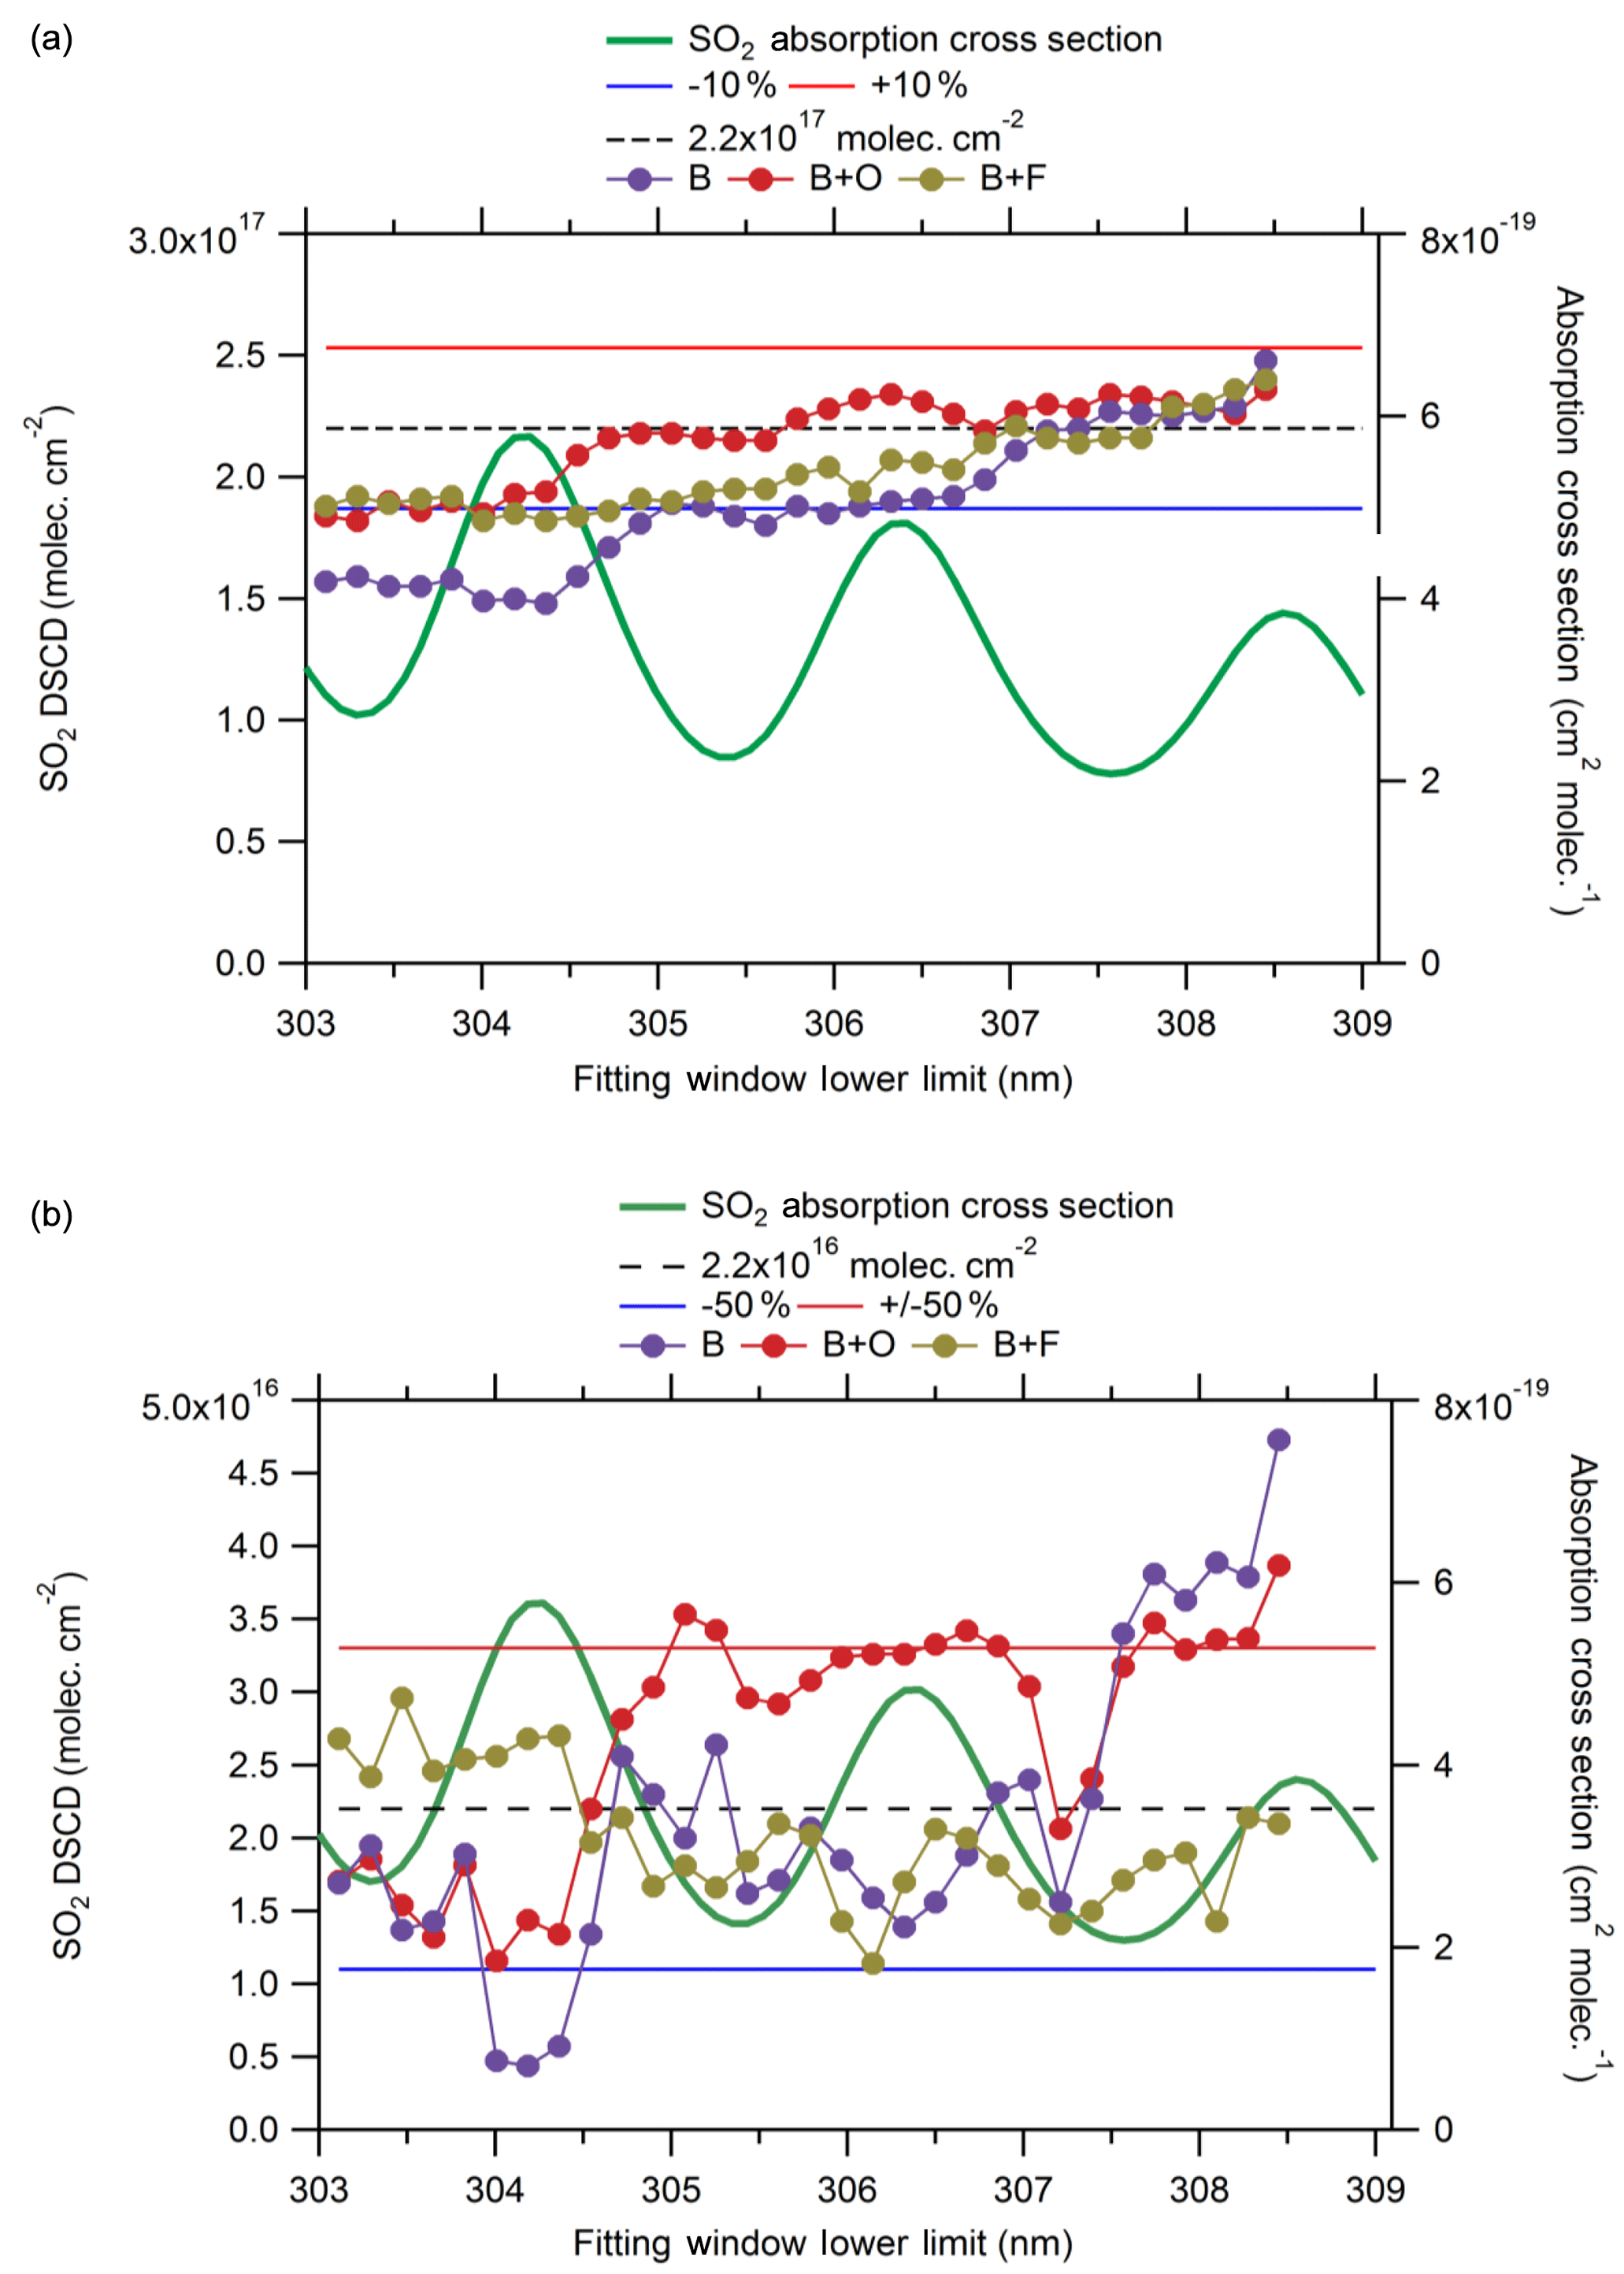
Figure 7SO2 absorption cross section and variation in the SO2 dSCDs with λlow and with λhigh=315 nm for higher (a) and lower (b) concentration measurements for the base case, B; with the offset, B+O; and with the filter, B+F.
3.3 Dependence of the dSCD on the SO2 absorption features
In the base case, the SO2 dSCDs exhibited an inverse relationship with the depth of the differential SO2 absorption features for windows with λlow < 307 and λhigh < 330 nm for non-zenith measurements (B in Figs. 2 and 5). The variation in the SO2 dSCD as a function of λlow from the measurements, given λhigh of 315 and 324 nm, are shown in Figs. 7 and 8, respectively. The SO2 dSCDs varied up to 3.4×10¹⁶ and 3.0×10¹⁶ molec. cm−2 for a 0.4 nm change in λlow for the higher and lower concentration measurements, respectively (Figs. 7, 8). Note that for the lower concentration measurement, the difference in the retrieved SO2 dSCDs between using λlow of 304 and 308.5 nm is an order of magnitude in the base case (Fig. 7). For both concentrations, using the filter or enabling the offset function reduced the dependence of the dSCDs on λlow (Figs. 7, 8) and increased the accuracy of many of the low wavelength fitting windows (Figs. 3, 6). The SO2 dSCD dependency was increased by stray light, exhibiting the greatest underestimation when λlow coincided with an SO2 absorption peak. Errors due to stray light are enhanced in wavelength regions where absorption is high (Choudhury and Prayagi, 2015). The measured signal was further reduced surrounding an SO2 absorption peak (e.g., ∼304.4 nm) compared with an absorption minimum, and stray light “filled in” the decreased intensity due to the absorption maxima. If an absorption peak is the strongest SO2 feature included in the fit, the resultant deviation between the modelled and measured spectrum in the peak region requires the fit algorithm to underestimate the SO2 dSCD to minimize the cost function (see the Supplement for fitting algorithm details). The inverse relationship between the dSCD and the SO2 absorption features was strongest at λlow < 307 nm because absorption was greatest and the solar signal was smallest (Figs. 4, 7, 8). The dSCDs exhibited less dependence on the λlow when λlow=307–311 nm due to increased solar intensity and weaker SO2 absorption (Fig. 4). For both higher and lower concentration measurements, the anti-correlation of the SO2 dSCD in the base case was more pronounced for windows with λhigh=324 than with λhigh=315 nm (Figs. 7, 8).
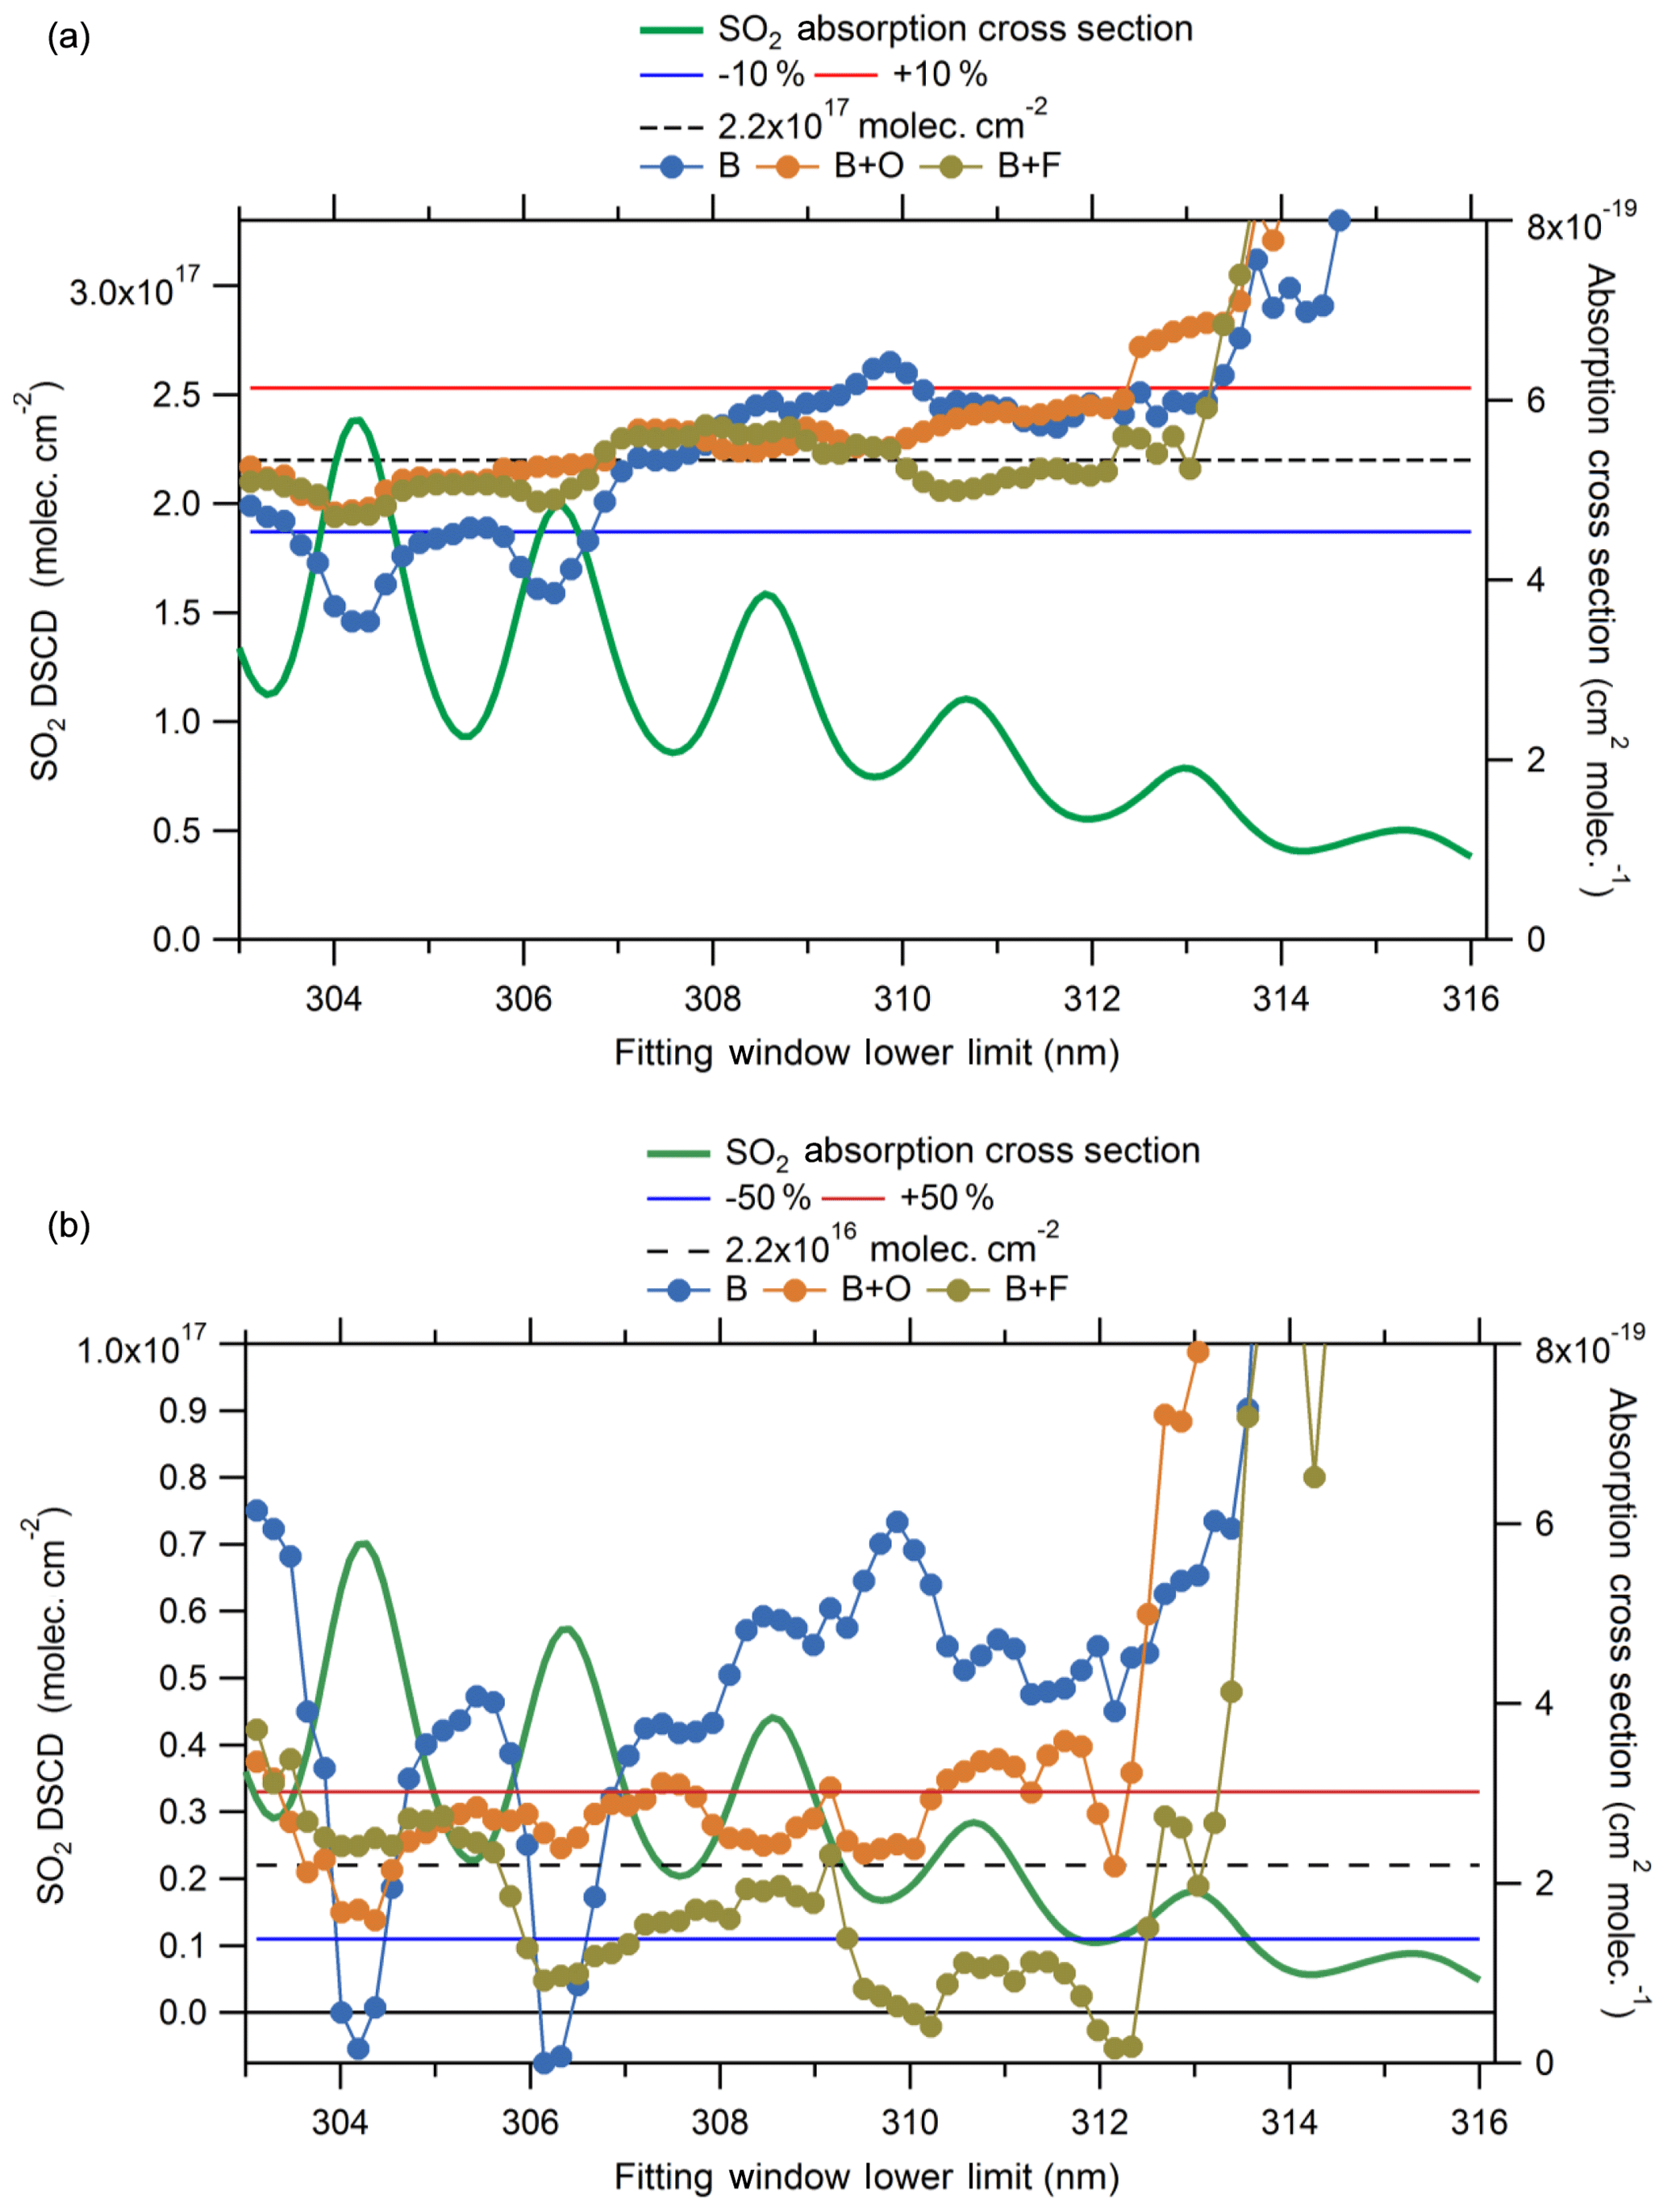
Figure 8SO2 absorption cross section and variation in the SO2 dSCDs with λlow and with λhigh=324 nm for higher (a) and lower (b) concentration measurements for the base case, B; with the offset, B+O; and with the filter, B+F.
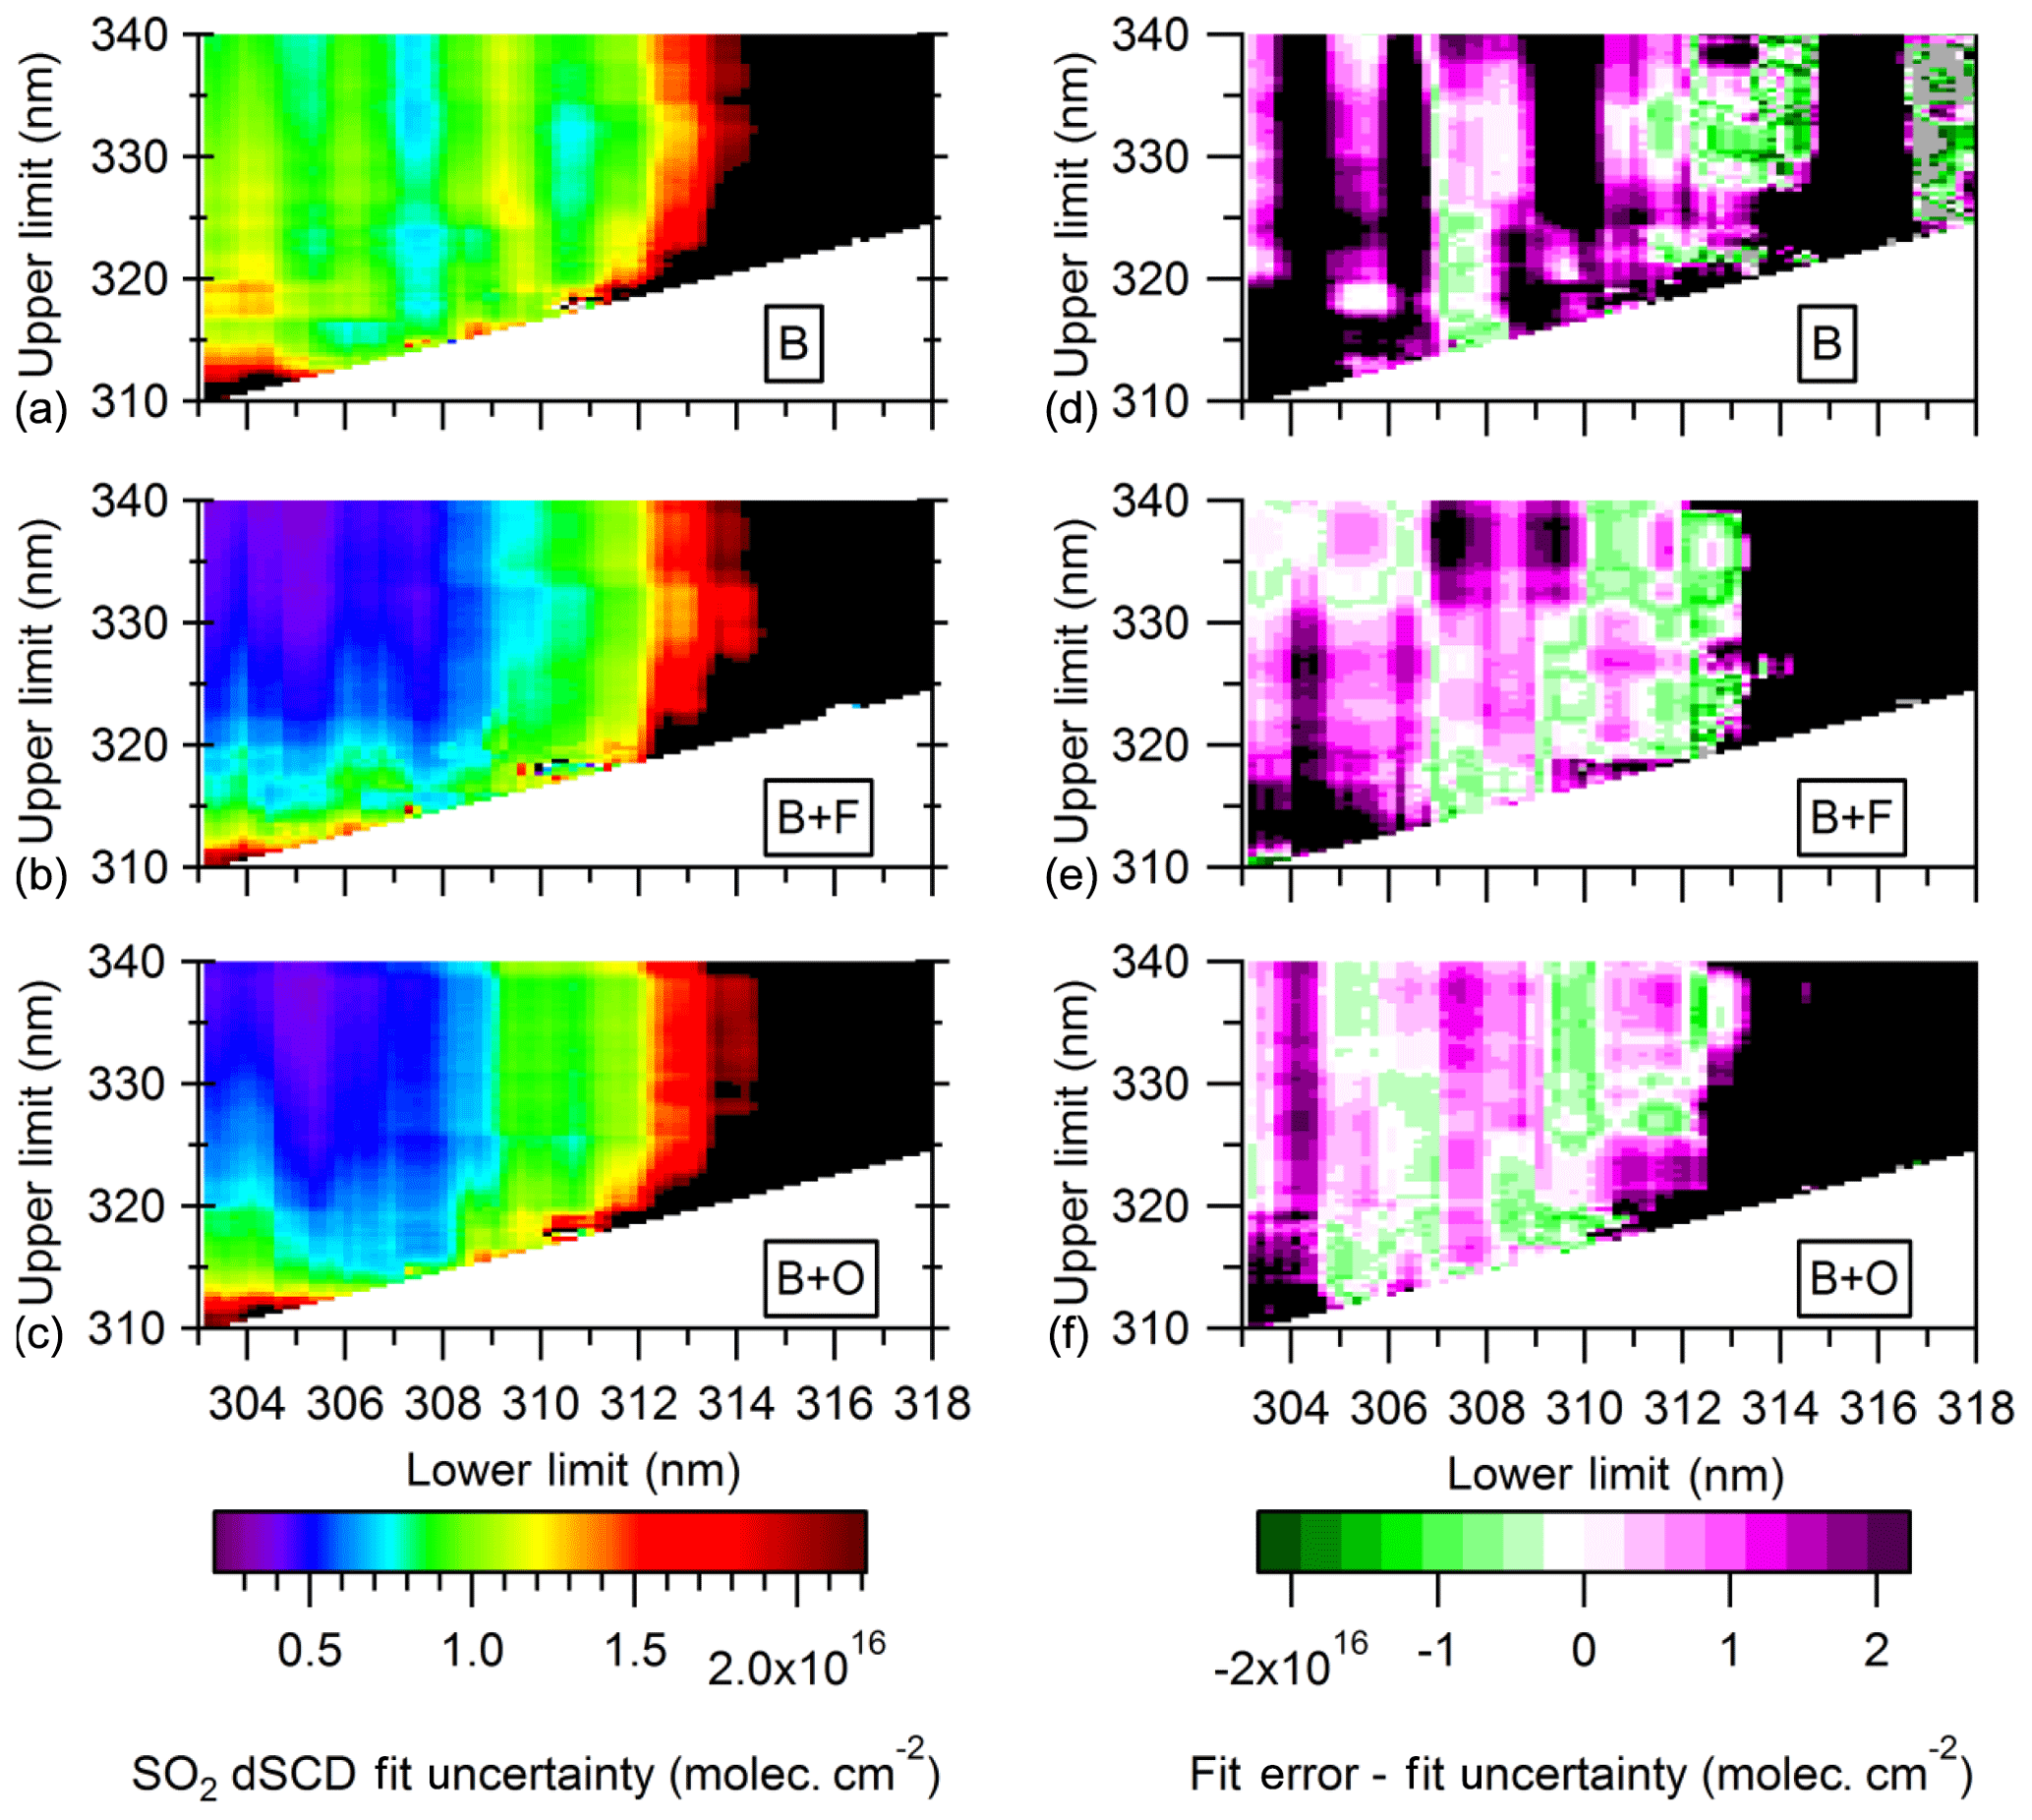
Figure 9Higher concentration SO2 dSCDs' fit uncertainties (a, b, c) and the difference between the fit error and uncertainty (d, e, f) from spectra measured at a 2∘ elevation angle for the base case, B; with the offset, B+O; and with the filter, B+F. Black areas indicate errors > 1.1×10¹⁶ molec. cm−2 for the absolute error (a, b, c) and > 2.2×10¹⁶ molec. cm−2 for the difference (underestimation) between the actual and fit error.

Figure 10Lower concentration SO2 dSCDs' fit errors (a, b, c) and the difference between the fit uncertainty and error (d, e, f) from spectra measured at a 2∘ elevation angle for the base case, B; with the offset, B+O; and with the filter, B+F. Black areas indicate errors of > 2.2×10¹⁶ molec. cm−2 for the absolute error (a, b, c) and a > 1.1×10¹⁶ molec. cm−2 underestimation of the fit error by the fit uncertainty.
3.4 Fit uncertainties and accuracy
The uncertainty in the SO2 dSCD reported by the fitting algorithm and the actual deviation from the expected value shall be referred to as the “fit uncertainty” and the “fit error”, respectively. While the fit uncertainty reported by the retrieval is commonly used as the error on the retrieved dSCD, this uncertainty is not always expected to accurately represent the true error. The divergence is due to factors including assumptions about the independence of errors, and the presence of spectral noise and structures in the fit residual (Stutz and Platt, 1996). Tests of modelled spectra with noise added found that when noise becomes large, the true errors of the retrieved trace gas coefficient were > 10 % larger than the retrieved error, and the difference was proportional to the noise level. Moreover, the inclusion of random residual structures in the spectra caused the fit uncertainty to underestimate the true error by a factor of 3 (Stutz and Platt, 1996). It is useful to examine which fitting windows exhibited the greatest difference between the fit uncertainty and error. The fit uncertainties from the 2∘ spectrum are shown for the higher and lower concentration measurements in the left columns of Figs. 9 and 10, respectively. The fit uncertainties for the base case were the greatest for windows with λlow < 306 and λhigh < 315 nm, and with λlow > 312 nm (B in Figs. 9 and 10). The purple and black regions in Figs. 9 and 10 indicate that the fit error was greater than the fit uncertainty, and the green regions indicate that fit error was less than the fit uncertainty. For the higher concentration measurement in the base case, the fit error was significantly greater than the fit uncertainty (by > 2.2×10¹⁶ molec. cm−2) for most windows when λlow < 305 nm (black regions in Fig. 9, case B), corresponding to fit uncertainties that were 20 %–50 % of the fit errors (Fig. S2). Therefore, fitting windows for the higher-concentration measurements in low wavelength regions (impacted by stray light and nonlinearity effects) can not only produce less accurate SO2 dSCDs but also exhibit larger divergences between fit uncertainty and error (B in Figs. 2, 3, and 9, and S2). For the lower concentration measurement, the fit error was > 1.1×10¹⁶ molec. cm−2 greater than the fit uncertainty for most windows in the base case (black regions in Fig. 10, case B). The use of the filter or enabling the offset function reduced the fit uncertainties by up to 50 % and decreased the difference between the fit errors and uncertainties, particularly for windows with λlow < 309 nm (Figs. 9, 10, S2). Note that when the filter or offset function was used, increasing λhigh > ∼320 nm or decreasing the λlow < ∼307 nm decreased the fit uncertainty but not the fit error for some windows (Figs. 6, 8).
Measurements of calibration gas cells with column densities of 2.2×10¹⁷ and 2.2×10¹⁶ molec. cm−2 SO2 were conducted using a miniature MAX-DOAS instrument with an Ocean Optics USB2000 spectrometer. In the base case, SO2 dSCDs were least accurate and had the largest fit uncertainties for fitting windows with λlow < 307 and > 312 nm due to stray light and low solar signal, and weak SO2 absorption, respectively. Fitting windows exhibited less accurate SO2 dSCDs for spectra recorded at lower compared with higher α due to the reduced UV signal. Therefore, choosing an accurate fitting window is particularly important for measurements at low α. Windows with λlow < 307 nm generally underestimated SO2 dSCDs from higher concentration measurements for all scenarios. In contrast, many windows with λlow < 307 nm from the lower concentration measurements overestimated the SO2 dSCD that were overestimated from the higher-concentration measurement. In the base case, the SO2 fit uncertainties were significantly less than the actual known fit error for many windows for both concentration measurements. Using the short-pass filter or the offset function increased the accuracy of the SO2 dSCDs, decreased the fit uncertainty, and decreased the difference between the fit uncertainty and error compared with the base case for most windows. Some low wavelength windows continued to underestimate the SO2 dSCDs despite the filter for the higher-concentration measurements. The remaining underestimation was probably due to significant stray light that originated from < 400 nm and nonlinearity in the relationship between the column density and the measured optical density owing to large optical depths of SO2 at these lower wavelengths (e.g., > 0.08). A low-pass filter with a lower cut-off wavelength (i.e., λcut-off=340 nm) may address the first factor, as may the use of spectrometers with reduced stray light. A spectrometer with an improved spectral resolution should help reduce the impact of the second factor (Kern, 2009). SO2 dSCDs exhibited an inverse dependence on the depth of the differential features in the SO2 absorption cross section in the base case. The dependence decreased with the use of the short-pass filter or the offset function, implying that stray light contributed to the dependence. Using both the filter and offset function decreased the accuracy of the lower concentration dSCDs of SO2 for some windows with λlow < 307 and λhigh < 320 nm compared with the base case. Increasing the λhigh to more than ∼320 nm tended to decrease the fit uncertainty but not necessarily the fit error for measurements with the filter or offset function.
Note that this study focused on the impact of two retrieval parameters (the fitting window wavelength and offset function) but that several other parameters can be varied in the SO2 dSCD fit. These parameters include the order of the DOAS and offset function polynomials and the choice of the literature cross sections for the trace gases. The DOAS analysis could also be expanded to include a correction to reduce the impacts of the wavelength dependence of the Ring effect in the near UV due to aerosol and multiple Rayleigh scattering, as described in Langford et al. (2007). Additional factors that could impact the retrieved dSCD include the solar zenith and azimuth angles during measurement. A limitation of this study is the lack of measurements at high solar zenith angles (near dawn and dusk) when the SCDs of O3 are larger and change rapidly with time. In such cases, fit accuracy may benefit from extending the upper limit of the fit window to allow for better discrimination between the differential absorption features in the O3 and SO2 cross sections. Future studies could repeat these experiments by measuring at different solar geometries and varying the other fit parameters. Furthermore, the SO2 column densities measured in this study were chosen to be representative of a range typical of polluted urban settings. Greater SO2 column densities (> 1×10¹⁸ molec. cm−2) can be observed in volcanic areas and close to major industrial sources; discussions on retrieving these high SO2 column densities can be found in Bobrowski et al. (2010) and Fickel and Delgado Granados (2017).
Based on the results of this study, it is recommended that fitting windows for SO2 have λlow > 307 nm to avoid the effects of stray light, low solar signal, and, for higher column densities, the effects of nonlinearity between the measured optical depth and the column density for optical densities ≫0.05, and λlow < 312 nm because of weak SO2 features. Fitting windows are recommended to have a λhigh less than ∼320 nm to avoid increased underestimation of the fit error by the fit uncertainty unless there are concerns about interference from large O3 absorptions, such as at high solar zenith angles. A fitting window should not be chosen only because it has a smaller fit uncertainty, as this does not guarantee a more accurate dSCD. A short-pass filter with a cut-off close to the λhigh of the SO2 fitting window improves the accuracy of MAX-DOAS SO2 measurements. In the absence of a filter or if a filter would conflict with other species to be determined (e.g., NO2), the offset function should be used to compensate for stray light. Even in the case that SO2 and NO2 are to be fit simultaneously, a filter with λcut-off=550 nm may reduce stray light. A short-pass filter may be preferred over the offset function for reducing stray light impacts because the filter removes stray light while the offset function mathematically compensates for stray light by assuming it is proportional to the measured intensity (see Eqs. 11 and 12 in Supplement). The offset function may increase fit error if this assumption is invalid or if little stray light is present. If a short-pass filter or the offset function is used, the 307.5–319 nm fitting window for miniature MAX-DOAS measurements of SO2 is recommended. Ultimately, the use of higher quality spectrometers with reduced stray light and improved spectral resolution for MAX-DOAS measurements is desirable, but this is a greater expense compared with the low-cost spectrometer used in this study.
| Acronym | Expansion |
| α | Viewing elevation angle |
| λcut-off | Cut-off wavelength of the short-pass filter |
| λhigh | Upper limit wavelength of the fitting window |
| λlow | Lower limit wavelength of the fitting window |
| B | Base case measurement (no filter and offset function disabled) |
| B+F | Measurement with the short-pass filter |
| B+F+O | Measurement with the short-pass filter fit using the offset function |
| B+O | Measurement with the fit using the offset function |
| dSCD | Differential slant column density |
| FRS | Fraunhofer reference spectrum |
| HCHO | Formaldehyde |
| MAX-DOAS | Multi-axis differential optical absorption spectroscopy |
| molec. cm−2 | Molecules per square centimetre |
| nm | Nanometres |
| NO2 | Nitrogen dioxide |
| O3 | Ozone |
| ppb | Parts per billion |
| SCD | Slant column density |
| SO2 | Sulfur dioxide |
| UV | Ultraviolet |
| VCD | Vertical column density |
The MAX-DOAS data collected from this study are publicly available from the following DOI: https://doi.org/10.5683/SP2/4XQZS8 (Davis and McLaren, 2020).
The supplement related to this article is available online at: https://doi.org/10.5194/amt-13-3993-2020-supplement.
ZYWD was responsible for the MAX-DOAS study concept, design, investigation and data analysis, data visualization, and writing and revising the paper. RM was responsible for the MAX-DOAS supervision and contributed to revising the paper.
The authors declare that they have no conflict of interest.
This research has been supported by the Natural Sciences and Engineering Research Council of Canada (grant no. RGPIN-2018-05898) and the Collaborative Research and Training Experience (CREATE) program “Integrating Atmospheric Chemistry and Physics from Earth to Space” (IACPES; grant no. 398061-2011).
This paper was edited by Jochen Stutz and reviewed by Christoph Kern and one anonymous referee.
Bobrowski, N. and Platt, U.: SO2∕BrO ratios studied in five volcanic plumes, J. Volcanol. Geoth. Res., 166, 147–160, https://doi.org/10.1016/j.jvolgeores.2007.07.003, 2007.
Bobrowski, N., Kern, C., Platt, U., Hörmann, C., and Wagner, T.: Novel SO2 spectral evaluation scheme using the 360–390 nm wavelength range, Atmos. Meas. Tech., 3, 879–891, https://doi.org/10.5194/amt-3-879-2010, 2010.
Bogumil, K., Orphal, J., Homann, T., Voigt, S., Spietz, P., Fleischmann, O. C., Vogel, A., Hartmann, M., Kromminga, H., Bovensmann, H., Frerick, J., and Burrows, J. P.: Measurements of molecular absorption spectra with the SCIAMACHY pre-flight model: instrument characterization and reference data for atmospheric remote-sensing in the 230–2380 nm region, J. Photoch. Photobio. A, 157, 167–184, https://doi.org/10.1016/S1010-6030(03)00062-5, 2003.
Brewer, A. W., McElroy, C. T., and Kerr, J. B.: Nitrogen Dioxide Concentrations in the Atmosphere, Nature, 246, 129–133, https://doi.org/10.1038/246129a0, 1973.
Choudhury, A. K. R. and Prayagi, K. P.: Principles of colour appearance and measurement. Volume 2: Visual measurement of colour, colour comparison and management, Woodhead Publishing Limited in association with The Textile Institute, Sawston, Cambridge, UK, available at: http://ezproxy.library.yorku.ca/login?url=http://ezproxy.library.yorku.ca/sso/skillport?context=78779 (last access: 20 August 2019), 2015.
Davis, Z. and McLaren, R.: Measurement Spectra from Recommendations for Spectral Fitting of SO2, https://doi.org/10.5683/SP2/4XQZS8, Scholars Portal Dataverse, 2020.
Davis, Z. Y. W., Baray, S., McLinden, C. A., Khanbabakhani, A., Fujs, W., Csukat, C., Debosz, J., and McLaren, R.: Estimation of NOx and SO2 emissions from Sarnia, Ontario, using a mobile MAX-DOAS (Multi-AXis Differential Optical Absorption Spectroscopy) and a NOx analyzer, Atmos. Chem. Phys., 19, 13871–13889, https://doi.org/10.5194/acp-19-13871-2019, 2019.
ECCC: NPRI Data Search – Facility and Substance Information – NOVA Chemicals (Canada) Ltd. – Corunna Site 2017, available at: https://pollution-waste.canada.ca/national-release-inventory/archives/index.cfm?do=facility_substance_summary&lang=en&opt_npri_id=0000001776&opt_report_year=2017, last access: 17 September 2018.
Fickel, M. and Delgado Granados, H.: On the use of different spectral windows in DOAS evaluations: Effects on the estimation of SO2 emission rate and mixing ratios during strong emission of Popocatepetl volcano, Chem. Geol., 462, 67–73, https://doi.org/10.1016/j.chemgeo.2017.05.001, 2017.
Fioletov, V. E., McLinden, C. A., Cede, A., Davies, J., Mihele, C., Netcheva, S., Li, S.-M., and O'Brien, J.: Sulfur dioxide (SO2) vertical column density measurements by Pandora spectrometer over the Canadian oil sands, Atmos. Meas. Tech., 9, 2961–2976, https://doi.org/10.5194/amt-9-2961-2016, 2016.
Hermans, C., Vandaele, A. C., and Fally, S.: Fourier transform measurements of SO2 absorption cross sections: I. Temperature dependence in the 24000–29000cm−1 (345–420nm) region, J. Quant. Spectrosc. Ra., 110, 756–765, https://doi.org/10.1016/j.jqsrt.2009.01.031, 2009.
Institute of Environmental Physics, Heidelberg University: DOASIS – DOAS Intelligent System – Home, DOASIS, available at: https://doasis.iup.uni-heidelberg.de/bugtracker/projects/doasis/ (last access: 13 September 2019), 2009.
Irie, H., Takashima, H., Kanaya, Y., Boersma, K. F., Gast, L., Wittrock, F., Brunner, D., Zhou, Y., and Van Roozendael, M.: Eight-component retrievals from ground-based MAX-DOAS observations, Atmos. Meas. Tech., 4, 1027–1044, https://doi.org/10.5194/amt-4-1027-2011, 2011.
Jin, J., Ma, J., Lin, W., Zhao, H., Shaiganfar, R., Beirle, S., and Wagner, T.: MAX-DOAS measurements and satellite validation of tropospheric NO2 and SO2 vertical column densities at a rural site of North China, Atmos. Environ., 133, 12–25, https://doi.org/10.1016/j.atmosenv.2016.03.031, 2016.
Keller-Rudek, H., Moortgat, G. K., Sander, R., and Sörensen, R.: The MPI-Mainz UV/VIS Spectral Atlas of Gaseous Molecules of Atmospheric Interest, Earth Syst. Sci. Data, 5, 365–373, https://doi.org/10.5194/essd-5-365-2013, 2013.
Kern, C.: Spectroscopic measurements of volcanic gas emissions in the ultra-violet wavelength region, PhD Thesis, University of Heidelberg, Germany, 318 pp., https://doi.org/10.11588/heidok.00009574, 2009.
Kraus, S. G.: DOASIS A Framework Design for DOAS, Mannheim University, Mannheim, Germany, available at: https://pdfs.semanticscholar.org/c091/cbb709447d3b5b778e7bf4aff9d6a2e25861.pdf (last access: 14 August 2019), 2006.
Kreuter, A. and Blumthaler, M.: Stray light correction for solar measurements using array spectrometers, Rev. Sci. Instrum., 80, 096108, https://doi.org/10.1063/1.3233897, 2009.
Kristensson, E., Bood, J., Alden, M., Nordstrom, E., Zhu, J., Huldt, S., Bengtsson, P.-E., Nilsson, H., Berrocal, E., and Ehn, A.: Stray light suppression in spectroscopy using periodic shadowing, Opt. Express, 22, 7711–7721, https://doi.org/10.1364/OE.22.007711, 2014.
Lampel, J., Wang, Y., Hilboll, A., Beirle, S., Sihler, H., Puķīte, J., Platt, U., and Wagner, T.: The tilt effect in DOAS observations, Atmos. Meas. Tech., 10, 4819–4831, https://doi.org/10.5194/amt-10-4819-2017, 2017.
Langford, A. O., Schofield, R., Daniel, J. S., Portmann, R. W., Melamed, M. L., Miller, H. L., Dutton, E. G., and Solomon, S.: On the variability of the Ring effect in the near ultraviolet: understanding the role of aerosols and multiple scattering, Atmos. Chem. Phys., 7, 575–586, https://doi.org/10.5194/acp-7-575-2007, 2007.
Lindon, J. C., Tranter, G. E., and Koppenaal, D. W.: Encyclopedia of Spectroscopy and Spectrometry, 2nd ed., Elsevier, Oxford, Sand Diego, CA, 2000.
Marquard, L. C., Wagner, T., and Platt, U.: Improved air mass factor concepts for scattered radiation differential optical absorption spectroscopy of atmospheric species, J. Geophys. Res.-Atmos., 105, 1315–1327, https://doi.org/10.1029/1999JD900340, 2000.
Noxon, J. F.: Nitrogen Dioxide in the Stratosphere and Troposphere Measured by Ground-Based Absorption Spectroscopy, Science, 189, 547–549, https://doi.org/10.1126/science.189.4202.547, 1975.
Ontario Ministry of the Environment: Toronto North: Hourly Sulphur Dioxide Concentrations 34021, Air Qual. Ont., available at: http://www.airqualityontario.com/history/pollutant.php?stationid=34021&pol_code=9, last access: 13 September 2019.
Perner, D., Ehhalt, D., Pätz, H., Platt, U., Röth, E.-P., and Volz-Thomas, A.: OH – Radicals in the lower troposphere, Geophys. Res. Lett., 3, 466–468, https://doi.org/10.1029/GL003i008p00466, 1976.
Platt, U. and Stutz, J.: Differential optical absorption spectroscopy: principles and applications, Springer Verlag, Berlin, 2008.
Platt, U., Perner, D., and Patz, H.: Simultaneous Measurement of Atmospheric CH2O, O3, and NO2 by Differential Optical-Absorption, J. Geophys. Res.-Oceans, 84, 6329–6335, https://doi.org/10.1029/JC084iC10p06329, 1979.
Puķīte, J., Kühl, S., Deutschmann, T., Platt, U., and Wagner, T.: Extending differential optical absorption spectroscopy for limb measurements in the UV, Atmos. Meas. Tech., 3, 631–653, https://doi.org/10.5194/amt-3-631-2010, 2010.
Rix, M., Valks, P., Hao, N., Loyola, D., Schlager, H., Huntrieser, H., Flemming, J., Koehler, U., Schumann, U., and Inness, A.: Volcanic SO2, BrO and plume height estimations using GOME-2 satellite measurements during the eruption of Eyjafjallajökull in May 2010, J. Geophys. Res.-Atmos., 117, D00U19, https://doi.org/10.1029/2011JD016718, 2012.
Salerno, G. G., Burton, M. R., Oppenheimer, C., Caltabiano, T., Tsanev, V. I., and Bruno, N.: Novel retrieval of volcanic SO2 abundance from ultraviolet spectra, J. Volcanol. Geoth. Res., 181, 141–153, https://doi.org/10.1016/j.jvolgeores.2009.01.009, 2009.
Schreier, S. F., Peters, E., Richter, A., Lampel, J., Wittrock, F., and Burrows, J. P.: Ship-based MAX-DOAS measurements of tropospheric NO2 and SO2 in the South China and Sulu Sea, Atmos. Environ., 102, 331–343, https://doi.org/10.1016/j.atmosenv.2014.12.015, 2015.
Stutz, J. and Platt, U.: Numerical analysis and estimation of the statistical error of differential optical absorption spectroscopy measurements with least-squares methods, Appl. Optics, 35, 6041–6053, https://doi.org/10.1364/AO.35.006041, 1996.
Tan, W., Liu, C., Wang, S., Xing, C., Su, W., Zhang, C., Xia, C., Liu, H., Cai, Z., and Liu, J.: Tropospheric NO2, SO2, and HCHO over the East China Sea, using ship-based MAX-DOAS observations and comparison with OMI and OMPS satellite data, Atmos. Chem. Phys., 18, 15387–15402, https://doi.org/10.5194/acp-18-15387-2018, 2018.
Theys, N., De Smedt, I., Yu, H., Danckaert, T., van Gent, J., Hörmann, C., Wagner, T., Hedelt, P., Bauer, H., Romahn, F., Pedergnana, M., Loyola, D., and Van Roozendael, M.: Sulfur dioxide retrievals from TROPOMI onboard Sentinel-5 Precursor: algorithm theoretical basis, Atmos. Meas. Tech., 10, 119–153, https://doi.org/10.5194/amt-10-119-2017, 2017.
Vogel, L., Sihler, H., Lampel, J., Wagner, T., and Platt, U.: Retrieval interval mapping: a tool to visualize the impact of the spectral retrieval range on differential optical absorption spectroscopy evaluations, Atmos. Meas. Tech., 6, 275–299, https://doi.org/10.5194/amt-6-275-2013, 2013.
Wang, Y., Lampel, J., Xie, P., Beirle, S., Li, A., Wu, D., and Wagner, T.: Ground-based MAX-DOAS observations of tropospheric aerosols, NO2, SO2 and HCHO in Wuxi, China, from 2011 to 2014, Atmos. Chem. Phys., 17, 2189–2215, https://doi.org/10.5194/acp-17-2189-2017, 2017.
Xie, C., Hu, X., Zhou, L., Xie, D., and Guo, H.: Ab initio determination of potential energy surfaces for the first two UV absorption bands of SO2, J. Chem. Phys., 139, 014305, https://doi.org/10.1063/1.4811840, 2013.
Yang, K., Krotkov, N. A., Krueger, A. J., Carn, S. A., Bhartia, P. K., and Levelt, P. F.: Retrieval of large volcanic SO2 columns from the Aura Ozone Monitoring Instrument: Comparison and limitations, J. Geophys. Res.-Atmos., 112, D24S43, https://doi.org/10.1029/2007JD008825, 2007.
fitting windows. We provide recommendations for measuring SO2 with greater accuracy.