the Creative Commons Attribution 4.0 License.
the Creative Commons Attribution 4.0 License.
 | 03 Aug 2020
An experimental study on light scattering matrices for Chinese loess dust with different particle size distributions
Jia Liu
Yinuo Huo
Jinjun Wang
Yongming Zhang
Mineral dust suspended in the atmosphere has significant effects on radiative balance and climate change. The Chinese Loess Plateau (CLP) is generally considered one of the main sources of Asian dust aerosol. After being lifted by wind, dust particles with various size distributions can be transported over different distances. In this study, an original loess sample was collected from Luochuan, which is centrally located on the CLP, and two samples with different size distributions were obtained afterwards. “Pristine loess” was used to represent dust that only affects source regions, part of pristine loess was milled to finer “milled loess” that can be transported over long distances. Light scattering matrices for these two samples were measured at 532 nm wavelength from 5 to 175∘ angles. Particle size distribution, refractive index, chemical component, and microscopic appearance were also characterized for auxiliary analyses. Experimental results showed that there are obvious discrepancies in angular behaviors of matrix elements for pristine loess and milled loess, and these discrepancies are different from those for other kinds of dust with distinct size distributions. Given that the effective radii of these two loess samples differ by more than 20 times, it is reasonable to conclude that the difference in size distributions plays a major role in leading to different matrices, while differences in refractive index and microstructure have relatively small contributions. Qualitative analyses of numerical simulation results of irregular particles also validate this conclusion. Gaussian spheres may be promising morphological models for simulating the scattering matrix of loess but need further quantitative verification. Finally, synthetic scattering matrices for both pristine loess and milled loess were constructed over 0–180∘, and the previous average scattering matrix for loess dust was updated. This study presents measurement results of Chinese loess dust and an updated average scattering matrix for loess, which are useful for validating existing models, developing more advanced models for optical simulations of loess dust, and helping to improve retrieval accuracy of dust aerosol properties over both source and downwind areas.
- Article
(3376 KB) - Full-text XML
- BibTeX
- EndNote


Mineral dust is a common particulate type in Earth's atmosphere, and accounts for a high fraction of atmospheric aerosol mass loading (Tegen and Fung, 1995). Asian dust contributes a lot to global atmospheric mineral dust aerosol; i.e, dust emitted from East Asia alone is about 1.04×10⁷, 2.76×10⁷, and 5.13×10⁷ t yr−1 for PM10 (particles with aerodynamic equivalent diameter smaller than 10 µm), PM30, and PM50, respectively (Xuan et al., 2004). During aerosol characterization experiments (ACE-Asia), mass balance calculations indicated that 45 %–82 % of atmospheric aerosol mass at observation sites in China was attributed to Asian dust (Zhang et al., 2003). The Chinese Loess Plateau (CLP) is usually considered one of the main sources or an important supply site of Asian dust aerosol (Han et al., 2008; Shen et al., 2016; Tsai et al., 2014; Zhang et al., 2010). Statistical analysis of dust storms influencing the Chinese mainland from 2000 to 2002 showed that about a quarter of dust storms originated from the CLP (Zhang and Gao, 2007). Source tracing of dust collected in Xi'an city revealed that these dust particles were mainly transported short distances from the CLP (Yan et al., 2015). Comparisons of chemical element ratios demonstrated that dust particles emitted from the CLP can be transported to Korea, Japan, and the North Pacific (Cao et al., 2008).
Because of the scattering and absorption of solar radiation, atmospheric dust has remarkable influences on global climate change and the radiation budget (Satheesh and Moorthy, 2005; Sokolik and Toon, 1996). Dust particles with different sizes can be transported over different distances. More specifically, dust particles with a size range of r>5 µm exist in source areas only, while particles with a size range of µm can experience airborne transportation over long distances (like about 5000 km) and even across continents from Asia to North America (Jaffe et al., 1999; Satheesh and Moorthy, 2005). Therefore, loess dust emitted from the CLP is expected to have important influence on the radiation balance both at source areas and places far away from sources.
It is well known that dust particles have distinct nonspherical shapes, thus retrievals of dust aerosol properties, like optical thickness, based on Lorenz–Mie computations will lead to significant errors (Herman et al., 2005; Mishchenko et al., 2003). Optical modeling of dust particles with nonspherical shapes has been an essential subject. Dubovik et al. (2006) employed a mixture of spheroids with different axial ratios and spheres to reproduce laboratory-measured angular light scattering patterns of dust aerosols presented by Volten et al. (2001), and the best fitted shape distribution of spheroids was obtained and proposed. Subsequent studies on the retrievals of dust aerosol properties from space-based (Dubovik et al., 2011), airborne (Espinosa et al., 2019), and ground-based (Titos et al., 2019) remote sensing observations were all based on this shape distribution. However, the application of the same shape distribution of spheroids for different kinds of dust is too arbitrary (Li et al., 2019) and may not be suitable for simulating optical properties of loess dust with different size distributions. Furthermore, more precise optical models that are more complex than spheroids and similar to real dust morphology are still needed. Laboratory measurements of angular scattering patterns and basic physical features, like size distribution, refractive index, and microstructure, of loess dust with different sizes are essential and beneficial to the development of more precise models for loess dust. These models will further be useful for more accurate retrievals of dust aerosol properties over both source and downwind regions from remote sensing observations and more accurate assessments of radiative forcing at different regions.
Optical properties of dust particles vary with changes in their size distributions. The light scattering matrix F, a 4×4 matrix containing 16 elements Fij (i, j=1–4), is a fundamental optical property for characterizing airborne dust particles and describes the depolarization or transformation of incident light with several polarization states under the influence of particles (Quinby-Hurt et al., 2000; Volten et al., 2001). This scattering matrix is not only sensitive to size distribution but also physical features like particle shape, microstructure, and refractive index (Muñoz and Hovenier, 2011). Therefore, it can be employed as a useful parameter to provide information and implications about above features of dust particles. Based on similar operational principles, several light scattering matrix measurement apparatuses were developed by researchers over the past 2 decades (Liu et al., 2018; Muñoz et al., 2010; Volten et al., 2001; Wang et al., 2015). With the assistance of these apparatuses, scattering matrices for various mineral dust samples were experimentally determined, such as loess, clay, desert dust, volcanic ash, simulants of cosmic dust, and so on (Dabrowska et al., 2015; Escobar-Cerezo et al., 2018; Merikallio et al., 2015; Muñoz et al., 2007, 2001). In addition, the Amsterdam Database and Amsterdam–Granada Database were established in 2005 and 2012, respectively, to publish measured scattering matrices and necessary physical properties of mineral dust particles (Volten et al., 2005, 2006a; Muñoz et al., 2012).
Most of the published literature about experimental measurements of scattering matrices has focused more on similarities and discrepancies between different kinds of mineral dust or between the same kinds of dust sampled from different sources. Furthermore, some researches paid more attention to the effect of particle size distribution on scattering matrices. Olivine dust samples with four size distributions were obtained using different sieves, but there are no clear and consistent effects of size on measured scattering matrices for olivine at both 442 and 633 nm wavelengths (Muñoz et al., 2000). Forsterite samples were produced with three size distributions using dry and wet sieving methods, and comparisons of experimental scattering matrices at 632.8 nm wavelength clearly showed the influence of size (Volten et al., 2006b). Relative phase function is larger for large forsterite particles, F22∕F11 is larger for small particles, and F34∕F11 are larger for small particles at most scattering angles but there are opposite trends for the negative branches at backscattering angles, F33∕F11 and F44∕F11 are larger for small particles at forward scattering angles but are smaller at backscattering angles. Two samples of palagonite with different size distributions were prepared by heating, and analyses of measured revealed that small particles have larger values at both 488 and 647 nm wavelengths (Dabrowska et al., 2015). Three commercial samples of Arizona Road Dust consisting of ultrafine, fine, and medium particles were selected to investigate their scattering matrices, results demonstrated that ultrafine particles have the largest normalized phase function, while medium particles have the smallest F22∕F11 values (Wang et al., 2015). Lunar soil simulant JSC-1A particles were recovered and reused during scattering matrix measurement experiments: the recovered sample was larger than pristine sample, and comparative analyses indicated that large particles have larger relative phase function and , large particles have smaller F22∕F11 at forward scattering angles, and F22∕F11 for these two samples was nearly consistent at backscattering angles (Escobar-Cerezo et al., 2018). Experimentally determined for meteorites illustrated that the minimum value of for larger particles is smaller, and the maximum value of F12∕F11 for larger particles is larger (Frattin et al., 2019).
It can be concluded from above research that size distributions have inconsistent effects on scattering matrix elements for different kinds of dust particles and that there is no study paying attention to the effect of size distribution on the scattering matrix for loess dust. Therefore, loess dust samples with different size distributions were investigated in this study. An original loess sample was collected from Luochuan, the center of the CLP, after sieving to remove oversized particles, this “pristine loess” sample was used to represent loess dust that is only present in source regions. Furthermore, part of the pristine loess was ball-milled to obtain a finer “milled loess” sample that can be transported over long distances and affect regions far away from dust sources. Scattering matrices for the above loess samples with distinct size distributions were measured at 532 nm with the help of a self-developed and validated apparatus over 5–175∘ angles. Besides particle size distribution, other characteristics that might be changed during the milling process were also analyzed, such as chemical component, refractive index, and microscopic appearance. Discrepancies in angular behaviors of matrix elements were summarized and their reasons were discussed based on analyses of numerical simulations in the literature. Furthermore, synthetic scattering matrices were defined over 0–180∘, and the previously published average scattering matrix for loess was updated.
In Sect. 2, fundamental characteristics of pristine loess and milled loess samples are shown. In Sect. 3, concise descriptions of related theory, apparatus, and methods are given. In Sect. 4, measured and synthetic scattering matrices for these two samples are plotted, reasons leading to these discrepancies in matrix elements are discussed, and the previous average scattering matrix for loess is updated. Finally, in Sect. 5 conclusions are drawn.
There are two deserts in the northern part of the Chinese Loess Plateau, and according to the distances from these deserts, the CLP is roughly separated into three regions: sandy loess, loess, and clayey loess (Cao et al., 2008). An original loess dust sample was collected from Loess National Geological Park (35.76∘ N, 109.42∘ E) at Luochuan, which is in the “loess zone” at the center of the CLP. Since this park is the only national geological park in China that has typical loess geomorphology, it can be considered that the sample collected represents Chinese loess to a certain extent. Prior to laboratory investigations, oversized particles in the original sample were removed through a 50 µm sieve. Next, the original loess sample was divided into two parts, one of which was not treated any more and was referred to as pristine loess and the other was milled by a ball miller to obtain finer particles, referred to here as milled loess. It should be noted that milled loess is the same sample as the “Luochuan loess” in Liu et al. (2019). Both of these loess dust samples were investigated through light scattering matrix measurements and auxiliary analyses of other physical characteristics of particles.
The size distributions of pristine loess and milled loess were determined by a laser particle sizer (SALD-2300; Shimadzu) using a dry measurement method, dry loess particles were injected into the measurement unit of laser particle sizer, and three independent repeated measurements were conducted for each sample. As can be seen from Fig. 1, the size of pristine loess shows a distinct bimodal distribution, and after ball-milling the particle size of milled loess becomes a unimodal distribution. From the viewpoint of atmospheric particle transportation, the majority (number fraction more than 70 %) of pristine loess particles have radii larger than 5 µm with peaks at about 3.9 and 10.7 µm, and thus this sample can be used to represent coarse dust that only affects source regions, like Xi'an city (Yan et al., 2015). On the other hand, almost all particles of the milled loess sample have radii smaller than 2 µm with a peak at about 0.55 µm and can be used as a representative of fine dust that can be transported over long distances and affect regions far away from dust sources.
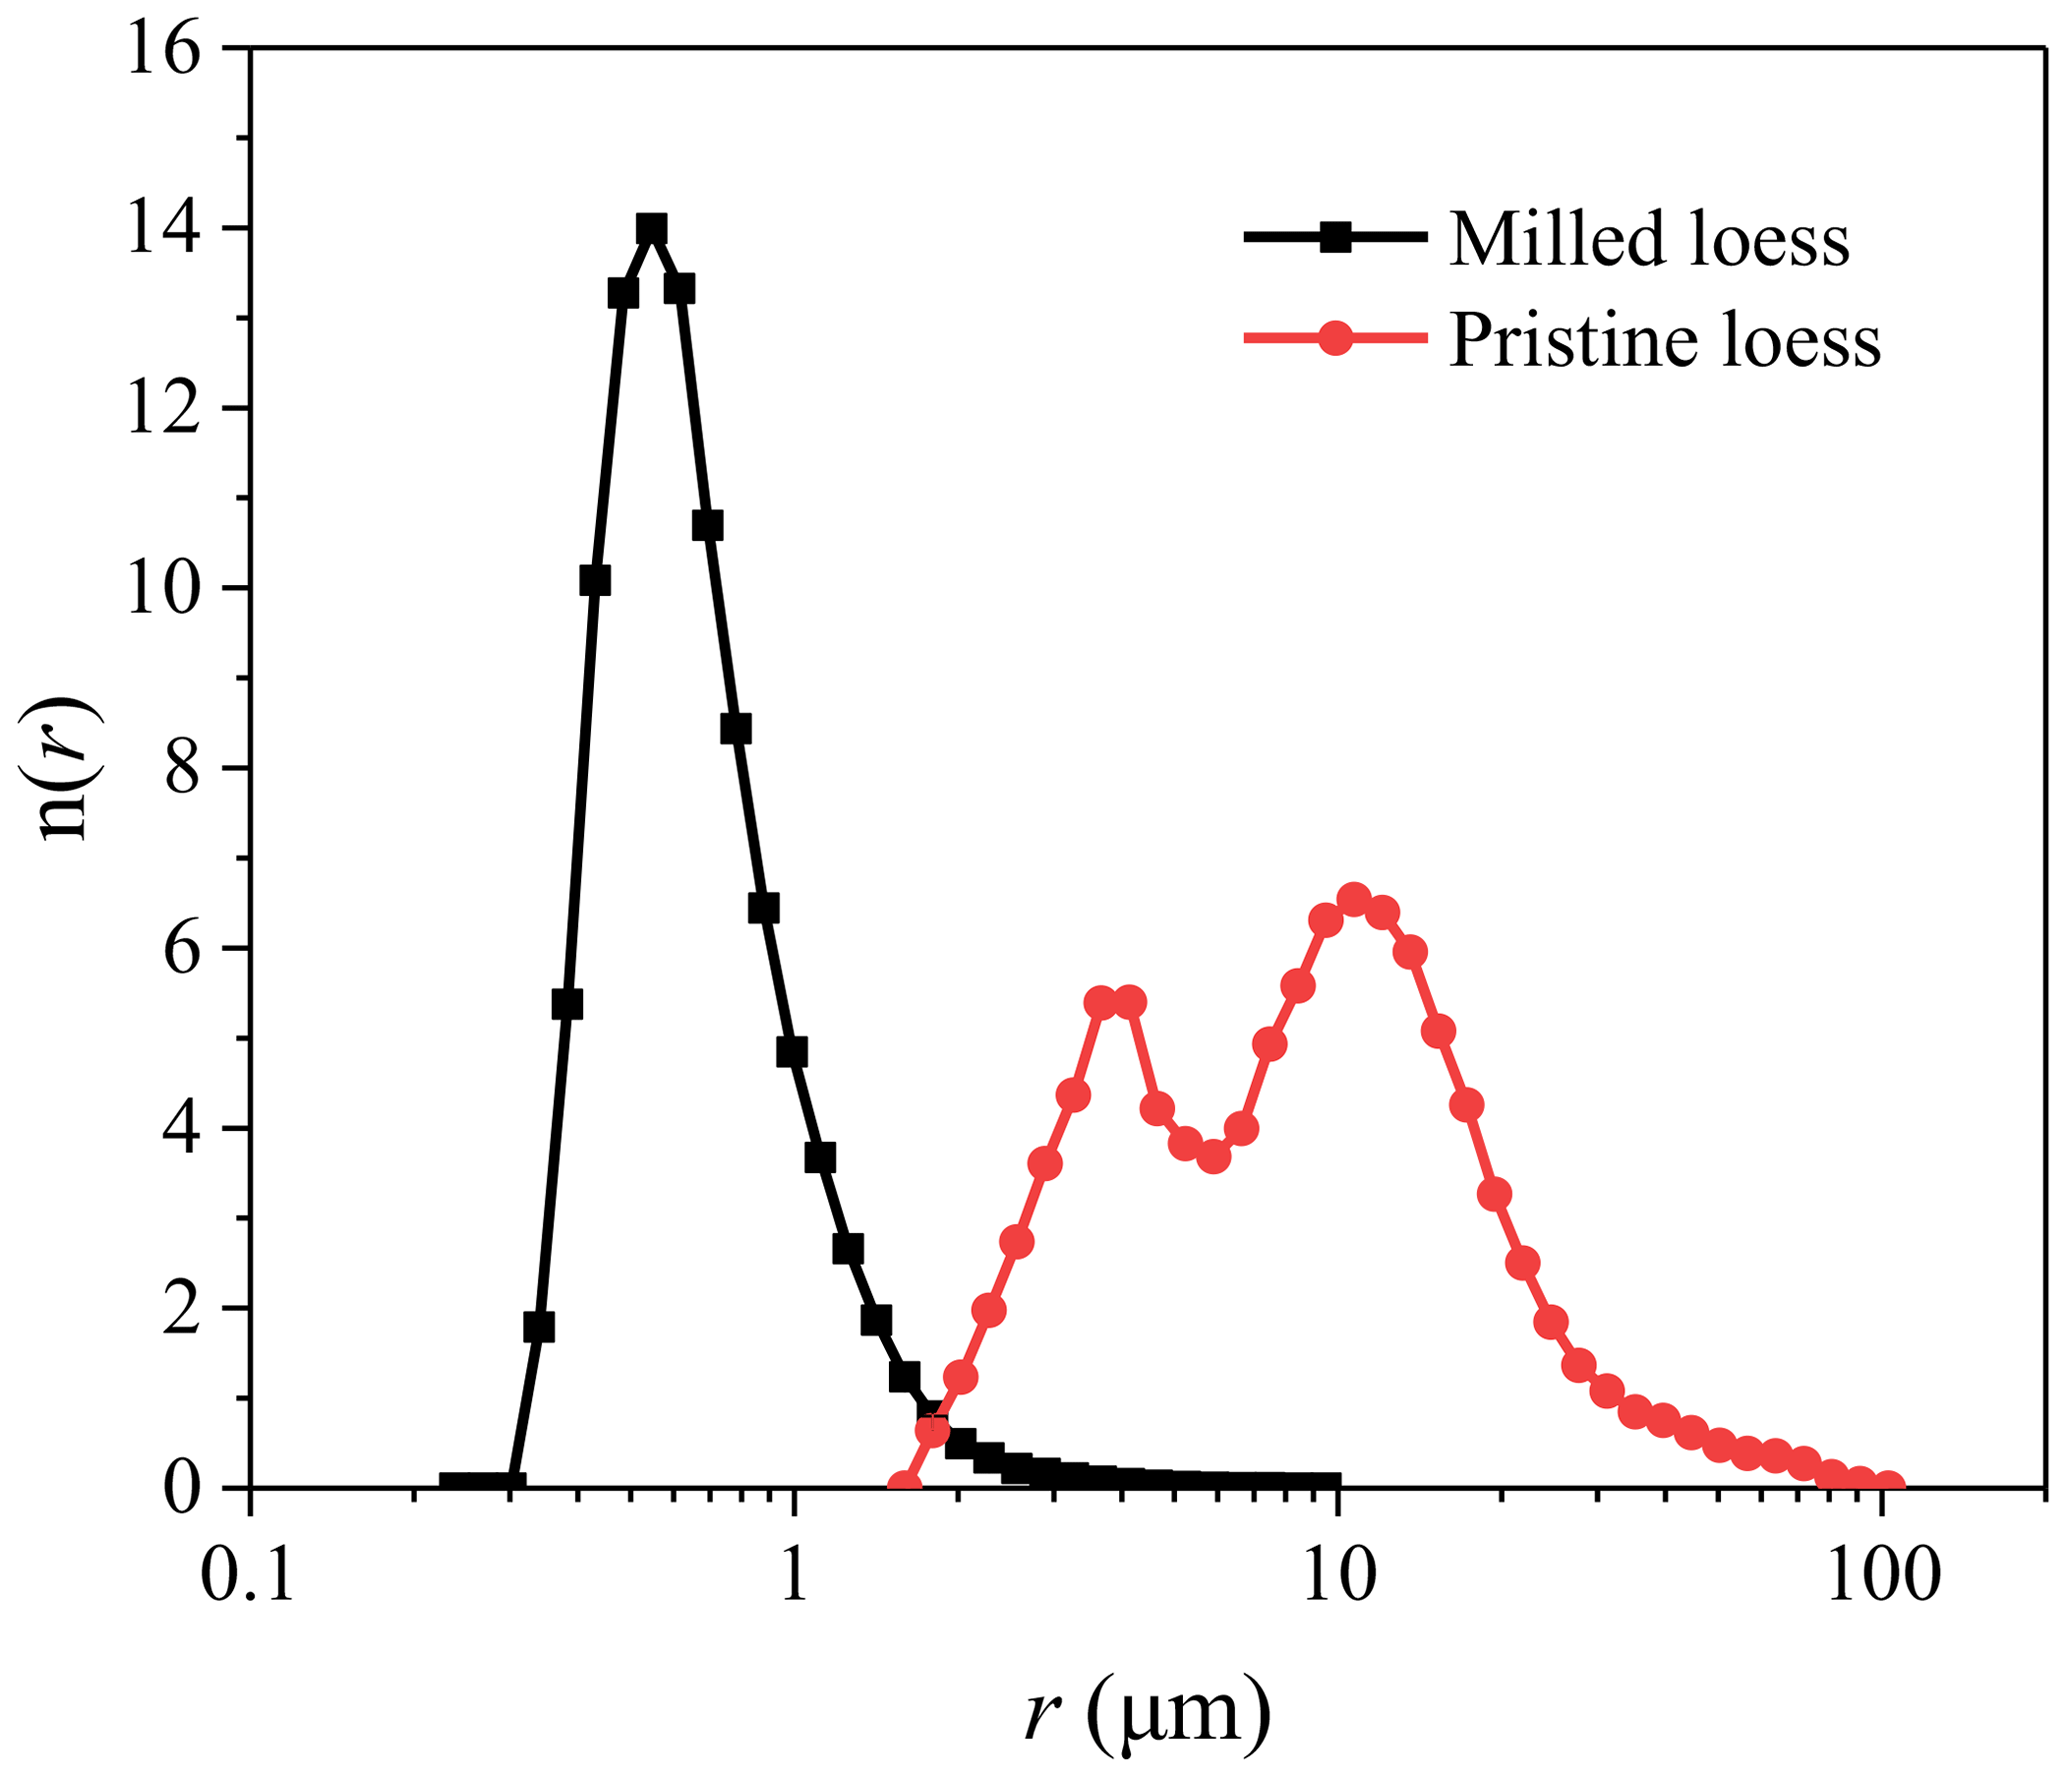
Figure 1Normalized number size distributions n(r) of pristine loess and milled loess. Radius r is plotted in logarithmic scale, and error bars are small and covered by symbols.
SALD-2300 has 84 scattering light detectors in all, including 78 forward detector elements, 1 side detector, and 5 back detectors. The best fitted number size distribution and refractive index m can be obtained by reproducing the measured angular distribution of light intensity based on Mie calculations. Liu et al. (2003) revealed that Mie theory can be used to reproduce forward scattering intensities of nonspherical particles with moderate aspect ratios at scattering angles smaller than 20∘. Since over 70 % of the detectors of SALD-2300 are set at angles smaller than 20∘, the retrieved size distributions of nonspherical loess dust based on Mie theory are of relatively high accuracy. During size distribution measurements of loess samples, the retrieval ranges of the real part Re(m) and imaginary part Im(m) of the refractive index were preset as 1.45–1.75 and 0–0.05, respectively (Volten et al., 2001). The smallest calculation steps of Re(m) and Im(m) are 0.05 and 0.01, respectively. As shown in Table 1, the optimal refractive indices are 1.65+0i for pristine loess and 1.70+0i for milled loess, and larger particles have relatively small real part of refractive index, which is similar to the results of Kinoshita (2001) and is caused by the nonspherical nature of loess dust. Retrieved refractive index of particles based on measured light intensity distribution is a kind of optically equivalent refractive index, which is close to the inherent refractive index of the measured particles. Based on measured size distributions, effective radius reff and standard deviation σeff can be derived (Hansen and Travis, 1974):
where n(r)dr stands for number proportion of equivalent spheres whose radii vary between r and r+dr. Results of reff and σeff are shown in Table 1. In addition, effective size parameters for pristine loess and milled loess were also calculated and presented in Table 1.
Table 1Size parameters and refractive indices of pristine loess and milled loess.

Scanning electron microscope (SEM) images for pristine loess (Fig. 2a) and milled loess (Fig. 2b) are displayed in Fig. 2. Obviously, particles of these two samples exhibit various shapes, and all of the particles can be classified as having an irregular shape. Almost all particles have rough surfaces, and some particles even have sharp edges. After the milling process, there are more sub-micrometer particles in the milled loess sample, some small particles even stuck on the rough surfaces of large particles due to electrostatic forces.

During the dry milling process, nonmetal grinding balls with a 6 mm diameter were used, the main component of which is ZrO2. For the purpose of detecting whether the chemical compositions of loess samples were changed, the oxide compositions of samples before and after milling process, that is the pristine loess and milled loess, were determined using a X-ray fluorescence spectrometer (XRF-1800, Shimadzu), the detection limit of which is 0.0001 wt %. As can be seen in Table 2, the largest change of content occurs for SiO2, but this change is less than 2.5 % and even smaller than the errors between repeat measurements for the pristine loess sample, and the change of ZrO2 is only about 0.03 %. It can be concluded that the composition differences between these two samples are very small, and that the milling process has little effect on the chemical composition of loess samples.
Table 2Chemical components of pristine loess and milled loess measured by XRF-1800.
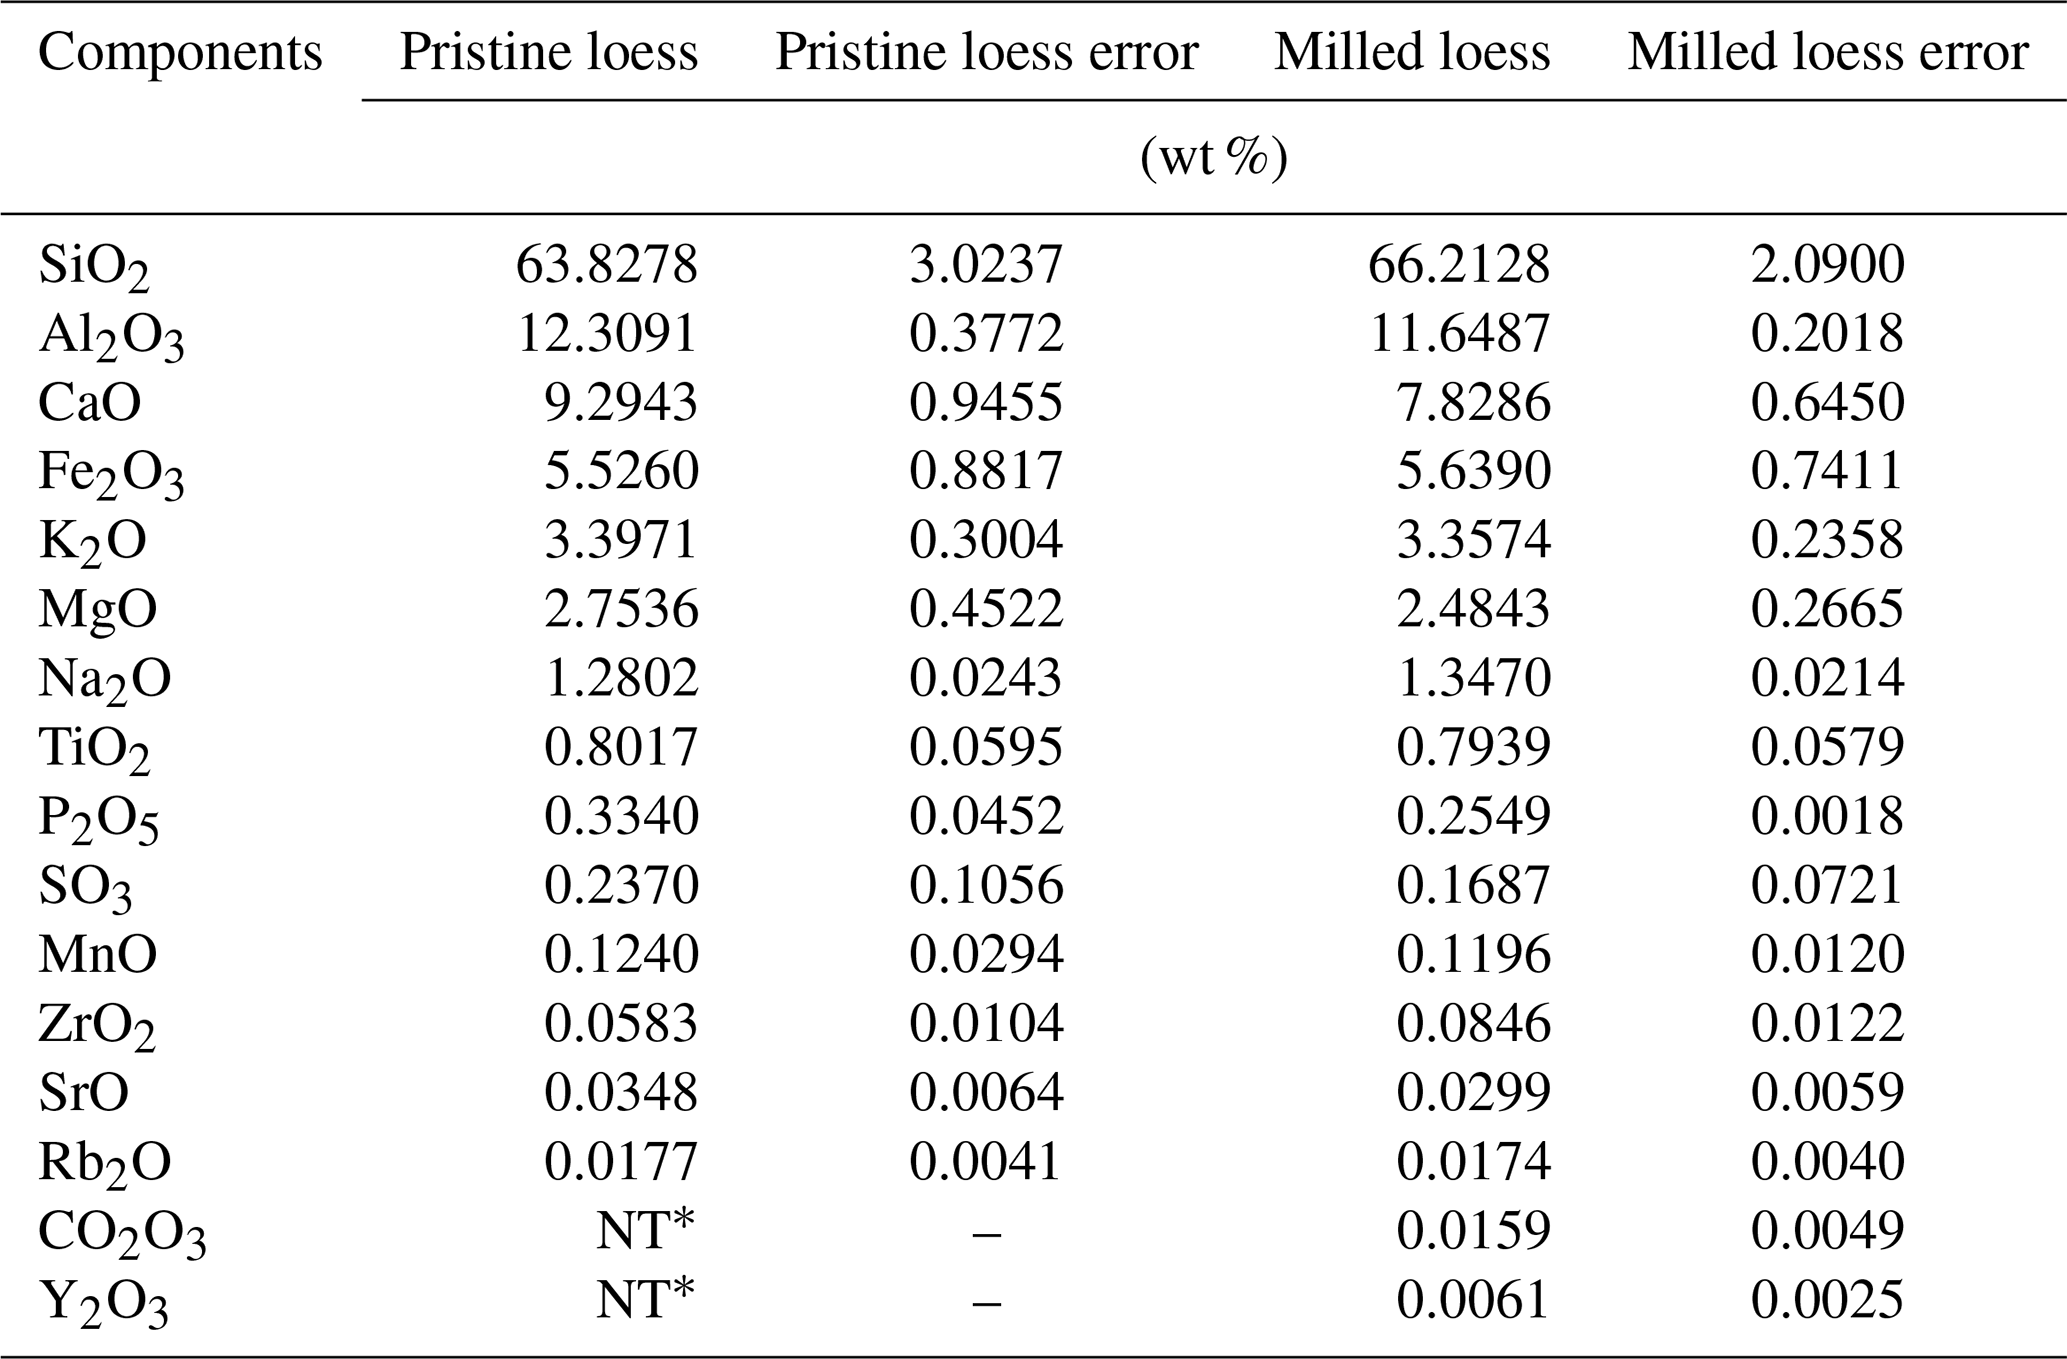
* NT: not detected.
3.1 Basic concepts about the light scattering matrix
Four Stokes parameters (I, Q, U and V) are usually used to introduce the intensity and polarization properties of light beam, and these parameters can form a column vector, the so-called Stokes vector (Hovenier et al., 2014; Hulst and van de Hulst, 1981). If a cloud of particles is present in light path, the incident beam will be scattered and part of light will deviate from the original direction of propagation. When multi-scattering plays a negligible role, the intensity and polarization state of scattered beams can be calculated from that of the incident beam using a 4×4 light scattering matrix F (Mishchenko and Yurkin, 2017):
where λ stands for wavelength of light, D is the distance between particle cloud and light detector, scattering angle θ is the angle between incident and scattered beams, and the scattering plane contains both incident and scattered beams.
Generally, F has 16 independent matrix elements Fij with i, j=1–4. Two basic assumptions are commonly used to simplify the general form of the light scattering matrix. The first is that all scattering planes are equivalent for particles that have random orientations. Thus, scattering directions can be adequately depicted by θ. The second assumption is that particles and their mirror counterparts exist in the same number in a cloud of randomly oriented particles. Based on the above random orientation and mirror particle assumptions, the number of independent elements in the light scattering matrix can be reduced from 16 to 6 (Mishchenko and Yurkin, 2017):
Matrix elements describe the depolarization or transformation of incident light with several polarization states under the influence of particles (Quinby-Hurt et al., 2000). F11 describes the transformation of incident light intensity. F12 describes the depolarization of 0 and 90∘ linearly polarized light relative to the scattering plane. F22 describes the transformation of ±90∘ polarized incident light to ±90∘ polarized scattered light and it is equal to F11 for spherical particles. F33 and F44 describe the transformation of ±45∘ linearly (or circularly) polarized incident light to ±45∘ linearly (or circularly) polarized scattered light, and these two elements are equal for spherical particles. F34 describes the transformation of circularly polarized incident light to ±45∘ linearly polarized scattered light. Almost all of these matrix elements are sensitive to physical properties of particles, including size distribution, particle shape, microstructure, and refractive index.
3.2 Experimental apparatus and methodology
Figure 3 shows a layout diagram of the improved scattering matrix measurement apparatus. The main improvement is that angle coverage at backscattering angles is extended to 175∘, while the maximum coverage of the previous apparatus is 160∘ (Liu et al., 2018). The wavelength of incident beam is 532 nm, and there is a linear polarizer P and an electro-optic modulator (EOM) in its propagation path. Subsequently, the modulated incident light is scattered by particles in the scattering zone, which are dispersed using an aerosol generator and are sprayed upwards to the scattering zone through a nozzle. A photomultiplier, referred to here as the “detector”, a 532 nm quarter-wave plate Q, and a polarizer A are fixed on a rotation arm, the rotational center of which coincides with the center of the aerosol nozzle. Before scattered light is detected by the detector, it successively passes through Q and A. The dark cassette used to encapsulate the detector, Q and A in the previous apparatus, are removed, which facilitates the adjustment of orientation angles of Q and A. The detector is controlled by an electric rotary table and is able to scan scattering angles from 5 to 175∘. Another photomultiplier referred to here as the “monitor” is fixed at a 30∘ scattering angle to record variations in dust aerosols. The combination of an electro-optic modulator and lock-in detector allows multiple scattering matrix elements or their sums to be measured simultaneously. All of the matrix elements of dust samples can be determined as functions of scattering angles with the help of various combinations of orientation angles of the above optical elements, as shown in Table 3, which is the same method as that of Muñoz et al. (2010).

Table 3Combinations of orientation angles of the optical axes of all the optical elements.
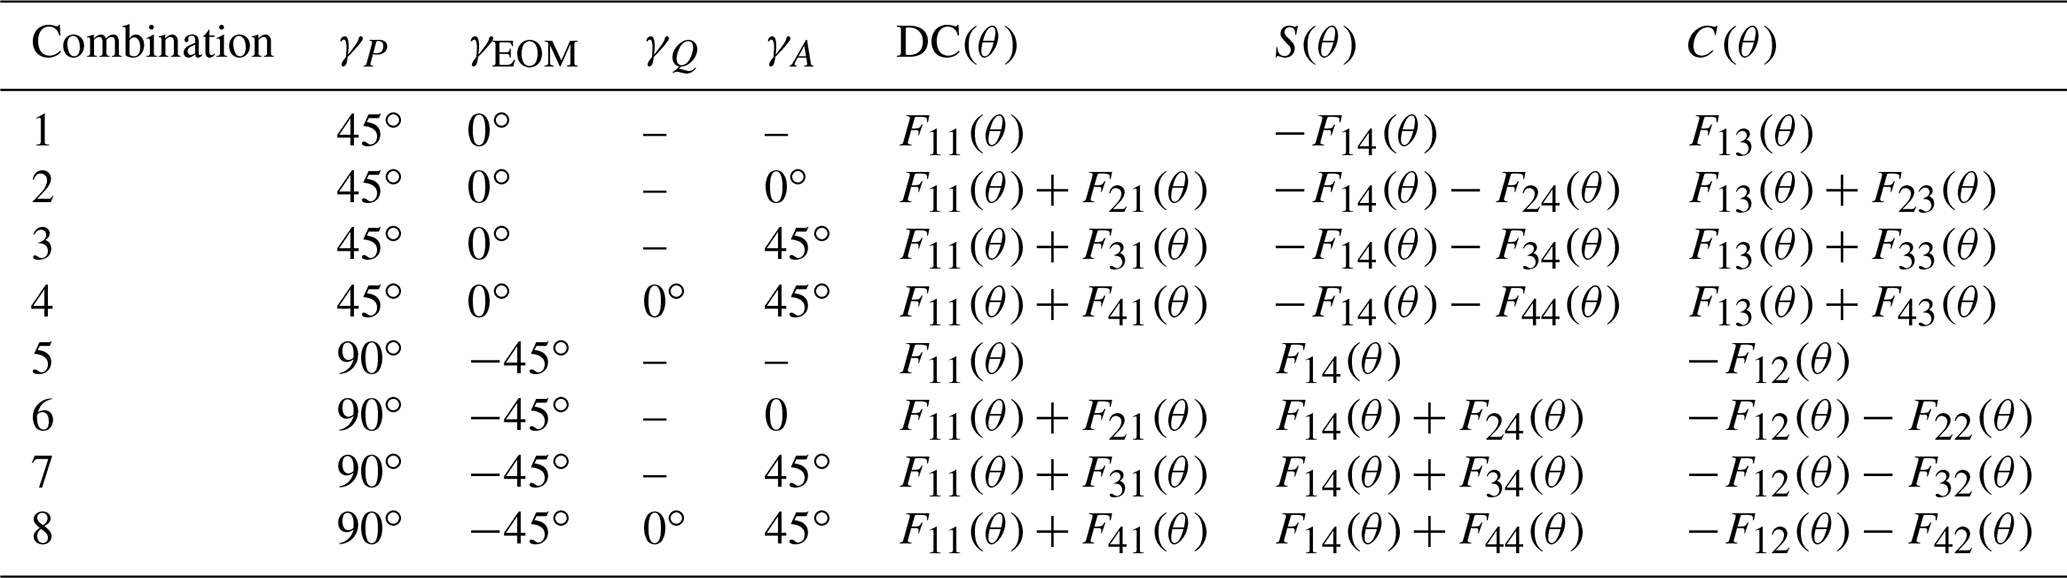
Multiple groups of values of measurable quantities, i.e., the DC component DC(θ), first harmonics S(θ), and second harmonics C(θ) of the voltage signal, are recorded at every scattering angle for each combination of optical elements. The first step of data processing is to average these recorded values and get their errors. The optical platform is surrounded by black curtains to avoid the effect of environmental stray light, and background signals need to be measured and subtracted. Fluctuations of dust aerosols can be eliminated by normalizing measurements of the detector using DC(30∘) measured by the monitor. Scattering matrix elements can be extracted from preprocessed DC(θ), S(θ), and C(θ) according to Table 3. Subsequently, F11(θ) is normalized to 1 at a 10∘ scattering angle, and the remaining matrix elements Fij(θ) are normalized to F11(θ) at the same angle. Finally, whether measurement results of scattering matrix satisfy the Cloude coherency matrix test should be examined (Hovenier and Van Der Mee, 1996). Three iterations of measurements are performed for each particle sample, the final results are the average of three groups of experiments, and the errors are also calculated, including errors during every measurement and errors for repeat measurements. Furthermore, the improved apparatus is validated using water droplets. All six measured nonzero scattering matrix elements for water droplets can be fitted well using Mie calculation results, indicating that the measurement accuracy of the apparatus is satisfactory. For more details about the measurement principles and validation methods of the apparatus, see Liu et al. (2018).
A dust generator (RBG 1000; Palas) was applied to disperse loess particles (Liu et al., 2018). Re-aerosolized dust aerosols were transported to scattering matrix measurement apparatus using a conductive tube and sprayed upwards to the scattering zone through a nozzle. Some particles of each loess sample were sprayed into vessels or sprayed onto copper grids for subsequent size distribution measurements or SEM analyses. For reliable measurements of the scattering matrix, experiments should be conducted under single-scattering conditions. This requires that the number of particles in the scattering zone is appropriate, as too many particles will result in significant multiple scattering, while too few particles will not satisfy the two basic assumptions mentioned above. Incident light intensity I0 and transmitted light intensity I passing through particle cloud can be related by the following equation (Mokhtari et al., 2005):
where stands for average number of scattering events. P(2)/P(1) is used to describe the ratio of occurrence probability of double-scattering event (the simplest form of multi-scattering) to that of the single-scattering event (Wang et al., 2015).
4.1 Experimentally determined scattering matrices
The measurements of were conducted before the measurements of matrix elements using each orientation angle combination of the above optical elements. Measured for both pristine loess and milled loess were smaller than about 0.006. In other words, the occurrence probability of the double-scattering event was about 170 times smaller than that of single-scattering event, and thus the double-scattering event can be ignored without question. For each loess sample, three independent and replicated measurements of the scattering matrix were conducted, and experimental results shown in the figures are averaged values for those three measurements. Examinations showed that measurements of loess samples satisfy the Cloude coherency matrix test at all scanned scattering angles.
Experimentally determined scattering matrix elements for both pristine loess and milled loess are shown in Fig. 4. Only six element ratios are plotted because the other ratios do not deviate from zero within experimental error. Matrix element ratios for pristine loess and milled loess present similar angular behaviors; more specifically, angular distributions of all six nonzero matrix element ratios are limited to narrow regions. Normalized phase functions show strong forward scattering peaks, and variations at backscattering directions are not obvious, which are typical behaviors for mineral dust with irregular shapes (Muñoz et al., 2012; Volten et al., 2001). For non-polarized incident beams, is equivalent to the degree of linear polarization. Measured angular behaviors of are bell-shaped, and the largest values appear at near side-scattering directions. There are negative branches of at both forward and backward scattering directions. F22(θ)∕F11(θ) is proof of the nonsphericity and irregularity of particles, since it is constant 1 for homogeneous spheres. Measured values of these two loess samples show that F22(θ)∕F11(θ) values deviate from constant 1 at nearly all angles scanned. The ratios F33(θ)∕F11(θ) and F44(θ)∕F11(θ) can be analyzed jointly because these two ratios are equal for particles with spherical shape. But for loess dust, F33(θ)∕F11(θ) values are smaller than F44(θ)∕F11(θ), especially at backscattering directions. The ratios F34(θ)∕F11(θ) show near “S-type” shapes and the maxima are obtained at about 115∘ angle. For scattering angles smaller than 50∘ and larger than 170∘, values of F34(θ)∕F11(θ) are negative.

Figure 4Measured nonzero scattering matrices for pristine loess and milled loess. It should be noted that milled loess is the same sample as the Luochuan loess in Liu et al. (2019).
On the other hand, the discrepancies in matrix elements for pristine loess and milled loess are still obvious. Compared to milled loess, there is an enlargement of relative phase function at a 5∘ scattering angle for pristine loess. The relative phase function for pristine loess is also larger at side and back scattering angles. As for ratio , small milled loess has smaller maximum values at near side scattering angles, while large pristine loess has relatively large maximum values. In contrast with ratio , measured F34(θ)∕F11(θ) has a larger maximum for the small milled loess sample. Experimentally determined F22(θ)∕F11(θ) values of milled loess are larger than pristine loess, especially at side and back scattering angles. It should be noted that discrepancies in measured F22(θ)∕F11(θ) cannot be directly used to indicate difference of particle irregularity because optical calculations of Gaussian spheres showed that F22(θ)∕F11(θ) values are sensitive not only to particle irregularity but also to size distribution (Liu et al., 2015). As for ratios F33(θ)∕F11(θ) and F44(θ)∕F11(θ), the measurements for milled loess are larger than those for pristine loess. In short, these discrepancies in scattering matrices between pristine loess and milled loess are inconsistent with those for all other kinds of dust with different size distributions in the literature.
In this study, several fundamental properties of loess dust samples were characterized for auxiliary analyses. As shown in Table 1, effective radii for pristine loess and milled loess are 49.40 and 2.35 µm, respectively. The real part of the refractive index for pristine loess is 1.65 and that for milled loess is 1.70. Table 2 shows that the changes in chemical components are negligible. Therefore, it is reasonable to suspect that distinctions in angular distributions of measured scattering matrix elements for two loess samples may be mainly caused by different size distributions (effective radii differ by more than 20 times), while differences in other factors such as refractive index and microstructure have relatively small contributions in leading to different scattering matrices.
Literature focused on optical modeling of irregular mineral dust was analyzed to find reasonable explanations for the differences in scattering matrix elements for milled loess and pristine loess samples. Numerical simulations of Gaussian spheres showed that as effective size parameter increases from 30 to 600, phase function F11 and F33∕F11 and F44∕F11 ratios decrease, the maximum of ratio F34∕F11 decreases and its negative branches at forward scattering and backscattering directions become small, the maximum of ratio increases, and the ratio F22∕F11 increases, especially at backscattering angles (Liu et al., 2015). When Gaussian spheres become more nonspherical and irregular, phase function F11 and , F22∕F11, F33∕F11 and F44∕F11 ratios show different trends compared with the influences of increasing effective radius, while the F34∕F11 ratio shows a similar trend (Liu et al., 2015). Zubko et al. (2007) showed that as the surfaces of Gaussian particles become rougher, the ratio tends to be larger. Simulations of agglomerated debris particles showed that while the imaginary part of refractive index varies in the range 0–0.01, the scattering matrix elements remain almost unchanged (Zubko et al., 2013). However, calculations of Gaussian particles conducted by Muinonen et al. (2007) showed that an increase in refractive index (both real and imaginary part) leads to smaller and F22∕F11. In summary, different factors have different or similar effects on certain matrix elements. The discrepancies in scattering matrices for milled loess and pristine loess can be mainly interpreted from the perspective of difference of effective radii, while differences in other factors such as refractive index and microstructure have relatively small contributions, and Gaussian spheres may be promising models for simulating scattering matrix for loess dust.
In this work, a relatively good case is presented to show the effect of size distribution of loess dust on scattering matrices because effective radii of pristine loess and milled loess differ by more than 20 times. The influence of loess particle size is roughly verified through qualitative analyses of simulation results of Gaussian spheres, which deepen the understanding of this effect. For more detailed explanations, quantitative analyses are still needed based on many more optical simulations of Gaussian spheres. However, besides size distribution, physical properties such as refractive index and microstructure also play important roles in determining scattering matrices of dust particles. When the difference in particle size distributions or effective radii is relatively small, the influences of other factors may become dominant or unignorable. This may be the reason why the effect of size distribution on measured scattering matrices for olivine samples cannot be concluded clearly (Muñoz et al., 2000), and this may also be the reason why effective radii cannot be used to explain all the discrepancies in matrix elements for forsterite samples based on simulation results of Gaussian spheres (Volten et al., 2006b). Another reason may be that Gaussian spheres are not suitable models to reproduce the measured scattering matrix for forsterite dust (Volten et al., 2006b), as optical modeling of irregular mineral dust is still a challenging subject.
4.2 Synthetic scattering matrices
Laboratory measurements of scattering matrices only cover scattering angles from 5 to 175∘. In order to obtain a scattering matrix over 0–180∘, synthetic scattering matrices Fsyn are constructed by a combination of numerical simulation and extrapolation of experimental measurements (Dabrowska et al., 2015; Escobar-Cerezo et al., 2018).
Measured F11(θ) values are normalized to 1 at 10∘, and these relative phase functions are the same for measured and synthetic scattering matrices for the same sample (Escobar-Cerezo et al., 2018):
where is the synthetic phase function that must fulfill the following normalized equation:
SEM images for both loess samples show that most particles have relatively moderate aspect ratios. Therefore, Lorenz–Mie theory can be used to calculate forward peaks of synthetic phase functions at angles smaller than 5∘ because for particles that have moderate aspect ratios forward peaks of synthetic phase functions mainly depend on size distributions and depend little on particle shapes (Liu et al., 2003). Refractive indices and size distributions for pristine loess and milled loess obtained from a particle sizer are used in Lorenz–Mie calculations. For the 180∘ scattering angle, multi-order polynomial extrapolation is used on the basis of experimentally determined relative phase functions. Following this, the calculated forward peak of the phase function and relative phase function after extrapolation are incorporated at a 5∘ angle to construct the synthetic phase function. Whether the synthetic phase function satisfies Eq. (7) should be checked. Otherwise, increase or decrease measured relative phase function at a 5∘ angle within measurement error and repeat the merging process and checking process until Eq. (7) is satisfied.
As for other matrix element ratios Fij(θ)∕F11(θ), a set of constraints at 0 and 180∘ scattering angles should be taken into consideration (Hovenier et al., 2014; Mishchenko and Hovenier, 1995):
Synthetic values for ratio F22∕F11 at a 180∘ angle for pristine loess and milled loess are obtained by ninth-order polynomial extrapolations. Then F33∕F11 and F44∕F11 at 180∘ are calculated according to Eqs. (10) and (11), respectively. In addition, the right-hand (left-hand) derivative at 0∘ (180∘) for each scattering matrix element must be 0 (Hovenier and Guirado, 2014). In Fig. 5, synthetic matrices for pristine loess and milled loess are illustrated.
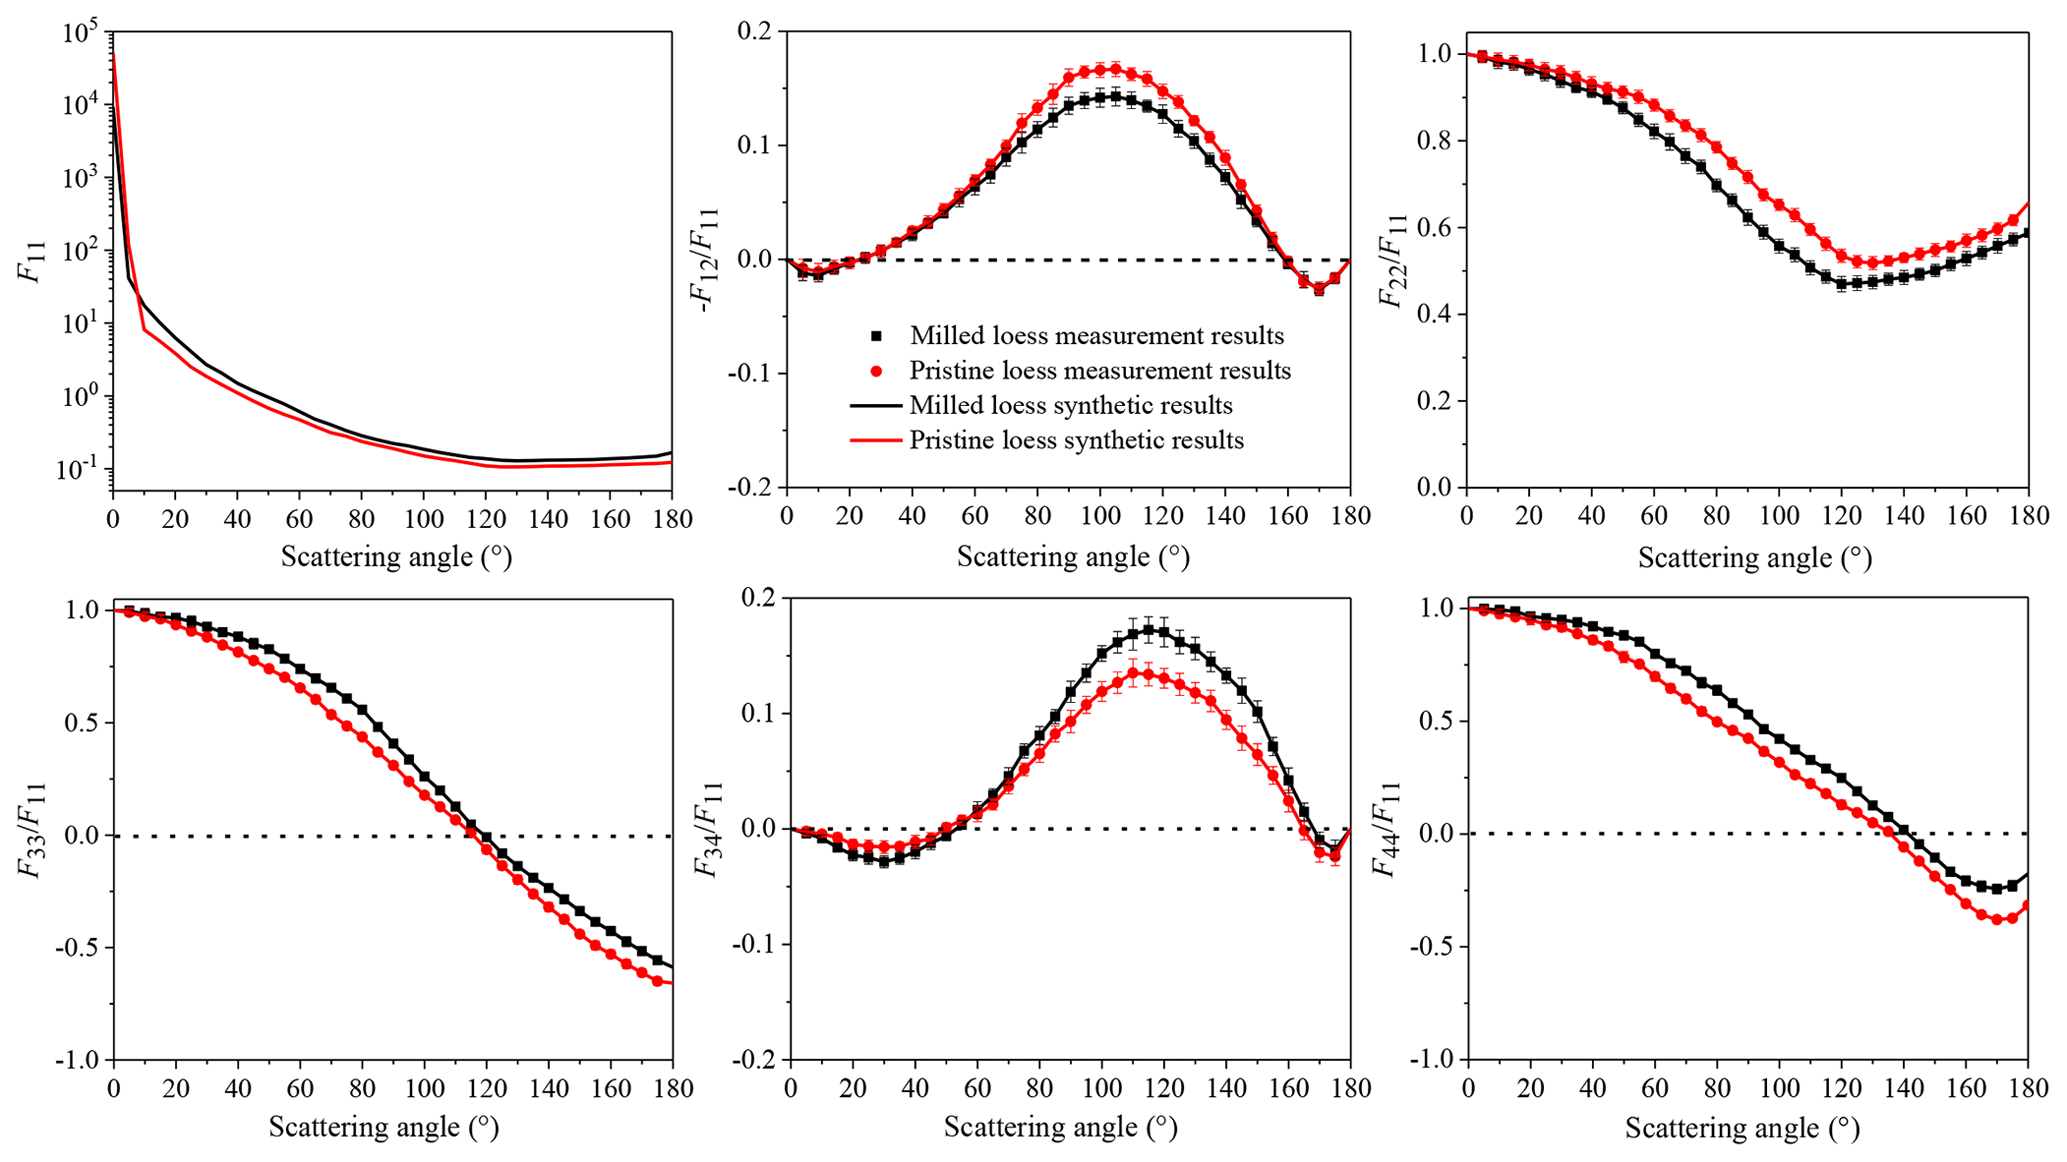
Figure 5Synthetic scattering matrices for milled loess and pristine loess. Lines are synthetic matrices, and plots are measured values.
Using the extrapolated value of F22∕F11 at a 180∘ scattering angle, the backscattering depolarization ratio δL can be calculated, which is an essential parameter for aerosol lidar observations (Mishchenko et al., 2002).
Calculated backscattering depolarization ratios for pristine loess and milled loess are 0.21 and 0.26, respectively; milled loess has a larger value of δL. Direct measurements of backscattering depolarization ratios of Arizona Test Dust with different size distributions at both 355 and 532 nm wavelengths also showed that δL values for small particles are larger than those for large particles, and this discrepancy is more pronounced at 532 nm (Miffre et al., 2016).
Finally, the previously published average scattering matrix for loess, which consists of results for Hungary loess, milled Yangling loess, and milled Luochuan loess (the latter two were sampled from the CLP), was updated using new sample pristine loess from Luochuan by averaging synthetic matrices for different loess samples. In other words, the differences between the average matrix before and after the update are also the differences between pristine loess and the other three samples, and differences among these three samples can be found in Liu et al. (2019). As shown in Fig. 6, compared to other three samples, phase function for pristine loess has larger forward scattering peaks and smaller values in the side scattering and backscattering directions. Pristine loess has larger values at near side scattering angles, has larger F22(θ)∕F11(θ) values at almost all scattering angles, and has smaller values of both F33(θ)∕F11(θ) and F44(θ)∕F11(θ) in backscattering directions, when compared with the other three samples.
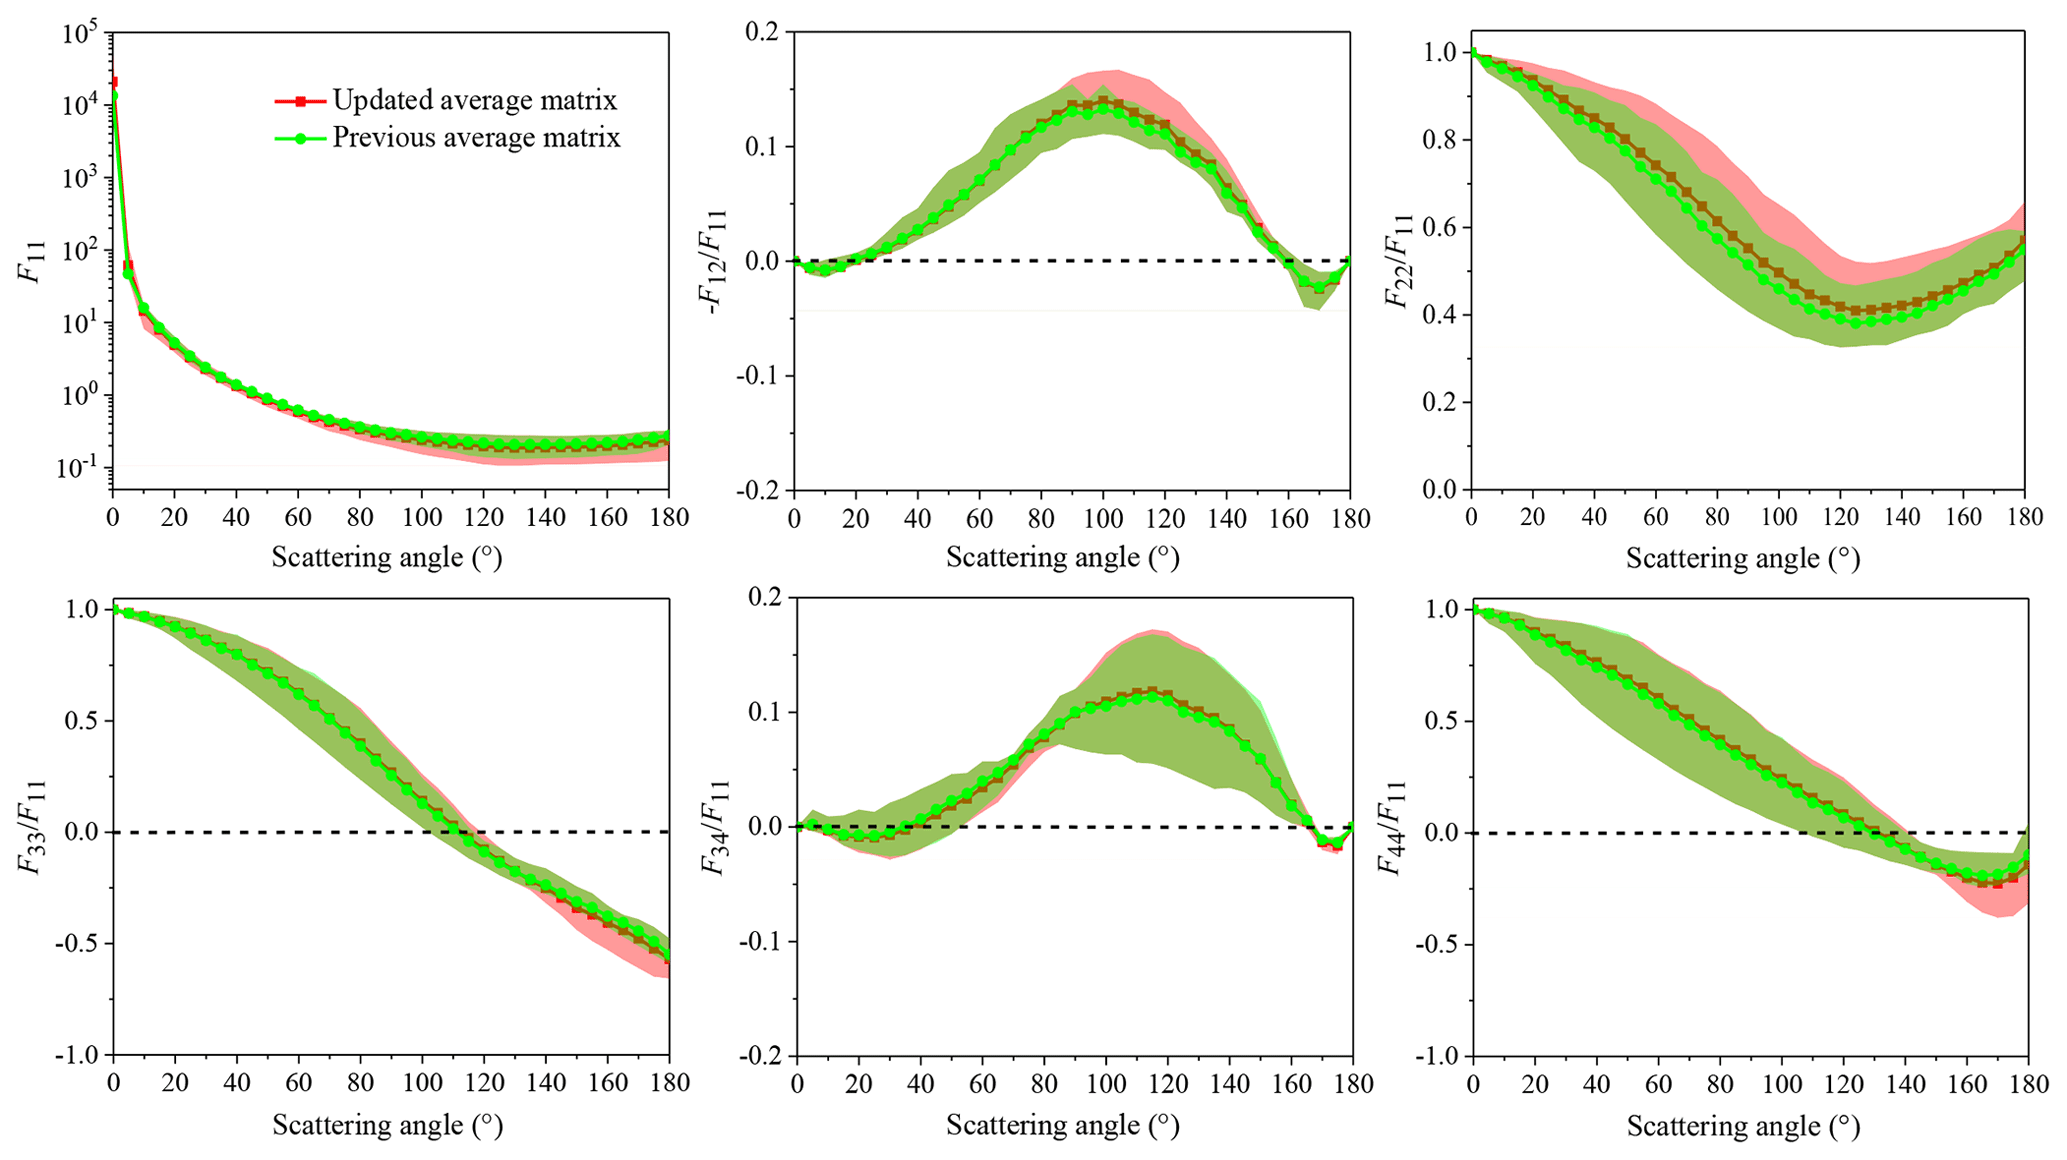
Figure 6Previous average scattering matrix (green lines and solid circles) (Liu et al., 2019) and updated average scattering matrix (red lines and solid squares) for loess dust. Reddish and green shadows stand for the areas covered by results for different loess samples with or without pristine loess included, respectively.
Asian dust contributes a lot to global atmospheric dust aerosol, and the Chinese Loess Plateau (CLP) is one of the main origins of Asian dust. Loess dust aerosols originating from the CLP are expected to potentially affect the radiation balance at both source areas and downwind areas far from sources because dust particles with different sizes can be transported over different distances. In this study, an original loess sample was collected from Luochuan, which is centrally located on the CLP. Subsequently, two loess samples with different size distributions were prepared for laboratory investigations. A pristine loess sample was used to represent loess dust that affects source regions only, and a milled loess sample that was ball-milled from pristine loess was used to represent loess dust that can be transported over long distances. Light scattering matrices for both pristine loess and milled loess samples at a 532 nm wavelength were measured from 5 to 175∘ scattering angles. Besides particle size distribution, other basic properties were also characterized, such as chemical component, refractive index, and microscopic appearance.
Even through experimentally determined angular behaviors of scattering matrix elements for pristine loess and milled loess are similar, there are still obvious discrepancies in matrix elements. More specifically, for small milled loess, relative phase function and and F22(θ)∕F11(θ) ratios are smaller than that for coarse pristine loess, while F33(θ)∕F11(θ), F34(θ)∕F11(θ), and F44(θ)∕F11(θ) ratios are larger than that for coarse pristine loess. These discrepancies are unique and different from those for other kinds of dust with distinct size distributions published in literatures. Qualitative analyses of optical simulations of various morphological models showed that the large difference in size distributions (effective radii differ by more than 20 times) caused by milling process plays a major role in leading to discrepancies in scattering matrices for these two samples, while differences in factors such as refractive index and microstructure have relatively small and recessive contributions. Gaussian sphere models may have good application prospects for optical modeling of loess dust, while more detailed quantitative verification using measured physical properties is still needed.
Synthetic scattering matrices for both pristine loess and milled loess were defined over 0–180∘ scattering angle, and the previously presented average scattering matrix for loess was updated with the new coarse pristine loess sample included. The phase function F11(θ) in the updated average matrix has larger forward scattering peaks and smaller values at side and backward scattering angles than that in the previous average matrix. Compared to the previous average matrix, the updated average matrix has larger at side scattering angles and has smaller F33(θ)∕F11(θ) and F44(θ)∕F11(θ) at backscattering angles. F22(θ)∕F11(θ) experiences the largest change between before and after the update, having values that are enlarged at almost all scattering angles.
In this study, scattering matrices for Chinese loess samples with large differences in their size distributions are investigated. Based on all the measurements, suitable shape distributions of spheroids can be obtained, which are useful for the retrievals of airborne loess dust properties at both source and downwind areas in China or even East Asia. On the other hand, the updated average scattering matrix for loess is meaningful for the validation of exiting models and the development of more advanced morphological models suitable for loess dust, which are also useful to finally improve the retrieval accuracies of dust aerosol properties.
Fine loess dust sampled from Luochuan and Yangling, two regions of the Chinese Loess Plateau, were investigated by Liu et al. (2019). Local variations in loess dust also have obvious effects on the measured scattering matrices. It should be noted that all these samples investigated still cannot completely represent the loess in Chinese Loess Plateau and China, so one of the efforts in the future is to investigate more loess samples collected from more regions and with more size distributions. Accordingly, the average scattering matrix for loess will be updated constantly. On the other hand, the validation of existing models and the development of more advanced models through reproducing measured scattering matrices using optical simulation results are also meaningful research directions.
All the data involved in this study are available online at https://github.com/liujia93/Scattering-matrix-for-loess-dust (last access: 17 July 2020, Liu, 2020).
JL and QZ designed the experiments. JL conducted the measurements. YH drew the layout diagram. All authors discussed the results. JL wrote the manuscript.
The authors declare that they have no conflict of interest.
We are very grateful to Zidong Nie for loess dust sampling. We are also very grateful to Engineer Chao Li from Hefei Ke Jing Materials Technology Co., Ltd. for milling the dust particles.
This research has been supported by the National Natural Science Foundation of China (grant nos. U1733126 and 41675024), the National Key Research and Development Program of China (grant nos. 2016YFC0800100 and 2017YFC0805100), and the Fundamental Research Funds for Central Universities of China (grant no. WK2320000040).
This paper was edited by Alexander Kokhanovsky and reviewed by six anonymous referees.
Cao, J., Chow, J., Watson, J., Wu, F., Han, Y., Jin, Z., Shen, Z., and An, Z.: Size-differentiated source profiles for fugitive dust in the Chinese Loess Plateau, Atmos. Environ., 42, 2261–2275, https://doi.org/10.1016/j.atmosenv.2007.12.041, 2008.
Dabrowska, D. D., Muñoz, O., Moreno, F., Ramos, J. L., Martínez-Frías, J., and Wurm, G.: Scattering matrices of Martian dust analogs at 488 nm and 647 nm, Icarus, 250, 83–94, https://doi.org/10.1016/j.icarus.2014.11.024, 2015.
Dubovik, O., Sinyuk, A., Lapyonok, T., Holben, B. N., Mishchenko, M., Yang, P., Eck, T. F., Volten, H., Muñoz, O., Veihelmann, B., van der Zande, W. J., Leon, J. F., Sorokin, M., and Slutsker, I.: Application of spheroid models to account for aerosol particle nonsphericity in remote sensing of desert dust, J. Geophys. Res., 111, D11208, https://doi.org/10.1029/2005JD006619, 2006.
Dubovik, O., Herman, M., Holdak, A., Lapyonok, T., Tanré, D., Deuzé, J. L., Ducos, F., Sinyuk, A., and Lopatin, A.: Statistically optimized inversion algorithm for enhanced retrieval of aerosol properties from spectral multi-angle polarimetric satellite observations, Atmos. Meas. Tech., 4, 975–1018, https://doi.org/10.5194/amt-4-975-2011, 2011.
Espinosa, W. R., Martins, J. V., Remer, L. A., Dubovik, O., Lapyonok, T., Fuertes, D., Puthukkudy, A., Orozco, D., Ziemba, L., Thornhill, K. L., and Levy, R.: Retrievals of aerosol size distribution, spherical fraction and complex refractive index from airborne in situ angular light scattering and absorption measurements, J. Geophys. Res.-Atmos., 124, 7997–8024, https://doi.org/10.1029/2018JD030009, 2019.
Escobar-Cerezo, J., Muñoz, O., Moreno, F., Guirado, D., Gómez Martín, J., Goguen, J., Garboczi, E., Chiaramonti, A., Lafarge, T., and West, R.: An Experimental Scattering Matrix for Lunar Regolith Simulant JSC-1A at Visible Wavelengths, Astrophys. J. Suppl. S, 235, 19, https://doi.org/10.3847/1538-4365/aaa6cc, 2018.
Frattin, E., Muñoz, O., Moreno, F., Nava, J., Escobar-Cerezo, J., Gomez Martin, J., Guirado, D., Cellino, A., Coll, P., Raulin, F., Bertini, I., Cremonese, G., Lazzarin, M., Naletto, G., and La Forgia, F.: Experimental phase function and degree of linear polarization of cometary dust analogues, Mon. Not. R. Astron. Soc., 484, 2198–2211, https://doi.org/10.1093/mnras/stz129, 2019.
Han, Y., Cao, J., Posmentier, E. S., Fung, K., Tian, H., and An, Z.: Particulate-associated potentially harmful elements in urban road dusts in Xi'an, China, Appl. Geochem., 23, 835–845, https://doi.org/10.1016/j.apgeochem.2007.09.008, 2008.
Hansen, J. E. and Travis, L. D.: Light scattering in planetary atmospheres, Space Sci. Rev., 16, 527–610, https://doi.org/10.1007/BF00168069, 1974.
Herman, M., Deuze, J. L., Marchand, A., Roger, B., and Lallart, P.: Aerosol remote sensing from POLDER/ADEOS over the ocean: Improved retrieval using a nonspherical particle model, J. Geophys. Res., 110, D10S02, https://doi.org/10.1029/2004JD004798, 2005.
Hovenier, J. W. and Guirado, D.: Zero slopes of the scattering function and scattering matrix for strict forward and backward scattering by mirror symmetric collections of randomly oriented particles, J. Quant. Spectrosc. Ra., 133, 596–602, https://doi.org/10.1016/j.jqsrt.2013.09.023, 2014.
Hovenier, J. W. and Van der Mee, C. V. M.: Testing scattering matrices: a compendium of recipes, J. Quant. Spectrosc. Ra., 55, 649–661, https://doi.org/10.1016/0022-4073(96)00008-8, 1996.
Hovenier, J. W., Van der Mee, C. V., and Domke, H.: Transfer of polarized light in planetary atmospheres: basic concepts and practical methods, Springer Science & Business Media, Berlin/Heidelberg, Germany, 2014.
Hulst, H. C. and van de Hulst, H. C.: Light scattering by small particles, Courier Corporation, North Chelmsford, MA, 1981.
Jaffe, D., Anderson, T., Covert, D., Kotchenruther, R., Trost, B., Danielson, J., Simpson, W., Berntsen, T., Karlsdottir, S., Blake, D., Harris, J., Carmichael, G., and Uno, I.: Transport of Asian air pollution to North America, Geophys. Res. Lett., 26, 711–714, https://doi.org/10.1029/1999GL900100, 1999.
Kinoshita, T.: The method to determine the optimum refractive index parameter in the laser diffraction and scattering method, Adv. Powder Technol., 12.4, 589–602, https://doi.org/10.1163/15685520152756697, 2001.
Li, L., Li, Z., Dubovik, O., Zhang, X., Li, Z., Ma, J., and Wendisch, M.: Effects of the shape distribution of aerosol particles on their volumetric scattering properties and the radiative transfer through the atmosphere that includes polarization, Appl. Optics, 58, 1475–1484, https://doi.org/10.1364/AO.58.001475, 2019.
Liu, J.: Scattering-matrix-for-loess-dust, GitHub, available at: https://github.com/liujia93/Scattering-matrix-for-loess-dust, last access: 17 July 2020.
Liu, J., Yang, P., and Muinonen, K.: Dust-aerosol optical modeling with Gaussian spheres: Combined invariant-imbedding T-matrix and geometric-optics approach, J. Quant. Spectrosc. Ra., 161, 136–144, https://doi.org/10.1016/j.jqsrt.2015.04.003, 2015.
Liu, J., Zhang, Y., Zhang, Q., and Wang, J.: Scattering Matrix for Typical Urban Anthropogenic Origin Cement Dust and Discrimination of Representative Atmospheric Particulates, J. Geophys. Res.-Atmos., 123, 3159–3174, https://doi.org/10.1002/2018JD028288, 2018.
Liu, J., Zhang, Y., and Zhang, Q.: Laboratory measurements of light scattering matrices for resuspended small loess dust particles at 532 nm wavelength, J. Quant. Spectrosc. Ra., 229, 71–79, https://doi.org/10.1016/j.jqsrt.2019.03.010, 2019.
Liu, L., Mishchenko, M. I., Hovenier, J. W., Volten, H., and Muñoz, O.: Scattering matrix of quartz aerosols: comparison and synthesis of laboratory and Lorenz–Mie results, J. Quant. Spectrosc. Ra., 79, 911–920, https://doi.org/10.1016/S0022-4073(02)00328-X, 2003.
Merikallio, S., Muñoz, O., Sundström, A. M., Virtanen, T. H., Horttanainen, M., de Leeuw, G., and Nousiainen, T.: Optical modeling of volcanic ash particles using ellipsoids, J. Geophys. Res.-Atmos., 120, 4102–4116, https://doi.org/10.1002/2014JD022792, 2015.
Miffre, A., Mehri, T., Francis, M., and Rairoux, P.: UV-VIS depolarization from Arizona Test Dust particles at exact backscattering angle, J. Quant. Spectrosc. Ra., 169, 79–90, https://doi.org/10.1016/j.jqsrt.2015.09.016, 2016.
Mishchenko, M. I. and Hovenier, J.: Depolarization of light backscattered by randomly oriented nonspherical particles, Opt. Lett., 20, 1356–1358, https://doi.org/10.1364/OL.20.001356, 1995.
Mishchenko, M. I. and Yurkin, M. A.: On the concept of random orientation in far-field electromagnetic scattering by nonspherical particles, Opt. Lett., 42, 494–497, https://doi.org/10.1364/OL.42.000494, 2017.
Mishchenko, M. I., Geogdzhayev, I. V., Liu, L., Ogren, J. A., Lacis, A. A., Rossow, W. B., Hovenier, J. W., Volten, H., and Muñoz, O.: Aerosol retrievals from AVHRR radiances: effects of particle nonsphericity and absorption and an updated long-term global climatology of aerosol properties, J. Quant. Spectrosc. Ra., 79, 953–972, https://doi.org/10.1016/S0022-4073(02)00331-X, 2003.
Mishchenko, M. I., Travis, L. D., and Lacis, A. A.: Scattering, absorption, and emission of light by small particles, Cambridge University press, Cambridge, UK, 2002.
Mokhtari, T., Sorensen, C. M., and Chakrabarti, A.: Multiple-scattering effects on static light-scattering optical structure factor measurements, Appl. Optics, 44, 7858–7861, https://doi.org/10.1364/AO.44.007858, 2005.
Muinonen, K., Zubko, E., Tyynelä, J., Shkuratov, Y. G., and Videen, G.: Light scattering by Gaussian random particles with discrete-dipole approximation, J. Quant. Spectrosc. Ra., 106, 360–377, https://doi.org/10.1016/j.jqsrt.2007.01.049, 2007.
Muñoz, O. and Hovenier, J.: Laboratory measurements of single light scattering by ensembles of randomly oriented small irregular particles in air. A review, J. Quant. Spectrosc. Ra., 112, 1646–1657, https://doi.org/10.1016/j.jqsrt.2011.02.005, 2011.
Muñoz, O., Volten, H., De Haan, J., Vassen, W., and Hovenier, J.: Experimental determination of scattering matrices of olivine and Allende meteorite particles, Astron. Astrophys., 360, 777–788, 2000.
Muñoz, O., Volten, H., De Haan, J., Vassen, W., and Hovenier, J.: Experimental determination of scattering matrices of randomly oriented fly ash and clay particles at 442 and 633 nm, J. Geophys. Res., 106, 22833–22844, https://doi.org/10.1029/2000JD000164, 2001.
Muñoz, O., Volten, H., Hovenier, J., Nousiainen, T., Muinonen, K., Guirado, D., Moreno, F., and Waters, L.: Scattering matrix of large Saharan dust particles: experiments and computations, J. Geophys. Res., 112, D13215, https://doi.org/10.1029/2006JD008074, 2007.
Muñoz, O., Moreno, F., Guirado, D., Ramos, J., López, A., Girela, F., Jerónimo, J., Costillo, L., and Bustamante, I.: Experimental determination of scattering matrices of dust particles at visible wavelengths: The IAA light scattering apparatus, J. Quant. Spectrosc. Ra., 111, 187–196, https://doi.org/10.1016/j.jqsrt.2009.06.011, 2010.
Muñoz, O., Moreno, F., Guirado, D., Dabrowska, D., Volten, H., and Hovenier, J.: The Amsterdam–Granada light scattering database, J. Quant. Spectrosc. Ra., 113, 565–574, https://doi.org/10.1016/j.jqsrt.2012.01.014, 2012.
Quinby-Hurt, M. S., Hull, P. G., and Hunt, A. J.: Polarized light scattering in the marine environment, in: Light Scattering by Nonspherical Particles: Theory, Measurements, and Applications, edited by: Mishchenko, M. I., Hovenier, J. W., and Travis, L. D., Academic Press, San Diego, California, USA, 528–529, 2000.
Satheesh, S. and Moorthy, K. K.: Radiative effects of natural aerosols: A review, Atmos. Environ., 39, 2089–2110, https://doi.org/10.1016/j.atmosenv.2004.12.029, 2005.
Shen, X., Sun, J., Zhang, Y., Zhang, X., Wang, T., Wang, Y., Zhang, L., Fan, R., Zhao, Y., and Wang, D.: The influence of Asian dust outflow on particle microphysical and optical properties at Mt. Tai in central east China, Atmos. Environ., 143, 27–38, https://doi.org/10.1016/j.atmosenv.2016.08.014, 2016.
Sokolik, I. N. and Toon, O. B.: Direct radiative forcing by anthropogenic airborne mineral aerosols, Nature, 381, 681–683, https://doi.org/10.1038/381681a0, 1996.
Tegen, I. and Fung, I.: Contribution to the atmospheric mineral aerosol load from land surface modification, J. Geophys. Res., 100, 18707–18726, https://doi.org/10.1029/95JD02051, 1995.
Titos, G., Ealo, M., Román, R., Cazorla, A., Sola, Y., Dubovik, O., Alastuey, A., and Pandolfi, M.: Retrieval of aerosol properties from ceilometer and photometer measurements: long-term evaluation with in situ data and statistical analysis at Montsec (southern Pyrenees), Atmos. Meas. Tech., 12, 3255–3267, https://doi.org/10.5194/amt-12-3255-2019, 2019.
Tsai, F., Tu, J. Y., Hsu, S. C., and Chen, W. N.: Case study of the Asian dust and pollutant event in spring 2006: Source, transport, and contribution to Taiwan, Sci. Total Environ., 478, 163–174, https://doi.org/10.1016/j.scitotenv.2014.01.072, 2014.
Volten, H., Munoz, O., Rol, E., de Haan, J. F., Vassen, W., Hovenier, J. W., Muinonen, K., and Nousiainen, T.: Scattering matrices of mineral aerosol particles at 441.6 nm and 632.8 nm, J. Geophys. Res., 106, 17375–17401, https://doi.org/10.1029/2001JD900068, 2001.
Volten, H., Munoz, O., Hovenier, J., de Haan, J., Vassen, W., Van der Zande, W., and Waters, L.: WWW scattering matrix database for small mineral particles at 441.6 and 632.8 nm, J. Quant. Spectrosc. Ra., 90, 191–206, https://doi.org/10.1016/j.jqsrt.2004.03.011, 2005.
Volten, H., Muñoz, O., Hovenier, J., and Waters, L.: An update of the Amsterdam light scattering database, J. Quant. Spectrosc. Ra., 100, 437–443, https://doi.org/10.1016/j.jqsrt.2005.11.055, 2006a.
Volten, H., Munoz, O., Brucato, J., Hovenier, J., Colangeli, L., Waters, L., and Van der Zande, W.: Scattering matrices and reflectance spectra of forsterite particles with different size distributions, J. Quant. Spectrosc. Ra., 100, 429–436, https://doi.org/10.1016/j.jqsrt.2005.11.074, 2006b.
Wang, Y., Chakrabarti, A., and Sorensen, C. M.: A light-scattering study of the scattering matrix elements of Arizona Road Dust, J. Quant. Spectrosc. Ra., 163, 72–79, https://doi.org/10.1016/j.jqsrt.2015.05.002, 2015.
Xuan, J., Sokolik, I. N., Hao, J., Guo, F., Mao, H., and Yang, G.: Identification and characterization of sources of atmospheric mineral dust in East Asia, Atmos. Environ. 38, 6239–6252, https://doi.org/10.1016/j.atmosenv.2004.06.042, 2004.
Yan, Y., Sun, Y., Ma, L., and Long, X.: A multidisciplinary approach to trace Asian dust storms from source to sink, Atmos. Environ., 105, 43–52, https://doi.org/10.1016/j.atmosenv.2015.01.039, 2015.
Zhang, K. and Gao, H.: The characteristics of Asian-dust storms during 2000–2002: From the source to the sea, Atmos. Environ., 41, 9136–9145, https://doi.org/10.1016/j.atmosenv.2007.08.007, 2007.
Zhang, K., Chai, F., Zhang, R., and Xue, Z.: Source, route and effect of Asian sand dust on environment and the oceans, Particuology, 8, 319–324, https://doi.org/10.1016/j.partic.2010.03.016, 2010.
Zhang, X., Gong, S., Shen, Z., Mei, F., Xi, X., Liu, L., Zhou, Z., Wang, D., Wang, Y., and Cheng, Y.: Characterization of soil dust aerosol in China and its transport and distribution during 2001 ACE-Asia: 1. Network observations, J. Geophys. Res., 108, 4261, https://doi.org/10.1029/2002JD002632, 2003.
Zubko, E., Muinonen, K., Shkuratov, Y., Videen, G., and Nousiainen, T.: Scattering of light by roughened Gaussian random particles, J. Quant. Spectrosc. Ra., 106, 604–615, https://doi.org/10.1016/j.jqsrt.2007.01.050, 2007.
Zubko, E., Muinonen, K., Muñoz, O., Nousiainen, T., Shkuratov, Y., Sun, W., and Videen, G.: Light scattering by feldspar particles: comparison of model agglomerate debris particles with laboratory samples, J. Quant. Spectrosc. Ra., 131, 175–187, https://doi.org/10.1016/j.jqsrt.2013.01.017, 2013.