the Creative Commons Attribution 4.0 License.
the Creative Commons Attribution 4.0 License.
 | 21 Aug 2020
Joint analysis of convective structure from the APR-2 precipitation radar and the DAWN Doppler wind lidar during the 2017 Convective Processes Experiment (CPEX)
Svetla Hristova-Veleva
Stephen L. Durden
Simone Tanelli
Ousmane Sy
G. David Emmitt
Steve Greco
Sara Q. Zhang
The mechanisms linking convection and cloud dynamical processes are major factors in much of the uncertainty in both weather and climate prediction. Further constraining the uncertainty in convective cloud processes linking 3-D air motion and cloud structure through models and observations is vital for improvements in weather forecasting and understanding limits on atmospheric predictability. To date, there have been relatively few airborne observations specifically targeted for linking the 3-D air motion surrounding developing clouds to the subsequent development (or nondevelopment) of convective precipitation. During the May–June 2017 Convective Processes Experiment (CPEX), NASA DC-8-based airborne observations were collected from the JPL Ku- and Ka-band Airborne Precipitation Radar (APR-2) and the 2 µm Doppler Aerosol Wind (DAWN) lidar during approximately 100 h of flight. For CPEX, the APR-2 provided the vertical air motion and structure of the cloud systems in nearby precipitating regions where DAWN is unable to sense. Conversely, DAWN sampled vertical wind profiles in aerosol-rich regions surrounding the convection but is unable to sense the wind field structure within most clouds. In this paper, the complementary nature of these data are presented from the 10–11 June flight dates, including the APR-2 precipitation structure and Doppler wind fields as well as adjacent wind profiles from the DAWN data.
- Article
(13167 KB) - Full-text XML
- BibTeX
- EndNote


The mechanisms linking convection and cloud dynamical processes are major factors in much of the uncertainty in both weather and climate prediction. The associated mesoscale convective systems (MCSs) produce much of the Earth's rainfall and are responsible for the bulk of the heat and moisture transport from the Earth's surface into the upper troposphere. The cold pool dynamics are thought to be an important mechanism to facilitate the development of MCSs in the tropical atmosphere (Chen et al., 2015; Zuidema et al., 2017), as are interactions between individual isolated convective storms (Raymond et al., 2015). These atmospheric boundaries can have a significant impact on deep convection, affecting its initiation, updraft strength and longevity. The intensity and size of the cold pools are strongly dependent upon the vertical distribution of the temperature and humidity as well as the vertical shear of the horizontal wind. While the overall processes responsible for these interactions have been identified for some time, their precise nature and interactions remain under-constrained by observations due to the difficulty of obtaining accurate, vertically resolved pressure, temperature, wind and water vapor in the proximity of developing convective clouds. Moreover, increasing evidence points to control of convection by the relatively smaller and more variable amount of moisture above the boundary layer in the free troposphere (Schiro and Neelin, 2019). Further constraining the uncertainty in convective cloud processes linking 3-D air motion and cloud structure through models and observations is vital for improvements in weather forecasting and understanding limits on atmospheric predictability.
The resolution of the precipitation radar onboard the Tropical Rainfall Measuring Mission (TRMM; 1997–2014) and the subsequent Global Precipitation Measurement (GPM; 2014–current) missions (4 km horizontal resolution; 250 m vertical) has enabled numerous observation-based studies of the MCS convective structure and features (Jiang et al., 2011). However, the dynamical (air motion) wind field associated with MCS features at this scale not well-represented by current space-based wind profile observing capabilities. The majority of available atmospheric wind observations are primarily water vapor and cloud-tracked atmospheric motion wind vectors (AMVs) derived from operational geostationary satellites (Velden et al, 2005), which can be refreshed as quickly as 15 min but are mainly indicative of large-scale middle- to upper-level air motion patterns. Observations of wind vectors in the periphery of smaller-scale cloud systems, especially in the 2 km nearest the Earth (the approximate delineation of the boundary layer), are much less abundant. Outside ground-based profiling networks, very few over-ocean wind profile observations at a similar GPM-like horizontal resolution are available.
A space-based Doppler wind lidar (DWL) capability has been envisioned as one means to overcome this observational shortcoming (Baker et al., 2014). Over the past decade, airborne DWL field campaigns have been conducted (Lux et al., 2018), recently in preparation for the deployment (August 2018) of the first-ever spaceborne DWL, the Atmospheric Dynamics Mission (ADM-Aeolus) of the European Space Agency (ESA) (Stoffelen et al., 2005). Aeolus provides vertical profiles of the horizontal line-of-sight (LOS) winds at an ≈100 km horizontal resolution and 200 km separation between profiles, with a main application to numerical weather prediction data assimilation (Horányi et al., 2015). Observations from campaigns with a DWL such as the THORPEX Pacific Asian Regional Campaign (TPARC) were largely focused on the improvement of tropical cyclone forecasts (Pu et al., 2010). These airborne campaigns have validated the capabilities of a DWL to provide wind profiles in the boundary layer (Bucci et al., 2018; Zhang et al., 2018). There has been relatively less focus on the collection and analysis of airborne DWL observations in relation to the convective processes linking air motion and the transport of water vapor near clouds, as well as the subsequent development (or nondevelopment) of convection. One main reason is that previous campaigns often lacked nadir-scanning Doppler precipitation radar capabilities on the same aircraft to enable matched radar–DWL observations. A scanning precipitation radar provides the actual 3-D representation of the condensed water mass field as well as the vertical Doppler winds and associated microphysical vertical structure (Rowe and Houze, 2014; Rowe et al., 2012). These data provide one means to validate the forecasted model precipitation structure (e.g., the presence or absence of convection, timing, location) that results when the DWL wind vectors are assimilated into cloud-resolving models.
In this paper, airborne DWL and Doppler precipitation radar observations are presented from the NASA-sponsored Convective Processes Experiment (CPEX), which took place between 25 May and 24 June 2017 based in Fort Lauderdale, FL. The goals of CPEX were to improve the understanding of convective processes during initiation, growth and dissipation using a combination of observations and cloud-resolving models. This included, in particular, measuring what combinations of environmental structure and observed convective properties, such as vertical velocity and reflectivity profiles, result in the rapid upscale growth of a convective system into a large organized mesoscale convective system (MCS) or, alternatively, result in failure to grow or rapid decay. This paper will describe and present only the airborne precipitation radar and DAWN observations; a separate paper will present the associated mesoscale model simulations and DAWN data assimilation experiment results (Zhang et al., 2019).
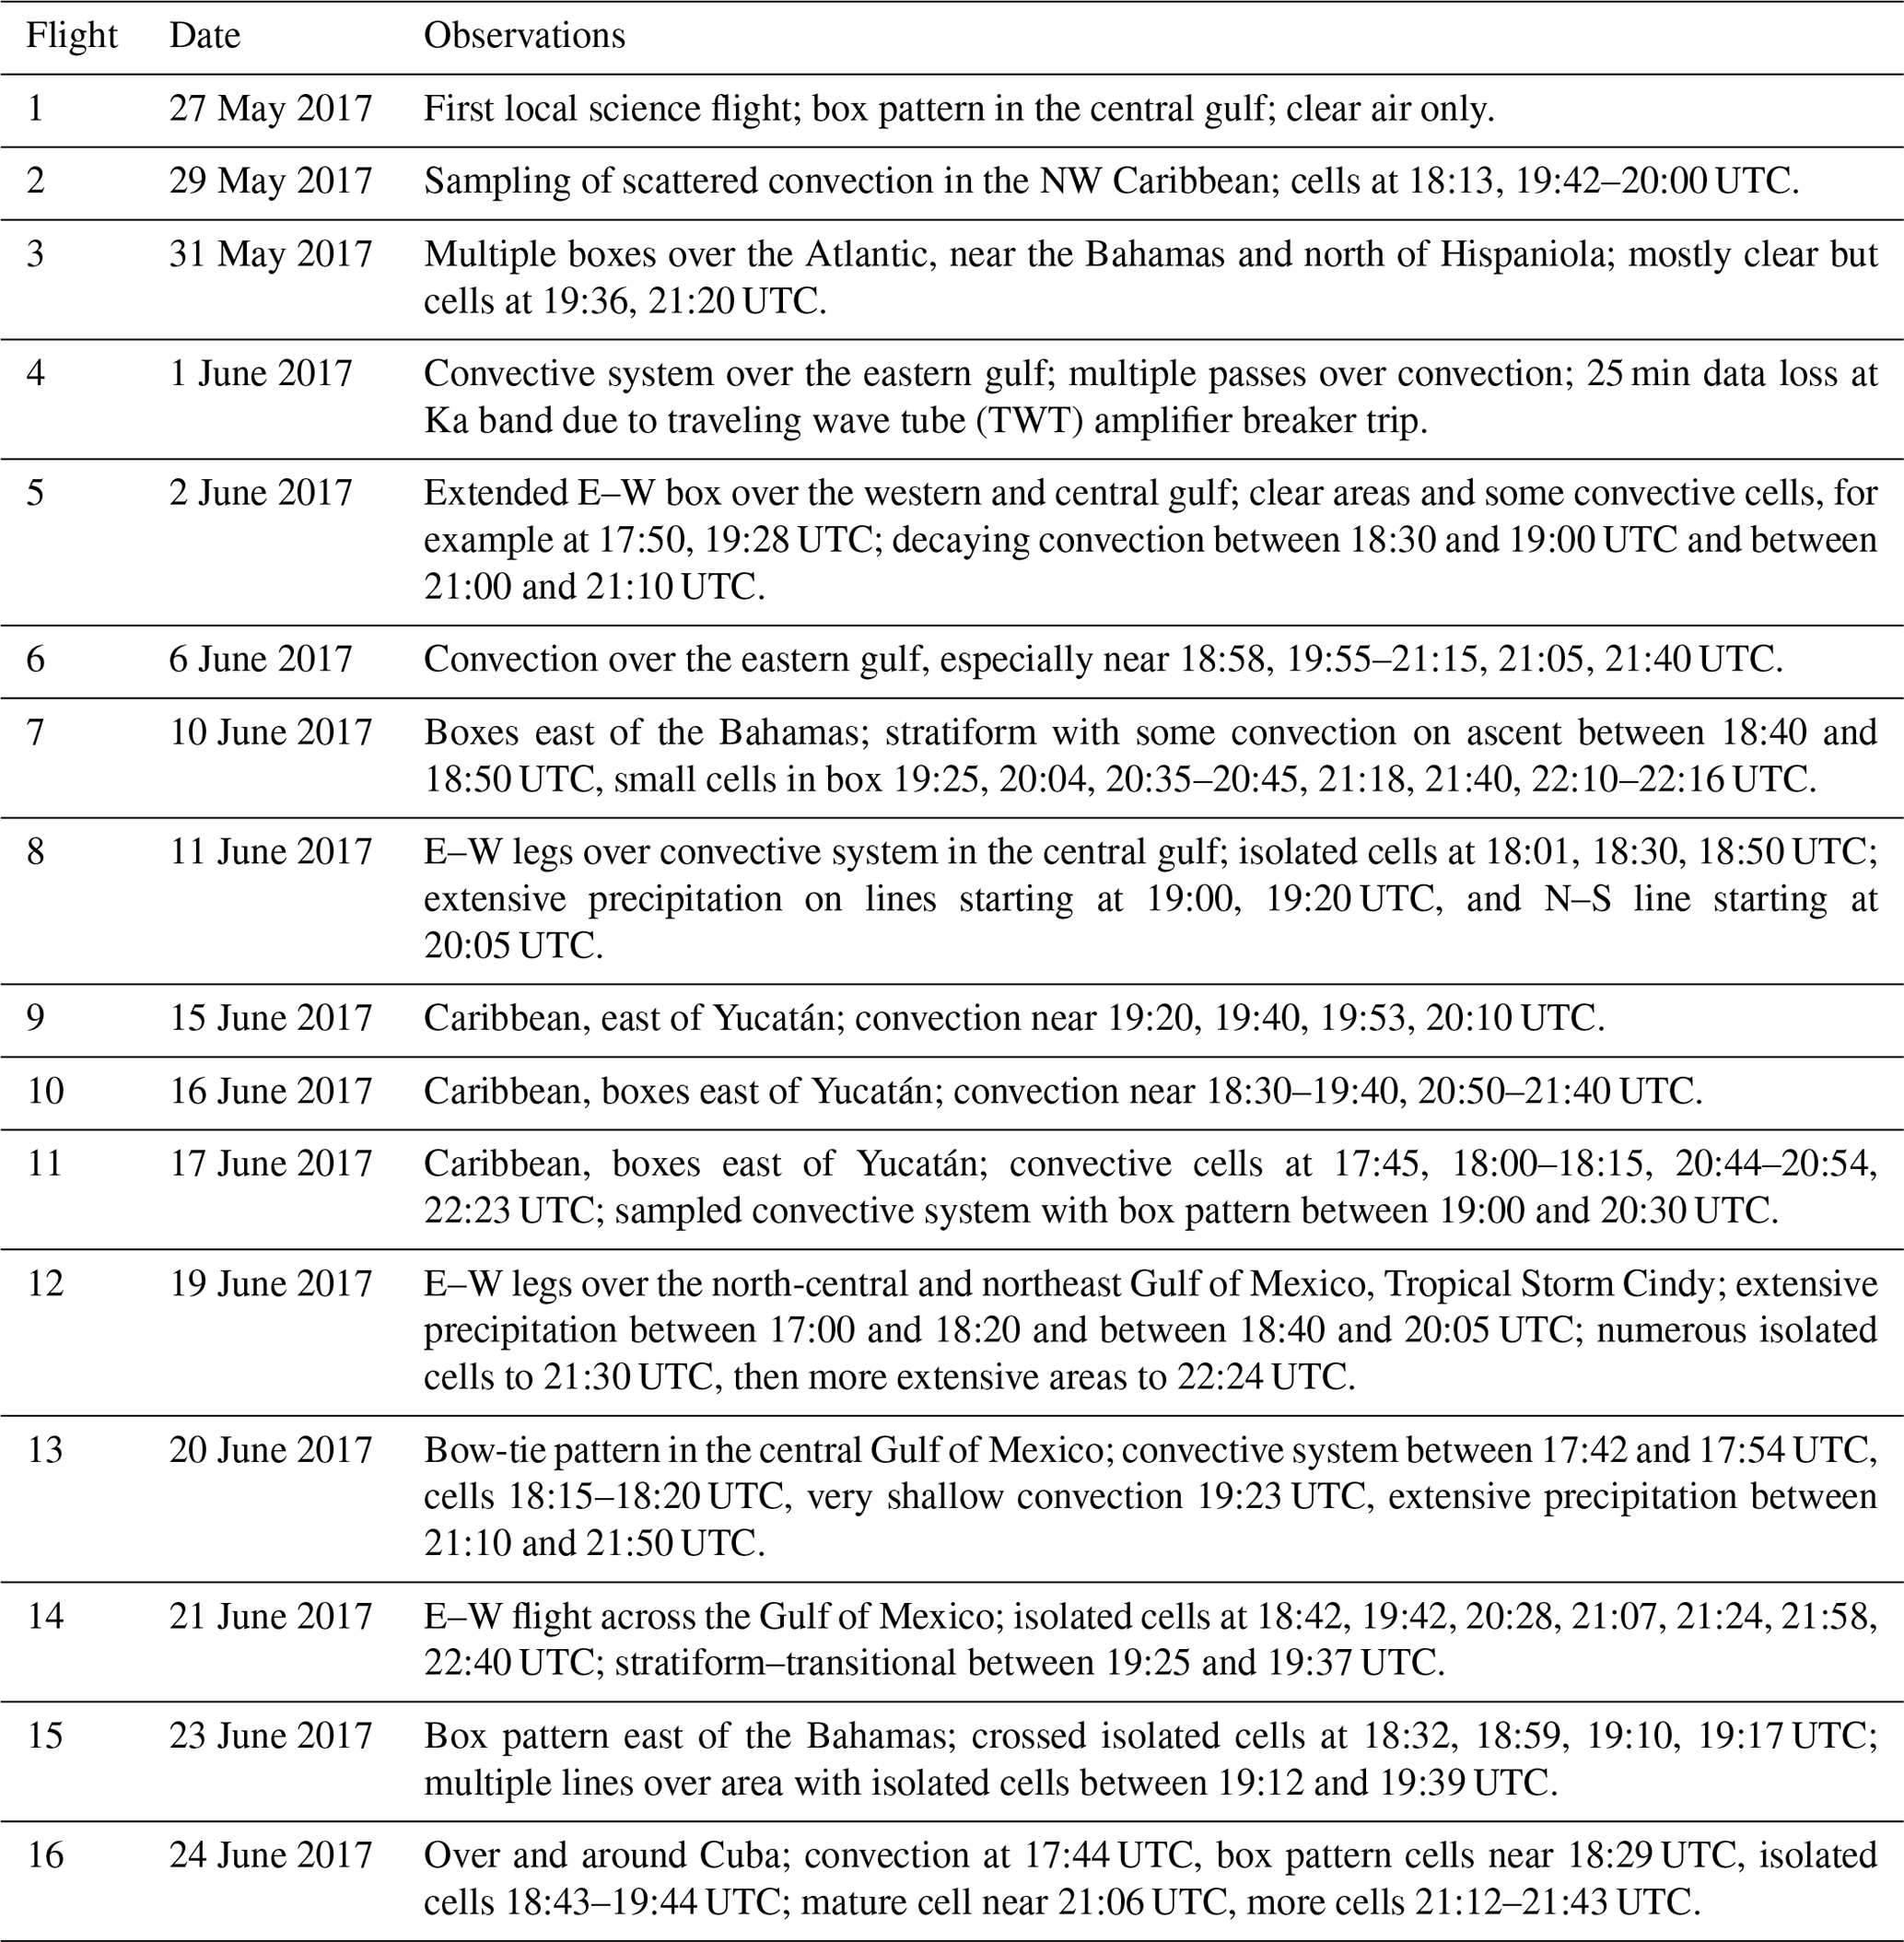
During CPEX, 16 NASA DC-8 airborne missions were flown into the Gulf of Mexico, Caribbean Sea and Atlantic Ocean. Each date is summarized in Table 1. During each flight, joint observations were collected from the JPL Ku- and Ka-band Airborne Precipitation Radar (APR-2)1 and the 2 µm Doppler Aerosol Wind (DAWN) lidar, covering a variety of isolated, scattered and organized deep convection, totalling approximately 100 h of flight. Intermittent dropsonde data accompanied the DAWN observations for validation purposes, and to provide complementary wind profiles near convection. The dropsonde system used during CPEX was the High-Definition Sounding System (HDSS) dropsonde delivery system developed by Yankee Environmental Services (Black et al., 2017). The dropsonde data are not presented in this paper.
APR-2 is a two-frequency Doppler radar, originally developed as an airborne prototype for the second-generation GPM–DPR (DPR: dual-frequency precipitation radar) (Sadowy et al., 2003). The APR-2 has flown in numerous airborne field campaigns outside CPEX, most recently the ORACLES (2016–2018) and CAMP2Ex (2019) campaigns. APR-2 acquires simultaneous measurements of multiple parameters at both the Ku and Ka band (14 and 35 GHz, respectively), including co- and cross-polarized radar backscatter, and LOS Doppler velocities of hydrometeors, with a maximum unambiguous velocity of ±27.5 (Ku band) and ±10.4 m s−1 (Ka band). From a nominal 10 km flight altitude, the horizontal resolution at the surface is ∼800 m, with a vertical range resolution and sampling of 50 and 30 m (slightly oversampled). Based upon analysis of radar surface backscatter measurements from CPEX, the reflectivity calibration is accurate to within 1–2 dB. From these basic measurements, APR-2 can depict the cloud macroscopic structure (extent, vertical air motion) and estimate the microphysical structure (water content, precipitation intensity, hydrometeor size distribution) of the associated precipitation (Durden et al., 2012). These resolutions are adequate to capture cloud features down to the resolution typical of high-resolution cloud models and appropriate for comparison with DAWN wind profiles in the vicinity near isolated, scattered and organized deep convection.
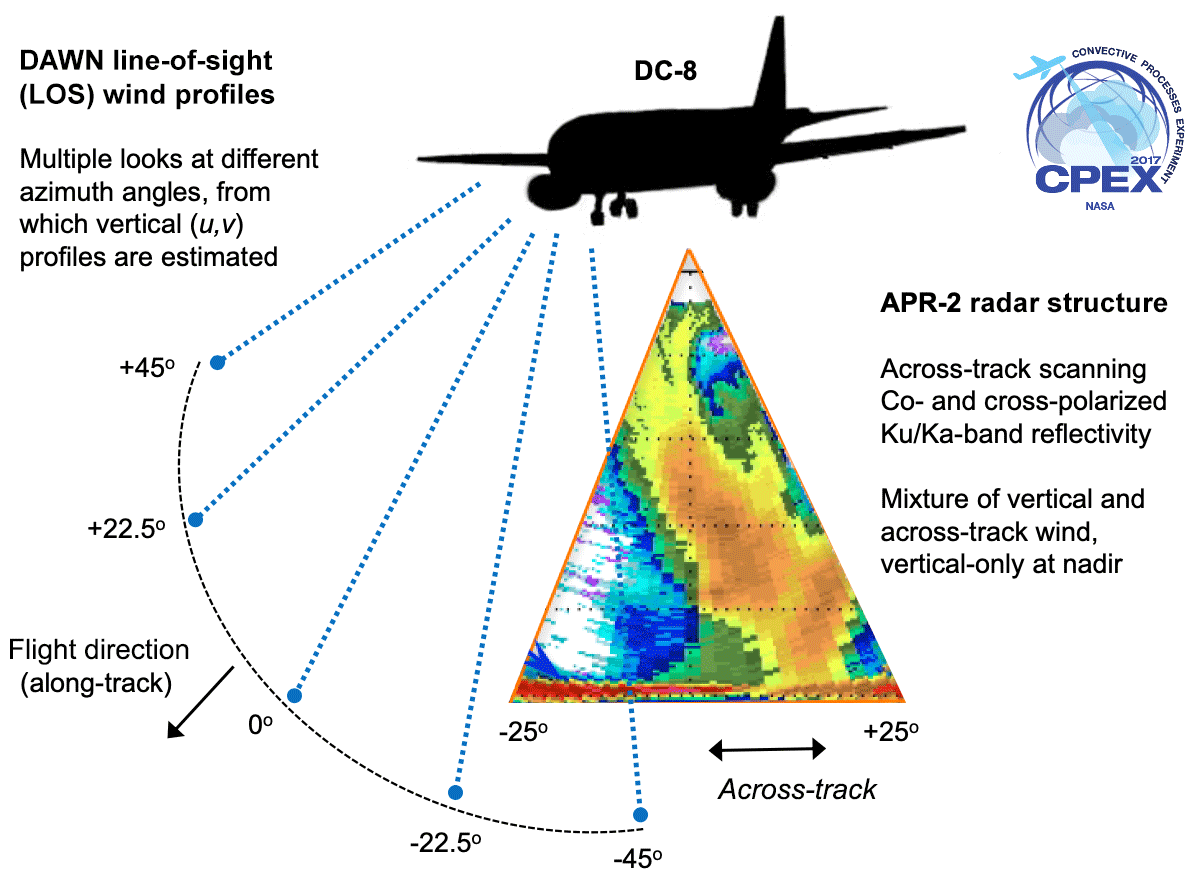
Figure 1Depiction of DAWN and APR-2 scanning operations from the DC-8 during CPEX. From a 10 km flight altitude, the APR-2 across-track swath width is 8 km, which is approximately the same distance as the separation between the DAWN ground locations of the −45 and +45∘ LOS profile beams.
DAWN is NASA's airborne DWL with a 2 µ laser that pulses at 10 Hz (Kavaya et al., 2014). It has previously participated in the NASA Genesis and Rapid Intensification Processes (GRIP) (2010) and Polar Winds (2014–2015) airborne campaigns. DAWN can provide high-resolution (4–12 km in the horizontal and 35-150 m in the vertical) wind measurements in clear and partly cloudy conditions. The lidar samples the scene in a conical pattern at a constant 30∘ elevation angle (i.e., 30∘ off nadir) and collects LOS wind profiles at up to five azimuth angles located at −45, −22.5, 0, 22.5 and 45∘ relative to the aircraft flight direction (Fig. 1). During CPEX, DAWN also collected LOS data at only two azimuth angles, −45 and 45∘. Since these LOS wind profiles view the local wind field from multiple azimuth angles, multiple LOS profiles are analyzed to estimate the vertical profile of the horizontal wind components (u,v) at different pressure levels using Adaptive Signal Integration Algorithm (ASIA) processing (Kavaya et al., 2014). DAWN data are available in both the native LOS format and processed wind vector (u,v) profile format. In this paper, the wind vector data are used to evaluate the wind field near clouds captured by the APR-2. The individual LOS data are projected (along the viewing direction) through the APR-2 radar scan to illustrate the ability of DAWN to sense in- and near-cloud structures.
The intent of this section is to assess the DAWN sampling density near the cloud systems captured by the APR-2 relative to the cloud evolution. The 10 June 2017 case is highlighted in this section. This case is used since it is a fairly isolated cloud growth case, not greatly affected by large-scale forcing at early stages, and was covered by several repeat DC-8 passes from various directions. On 10 June 2017, the DC-8 took off from Fort Lauderdale near 18:00 UTC and headed east towards the area of interest (AOI) with building clouds, located in the box bounded between 24.2 and 26.2∘ N latitude and 74–72∘ W longitude. Figure 2 shows the DC-8 flight tracks on this date taken from the JPL CPEX data portal (http://cpex.jpl.nasa.gov, 19 August 2020; Hristova-Veleva et al., 2020) and superimposed upon GOES-16 geostationary visible-channel imagery from 19:02 UTC.
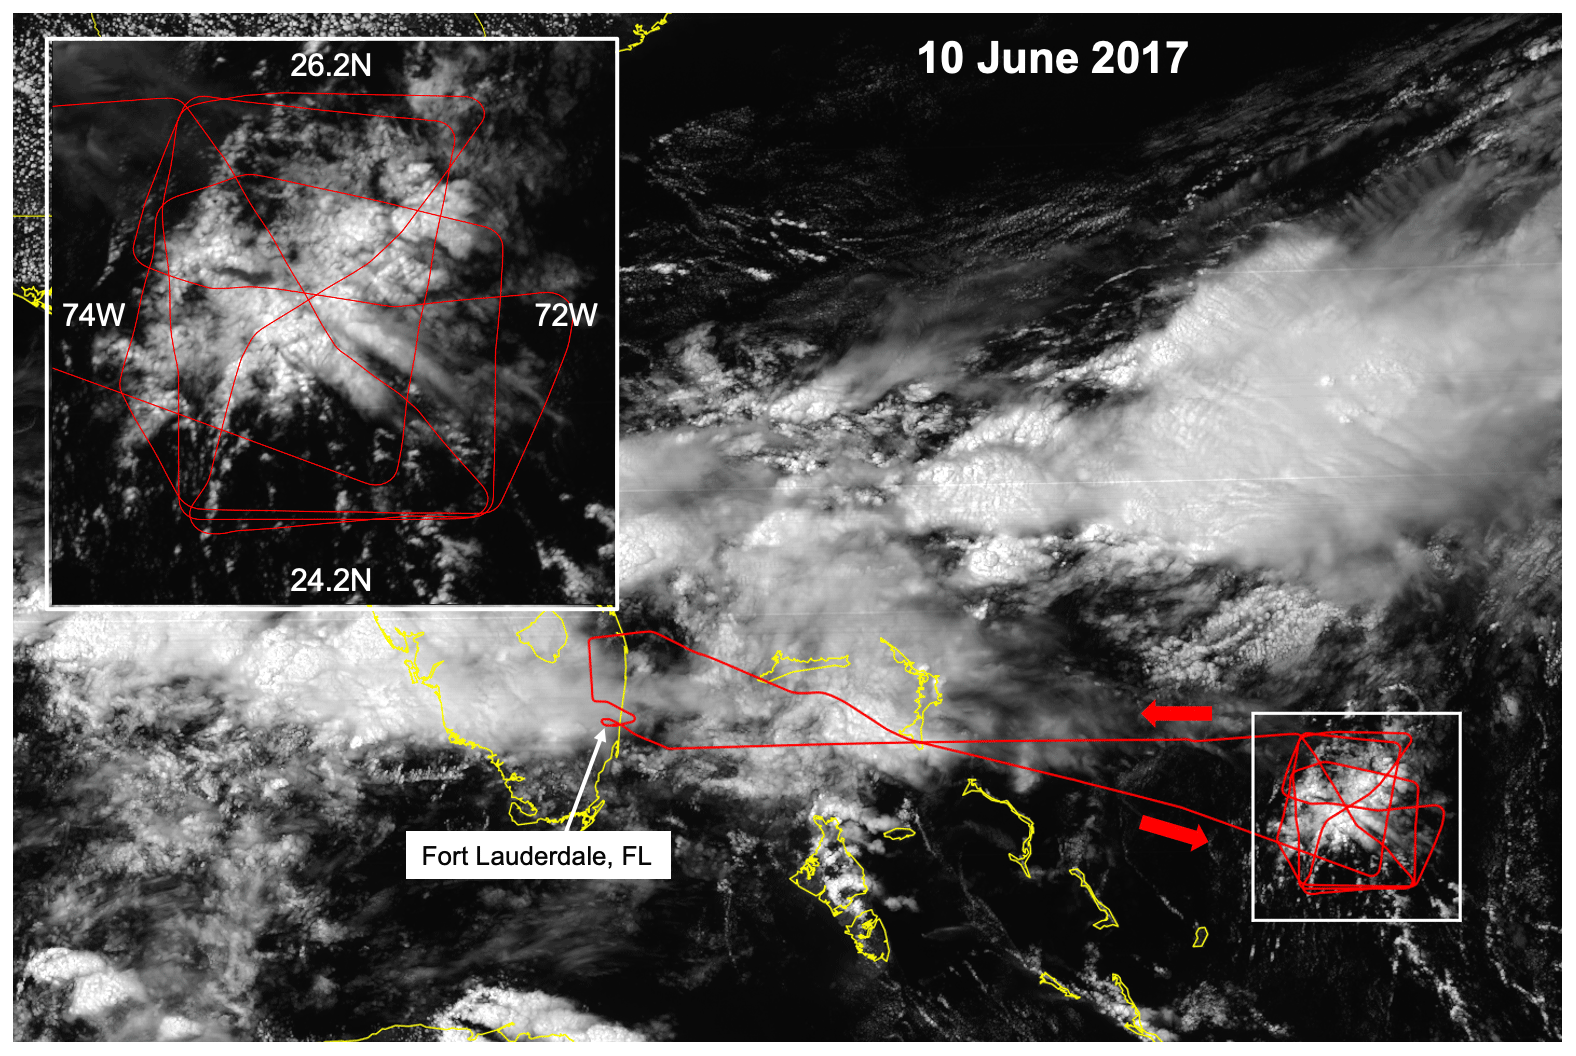
Figure 2The 10 June 2017 flight track (red lines) shown on the JPL CPEX data portal. The DC-8 home base at Fort Lauderdale, FL, is indicated. The main area of interest is shown in the expanded box, covered by the DC-8 during the 18:30–22:30 UTC time period. The grayscale background depicts the GOES-16 visible imagery at 19:02 UTC.
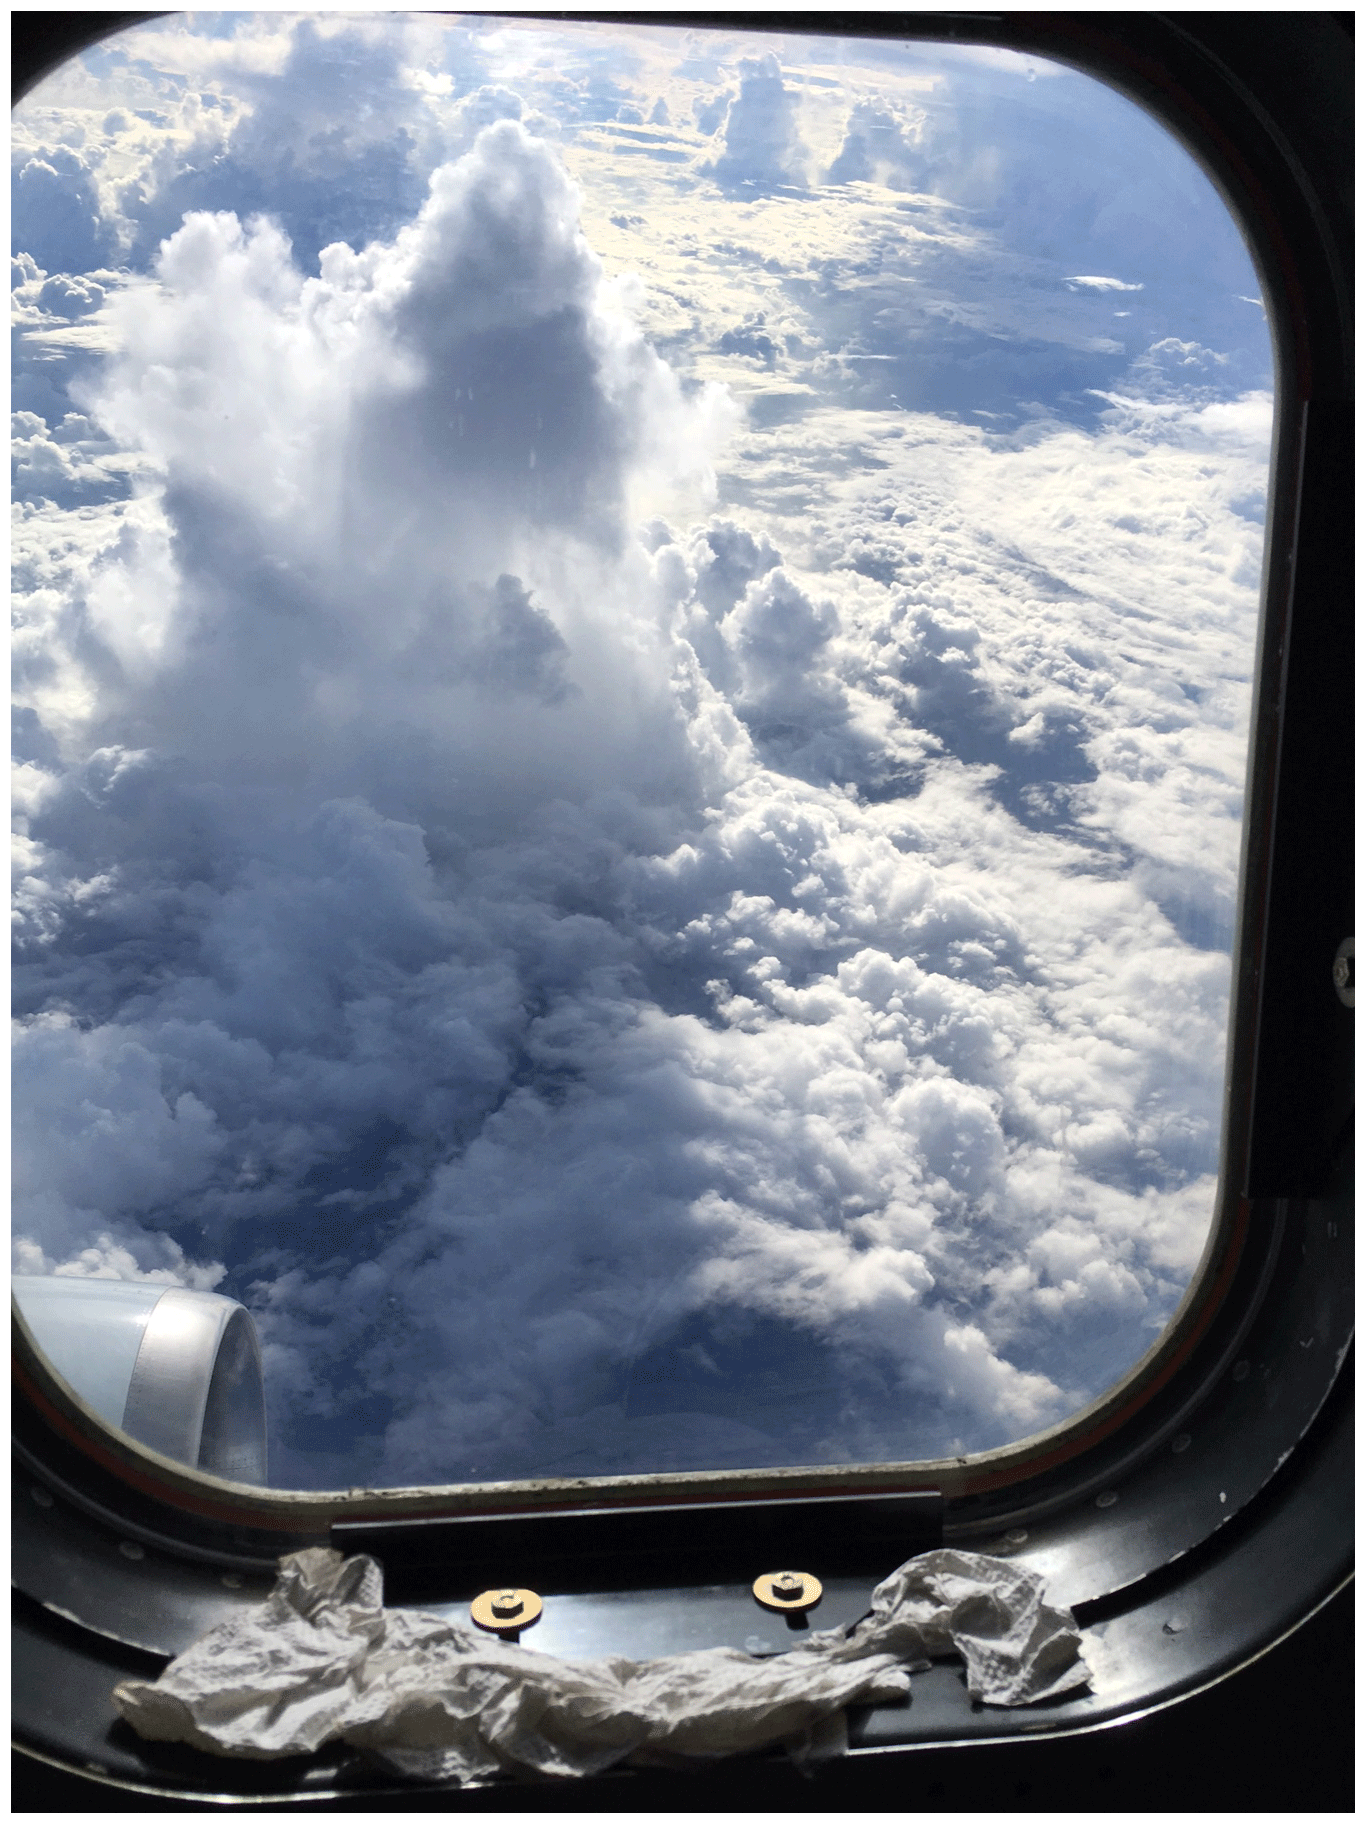
Figure 3View of developing cumulus from the DC-8 window, near 22:00 UTC on 10 June 2017, from a 10 km flight altitude.
A series of convective box patterns were executed to sample the evolution of the air movement surrounding the convection from multiple flight bearings. The intent was to be on-station in order to capture developing cumulus clouds before they had developed any significant glaciation and before they reached a stage of vertical development at which the DC-8 was unable to overfly from its nominal 10 km flight altitude. A photograph taken from the DC-8 near 22:00 UTC (Fig. 3) on this date illustrates an example of a cloud at a desired stage of evolution, at which the clouds are captured at an early enough stage such that the DC-8 can safely overfly multiple times during subsequent evolution.
APR-2 data were collected in tandem with DAWN between 18:35 and 22:30 UTC. To explain the DAWN observations relative to the development of the precipitation, the analysis is broken into four 1 h segments, separated by the DC-8 flight track segments during each hour. The APR-2 data will be shown in context to give a sense of when and where (proximity and cloud penetration depth) DAWN can provide valid wind data. Furthermore, the analysis will focus on the wind shear within each quadrant (NE: northeast, SE: southeast, SW: southwest, NW: northwest) relative to the approximate center (25.2∘ N 73∘ W) of the AOI flight box in Fig. 2. These segments also correspond to the data assimilation interval used in the investigation of these data by Zhang et al. (2019).
3.1 Flight segment 1 (18:30–19:30 UTC)
This first DC-8 flight segment flew along a 120∘ bearing approaching the NW and SW quadrants of the AOI, whereas the next three flight segments discussed below take place inside the main AOI. Figure 4 shows the plan view at 2 km (panel a) and 8 km (panel b) constant elevation levels. The locations of DAWN wind vectors are shown by the red barbs. The densest DAWN sampling occurs between 19:00 and 19:30 UTC in the mostly cloud-free area, shown in the lower right of Fig. 4, with 5–10 m s−1 winds at both levels.
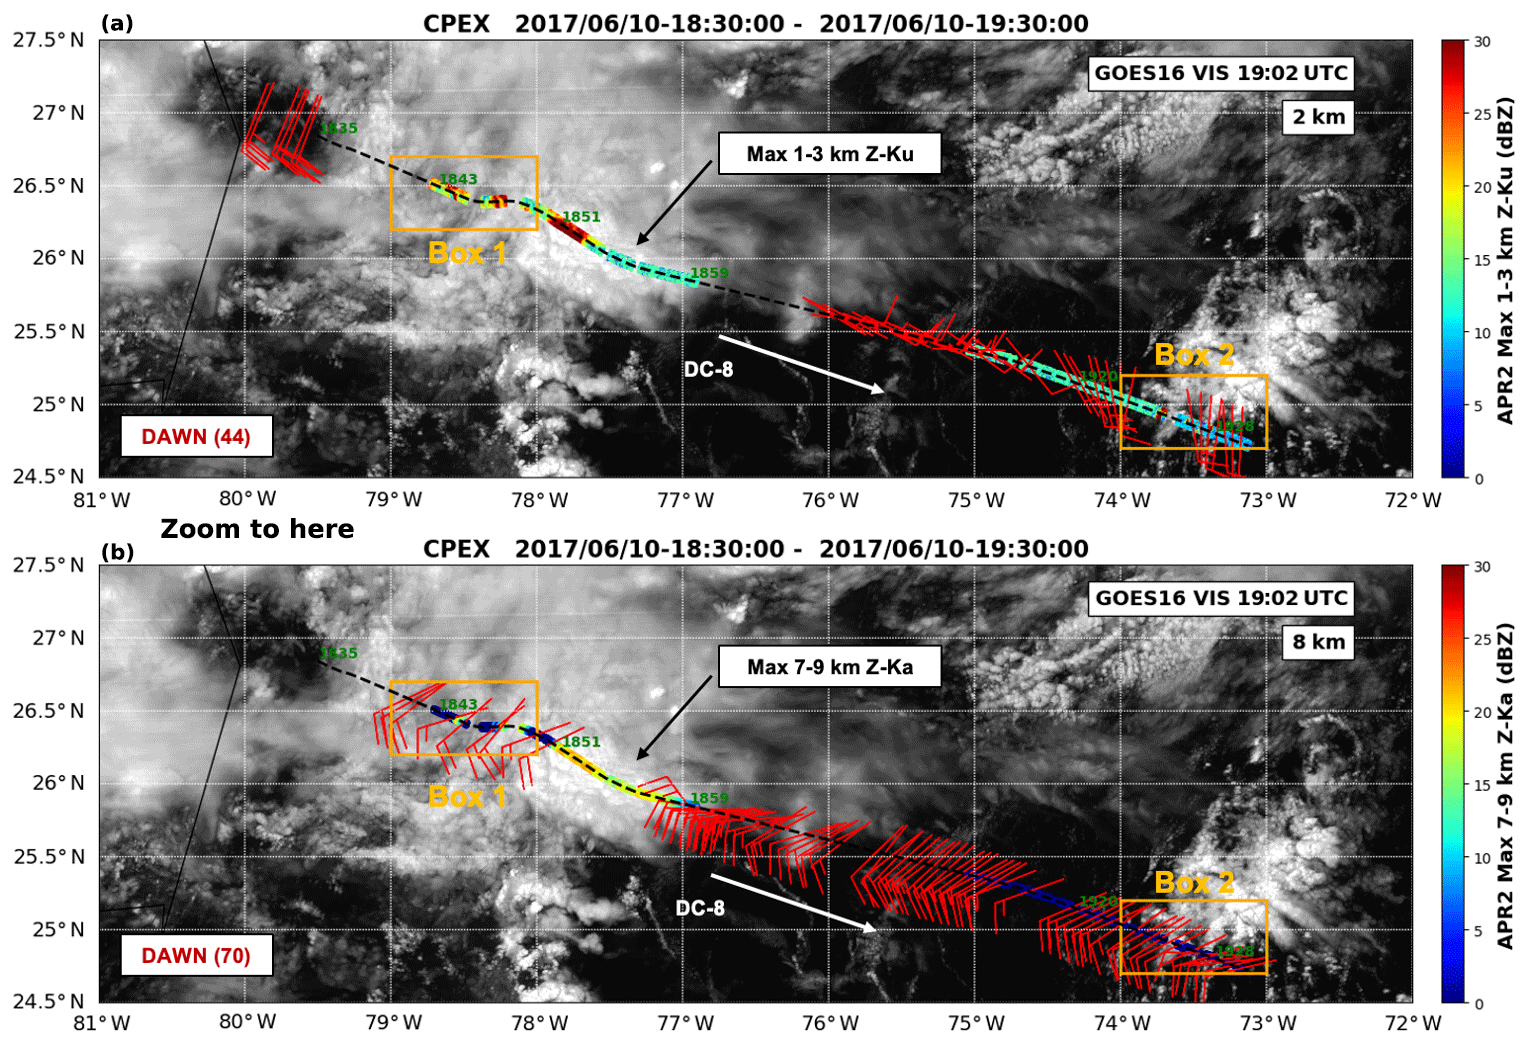
Figure 4DC-8 flight line during segment 1 (18:30–19:30 UTC) on 10 June 2017. The GOES-16 visible imagery at 19:00 UTC is shown in the background grayscale (scaled from 0 %–100 % albedo, not shown). (a) The red barbs show the locations of the wind vectors (44 total) estimated by DAWN at 2 km of height. The background color represents the average APR-2 Ku-band reflectivity between 1 and 3 km of height (top color scale). (b) Same as panel (a), but for an 8 km height. The background color represents the APR-2 average Ka-band reflectivity between 7 and 9 km (bottom color scale).
For the 2 km level, the maximum APR-2 Ku-band reflectivity between 1 and 3 km is plotted underneath the DAWN winds; for the 8 km level the maximum Ka-band reflectivity between 7 and 9 km is shown instead (the rationale being that since there is less path attenuation through rain at Ku band than at Ka band, the Ku-band data provide a better depiction of the cloud structure for the deeper 2 km level; the APR-2 is more sensitive to clouds at Ka band than at Ku band, so the Ka-band reflectivity was used for the higher 8 km level cloud structure). Peak APR-2 Ku-band reflectivity at 2 km exceeded 30 dBZ.
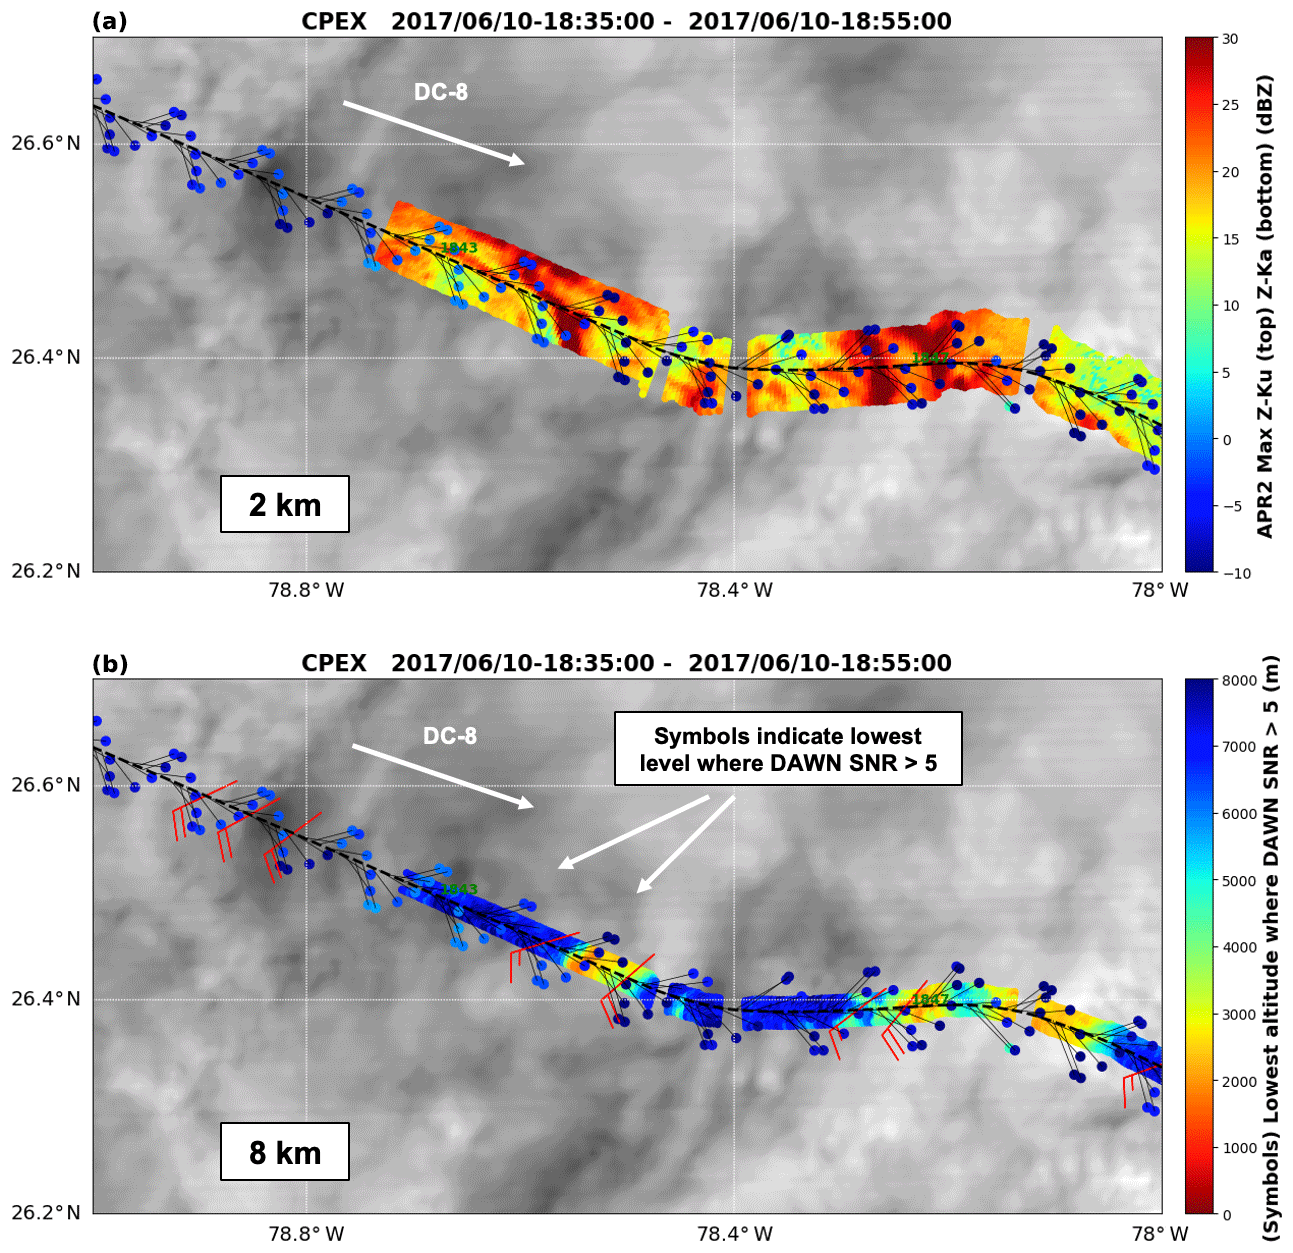
Figure 5Same as Fig. 4, but zoomed in on the flight segment between 18:35 and 18:55 UTC (Box 1 in Fig. 4). The symbol (dot) colors indicate the lowest level at which the DAWN SNR is >5 dB (lower panel color scale). Periods of missing APR-2 data indicate no data. (a) 2 km level, (b) 8 km level. DAWN winds at each level are indicated with the red barb symbols.
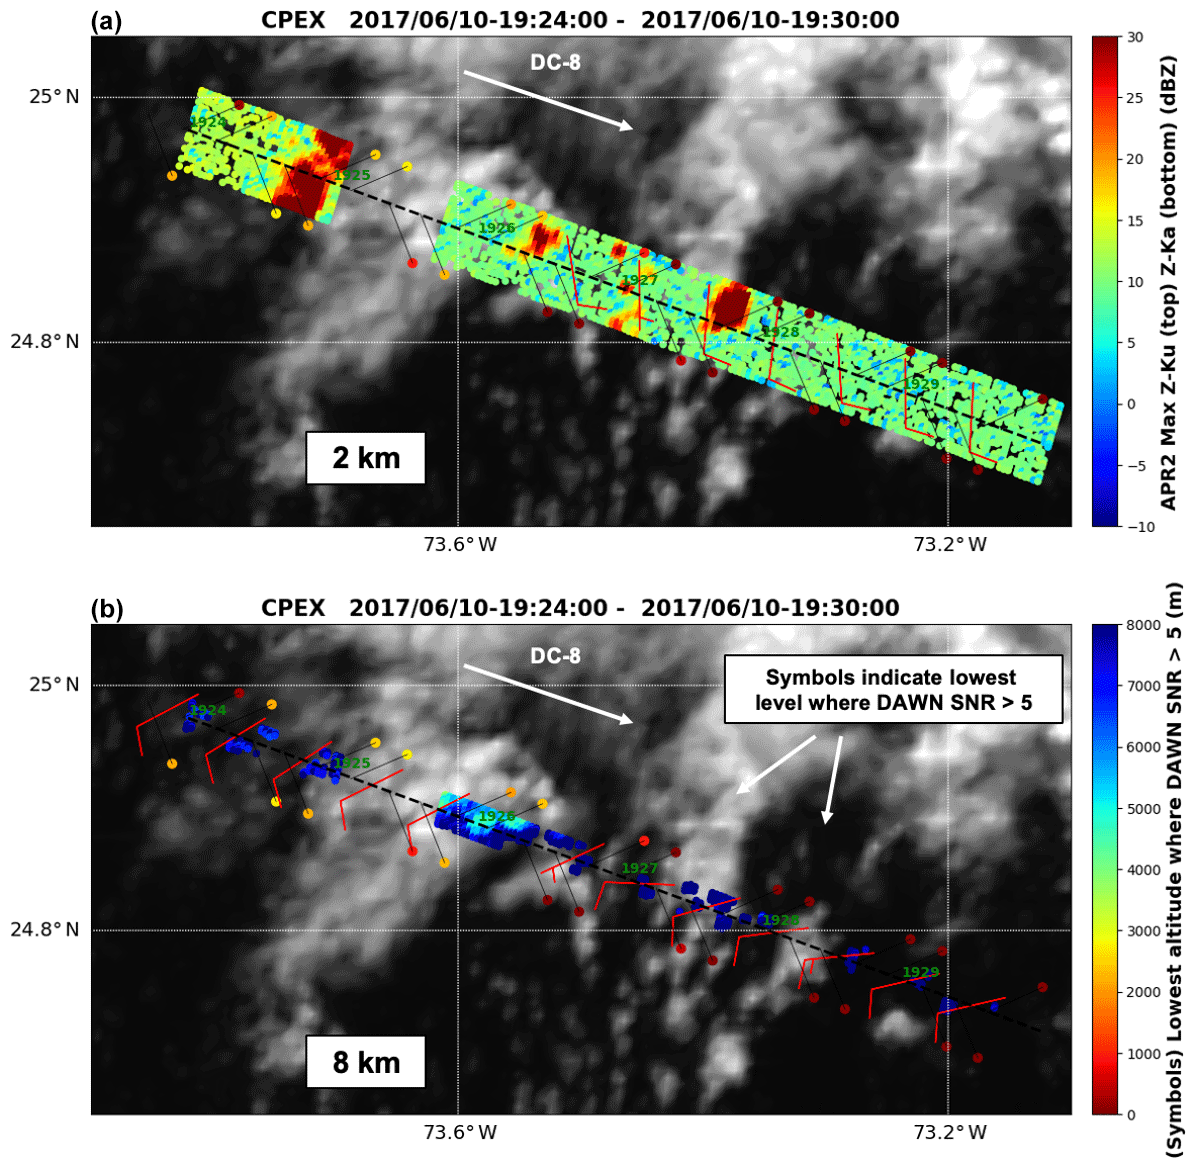
Figure 6Same as Fig. 5, but zoomed in on the flight segment between 19:24 and 19:30 UTC (Box 2 in Fig. 4).
In Fig. 4, the associated cloud and aerosol conditions were such that the processing of these DAWN LOS data produced a total of 44 vectors at 2 km of height (a) and 70 vectors at 8 km of height (b). To look in more detail at the DAWN sampling proximity relative to the locations of individual cloud structures sampled by the APR-2, Figs. 5 and 6 show zoom-in depictions covering the two boxes indicated with the orange rectangles in Fig. 4, which cover a mostly cloudy area (Box 1 for 18:35–18:55 UTC, Fig. 5) and mostly clear area (Box 2 for 19:24–19:30 UTC, Fig. 6), respectively. The mean sea level (MSL) locations of the DAWN LOS profiles are indicated with colored markers. Owing to the conical scan pattern of the five looks shown in Fig. 1, the locations appear as a zigzag pattern as the DC-8 moves forward. Each DAWN LOS beam is colored by the lowest altitude at which the signal-to-noise ratio (SNR) is >5 (the 5 dB value is used as a reference level, not as an absolute minimum threshold, as DAWN often provides valid data at lower SNR levels). The ground locations of the DAWN LOS profiles are indicated with colored markers, and a thin line connected to each marker shows the LOS projection extending from the DC-8 to MSL.
Note that in the mostly cloudy Box 1 area (Fig. 5), the DAWN sampling pattern is evident, covering about an 8 km swath as the lidar collects samples at each of the five azimuth locations in its conical scan. For these cloud cover conditions, no DAWN wind vectors were estimated at the 2 km height. However, at 8 km of height, DAWN processing retrieved wind vectors even when the Ka-band reflectivity in the vicinity was as high as about 15 dBZ, showing about 10 m s−1 southeasterly winds. The mostly clear Box 2 region shown in Fig. 6 (19:24–19:30 UTC) is presented in an identical layout as Fig. 5. At this time, DAWN was configured for two looks per scan (−45 and 45∘ azimuth). In this region, DAWN was able to sense well below 2 km even in the vicinity of clouds at the 10–15 dBZ Ku-band reflectivity level from APR-2, showing 5 m s−1 southerly winds at 2 km, becoming more westerly at 8 km of height.
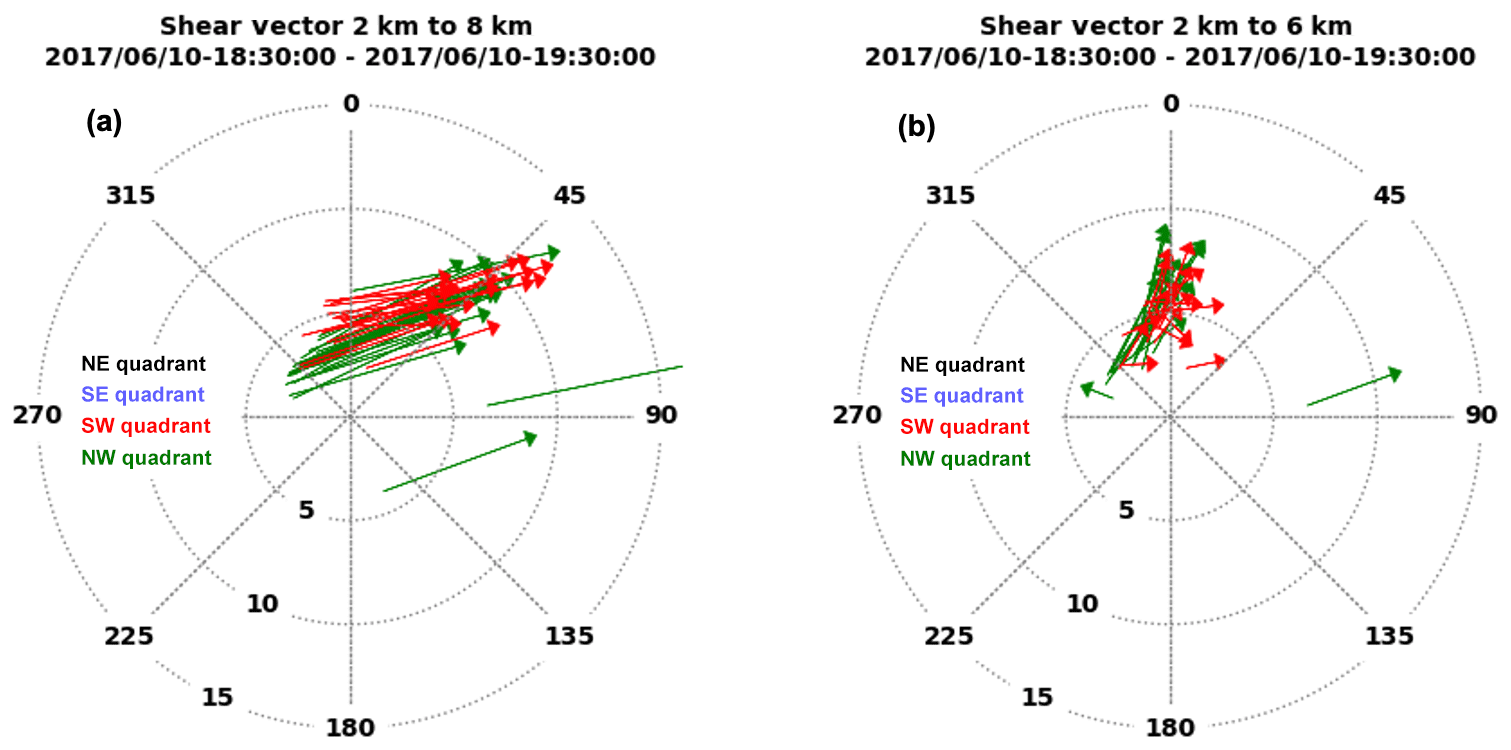
Figure 7Two-level hodograph derived from the DAWN wind profiles during 18:30–19:30 UTC in polar coordinate form. Rings are spaced at 5 m s−1 intervals. Each vector represents shear derived from each wind profile. (a) Shear vector pointing from (u,v) at 2 km towards (u,v) at 8 km. (b) Shear vector pointing from (u,v) at 2 km towards (u,v) at 6 km. The shear vectors are colored according to which quadrant (NE: northwest, SE: southeast, SW: southwest, NW: northwest) they are located in relative to the approximate center (25.2∘ N 73∘ W) of the AOI flight box in Fig. 2. During this time, the DC-8 sampled only the SW and NW quadrants.
In these DAWN data, there is a tendency for increased directional shear between these two vertical levels as the DC-8 approaches the AOI. To enhance this feature, Fig. 7a displays each DAWN profile in Fig. 4 in a two-level hodograph form in which each vector points from the DAWN (u,v) wind at 2 km to the (u,v) at 8 km, thereby representing the shear between these two levels. When the vector is aligned along a radial direction, that indicates no directional shear, only speed shear. When the vector is aligned away from the radial direction, that indicates directional shear and possible speed shear. The shear vectors are colored according to which quadrant (NE, SE, SW, NW) they are located in relative to the approximate center (25.2∘ N 73∘ W) of the AOI flight box in Fig. 2. During this time there is sustained directional wind shear in the SW and NW quadrants oriented from west to east. A similar analysis for the shear between 2 and 6 km (right panel of Fig. 7) shows the shear oriented more south to north.

Figure 8Cross section of the APR-2 Ka-band reflectivity (color scale: dBZ) during segment 1 (18:30–19:30 UTC). The x axis represents the APR-2 scan number (2000 scans representing 720 km ground distance) and the y axis the MSL height (km). The DC-8 reached its nominal 10 km flight altitude near 18:40 UTC. The black points represent vertical locations of valid DAWN (u,v) wind vectors produced from the DAWN processing of the LOS data. The green shaded “upper cloud” area shows an area where there are clouds in the 1.8 km blind zone (where APR-2 does not process data) but whose cloud top is noted in the DAWN profiles above this shaded area.
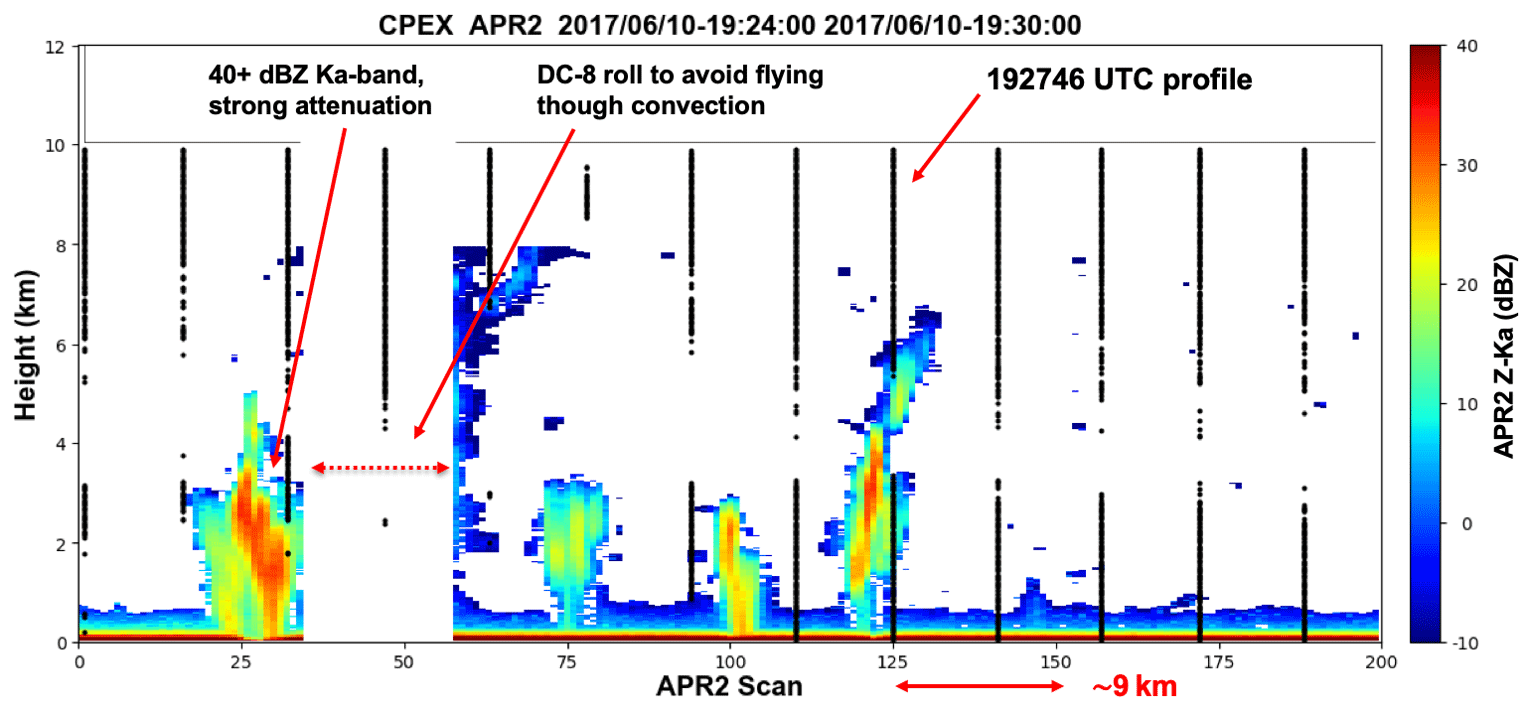
Figure 9Same format as Fig. 8, but covering only the Box 2 area (19:24–19:30 UTC) shown in Fig. 4. DAWN wind profiles are obtained to the surface very close to the growing convection near 19:27:46 UTC (near scan 120).
To provide a depiction of the DAWN vertical sampling capability, a cross section of the DAWN vertical profile sampling locations superimposed upon the APR-2 nadir reflectivity is shown in Fig. 8. The black points represent locations of valid DAWN (u,v) wind vectors during this time. Several notable features are evident. Depending upon the APR-2 transmit pulse length, there is a blind zone (∼1.8 km) below the aircraft where the radar processor does not receive any returned signals. This is noted in a short period during which the cloud tops were within the APR-2 blind zone (near scan 750), but the cloud top was identifiable in the DAWN profiles (labeled the “upper cloud area” in green shading in Fig. 8). Similarly, near the surface where the APR-2 backscatter is affected by ground clutter in the lowest 500 m, DAWN was able to provide wind observations to the surface. In general, DAWN winds are abundant above 6 km (where the SNR is highest), and below 3 km (where the aerosol content is higher), with considerable upper-level sampling right up to the edges of the tall developed clouds (near scan 1000). There are several DAWN profiles that bump up close to the small convective cell near scan 1800 (denoted with a red ellipse in Fig. 8), which are associated with the clouds shown in Fig. 6a (Box 2), where the Ku-band reflectivity exceed 30 dB. To show this area in more detail, Fig. 9 zooms in on the Box 2 area (19:24–19:30 UTC), where three small growing clouds are shown in the middle of the figure. DAWN wind profiles are produced to the surface next to growing convection near scans 100 and 120, but not for the cell near scan 75. This highlights the fact that convective clouds are not continuous “impenetrable” cloud structures but in nature have gaps or “holes” in them through which the DAWN LOS view can penetrate to lower levels.
3.2 Flight segment 2 (19:30–20:30 UTC)
From 19:30 to 20:30 UTC, the DC-8 conducted a series of flight legs in a counterclockwise pattern within the AOI, with densest sampling in the NW and SE quadrants, before departing along a 270∘ bearing. Figure 10 illustrates the APR-2 and DAWN data in the same format as used in Figs. 5 and 6. Maximum Ka-band reflectivity in the 7–9 km level is near 20–25 dB in the middle of the segment. On the north side of the AOI, the winds were mainly southwesterly near 10 m s−1, with 2 km level winds more southerly with weaker 5 m s−1 speeds.
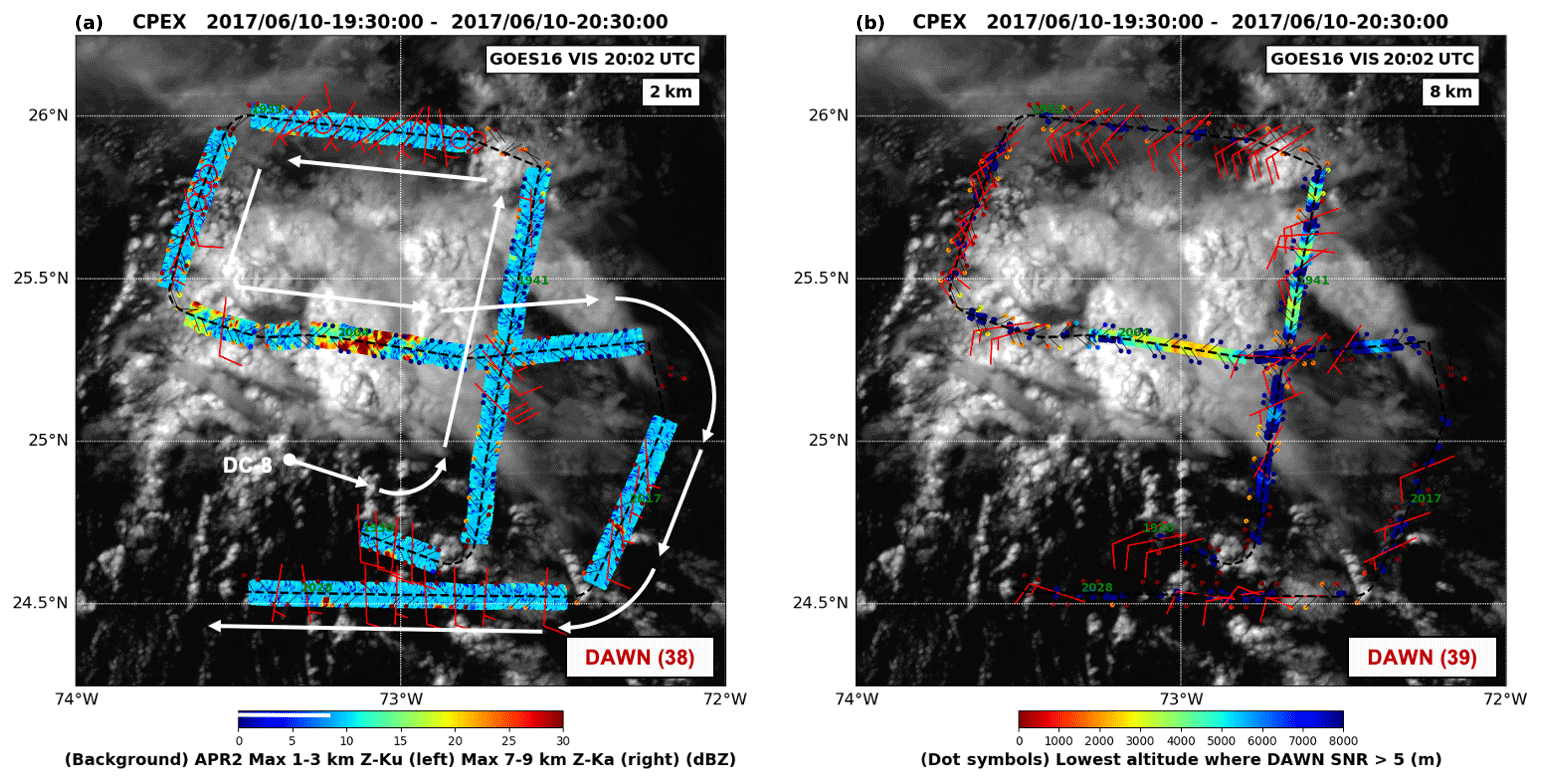
Figure 10DC-8 flight line during segment 2 (19:30–20:30 UTC) on 10 June 2017. The GOES-16 visible imagery at 20:00 UTC is shown in the background grayscale. DAWN winds at each level are indicated with the red barb symbols. (a) 2 km level. The background color represents the average APR-2 Ku-band reflectivity between 1 and 3 km of height. (b) Same as panel (a), but for an 8 km height. The background color represents the APR-2 average Ka-band reflectivity between 7 and 9 km. In both panels, the symbol (dot) colors indicate the lowest level at which the DAWN SNR is >5 dB (lower panel color scale) according to the color scale in panel (b). Periods of missing APR-2 data indicate no data.
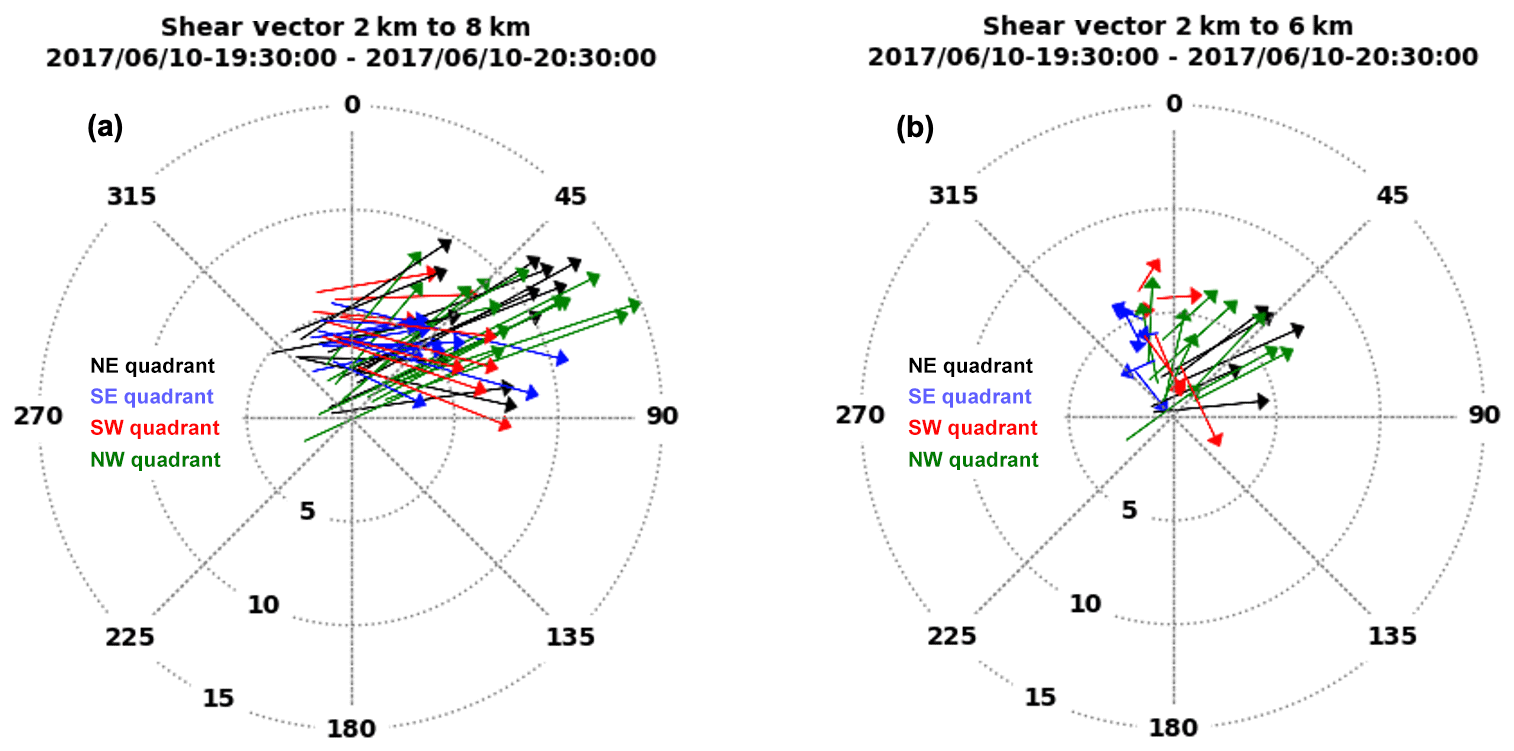
In the NW quadrant of the AOI, there is a large shear magnitude between the 2 and 8 km levels (Fig. 11), but it is less directional (vectors more aligned in the radial) compared to Fig. 7. In Fig. 11, the shear between 2 and 6 km in the NW quadrant (green arrows) is similar to Fig. 7, but the shear between 2 and 8 km is pointing more towards the east. The shear between 2 and 8 km in the SW and SE quadrants (red and blue arrows, respectively) points mostly towards the east-southeast directions, but this same signature is not well-noted between the 2 and 6 km levels owing to the reduced DAWN sampling at the 6 km level.
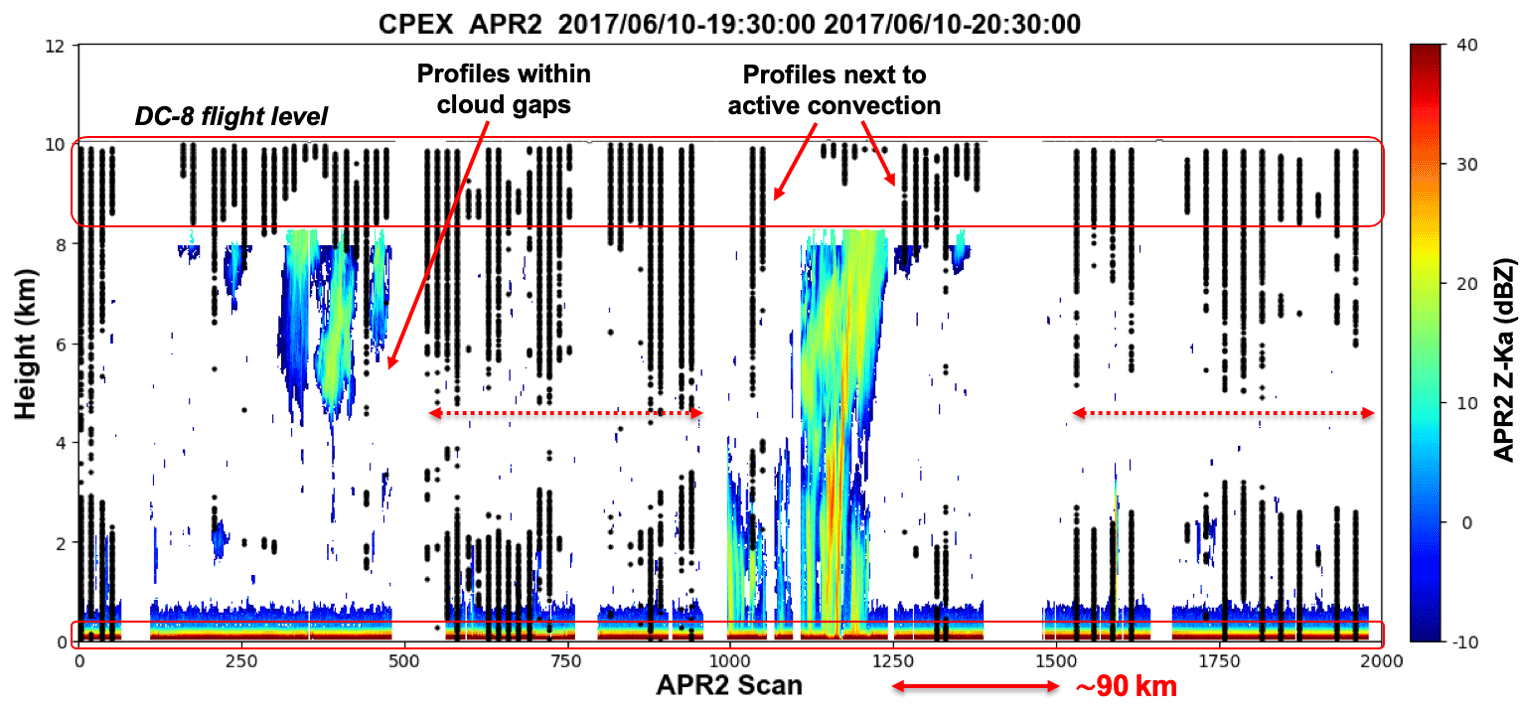
Figure 12Cross section of the APR-2 Ka-band reflectivity (color scale to right) during segment 2 (19:30–20:30 UTC). Same layout and format as Fig. 8.
The vertical cross section of the DAWN wind profile sampling locations alongside the APR-2 nadir reflectivity profile is shown in Fig. 12 (areas where the DC-8 was making a banking turn are omitted). Similar to flight segment 1, the two main “no-cloud” regions between APR-2 scans 600–900 and 1300–2000 are well-sampled at the upper and lower heights levels. Near scan 850, DAWN data stop near 8 km in areas where APR-2 does not show any cloud, and several profiles near scan 900 sense deeper (to nearly 4 km), both of which may be from lidar backscatter off clouds not sensed by APR-2 (i.e., below the minimum Ka-band detectability). The lowermost level retrieved by DAWN near scan 300 and again near scan 1200 appears to be the cloud top, which occurred in the 1.8 km blind zone (∼8.2–10 km of height) area where APR-2 does not provide any data. Near scan 400, there are numerous DAWN profiles provided in cloud gaps as the DC-8 passed through some higher-level clouds.
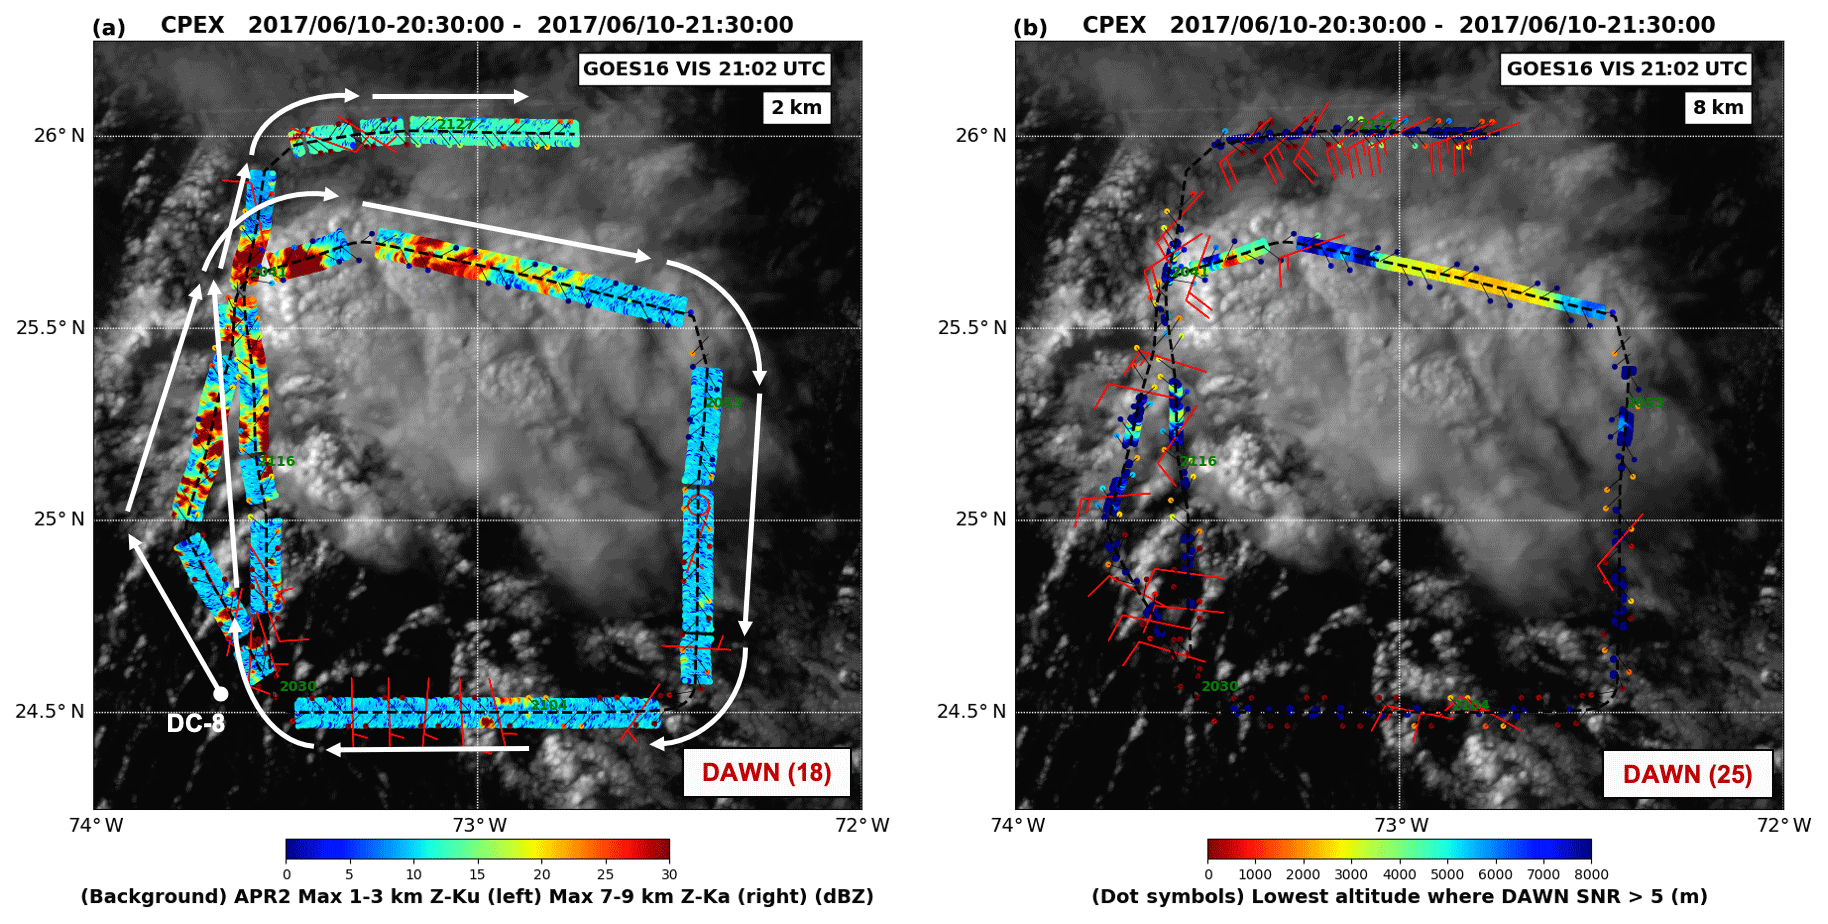
Figure 13DC-8 flight line during segment 3 (20:30–21:30 UTC) on 10 June 2017. Same layout and format as Fig. 10.
3.3 Flight segment 3 (20:30–21:30 UTC)
Flight segment 3 begins with the DC-8 heading in a northerly direction. The flight revisited some of the area sampled during the previous segment by executing a box pattern in the clockwise direction, before exiting to the east along a 90∘ bearing (Fig. 13). Towards the end of this flight segment, the DC-8 dropped to a 9 km flight level. At 8 km of height, 25 DAWN wind vectors were estimated from the LOS data processing.
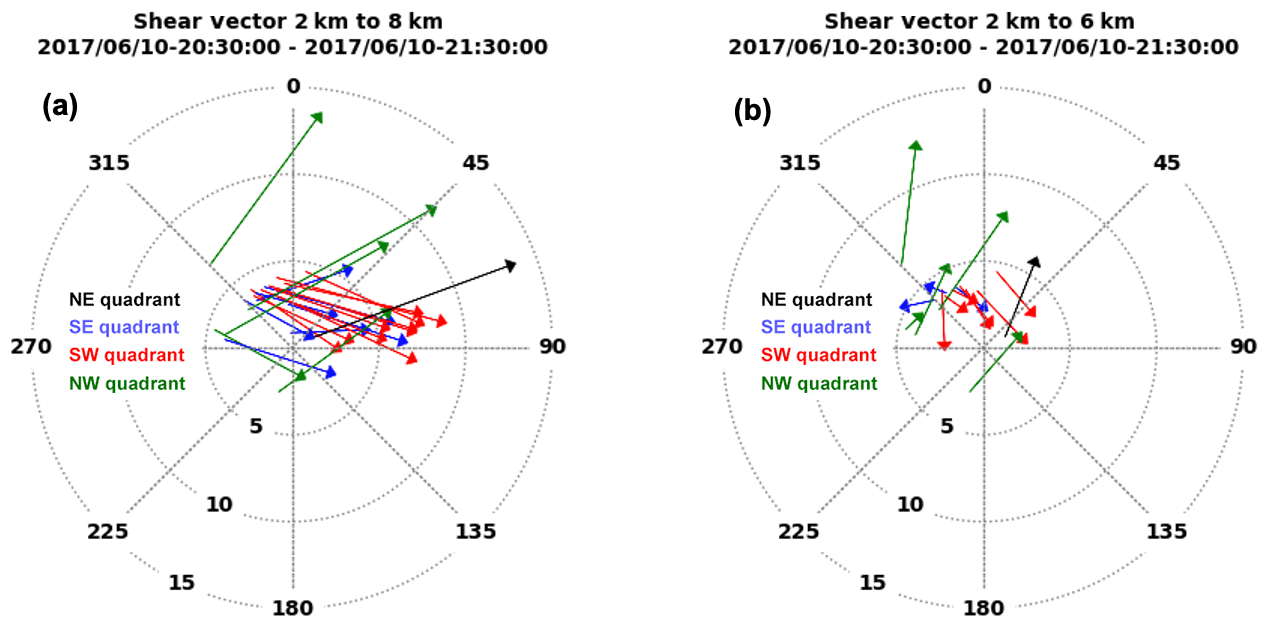
The 90∘ directional shear on the SW quadrant of the AOI is still present, measuring about 5 m s−1 in magnitude (Fig. 14), but insufficient 8 km winds were obtained in the other quadrants for comparison (at the 2 km level, only 18 DAWN wind vectors were estimated, nearly all concentrated on the south side of the AOI).
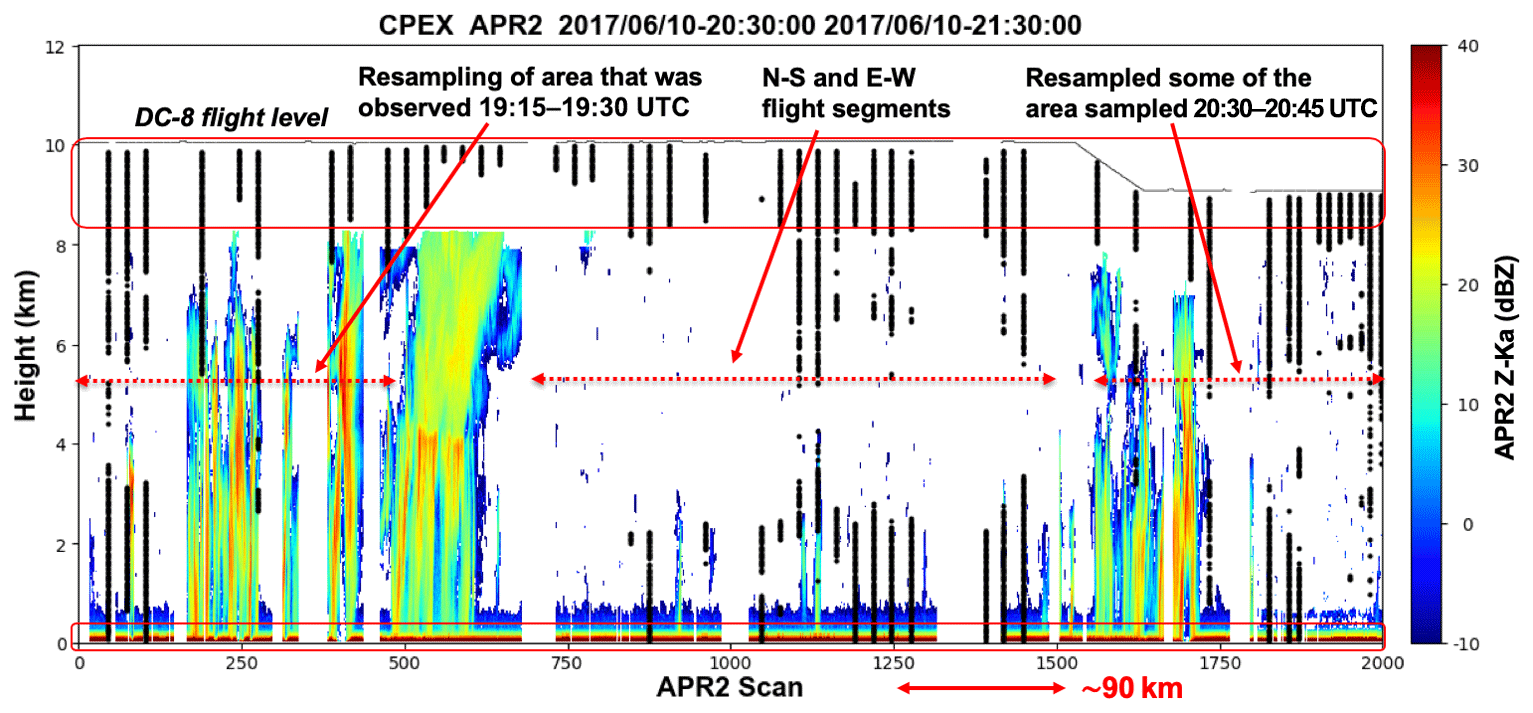
Figure 15Cross section of the APR-2 Ka-band reflectivity (color scale to right) during segment 3 (20:30–21:30 UTC). Same layout and format as Fig. 8.
Figure 15 shows the DAWN vertical sampling density during this flight segment relative to the APR-2 Ka-band reflectivity structure. On the east side of the AOI the DC-8 passed above a region of thin clouds (as shown in the IR background in Fig. 11), but they were below the sensitivity of APR-2. This could be one reason for the reduced DAWN sampling between APR-2 scans 700 and 1000 at the 2–8 km height level, but the E–W leg (scans 1200–1400) provided DAWN profiling to the surface in many locations.
3.4 Flight segment 4 (2130-2230 UTC)
Flight segment 4 begins with the DC-8 heading in an easterly direction and then banking to a 225∘ bearing. The DC-8 partially completed a figure-eight pattern, before exiting to the west along a 270∘ bearing and returning to Florida, as shown in Fig. 16. The total DAWN profile sampling numbers are higher than segment 3, with 49 and 63 DAWN vectors provided at 2 and 8 km heights, respectively. The cloud system near 25.5∘ N, 73.5∘ W has matured considerably relative to its structure in previous flight segments, represented with a fairly well-defined melting level shown near scans 1450–1550.
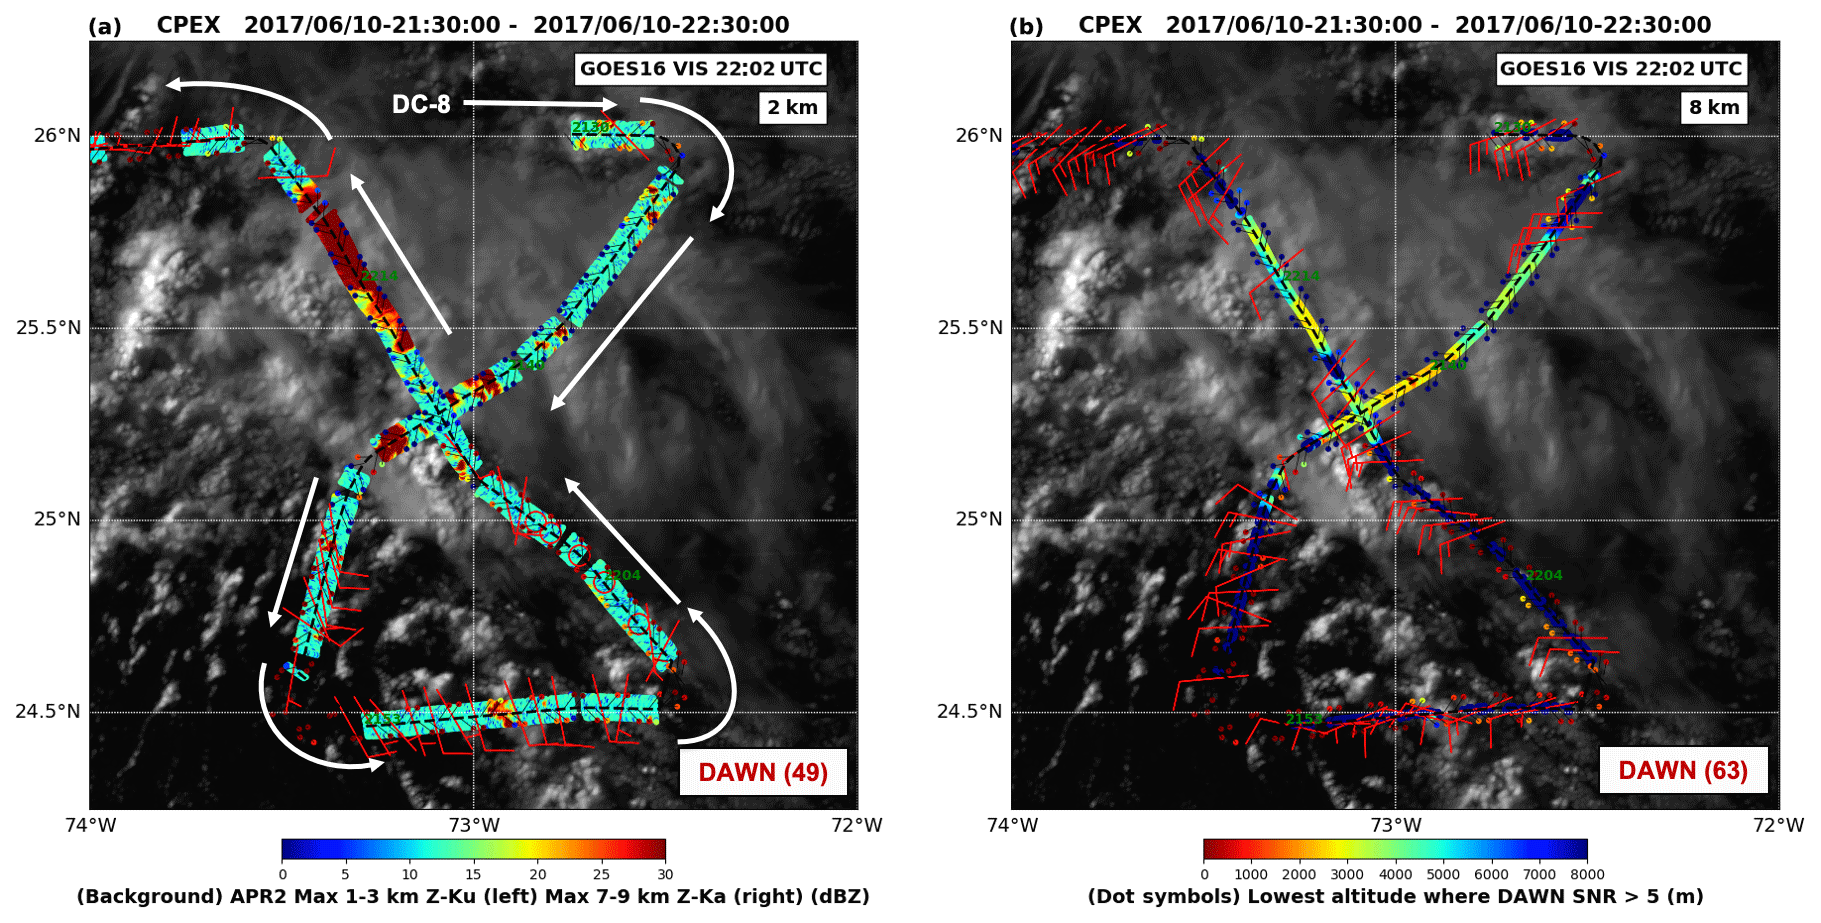
Figure 16DC-8 flight line during segment 4 (21:30–22:30 UTC) on 10 June 2017. Same layout and format as Fig. 10.
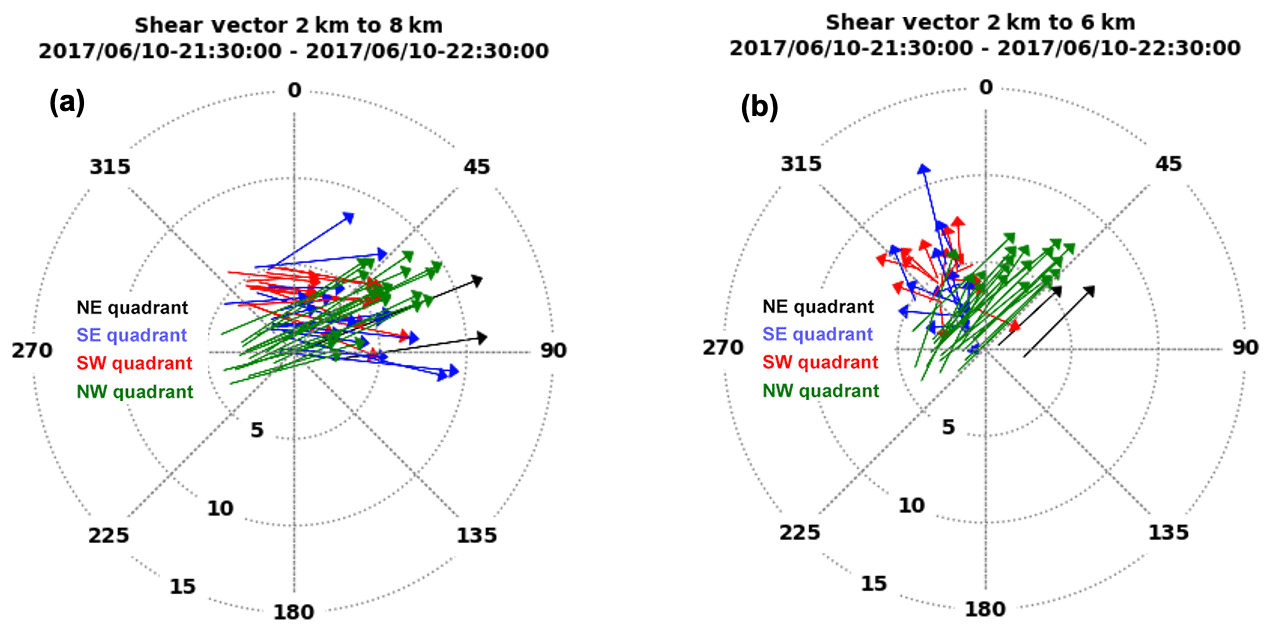
Figure 17 shows the shear in the NW quadrant between 2 and 8 km (and between 2 and 6 km), pointing towards the northeast along a near-radial direction (little directional shear). This period also gathers sufficient DAWN data in the SE quadrant (blue vectors), which was not well-sampled in the earlier time segments. This shows evidence of shear between 2 and 6 km pointing to the north but shear between 2 and 8 km pointing towards the east.
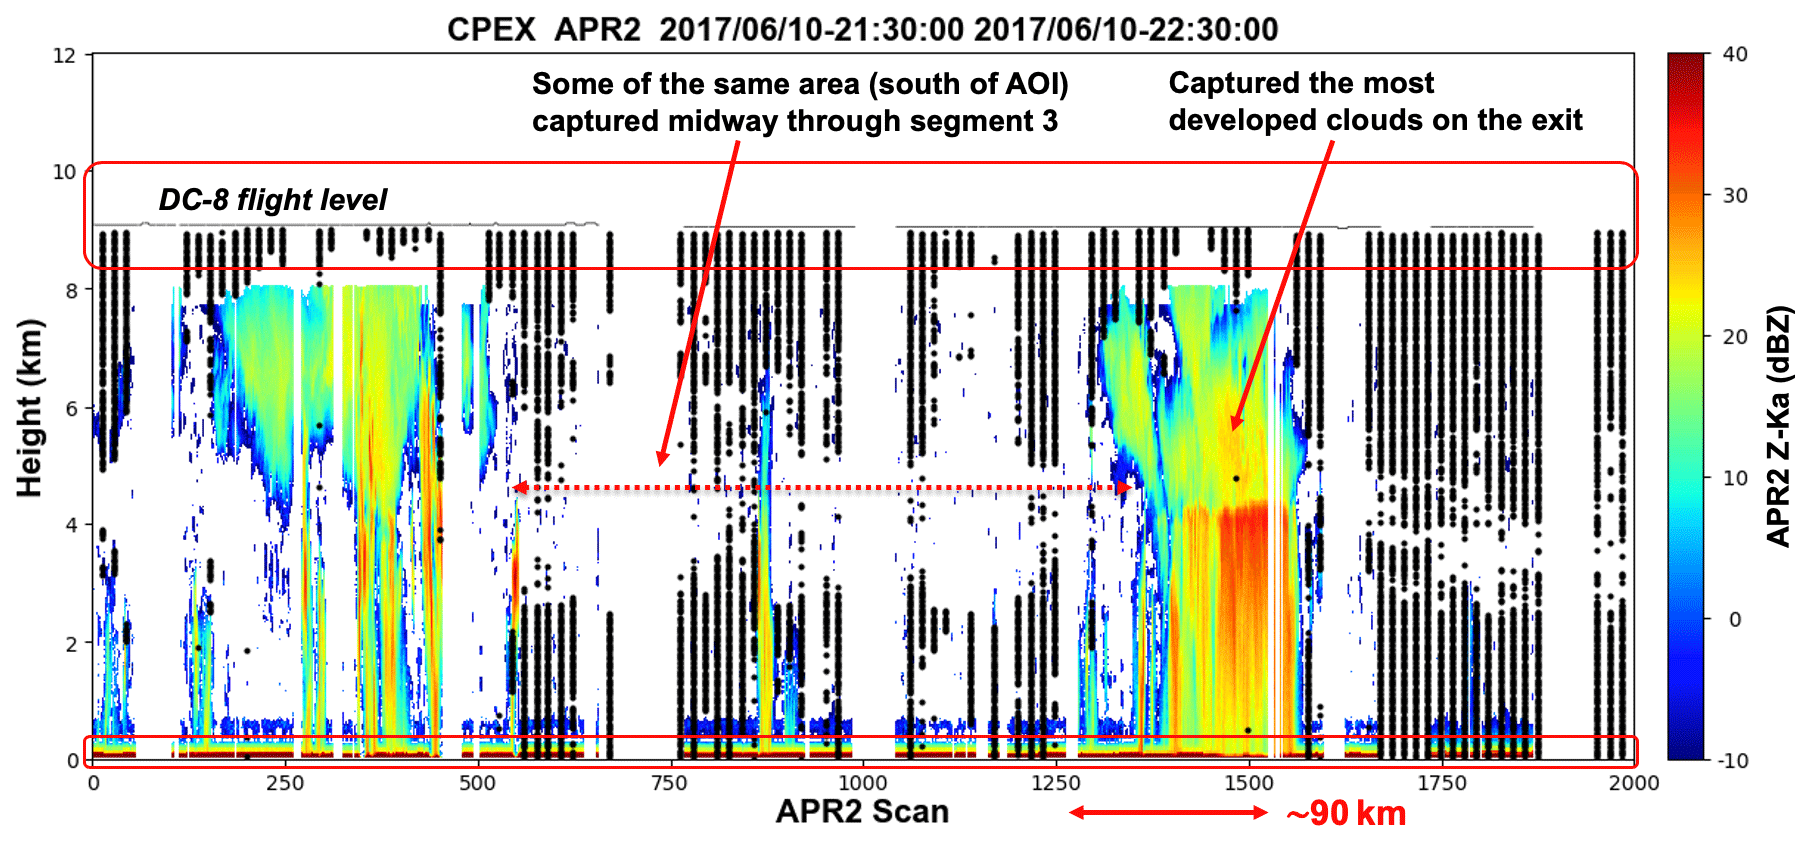
Figure 18Cross section of the APR-2 Ka-band reflectivity (color scale to right) during segment 4 (21:30–22:30 UTC). Same layout and format as Fig. 8.
Narrow growing clouds were first overflown during scans 200–400 (Fig. 18). DAWN vertical sampling density during this time is fairly dense, with more winds provided in the 2–6 km height level than during flight segment 3, notably in the middle and at the end of this flight segment. When the DC-8 moved to a lower 9 km flight level, the pulse width was changed, resulting in the APR-2 blind zone being shorted by one-half (to 0.9 km), which is evident for the tallest clouds near scans 400 and 1400. DAWN also provided overall better sampling in the mid-levels from this lower flight altitude, with almost complete top–bottom profiles towards the end of the flight segment.
APR-2 also provided the vertical air motion and structure of the cloud systems in the cloud-detected regions where the DAWN profiling capability was degraded. The purpose of this section is to examine a method to couple the two wind estimates near clouds. By viewing clouds from multiple viewing directions near nadir, airborne Doppler radars sample a mixture of the vertical and horizontal winds associated with the movement of the hydrometeors being sensed (Heymsfield et al., 1996). As the DC-8 moves forward and the APR-2 scans across-track, the measured Doppler velocity represents a combination of the vertical and across-track components of the hydrometeor motion within each APR-2 range bin (Durden et al., 2003). These data can provide some wind direction information to complement DAWN, and under the right conditions (no significant horizontal shear across the APR-2 scan swath) they can provide some continuity in the wind measurements between the cloud and no-cloud areas. The received Doppler velocity represents contributions from the motion of the hydrometeors owing to air motion and the contribution owing to the (reflectivity-weighted) hydrometeor fall speed. Defining θ as the viewing angle from nadir (e.g., zero represents straight downward, and negative and positive denote the left and right sides of the APR-2 swath, respectively) and vz and vy as the vertical and across-track wind components, the Doppler wind at corresponding left and right sides of the swath is given by
where the subscripts left and right refer to the corresponding APR-2 beam positions at −θ (left side of swath) and +θ (right side of swath), respectively. The vertical (z) and across-track (y) wind components are easily solved for:
Note that in this formulation, the effects owing to the hydrometeor fall speeds are still included, so the estimate of vz in Eq. (3) is not the same as the vertical (w component) wind due to air motion only. To account for the fall speed, the fall speed–reflectively relation developed by Black et al. (1996) is applied and only the 8 km level winds (for which there has not yet been significant attenuation) are assessed. After this correction, vz is assumed equal to the w wind owing to air motion. However, in general more rigorous radar inversion methods that account for the radar attenuation and the hydrometeor Doppler fall speed are required before this formulation can be applied to lower cloud levels (Guimond et al., 2014)
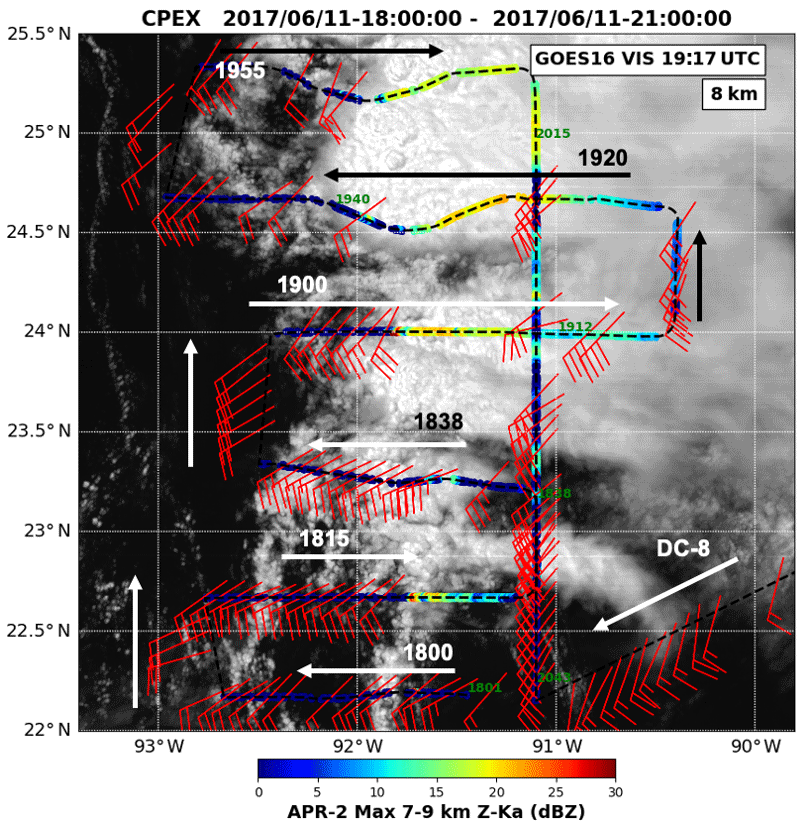
Figure 19DC-8 flight lines during 18:00–21:30 UTC on 11 June. Same layout and format as Fig. 4, but only for the 8 km level. The six E–W or W–E flight lines beginning near 18:00, 18:15, 18:38, 19:00, 19:20 and 19:55 UTC are shown.
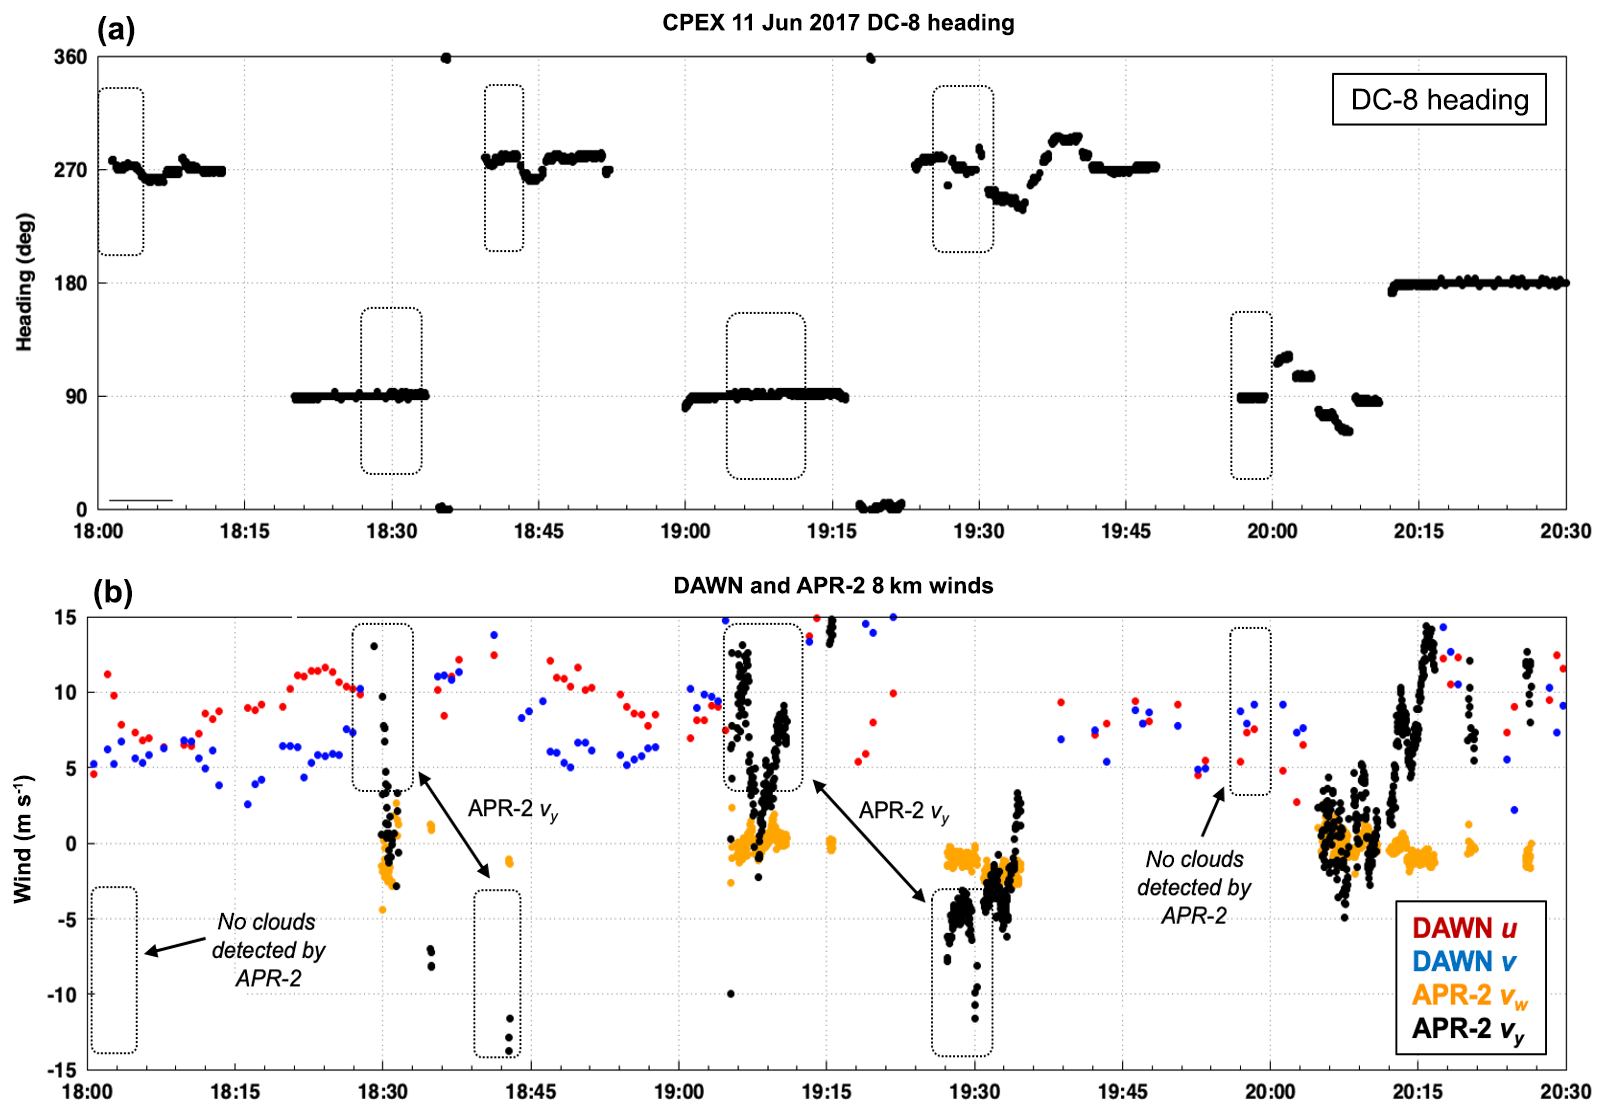
Figure 20(a) DC-8 heading between 18:00 and 21:30 UTC on 11 June 2017, highlighting the six time periods depicted in Fig. 19. (b) DAWN (u,v) wind vectors at the 8 km level (red and blue points, respectively). APR-2 (vw,vy) winds (orange and black, respectively) estimated from Eqs. (3) and (4).
This principle is examined on the APR-2 data gathered between 18:00 and 21:00 UTC on 11 June 2017. Figure 19 shows the plan view, wherein there are abundant DAWN wind vectors at 8 km, including many that are close to clouds. There are six flight legs along a predominant 90∘ (W–E) or 270∘ (E–W) (+u and −u wind component direction, respectively) flight bearing, beginning near 18:00, 18:15, 18:38, 19:00, 19:20 and 19:55 UTC (with some slight deviations along these directions to avoid deep clouds near the flight level). The first and last three of these flight legs occurred in predominantly cloud-free and cloud-covered conditions, respectively. Figure 20a shows the time intervals corresponding to these 90 and 270∘ bearings. In these flight directions, the APR-2 across-track wind component vy (Eq. 4) is solely contributed by the v wind. When the DC-8 transitions from a 90 to 270∘ flight bearing (or vice versa), a flip in the sign of the APR-2 vy component is expected, since the APR-2 right swath side becomes the left swath side.
Figure 20b shows the APR-2 vertical (vz) and across-track (vy) winds estimated from Eqs. (3) and (4), plotted in orange and black, respectively. DAWN (u,v) winds at the same 8 km level are shown in red and blue, respectively. Near 18:30 UTC, the DAWN v component is near 5 m s−1, and the APR-2 v component is near 5–10 m s−1 but quickly (within a few minutes) changes to a smaller value as the DC-8 enters an area with stronger vertical motion and assumptions on horizontal shear are likely voided. Near 18:40 UTC when the DC-8 is flying along a 270∘ bearing and detects clouds at the 8 km level, the APR-2 v component changes to −12 m s−1. While it is the expected wind speed sign flip, it is more difficult to compare the wind speed magnitude. Also, the 270∘ bearing has some deviations near 18:43 UTC to avoid convection at the flight level.
A second coincidence occurs between the APR-2 data near 19:10 and 19:25 UTC, when the APR-2 vy component flips sign between similar wind speed values. However, the area at 19:25 UTC is so cloud-filled that there are no nearby DAWN wind profile data to compare to. It also represents an area with stronger vertical winds, for which the assumption of no significant horizontal shear across the APR-2 scan swath is likely not valid. While this is not a rigorous comparison of DAWN and Doppler precipitation radar horizontal winds, the principle could be applied to any of these data from any close time pair of DC-8 flight bearing segments that are separated by 180∘. In this example, the flight bearings were fortuitously along easterly or westerly directions. For any arbitrary flight bearing, the cross-track winds estimated by Eq. (4) are more generally a combination of (u,v), and the DAWN (u,v) winds could be transformed to these same directions for comparison. This complement of Doppler radar and DWL observations could provide a means to link horizontal wind data outside clouds and inside clouds (away from strong vertical motion, from APR-2), an important transition region. Space-based Doppler radar measurement methods to estimate the horizontal LOS (HLOS) wind in-cloud have been proposed (Illingworth et al., 2018) as one means to complement the HLOS winds from Aeolus. However, further investigation from CPEX and other APR-2 airborne data is needed to assess the quality of the radar wind components before they can be used for science or model data assimilation purposes.
This paper has presented joint observations from the DAWN Doppler wind lidar and the APR-2 (Ku- and Ka-band) Doppler precipitation radar collected during the CPEX campaign in 2017. Data from NASA DC-8 flight segments from two flight dates were examined to assess the ability of DAWN to sense air motion near developing convection. The flight patterns on 10–11 June were selected for this purpose. For the 10 June flight date, the DC-8 arrived on-station to the area of interest with sufficient time to capture the evolution of isolated, small-scale (<10 km horizontal extent, many not yet glaciated) clouds from numerous DC-8 repeat passes for about a 3 h period. The environment surrounding the clouds on this date exhibited directional shear between the 2 and 8 km levels in the quadrant SW of the developing convection. A number of growing convective clouds with APR-2 echo tops below 5 km were sampled by the APR-2, away from the more developed convection. The capability of DAWN to collect LOS profiles near convection was highlighted for several passes wherein profile retrievals were possible up to the edges of many APR-2 detected cloud systems. On 11 June, the DC-8 sampling pattern consisted of successive repeat passes on E–W and W–E flight bearings, for which the cross-track winds from APR-2 were examined for consistency with nearby DAWN winds in the proximity of cloud edges.
As stated in the Introduction, this paper provides the observational context for a separate mesoscale model data assimilation study, which is aimed at quantifying the impact of the DAWN measurements on the analyzed atmospheric state variables and on the forecasted precipitation when the DAWN wind profile observations were assimilated into the model (Zhang et al., 2019). While only limited examples are shown, these particular findings highlight the importance of when and where the wind observations are taken and provide guidance for assessing observational strategies and requirements for future airborne field campaigns with similar instrumentation.
The DAWN LOS and profile data (ASCII text format) and APR-2 data (HDF5 format) are available from the authors upon request.
ST, SLD and OS carried out the APR-2 data preprocessing to produce Level-1 reflectivity products. FJT carried out the data alignment between DAWN and APR-2. All JPL authors contributed to operations of the APR-2 during CPEX. SG, SQZ and GDE collected and performed all DAWN data processing.
The authors declare that they have no conflict of interest.
The work contained in this presentation was carried out at the Jet Propulsion Laboratory, California Institute of Technology, under a contract with NASA. Support from NASA under the Weather and Atmospheric Dynamics program is recognized. The authors gratefully acknowledge the DC-8 flight support team, the CPEX Co-Investigators Ed Zipser and Shuyi Chen, and Kristopher Bedka (NASA Langley Research Center) for his assistance with GOES data processing.
This research has been supported by the National Aeronautics and Space Administration (through program element NNH16ZDA001N).
This paper was edited by Ad Stoffelen and reviewed by Christoph Kiemle and one anonymous referee.
Baker, W. E., Atlas, R., Cardinali, C., Clement, A., Emmitt, G. D., Gentry, B. M., Hardesty, R. M., Källén, E., Kavaya, M. J., Langland, R., Ma, Z., Masutani, M., McCarty, W., Pierce, R. B., Pu, Z., Riishojgaard, L. P., Ryan, J., Tucker, S., Weissmann, M., and Yoe, J. G.: Lidar-Measured Wind Profiles: The Missing Link in the Global Observing System, B. Am. Meteorol. Soc., 95, 543–564, https://doi.org/10.1175/BAMS-D-12-00164.1, 2014.
Black, M. L., Burpee, R. W., and Marks, F. D.: Vertical Motion Characteristics of Tropical Cyclones Determined with Airborne Doppler Radial Velocities, J. Atmos. Sci., 53, 1887–1909, https://doi.org/10.1175/1520-0469(1996)053<1887:VMCOTC>2.0.CO;2, 1996.
Black, P., Harrison, L., Beaubien, M., Bluth, R., Woods, R., Penny, A., Smith, R. W., and Doyle, J. D.: High-Definition Sounding System (HDSS) for Atmospheric Profiling, J. Atmos. Ocean. Tech., 34, 777–796, https://doi.org/10.1175/JTECH-D-14-00210.1, 2017.
Bucci, L. R., O'Handley, C., Emmitt, G. D., Zhang, J. A., Ryan, K., and Atlas, R.: Validation of an Airborne Doppler Wind Lidar in Tropical Cyclones, Sensors (Basel), 18, 4288, https://doi.org/10.3390/s18124288, 2018.
Chen, S. S., Kerns, B. W., Guy, N., Jorgensen, D. P., Delanoë, J., Viltard, N., Zappa, C. J., Judt, F., Lee, C.-Y., and Savarin, A.: Aircraft Observations of Dry Air, the ITCZ, Convective Cloud Systems, and Cold Pools in MJO during DYNAMO, B. Am. Meteorol. Soc., 97, 405–423, https://doi.org/10.1175/BAMS-D-13-00196.1, 2015.
Durden, S. L., Li, L., Im, E., and Yueh, S. H.: A Surface Reference Technique for Airborne Doppler Radar Measurements in Hurricanes, J. Atmos. Ocean. Tech., 20, 269–275, https://doi.org/10.1175/1520-0426(2003)020<0269:ASRTFA>2.0.CO;2, 2003.
Durden, S. L., Tanelli, S., and Im, E.: Recent observations of clouds and precipitation by the airborne precipitation radar 2nd generation in support of the GPM and ACE missions, Remote Sensing of the Atmosphere, Clouds, and Precipitation IV, International Society for Optics and Photonics, Proc. SPIE, 8523, 85230M, https://doi.org/10.1117/12.977574, 2012.
Guimond, S. R., Tian, L., Heymsfield, G. M., and Frasier, S. J.: Wind Retrieval Algorithms for the IWRAP and HIWRAP Airborne Doppler Radars with Applications to Hurricanes, J. Atmos. Ocean. Tech. 31, 1189–1215, https://doi.org/10.1175/JTECH-D-13-00140.1, 2014.
Heymsfield, G. M., Bidwell, S. W., Caylor, I. J., Ameen, S., Nicholson, S., Boncyk, W., Miller, L., Vandemark, D., Racette, P. E., and Dod, L. R.: The EDOP Radar System on the High-Altitude NASA ER-2 Aircraft, J. Atmos. Ocean. Tech., 13, 795–809, https://doi.org/10.1175/1520-0426(1996)013<0795:TERSOT>2.0.CO;2, 1996.
Horányi, A., Cardinali, C., Rennie, M., and Isaksen, L.: The assimilation of horizontal line-of-sight wind information into the ECMWF data assimilation and forecasting system. Part I: The assessment of wind impact, Q. J. Roy. Meteor. Soc., 141, 1223–1232, https://doi.org/10.1002/qj.2430, 2015.
Hristova-Veleva, S., Li, P. P., Knosp, B., Vu, Q., Turk, F. J., Poulsen, W. L., Haddad, Z. S., Lambrigtsen, B., Stiles, B., Shen, T.-P., Niamsuwan, N., Tanelli, S., Sy, O., Su, H., Vane, D. G., Chao, Y., Callahan, P. S., Dunbar, R. S., Montgomery, M., Boothe, M., Tallapragada, V., Trahan, S., Wimmers, A. J., Holz, R., Reid, J., Marks, F., Vukicevic, T., Bhalachandran, S., Leighton, H., Gopalakrishnan, S., Navarro, A., and Tapiador, F. J.: An Eye on the Storm: Integrating a Wealth of Data for Quickly Advancing the Physical Understanding and Forecasting of Hurricanes, B. Am. Meteorol. Soc., accepted, https://doi.org/10.1175/BAMS-D-19-0020.1, 2020.
Illingworth, A. J., Battaglia, A., Bradford, J., Forsythe, M., Joe, P., Kollias, P., Lean, K., Lori, M., Mahfouf, J.-F., Melo, S., Midthassel, R., Munro, Y., Nicol, J., Potthast, R., Rennie, M., Stein, T. H. M., Tanelli, S., Tridon, F., Walden, C. J., and Wolde, M..: WIVERN: A New Satellite Concept to Provide Global In-Cloud Winds, Precipitation, and Cloud Properties, B. Am. Meteorol. Soc., 99, 1669–1687, https://doi.org/10.1175/BAMS-D-16-0047.1, 2018.
Jiang, H., Liu, C. and Zipser, E. J.: A TRMM-based Tropical Cyclone Cloud and Precipitation Feature Database, J. Appl. Meteorol. Clim., 50, 1255–1274, https://doi.org/10.1175/2011JAMC2662.1, 2011.
Kavaya, M. J., Beyon, J. Y., Koch, G. J., Petros, M., Petzar, P. J., Singh, U. N., Trieu, B. C., and Yu, J.: The Doppler aerosol wind (DAWN) airborne, wind-profiling coherent-detection Lidar system: overview and preliminary flight results, J. Atmos. Ocean. Tech., 31, 826–842, https://doi.org/10.1175/JTECH-D-12-00274.1, 2014.
Lux, O., Lemmerz, C., Weiler, F., Marksteiner, U., Witschas, B., Rahm, S., Schäfler, A., and Reitebuch, O.: Airborne wind lidar observations over the North Atlantic in 2016 for the pre-launch validation of the satellite mission Aeolus, Atmos. Meas. Tech., 11, 3297–3322, https://doi.org/10.5194/amt-11-3297-2018, 2018.
Pu, Z., Zhang, L., and Emmitt, G. D.: Impact of airborne Doppler Wind Lidar data on numerical simulation of a tropical cyclone, Geophy. Res. Lett., 37, L05801, https://doi.org/10.1029/2009GL041765, 2010.
Raymond, D., Fuchs, Ž., Gjorgjievska, S., and Sessions, S.: Balanced dynamics and convection in the tropical troposphere, J. Adv. Model. Earth Syst., 7, 1093–1116, https://doi.org/10.1002/2015MS000467, 2015.
Rowe, A. K. and Houze, R. A.: Microphysical characteristics of MJO convection over the Indian Ocean during DYNAMO, J. Geophys. Res.-Atmos., 119, 2543–2554, https://doi.org/10.1002/2013JD020799, 2014.
Rowe, A. K., Rutledge, S. A., and Lang, T. J.: Investigation of Microphysical Processes Occurring in Organized Convection during NAME, Mon. Weather Rev., 140, 2168–2187, https://doi.org/10.1175/MWR-D-11-00124.1, 2012.
Sadowy, G. A., Berkun, A. C., Chun, W., Im, E., and Durden, S. L.: Development of an advanced airborne precipitation radar, Microwave J., 46, 84–98, 2003.
Schiro, K. A. and Neelin, J. D.: Deep Convective Organization, Moisture Vertical Structure, and Convective Transition Using Deep-Inflow Mixing, J. Atmos. Sci., 76, 965–987, https://doi.org/10.1175/JAS-D-18-0122.1, 2019.
Stoffelen, A., Pailleux, J., Källén, E., Vaughan, J. M., Isaksen, L., Flamant, P., Wergen, W., Andersson, E., Schyberg, H., Culoma, A., Meynart, R., Endemann, M., and Ingmann, P.: The atmospheric dynamics mission for global wind field measurement, B. Am. Meteorol. Soc., 86, 73–88, https://doi.org/10.1175/BAMS-86-1-73, 2005.
Velden, C., Daniels, J., Stettner, D., Santek, D., Key, J., Dunion, J., Holmlund, K., Dengel, G., Bresky, W., and Menzel, P: Recent innovations in deriving tropospheric winds from meteorological satellites, B. Am. Meteorol. Soc., 86, 205–224, https://doi.org/10.1175/BAMS-86-2-205, 2005.
Zhang, J. A., Atlas, R., Emmitt, G. D., Bucci, L., and Ryan, K.: Airborne Doppler Wind Lidar Observations of the Tropical Cyclone Boundary Layer, Remote Sens., 10, 825, https://doi.org/10.3390/rs10060825, 2018.
Zhang, S., Hristova-Veleva, S., and Turk, F. J.: Assimilating the DAWN winds: Impact on the precipitation and flow structure of the June 10 squall line, 2nd CPEX Science Team Meeting, 18–19 July 2019, Univ. of Washington, Seattle, Washington, USA, available at: https://cpex.jpl.nasa.gov/cpex2017/scienceteammeeting/2019/SaraZhang_SvetlaHristoveVeleva_JoeTurk_20190717_CPEX_AssimilatingDAWN_June10_v05_final.pdf (last access: 19 August 2020), 2019.
Zuidema, P., Torri, G., Muller, C., and Chandra, A.: A Survey of Precipitation-Induced Atmospheric Cold Pools over Oceans and Their Interactions with the Larger-Scale Environment, Surv. Geophys., 38, 1283–1305, https://doi.org/10.1007/s10712-017-9447-x, 2017.
In 2015, APR-2 was augmented with an additional W-band (94 GHz) Doppler radar for an expanded APR-3 capability. Owing to logistical details, the W-band radar was unavailable for CPEX in 2017, hence the use of the APR-2 system.