the Creative Commons Attribution 4.0 License.
the Creative Commons Attribution 4.0 License.
 | 02 Sep 2020
Aerosol data assimilation in the MOCAGE chemical transport model during the TRAQA/ChArMEx campaign: lidar observations
Laaziz El Amraoui
Bojan Sič
Andrea Piacentini
Virginie Marécal
Nicolas Frebourg
Jean-Luc Attié
This paper presents the first results about the assimilation of CALIOP (Cloud-Aerosol Lidar with Orthogonal Polarization) extinction coefficient measurements onboard the CALIPSO (Cloud-Aerosol Lidar and Infrared Pathfinder Satellite Observations) satellite in the MOCAGE (MOdèle de Chimie Atmosphérique à Grande Echelle) chemistry transport model of Météo-France. This assimilation module is an extension of the aerosol optical depth (AOD) assimilation system already presented by Sič et al. (2016). We focus on the period of the TRAQA (TRAnsport à longue distance et Qualité de l’Air dans le bassin méditerranéen) field campaign that took place during summer 2012. This period offers the opportunity to have access to a large set of aerosol observations from instrumented aircraft, balloons, satellite and ground-based stations. We evaluate the added value of CALIOP assimilation with respect to the model free run by comparing both fields to independent observations issued from the TRAQA field campaign.
In this study we focus on the desert dust outbreak which happened during late June 2012 over the Mediterranean Basin (MB) during the TRAQA campaign. The comparison with the AERONET (Aerosol Robotic Network) AOD measurements shows that the assimilation of CALIOP lidar observations improves the statistics compared to the model free run. The correlation between AERONET and the model (assimilation) is 0.682 (0.753); the bias and the root mean square error (RMSE), due to CALIOP assimilation, are reduced from −0.063 to 0.048 and from 0.183 to 0.148, respectively.
Compared to MODIS (Moderate-resolution Imaging Spectroradiometer) AOD observations, the model free run shows an underestimation of the AOD values, whereas the CALIOP assimilation corrects this underestimation and shows a quantitative good improvement in terms of AOD maps over the MB. The correlation between MODIS and the model (assimilation) during the dust outbreak is 0.47 (0.52), whereas the bias is −0.18 (−0.02) and the RMSE is 0.36 (0.30).
The comparison of in situ aircraft and balloon measurements to both modelled and assimilated outputs shows that the CALIOP lidar assimilation highly improves the model aerosol field. The evaluation with the LOAC (Light Optical Particle Counter) measurements indicates that the aerosol vertical profiles are well simulated by the direct model but with a general underestimation of the aerosol number concentration, especially in the altitude range 2–5 km. The CALIOP assimilation improves these results by a factor of 2.5 to 5.
Analysis of the vertical distribution of the desert aerosol concentration shows that the aerosol dust transport event is well captured by the model but with an underestimated intensity. The assimilation of CALIOP observations allows the improvement of the geographical representation of the event within the model as well as its intensity by a factor of 2 in the altitude range 1–5 km.
- Article
(9883 KB) - Full-text XML
- Companion paper
- BibTeX
- EndNote


Aerosols play an important role in the atmospheric system of our planet. They have a significant impact on the Earth's radiation budget by direct scattering/absorption of sunlight and by changing cloud properties (e.g. Tegen and Lacis, 1996). Therefore, they play a major role in the climate system. They also have an influence on the photochemistry of our atmosphere via the change in the intensity of photolysis of tropospheric oxidants (e.g. Tie et al., 2005). It is then important to simulate the three-dimensional (3D) distribution of different types of aerosols well within the chemistry and transport models (CTMs). Nevertheless, modelling of different types of aerosols is challenging due to the complexity of their physical/chemical transformations and the uncertainties in the parameterisations of their sources/sinks. Model improvements can be achieved (i) by improving physical parameterisations of the aerosols (see e.g. Sič et al., 2015) and/or (ii) by assimilating aerosol products such as aerosol optical depth (AOD) (e.g. Sič et al., 2016) or lidar backscatter/extinction profiles. Here, we deal with the improvement of modelled 3D distribution of aerosols using data assimilation.
Global observations of tropospheric aerosols have been performed from several satellite instruments including radiometers and lidars since the late 1970s (the reader may refer to King et al. (1999) for a historical overview). The aerosol measurements from these different instruments have provided many opportunities to study tropospheric aerosols on global and regional scales. This includes for example MISR (Multi-angle Imaging SpectroRadiometer; Diner et al., 1989), POLDER (POLarization and Directionality of the Earth’s Reflectances; Deschamps et al., 1994), MODIS (MODerate resolution Imaging SpectroRadiometer; Justice et al., 1998), MERIS (Medium Resolution Imaging Spectrometer; Rast et al., 1999), SEVIRI (Spinning Enhanced Visible and Infrared Imager; Aminou, 2002), and CALIOP (Cloud-Aerosol LIdar with Orthogonal Polarization; Winker et al., 2003).
Most of the aerosols related to air quality and pollution are found in the lower troposphere or boundary layer (e.g. Akimoto, 2003). These tropospheric aerosols are very important components of the Earth–atmosphere–ocean system and affect climate, pollution, air quality and health (see e.g. Ebi and McGregor, 2008). Research on air quality and pollution is generally based on (i) the use of observations from different space or in situ platforms or (ii) the use of numerical models that are used first to better understand the physico-chemical processes that cause air pollution and then to predict the spatial and temporal evolution of the different types of aerosols. Nevertheless, current methodologies for detecting aerosols are based on observations from passive sensors (spectroradiometers) or active sensors (lidars). The spectroradiometers are generally characterised by a good horizontal coverage but a very limited vertical resolution. By contrast, lidar measurements have a very good vertical resolution but a very low spatial coverage. On the other hand, modelling has the advantage of providing a 3D detailed spatio-temporal representation of different types of aerosols. Nevertheless, models generally face problems related mainly to the initial conditions, spatial resolution and emissions. Data assimilation is often used to overcome these difficulties and thus to improve the representation of different types of aerosols within models.
Chemical data assimilation consists in combining in an optimal way observations provided by instruments and a priori knowledge about a physical system such as model output. The observations act as constraints for the models and thus can be used to overcome model deficiencies (e.g. El Amraoui et al., 2014). Typically, observation-minus-forecast (OMF) statistics are used for monitoring biases between the observations and the models (e.g. El Amraoui et al., 2010). Data assimilation systems produce a self-consistent 4D (time and space) description of the dynamical and chemical state of the atmosphere, taking into account both the available chemical observations and our theoretical understanding of the atmospheric system.
The assimilation of different aerosol components has been conducted in the framework of many studies including AOD (e.g. Rasch et al., 2001; Zhang and Reid, 2006; Niu et al., 2008; Benedetti et al., 2009; Liu et al., 2011; Shi et al., 2011), particulate matters (PMs) (e.g. Tombette et al., 2009; Lee et al., 2013) and lidar profiles (e.g. Sekiyama et al., 2010; Zhang et al., 2011; Wang et al., 2014). Most of these studies have shown that data assimilation of different aerosol-related quantities has a positive impact on aerosol forecasting, especially during the first forecast hours. Moreover, the assimilation of lidar profiles has the advantage of constraining the vertical structure of the model in a much more realistic and direct way. Consequently, the assimilation of lidar information would serve to reduce the influence of diffusion and better constrain the vertical structure (Campbell et al., 2010).
In this study, we present the assimilation module of lidar measurements in the CTM of Météo-France, MOCAGE (MOdèle de Chimie Atmosphérique à Grande Echelle). The assimilation system coupled to the MOCAGE CTM was initially developed and used for atmospheric gases, predominately ozone (O3) (e.g. Semane et al., 2007; El Amraoui et al., 2008b; Rabier et al., 2010; Bencherif et al., 2011; Barré et al., 2013; Emili et al., 2014; Hache et al., 2014; Abida et al., 2017), carbon monoxide (CO) (e.g. El Amraoui et al., 2010; Claeyman et al., 2010, 2011a; El Amraoui et al., 2014) and water vapour (H2O) (e.g. Payra et al., 2016). The assimilation of aerosol components within the MOCAGE CTM is more recent compared to that of chemical species. The first work related to the aerosol assimilation in MOCAGE concerned the MODIS AOD assimilation. The assimilation module presented in this work is an extension of the AOD assimilation system already described by Sič et al. (2016).
We consider the extinction coefficient measurements from the CALIOP lidar onboard the CALIPSO (Cloud-Aerosol Lidar and Infrared Pathfinder Satellite Observations) satellite. We focus on the African dust event that occurred in late June–early July 2012 over the Mediterranean Basin (MB) during the TRAQA (TRAnsport à longue distance et Qualité de l'Air dans le bassin méditerranéen) field campaign held between 26 and 11 July 2012 (see Sect. 3.3 later for more information about the TRAQA campaign). During this dust outbreak event, several aerosol profiles within the dust plume were measured by the PCASP (Passive Cavity Aerosol Spectrometer Probe; see Sect. 3.3.1) instrument onboard the instrumented aircraft.
This study aims principally to
-
present the lidar assimilation module as well as the first results dealing with the assimilation of CALIOP observations in terms of extinction coefficient into the MOCAGE CTM and
-
evaluate the impact of lidar assimilation on the 3D tropospheric aerosol distribution at regional scale during this large-scale event. The lidar measurements from the CALIOP instrument are assimilated into the MOCAGE CTM using the variational 3D-FGAT (first guess at appropriate time) method. The impact of the CALIOP extinction coefficient assimilation on the aerosol distribution has been evaluated using a set of independent data including AERONET (AErosol RObotic NETwork), MODIS, aircraft as well as balloon measurements.
The paper outline is as follows. In Sect. 2 we describe the CALIOP lidar measurements which are assimilated in terms of extinction coefficient as well as the model and the assimilation system used in this study. Section 3 presents the independent observations used for the evaluation of CALIOP assimilation: AOD observations from MODIS and AERONET as well as the in situ measurements collected during the TRAQA field campaign. Results concerning the assimilation of CALIOP lidar measurements during the TRAQA field campaign are presented in Sect. 4. Summary and conclusions are presented in Sect. 5.
2.1 Assimilated observations: CALIPSO/CALIOP measurements
The CALIPSO satellite is a partnership between NASA (National Aeronautics and Space Administration) and the French Space Agency, CNES (Centre National d’Etudes Spatiales). It was launched on 28 April 2006 with the cloud profiling radar system on the CloudSat satellite. It flew in the international “A-Train” constellation for coincident Earth observations until 13 September 2018, when CALIPSO began lowering its orbit from 705 to 688 km above the Earth to resume formation flying with CloudSat as part of the “C-Train” (see https://atrain.nasa.gov/, last access: 20 August 2020). The CALIPSO satellite comprises three instruments, the CALIOP lidar, the IIR (Imaging Infrared Radiometer), and the WFC (Wide Field Camera). For more information on the CALIPSO measurements, the reader could refer to the website: https://www-calipso.larc.nasa.gov/ (last access : 20 August 2020).
The CALIPSO satellite provides new insight into the role that clouds and atmospheric aerosols (airborne particles) play in regulating Earth's weather, climate, and air quality (e.g. Huang et al., 2015). CALIOP is a two-wavelength lidar that has the ability to differentiate between types of aerosols. It provides the processed backscatter signal and the retrieved backscattering and extinction coefficients. CALIOP is an elastic backscatter lidar operating at 532 and 1064 nm (Winker et al., 2010). It generally has two ascending and two descending orbits per day with a frequency of measurements that varies from day to day. CALIOP provides continuous measurements in both space and time but with limited horizontal coverage since CALIOP has a very narrow swath. Nevertheless, it allows one to have aerosol and cloud profiles with a vertical resolution of 30 to 60 m (Winker et al., 2012).
In this study, the quality controls of the selected aerosol profiles of CALIOP observations to be assimilated have to be consistent with the following criteria (see e.g. Cheng et al., 2019): the measurements in each level of the vertical profile are not contaminated by clouds, the extinction coefficient must be greater than 0, and the extinction quality control flag must be equal to 0 or 1.
It should be noted that the vertical resolution of the CALIOP observations is much higher than that of the model. Before the assimilation, each CALIOP profile is adjusted to the model resolution. We first choose a vertical grid that best fits the model. This vertical grid is projected onto each profile of the CALIOP data in such a way that each level corresponds to the middle of the layer. The intermediate levels are then averaged inside each layer. Thus, the profile best corresponds to that of the model while keeping as much as possible of the vertical information.
We will thus see the ability of the CALIOP aerosol observations to constrain the MOCAGE model and to provide added value when assessed against independent observations.
2.2 The model and assimilation system
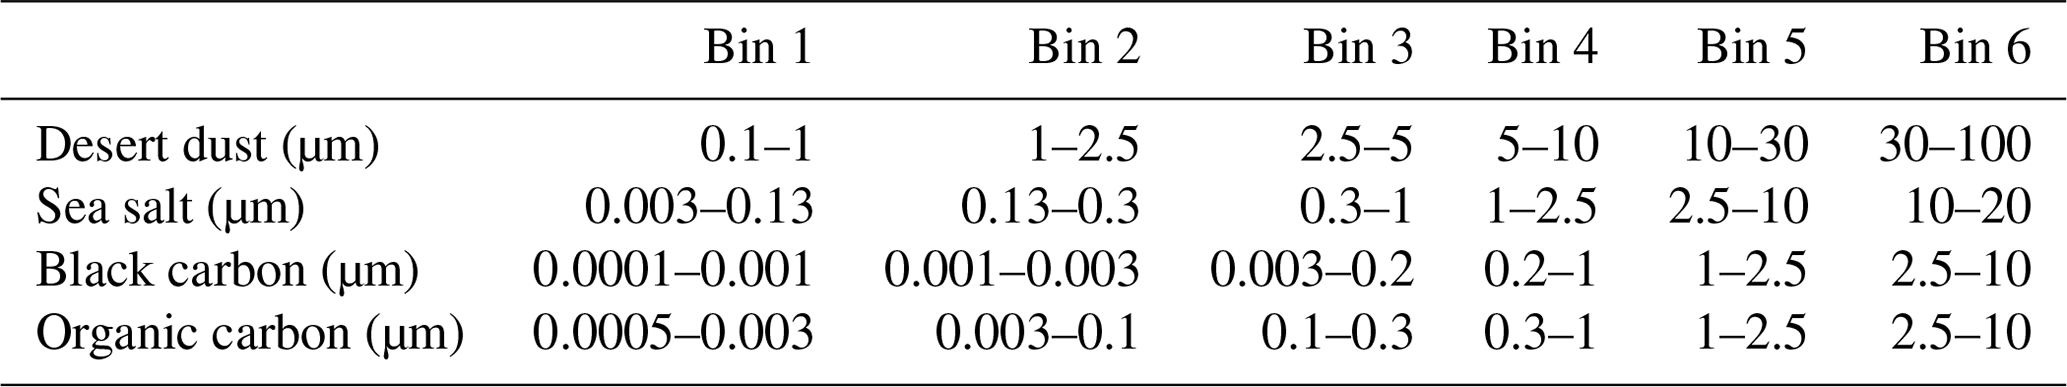
MOCAGE (e.g. Josse et al., 2004; Teyssèdre et al., 2007) is a global 3D CTM which covers the planetary boundary layer, the free troposphere and the stratosphere. It provides a number of optional configurations with varying domain geometries and resolutions as well as chemical and physical parametrisation packages. In this study, MOCAGE is forced dynamically by wind and temperature fields from the ARPEGE (Action de Recherche Petite Echelle Grande Echelle) model analyses, the global operational weather prediction model of Météo-France (Courtier et al., 1991). It is run in a two-domain configuration with a global grid of and a smaller nested domain with a grid of (called MEDI02) including the MB and the Sahara. The assimilation is done only on the nested domain MEDI02. The model uses a semi-Lagrangian transport scheme and includes 47 hybrid (σ, P) levels from the surface up to 5 hPa, where ; P and Ps are the pressure and the surface pressure, respectively. In the boundary layer, MOCAGE has seven levels with a vertical resolution between 40 and 400 m. In the free troposphere, the vertical resolution of MOCAGE varies from 400 to 800 m. Modelled aerosol species for this study are black carbon (BC), primary organic carbon (OC), desert dust and sea salt (Martet et al., 2009; Sič et al., 2015). Biomass-burning sources of BC and OC aerosols used in this study are the same as used in Sič et al. (2016). They are based on a daily frequency from the Global Fire Assimilation System (GFAS) version 1.1 (Kaiser et al., 2012). These represented aerosol species are far from complete, secondary aerosol, which can be the major part of the fine fraction, being lacking. This partly explains the generally observed negative biases observed in their study. Assimilation corrects this bias simply, but possibly also root mean square error (RMSE) and correlation. The particle size distribution for each aerosol type is divided into six bins. The diameter range of different primary aerosol bins considered within the MOCAGE model is presented in Table 1. In total, we have 24 aerosol bins. Each aerosol bin is considered a passive tracer during the model integration (including emission, transport and removal processes from the atmosphere). However, there are no physical transformations or chemical reactions between different types of aerosols/bins with gases. More details and information about the different parameterisations used within the MOCAGE CTM as well as the primary aerosols can be found in Sič et al. (2015).
Table 1Variation range of different primary aerosol bins within the MOCAGE model.
The assimilation system is MOCAGE-Valentina (e.g. Emili et al., 2014; El Amraoui et al., 2014), which is an extension of the MOCAGE-PALM system (e.g. Massart et al., 2009).
The assimilation system used in this study is the same as described in Sič et al. (2016). It uses the 3D-FGAT method which compares the observation and background fields at the correct time and assumes that the increment to be added to the background state is constant over the entire assimilation window. This technique has already produced good-quality results compared to independent data, especially for O3 (e.g. Semane et al., 2007; El Amraoui et al., 2008a, b; Rabier et al., 2010; Bencherif et al., 2011), CO (e.g. El Amraoui et al., 2010; Claeyman et al., 2011b), H2O (e.g. Payra et al., 2016) and AOD (e.g. Sič et al., 2016). This variant has the advantage that the linearised operator of the model evolution and its adjoint are replaced by the identity. The cost function of the 3D-FGAT incremental form is
B and R are the background and observation error covariance matrices, respectively. In order to minimise the cost function more efficiently and to improve the convergence, the increment δx is transformed to
In this way the cost function becomes
is the departure, at time ti, between the observation vector yi and its model equivalent in the observation space . The H operator is the tangent linear of the H operator.
In this formulation, there is no need for the explicit specification of the inverse matrix B−1. Other advantages of such an approach are presented by Courtier et al. (1994).
The minimisation of the cost function with the preconditioned form gives, as a result, an increment of the analysis in the space of variable v. After the minimisation, it is necessary to pass into the model space again, and the increment is calculated as
More details on the assimilation algorithm are described by Pannekoucke and Massart (2008) and Massart et al. (2012).
The background error covariance matrix B can be represented as
where Σ is the diagonal matrix of the square root of the variances and C is the positive definite symmetric matrix of horizontal and vertical correlations.
The correlation matrix C contains both horizontal and vertical operators. The horizontal correlation is modelled using a 2D Gaussian function (Weaver and Courtier, 2001; Weaver and Ricci, 2003; Pannekoucke and Massart, 2008) with a homogenous length scale in both latitude and longitude.
The horizontal correlation () between two points (m and n) separated by a distance (δm,n) is
Lx and Ly are the longitude and latitude length scales in kilometres, respectively.
Re is the Earth's radius (6371.22 km) and αx and αy are the longitude and latitude length scales, respectively, in degrees. In this study, both αx and αy are constant and fixed to 0.2∘ (same as the grid resolution of the assimilated domain), which corresponds to a length scale of about 20–22 km.
The vertical correlation is modelled using a Gaussian function in terms of the logarithm of the pressure. Thus, the vertical correlation () between two pressure levels (pi and pj) is as follows:
The estimation of the dimensionless parameter, k, is based on the propagation shape of the increment around the observation location (e.g. Massart et al., 2010). In the troposphere, it is found that k=100 better characterises the vertical correlation of the B matrix (e.g. El Amraoui et al., 2014).
In data assimilation, the covariance matrices B and R should be consistent (see e.g. Talagrand, 2003). This consistency could be ensured thanks to the help of the χ2 test (Lahoz et al., 2007; Ménard and Chang, 2000). A χ2 value close to 1 is a good indication of the consistency of the assimilation algorithm (e.g. Talagrand, 2003). The background and observation error variances, located along the diagonal of B and R, influence the weight of the model and observations in the cost function. In this study, following the same approach as in Sič et al. (2016), the background and observation error variances are specified as a percentage of the first guess field and the CALIOP lidar measurements, respectively.
Different validation exercises indicate that the CALIOP observations are situated within a range between 10 % and 25 % in comparison to different independent data (e.g. Liu et al., 2008; Mamouri et al., 2009; Sekiyama et al., 2010; Kacenelenbogen et al., 2011; Rogers et al., 2014; Zhou et al., 2017). Based on these studies, we fixed the observation error covariance matrix R to 15 %. Errors of observations are considered to be non-correlated, which means that all non-diagonal members (covariances) in the R matrix are zero. Further, based on this estimation of the R matrix, we have estimated the B matrix using the χ2 test in order to check the consistency of the assimilation algorithm in the same way as we already did in our previous studies (see e.g. El Amraoui et al., 2014; Sič et al., 2016). The background error variances, which are located on the diagonal of the B matrix, are found to be 30 % of the background state.
Note that for better model–observation comparison and memory optimisation, the assimilation cycle (assimilation window) is generally divided into time slots of 1 h. During each slot, observations are read, the observation operator is run, its output field is interpolated to locations and times of the observations and compared with the observations, and the innovation vector is calculated and stored. In this study, the length of the assimilation window is the same as the time slot; consequently, the cost function is minimised every hour.
2.3 Lidar assimilation
For aerosols, the modelled prognostic variable and observations are usually not the same physical quantity. In MOCAGE, the prognostic variable is the aerosol mass concentration of each bin, and the quantities that could be assimilated within this assimilation system are the aerosol optical depth and the lidar backscatter/extinction profiles. For assimilation, it is necessary to choose the control variable x (Eq. 3) in the way to be the best adapted to our system and its purpose. The observation operator should be as simple as possible and easy to linearise.
In the literature we can find different choices for the control variable for the assimilation of different aerosol parameters. For more information about the different approaches concerning the choice of the control variable for the aerosol assimilation, the reader could be referred to Sič (2014) and Sič et al. (2016).
For our assimilation system, we chose to use the 3D total aerosol concentration as the control variable as in Benedetti et al. (2009). With this choice, the assimilation system is able to assimilate either AOD measurements or lidar profiles (separately or jointly). Moreover, the problem of minimisation of the cost function is better determined than in the first approach, where one observation would be used to constrain 30 unknowns (bins). Also, it is better in terms of memory usage and computing performances. Still, in order to linearise the observation operator, it is necessary to make an assumption about how the analysis increment δxa will influence each bin.
In MOCAGE-Valentina, we keep the relative contribution of each bin constant in terms of their mass during the assimilation cycle. Bulk aerosol observations do not have any information on the contributions of different aerosol types. The validation of this approach has been done in Sič (2014) and successfully applied to AOD assimilation (Sič et al., 2016).
The information on the aerosol vertical profile can be obtained from lidar observations. Incorporating this information into MOCAGE-Valentina is an important improvement in the model. For the assimilation of lidar profiles, it is necessary to develop an observation operator which links the total concentration in the model space with observed lidar quantities in the observation space.
The observation operator transforms the control variable in terms of total aerosol concentration into the lidar extinction coefficient observed quantity. First, the lidar profile observation operator within the MOCAGE-PALM assimilation system sums all individual species in order to calculate the total concentration. Second, it solves the lidar equation by taking into account the contributions of aerosols, gases and Rayleigh scattering. In order to make a connection between total aerosol mass and lidar-observed quantities, the relative mass contributions among aerosol species and sizes (bins) are considered constant in the tangent-linear and adjoint operators (during an assimilation cycle).
To calculate the increment at the end of the cycle, the same relative mass contribution determined before the assimilation is used to convert the total concentration into all the aerosol bins. The observation operator simulates measurements of an elastic backscatter lidar.
By using 3D total concentration as the control variable, we develop the system which is able to efficiently assimilate AOD and lidar profiles. The lidar quantities that could be considered and assimilated within the MOCAGE system are the attenuated backscatter signal, the aerosol extinction coefficient and the aerosol backscatter coefficient. The theoretical concepts of the observation operator as well as the tangent-linear and adjoint tests concerning the lidar assimilation are presented in detail in Sič (2014).
We extend our study to the lidar measurements derived from the CALIOP instrument onboard the CALIPSO satellite and we focus on the TRAQA campaign for which we have access to a wide range of datasets comprising AOD, in situ measurements from the aircraft and the LOAC balloon observations. We study the case of a desert dust transport from Africa to the MB. The added value of the assimilation of CALIOP measurements will be assessed in terms of the improvement of the representation of the desert aerosol within the MOCAGE model during this event.
3.1 MODIS
The MODIS instruments onboard the two EOS (Earth Observing System) satellites Terra (since 2000) and Aqua (since 2002) observe atmospheric aerosols and provide information about aerosol distribution on global coverage at horizontal resolutions of 10 and 3 km. The evaluation of CALIPSO analyses in terms of MODIS AOD is done by using Collection C61 retrievals at 550 nm from both Terra and Aqua. The MODIS data concern both the deep blue and dark target products. For more information about the improvements of the C61 collection in comparison to the C6 collection, the reader is referred to https://modis-atmosphere.gsfc.nasa.gov/sites/default/files/ModAtmo/C061_Aerosol_Dark_Target_v2.pdf (last access: 8 July 2020) for the deep blue product and to Gupta et al. (2016) for the dark target product.
The MODIS C61 version used in this comparison has a resolution of 10 km×10 km. To fit the model resolution of 0.2 over the MB in which the CALIOP assimilation has been performed, we calculate the so-called super observations (Daley, 1993) obtained by averaging all MODIS observations within the model grid.
3.2 AERONET
The AERONET project is a federation of ground-based remote-sensing aerosol networks. It uses CIMEL Sun/sky radiometers that make measurements within 340–1020 nm for the direct Sun radiation (Holben et al., 1998). For more than 25 years, the project has provided a long-term, continuous and readily accessible public domain database of aerosol optical, microphysical and radiative properties for aerosol research and characterisation, validation of satellite retrievals, and synergism with other databases. AERONET measurements are available at three levels: Level 1 (unscreened), Level 1.5 (cloud screened), and Level 2 (cloud screened and quality assured). The network imposes standardisation of instruments, calibration, processing and distribution. For more information about the AERONET project, the reader could be referred to https://aeronet.gsfc.nasa.gov/ (last access: 20 July 2020). In this study, we used AERONET Level 2 (L2) data for the evaluation of the model free run and CALIOP lidar assimilated product.
3.3 In situ measurements during the TRAQA field campaign
TRAQA is a scientific experiment within the MISTRALS (Mediterranean Integrated STudies at Regional And Local Scales) programme (http://www.mistrals-home.org, last access: 20 July 2020). It was part of the preparation of the observation campaigns for the ChArMEx component (Chemistry AeRosol Mediterranean EXperiment; http://charmex.lsce.ipsl.fr, last access: 20 July 2020). The ChArMEx project aimed at better estimating the impact of the chemical and particulate composition of the atmosphere on air quality and climate change at the scale of the MB (see e.g. Jaidan et al., 2018).
The objectives of the TRAQA field campaign were to study transport, ageing and mixing of the pollution occurring in the MB (see e.g. Basart et al., 2016). The aircraft flight domain was located over the north-western MB during summer 2012. During the TRAQA campaign, between 26 June and 12 July 2012, several measurements of trace gases and aerosols were undertaken using numerous instruments, such as the ATR-42 aircraft, atmospheric balloons (sounding and drift) and ground-based instruments. Seven intensive observation periods (IOPs) were performed using the ATR-42 aircraft operated by Météo-France/Safire. In particular, on 29 June 2012, a remarkable desert dust outbreak event marked by the recording of high values of AOD and aerosol concentrations was well captured by the aircraft instrument with a clear transport of aerosols to the MB (see e.g. Sič et al., 2016).
In this study, we will focus on this desert dust outbreak to evaluate the added value of the CALIOP observations within the assimilation system compared to the free model run.
3.3.1 Aircraft measurement: PCASP
During TRAQA, the ATR-42 aircraft was equipped with the PCASP instrument. It is an aerosol spectrometer that measures the concentration and the particle size distribution of aerosols at high frequency in 30 channels distributed over the diameter range 0.1–3 µm (Strapp et al., 1992). Additional information on the instrument, the calibration methods and the measurement errors is reported by Cai et al. (2013). In this study we use data averaged over a 1 min interval with a spatial resolution of about 8 km.
3.3.2 LOAC
The LOAC (Light Optical Particle Counter; Renard et al., 2016) is an optical counter that measures the concentration in number of aerosols. It uses the two-angle diffusion aerosol measurement technique (Lurton et al., 2014; Renard et al., 2016). The LOAC used during the TRAQA campaign has 20 size classes in the diameter range between 2 and 100 µm and is installed onboard meteorological balloons. The number uncertainties for LOACs are of the order of 20 % and 60 % for concentrations above 1 cm−3 and for concentrations below 0.01 cm−3, respectively. The vertical resolution of the LOAC measurements is the product of the LOAC time resolution including averaging and the balloon ascent speed. It ranges in the troposphere between 300 and 400 m, which is in the same range as the resolution of the MOCAGE model in the free troposphere.
We assimilate the extinction coefficient measurements from the CALIOP instrument into MOCAGE during the TRAQA campaign period. The objective is to assess the added value of CALIOP analyses compared to the model free run. Both fields are compared to different datasets presented in Sect. 3 including AOD observations from MODIS and AERONET as well as the in situ measurements collected during the TRAQA field campaign. The extinction coefficient observations from the CALIOP lidar are assimilated in the period between 20 June and 11 July 2012.
For this assimilation experiment, the domain in which the assimilation takes place, called the control domain, is defined with a resolution of . It spatially covers the MB and the African Saharan desert. The boundaries of this control domain are [20∘ W–40∘ E, 16–52∘ N]. The boundary conditions for both the model and the assimilation outputs are provided by the global domain which is run with a spatial resolution of .
4.1 Performance of the assimilation
To evaluate the impact of CALIOP lidar measurements on the modelled field, we analyse the behaviour of the assimilation diagnostics in terms of observation minus analysis (OMA) and OMF. Figure 1 shows the OMF and OMA histograms for all CALIOP lidar measurements in terms of extinction coefficient during the whole assimilation period (20 June–11 July 2012). From this figure, we notice that the OMA histogram is narrower and with its mean closer to zero than that for OMF (this means that the bias is reduced). The mean value of OMF (OMA) is 0.012 km−1 (0.0095 km−1) with a respective standard deviation of 0.15 km−1 (0.14 km−1). This indicates that the CALIOP lidar assimilated field is closer to the observations than the forecasts in terms of extinction coefficient. Note also that the bias between the observations and the model field is reduced after the assimilation process. Note that the assimilation system is more efficient when OMF is negative. This likely corresponds to the lower observation values and lower observation uncertainties. In this case, the assimilation system gives more confidence to the observations. The results from these a posteriori diagnostics show that the CALIOP assimilation has improved the model field since the assimilated field is globally closer to the observations than the free model field.
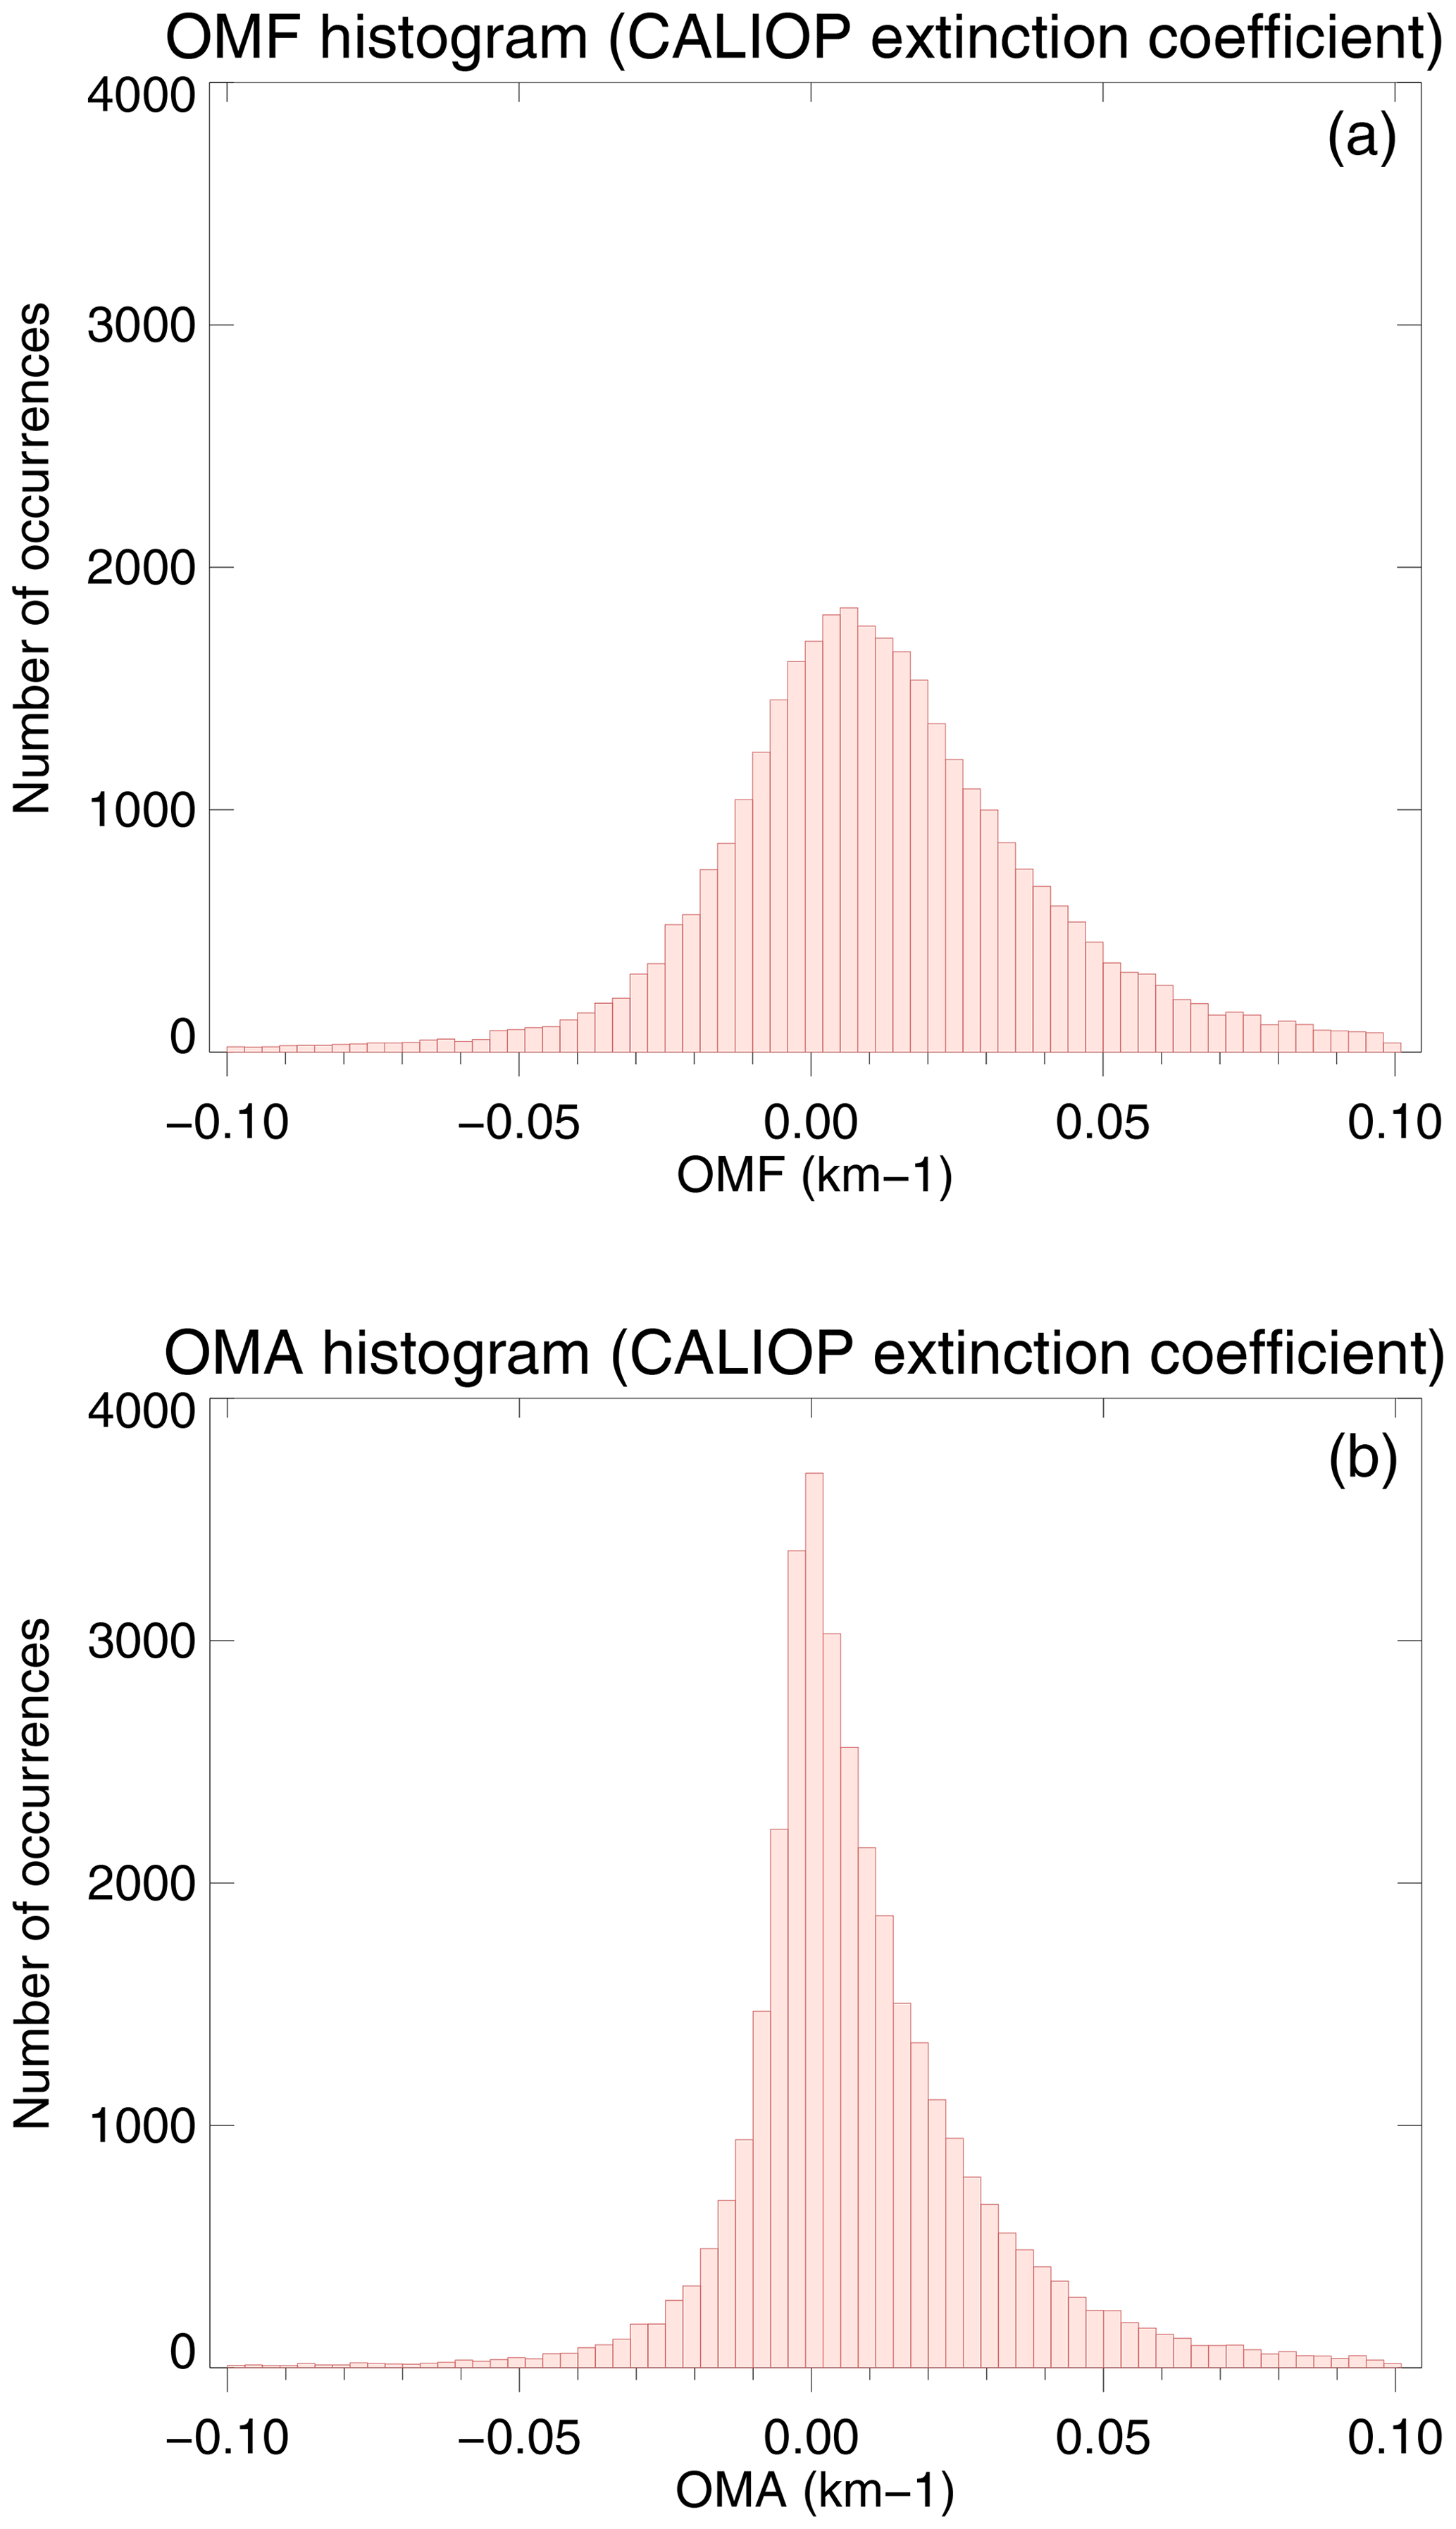
Figure 1Histograms of the assimilation diagnostics in terms of OMF (observation minus forecast) in (a) and OMA (observation minus analysis) in (b).
4.2 Comparison with MODIS observations
In this section, we present a first evaluation of the extinction coefficient assimilated product with respect to the MOCAGE free run by comparing both fields with the MODIS-independent observations in terms of AOD.
Figure 2 presents a comparison between the AOD from the MOCAGE model and those from the CALIOP assimilation compared to MODIS over the MB for specific days of the whole desert dust outbreak event (from 26 June to 1 July 2012). All the fields presented in this figure were averaged over the day of comparison: the MOCAGE free run and the assimilated product are averaged within an hourly time resolution on a horizontal grid corresponding to that of the assimilation domain MEDI02. As for the free run and the assimilated fields, MODIS observations from AQUA and TERRA corresponding to the whole day of comparison are averaged on the grid of the model. In this figure, we also show the tracks of all CALIOP orbits performed during each day of comparison. It shows that the MB region is sounded every day by two to three descendant and ascendant orbits.
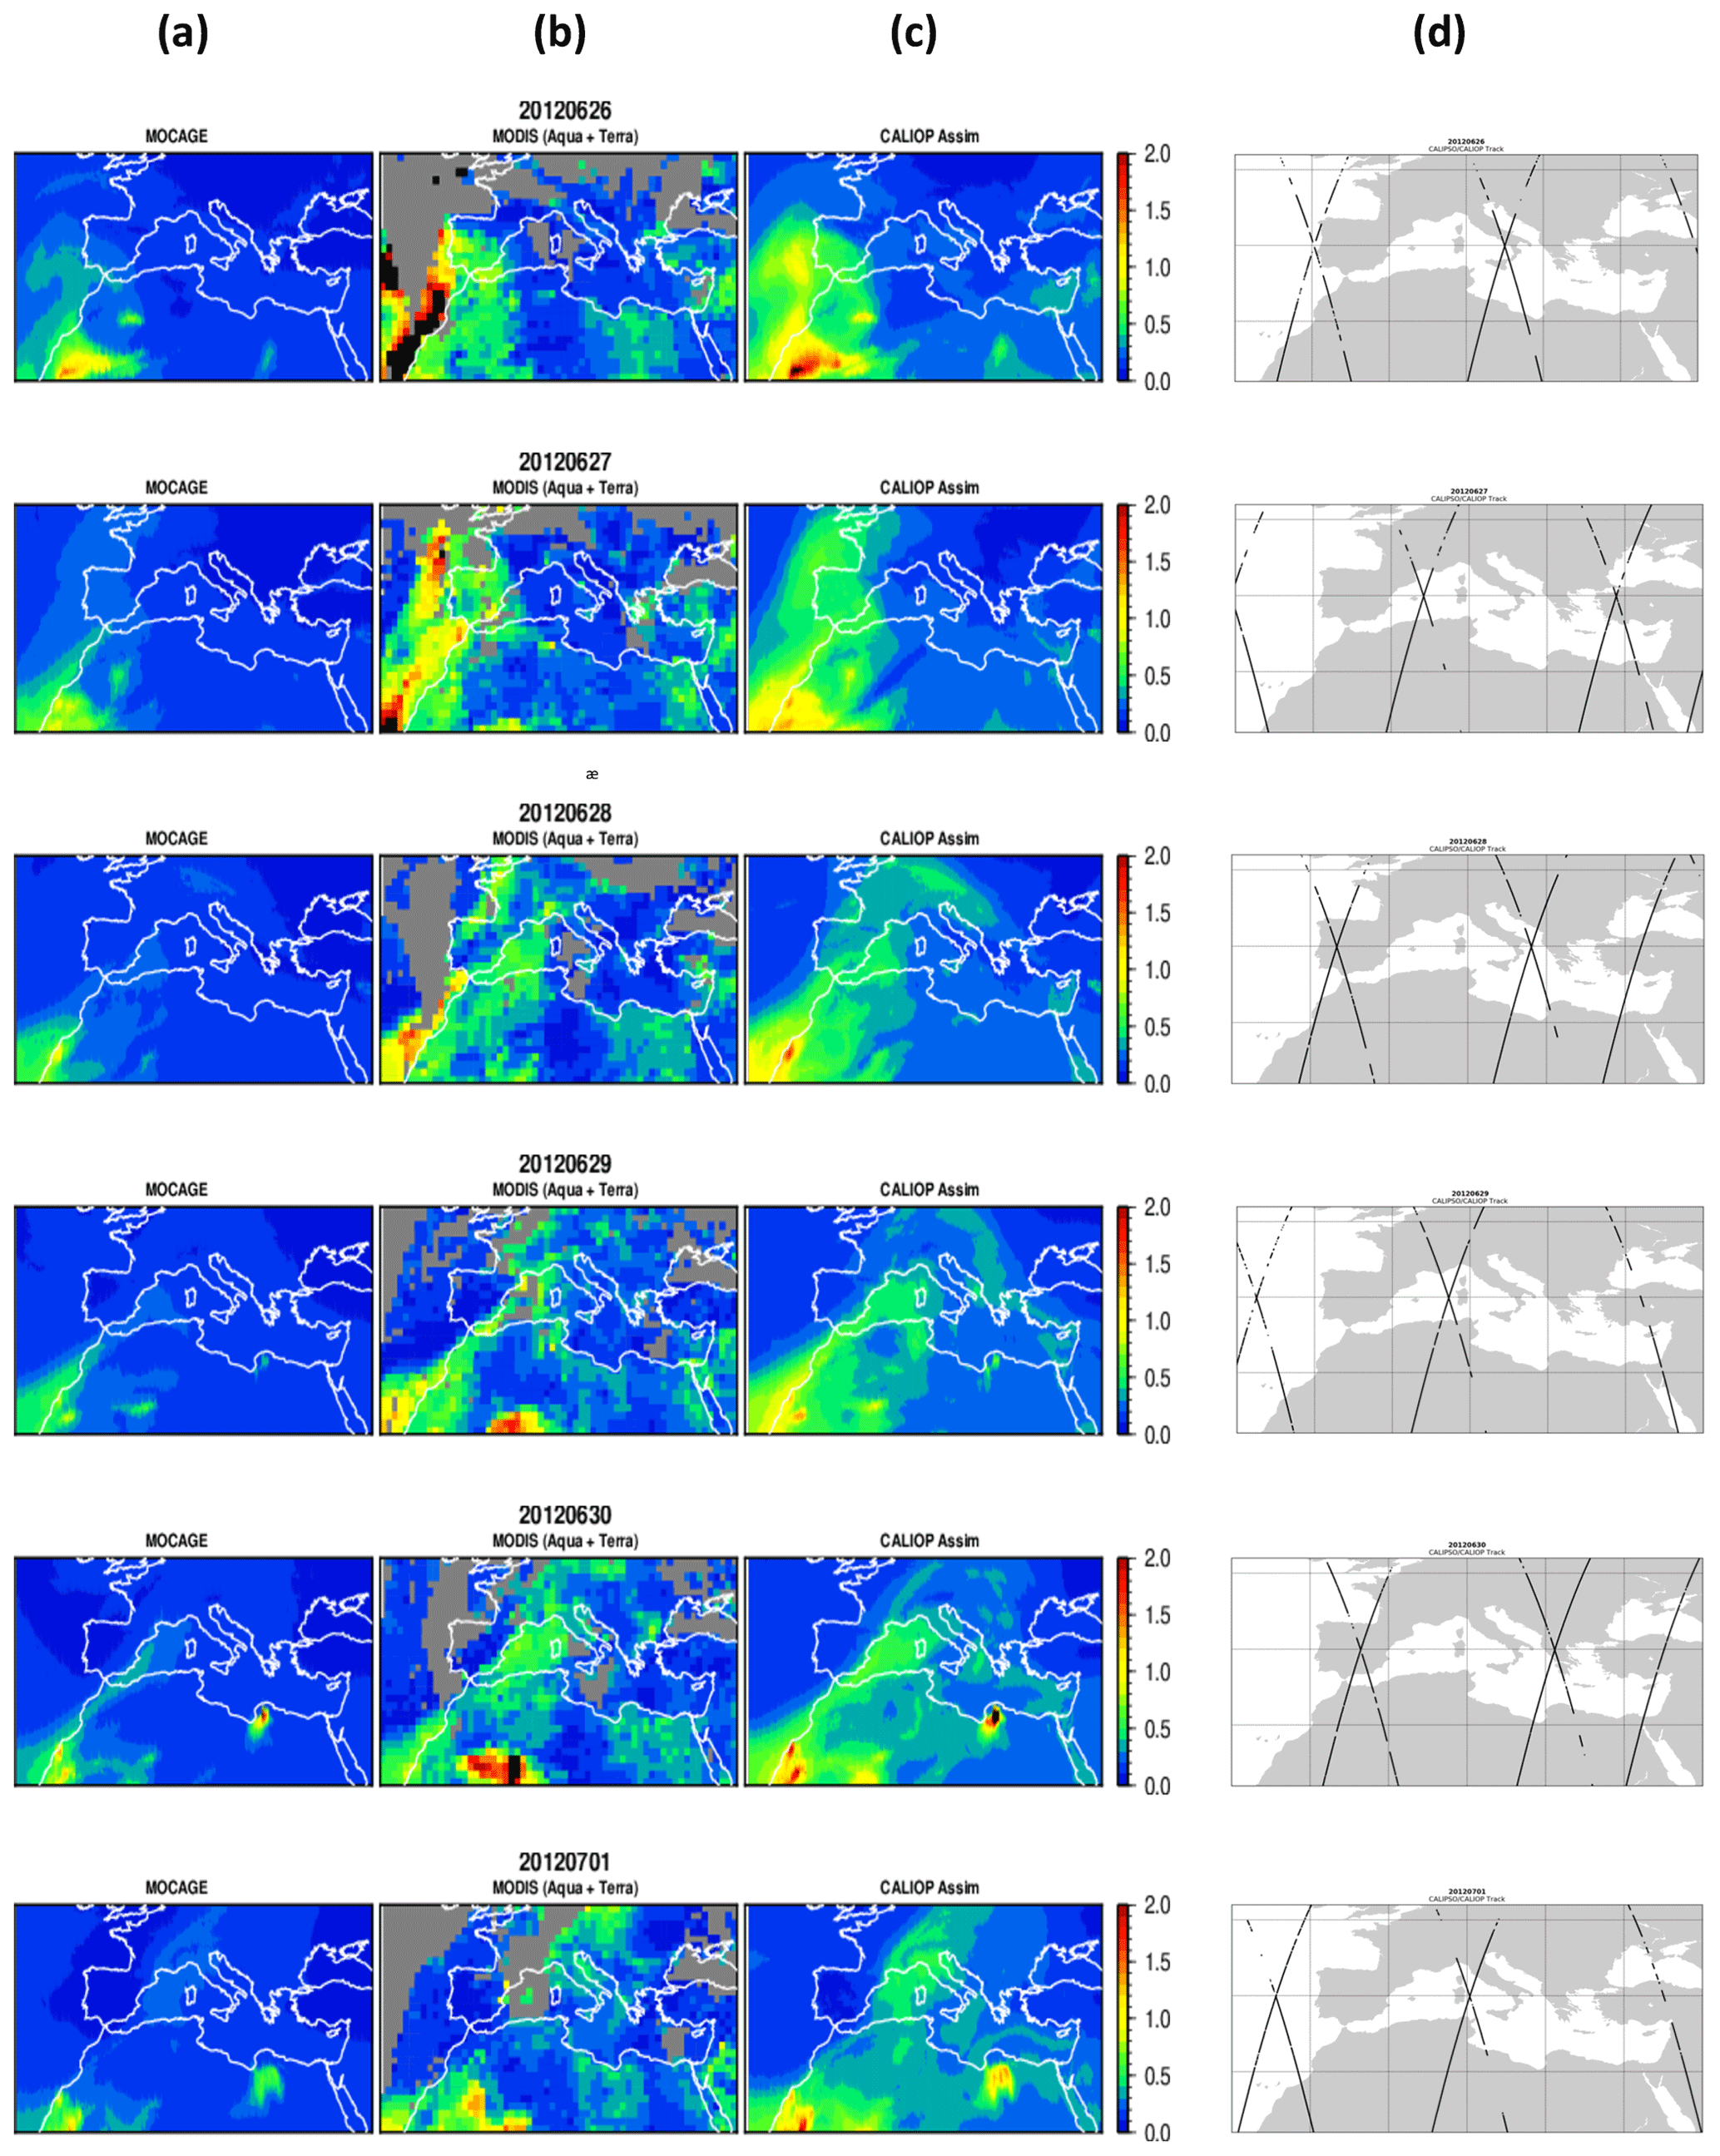
Figure 2Comparison of aerosol optical depth obtained by both the MOCAGE free-run model (a) and the CALIOP assimilation (c) to the MODIS product from both Aqua and Terra for specific days (b) between 26 June and 1 July 2012 (from up to bottom). Figures in (d) show the tracks of all CALIOP orbits performed during each day of comparison.
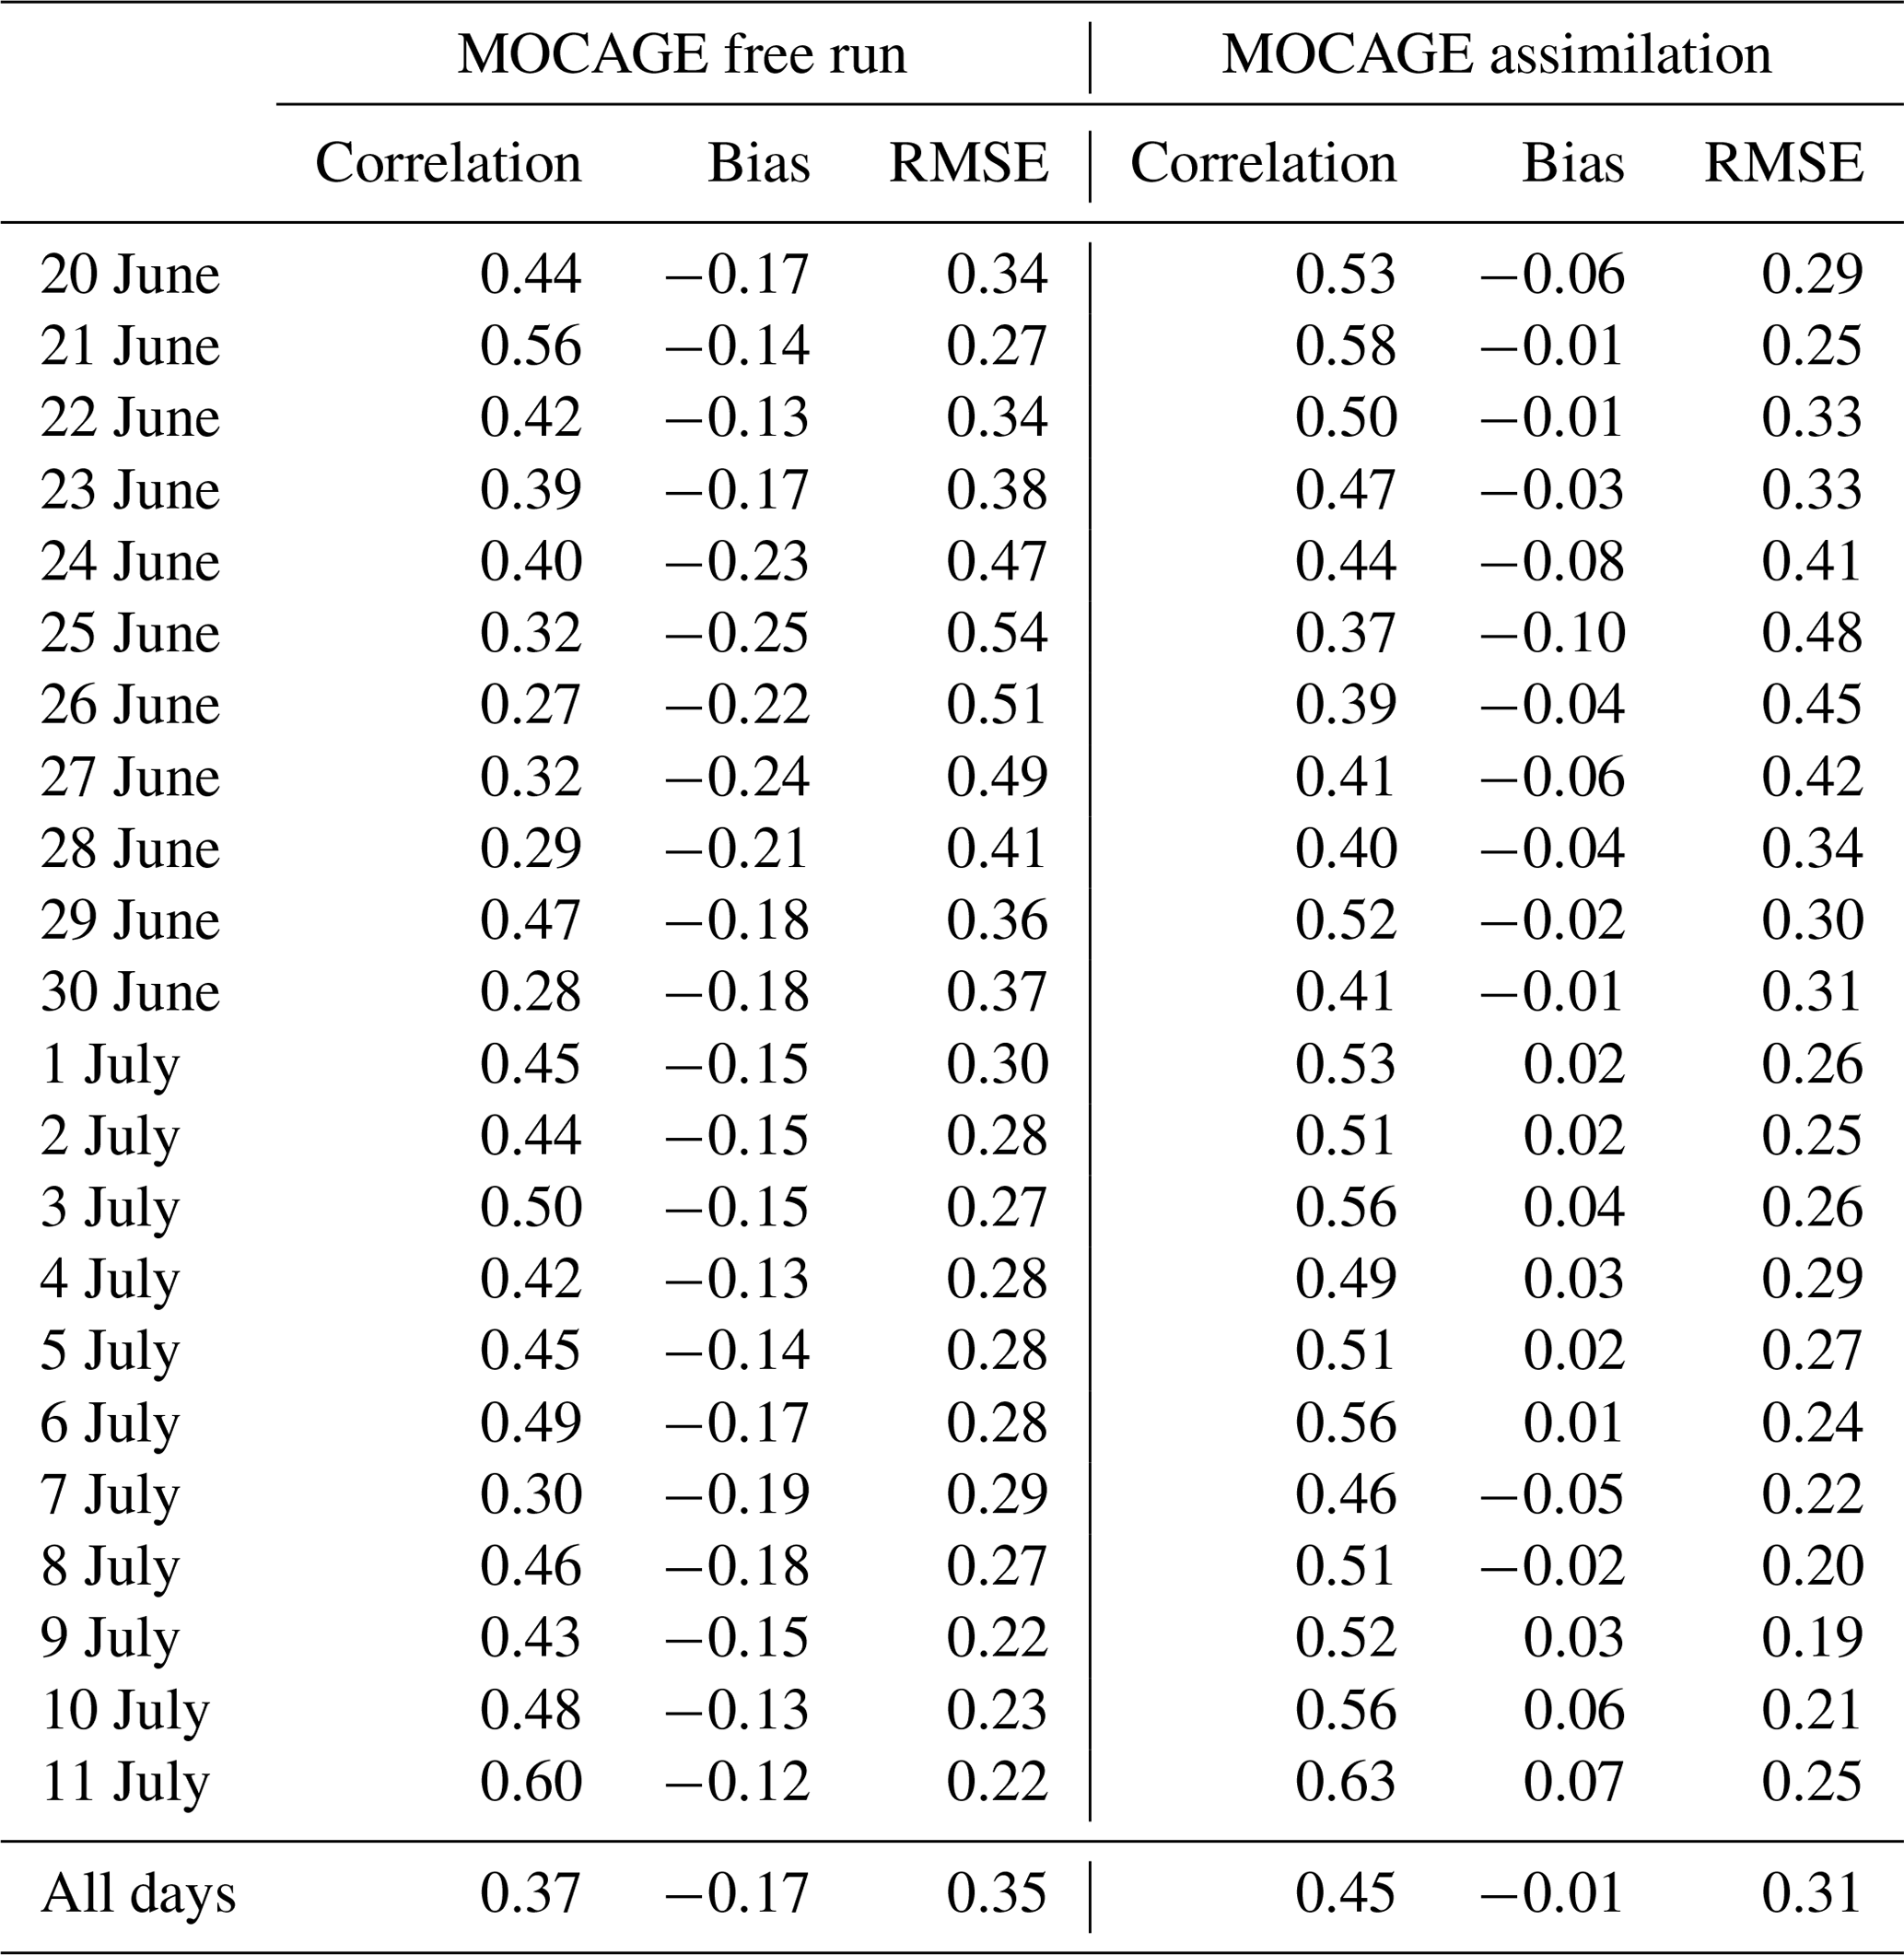
Table 2 shows the statistics of such a comparison for all the days of the study. It shows the correlation, the bias and the RMSE between MODIS and the model free run on the one hand and between MODIS and the assimilated product on the other hand. For all the comparison days, the statistics of the assimilated product are significantly improved compared to the free-run field. For example, during the dust outbreak event of 29 June 2012, the correlation is improved from 0.47 to 0.52, whereas the bias (RMSE) is reduced from −0.18 (0.36) to −0.02 (0.30) for MODIS versus the direct free run and MODIS versus the assimilated field, respectively.
Table 2Statistics (correlation, bias and RMSE) between MODIS observations and MOCAGE free run/assimilation during the TRAQA campaign between 20 June and 11 July 2012.
In Fig. 2, we note that during 26 June 2012 the event is located between north-western Africa covering Morocco and almost all of Spain and Portugal, with a maximum of MODIS AOD values ranging between 0.5 and 1.2 over the Atlantic Ocean. During 27 June, the desert dust transport event moved north with a complete coverage of Spain and part of France, with AOD values ranging from 0.4 to 0.8. During 28 June, the event moved to the east toward Corsica with AOD values of about 0.5 recorded in the western part of the MB and part of central Europe. During 29 and 30 June, the desert dust air mass covered a large part of the western Mediterranean with high AOD values exceeding 0.7 over Corsica and the Italian coasts. This period corresponds to the in situ measurements performed during the TRAQA campaign (see Sect. 4.4 for more details). Starting from 1 July 2012, we generally note that the event weakens progressively despite the fact that high AOD values still persist over Corsica. Note also that for all the days of comparison, AOD values from the free model run show a systematic underestimation of the desert dust amplitude. The assimilation of the lidar observations from the CALIOP instrument clearly improves the model field.
Many previous studies have highlighted the existence of biases between the CALIOP and MODIS observations (e.g. Kittaka et al., 2011; Redemann et al., 2012; Shikwambana and Sivakumar, 2018). The comparison between both datasets shows that MODIS AOD is generally higher than CALIOP-derived AOD (Oo and Holz, 2011). Ma et al. (2013) reported that the largest differences between CALIPSO and MODIS occurs during the active dust seasons over the major dust regions. Nevertheless, in our study the agreement between the AOD assimilated outputs and those resulting from the independent MODIS observations is relatively good in terms of both quality and quantity. This shows that the assimilation of lidar observations has reduced the bias between MOCAGE and MODIS data.
4.3 Comparison to AERONET observations
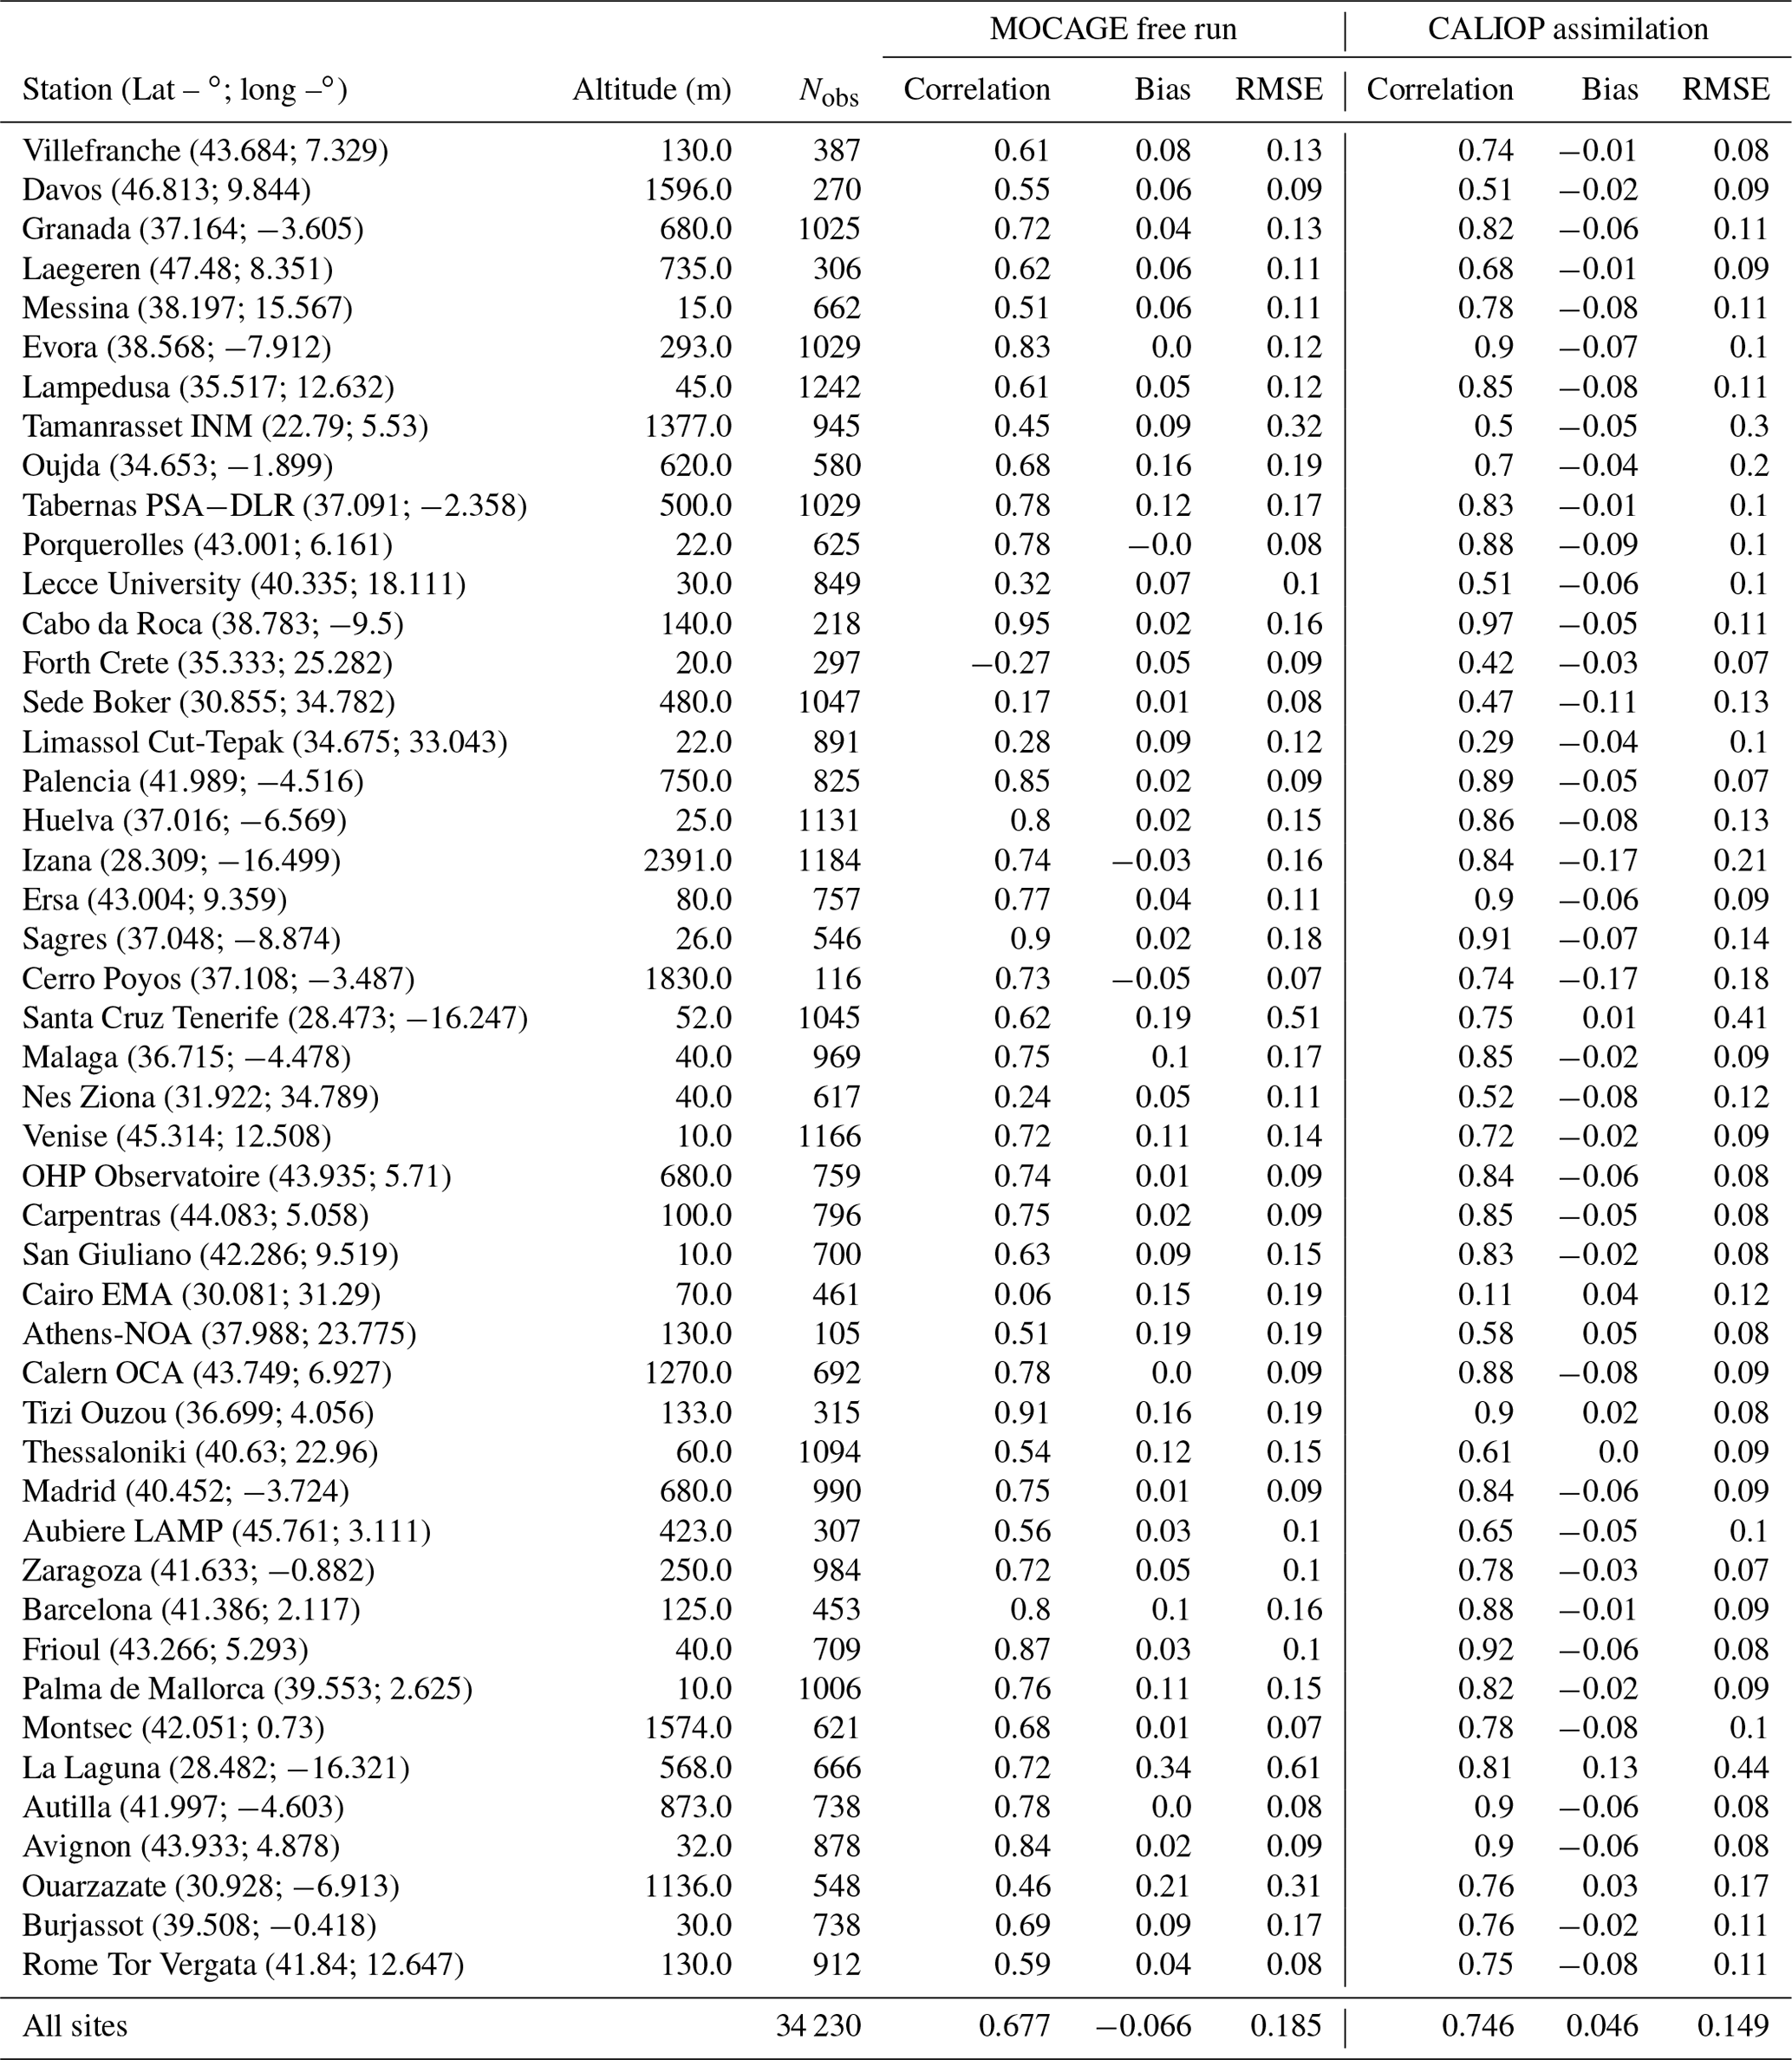
In this section, we exploit the AOD in situ observations from AERONET to quantify the added value of the CALIOP assimilated field in comparison to the model free run. We therefore use all available AERONET AOD L2 data collected during the period of study from different stations located within the assimilation domain. Figure 3 shows the location as well as the number of AOD observations for each measurement station used for the comparison during the considered period (from 20 June to 11 July 2012). In total, we consider measurements from 47 AERONET stations which are located in the domain of study. Most of the stations have a number of measurements greater than 300 (only 4 of the 47 used stations have a number of measurements less than 300 over the whole period of comparison). Moreover, the stations have been chosen to be representative of the whole domain. Modelled and assimilated fields available in each hour are interpolated into the AERONET time measurements. Moreover, in order to make the AOD wavelengths of different stations consistent with those of the model, we interpolate the AERONET data in a logarithmic scale at 550 nm by using all available neighbouring wavelengths (440, 500, 675 and 870 nm).

Figure 3Map of the AERONET stations used for the validation of CALIOP assimilation. The colour code presents the number of observations in each station used within the whole period of study.
Figure 4 shows AOD time series for selected stations illustrating the time evolution of the model free run and the CALIOP assimilated fields in terms of AOD compared to the AERONET measurements between 20 June and 11 July 2012.

Figure 4Time series of AOD at 550 nm of the AERONET data (black), the free-run model (blue) and the CALIOP assimilation (red) from 20 June to 11 July 2012 for specific AERONET stations. The name as well as the coordinates (longitude and latitude) of the specified station are marked at the top of each panel. Correlation, bias and root mean square error for both the direct model and the assimilation run as compared to the AERONET data are given in Table 3.
The stations located in the western part of the MB and Spain are marked by a dust episode of relatively high amplitude illustrated by high AOD values (around 27 June). The stations in Spain recorded the event earlier than the stations in France, where it happened a few days later. This event is clearly highlighted by high AOD values. The localisation as well as the duration of this event are well represented by both the model free run and the CALIOP analyses over all the stations of comparison. Nevertheless, the AOD values from the free model run are underestimated over all the stations compared to AERONET measurements. The assimilated field corrects this underestimation regarding the AOD amplitude since the agreement between CALIOP analyses and AERONET data is better than that of the free-run model. Table 3 presents correlation coefficient, bias and RMSE between AERONET data and the model free run on the one hand and between AERONET and the assimilated field on the other hand over all the stations presented in Fig. 3. Generally, the AOD derived from CALIOP analyses presents better statistics than the model free run compared to the AERONET data over all the stations. The comparison between AERONET data and the model output and between the AERONET data and the assimilated product is presented in Fig. 5. This figure confirms again the overall conclusion about the improvement of the assimilation compared to the model free run. The improvement of the CALIOP assimilated field compared to the model free run is evidenced by the correlation that increases, whereas the bias and the RMSE are reduced. The correlation between AERONET observations and the model output (CALIOP assimilation) is 0.682 (0.753), whereas the bias is −0.063 (0.043) and the RMSE is 0.183 (0.148). Nevertheless, we note that the AODs from both the free model run and the assimilated field are overestimated for low AOD values (lower than 0.1). This is likely due to the observations from the stations located at high altitude, in agreement with previous studies reporting that AOD values at high-elevation locations tend to be smaller compared to low-elevation locations (e.g. Toledano et al., 2018; Wang et al., 2019).
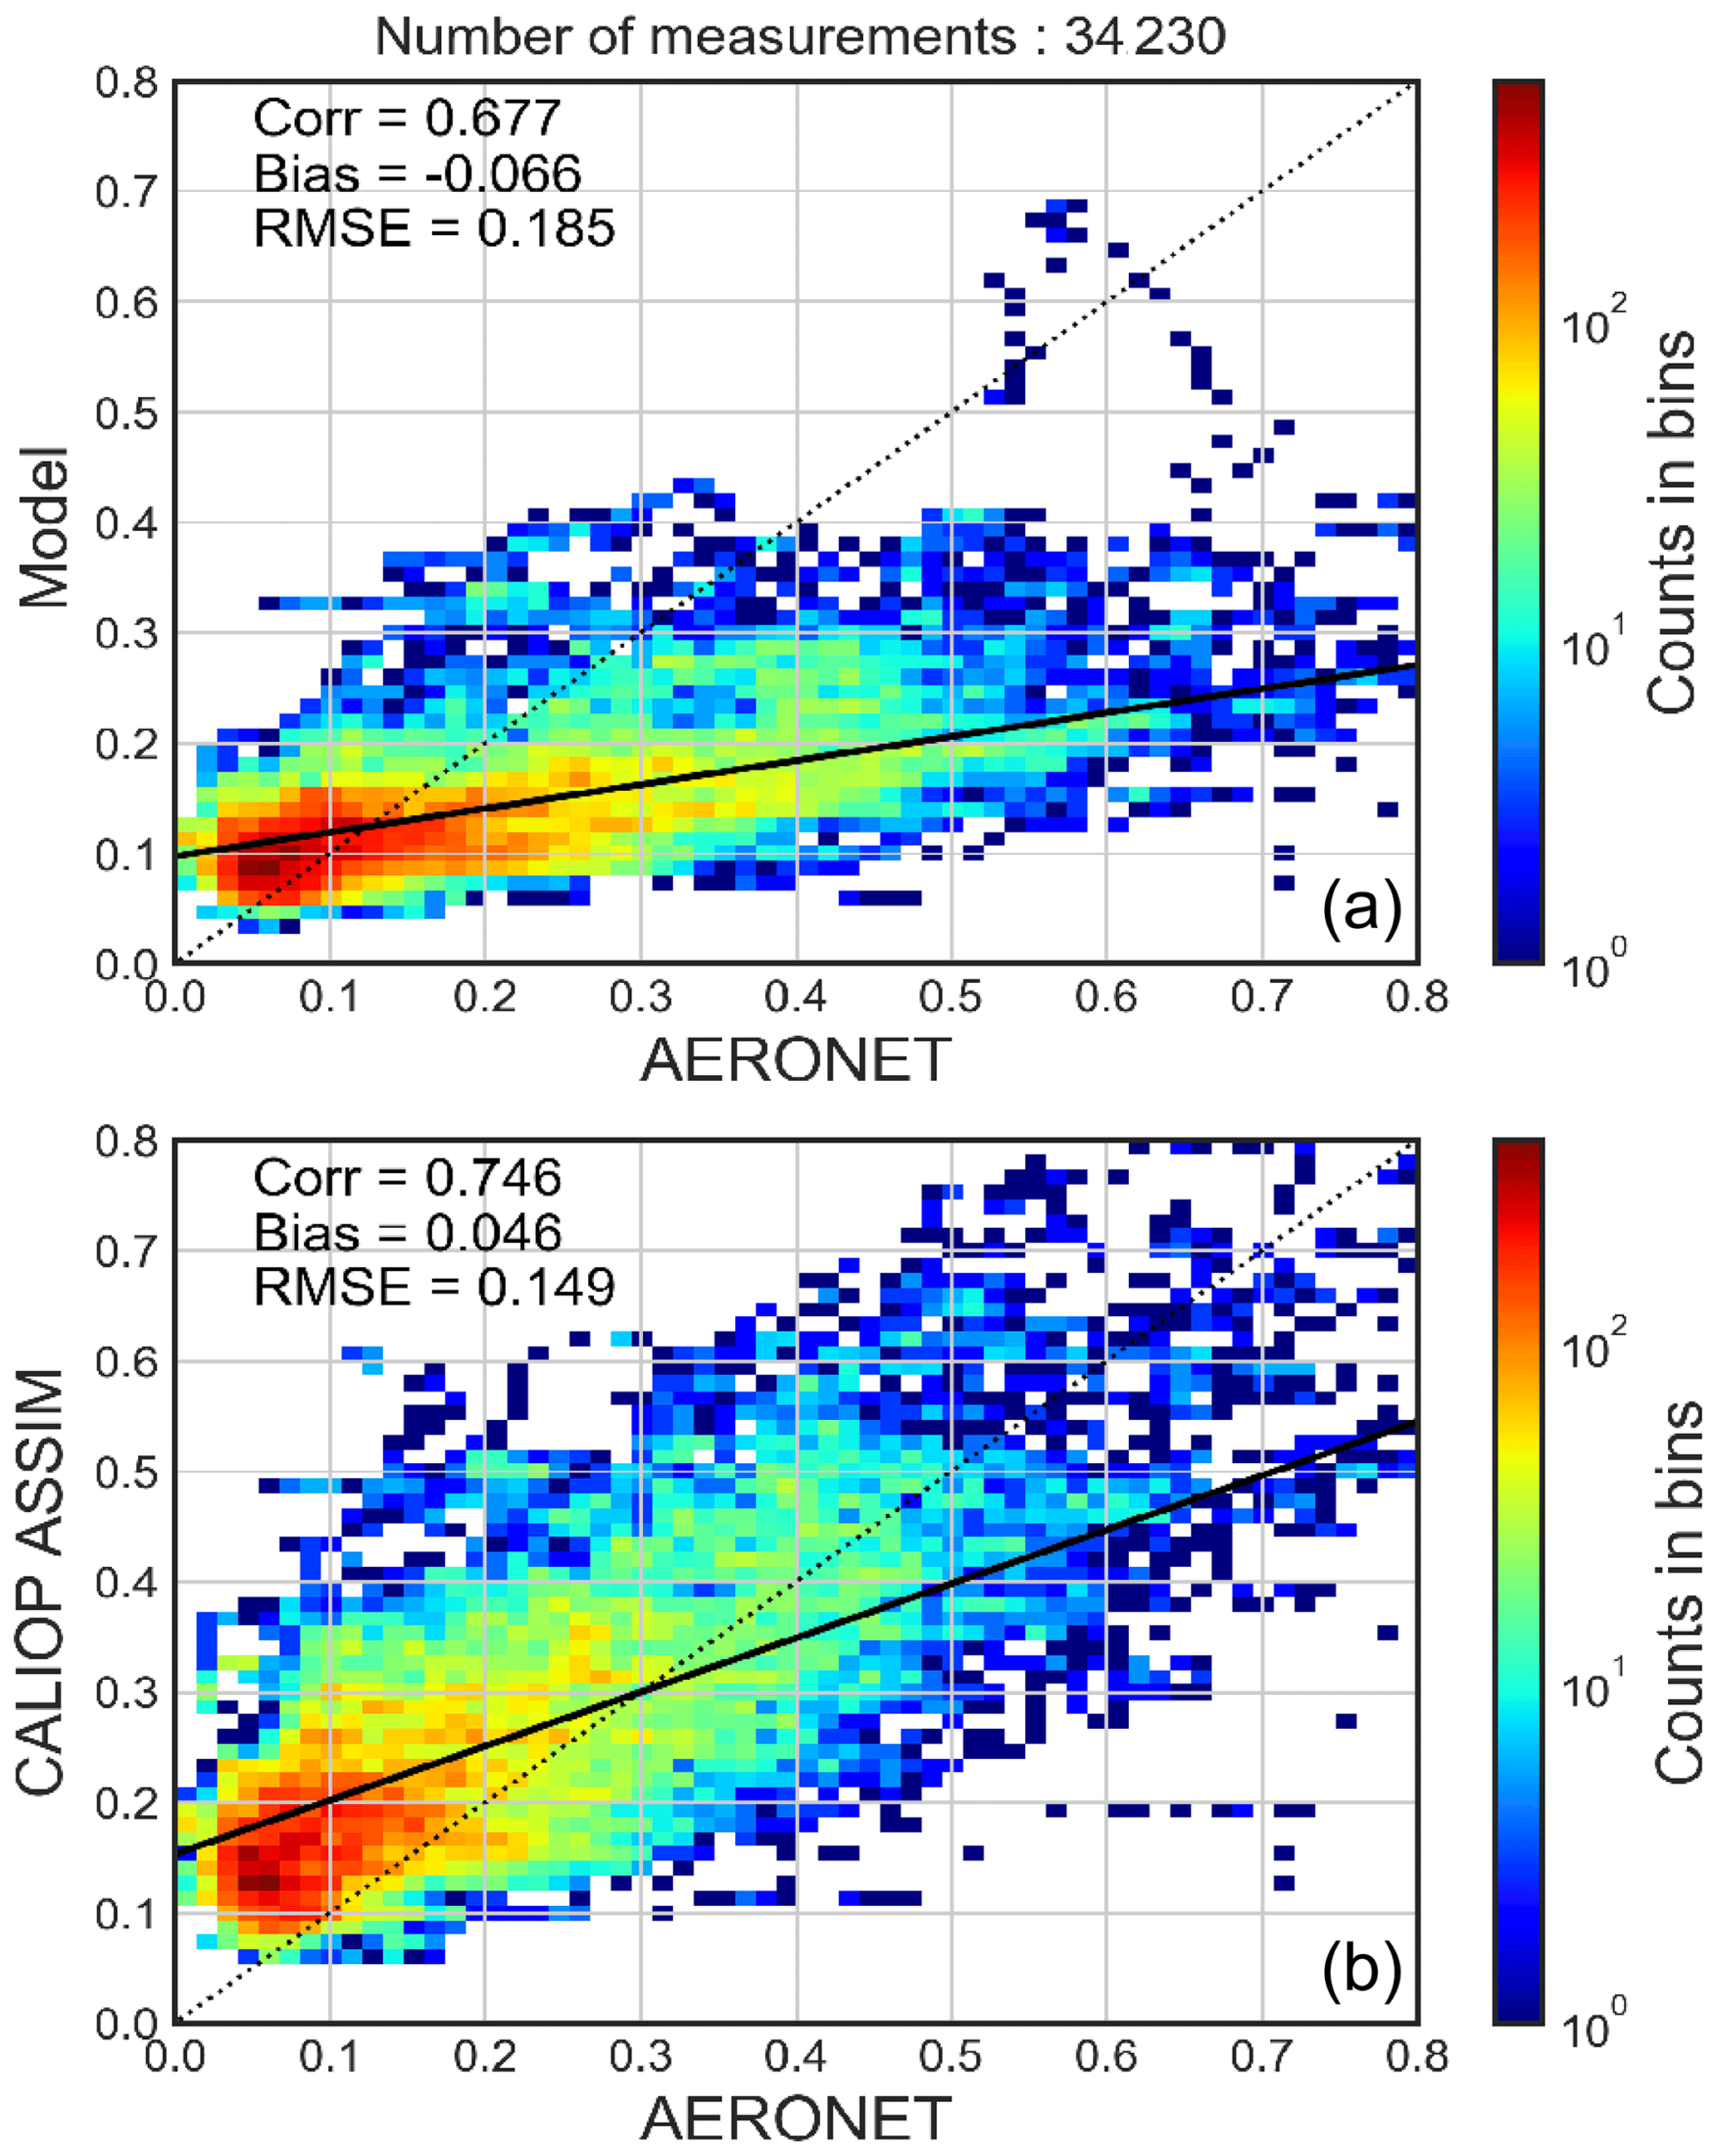
Figure 5Scatter plots of AOD where colours represent the number of counts between the independent observations of AERONET and the two simulations: the direct free model run (a) and the CALIOP assimilation (b). Correlation, bias and root mean square error are noted in each panel. The presented data correspond to the period of comparison from 20 June until 11 July 2012 and cover all the AERONET stations presented in Fig. 4.
Table 3Correlation, bias and RMSE between AERONET observations and MOCAGE free/assimilation runs.
4.4 Comparison with the aircraft in situ measurements
In this section, we evaluate in detail the performance of the CALIOP lidar assimilated field by comparing the results of assimilation and the MOCAGE model with the aerosol concentrations from in situ measurements onboard the instrumented aircraft. We therefore use measurements of the PCASP instrument that embarked onboard the ATR-42 aircraft to measure the total concentration for particle diameters above 100 nm. Figure 6 shows the results of the total aerosol number concentration corresponding to the most representative flights which highlight the desert dust outbreak event over the MB already presented in Fig. 2: flight A on 29 June 2012 from Toulouse to Corsica (Fig. 6a) and flight B on the same day from Corsica to Toulouse (Fig. 6b). Figure 6(1) shows the time evolution of the aerosol number concentration over the flight period. Figure 6(2) presents the aircraft altitude over the time flight from the departure to arrival airports. In Fig. 6(3), we present the map of the total AOD averaged over the flight period superimposed by the aircraft track with the departure (D) and arrival (A) points for each flight. Figure 6(4) is the same as Fig. 6(3) but for the mean value of the desert dust AOD over the flight period instead of the total AOD (obtained from all types of aerosols within the MOCAGE model).
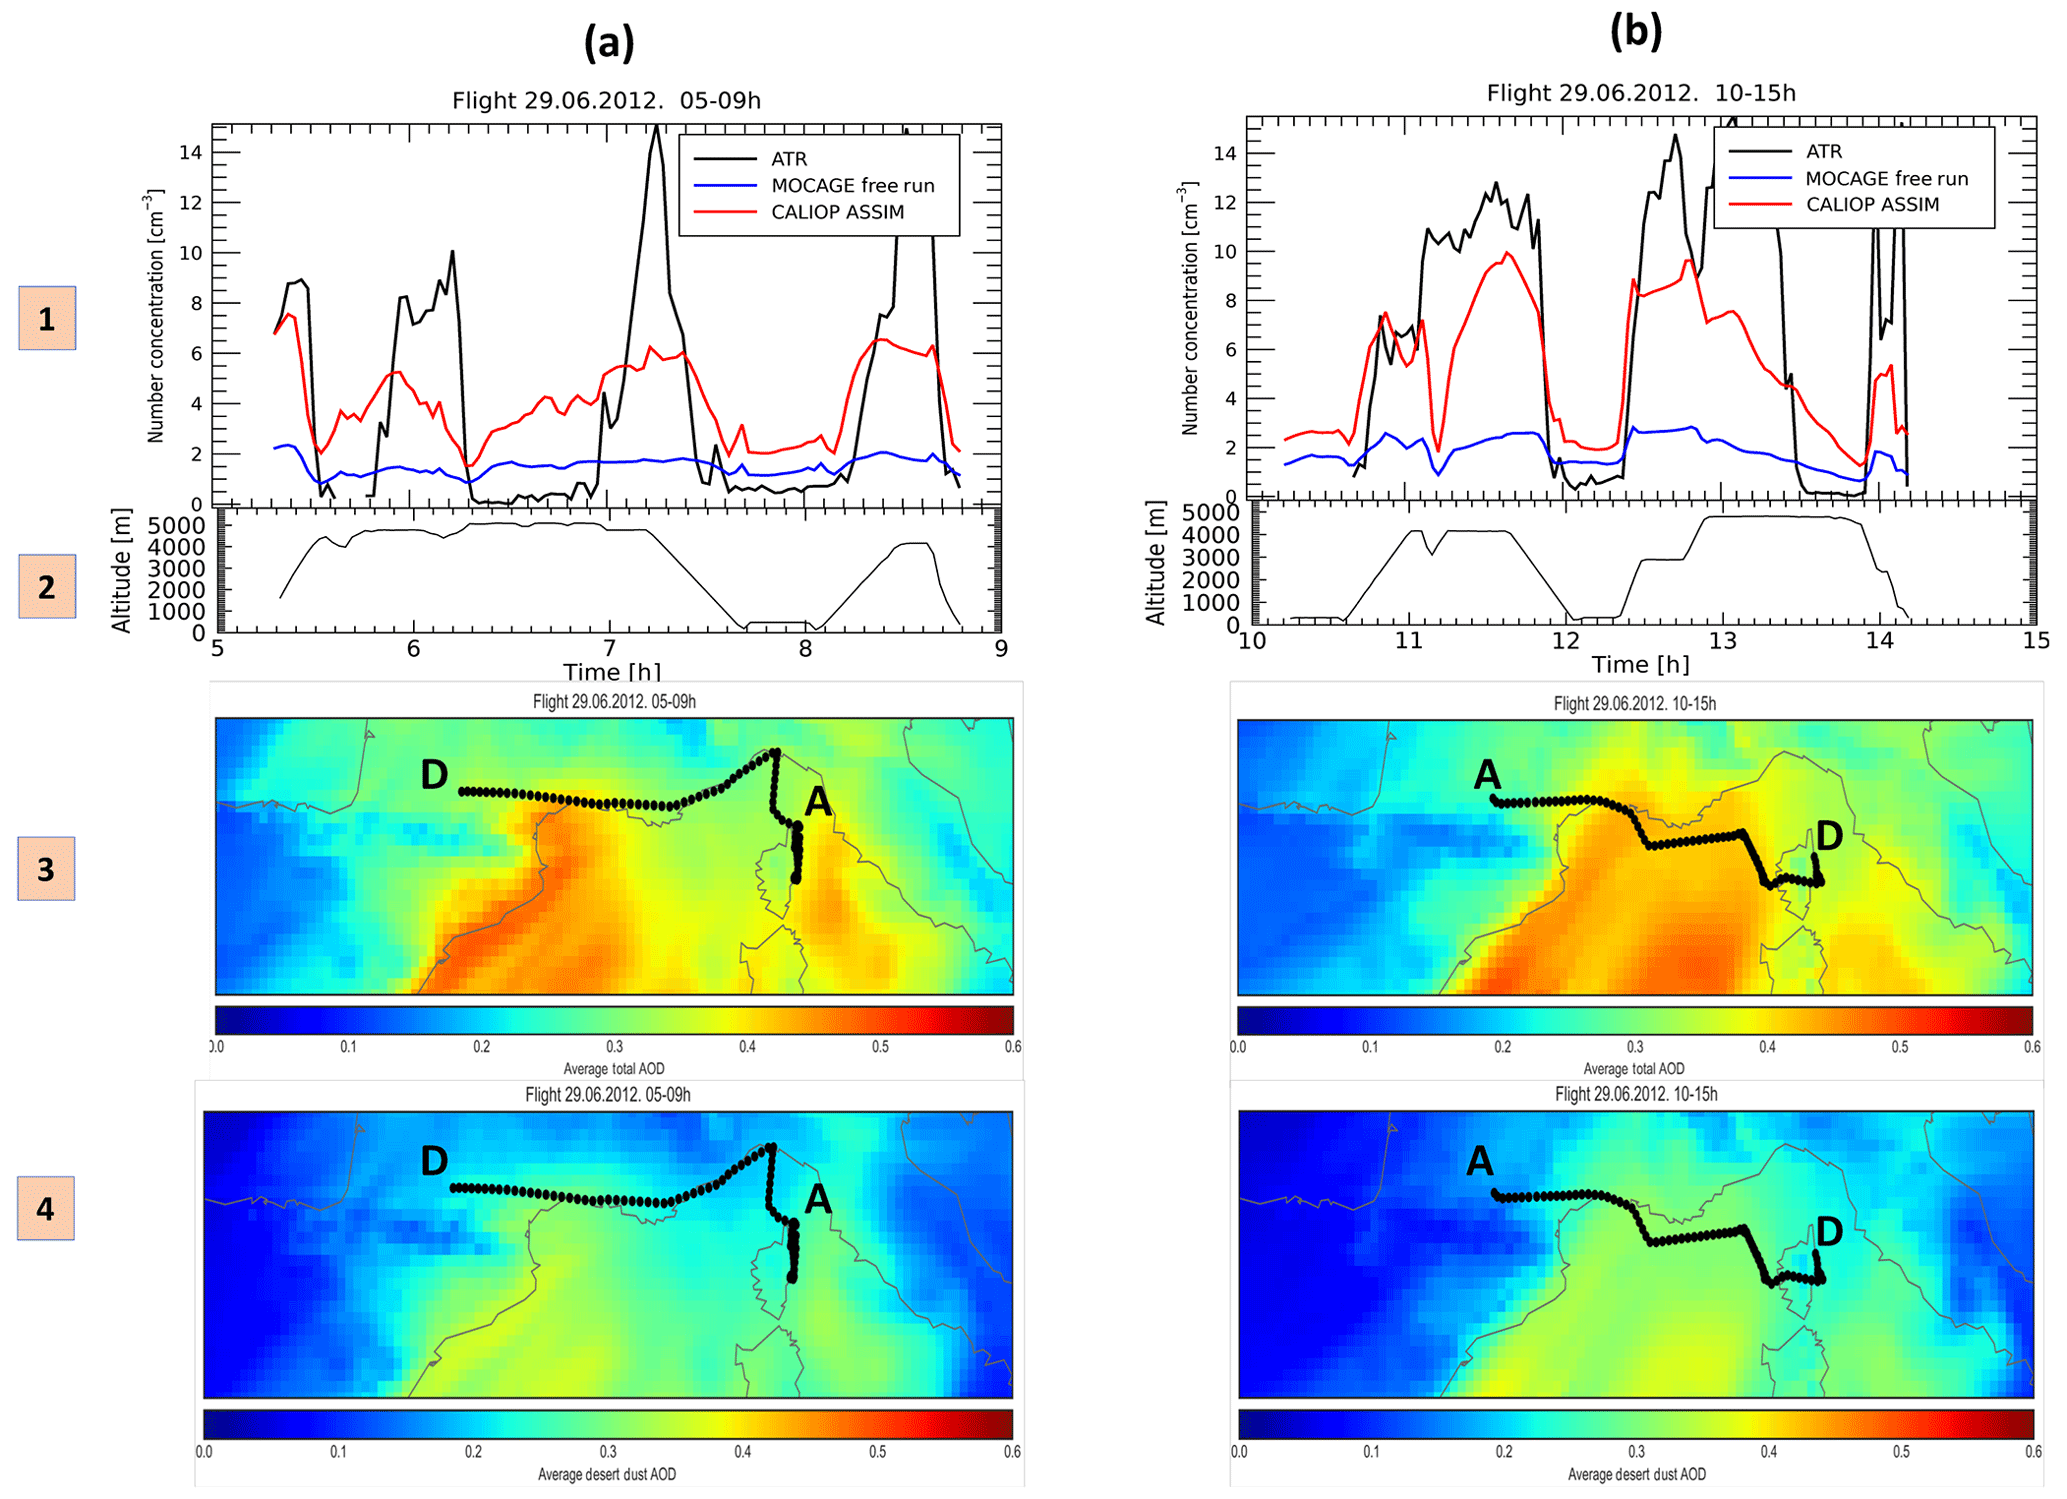
Figure 6(1) Time evolution of aerosol number concentration (in cm−3) measured by the PCASP instrument onboard the ATR aircraft (black) compared with the free model run (blue) and the CALIOP assimilation (red). (2) The aircraft altitude (in km) during its trajectory from the departure to arrival points. (3) The total AOD averaged over the time of flight deduced from the CALIOP assimilation field. The thick black line represents the aircraft trajectory from the departure (D) to the arrival (A). (4) Same as for (3) but for the desert dust aerosol. All these figures are presented for the two different flights: (a) the flight on 29 June 2012 between 05:00 and 09:00 and (b) the flight on 29 June 2012 between 10:00 and 15:00.
Flight A was performed on 29 June from 05:00 to 09:00 UTC from Toulouse to Corsica. This flight coincides with the beginning of the establishment of the desert dust event over southern France with incursions into eastern and north-eastern Spain and the western part of Italy (see Fig. 6a, 3–4). During this flight, three peaks of aerosol number concentrations were well captured by the aircraft, with fairly high values throughout the flight from Toulouse to Corsica (maximum values varying between 8 and 14 cm−3). These peaks were measured at altitudes between 4000 and 5000 m. The contribution of the desert AOD to the total AOD exceeds 60 % (Fig. 6a, 3, and 6a, 4). The MOCAGE free run clearly underestimates the maximum values of these three peaks. However, the CALIOP assimilated field better represents the aerosol concentration peaks compared to the MOCAGE free-run model. The assimilated product improves the field of the model and perfectly reproduces the cycle of variations in aerosol concentrations along flight A.
During flight B (on 29 June between 10:00 and 15:00), the desert dust event is well established, with an air mass of desert dust spreading over the MB from the eastern and north-eastern coasts of Spain to the coasts of Corsica and Italy (Fig. 6b(3) and 6b(4)). The contribution of the desert dust AOD to the total AOD exceeds 80 %. Aircraft measurements show high values in terms of number of aerosol concentrations during the majority of the flight throughout the desert dust air mass, especially when the measurements are above 3000 m. The model free-run fields highly underestimate the aircraft measurements, while the CALIOP assimilation significantly improves this underestimation. They well reproduce aircraft measurements in terms of quantities and temporal variability.
These examples illustrate again the ability of the CALIOP assimilation to improve the model and then to reproduce the aircraft in situ measurements in terms of aerosol concentrations. The assimilation of lidar aerosol data from CALIOP into MOCAGE improves the results by enhancing the aerosol number concentration by about a factor of 2 getting closer to the aircraft measurements. Nevertheless, the minimum values of concentrations, close to zero, are not well reproduced by the MOCAGE model. The general underestimation of MOCAGE and the assimilation compared to the independent aircraft measurements during the TRAQA aircraft campaign is likely due to the horizontal resolution of the MOCAGE CTM (resolution of 0.2∘) and the low number of lidar data around the studied aircraft domain due to the revisit time of CALIPSO. However, this comparison evidenced the added value in the MOCAGE CTM using CALIOP aerosol measurements (see Fig. 2).
4.5 Comparison with LOAC in situ measurements
During the TRAQA campaign, the LOAC flew onboard three balloons, all launched from Martigues (5.05∘ E, 43.40∘ N: near Marseille, France). We focus on the two flights performed on 29 June 2012 within the desert dust plume. The total horizontal extent of the LOAC is quite small (∼15 km). This horizontal distance is smaller than the grid size of our domain of study (∼20 km). Therefore, we assume that the LOAC measurements represent the vertical profile of the aerosol above the launch point. The LOAC two flights are launched at two different hours of the same day, in the morning and at noon, but they flew within the same plume of desert dust (see the AOD maps in Fig. 6). Figure 7 represents the vertical profile of the aerosol number concentration as deduced from the MOCAGE free run and the CALIOP assimilation, both compared to the in situ LOAC measurements of the two flights performed on 29 June 2012. The model free run simulates the shape of the vertical profile well, but for both cases it underestimates the aerosol number concentration by a factor of 2.5 to 5 in the altitude range of 2–5 km. The assimilation of CALIOP lidar data improves this underestimation and shows general good agreement compared to LOAC measurements. The CALIOP lidar data assimilation product is closer to the LOAC measurements than that of the model free run, especially in the altitude range of 1.5–5 km. This altitude range corresponds to the altitude within which the desert dust plume is transported (see Sect. 4.6). CALIOP assimilation better simulates the shape of the profile as well as the aerosol number concentrations than the model free run.
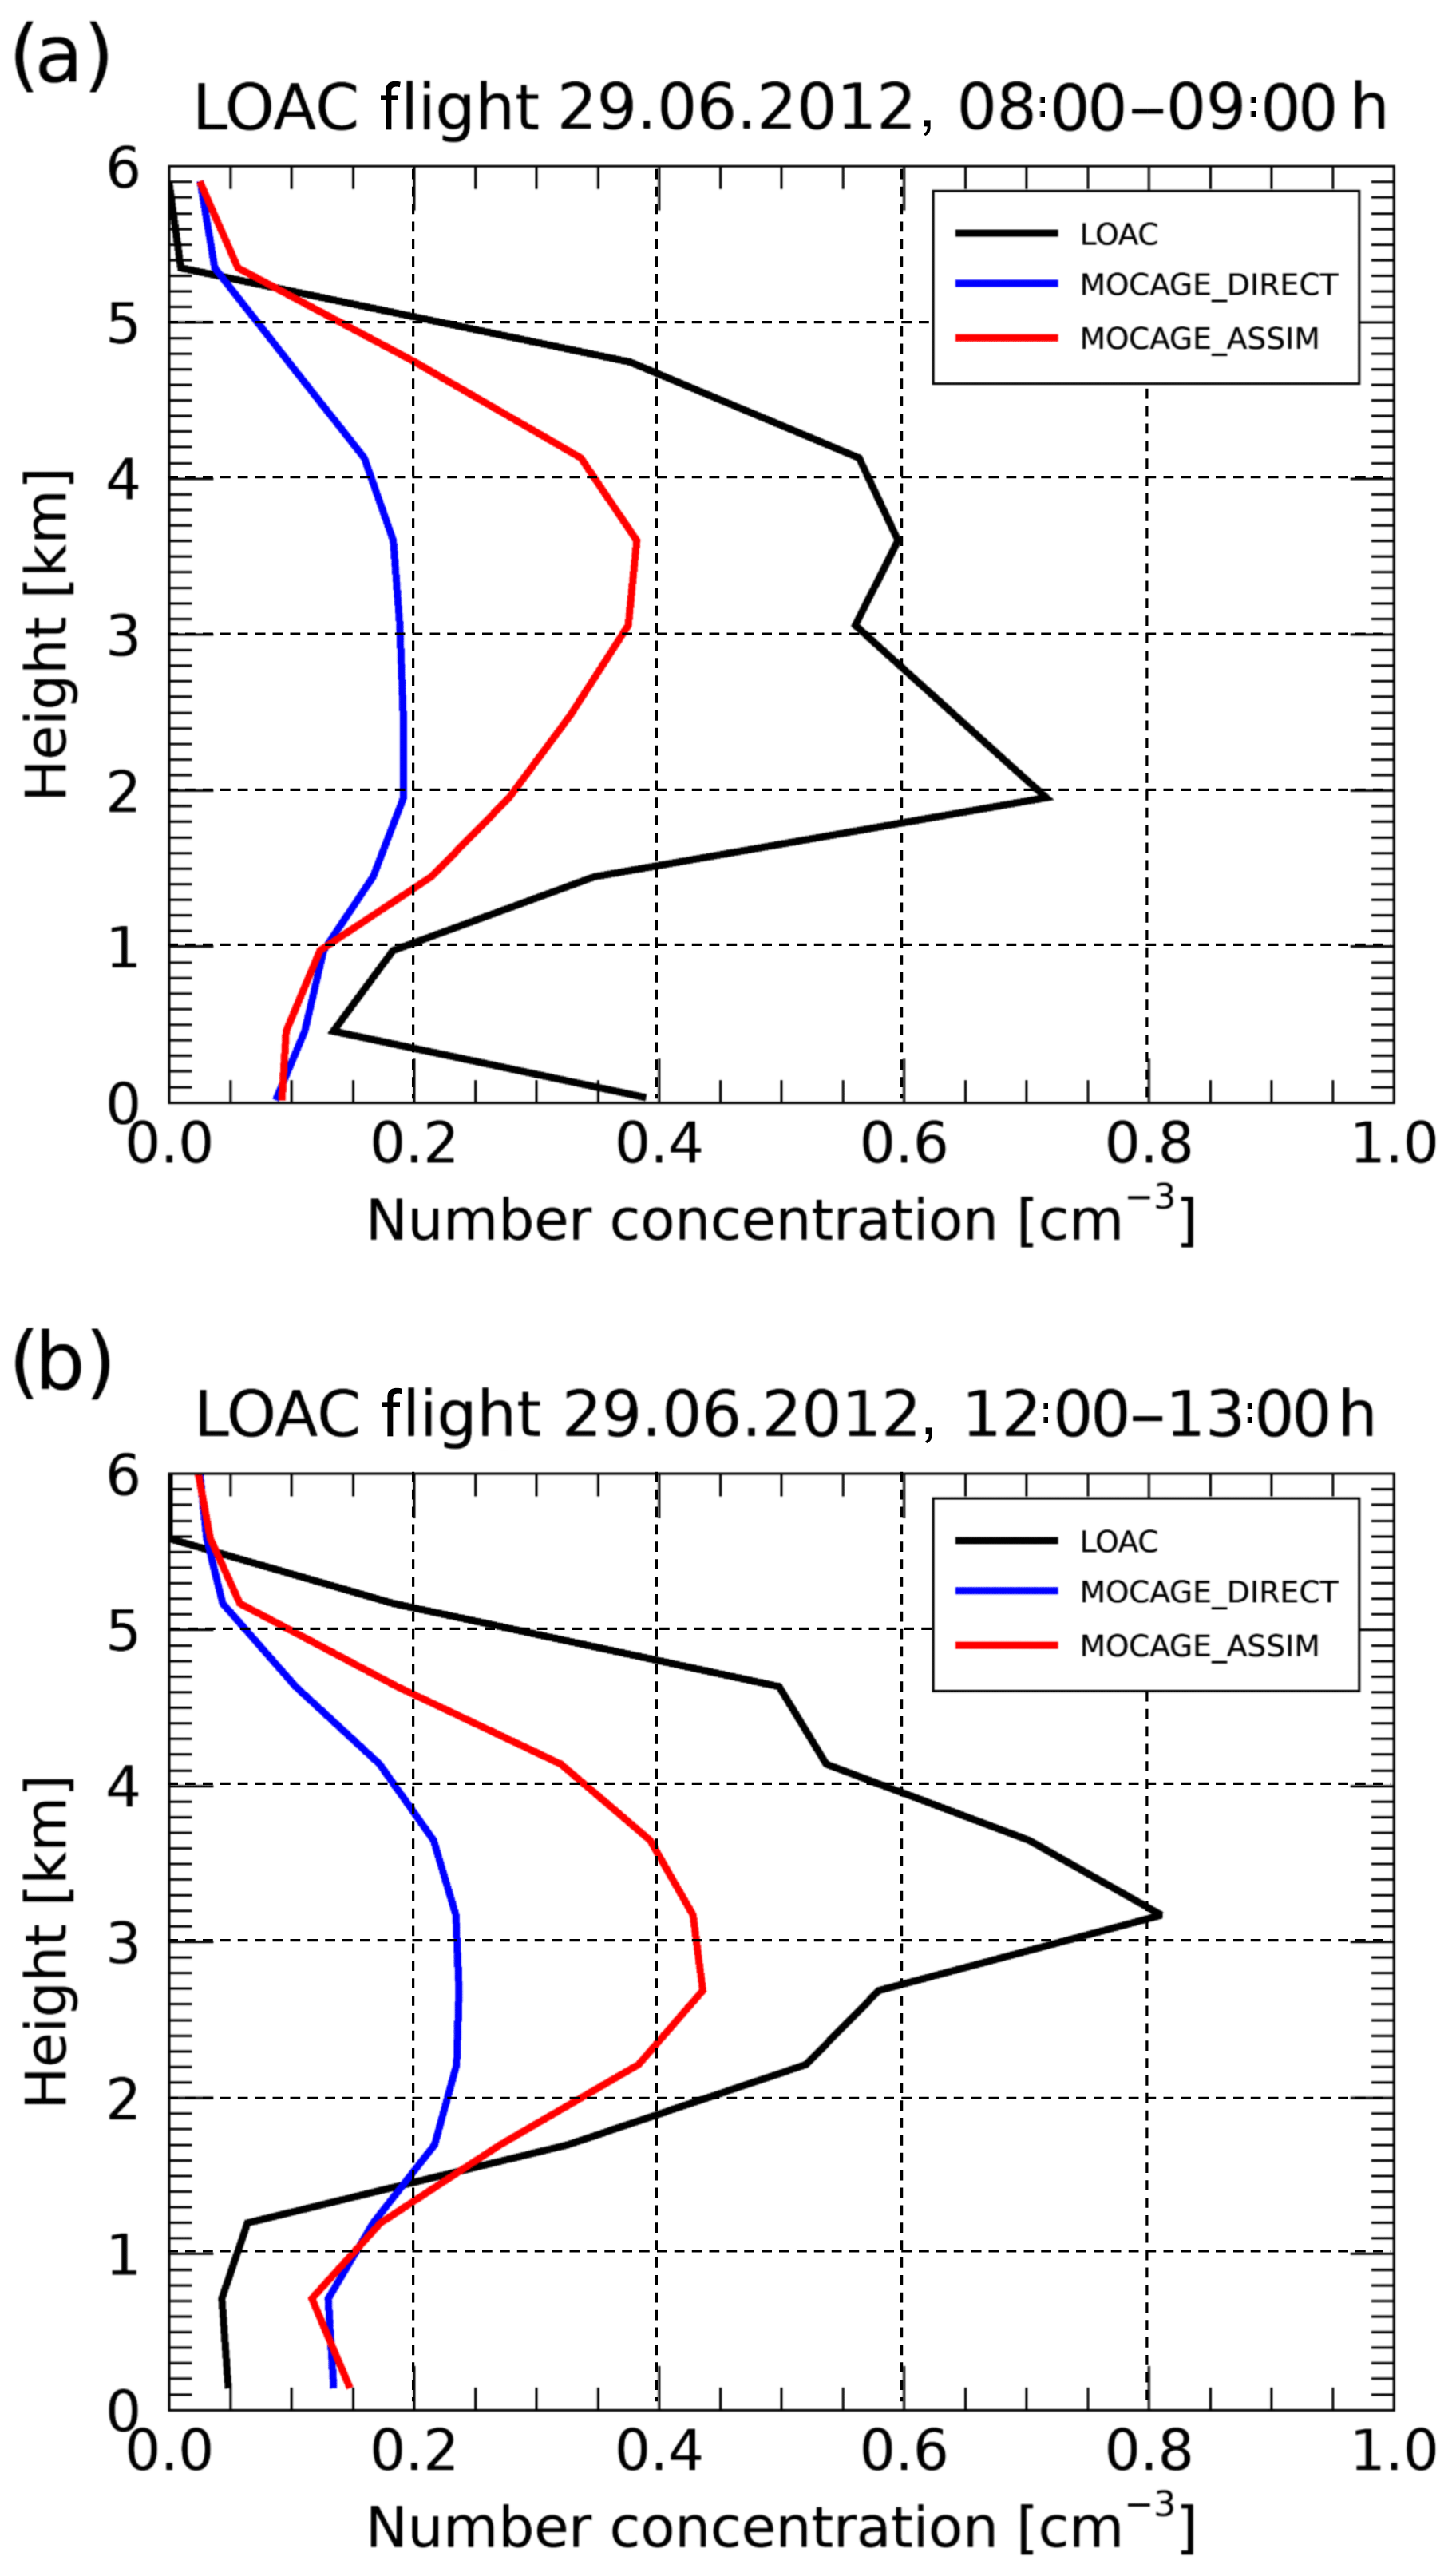
Figure 7Vertical profile of aerosol number concentration in cm−3 obtained by the model free run (blue) and the CALIOP assimilation (red), both compared to the LOAC measurements (black). The comparison is done for two LOAC flights both performed on 29 June 2012: between 08:00 and 09:00 (a) and between 12:00 and 13:00 (b).
The comparison of LOAC profiles to those resulting from the assimilation of AOD and CALIOP lidar extinction coefficient observations (Fig. 9 of Sič et al. (2016) for AOD assimilation and Fig. 7 of this study for CALIOP assimilation) seems to show an underestimation of the field resulting from the assimilation of the extinction coefficient of the CALIOP lidar. An explanation may be due to the fact that both MODIS AOD and LOAC measurements generally show an overestimation of aerosol concentrations compared to independent observations. Indeed, the study conducted by Shikwambana and Sivakumar (2018) highlights the overestimation of MODIS AOD compared to several datasets (e.g. CALIPSO, MERRA-2 and MISR). On the other hand, the validation of LOAC measurements conducted by Renard et al. (2016) shows that the retrieved concentrations of the largest particles could be overestimated by up to 50 % for particles above about 2 µm. Consequently, almost the total concentration of desert aerosols is affected by this overestimation since the majority of desert dust bins are greater than 2 µm (see Table 1).
4.6 Vertical structure of aerosol concentration
In this section, we evaluate the impact of assimilating the observations from the CALIOP instrument on the desert aerosol vertical distribution.
First, we evaluate the capability of both the model free run and the assimilated field to reproduce the CALIOP observations. Figure 8 shows a comparison, in terms of extinction coefficient, of the model free run and the assimilated field to the CALIOP observations. Figure 8a shows a measurement orbit from the CALIOP instrument during 29 June 2012 between 12:45 and 12:52 (black colours). Figure 8b shows the vertical profile of the extinction coefficient (m−1) at the wavelength of 532 nm from the CALIOP instrument corresponding to the measurements presented in Fig. 8a. Figure 8c and d present the vertical profiles of the extinction coefficient deduced from the free model run and the assimilated product, respectively. The CALIOP measurements show high values of the extinction coefficient in the pressure range between 1000 and 500 hPa (0–∼5 km), particularly over the MB (between 12:47 and 12:50). The model extinction coefficient (Fig. 8c) shows relatively low values compared to the CALIOP observations, especially for the measurements over the MB. However, the extinction coefficient deduced from the assimilated product shows very good agreement compared to the CALIOP measurements over all levels of the vertical profiles. This comparison reveals that the assimilated product is closer to what CALIOP is observing compared to the product deduced from the model.
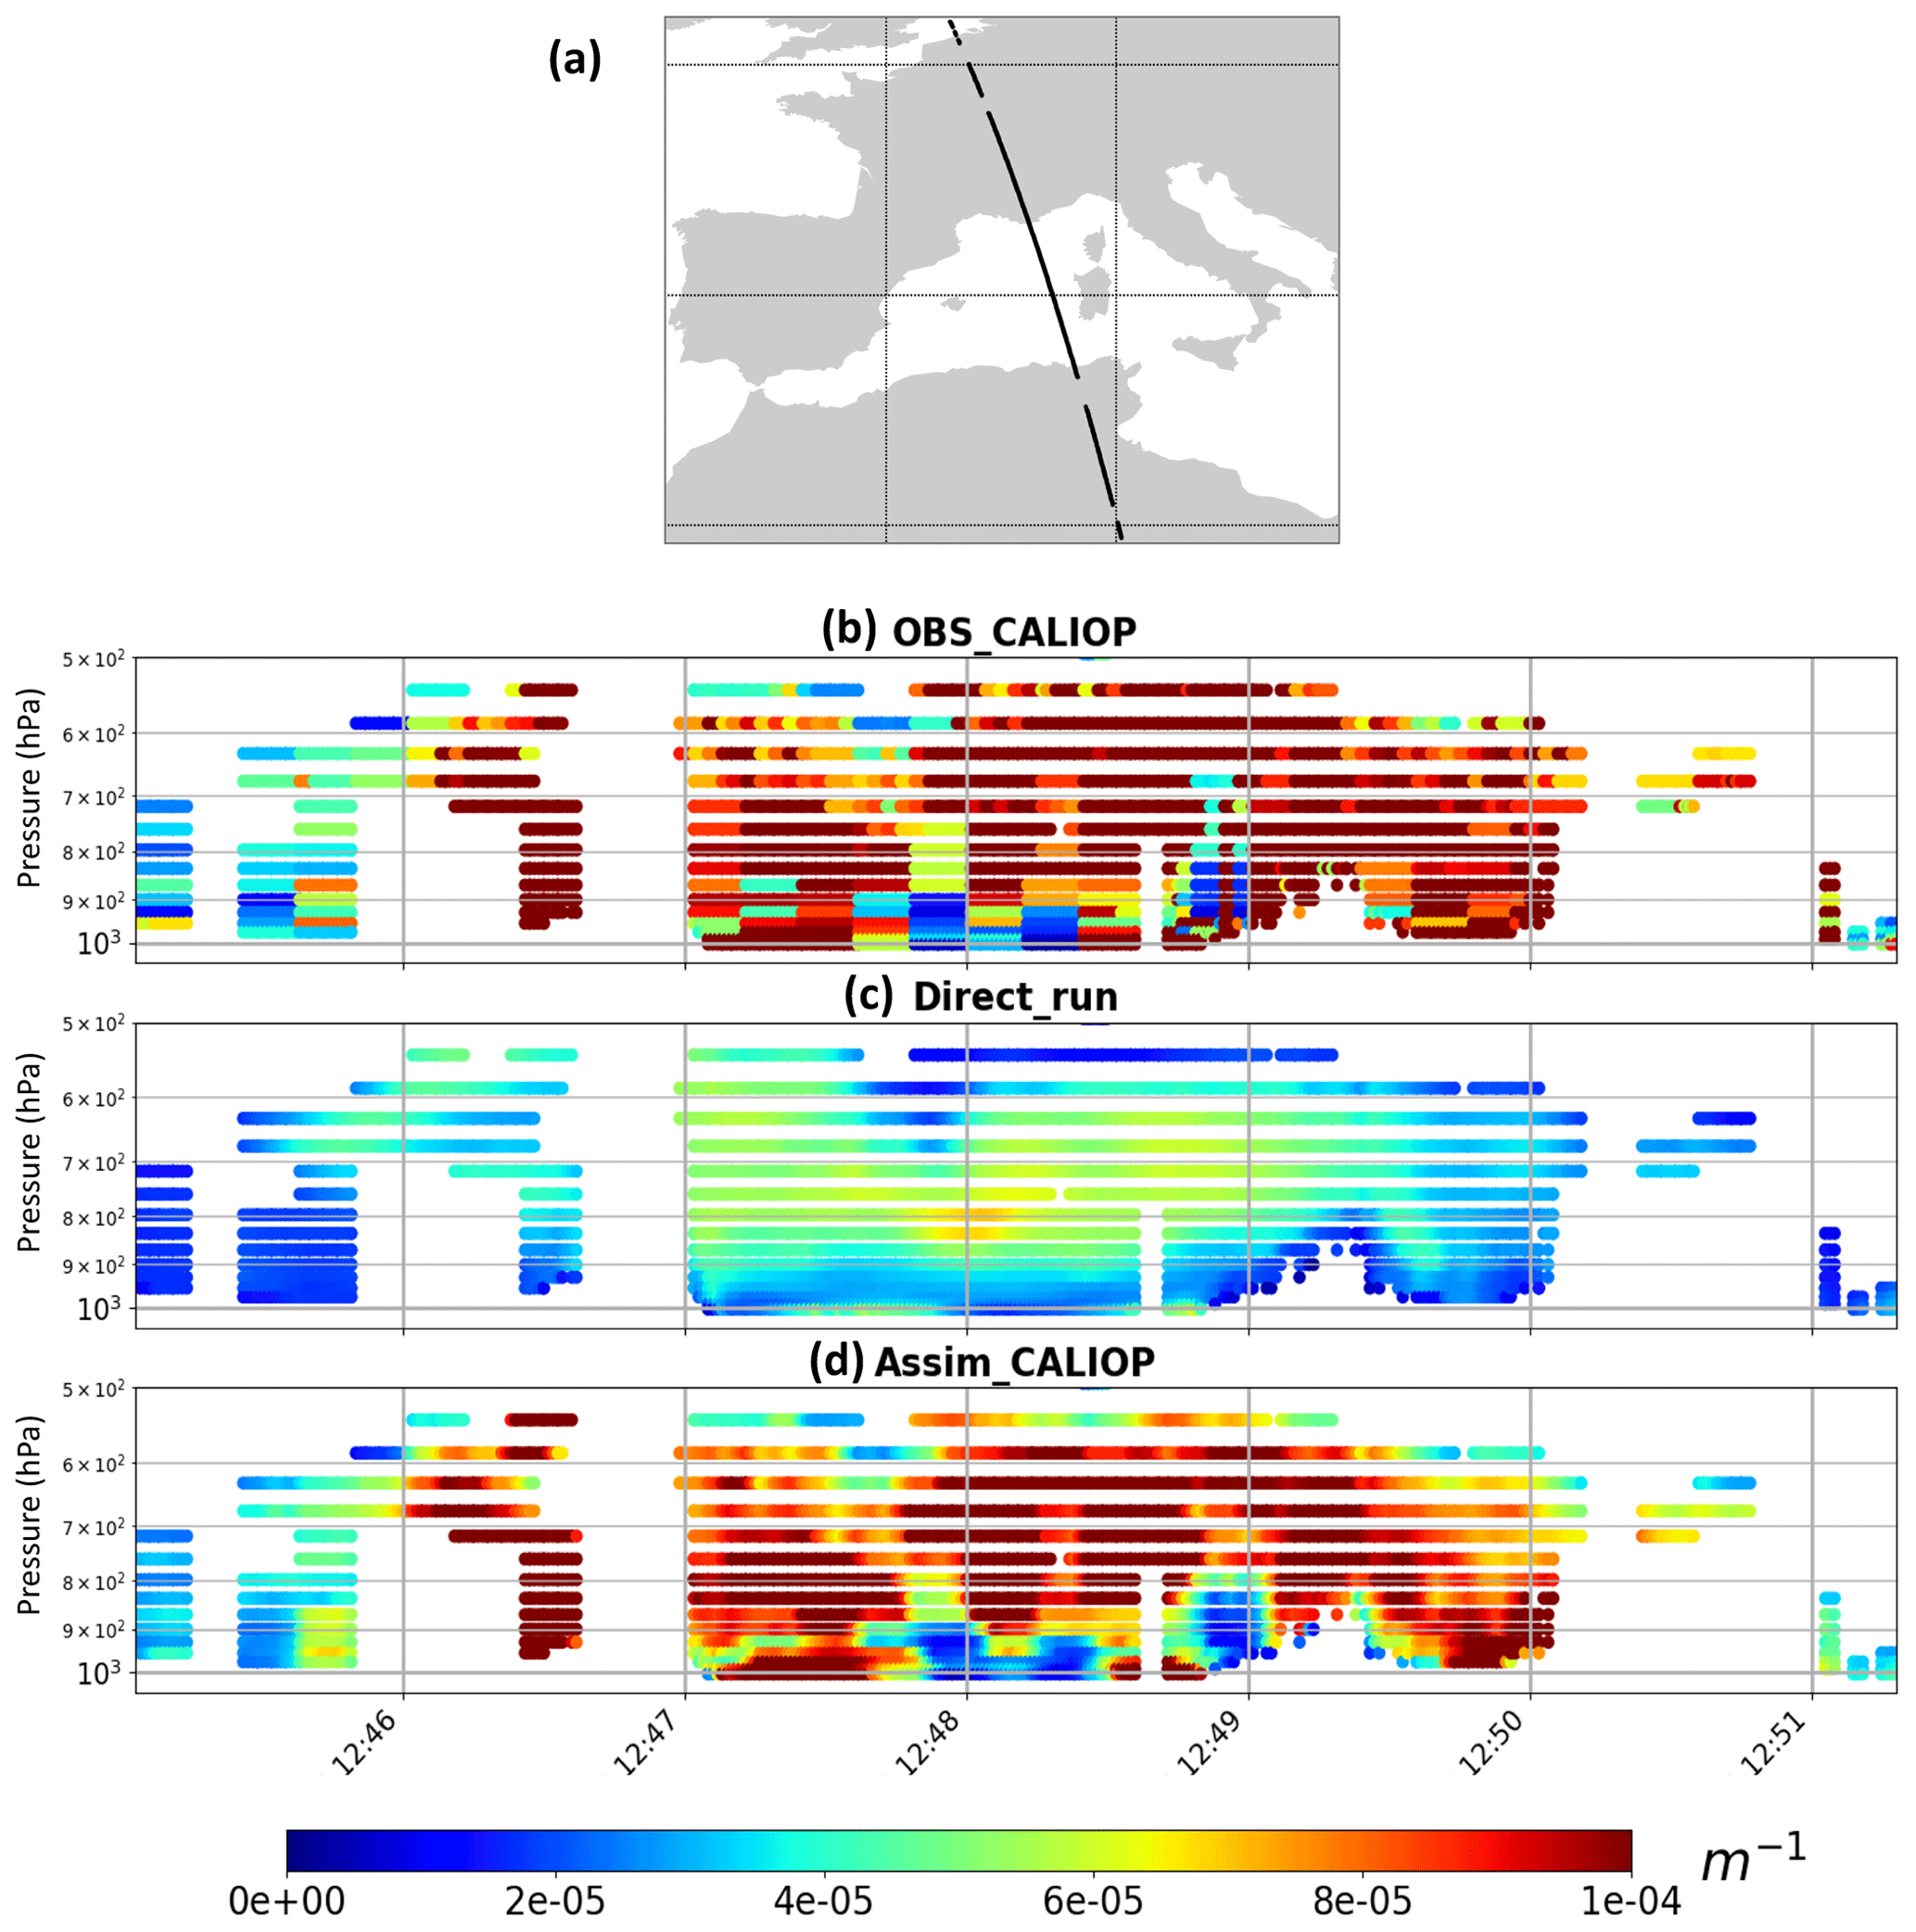
Figure 8(a) A measurement orbit of the CALIOP instrument during 29 June 2012 between 12:45 and 12:52. (b) The vertical profiles of CALIOP observations in terms of extinction coefficient (m−1). The corresponding profiles from the model free run and the assimilated product as for (b) are given in (c) and (d), respectively.
In a second step, we evaluate the added value of CALIOP observation assimilation to better represent the desert dust plume.
Figure 9 shows an illustration of the impact of the assimilation of CALIOP observations on the vertical distribution of desert aerosol during the desert dust outbreak over the MB during 29 June 2012.
Figure 9a presents the same measurement orbit from the CALIOP instrument as for Fig. 8a (black and red colours).
Figure 9b shows the total attenuated backscatter (km−1 sr−1) at the wavelength of 532 nm from the CALIOP instrument corresponding to the measurements presented in Fig. 9a. The white rectangle shows part of the orbit indicated in red colour in Fig. 9a.
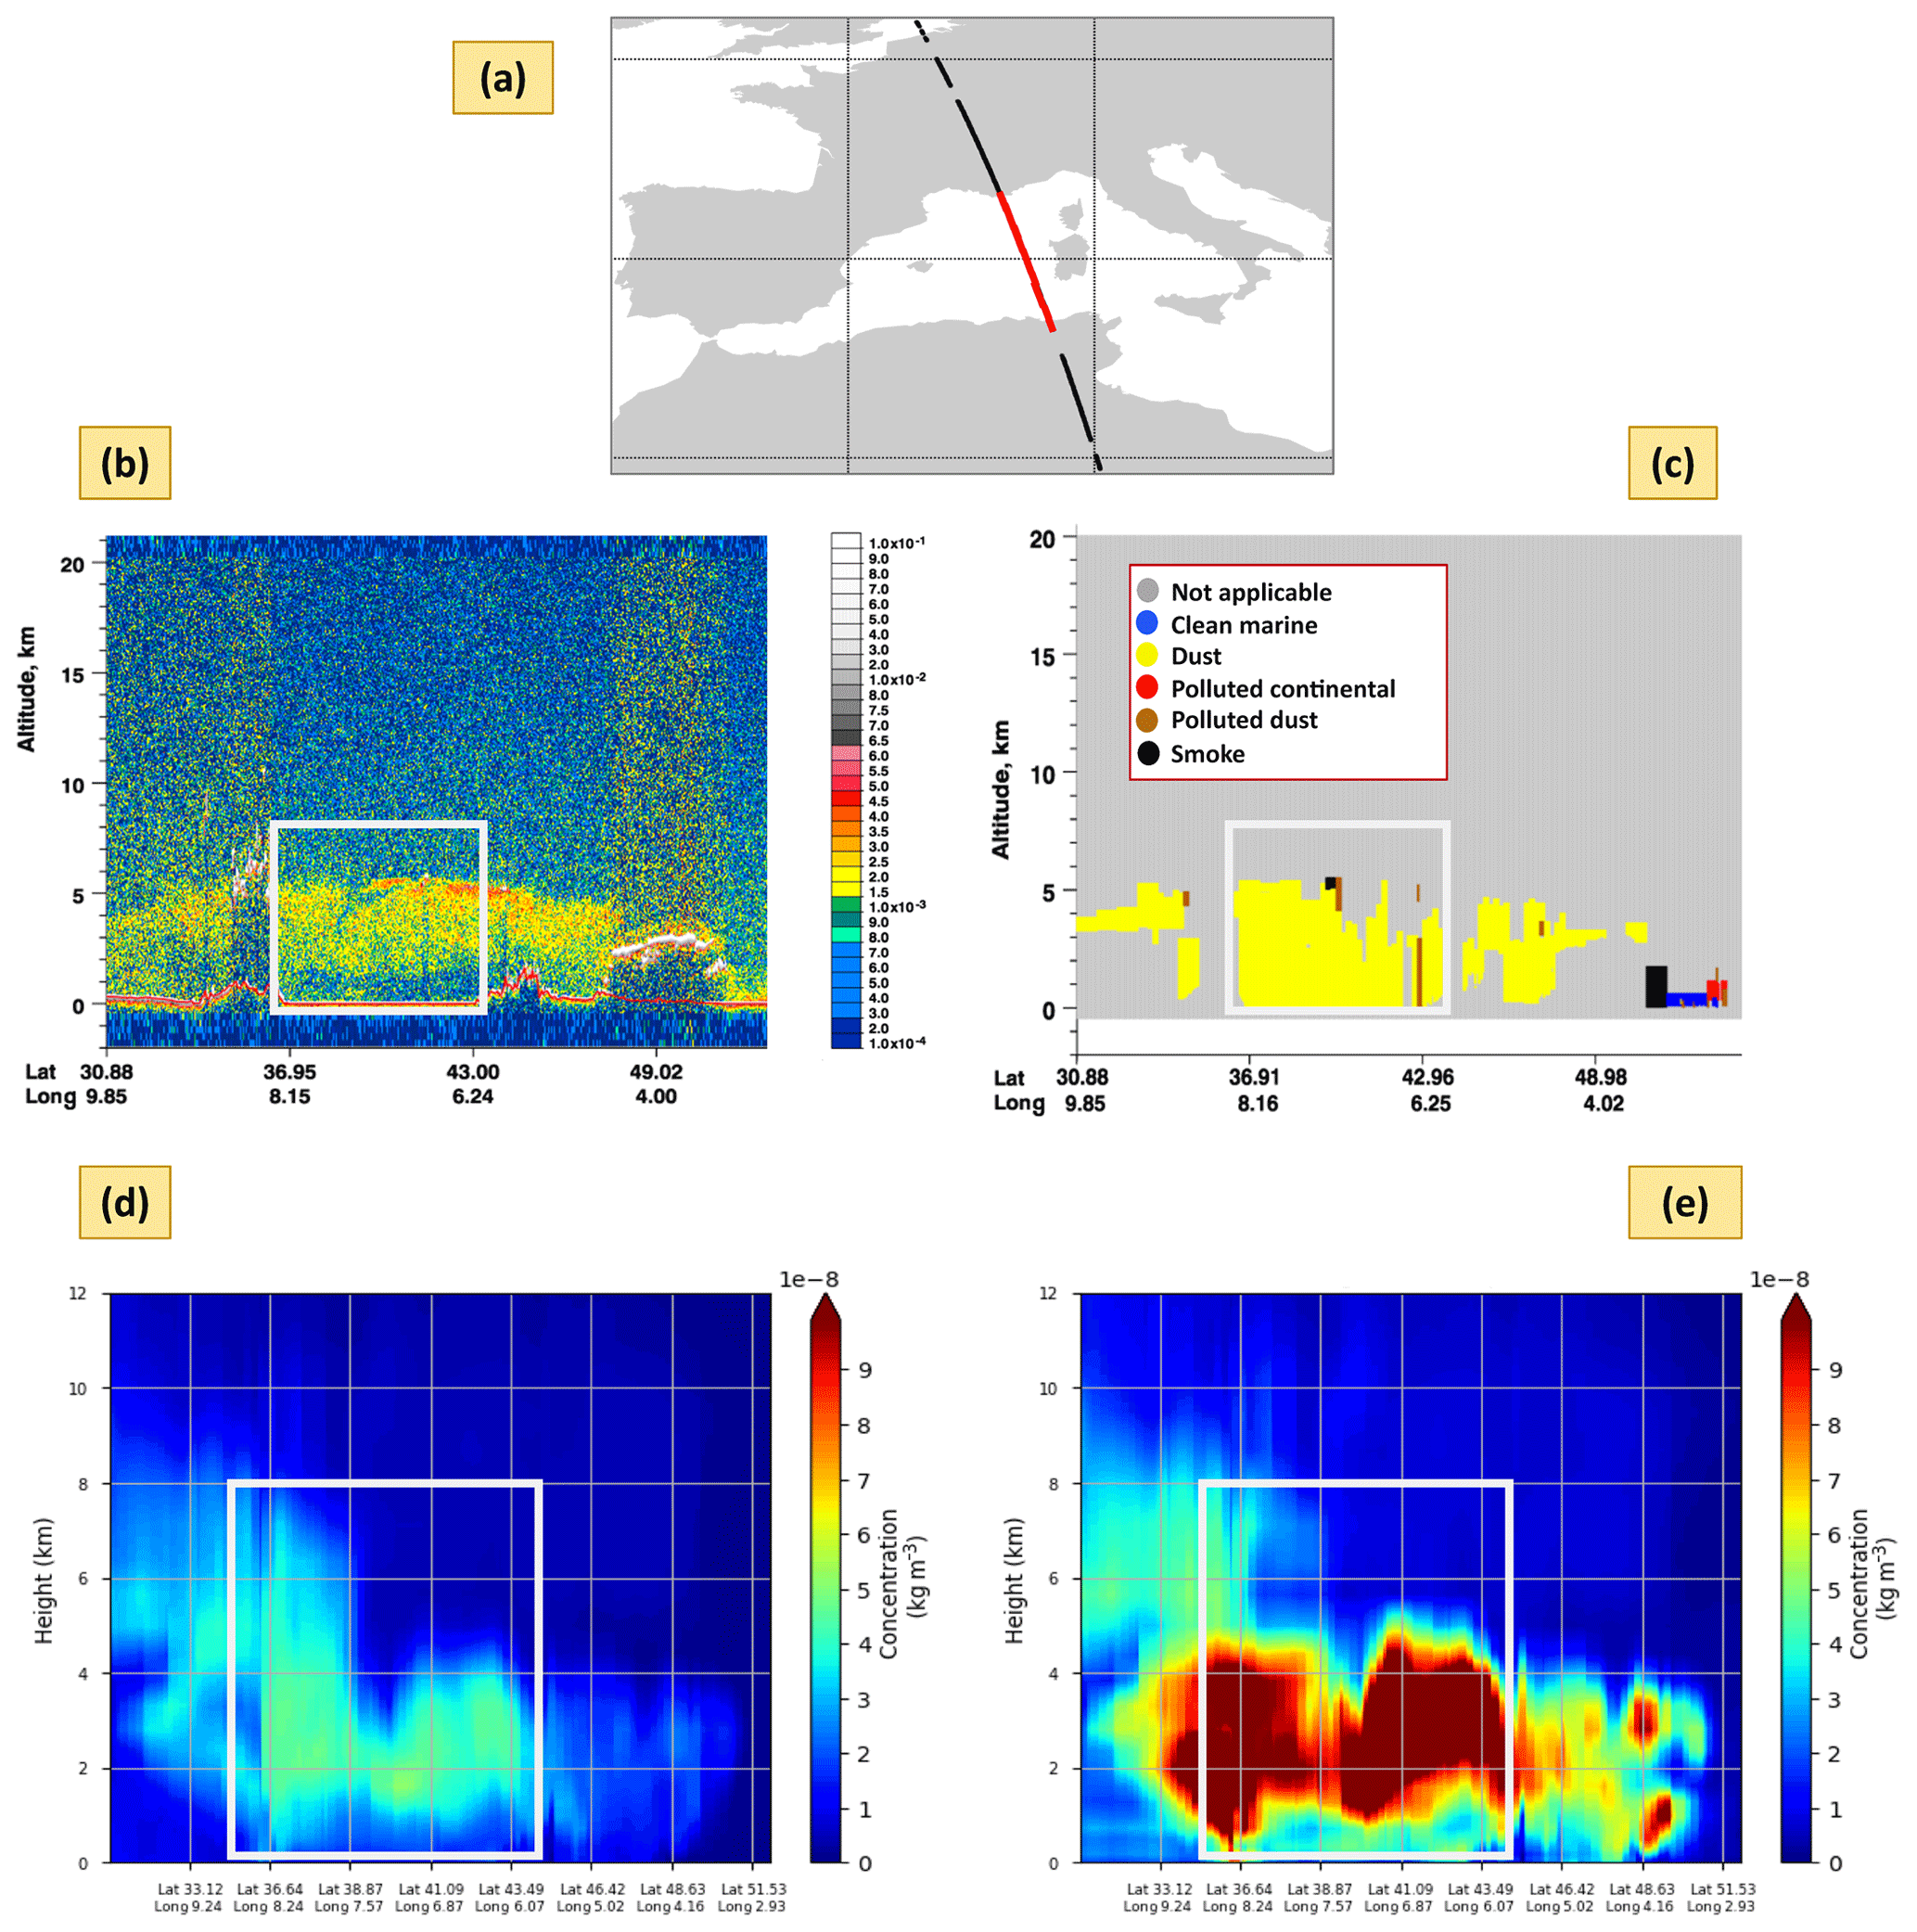
Figure 9(a) A measurement orbit of the CALIOP instrument during 29 June 2012 between 12:45 and 12:52 (red colour corresponds to the part of the orbit which coincides with the desert dust air mass over the MB). (b) The vertical profile of the total attenuated backscatter (km−1 sr−1) as measured by CALIOP at the wavelength of 532 nm corresponding to the orbit presented in (a). (c) The aerosol classifications corresponding to the vertical profiles are shown in (b) (the majority of the aerosols are of dust origin). (d) Vertical profiles of desert dust concentration in kg m−3 issued from the MOCAGE model and corresponding to the CALIOP orbit of (a) issued from MOCAGE and CALIOP assimilation. (e) Same as (d) but for the assimilation of the extinction coefficient from CALIOP lidar instrument. The white rectangle in (b), (c), (d) and (e) corresponds to the part of the orbit indicated in red colour in (a).
This part of the orbit highlights an air mass of desert dust above the MB in the altitude range between 1 and 5 km. This layer of desert dust is illustrated by relatively high values of the attenuated total backscatter from CALIOP measurements. Figure 9c shows the latitude cross section (latitude versus altitude) of the desert dust aerosol along the blue line of Fig. 9a (longitude = 7.1∘) from the MOCAGE model. We note from this figure that the MOCAGE model provides the distribution of the desert dust concentration between 3 and 6 km above sea level at latitude 30∘ N and in the altitude range 1–5 km between latitudes 37 and 49∘ N. The desert dust aerosol concentrations from the MOCAGE model are relatively low and do not clearly show the transport of desert dust as illustrated by the CALIOP measurements in Fig. 9b, where the desert dust air mass is distributed over a large region from latitude 34∘ N to almost latitude 45∘ N following the CALIOP orbit. Figure 9d is the same as Fig. 9c but for the product resulting from the assimilation of CALIOP measurements. High values of the concentration of the desert aerosol are highlighted in the latitude range 38–44∘ N between 1 and 5 km of altitude. This figure shows a distribution of the desert dust aerosol above the MB much more realistic than the one from the free model run (see the comparison of the model and the analyses with MODIS-independent data in Fig. 2). The results presented in Fig. 9 illustrate once again the ability of the assimilation of the CALIOP product to improve the vertical distribution of the desert aerosol.
The aim of this paper is to present and describe the assimilation of lidar observations from the CALIOP (Cloud-Aerosol Lidar with Orthogonal Polarization) instrument in the chemistry-transport model (CTM) of Météo-France, MOCAGE (MOdèle de Chimie Atmosphérique à Grande Échelle). We presented the first results of the assimilation of the extinction coefficient observations of the CALIOP lidar instrument onboard the CALIPSO (Cloud-Aerosol Lidar and Infrared Pathfinder Satellite Observations) satellite during the TRAQA (TRAnsport à longue distance et Qualité de l’Air dans le bassin méditerranéen) field campaign. The assimilation system used in this study is an extension of the assimilation system developed for aerosol optical depth (AOD) already presented by Sič et al. (2016). The methodology of assimilating different aerosol components (AOD or lidar profile) within the MOCAGE model consists in choosing the total concentration of aerosols as the control variable. This approach has the advantage of making the problem of minimising the cost function better determined than with other commonly used approaches (see e.g. Benedetti et al., 2009). Moreover, this approach is more adapted for the assimilation of various aerosol products such as lidar and AOD observations, either independently or in synergy.
In this study, we have evaluated the added value of the assimilation of the CALIOP extinction coefficient observations to better document a desert dust transport event compared to the model free run. The CALIOP assimilation product has been evaluated against different independent datasets: AOD from MODIS (Moderate-resolution Imaging Spectroradiometer) and AERONET (AErosol RObotic NETwork) and aerosol concentration from both the PCASP (Passive Cavity Aerosol Spectrometer Probe) instrument onboard the ATR-42 aircraft and the LOAC (Light Optical Particle Counter) onboard the balloon during the TRAQA field campaign. The results show that CALIOP analyses improve the model compared to the AOD AERONET independent observations. The correlation is increased, while the bias and the RMSE (root mean square error) are reduced. The correlation between AERONET and the model free run (CALIOP assimilation) is 0.682 (0.753), whereas the bias is −0.063 (0.043) and the RMSE is 0.183 (0.148). Compared to MODIS observations, the model free run shows an underestimation of the AOD values, whereas the CALIOP assimilation improves this underestimation and shows a quantitative good improvement in terms of AOD maps over the MB. Compared to the LOAC in situ measurements, the results showed that the assimilated field is closer to the measurements than the free-run model field, particularly in the altitude range ∼1.5–∼5 km corresponding to the altitude range within which the desert dust plume is transported. However, it appears that the number concentration values observed with the LOAC flight (∼0.5 cm−3) are much lower than those observed with the PCASP instrument onboard the ATR aircraft within the desert dust plume (∼5 cm−3). This could be explained by the fact that the size detection ranges for the two instruments are very different. The PCASP instrument measures particles in the diameter range 0.1–3 µm, whereas the LOAC measurements are situated in the diameter range of 2–100 µm.
Note also that the represented aerosol species in this study do not consider the secondary aerosols, which can be the main component of the fine fraction. The lack of secondary aerosols may partly explain the negative biases generally observed in this study.
Space-borne aerosol lidar observations have been revealed to be useful for better understanding the aerosol properties in the atmosphere (e.g. Yu et al., 2010). Particularly, the CALIOP instrument offers many opportunities to better estimate the vertical distribution of aerosols (e.g. Winker et al., 2010). In this study we show that the assimilation of CALIOP lidar observations within the MOCAGE CTM allows a significant improvement in the model. We therefore get a better three-dimensional (3D) distribution of aerosols in comparison to different independent observations.
Despite the fact that satellite nadir-view active sensors such as CALIOP have limited spatial coverage compared to passive sensors, the global observations of aerosol vertical distribution from lidars have contributed to improving the quality of atmospheric aerosol observations (IPCC, 2013). In addition, the assimilation of the lidar aerosol products in the MOCAGE CTM has some advantages. Compared to the assimilation of AOD observations, the assimilation of lidar profiles is more straightforward and allows the introduction of direct information about the vertical distribution of aerosols into the model. This could give more realistic vertical aerosol distributions. Indeed, during the lidar assimilation, the minimisation is done in each level where the observation is available independently of the other levels. Even when the correlation between adjacent levels is done via the B matrix, the lidar assimilation will bring modifications according to the intensity and quality of observations in each level. This has the advantage of better representing the different aerosol layers within the model and therefore better describing their transport process (e.g. desert dust, biomass burning, volcanic ash). By contrast, the assimilation of the AOD will tend to uniformly modify the vertical profile of the model. This can induce biases, especially during extreme events. The assimilation of AOD and lidar profiles has been validated using the same versions of the model and the assimilation system. The next step will consist of making a complete comparison and a discussion about the results of both MODIS AOD and CALIOP lidar assimilations. We will particularly focus on the advantages and limitations of each approach during a desert dust outbreak event.
We also plan to study the added value of measurements from passive and active probes during volcanic eruption events. This is a very important theme for Météo-France since it is part of the VAAC (Volcanic Ash Advisory Center), whose responsibility extends over a large part of Europe, Asia and Africa.
As a perspective of this work, we will consider simultaneously assimilating the observations from passive and active sensors by carrying out an initial de-biasing of both observation datasets. A much more ambitious solution will consist in assimilating satellite radiances directly in a global model using an integrated approach. Assimilation of satellite radiances, i.e. in numerical weather prediction assimilation systems, has proven to be an essential component for improving the forecast skills, particularly for global models (e.g. Derber and Wu, 1998; McNally et al., 2000). This technique may be able to surpass some retrieval algorithms and should provide improved results compared to data assimilation of retrieval products (e.g. Dong et al., 2007).
The MOCAGE model as well as its assimilation system are property of Météo-France and not allowed to be shared publicly. The volume of the model and the assimilation analyses used in this paper is large, but for scientific purpose subsets can be made available upon request. The PCASP and LOAC TRAQA data are available on the ChArMEx database at http://mistrals.sedoo.fr/ChArMEx/ (last access: 20 August 2020) with subsequent DOI: the PCASP TRAQA data (https://doi.org/10.6096/MISTRALS-ChArMEx.998, Piguet and Perrin, 2013) and the LOAC TRAQA data (https://doi.org/10.6096/MISTRALS-ChArMEx.833, Renard, 2012). The user must register before having access to the data. The MODIS/Aqua and MODIS/Terra Atmosphere L2 aerosol products (MYD04_L2-C61 and MOD04_L2-C61) were acquired from the Level-1 & Atmosphere Archive and Distribution System (LAADS) Distributed Active Archive Center (DAAC, http://ladsweb.nascom.nasa.gov, last access: 20 August 2020) (Huang et al., 2019). The AERONET level 2 data were acquired from the AERONET network website (http://aeronet.gsfc.nasa.gov/, last access: 20 July 2020) (Holben et al., 1998).
LEA prepared the paper with contributions from all the authors. BS, AP and LEA implemented the assimilation module within the MOCAGE model. LEA, BS, VM, NF, and JLA designed the experiment and provided scientific guidance. LEA, BS and NF prepared the observations to be assimilated. LEA performed the analysis of MODIS and AERONET data. LEA and BS performed the analysis of the aircraft data. LEA, BS, VM, NF and JLA performed the analyses of the model assimilation runs.
The authors declare that they have no conflict of interest.
This article is part of the special issue “CHemistry and AeRosols Mediterranean EXperiments (ChArMEx) (ACP/AMT inter-journal SI)”. It is not associated with a conference.
This work is funded in France by the Centre National de Recherches Météorologiques (CNRM) of Météo-France and the Centre National de Recherches Scientifiques (CNRS). We would also like to thank NASA and the ICARE, the French atmospheric composition database (CNES and CNRS-INSU), for providing the AERONET and CALIOP data.
This research has been supported by Météo-France as well as by CNRS and CNES through the EECLAT programme.
This paper was edited by Matthias Beekmann and reviewed by two anonymous referees.
Abida, R., Attié, J.-L., El Amraoui, L., Ricaud, P., Lahoz, W., Eskes, H., Segers, A., Curier, L., de Haan, J., Kujanpää, J., Nijhuis, A. O., Tamminen, J., Timmermans, R., and Veefkind, P.: Impact of spaceborne carbon monoxide observations from the S-5P platform on tropospheric composition analyses and forecasts, Atmos. Chem. Phys., 17, 1081–1103, https://doi.org/10.5194/acp-17-1081-2017, 2017. a
Akimoto, H.: Global air quality and pollution, Science, 302, 1716–1719, 2003. a
Aminou, D.: MSG's SEVIRI instrument, ESA Bulletin (0376-4265), pp. 15–17, 2002. a
Barré, J., El Amraoui, L., Ricaud, P., Lahoz, W. A., Attié, J.-L., Peuch, V.-H., Josse, B., and Marécal, V.: Diagnosing the transition layer at extratropical latitudes using MLS O3 and MOPITT CO analyses, Atmos. Chem. Phys., 13, 7225–7240, https://doi.org/10.5194/acp-13-7225-2013, 2013. a
Basart, S., Dulac, F., Baldasano, J., Nabat, P., Mallet, M., Solmon, F., Laurent, B., Vincent, J., Menut, L., El Amraoui, L., Sic, B., Chaboureau, J.-P., Léon, J.-F., Schepanski, K., Renard, J.-B., Ravetta, F., Pelon, J., Di Biagio, C., Formenti, P., Chiapello, I., Roujean, J.-L., Ceamanos, X., Carrer, D., Sicard, M., Delbarre, H., Roberts, G., Junkermann, W., and Attié, J.-L.: Extensive Comparison Between a Set of European Dust Regional Models and Observations in the Western Mediterranean for the Summer 2012 Pre-ChArMEx/TRAQA Campaign, in: Air Pollution Modeling and its Application XXIV, pp. 79–83, Springer, 2016. a
Bencherif, H., El Amraoui, L., Kirgis, G., Leclair De Bellevue, J., Hauchecorne, A., Mzé, N., Portafaix, T., Pazmino, A., and Goutail, F.: Analysis of a rapid increase of stratospheric ozone during late austral summer 2008 over Kerguelen (49.4∘ S, 70.3∘ E), Atmos. Chem. Phys., 11, 363–373, https://doi.org/10.5194/acp-11-363-2011, 2011. a, b
Benedetti, A., Morcrette, J.-J., Boucher, O., Dethof, A., Engelen, R., Fisher, M., Flentje, H., Huneeus, N., Jones, L., Kaiser, J. W., Kinne, S., Mangold, A., Razinger, M., Simmons, A. J., and Suttie, M.: Aerosol analysis and forecast in the European centre for medium-range weather forecasts integrated forecast system: 2. Data assimilation, J. Geophys. Res.-Atmos., 114, D13205, https://doi.org/10.1029/2008JD011115, 2009. a, b, c
Cai, Y., Snider, J. R., and Wechsler, P.: Calibration of the passive cavity aerosol spectrometer probe for airborne determination of the size distribution, Atmos. Meas. Tech., 6, 2349–2358, https://doi.org/10.5194/amt-6-2349-2013, 2013. a
Campbell, J. R., Reid, J. S., Westphal, D. L., Zhang, J., Hyer, E. J., and Welton, E. J.: CALIOP aerosol subset processing for global aerosol transport model data assimilation, IEEE Journal of Selected Topics in Applied Earth Observations and Remote Sensing, 3, 203–214, 2010. a
Cheng, Y., Dai, T., Goto, D., Schutgens, N. A. J., Shi, G., and Nakajima, T.: Investigating the assimilation of CALIPSO global aerosol vertical observations using a four-dimensional ensemble Kalman filter, Atmos. Chem. Phys., 19, 13445–13467, https://doi.org/10.5194/acp-19-13445-2019, 2019. a
Claeyman, M., Attié, J.-L., El Amraoui, L., Cariolle, D., Peuch, V.-H., Teyssèdre, H., Josse, B., Ricaud, P., Massart, S., Piacentini, A., Cammas, J.-P., Livesey, N. J., Pumphrey, H. C., and Edwards, D. P.: A linear CO chemistry parameterization in a chemistry-transport model: evaluation and application to data assimilation, Atmos. Chem. Phys., 10, 6097–6115, https://doi.org/10.5194/acp-10-6097-2010, 2010. a
Claeyman, M., Attié, J.-L., Peuch, V.-H., El Amraoui, L., Lahoz, W. A., Josse, B., Joly, M., Barré, J., Ricaud, P., Massart, S., Piacentini, A., von Clarmann, T., Höpfner, M., Orphal, J., Flaud, J.-M., and Edwards, D. P.: A thermal infrared instrument onboard a geostationary platform for CO and O3 measurements in the lowermost troposphere: Observing System Simulation Experiments (OSSE), Atmos. Meas. Tech., 4, 1637–1661, https://doi.org/10.5194/amt-4-1637-2011, 2011a. a
Claeyman, M., Attié, J.-L., Peuch, V.-H., El Amraoui, L., Lahoz, W. A., Josse, B., Ricaud, P., von Clarmann, T., Höpfner, M., Orphal, J., Flaud, J.-M., Edwards, D. P., Chance, K., Liu, X., Pasternak, F., and Cantié, R.: A geostationary thermal infrared sensor to monitor the lowermost troposphere: O3 and CO retrieval studies, Atmos. Meas. Tech., 4, 297–317, https://doi.org/10.5194/amt-4-297-2011, 2011b. a
Courtier, P., Freydier, C., Geleyn, J., Rabier, F., and Rochas, M.: The ARPEGE project at Météo France, in: Atmospheric Models, vol.2, pp. 193–231, Workshop on Numerical Methods, Reading, U.K., 1991. a
Courtier, P., Thépaut, J.-N., and Hollingsworth, A.: A strategy for operational implementation of 4D-Var, using an incremental approach, Q. J. Roy. Meteor. Soc., 120, 1367–1387, 1994. a
Daley, R.: Atmospheric data analysis, 2, Cambridge University Press, Cambridge, UK, 1993. a
Derber, J. C. and Wu, W.-S.: The use of TOVS cloud-cleared radiances in the NCEP SSI analysis system, Mon. Weather Rev., 126, 2287–2299, 1998. a
Deschamps, P.-Y., Bréon, F.-M., Leroy, M., Podaire, A., Bricaud, A., Buriez, J.-C., and Seze, G.: The POLDER mission: Instrument characteristics and scientific objectives, IEEE T. Geosci. Remote, 32, 598–615, 1994. a
Diner, D. J., Bruegge, C. J., Martonchik, J. V., Ackerman, T. P., Davies, R., Gerstl, S. A., Gordon, H. R., Sellers, P., Clark, J., Daniels, J., Danielson, E. D., Duval, V. G., Klaasen, K. P., Lilienthal, G. W., Nakamoto, D. I., Pagano, R. J., and Reilly, T. H.: MISR: A multiangle imaging spectroradiometer for geophysical and climatological research from EOS, IEEE T. Geosci. Remote, 27, 200–214, 1989. a
Dong, J., Walker, J. P., Houser, P. R., and Sun, C.: Scanning multichannel microwave radiometer snow water equivalent assimilation, J. Geophys. Res.-Atmos., 112, D07108, https://doi.org/10.1029/2006JD007209, 2007. a
Ebi, K. L. and McGregor, G.: Climate change, tropospheric ozone and particulate matter, and health impacts, Environ. Health Perspect., 116, 1449–1455, 2008. a
El Amraoui, L., Peuch, V.-H., Ricaud, P., Massart, S., Semane, N., Teyssèdre, H., Cariolle, D., and Karcher, F.: Ozone loss in the 2002–2003 Arctic vortex deduced from the assimilation of Odin/SMR O3 and N2O measurements: N2O as a dynamical tracer, Q. J. Roy. Meteor. Soc., 134, 217–228, 2008a. a
El Amraoui, L., Semane, N., Peuch, V.-H., and Santee, M. L.: Investigation of dynamical processes in the polar stratospheric vortex during the unusually cold winter 2004/2005, Geophys. Res. Lett., 35, L03803, https://doi.org/10.1029/2007GL031251, 2008b. a, b
El Amraoui, L., Attié, J.-L., Semane, N., Claeyman, M., Peuch, V.-H., Warner, J., Ricaud, P., Cammas, J.-P., Piacentini, A., Josse, B., Cariolle, D., Massart, S., and Bencherif, H.: Midlatitude stratosphere – troposphere exchange as diagnosed by MLS O3 and MOPITT CO assimilated fields, Atmos. Chem. Phys., 10, 2175–2194, https://doi.org/10.5194/acp-10-2175-2010, 2010. a, b, c
El Amraoui, L., Attié, J.-L., Ricaud, P., Lahoz, W. A., Piacentini, A., Peuch, V.-H., Warner, J. X., Abida, R., Barré, J., and Zbinden, R.: Tropospheric CO vertical profiles deduced from total columns using data assimilation: methodology and validation, Atmos. Meas. Tech., 7, 3035–3057, https://doi.org/10.5194/amt-7-3035-2014, 2014. a, b, c, d, e
Emili, E., Barret, B., Massart, S., Le Flochmoen, E., Piacentini, A., El Amraoui, L., Pannekoucke, O., and Cariolle, D.: Combined assimilation of IASI and MLS observations to constrain tropospheric and stratospheric ozone in a global chemical transport model, Atmos. Chem. Phys., 14, 177–198, https://doi.org/10.5194/acp-14-177-2014, 2014. a, b
Gupta, P., Levy, R. C., Mattoo, S., Remer, L. A., and Munchak, L. A.: A surface reflectance scheme for retrieving aerosol optical depth over urban surfaces in MODIS Dark Target retrieval algorithm, Atmos. Meas. Tech., 9, 3293–3308, https://doi.org/10.5194/amt-9-3293-2016, 2016. a
Hache, E., Attié, J.-L., Tourneur, C., Ricaud, P., Coret, L., Lahoz, W. A., El Amraoui, L., Josse, B., Hamer, P., Warner, J., Liu, X., Chance, K., Höpfner, M., Spurr, R., Natraj, V., Kulawik, S., Eldering, A., and Orphal, J.: The added value of a visible channel to a geostationary thermal infrared instrument to monitor ozone for air quality, Atmos. Meas. Tech., 7, 2185–2201, https://doi.org/10.5194/amt-7-2185-2014, 2014. a
Holben, B., Eck, T., Slutsker, I., Tanre, D., Buis, J., Setzer, A., Vermote, E., Reagan, J., Kaufman, Y., Nakajima, T., Lavenu, F., Jankowiak, I., and Smirnov, A.: AERONET—A federated instrument network and data archive for aerosol characterization, Remote Sens. Environ., 66, 1–16, 1998. a
Huang, J. P., Liu, J. J., Chen, B., and Nasiri, S. L.: Detection of anthropogenic dust using CALIPSO lidar measurements, Atmos. Chem. Phys., 15, 11653–11665, https://doi.org/10.5194/acp-15-11653-2015, 2015. a
Huang, Y., Zhu, B., Zhu, Z., Zhang, T., Gong, W., Ji, Y., Xia, X., Wang, L., Zhou, X., and Chen, D., Evaluation and Comparison of MODIS Collection 6.1 and Collection 6 Dark Target Aerosol Optical Depth over Mainland China Under Various Conditions Including Spatiotemporal Distribution, Haze Effects, and Underlying Surface, Earth Space Sci., 6, 2575–2592, https://doi.org/10.1029/2019EA000809, 2019. a
IPCC: Climate change 2013: The physical science basis: Working Group I Contribution to the Fifth Assessment Report of the Intergovernmental Panel on Climate Change, Cambridge University Press, Cambridge and New York, 2013. a
Jaidan, N., El Amraoui, L., Attié, J.-L., Ricaud, P., and Dulac, F.: Future changes in surface ozone over the Mediterranean Basin in the framework of the Chemistry-Aerosol Mediterranean Experiment (ChArMEx), Atmos. Chem. Phys., 18, 9351–9373, https://doi.org/10.5194/acp-18-9351-2018, 2018. a
Josse, B., Simon, P., and Peuch, V.-H.: Radon global simulation with the multiscale chemistry trasnport model MOCAGE, Tellus, 56, 339–356, 2004. a
Justice, C. O., Vermote, E., Townshend, J. R., Defries, R., Roy, D. P., Hall, D. K., Salomonson, V. V., Privette, J. L., Riggs, G., Strahler, A., Lucht, W., Myneni, R. P., Knyazikhin, Y., Running, S. W., Nemani, R. R., Wan, Z., Huete, A. R., van Leeuwen, W., Wolfe, R. E., Giglio, L., Muller, J.-P., Lewis, P., and Barnsley, M. J.: The Moderate Resolution Imaging Spectroradiometer (MODIS): Land remote sensing for global change research, IEEE T. Geosci. Remote, 36, 1228–1249, 1998. a
Kacenelenbogen, M., Vaughan, M. A., Redemann, J., Hoff, R. M., Rogers, R. R., Ferrare, R. A., Russell, P. B., Hostetler, C. A., Hair, J. W., and Holben, B. N.: An accuracy assessment of the CALIOP/CALIPSO version 2/version 3 daytime aerosol extinction product based on a detailed multi-sensor, multi-platform case study, Atmos. Chem. Phys., 11, 3981–4000, https://doi.org/10.5194/acp-11-3981-2011, 2011. a
Kaiser, J. W., Heil, A., Andreae, M. O., Benedetti, A., Chubarova, N., Jones, L., Morcrette, J.-J., Razinger, M., Schultz, M. G., Suttie, M., and van der Werf, G. R.: Biomass burning emissions estimated with a global fire assimilation system based on observed fire radiative power, Biogeosciences, 9, 527–554, https://doi.org/10.5194/bg-9-527-2012, 2012. a
King, M. D., Kaufman, Y. J., Tanré, D., and Nakajima, T.: Remote Sensing of Tropospheric Aerosols from Space: Past, Present, and Future, B. Am. Meteor. Soc., 80, 2229–2259, 1999. a
Kittaka, C., Winker, D. M., Vaughan, M. A., Omar, A., and Remer, L. A.: Intercomparison of column aerosol optical depths from CALIPSO and MODIS-Aqua, Atmos. Meas. Tech., 4, 131–141, https://doi.org/10.5194/amt-4-131-2011, 2011. a
Lahoz, W. A., Errera, Q., Swinbank, R., and Fonteyn, D.: Data assimilation of stratospheric constituents: a review, Atmos. Chem. Phys., 7, 5745–5773, https://doi.org/10.5194/acp-7-5745-2007, 2007. a
Lee, E.-H., Ha, J.-C., Lee, S.-S., and Chun, Y.: PM 10 data assimilation over South Korea to Asian dust forecasting model with the optimal interpolation method, Asia-Pacific J. Atmos. Sci., 49, 73–85, 2013. a
Liu, Z., Omar, A., Vaughan, M., Hair, J., Kittaka, C., Hu, Y., Powell, K., Trepte, C., Winker, D., Hostetler, C., Ferrare, R., and Pierce, R.: CALIPSO lidar observations of the optical properties of Saharan dust: A case study of long-range transport, J. Geophys. Res.-Atmos., 113, D07207, https://doi.org/10.1029/2007JD008878, 2008. a
Liu, Z., Liu, Q., Lin, H.-C., Schwartz, C. S., Lee, Y.-H., and Wang, T.: Three-dimensional variational assimilation of MODIS aerosol optical depth: Implementation and application to a dust storm over East Asia, J. Geophys. Res.-Atmos., 116, D23206, https://doi.org/10.1029/2011JD016159, 2011. a
Lurton, T., Renard, J.-B., Vignelles, D., Jeannot, M., Akiki, R., Mineau, J.-L., and Tonnelier, T.: Light scattering at small angles by atmospheric irregular particles: modelling and laboratory measurements, Atmos. Meas. Tech., 7, 931–939, https://doi.org/10.5194/amt-7-931-2014, 2014. a
Ma, X., Bartlett, K., Harmon, K., and Yu, F.: Comparison of AOD between CALIPSO and MODIS: significant differences over major dust and biomass burning regions, Atmos. Meas. Tech., 6, 2391–2401, https://doi.org/10.5194/amt-6-2391-2013, 2013. a
Mamouri, R. E., Amiridis, V., Papayannis, A., Giannakaki, E., Tsaknakis, G., and Balis, D. S.: Validation of CALIPSO space-borne-derived attenuated backscatter coefficient profiles using a ground-based lidar in Athens, Greece, Atmos. Meas. Tech., 2, 513–522, https://doi.org/10.5194/amt-2-513-2009, 2009. a
Martet, M., Peuch, V.-H., Laurent, B., Marticorena, B., and Bergametti, G.: Evaluation of long-range transport and deposition of desert dust with the CTM MOCAGE, Tellus B, 61, 449–463, 2009. a
Massart, S., Clerbaux, C., Cariolle, D., Piacentini, A., Turquety, S., and Hadji-Lazaro, J.: First steps towards the assimilation of IASI ozone data into the MOCAGE-PALM system, Atmos. Chem. Phys., 9, 5073–5091, https://doi.org/10.5194/acp-9-5073-2009, 2009. a
Massart, S., Pajot, B., Piacentini, A., and Pannekoucke, O.: On the merits of using a 3D-FGAT assimilation scheme with an outer loop for atmospheric situations governed by transport, Mon. Weather Rev., 138, 4509–4522, 2010. a
Massart, S., Piacentini, A., and Pannekoucke, O.: Importance of using ensemble estimated background error covariances for the quality of atmospheric ozone analyses, Q. J. Roy. Meteorol. Soc., 138, 889–905, 2012. a
McNally, A. P., Derber, J., Wu, W., and Katz, B.: The use of TOVS level-1b radiances in the NCEP SSI analysis system, Q. J. Roy. Meteorol. Soc., 126, 689–724, 2000. a
Ménard, R. and Chang, L.-P.: Assimilation of stratospheric chemical tracer observations using a Kalman filter. Part II: χ 2-validated results and analysis of variance and correlation dynamics, Mon. Weather Rev., 128, 2672–2686, 2000. a
Niu, T., Gong, S. L., Zhu, G. F., Liu, H. L., Hu, X. Q., Zhou, C. H., and Wang, Y. Q.: Data assimilation of dust aerosol observations for the CUACE/dust forecasting system, Atmos. Chem. Phys., 8, 3473–3482, https://doi.org/10.5194/acp-8-3473-2008, 2008. a
Oo, M. and Holz, R.: Improving the CALIOP aerosol optical depth using combined MODIS-CALIOP observations and CALIOP integrated attenuated total color ratio, J. Geophys. Res.-Atmos., 116, D14201, https://doi.org/10.1029/2010JD014894, 2011. a
Pannekoucke, O. and Massart, S.: Estimation of the local diffusion tensor and normalization for heterogeneous correlation modelling using a diffusion equation, Q. J. Roy. Meteorol. Soc., 134, 1425–1438, 2008. a, b
Payra, S., Ricaud, P., Abida, R., El Amraoui, L., Attié, J.-L., Rivière, E., Carminati, F., and von Clarmann, T.: Evaluation of water vapour assimilation in the tropical upper troposphere and lower stratosphere by a chemical transport model, Atmos. Meas. Tech., 9, 4355–4373, https://doi.org/10.5194/amt-9-4355-2016, 2016. a, b
Piguet, B. and Perrin, T.: ATR Core in-situ measurements – TRAQA, ChArMEx database, available at: http://mistrals.sedoo.fr/ChArMEx/ (registration required, last access: August 2020), https://doi.org/10.6096/MISTRALS-ChArMEx.998, 2013. a
Rabier, F., Bouchard, A., Brun, E., Doerenbecher, A., Guedj, S., Guidard, V., Karbou, F., Peuch, V., El Amraoui, L., Puech, D., Genthon, C., Picard, G., Town, M., Hertzog, A., Vial, F., Cocquerez, P., Cohn, S., Hock, T., Fox, J., Cole, H., Parsons, D., Powers, J., Romberg, K., VanAndel, J., Deshler, T., Mercer, J., Haase, J., Avallone, L., Kalnajs, L., Mechoso, C., Tangborn, A., Pellegrini, A., Frenot, Y., Thépaut, J., McNally, A., Balsamo, G., and Steinle, P.: The Concordiasi Project in Antarctica, B. Am. Meteor. Soc., 91, 69–86, https://doi.org/10.1175/2009BAMS2764.1, 2010. a, b
Rasch, P. J., Collins, W. D., and Eaton, B. E.: Understanding the Indian Ocean Experiment (INDOEX) aerosol distributions with an aerosol assimilation, J. Geophys. Res.-Atmos., 106, 7337–7355, 2001. a
Rast, M., Bezy, J., and Bruzzi, S.: The ESA Medium Resolution Imaging Spectrometer MERIS a review of the instrument and its mission, Int. J. Remote Sens., 20, 1681–1702, 1999. a
Redemann, J., Vaughan, M. A., Zhang, Q., Shinozuka, Y., Russell, P. B., Livingston, J. M., Kacenelenbogen, M., and Remer, L. A.: The comparison of MODIS-Aqua (C5) and CALIOP (V2 & V3) aerosol optical depth, Atmos. Chem. Phys., 12, 3025–3043, https://doi.org/10.5194/acp-12-3025-2012, 2012. a
Renard, J.-B.: LOAC – TRAQA – Martigues, ChArMEx database, available at: http://mistrals.sedoo.fr/ChArMEx/ (registration required, last access: August 2020), https://doi.org/10.6096/MISTRALSChArMEx.833, 2012. a
Renard, J.-B., Dulac, F., Berthet, G., Lurton, T., Vignelles, D., Jégou, F., Tonnelier, T., Jeannot, M., Couté, B., Akiki, R., Verdier, N., Mallet, M., Gensdarmes, F., Charpentier, P., Mesmin, S., Duverger, V., Dupont, J.-C., Elias, T., Crenn, V., Sciare, J., Zieger, P., Salter, M., Roberts, T., Giacomoni, J., Gobbi, M., Hamonou, E., Olafsson, H., Dagsson-Waldhauserova, P., Camy-Peyret, C., Mazel, C., Décamps, T., Piringer, M., Surcin, J., and Daugeron, D.: LOAC: a small aerosol optical counter/sizer for ground-based and balloon measurements of the size distribution and nature of atmospheric particles – Part 1: Principle of measurements and instrument evaluation, Atmos. Meas. Tech., 9, 1721–1742, https://doi.org/10.5194/amt-9-1721-2016, 2016. a, b, c
Rogers, R. R., Vaughan, M. A., Hostetler, C. A., Burton, S. P., Ferrare, R. A., Young, S. A., Hair, J. W., Obland, M. D., Harper, D. B., Cook, A. L., and Winker, D. M.: Looking through the haze: evaluating the CALIPSO level 2 aerosol optical depth using airborne high spectral resolution lidar data, Atmos. Meas. Tech., 7, 4317–4340, https://doi.org/10.5194/amt-7-4317-2014, 2014. a
Sekiyama, T. T., Tanaka, T. Y., Shimizu, A., and Miyoshi, T.: Data assimilation of CALIPSO aerosol observations, Atmos. Chem. Phys., 10, 39–49, https://doi.org/10.5194/acp-10-39-2010, 2010. a, b
Semane, N., Peuch, V.-H., El Amraoui, L., Bencherif, H., Massart, S., Cariolle, D., Attié, J.-L., and Abida, R.: An observed and analysed stratospheric ozone intrusion over the high Canadian Arctic UTLS region during the summer of 2003, Q. J. Roy. Meteor. Soc., 133, 171–178, 2007. a, b
Shi, Y., Zhang, J., Reid, J. S., Holben, B., Hyer, E. J., and Curtis, C.: An analysis of the collection 5 MODIS over-ocean aerosol optical depth product for its implication in aerosol assimilation, Atmos. Chem. Phys., 11, 557–565, https://doi.org/10.5194/acp-11-557-2011, 2011. a
Shikwambana, L. and Sivakumar, V.: Global distribution of aerosol optical depth in 2015 using CALIPSO level 3 data, J. Atmos. Sol.-Terr. Phys., 173, 150–159, 2018. a, b
Sič, B.: Amélioration de la représentation des aérosols dans un modèle de chimie-transport: modélisation et assimilation de données, Ph.D. thesis, Université de Toulouse, Université Toulouse III-Paul Sabatier, 2014. a, b, c
Sič, B., El Amraoui, L., Marécal, V., Josse, B., Arteta, J., Guth, J., Joly, M., and Hamer, P. D.: Modelling of primary aerosols in the chemical transport model MOCAGE: development and evaluation of aerosol physical parameterizations, Geosci. Model Dev., 8, 381–408, https://doi.org/10.5194/gmd-8-381-2015, 2015. a, b, c
Sič, B., El Amraoui, L., Piacentini, A., Marécal, V., Emili, E., Cariolle, D., Prather, M., and Attié, J.-L.: Aerosol data assimilation in the chemical transport model MOCAGE during the TRAQA/ChArMEx campaign: aerosol optical depth, Atmos. Meas. Tech., 9, 5535–5554, https://doi.org/10.5194/amt-9-5535-2016, 2016. a, b, c, d, e, f, g, h, i, j, k, l, m
Strapp, J. W., Leaitch, W. R., and Liu, P. S. K.: Hydrated and Dried Aerosol-Size-Distribution Measurements from the Particle Measuring Systems FSSP-300 Probe and the Deiced PCASP-100X Probe, J. Atmos. Ocean. Tech., 9, 548–555, https://doi.org/10.1175/1520-0426(1992)009<0548:HADASD>2.0.CO;2, 1992. a
Talagrand, O.: A posteriori validation of assimilation algorithms, in: Data assimilation for the earth system, edited by: Swinbank, R., Shutyaev, V., and Lahoz, W. A., pp. 85–95, Springer, 2003. a, b
Tegen, I. and Lacis, A. A.: Modeling of particle size distribution and its influence on the radiative properties of mineral dust aerosol, J. Geophys. Res.-Atmos., 101, 19237–19244, 1996. a
Teyssèdre, H., Michou, M., Clark, H. L., Josse, B., Karcher, F., Olivié, D., Peuch, V.-H., Saint-Martin, D., Cariolle, D., Attié, J.-L., Nédélec, P., Ricaud, P., Thouret, V., van der A, R. J., Volz-Thomas, A., and Chéroux, F.: A new tropospheric and stratospheric Chemistry and Transport Model MOCAGE-Climat for multi-year studies: evaluation of the present-day climatology and sensitivity to surface processes, Atmos. Chem. Phys., 7, 5815–5860, https://doi.org/10.5194/acp-7-5815-2007, 2007. a
Tie, X., Madronich, S., Walters, S., Edwards, D. P., Ginoux, P., Mahowald, N., Zhang, R., Lou, C., and Brasseur, G.: Assessment of the global impact of aerosols on tropospheric oxidants, J. Geophys. Res.-Atmos., 110, D03204, https://doi.org/10.1029/2004JD005359, 2005. a
Toledano, C., González, R., Fuertes, D., Cuevas, E., Eck, T. F., Kazadzis, S., Kouremeti, N., Gröbner, J., Goloub, P., Blarel, L., Román, R., Barreto, Á., Berjón, A., Holben, B. N., and Cachorro, V. E.: Assessment of Sun photometer Langley calibration at the high-elevation sites Mauna Loa and Izaña, Atmos. Chem. Phys., 18, 14555–14567, https://doi.org/10.5194/acp-18-14555-2018, 2018. a
Tombette, M., Mallet, V., and Sportisse, B.: PM10 data assimilation over Europe with the optimal interpolation method, Atmos. Chem. Phys., 9, 57–70, https://doi.org/10.5194/acp-9-57-2009, 2009. a
Wang, Y., Sartelet, K. N., Bocquet, M., and Chazette, P.: Modelling and assimilation of lidar signals over Greater Paris during the MEGAPOLI summer campaign, Atmos. Chem. Phys., 14, 3511–3532, https://doi.org/10.5194/acp-14-3511-2014, 2014. a
Wang, Y., Yuan, Q., Li, T., Shen, H., Zheng, L., and Zhang, L.: Evaluation and comparison of MODIS Collection 6.1 aerosol optical depth against AERONET over regions in China with multifarious underlying surfaces, Atmos. Environ., 200, 280–301, 2019. a
Weaver, A. and Courtier, P.: Correlation modelling on the sphere using a generalized diffusion equation, Q. J. Roy. Meteor. Soc., 127, 1815–1846, https://doi.org/10.1002/qj.49712757518, 2001. a
Weaver, A. and Ricci, S.: Constructing a background-error correlation model using generalized diffusion operators, in: Proceedings of the ECMWF Seminar Series on Recent developments in atmospheric and ocean data assimilation, pp. 8–12, ECMWF, Reading, UK, 2003. a
Winker, D., Pelon, J., Coakley Jr., J., Ackerman, S., Charlson, R., Colarco, P., Flamant, P., Fu, Q., Hoff, R., Kittaka, C., Kubar, T. L., Le Treut, H., Mccormick, M. P., Mégie, G., Poole, L., Powell, K., Trepte, C., Vaughan, M. A., and Wielicki, B. A.: The CALIPSO mission: A global 3D view of aerosols and clouds, B. Am. Meteor. Soc., 91, 1211–1230, 2010. a, b
Winker, D., Liu, Z., Omar, A., Tackett, J., and Fairlie, D.: CALIOP observations of the transport of ash from the Eyjafjallajökull volcano in April 2010, J. Geophys. Res.-Atmos., 117, D00U15, https://doi.org/10.1029/2011JD016499, 2012. a
Winker, D. M., Pelon, J. R., and McCormick, M. P.: CALIPSO mission: spaceborne lidar for observation of aerosols and clouds, in: Lidar Remote Sensing for Industry and Environment Monitoring III, vol. 4893, pp. 1–11, International Society for Optics and Photonics, 2003. a
Yu, H., Chin, M., Winker, D. M., Omar, A. H., Liu, Z., Kittaka, C., and Diehl, T.: Global view of aerosol vertical distributions from CALIPSO lidar measurements and GOCART simulations: Regional and seasonal variations, J. Geophys. Res.-Atmos., 115, D00H30, https://doi.org/10.1029/2009JD013364, 2010. a
Zhang, J. and Reid, J. S.: MODIS aerosol product analysis for data assimilation: Assessment of over-ocean level 2 aerosol optical thickness retrievals, J. Geophys. Res.-Atmos., 111, D22207, https://doi.org/10.1029/2005JD006898, 2006. a
Zhang, J., Campbell, J. R., Reid, J. S., Westphal, D. L., Baker, N. L., Campbell, W. F., and Hyer, E. J.: Evaluating the impact of assimilating CALIOP-derived aerosol extinction profiles on a global mass transport model, Geophys. Res. Lett., 38, L14801, https://doi.org/10.1029/2011GL047737, 2011. a
Zhou, Y., Sun, X., Zhang, C., Zhang, R., Li, Y., and Li, H.: 3D aerosol climatology over East Asia derived from CALIOP observations, Atmos. Environ., 152, 503–518, https://doi.org/10.1016/j.atmosenv.2017.01.013, 2017. a
- Abstract
- Introduction
- Data and analysis
- Independent observations used for the evaluation of assimilated fields
- Assimilation of CALIOP Lidar measurements during the TRAQA field campaign
- Summary and conclusion
- Data availability
- Author contributions
- Competing interests
- Special issue statement
- Acknowledgements
- Financial support
- Review statement
- References