the Creative Commons Attribution 4.0 License.
the Creative Commons Attribution 4.0 License.
 | 30 Sep 2020
Validation of XCO2 and XCH4 retrieved from a portable Fourier transform spectrometer with those from in situ profiles from aircraft-borne instruments
Hirofumi Ohyama
Isamu Morino
Voltaire A. Velazco
Theresa Klausner
Gerry Bagtasa
Matthäus Kiel
Matthias Frey
Akihiro Hori
Osamu Uchino
Tsuneo Matsunaga
Nicholas M. Deutscher
Joshua P. DiGangi
Yonghoon Choi
Glenn S. Diskin
Sally E. Pusede
Alina Fiehn
Anke Roiger
Michael Lichtenstern
Hans Schlager
Pao K. Wang
Charles C.-K. Chou
Maria Dolores Andrés-Hernández
John P. Burrows
Column-averaged dry-air mole fractions of carbon dioxide (XCO2) and methane (XCH4) measured by a solar viewing portable Fourier transform spectrometer (FTS, EM27/SUN) have been characterized and validated by comparison using in situ profile measurements made during the transfer flights of two aircraft campaigns: Korea-United States Air Quality Study (KORUS-AQ) and Effect of Megacities on the Transport and Transformation of Pollutants at Regional and Global Scales (EMeRGe). The aircraft flew over two Total Carbon Column Observing Network (TCCON) sites: Rikubetsu, Japan (43.46∘ N, 143.77∘ E), for the KORUS-AQ campaign and Burgos, Philippines (18.53∘ N, 120.65∘ E), for the EMeRGe campaign. The EM27/SUN was deployed at the corresponding TCCON sites during the overflights. The mole fraction profiles obtained by the aircraft over Rikubetsu differed between the ascending and the descending flights above approximately 8 km for both CO2 and CH4. Because the spatial pattern of tropopause heights based on potential vorticity values from the ERA5 reanalysis shows that the tropopause height over the Rikubetsu site was consistent with the descending profile, we used only the descending profile to compare with the EM27/SUN data. Both the XCO2 and XCH4 derived from the descending profiles over Burgos were lower than those from the ascending profiles. Output from the Weather Research and Forecasting Model indicates that higher CO2 for the ascending profile originated in central Luzon, an industrialized and densely populated region about 400 km south of the Burgos TCCON site. Air masses observed with the EM27/SUN overlap better with those from the descending aircraft profiles than those from the ascending aircraft profiles with respect to their properties such as origin and atmospheric residence times. Consequently, the descending aircraft profiles were used for the comparison with the EM27/SUN data. The EM27/SUN XCO2 and XCH4 data were derived by using the GGG2014 software without applying air-mass-independent correction factors (AICFs). The comparison of the EM27/SUN observations with the aircraft data revealed that, on average, the EM27/SUN XCO2 data were biased low by 1.22 % and the EM27/SUN XCH4 data were biased low by 1.71 %. The resulting AICFs of 0.9878 for XCO2 and 0.9829 for XCH4 were obtained for the EM27/SUN. Applying AICFs being utilized for the TCCON data (0.9898 for XCO2 and 0.9765 for XCH4) to the EM27/SUN data induces an underestimate for XCO2 and an overestimate for XCH4.
- Article
(3126 KB) - Full-text XML
-
Supplement
(386 KB) - BibTeX
- EndNote


Greenhouse gas (GHG) total column abundances are retrieved from ground-based high-resolution Fourier transform spectrometers (FTSs) that record solar absorption spectra in the near-infrared spectral region. Presently, there are more than 25 such FTS observation sites across the globe forming the Total Carbon Column Observing Network (TCCON) (Wunch et al., 2011a). Stringent conditions placed on instrumentation, measurement procedures, and data processing, as well as validation to the World Meteorological Organization's (WMO) standards by comparison with aircraft and AirCore profile data (Deutscher et al., 2010; Wunch et al., 2010; Messerschmidt et al., 2011; Geibel et al., 2012; Sha et al., 2020) facilitate highly accurate and precise measurements of column-averaged dry-air mole fractions of CO2 and CH4 (XCO2 and XCH4) (2σ uncertainties: 0.8 ppm for XCO2 and 7 ppb for XCH4). The TCCON data are used extensively for carbon cycle studies and play a vital role in validating space-borne data from the Greenhouse Gases Observing Satellite (Yoshida et al., 2013), the Orbiting Carbon Observatory 2 (O'Dell et al., 2018; Kiel et al., 2019), the TanSat (Liu et al., 2018), the Scanning Imaging Absorption Spectrometer for Atmospheric Chartography (Dils et al., 2014), and the TROPOspheric Monitoring Instrument (Hu et al., 2018).
The Bruker IFS 125HR is at present the most stable high-resolution FTS commercially available and is currently the primary instrument selected for use at TCCON sites. However, it is expensive, and its operation and maintenance require a large infrastructure and an experienced specialist. Within the last decade, a portable and robust FTS (Bruker EM27/SUN) was developed for GHG column measurements (Gisi et al., 2012). The EM27/SUN was mainly used in observation campaigns for the quantification of local sources and sinks of GHGs. To date, citywide campaigns were conducted in urban areas such as Berlin (Hase et al., 2015), Los Angeles (Chen et al., 2016), Paris (Vogel et al., 2019), and Tokyo (Frey et al., 2017). An additional observation campaign for satellite data validation was conducted in the desert areas of Australia (Velazco et al., 2019). Furthermore, EM27/SUN data obtained above the Atlantic Ocean (Klappenbach et al., 2015) and in boreal areas (Tu et al., 2020) have been utilized for satellite validation studies. Long-term observations have also been conducted in Africa, where operational observation by the IFS 125HR is difficult (Frey et al., 2020), and in urban areas, e.g., in Munich when deploying an automated enclosure system (Heinle and Chen, 2018).
To validate EM27/SUN data, Frey et al. (2019) compared individual EM27/SUN instruments that are located around the world with a reference EM27/SUN instrument. The reference data were scaled to be consistent with a collocated IFS 125HR in Karlsruhe, Germany (Kiel et al., 2016), and empirical correction factors for each instrument were determined for XCO2 and XCH4 data. In March 2016 our (National Institute for Environmental Studies: NIES) EM27/SUN was delivered with a single channel for CO2 and CH4 observations. In December 2017, it was sent to Bruker Optics, Inc. to add a second channel for carbon monoxide (CO) observations. A comparison with the reference EM27/SUN with both instruments operating side by side was attempted at the Karlsruhe Institute of Technology. However, consecutive periods of poor weather conditions prevented the intercomparison. In the present study, we independently validated the retrieved data products from our instrument using campaign-based aircraft measurements.
We obtained in situ aircraft profiles of CO2 and CH4 over two TCCON sites – Rikubetsu, Japan (43.46∘ N, 143.77∘ E, 380 m a.s.l.; Morino et al., 2018c), and Burgos, Philippines (18.53∘ N, 120.65∘ E, 35 m a.s.l.; Velazco et al., 2017; Morino et al., 2018b) – in the track of the transfer flights of two aircraft campaigns: the Korea-United States Air Quality Study (KORUS-AQ) and the Effect of Megacities on the Transport and Transformation of Pollutants at Regional and Global Scales (EMeRGe). Although the primary objectives of the overflights were to validate the TCCON XCO2 and XCH4 data, we also deployed our EM27/SUN at the TCCON sites during the overflights to validate the EM27/SUN data and to intercompare between the EM27/SUN and TCCON data. In this paper, we primarily focus on the validation of the EM27/SUN data by comparison with the aircraft measurements.
2.1 EM27/SUN
The EM27/SUN measures XCO2 and XCH4 values with high accuracy and precision based on solar absorption measurements (Gisi et al., 2012). The EM27/SUN features a pendulum interferometer with two corner cube mirrors and a CaF2 beam splitter and has a spectral resolution of 0.5 cm−1 (1.8 cm of optical path difference); a 127 mm parabolic mirror together with the 0.6 mm aperture defines a semi-field of view (FOV) of 2.36 mrad, corresponding to an external FOV of approximately 50 % of the apparent solar disc diameter.
In March 2016 we started making solar absorption measurements in Tsukuba, Japan (36.05∘ N, 140.12∘ E; 31 m a.s.l.), using an EM27/SUN equipped with a standard indium gallium arsenide (InGaAs) detector covering the spectral range of 5500–11 000 cm−1 operated at ambient temperature. In December 2017, the second channel with an extended InGaAs detector element and a wedged germanium filter to limit the spectral range to 4000–5500 cm−1 were added to enable CO measurements (Hase et al., 2016). One measurement consisted of 10 double-sided interferograms (5 interferograms each for forward and backward scans), which were separately integrated and recorded in DC mode with a sampling rate of 10 kHz; each measurement took approximately 60 s to complete.
The open-source software package GGG2014 was used for data processing and analysis (Wunch et al., 2015). The spectra were computed from the raw interferograms by applying a fast Fourier transform. In the course of processing, any solar intensity variations that occurred during an interferogram acquisition as well as phase errors were corrected. The central algorithm of the data processing, the GFIT nonlinear least-squares fitting algorithm, scales an a priori profile to make the best spectral fit between the measured and modeled spectra. The column abundances retrieved from the spectral fits were then computed as the product of the a priori column abundances and the derived scaling factors. The retrieved column abundances were then converted to column-averaged dry-air mole fractions by dividing them by the dry-air columns that were computed by retrieving the O2 column abundances from the same spectra. Although the solar intensity variations were corrected, only the retrieved data with solar intensity variations of less than 1 % were used for the comparisons with the aircraft data. The GGG2014 software includes air-mass-independent and air-mass-dependent correction factors for the TCCON data. The air-mass-independent correction factors (AICFs) were not utilized (i.e., they were set to one) for the analysis of the EM27/SUN data because we separately determined them for EM27/SUN in this study. Meanwhile, we used the same air-mass-dependent correction factors (ADCFs) as those applied to the TCCON data, and their validity is evaluated in Sect. 3.3.
2.2 Aircraft campaigns
The KORUS-AQ campaign is an international, multi-organization mission to observe air quality across the Korean Peninsula and surrounding seas from various platforms such as aircraft, ground sites, ships, and satellites. On 26 April 2016, the aircraft took off from the US bound for scientific observations around Korea, which began on 1 May 2016. On its transfer flight to Korea, a dedicated maneuver over Rikubetsu was performed. In situ measurements of CO2 and CH4 over the Rikubetsu TCCON site during the KORUS-AQ campaign were performed by two instruments aboard the DC-8 aircraft: the Atmospheric Vertical Observations of CO2 in the Earth's Troposphere (AVOCET) instrument using a non-dispersive infrared spectrometer (LI-COR, Inc. LI-6252) for CO2 and the Differential Absorption Carbon monOxide Measurement (DACOM) instrument based on infrared wavelength modulation spectroscopy for CH4. Calibrations of both instruments were performed during flight using standard gases traceable to the WMO scale. The sampling rates for both measurements were 1 Hz. Additional radiosonde observations (Meisei Electric Co., Ltd. RS-11G) were performed by the Japan Weather Association under a contract with the NIES to obtain pressure, temperature, and humidity profiles coincident with the aircraft CO2 and CH4 profiles.
The objective of the EMeRGe project is to investigate the impact of emissions from major population centers on air pollution at local, regional, and hemispheric scales by conducting dedicated airborne measurement campaigns. The campaigns in Europe and Asia using the High Altitude and Long Range Research Aircraft (HALO) platform were performed during the summer of 2017 (Europe) and the spring of 2018 (Asia). HALO flew over the Burgos TCCON site in the track of the transfer flight from Thailand through Manila to Taiwan on 12 March 2018. In situ CO2 and CH4 profiles, calibrated using standards traceable to the WMO scales, were measured with a cavity ring-down spectrometer (CRDS, Picarro, Inc. G1301-m) aboard HALO. Ancillary data were provided by the basic meteorological sensor package that measures pressure, temperature, and humidity.
3.1 EM27/SUN and aircraft measurements in Rikubetsu
The EM27/SUN measurements in Rikubetsu were made from the roof of the building that houses the Rikubetsu TCCON FTS on 27 April 2016. Surface meteorological data (pressure, temperature, humidity, and wind) measured by meteorological instruments deployed as a part of the TCCON station were used for analyses of the EM27/SUN data. Figure 1a shows the flight track over Hokkaido, Japan, between 01:25 and 02:30 UTC on 27 April 2016. The descending profile was measured from 10.81 to 0.10 km in ∼34 min with a spiral flight pattern over the Rikubetsu site. The ascending profile was measured up to an altitude of 11.51 km in ∼27 min in a linear manner on the west side of the Rikubetsu site. The descending and ascending profiles of both CO2 and CH4 (Fig. 1b and c) were consistent with each other up to an altitude of ∼8 km. There are missing data due to instrumental calibrations, especially between 0.24 and 2.78 km of the CO2 ascent profile (Fig. 1b). The mole fractions at higher altitudes were likely affected by an intrusion of stratospheric air, which reached approximately 8 km for the descending profile and approximately 10 km for the ascending profile, as described in more detail below. Consequently, we calculated XCO2 and XCH4 separately for ascending and descending aircraft profiles. Each profile was averaged per layer with a layer width of 0.05 km.
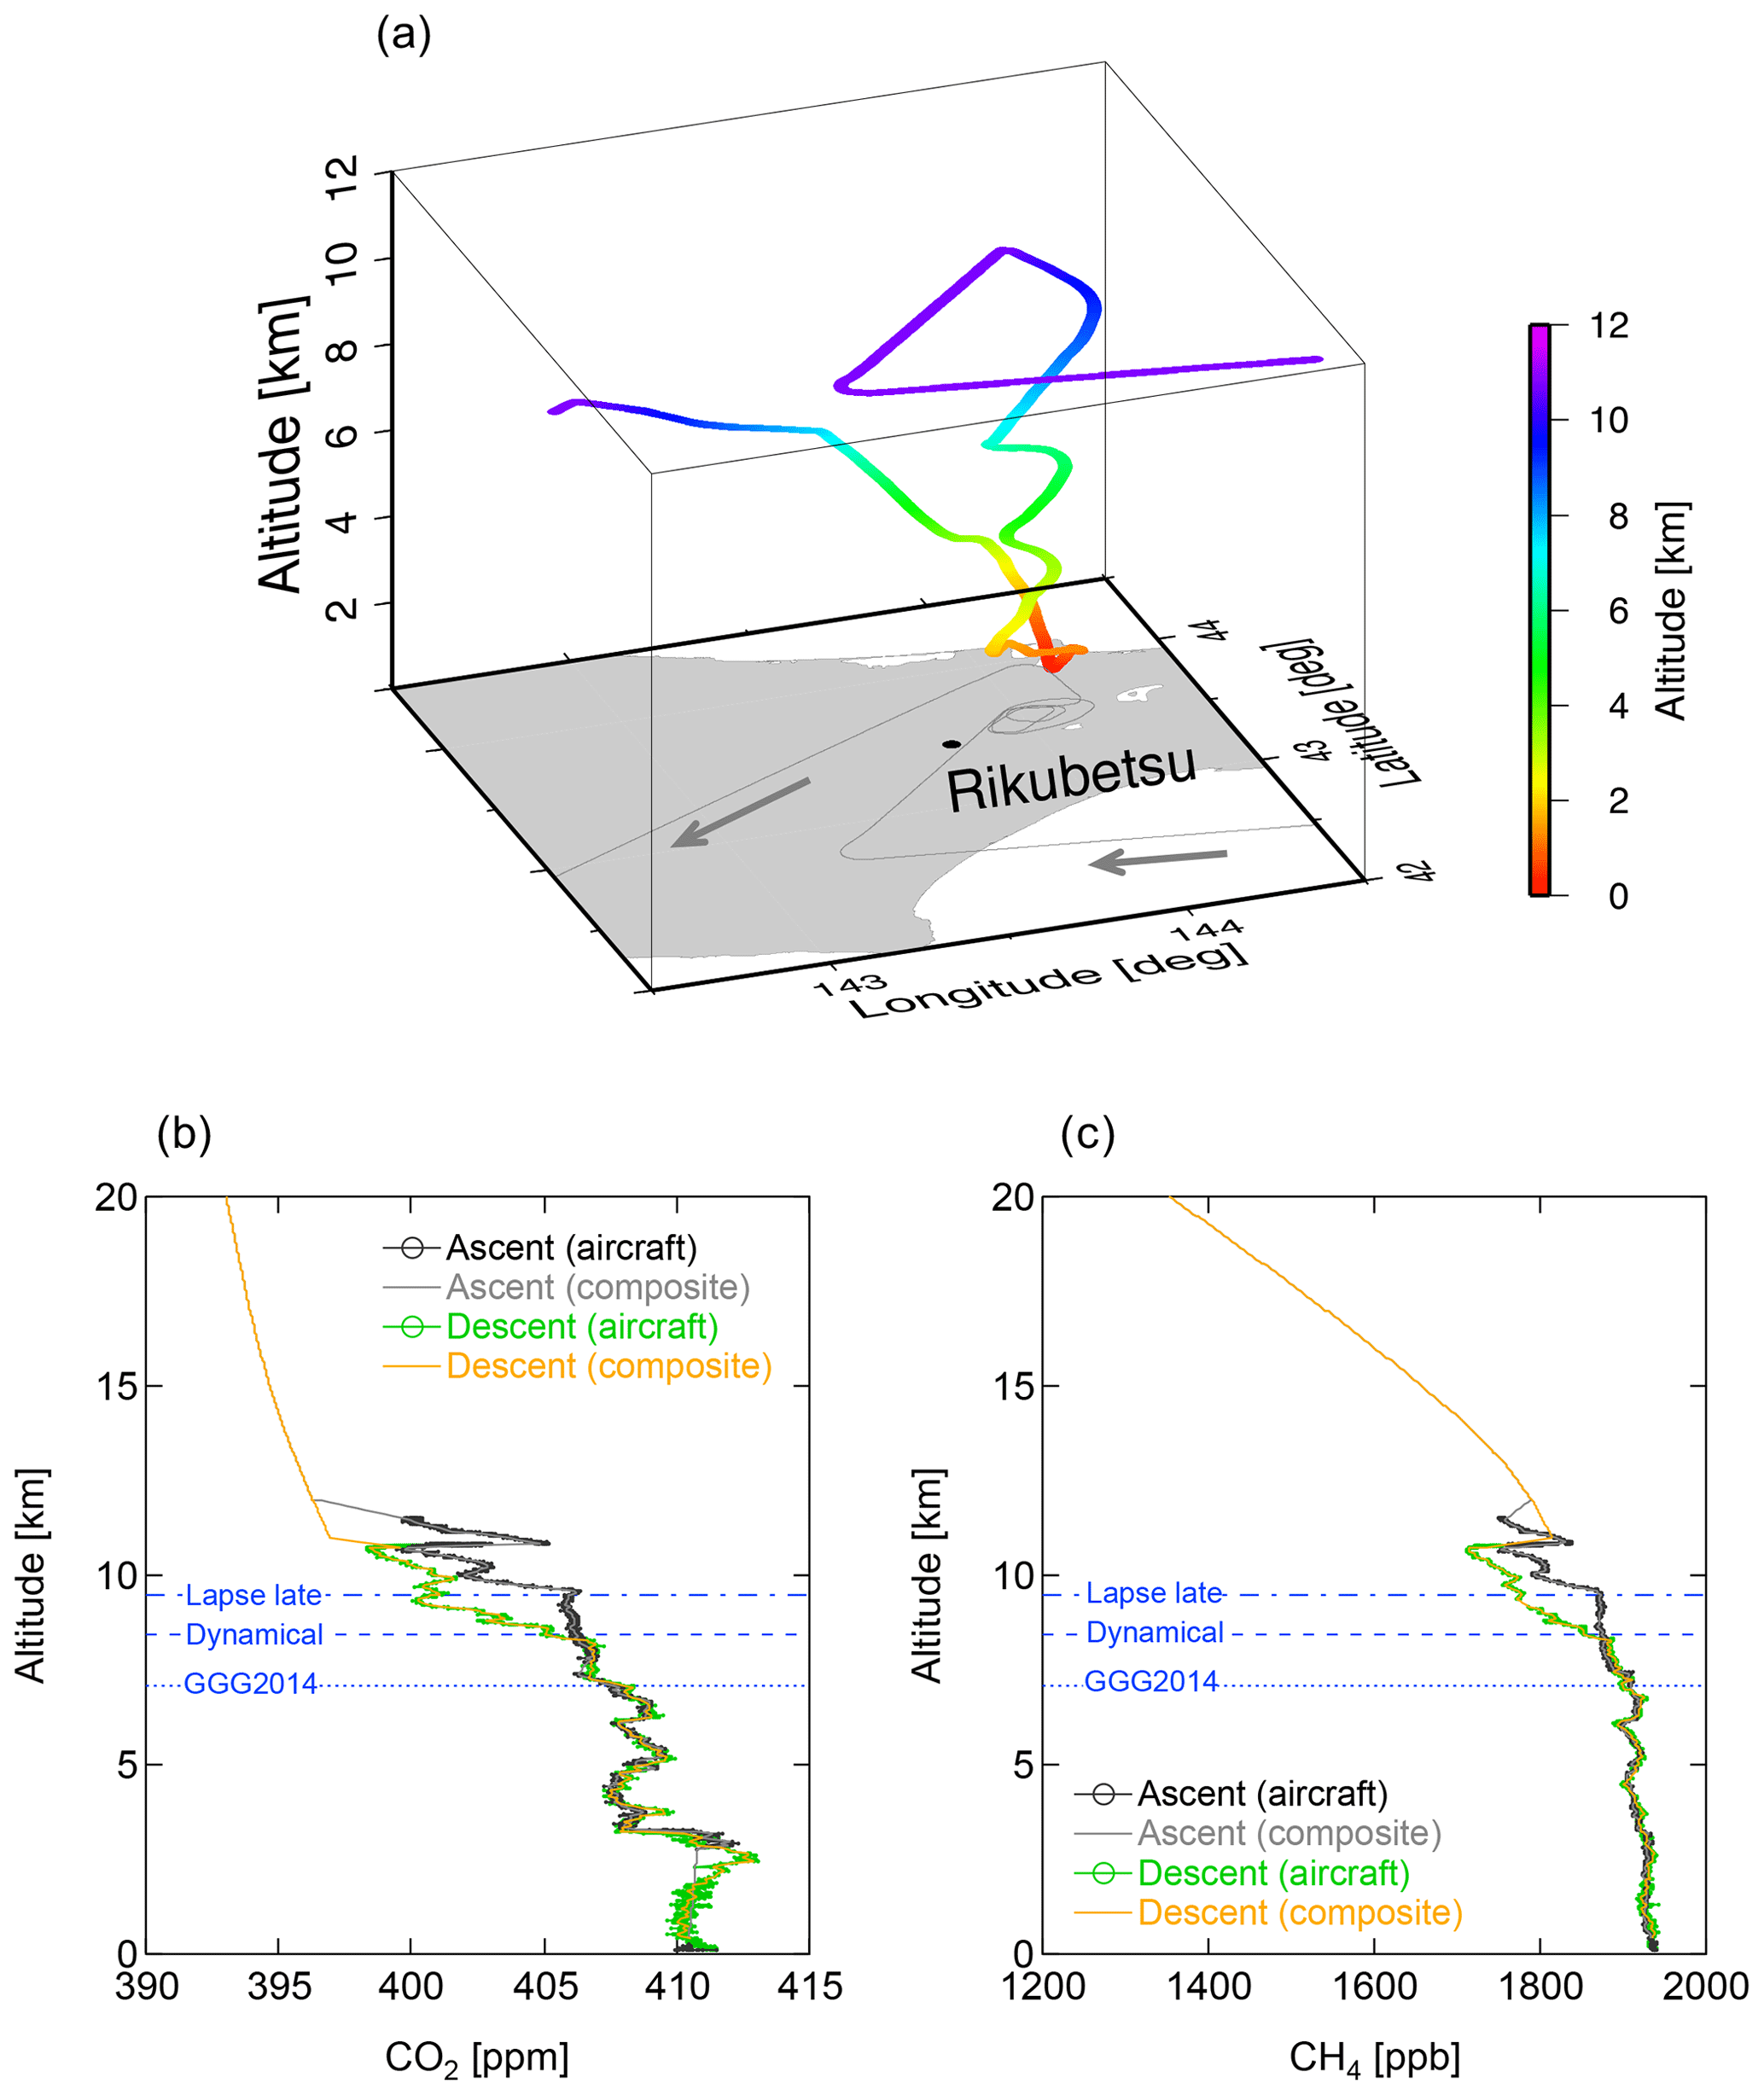
Figure 1(a) Aircraft flight track over Hokkaido, Japan, on 27 April 2016 during the KORUS-AQ campaign. The arrows indicate the flight direction, and the thin solid line represents the flight track projected on the ground. (b, c) The descending (green) and ascending (black) CO2 and CH4 mole fraction profiles measured by airborne instruments. Also shown are the descending (yellow) and ascending (gray) composite profiles that are used for calculating the column-averaged dry-air mole fractions. The horizontal lines indicate the lapse rate tropopause and the dynamical tropopause over Rikubetsu at 03:00 UTC and the GGG2014-derived tropopause over Rikubetsu.
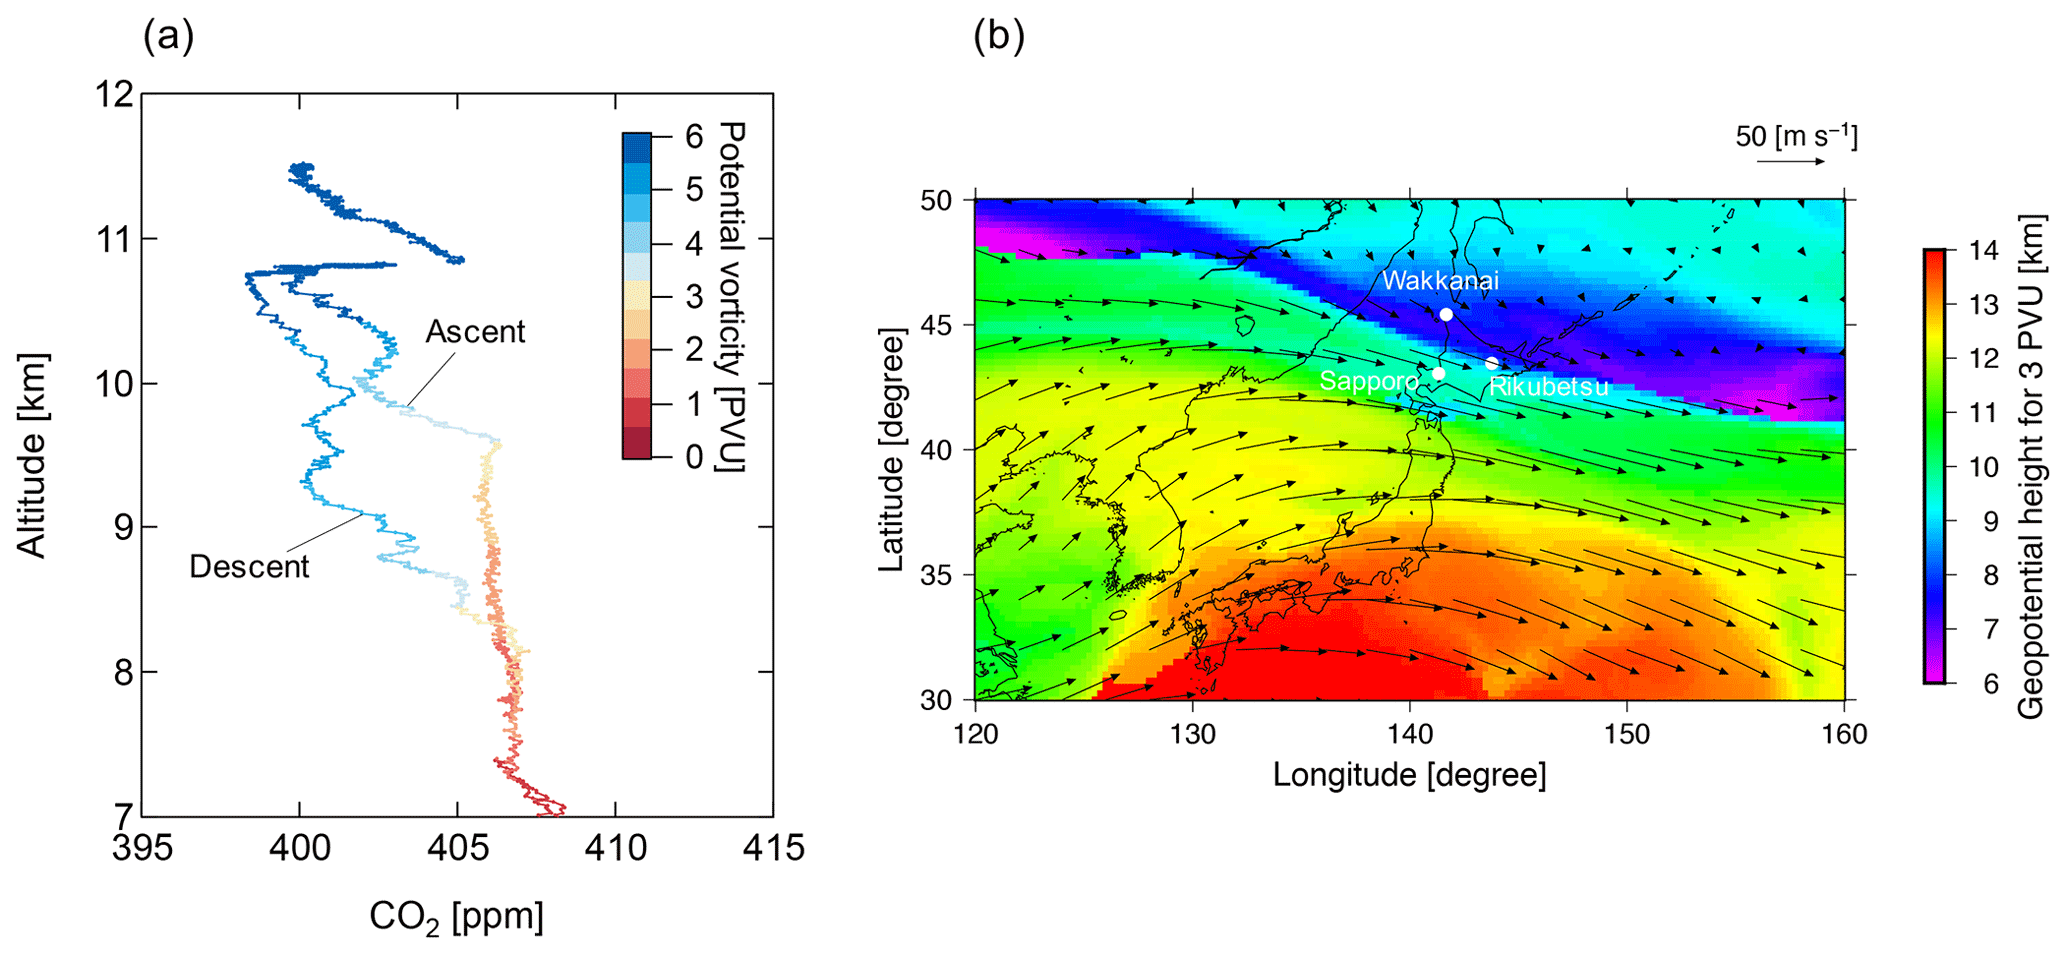
Figure 2(a) The CO2 profiles above 7 km over Rikubetsu. Colors denote the potential vorticity values from ERA5 (see text for details). (b) The ERA5 geopotential height (color scale) and winds (vectors) at the 3 PVU level on 27 April 2016, 02:00 UTC, are shown. White dots indicate the locations of Rikubetsu and two radiosonde stations in Hokkaido operated by the Japan Meteorological Agency (Sapporo and Wakkanai).
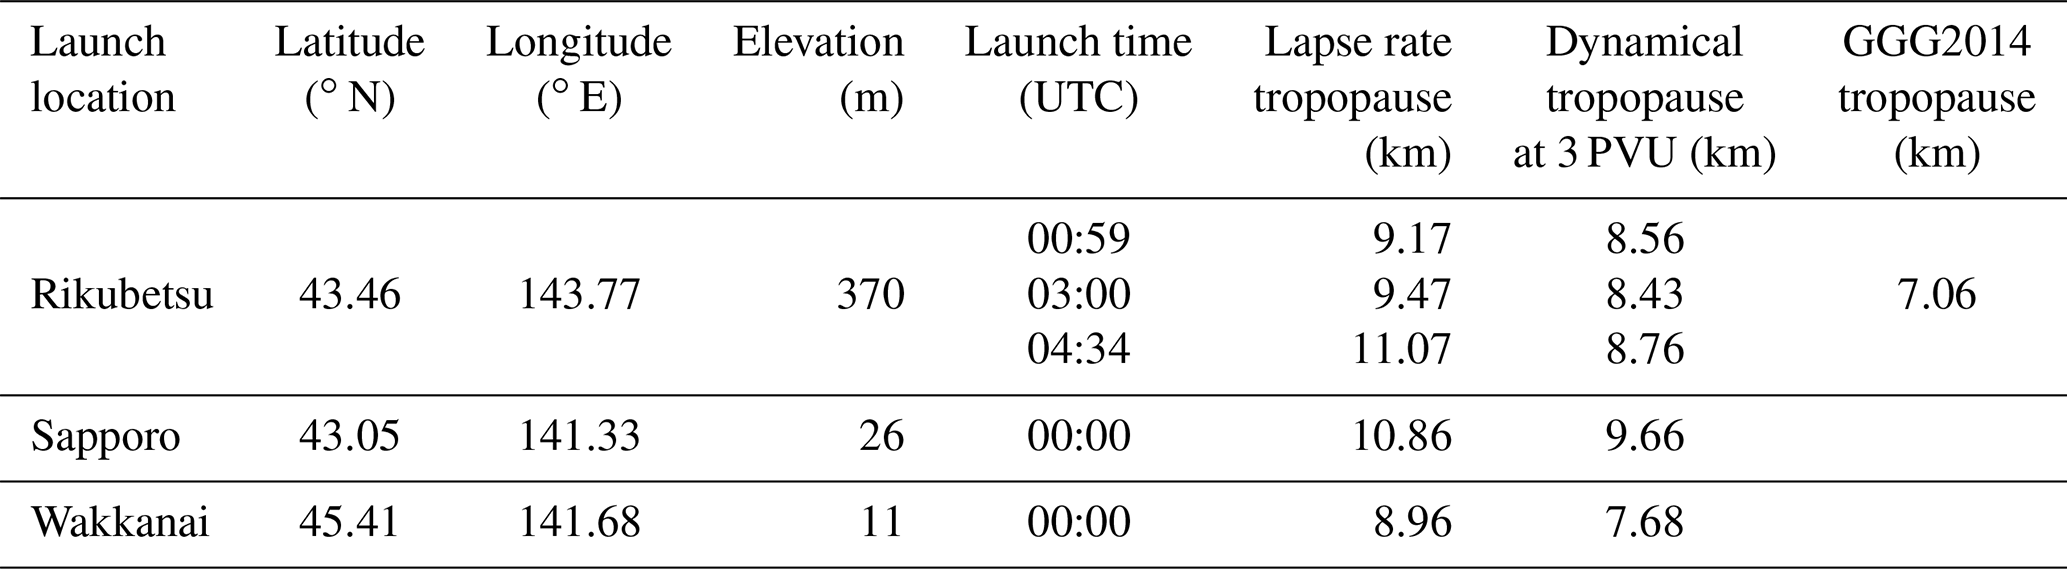
We examined the causes of the differences between the descending and ascending profiles in order to determine which profiles should be used for the comparison with the EM27/SUN. For the aircraft data, the potential vorticity, which has been previously used as an indicator to determine the tropopause height (Trickl et al., 2011), was investigated along the aircraft tracks. The potential vorticity was calculated from the European Centre for Medium-Range Weather Forecasts (ECMWF) fifth-generation reanalysis (ERA5) with a spatial resolution of ∘ and a temporal resolution of 1 h (C3S, 2017). Figure 2a shows the CO2 profiles obtained from the aircraft-borne measurements above 7 km over Rikubetsu, color-coded by the corresponding potential vorticity values. We found that when the potential vorticity was greater than approximately 3 PVU (potential vorticity units; 1 PVU = 10−6 m2 s−1 K kg−1), the CO2 and CH4 mole fractions began to decrease. We, therefore, assumed that the air masses with potential vorticity values of more than 3 PVU were of stratospheric origin and that the tropopause height corresponded to 3 PVU. Figure 2b shows the latitude–longitude cross section of the geopotential height corresponding to the potential vorticity of 3 PVU at 02:00 UTC on 27 April 2016, and the altitude–longitude cross section of the potential vorticity averaged between 42 and 45∘ N is shown in Fig. S1 in the Supplement. A strip-shaped subsidence of the tropopause (tropopause fold) occurred over Hokkaido, and the southern border of the tropopause fold occurred over Rikubetsu. The tropopause fold has been observed to form on the north side of the upper tropospheric jet stream (Holton et al., 1995), and this is apparent in Fig. 2b. In the northern extratropics, e.g., Hokkaido, the tropopause fold most frequently occurs from April to June (Stohl et al., 2003). We compared the tropopauses based on the potential vorticity (dynamical tropopauses) with those determined by radiosonde temperature data (lapse rate tropopauses): the two types of tropopauses were spatially consistent (Table 1). The dynamical tropopause over Sapporo was higher than those over Rikubetsu and Wakkanai and was similar to the dynamical tropopause for the ascending profile. Because the dynamical tropopause over Rikubetsu was consistent with that of the descending profile, we decided to compare the descending profile with the EM27/SUN data.
Table 1Summary of radiosonde observations in Hokkaido, Japan, on 27 April 2016. The last two columns show the dynamical tropopause from the ERA5 potential vorticity values and the GGG2014-derived tropopause.
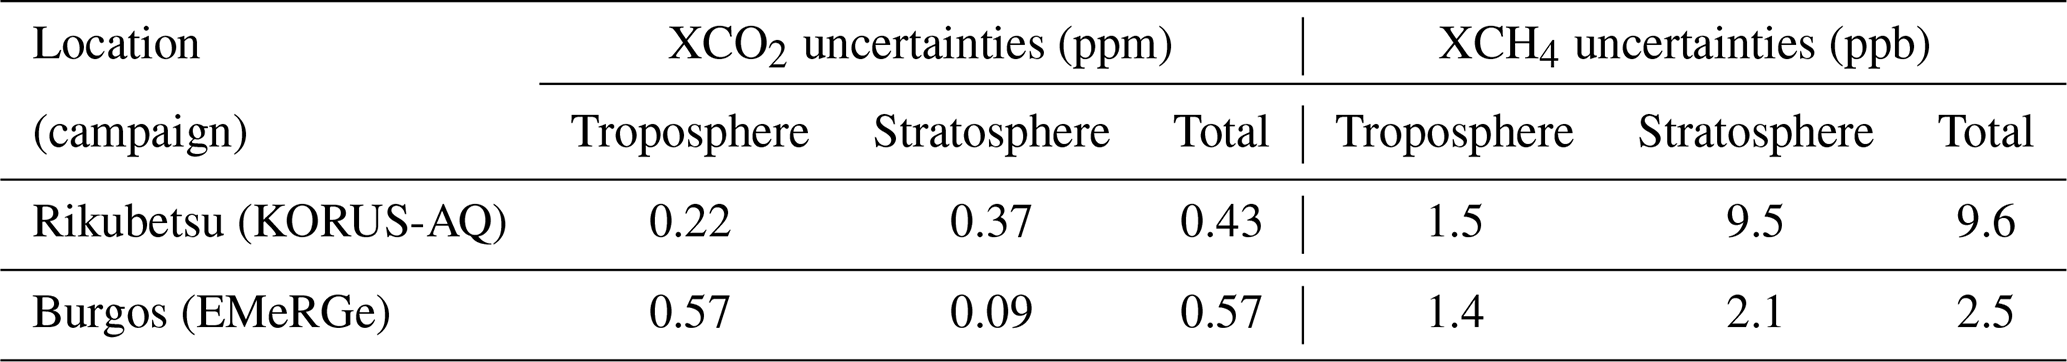
Although the altitude range of the descending flight around Rikubetsu was limited to 0.10–10.81 km, the aircraft data covered the entire troposphere above the altitude of the ground-based instruments (elevation of the instrument: 0.38 km); consequently, there was no need to extrapolate the aircraft data in the troposphere. The aircraft data were connected to the a priori profile in the GGG2014 above ceiling heights (i.e., in the stratosphere). The a priori profiles are created on the basis of tropopause height from the National Centers for Environmental Prediction reanalysis (Wunch et al., 2015). The a priori profile was shifted in an altitude as a function of the retrieved scaling factor of hydrogen fluoride to make the profile more proper (Wunch et al., 2010), before being connected with the aircraft data. We refer to the shifted tropopause height as the GGG2014-derived tropopause height (Table 1). To investigate uncertainties in the aircraft XCO2 and XCH4 data, we performed a sensitivity analysis in which we perturbed each source of uncertainty (i.e., measurement uncertainty and tropopause height) by a realistic amount and compared the resulting XCO2 and XCH4 with the corresponding unperturbed case. We separated the sources of uncertainties into tropospheric and stratospheric parts, and the total uncertainty was estimated as a root sum square of each part. We estimated the uncertainties in the aircraft CO2 data to be 0.27 ppm from the square root of the sum of the squares of both a precision of 0.1 ppm and an accuracy of 0.25 ppm (Vay et al., 2011; Tang et al., 2018). The uncertainty in the stratospheric CO2 mole fraction was estimated to be 0.3 %, and the perturbed CO2 profile was created by shifting the a priori profile up by 1 km and adding 0.3 % uncertainty to the a priori profile (Wunch et al., 2010). For CH4, the uncertainty in the aircraft data was estimated to be 0.1 % (https://www-gte.larc.nasa.gov/pem/DACOM.htm, last access: 5 September 2019). The perturbed CH4 profile was created by shifting the a priori profile up by 1 km. The estimated uncertainties in aircraft XCO2 and XCH4 are listed in Table 2.

Figure 3(a) Aircraft flight track over the Philippines on 12 March 2018 during the EMeRGe campaign. The arrows indicate the flight direction, and the thin solid line represents the flight track projected on the ground. (b, c) The descending (green) and ascending (black) CO2 and CH4 mole fraction profiles measured by airborne instruments. The composite profiles for the descent (yellow) and ascent (gray) flights that are used for calculating their column-averaged dry-air mole fractions and the GGG2014-derived tropopause over Burgos (blue) are also shown.
3.2 EM27/SUN and aircraft measurements in Burgos
The EM27/SUN was located next to a TCCON FTS container in Burgos, Ilocos Norte, Philippines, during the period 7–13 March 2018. The flight track over the Philippines between 08:21 and 10:41 UTC on 12 March 2018 is shown in Fig. 3a. The descending profile was measured from 6.47 to approximately 0.6 km in ∼20 min approaching the Burgos site from south to northeast. The low-level flight at approximately 0.6 km was performed as near as possible to the north side of the Burgos site for ∼9 min. The ascending profile was measured up to 9.32 km in ∼11 min after the low-level flight west of the Burgos site. Additional data for the profiles above 6.47 (descent flight) and 9.32 km (ascent flight) were taken from the same aircraft data measured during the descent flight lasting for ∼10 min from an altitude of 13.87 km west of Manila. Figure 3b and c show the descending and ascending profiles of CO2 and CH4. Because the aircraft data were limited to 0.6–13.87 km, the aircraft data needed to be extrapolated to both the surface (elevation of the EM27/SUN instrument: 0.035 km) and the tropopause height (GGG2014-derived tropopause height: 14.08 km) using realistic assumptions. Above the ceiling altitude of the aircraft, the aircraft data in the highest layer were extrapolated to the tropopause height and then connected to the a priori profile. Below the lowest flight altitude, the average values of aircraft data during the low-level flight near the Burgos site (less than 0.55 km) were linearly extrapolated to the surface. The static pressure and temperature values and water vapor mixing ratios, recorded by airborne instruments, were used to calculate the aircraft XCO2 and XCH4 values. For pressure, temperature, and water vapor values below and above the aircraft altitude, we used nearby (Laoag, Philippines) radiosonde measurements and the GGG2014 a priori profile, respectively.
Compared to the profiles over Rikubetsu (Fig. 1b and c), the CO2 and CH4 mole fraction profiles obtained from the descending and ascending flights over Burgos differed substantially, notably in the lower troposphere. To explore the reasons for these differences, the spatial CO2 distribution in the lower troposphere around the Burgos site was investigated using output from the Weather Research and Forecasting Model coupled with Chemistry (WRF-Chem) GHG tracer model (Skamarock et al., 2008) run with 5 d spin-up time (Bagtasa, 2011). The meteorological initial and boundary conditions for the simulation in this study were taken from the National Centers for Environmental Prediction (NCEP) Final (FNL) Operational Model Global Tropospheric Analyses data with a spatial resolution of ∘ and a temporal resolution of 6 h (http://rda.ucar.edu, last access: 5 September 2019). WRF-Chem downscales the NCEP FNL reanalysis data to a finer spatial resolution of 5 km at 3 h intervals. Figure 4a shows the simulated CO2 mole fraction averaged between the surface and 3 km altitude at 09:00 UTC on 12 March 2018. The simulation domain includes Japan, Korea, China, Taiwan, and parts of Southeast Asia including mainland Southeast Asia (former Indochina) and the Philippines. The CO2 emissions from fossil fuel combustion were taken from the Open-source Data Inventory for Anthropogenic CO2, version 2018 (Oda and Maksyutov, 2015). Furthermore, the CO2 mole fractions in the smaller region shown in Fig. 4b were simulated at 1 h intervals and 1 km resolution. Output from WRF-Chem shows that northeast wind was dominant on the east side of the Philippines, where there are no large emission sources. Luzon island disrupted the northeast wind, consequently lowering wind speeds in the west of central Luzon. This disruption of wind flow possibly induced high CO2 concentrations related to long residence times to the west of central Luzon. The simulated CO2 concentrations below 3 km west of the Burgos site (i.e., in the ascending flight area) are a few parts per million higher relative to the background (Fig. 4b), and the high CO2 also seems to have originated in central Luzon, an industrialized and densely populated region about 400 km south of the Burgos TCCON site. The Burgos TCCON site is located on a wind farm, and the whole province of Ilocos Norte has been designated as a “coal-free” province; therefore strong point sources such as coal-fired power plants are absent in this region (Velazco et al., 2017). Because air mass properties observed with the EM27/SUN at the Burgos TCCON site are more consistent with those associated with the descending profiles rather than the ascending profiles, the descending profiles were used for the comparison with the EM27/SUN data. Additionally, we note that the overflight time was just after sundown (approximately 10:00 UTC), and therefore the descending flight toward Burgos was closer in time to the EM27/SUN measurements.
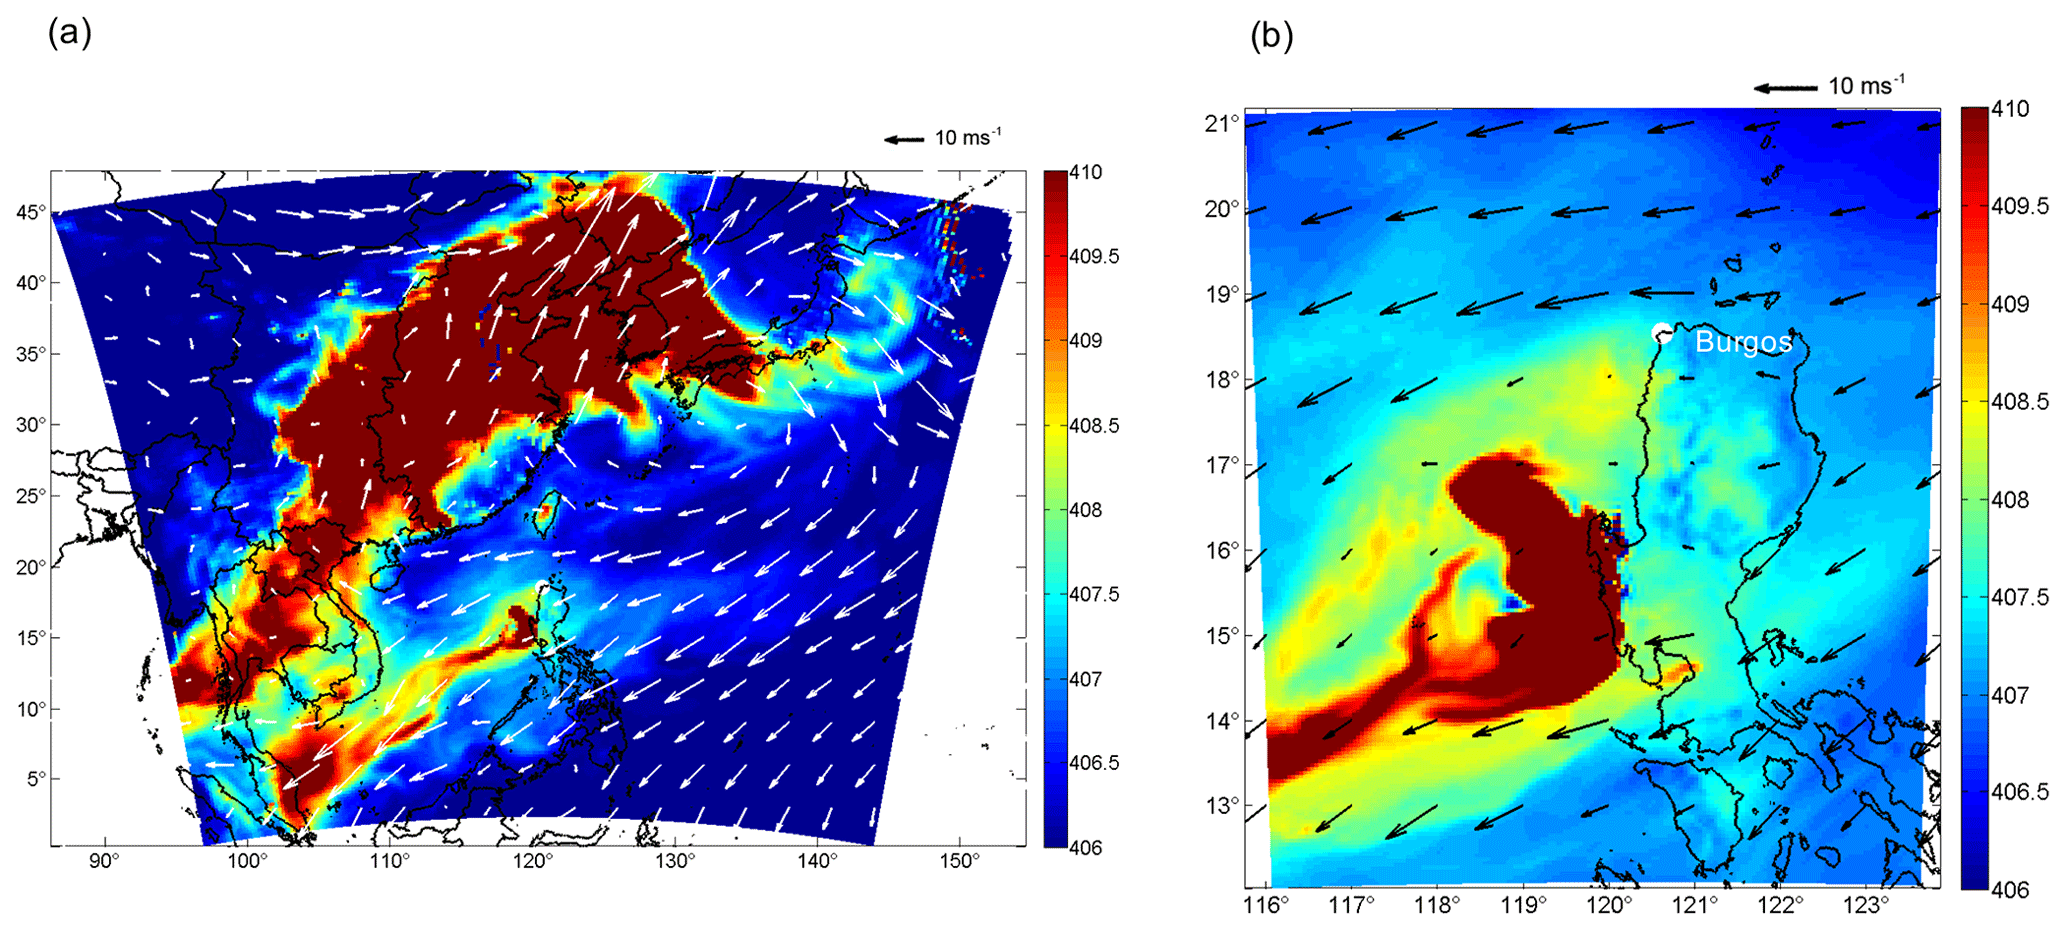
Figure 4(a) Mean CO2 mole fractions and wind vectors from the surface to 3 km altitude over Japan, Korea, China, Taiwan, and parts of Southeast Asia at 09:00 UTC on 12 March 2018, simulated by the Weather Research and Forecasting Model. (b) Same as (a) but for a magnified section over the Philippines at 10:00 UTC.
The total measurement uncertainty in aircraft CO2 data obtained with the Picarro analyzer G1301-m was estimated to be 0.5 ppm following the calibration procedure described by Klausner et al. (2020), and the uncertainty in the CO2 data extrapolated to the surface was estimated to be 1.8 ppm on the basis of standard deviations of the average values. The CO2 concentrations during the low-level flight were quite variable. This behavior is attributed to local emissions and biosphere exchange. For the CH4 measurements the uncertainty in aircraft data was estimated to be 1.4 ppb, and the uncertainty in the extrapolated data was estimated to be 3.0 ppb. We estimated the contributions of the stratospheric parts to the XCO2 and XCH4 uncertainties using methods similar to the Rikubetsu cases. Table 2 lists the estimated aircraft XCO2 and XCH4 uncertainties. We found that the uncertainties in the tropospheric dry columns over Burgos were larger than those over Rikubetsu because the aircraft data over Burgos had to be extrapolated to the surface where CO2 concentrations were more variable. In contrast, the uncertainties in the stratospheric dry columns were larger over Rikubetsu than Burgos because the tropopause height over Rikubetsu was 7.2 km lower (in the case of GGG2014 tropopause height) and, thus, the stratospheric part larger than that over Burgos.
3.3 Stability and air mass dependence of EM27/SUN measurements
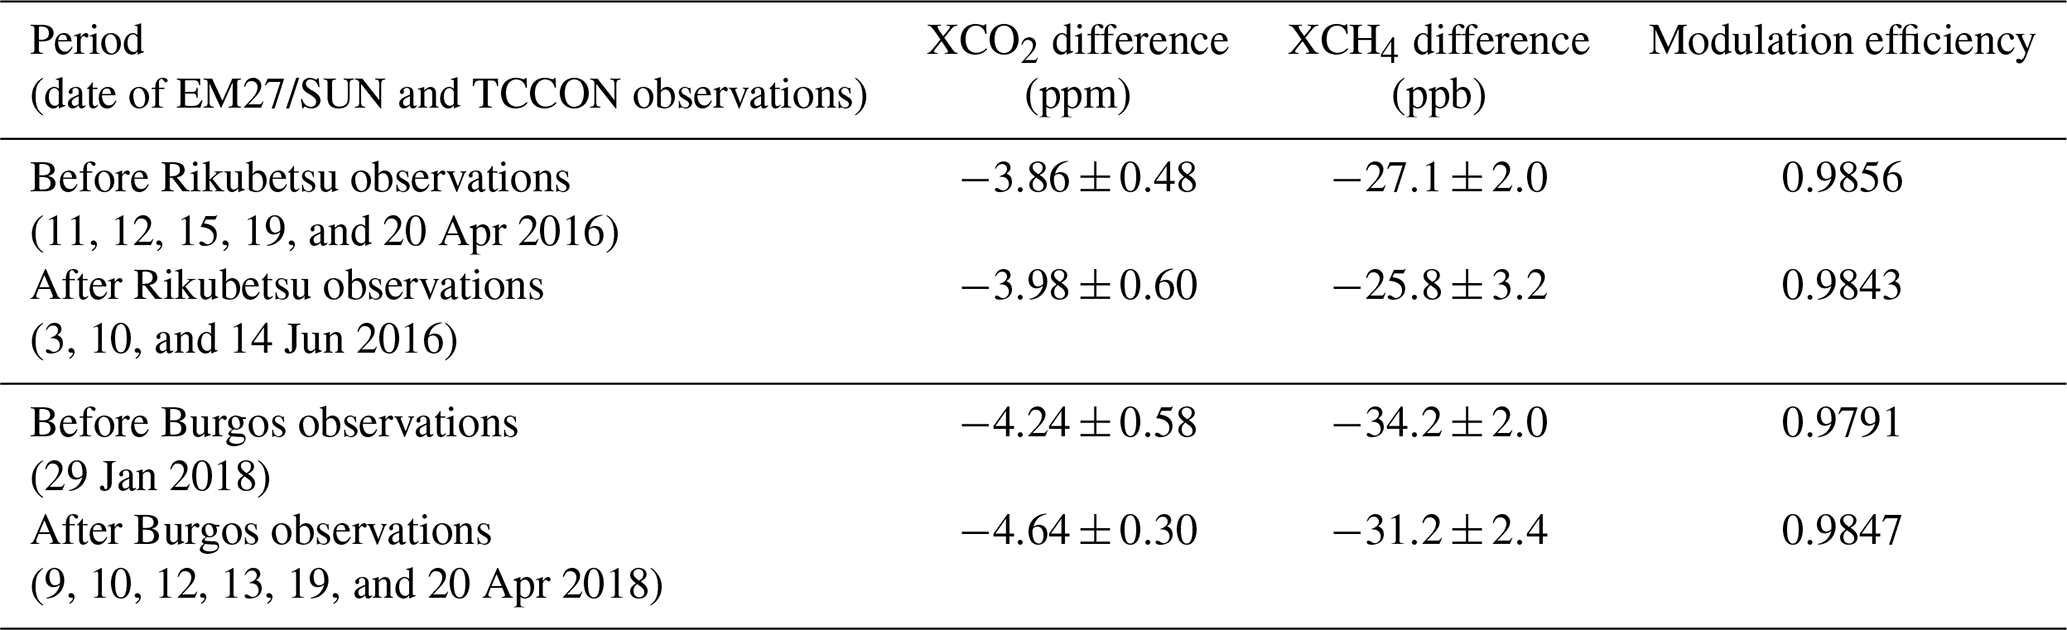
To evaluate the extent of instrument drifts of the EM27/SUN due to transporting the instruments (hereafter “transports”), the instrumental line shape (ILS) of the EM27/SUN was evaluated before and after the solar absorption measurements in Rikubetsu and Burgos. We performed indoor open-path measurements of water vapor absorption lines (Frey et al., 2015) obtained in Tsukuba and analyzed the spectra utilizing the LINEFIT v14.5 software (Hase et al., 1999). The LINEFIT analysis of the data determines two ILS parameters, modulation efficiency, and phase error defined by a function of optical path difference, which represent line broadening/narrowing and asymmetry, respectively. Before and after the solar absorption measurement in Rikubetsu, the modulation efficiency changed from 0.9856 to 0.9843, and the phase error changed from 0.0025 to 0.0022 rad. In the case of the transport to and from Burgos, the modulation efficiency changed from 0.9791 to 0.9847, while the phase error changed from 0.0028 to 0.0025 rad. Because a change in modulation efficiency of 0.01 induces a change in XCO2 of 0.15 % (Frey et al., 2015), the change in modulation efficiency due to transport between Tsukuba and Rikubetsu/Burgos had little impact (<0.1 %) on the retrievals.
Table 3The differences in XCO2 and XCH4 between the EM27/SUN and Tsukuba TCCON data (EM27/SUN minus TCCON) before and after the transports of the EM27/SUN instrument. Note that correction factors are applied to only TCCON data. Also shown is the modulation efficiency of the EM27/SUN ILS.
As an additional evaluation of the instrument drifts, we examined the differences from the Tsukuba TCCON data (Morino et al., 2018a) before and after the EM27/SUN transports to Rikubetsu and Burgos. The TCCON data were also analyzed with the GGG2014 software. We note that all the TCCON data used in the present study are scaled by AICFs, which were derived from aircraft in situ data in the past (Wunch et al., 2010, 2015). The retrieved XCO2 and XCH4 data were averaged into 10 min bins for each instrument. To compare different remote sensing data sets, the differences in the a priori profile and the column-averaging kernels must be taken into account (Rodgers and Connor, 2003). The column-averaging kernels represent the altitude-dependent sensitivity of the retrieved total column to the perturbation of mole fraction at a given altitude. Because the a priori profile was common for the EM27/SUN and TCCON analyses, only the difference in the column-averaging kernel should be considered by adjusting the TCCON data. We denote the EM27/SUN and TCCON by subscripts 1 and 2, respectively, and the TCCON column-averaged value adjusted to the EM27/SUN column-averaging kernel a1, can be expressed by the following equation (Rodgers and Connor, 2003; Wunch et al., 2011b):
where ca is the a priori column-averaged value, is the retrieved TCCON column-averaged value, h is the pressure-weighting function, xa is the a priori profile, and j represents the altitude level. The overall column-averaging kernels of EM27/SUN and TCCON FTS depending on solar zenith angle are shown in Hedelius et al. (2016). According to analyses using the Tsukuba TCCON data on 3 June 2016 (29 January 2018), the overall differences ( between the adjusted TCCON value and the original TCCON value are 0.04±0.08 ppm (0.06±0.02 ppm) for XCO2 and 1.64±2.44 ppb (0.33±0.20 ppb) for XCH4. From these results, we find that the effect of the difference in column-averaging kernel has little impact on the comparison between the EM27/SUN and the TCCON data, and we decided to compare the EM27/SUN data with the original TCCON data. Table 3 summarizes the differences between the EM27/SUN and TCCON data before and after the transports. Note that only the TCCON data are corrected by the AICFs. The changes in the XCO2 differences are less than 0.4 ppm for the transports to and from both Rikubetsu and Burgos, while the changes in the XCH4 differences are less than 3.0 ppb. Thus, the influence of EM27/SUN transports on the XCO2 and XCH4 retrievals are comparable to their 2σ uncertainties (0.6 ppm for XCO2 and 2.2 ppb for XCH4; Frey et al., 2019).
As described in Sect. 2.1, we applied the GGG2014 ADCFs to the EM27/SUN retrievals. The ADCF is a coefficient tied to a symmetric basis function (Eq. A12 in Wunch et al., 2011a) representing spurious diurnal variation, and the values derived from the TCCON data at multiple sites are for XCO2 and 0.0053±0.0080 for XCH4 (Wunch et al., 2015). To assess the relevance of applying the ADCFs derived from the TCCON data to the EM27/SUN data, we derived the ADCF for our EM27/SUN, such that the difference between the EM27/SUN and TCCON retrievals in Burgos that were individually averaged into 10 min bins is minimized while taking into account a coefficient for correcting the mean bias between EM27/SUN and the TCCON data. The derived ADCFs are for XCO2 and 0.0031±0.0007 for XCH4 (the uncertainties were estimated as 1σ standard deviations of daily ADCFs derived from 4 d side-by-side observations in Burgos). The ADCFs for XCO2 show good agreement between the EM27/SUN and the TCCON, while those for XCH4 show a slightly larger difference. Considering that the ADCFs for our instrument are consistent with those for the TCCON data within the uncertainties and that the ADCFs have the possibility to vary with the seasons and sites (Wunch et al., 2015), we conclude that the use of the mean ADCFs derived from the TCCON data is a reasonable choice.
3.4 Comparisons of EM27/SUN with aircraft data
To compare the EM27/SUN data with the aircraft data, the aircraft column-averaged value was calculated by considering the column-averaging kernels and the a priori values of EM27/SUN analysis:
where xin situ is the in situ aircraft profile and γ is the scaling factor for the EM27/SUN retrieval. The EM27/SUN data recorded within ±1 h of the aircraft measurements were averaged. The EM27/SUN column-averaging kernel in Eq. (2) was obtained by averaging those values for multi-retrieval windows within ±1 h of the aircraft measurement. Applying the column-averaging kernel to the integration of the aircraft data modifies the raw aircraft XCO2 (XCH4) value by +0.15 ppm (−0.22 ppb) for the Rikubetsu overflight and +0.06 ppm (+0.35 ppb) for the Burgos overflight. We assumed the measurement time for the aircraft to be the measurement time at the lowermost altitude. Since a common column-averaging kernel is applied to the descending and ascending profiles, the differences in calculated aircraft XCO2 and XCH4 data between the descent and ascent flights result solely from the difference in concentrations between the two profiles.
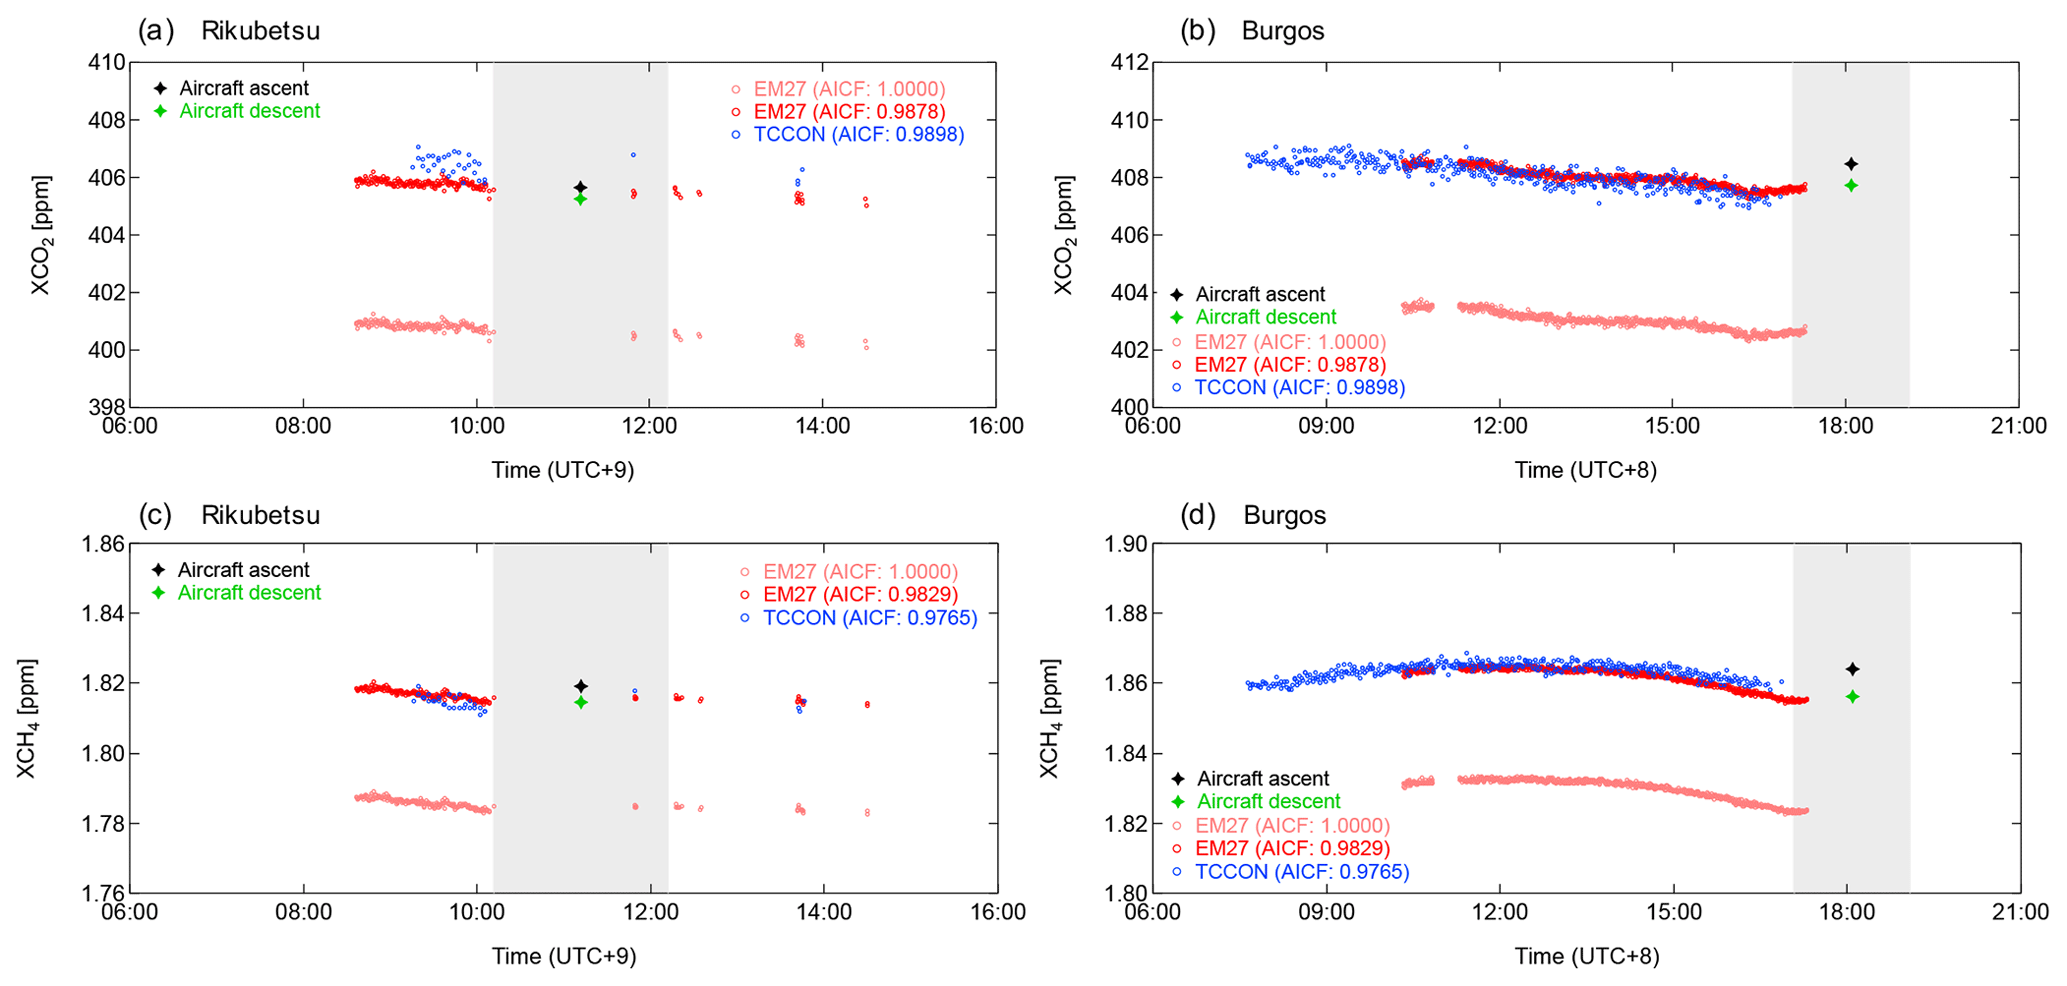
Figure 5(a, b) XCO2 and (c, d) XCH4 values measured by the EM27/SUN, TCCON, and airborne instruments over (a, c) Rikubetsu on 27 April 2016 and (b, d) Burgos on 12 March 2018. The aircraft XCO2 and XCH4 values are calculated separately for the descending (green) and ascending (black) profiles shown in Figs. 1 and 3. Shown are the EM27/SUN values without air-mass-independent correction factors (AICFs = 1) and with them (AICFs ≅ 1). The EM27/SUN data within the light gray shaded areas indicate ±1 h of the aircraft measurements and are used for determining the AICFs.
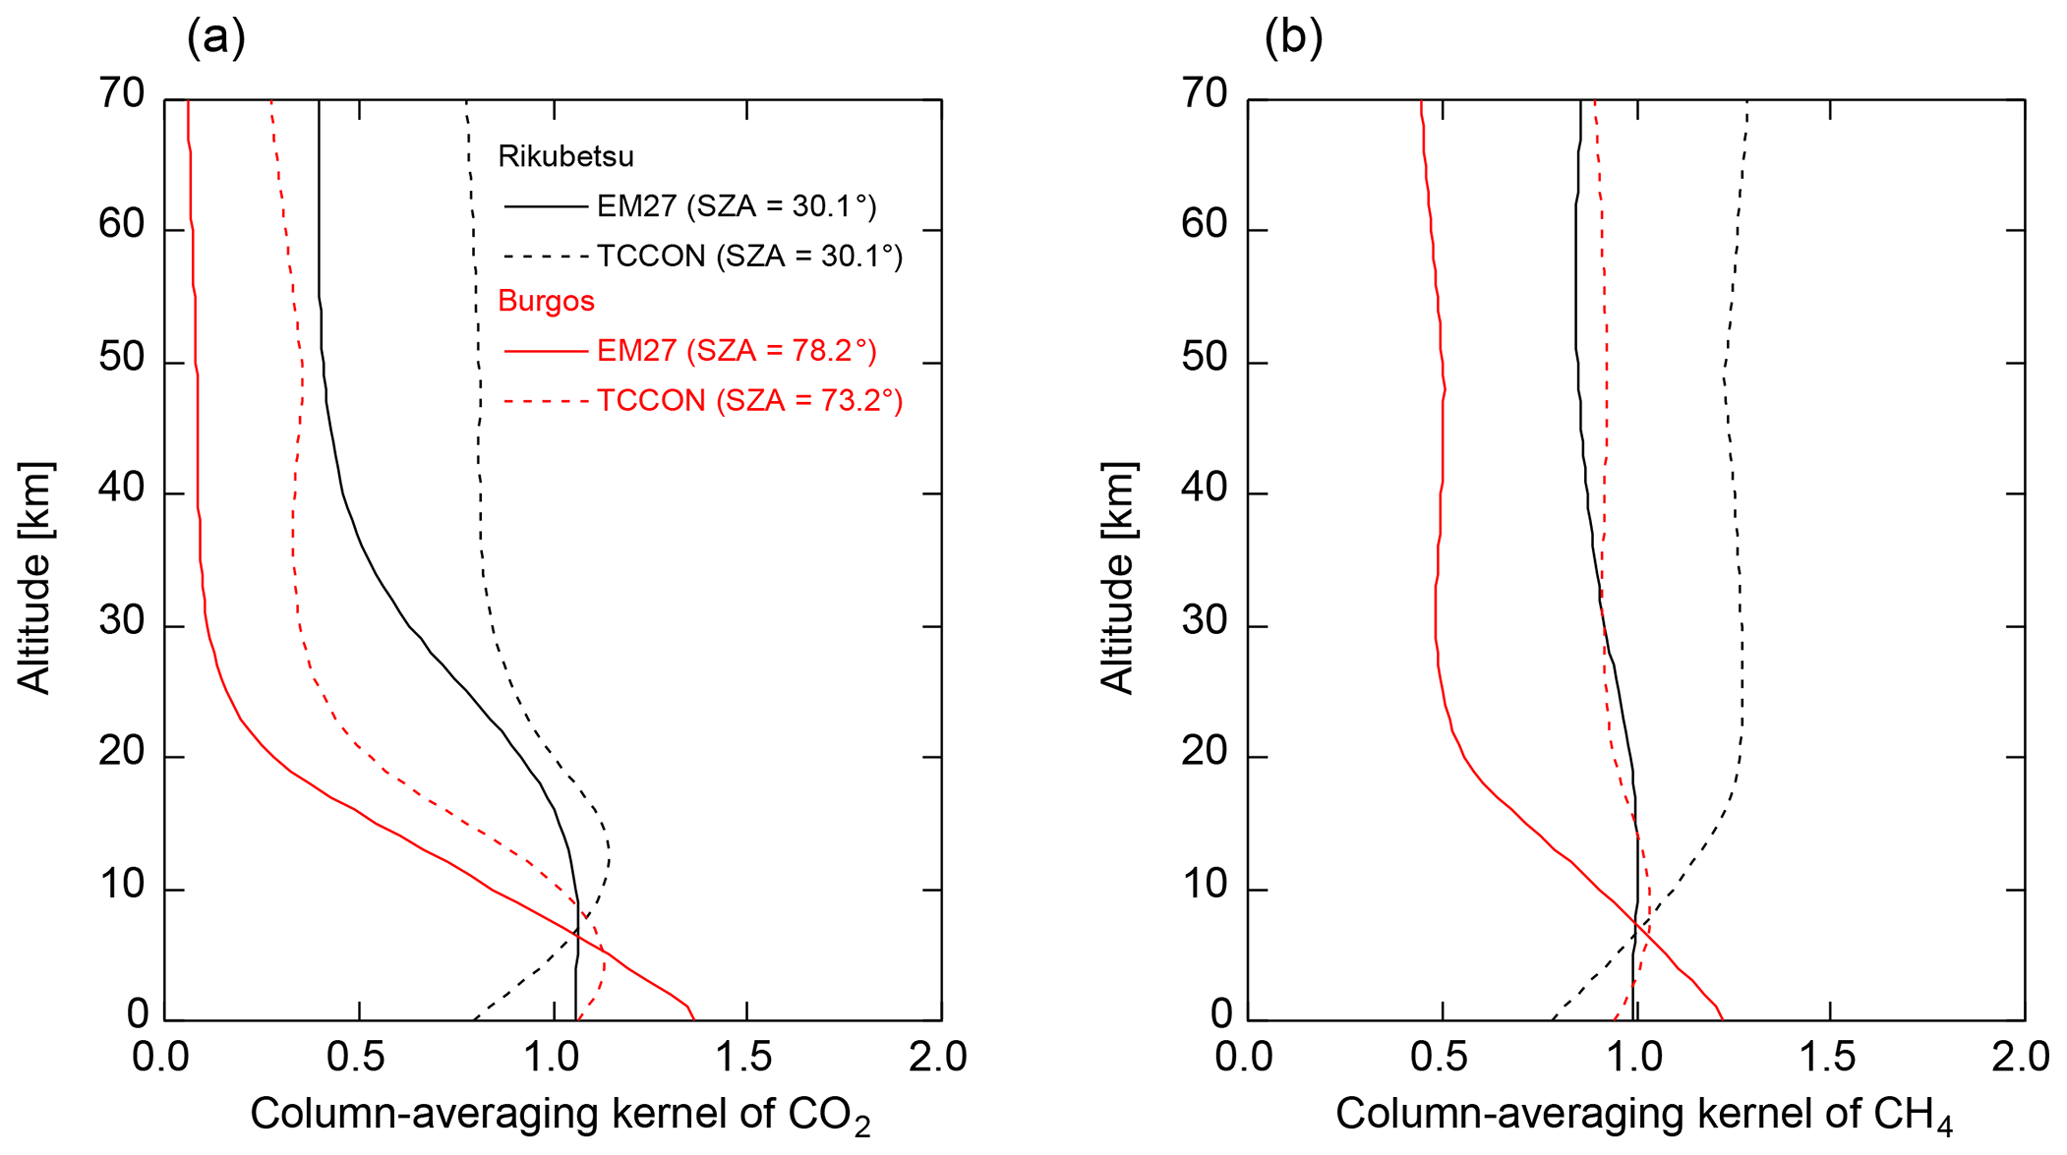
Figure 6Column-averaging kernels of (a) CO2 and (b) CH4 retrievals from the EM27/SUN and TCCON spectra, which are used for calculating the aircraft XCO2 and XCH4 values over Rikubetsu (black) and Burgos (red).
Table 4Comparison of EM27/SUN data with aircraft XCO2 and XCH4 data. The air-mass-independent correction factors derived in this study are not yet applied to the EM27/SUN data. The relative differences are calculated as follows: (EM27/SUN − aircraft)/aircraft ×100.
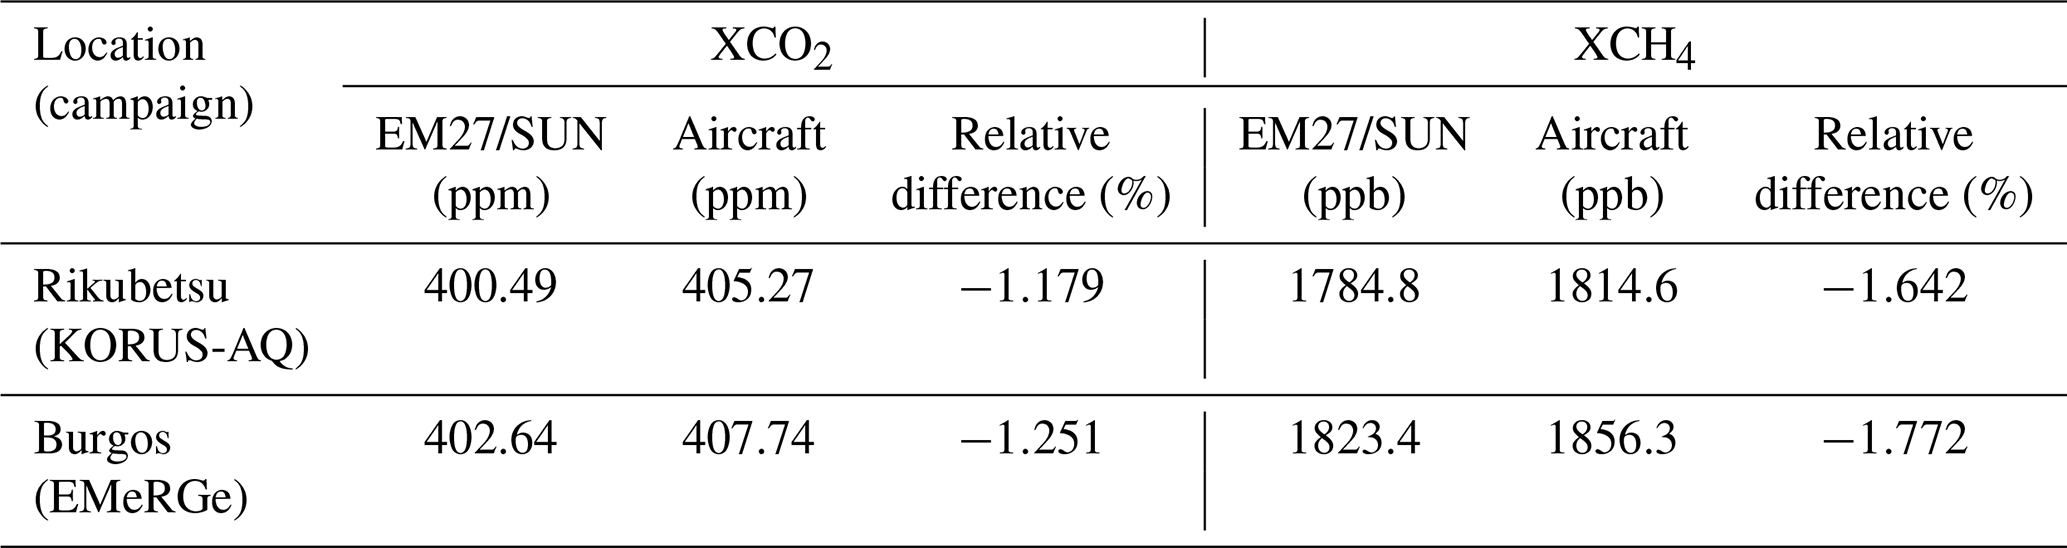
Figure 5 shows the time series of XCO2 and XCH4 measured by the EM27/SUN in Rikubetsu and Burgos. The EM27/SUN measurements taken at the overflight time were interrupted by clouds for Rikubetsu and sundown for Burgos. The numbers of EM27/SUN data, satisfying the temporal coincidence criterion, are 4 and 24 for Rikubetsu and Burgos, respectively. The aircraft XCO2 and XCH4 values calculated using Eq. (1) are presented separately for the descending and ascending profiles, although only the descending profiles are used for the comparison to the EM27/SUN data as described above. When calculating aircraft XCO2 and XCH4 values, the missing data were linearly interpolated. We note that, provided that the missing data between 0.24 and 2.78 km of the CO2 ascent profile were substituted by the descent profile in the corresponding altitude range, the difference between the XCO2 values from the linear interpolation and the substitution was less than 0.1 ppm. The EM27/SUN column-averaging kernels for the flight times over Rikubetsu and Burgos are shown in Fig. 6. Table 4 lists results of the comparison of the EM27/SUN with the aircraft XCO2 and XCH4 data. The relative biases of EM27/SUN XCO2 with respect to the aircraft XCO2 values are −1.179 % and −1.251 % for the comparisons at Rikubetsu and Burgos, respectively. The relative biases of EM27/SUN XCH4 with respect to the aircraft XCH4 values are −1.642 % and −1.772 % for the comparisons at Rikubetsu and Burgos, respectively. Overall, correction factors for EM27/SUN XCO2 and XCH4 values are determined to be 0.9878 and 0.9829, respectively, and corrected values are obtained by dividing the raw values by the correction factors. Uncertainties in their correction factors were calculated from the estimated aircraft total uncertainties (Table 2) and EM27/SUN measurement precisions (standard deviations of the mean EM27/SUN values) and are found to be 0.0012 for XCO2 and 0.0038 for XCH4.
Provided that the mean value of the modulation efficiency before and after the transport was that during the campaign, the difference in the modulation efficiency between the campaigns (EMeRGe – KORUS-AQ) was −0.0031 (Table 3), which corresponds to a change of −0.047 % for the XCO2 value. Because the relative difference between the EM27/SUN and the aircraft XCO2 data differed by −0.072 % (Table 4) between the campaigns (EMeRGe – KORUS-AQ), the change in the ILS of the EM27/SUN for the campaign periods may have partly contributed to the difference in the relative differences.
The correction factors for TCCON data are 0.9898 for XCO2 and 0.9765 for XCH4, and the XCH4 correction factor of TCCON with the higher spectral resolution (0.02 cm−1) deviates more largely from 1 than that of EM27/SUN with the lower spectral resolution (0.5 cm−1). Here, the GGG2014 uses the HITRAN 2008 database and a Voigt line shape to calculate absorption coefficients of CH4 in the 1.67 µm band, which results in smaller XCH4 for both the TCCON and EM27/SUN compared to aircraft in situ XCH4. When the spectral resolution of TCCON is reduced to that of EM27/SUN by truncating the TCCON interferogram, the retrieved low-resolution TCCON XCH4 becomes consistent with the EM27/SUN XCH4 (Frey et al., 2019; Hedelius et al., 2016). This implies that the inaccurate line shape and spectroscopic parameters in the 1.67 µm band would have a larger impact on XCH4 retrievals from the high-resolution spectra than those from low-resolution spectra.
Hedelius et al. (2016) compared the four EM27/SUN data with the Lamont (US) TCCON data. The EM27/SUN XCO2 and XCH4 data had mean biases of 0.03 % and 0.75 % relative to the TCCON data, respectively, and the correction factors for EM27/SUN were estimated to be 0.9901±0.0011 and 0.9839±0.0027. Our results are in agreement with the results from Hedelius et al. (2016) within the range of the uncertainties in correction factors for TCCON data.
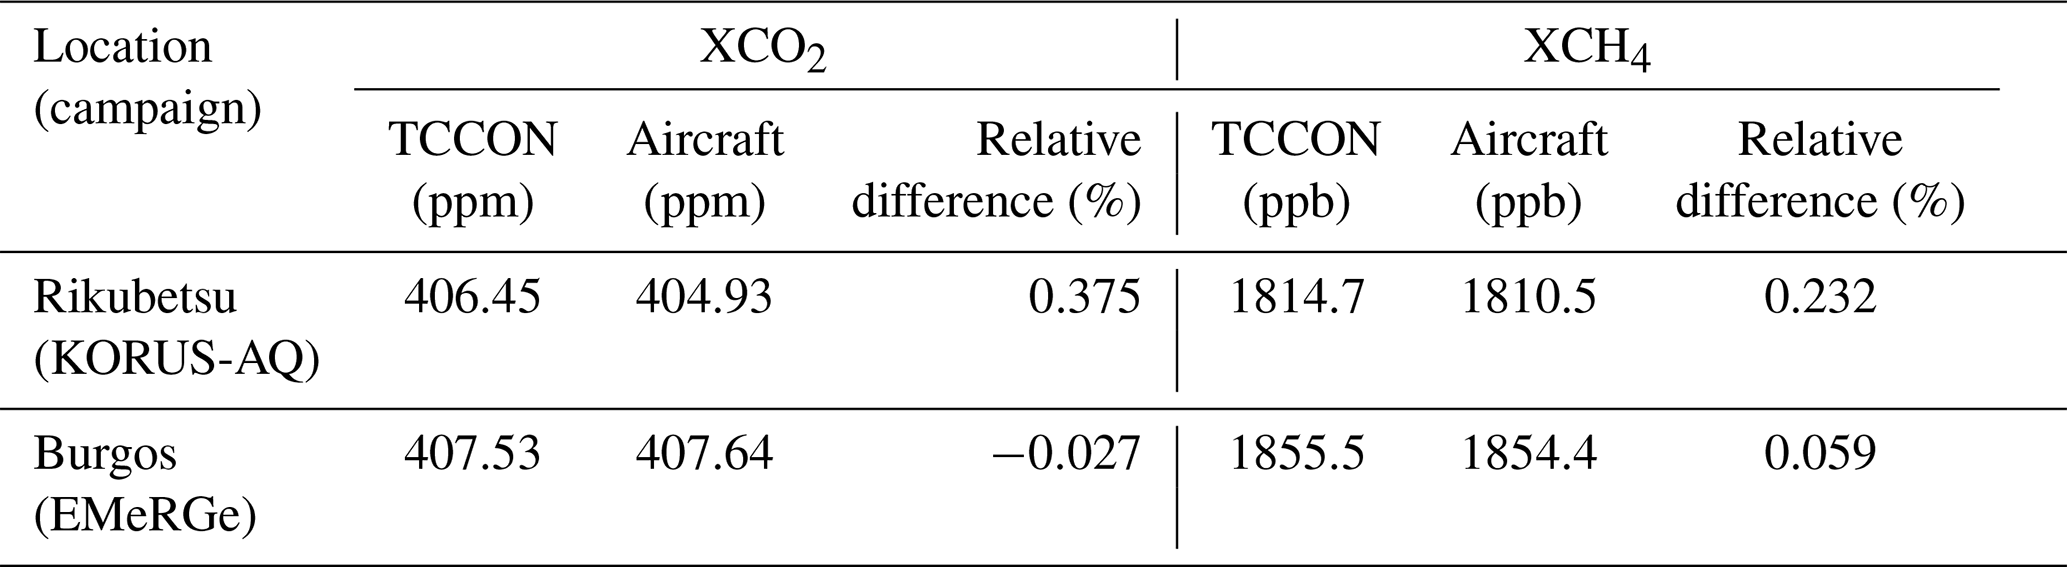
We compared the TCCON data with the same aircraft data as used for validating the EM27/SUN data (Fig. 5). For comparisons of the TCCON data with the aircraft data the temporal range to calculate mean TCCON values was expanded to within ±2 h, because there were few TCCON data available within ±1 h of the aircraft overpass. We note that the column-averaging kernels and scaling factors in Eq. (1), to calculate comparable aircraft XCO2 and XCH4 values, were altered to correspond to the TCCON data (Fig. 6). The comparison between the TCCON and aircraft data (Table 5) reveals that the Rikubetsu TCCON data are biased high by 0.375 % for XCO2 and 0.232 % for XCH4, while the Burgos TCCON data are in good agreement with the aircraft data, with relative differences of <0.1 % for both XCO2 and XCH4.
Table 5Comparison of TCCON data with aircraft XCO2 and XCH4 data. The relative differences are calculated as follows: (TCCON − aircraft)/aircraft ×100.
In the present study, the comparisons of the EM27/SUN data with the Tsukuba TCCON data (Sect. 3.3) are restricted to the periods before and after the transports of the EM27/SUN instrument. In addition, the EM27/SUN measurements in Burgos were conducted for a week, although the results on only the overflight day are shown here because the focus of this study is the validation of the EM27/SUN data. The collocated measurements by our EM27/SUN and TCCON FTS were also performed at the TCCON site in Saga, Japan, in addition to the Tsukuba, Rikubetsu, and Burgos TCCON sites. An evaluation of the consistency between these TCCON data sets based on comparison to the EM27/SUN data will be performed in a future study.
The XCO2 and XCH4 values from an EM27/SUN have been validated by comparison with in situ aircraft data obtained over the Rikubetsu and Burgos TCCON sites in the track of the transfer flights of the KORUS-AQ and EMeRGe campaigns, respectively. The impacts of transport on the EM27/SUN were investigated and evaluated by examining both the ILS and the differences of the XCO2 and XCH4 data products compared to those of the Tsukuba TCCON data before and after transport. We find that the influence of EM27/SUN transports on the XCO2 and XCH4 retrievals were comparable to their uncertainties. The aircraft profiles obtained over the two TCCON sites varied between the descending and ascending flights. Investigation of the dynamical tropopause using the ERA5 potential vorticity values reveals that a tropopause fold occurred over Rikubetsu during the measurements made at the location of the descending flight but not during the ascending flight. The output from WRF-Chem GHG tracer model indicates that, during the ascending flight close to Burgos of HALO, the aircraft encountered air masses having high CO2, probably resulting from central Luzon. Air masses observed with the EM27/SUN were different to those encountered by HALO during the ascending profiles. However, during the descending profiles made by HALO, the EM27/SUN measured air masses that had a similar history to those measured by HALO. On the basis of the comparison between the EM27/SUN data and the selected (descending) aircraft data, the correction factors for EM27/SUN are determined to be 0.9878 for XCO2 and 0.9829 for XCH4. These values are consistent with those derived from the relative differences between EM27/SUN and TCCON data that were examined in the previous study (Hedelius et al., 2016). The comparison between the TCCON and aircraft data showed that the Rikubetsu TCCON data were biased high by 0.375 % for XCO2 and 0.232 % for XCH4, while the Burgos TCCON data and aircraft data agreed to within 0.1 % for both XCO2 and XCH4.
The KORUS-AQ aircraft data were obtained from the NASA Langley Research Center Airborne Science Data for Atmospheric Composition (https://www-air.larc.nasa.gov/cgi-bin/ArcView/korusaq, last access: 5 September 2019) (NASA, 2019). The ERA5 reanalyses data were acquired from the Copernicus Climate Change Service Climate Data Store (https://cds.climate.copernicus.eu/#!/home, last access: 5 September 2019) (C3S, 2017). The NCEP FNL Operational Model Global Tropospheric Analyses data were obtained from the Research Data Archive at the National Center for Atmospheric Research, Computational and Information Systems Laboratory (http://rda.ucar.edu, last access: 5 September 2019) (NCAR, 2019). Burgos, Rikubetsu, and Tsukuba TCCON data were obtained from the TCCON Data Archive, hosted by CaltechDATA, California Institute of Technology (https://tccondata.org/, last access: 5 September 2019) (Morino et al., 2018a–c).
The supplement related to this article is available online at: https://doi.org/10.5194/amt-13-5149-2020-supplement.
HO, IM, and VAV designed the content of the paper. HO, IM, and VAV analyzed the data with help from MK and MF. IM (Rikubetsu and Burgos) and VAV (Burgos) led ground-based measurements, and HO, AH, OU, NMD, and TM contributed to the ground-based measurements and site operations. TK measured, processed, and analyzed the trace gas data aboard HALO. GB conducted WRF-Chem model simulations. JPdG, YC, GSD, and SEP provided KORUS-AQ aircraft data. AF, AR, ML, and HS were responsible for EMeRGe airborne measurements and provided the aircraft data. JPB and MDAH led the EMeRGe mission and flight planning, with support from PKW and CCKC. HO prepared the manuscript, and all authors reviewed the paper and contributed to the discussion of the paper.
The authors declare that they have no conflict of interest.
This article is part of the special issue “Effect of Megacities on the Transport and Transformation of Pollutants at Regional and Global Scales (EMeRGe) (ACP/AMT inter-journal SI)”. It is not associated with a conference.
We are grateful to David W. T. Griffith for his useful comments and discussions. We thank Takahiro Nakatsuru for the EM27/SUN measurement at the Rikubetsu site. Local technical support for the EM27/SUN and TCCON measurements in Burgos is provided by the Energy Development Corporation (EDC, Philippines). The EM27/SUN measurements at the Rikubetsu and Burgos TCCON sites and operations of the Rikubetsu, Tsukuba, and Burgos TCCON sites are financially supported in part by the GOSAT series project. Travel and financial support to Voltaire A. Velazco were granted by the NIES, UOW SMAH-PEPA, UIC International Links Grant Scheme, Small Project Grant (grant no. 2016/SPGA-S/07), and UOW-CAC cluster. Voltaire A. Velazco thanks the Civil Aviation Authority of the Philippines, Ricky Mina, Ro Andrei Casim, Ronald C. Macatangay, Mylene Cayetano, and Dragon Star Aviation Services for assistance. Voltaire A. Velazco thanks the First Philippine Holdings and the municipality of Burgos, Ilocos Norte, and extends special thanks to Oscar M. Lopez, Federico R. Lopez, Richard B. Tantoco, Agnes C. de Jesus, Andy Durog, Cesar Aguilar, and all EBWPC, EDC and FPH executives and staff. Joshua P. DiGangi, Yonghoon Choi, Glenn S. Diskin, and Sally E. Pusede were supported for this research through the NASA Tropospheric Composition Program (grant no. NNX16AC17G). The High Altitude and Long Range Research Aircraft (HALO) is a German government research aircraft operated for the German research community by the German Aerospace Center (DLR) from Oberpfaffenhofen. The Effect of Megacities on the Transport and Transformation of Pollutants at Regional and Global Scales (EMeRGe) is a research mission selected by the German research foundation (DFG) for its HALO SPP 1294 infrastructure research program. The flight costs of the EMeRGe campaign were funded by a consortium comprising the DFG, which supports the German university costs, the Research Center for Environmental Changes, Academia Sinica, Taiwan, the DLR Institute of Atmospheric Physics, DLR-IAP, the Karlsruhe Institute of Technology, KIT, and Research Centre Jülich, FZ-J. The EMeRGe research undertaken at the University of Bremen and the DLR-IAP for EMeRGe was funded primarily by the University of Bremen and DLR respectively and in small part by the DFG. The University of Bremen also thanks the Max Planck Institute in Mainz for support for EMeRGe.
This research has been supported by the NASA Tropospheric Composition Program (grant no. NNX16AC17G) and the University of Wollongong (grant no. 2016/SPGA-S/07).
This paper was edited by Manabu Shiraiwa and reviewed by two anonymous referees.
Bagtasa, G.: Effect of synoptic scale weather disturbance to Philippine transboundary ozone pollution using WRF-CHEM, Int. J. Environ. Sci. Dev., 3402–3405, https://doi.org/10.7763/IJESD.2011.V2.159, 2011.
Chen, J., Viatte, C., Hedelius, J. K., Jones, T., Franklin, J. E., Parker, H., Gottlieb, E. W., Wennberg, P. O., Dubey, M. K., and Wofsy, S. C.: Differential column measurements using compact solar-tracking spectrometers, Atmos. Chem. Phys., 16, 8479–8498, https://doi.org/10.5194/acp-16-8479-2016, 2016.
Copernicus Climate Change Service (C3S): ERA5: Fifth generation of ECMWF atmospheric reanalyses of the global climate, Copernicus Climate Change Service Climate Data Store (CDS), https://cds.climate.copernicus.eu/cdsapp#!/home (last access: 5 September 2019), 2017.
Deutscher, N. M., Griffith, D. W. T., Bryant, G. W., Wennberg, P. O., Toon, G. C., Washenfelder, R. A., Keppel-Aleks, G., Wunch, D., Yavin, Y., Allen, N. T., Blavier, J.-F., Jiménez, R., Daube, B. C., Bright, A. V., Matross, D. M., Wofsy, S. C., and Park, S.: Total column CO2 measurements at Darwin, Australia – site description and calibration against in situ aircraft profiles, Atmos. Meas. Tech., 3, 947–958, https://doi.org/10.5194/amt-3-947-2010, 2010.
Dils, B., Buchwitz, M., Reuter, M., Schneising, O., Boesch, H., Parker, R., Guerlet, S., Aben, I., Blumenstock, T., Burrows, J. P., Butz, A., Deutscher, N. M., Frankenberg, C., Hase, F., Hasekamp, O. P., Heymann, J., De Mazière, M., Notholt, J., Sussmann, R., Warneke, T., Griffith, D., Sherlock, V., and Wunch, D.: The Greenhouse Gas Climate Change Initiative (GHG-CCI): comparative validation of GHG-CCI SCIAMACHY/ENVISAT and TANSO-FTS/GOSAT CO2 and CH4 retrieval algorithm products with measurements from the TCCON, Atmos. Meas. Tech., 7, 1723–1744, https://doi.org/10.5194/amt-7-1723-2014, 2014.
Frey, M., Hase, F., Blumenstock, T., Groß, J., Kiel, M., Mengistu Tsidu, G., Schäfer, K., Sha, M. K., and Orphal, J.: Calibration and instrumental line shape characterization of a set of portable FTIR spectrometers for detecting greenhouse gas emissions, Atmos. Meas. Tech., 8, 3047–3057, https://doi.org/10.5194/amt-8-3047-2015, 2015.
Frey, M., Hase, F., Blumenstock, T., Morino, I., and Shiomi, K.: Quantification of CO2 and CH4 megacity emissions using portable solar absorption spectrometers, EGU General Assembly, Vienna, Austria, 23–28 April 2017, EGU2017-14218, 2017.
Frey, M., Sha, M. K., Hase, F., Kiel, M., Blumenstock, T., Harig, R., Surawicz, G., Deutscher, N. M., Shiomi, K., Franklin, J. E., Bösch, H., Chen, J., Grutter, M., Ohyama, H., Sun, Y., Butz, A., Mengistu Tsidu, G., Ene, D., Wunch, D., Cao, Z., Garcia, O., Ramonet, M., Vogel, F., and Orphal, J.: Building the COllaborative Carbon Column Observing Network (COCCON): long-term stability and ensemble performance of the EM27/SUN Fourier transform spectrometer, Atmos. Meas. Tech., 12, 1513–1530, https://doi.org/10.5194/amt-12-1513-2019, 2019.
Frey, M., Hase, F., Blumenstock, T., Dubravica, D., Hase, F., Goettsche, F., Gross, J., Olesen, F., Amadhila, P., Handjaba, M., Maggs-Koelling, G., Marais, E., Mushi, R., Morino, I., Shiomi, K., De Mazière, M., and Sha, M. K.: Long-term column-averaged greenhouse gas observations using a COCCON spectrometer at a high surface albedo site in Namibia, EGU General Assembly, 4–8 May 2020, EGU2020-6477, 2020.
Geibel, M. C., Messerschmidt, J., Gerbig, C., Blumenstock, T., Chen, H., Hase, F., Kolle, O., Lavrič, J. V., Notholt, J., Palm, M., Rettinger, M., Schmidt, M., Sussmann, R., Warneke, T., and Feist, D. G.: Calibration of column-averaged CH4 over European TCCON FTS sites with airborne in-situ measurements, Atmos. Chem. Phys., 12, 8763–8775, https://doi.org/10.5194/acp-12-8763-2012, 2012.
Gisi, M., Hase, F., Dohe, S., Blumenstock, T., Simon, A., and Keens, A.: XCO2-measurements with a tabletop FTS using solar absorption spectroscopy, Atmos. Meas. Tech., 5, 2969–2980, https://doi.org/10.5194/amt-5-2969-2012, 2012.
Hase, F., Blumenstock, T., and Paton-Walsh, C.: Analysis of the instrumental line shape of high-resolution Fourier transform IR spectrometers with gas cell measurements and new retrieval software, Appl. Optics, 38, 3417–3422, https://doi.org/10.1364/AO.38.003417, 1999.
Hase, F., Frey, M., Blumenstock, T., Groß, J., Kiel, M., Kohlhepp, R., Mengistu Tsidu, G., Schäfer, K., Sha, M. K., and Orphal, J.: Application of portable FTIR spectrometers for detecting greenhouse gas emissions of the major city Berlin, Atmos. Meas. Tech., 8, 3059–3068, https://doi.org/10.5194/amt-8-3059-2015, 2015.
Hase, F., Frey, M., Kiel, M., Blumenstock, T., Harig, R., Keens, A., and Orphal, J.: Addition of a channel for XCO observations to a portable FTIR spectrometer for greenhouse gas measurements, Atmos. Meas. Tech., 9, 2303–2313, https://doi.org/10.5194/amt-9-2303-2016, 2016.
Hedelius, J. K., Viatte, C., Wunch, D., Roehl, C. M., Toon, G. C., Chen, J., Jones, T., Wofsy, S. C., Franklin, J. E., Parker, H., Dubey, M. K., and Wennberg, P. O.: Assessment of errors and biases in retrievals of X, X, XCO, and X from a 0.5 cm−1 resolution solar-viewing spectrometer, Atmos. Meas. Tech., 9, 3527–3546, https://doi.org/10.5194/amt-9-3527-2016, 2016.
Heinle, L. and Chen, J.: Automated enclosure and protection system for compact solar-tracking spectrometers, Atmos. Meas. Tech., 11, 2173–2185, https://doi.org/10.5194/amt-11-2173-2018, 2018.
Holton, J. R., Haynes, P., McIntyre, M. E., Douglass, A. R., Rood, R. B., and Pfister, L.: Stratosphere-troposphere exchange, Rev. Geophys., 33, 403–439, https://doi.org/10.1029/95RG02097, 1995.
Hu, H., Landgraf, J., Detmers, R., Borsdorff, T., Aan de Brugh, J., Aben, I., Butz, A., and Hasekamp, O.: Toward Global Mapping of Methane With TROPOMI: First Results and Intersatellite Comparison to GOSAT, Geophys. Res. Lett., 45, 3682–3689, https://doi.org/10.1002/2018GL077259, 2018.
Kiel, M., Wunch, D., Wennberg, P. O., Toon, G. C., Hase, F., and Blumenstock, T.: Improved retrieval of gas abundances from near-infrared solar FTIR spectra measured at the Karlsruhe TCCON station, Atmos. Meas. Tech., 9, 669–682, https://doi.org/10.5194/amt-9-669-2016, 2016.
Kiel, M., O'Dell, C. W., Fisher, B., Eldering, A., Nassar, R., MacDonald, C. G., and Wennberg, P. O.: How bias correction goes wrong: measurement of X affected by erroneous surface pressure estimates, Atmos. Meas. Tech., 12, 2241–2259, https://doi.org/10.5194/amt-12-2241-2019, 2019.
Klappenbach, F., Bertleff, M., Kostinek, J., Hase, F., Blumenstock, T., Agusti-Panareda, A., Razinger, M., and Butz, A.: Accurate mobile remote sensing of XCO2 and XCH4 latitudinal transects from aboard a research vessel, Atmos. Meas. Tech., 8, 5023–5038, https://doi.org/10.5194/amt-8-5023-2015, 2015.
Klausner, T., Mertens, M., Huntrieser, H., Galkowski, M., Kuhlmann, G., Baumann, R., Fiehn, A., Jöckel, P., Pühl, M., and Roiger, A.: Urban greenhouse gas emissions from the Berlin area: A case study using airborne CO2 and CH4 in situ observations in summer 2018, Elem. Sci. Anth., 8, 15, https://doi.org/10.1525/elementa.411, 2020.
Liu, Y., Wang, J., Yao, L., Chen, X., Cai, Z., Yang, D. Yin, Z. Gu, S., Tian, L., Lu, N., and Lyu, D.: The TanSat mission: preliminary global observations, Sci. Bull., 63, 1200–1207, https://doi.org/10.1016/j.scib.2018.08.004, 2018.
Messerschmidt, J., Geibel, M. C., Blumenstock, T., Chen, H., Deutscher, N. M., Engel, A., Feist, D. G., Gerbig, C., Gisi, M., Hase, F., Katrynski, K., Kolle, O., Lavrič, J. V., Notholt, J., Palm, M., Ramonet, M., Rettinger, M., Schmidt, M., Sussmann, R., Toon, G. C., Truong, F., Warneke, T., Wennberg, P. O., Wunch, D., and Xueref-Remy, I.: Calibration of TCCON column-averaged CO2: the first aircraft campaign over European TCCON sites, Atmos. Chem. Phys., 11, 10765–10777, https://doi.org/10.5194/acp-11-10765-2011, 2011.
Morino, I., Matsuzaki, T., and Horikawa, M.: TCCON data from Tsukuba (JP), 125HR, Release GGG2014.R2, TCCON Data Archive, hosted by CaltechDATA, https://doi.org/10.14291/tccon.ggg2014.tsukuba02.r2, 2018a.
Morino, I., Velazco, V. A., Hori, A., Uchino, O., and Griffith, D. W. T.: TCCON data from Burgos, Ilocos Norte (PH), Release GGG2014.R0, TCCON data archive, hosted by CaltechDATA, https://doi.org/10.14291/tccon.ggg2014.burgos01.r0, 2018b.
Morino, I., Yokozeki, N., Matsuzaki, T., and Horikawa, M.: TCCON data from Rikubetsu (JP), Release GGG2014.R2, TCCON data archive, hosted by CaltechDATA, https://doi.org/10.14291/tccon.ggg2014.rikubetsu01.r2, 2018c.
NASA: KORUSAQ_2016, available at: https://www-air.larc.nasa.gov/cgi-bin/ArcView/korusaq, last access: 5 September 2019.
NCAR: Research Data Archive, available at: https://rda.ucar.edu/, last access: 5 September 2019.
Oda, T. and Maksyutov, S.: ODIAC Fossil Fuel CO2 Emissions Dataset (Version name: ODIAC2018), Center for Global Environmental Research, National Institute for Environmental Studies, https://doi.org/10.17595/20170411.001, 2015.
O'Dell, C. W., Eldering, A., Wennberg, P. O., Crisp, D., Gunson, M. R., Fisher, B., Frankenberg, C., Kiel, M., Lindqvist, H., Mandrake, L., Merrelli, A., Natraj, V., Nelson, R. R., Osterman, G. B., Payne, V. H., Taylor, T. E., Wunch, D., Drouin, B. J., Oyafuso, F., Chang, A., McDuffie, J., Smyth, M., Baker, D. F., Basu, S., Chevallier, F., Crowell, S. M. R., Feng, L., Palmer, P. I., Dubey, M., García, O. E., Griffith, D. W. T., Hase, F., Iraci, L. T., Kivi, R., Morino, I., Notholt, J., Ohyama, H., Petri, C., Roehl, C. M., Sha, M. K., Strong, K., Sussmann, R., Te, Y., Uchino, O., and Velazco, V. A.: Improved retrievals of carbon dioxide from Orbiting Carbon Observatory-2 with the version 8 ACOS algorithm, Atmos. Meas. Tech., 11, 6539–6576, https://doi.org/10.5194/amt-11-6539-2018, 2018.
Rodgers, C. D. and Connor, B. J.: Intercomparison of remote sounding instruments, J. Geophys. Res., 108, 4116, https://doi.org/10.1029/2002JD002299, 2003.
Sha, M. K., De Mazière, M., Notholt, J., Blumenstock, T., Chen, H., Dehn, A., Griffith, D. W. T., Hase, F., Heikkinen, P., Hermans, C., Hoffmann, A., Huebner, M., Jones, N., Kivi, R., Langerock, B., Petri, C., Scolas, F., Tu, Q., and Weidmann, D.: Intercomparison of low- and high-resolution infrared spectrometers for ground-based solar remote sensing measurements of total column concentrations of CO2, CH4, and CO, Atmos. Meas. Tech., 13, 4791–4839, https://doi.org/10.5194/amt-13-4791-2020, 2020.
Skamarock, W. C., Klemp, J. B., Dudhia. J., Gill, D. O., Barker, D., Wang, W., and Powers, J. G.: A description of the Advanced Re-search WRF version 3, NCAR Tech. Note NCAR/TN-475+STR, NCAR, 113 pp., 2008.
Stohl, A., Bonasoni, P., Cristofanelli, P., Collins, W., Feichter, J., Frank, A., Forster, C., Gerasopoulos, E., Gaggeler, H., James, P., Kentarchos, T., Kromp-Kolb, H., Krüger, B., Land, C., Meloen, J., Papayannis, A., Priller, A., Seibert, P., Sprenger, M., Roelofs, G. J., Scheel, H. E., Schnabel, C., Siegmund, P., Tobler, L., Trickl, T., Wernli, H., Wirth, V., Zanis, P., and Zerefos, C.: Stratosphere-troposphere exchange: A review, and what we have learned from STACCATO, J. Geophys. Res.-Atmos., 108, 8516, https://doi.org/10.1029/2002JD002490, 2003.
Tang, W., Arellano, A. F., DiGangi, J. P., Choi, Y., Diskin, G. S., Agustí-Panareda, A., Parrington, M., Massart, S., Gaubert, B., Lee, Y., Kim, D., Jung, J., Hong, J., Hong, J.-W., Kanaya, Y., Lee, M., Stauffer, R. M., Thompson, A. M., Flynn, J. H., and Woo, J.-H.: Evaluating high-resolution forecasts of atmospheric CO and CO2 from a global prediction system during KORUS-AQ field campaign, Atmos. Chem. Phys., 18, 11007–11030, https://doi.org/10.5194/acp-18-11007-2018, 2018.
Trickl, T., Bärtsch-Ritter, N., Eisele, H., Furger, M., Mücke, R., Sprenger, M., and Stohl, A.: High-ozone layers in the middle and upper troposphere above Central Europe: potential import from the stratosphere along the subtropical jet stream, Atmos. Chem. Phys., 11, 9343–9366, https://doi.org/10.5194/acp-11-9343-2011, 2011.
Tu, Q., Hase, F., Blumenstock, T., Kivi, R., Heikkinen, P., Sha, M. K., Raffalski, U., Landgraf, J., Lorente, A., Borsdorff, T., Chen, H., Dietrich, F., and Chen, J.: Intercomparison of atmospheric CO2 and CH4 abundances on regional scales in boreal areas using Copernicus Atmosphere Monitoring Service (CAMS) analysis, COllaborative Carbon Column Observing Network (COCCON) spectrometers, and Sentinel-5 Precursor satellite observations, Atmos. Meas. Tech., 13, 4751–4771, https://doi.org/10.5194/amt-13-4751-2020, 2020.
Vay, S. A., Choi, Y., Vadrevu, K. P., Blake, D. R., Tyler, S. C., Wisthaler, A., Hecobian, A., Kondo, Y., Diskin, G. S., Sachse, G. W., and Woo, J. H.: Patterns of CO2 and radiocarbon across high northern latitudes during International Polar Year 2008, J. Geophys. Res.-Atmos., 116, D14301, https://doi.org/10.1029/2011jd015643, 2011.
Velazco, V. A., Morino, I., Uchino, O., Hori, A., Kiel, M., Bukosa, B., Deutscher, N. M., Sakai, T., Nagai, T., Bagtasa, G., Izumi, T., Yoshida, Y., and Griffith, D. W. T.: TCCON Philippines: First Measurement Results, Satellite Data and Model Comparisons in Southeast Asia, Remote Sens., 9, 1228, https://doi.org/10.3390/rs9121228, 2017.
Velazco, V. A., Deutscher, N. M., Morino, I., Uchino, O., Bukosa, B., Ajiro, M., Kamei, A., Jones, N. B., Paton-Walsh, C., and Griffith, D. W. T.: Satellite and ground-based measurements of XCO2 in a remote semiarid region of Australia, Earth Syst. Sci. Data, 11, 935–946, https://doi.org/10.5194/essd-11-935-2019, 2019.
Vogel, F. R., Frey, M., Staufer, J., Hase, F., Broquet, G., Xueref-Remy, I., Chevallier, F., Ciais, P., Sha, M. K., Chelin, P., Jeseck, P., Janssen, C., Té, Y., Groß, J., Blumenstock, T., Tu, Q., and Orphal, J.: XCO2 in an emission hot-spot region: the COCCON Paris campaign 2015, Atmos. Chem. Phys., 19, 3271–3285, https://doi.org/10.5194/acp-19-3271-2019, 2019.
Wunch, D., Toon, G. C., Wennberg, P. O., Wofsy, S. C., Stephens, B. B., Fischer, M. L., Uchino, O., Abshire, J. B., Bernath, P., Biraud, S. C., Blavier, J.-F. L., Boone, C., Bowman, K. P., Browell, E. V., Campos, T., Connor, B. J., Daube, B. C., Deutscher, N. M., Diao, M., Elkins, J. W., Gerbig, C., Gottlieb, E., Griffith, D. W. T., Hurst, D. F., Jiménez, R., Keppel-Aleks, G., Kort, E. A., Macatangay, R., Machida, T., Matsueda, H., Moore, F., Morino, I., Park, S., Robinson, J., Roehl, C. M., Sawa, Y., Sherlock, V., Sweeney, C., Tanaka, T., and Zondlo, M. A.: Calibration of the Total Carbon Column Observing Network using aircraft profile data, Atmos. Meas. Tech., 3, 1351–1362, https://doi.org/10.5194/amt-3-1351-2010, 2010.
Wunch, D., Toon, G. C., Blavier, J. F., Washenfelder, R. A., Notholt, J., Connor, B. J., Griffith, D. W., Sherlock, V., and Wennberg, P. O.: The total carbon column observing network, Philos. T. Roy. Soc. A, 369, 2087–2112, https://doi.org/10.1098/rsta.2010.0240, 2011a.
Wunch, D., Wennberg, P. O., Toon, G. C., Connor, B. J., Fisher, B., Osterman, G. B., Frankenberg, C., Mandrake, L., O'Dell, C., Ahonen, P., Biraud, S. C., Castano, R., Cressie, N., Crisp, D., Deutscher, N. M., Eldering, A., Fisher, M. L., Griffith, D. W. T., Gunson, M., Heikkinen, P., Keppel-Aleks, G., Kyrö, E., Lindenmaier, R., Macatangay, R., Mendonca, J., Messerschmidt, J., Miller, C. E., Morino, I., Notholt, J., Oyafuso, F. A., Rettinger, M., Robinson, J., Roehl, C. M., Salawitch, R. J., Sherlock, V., Strong, K., Sussmann, R., Tanaka, T., Thompson, D. R., Uchino, O., Warneke, T., and Wofsy, S. C.: A method for evaluating bias in global measurements of CO2 total columns from space, Atmos. Chem. Phys., 11, 12317–12337, https://doi.org/10.5194/acp-11-12317-2011, 2011b.
Wunch, D., Toon, G. C., Sherlock, V., Deutscher, N. M., Liu, C., Feist, D. G., and Wennberg, P. O.: The Total Carbon Column Observing Network's GGG2014 Data Version, Tech. rep., California Institute of Technology, Pasadena, CA, https://doi.org/10.14291/tccon.ggg2014.documentation.R0/1221662, 2015.
Yoshida, Y., Kikuchi, N., Morino, I., Uchino, O., Oshchepkov, S., Bril, A., Saeki, T., Schutgens, N., Toon, G. C., Wunch, D., Roehl, C. M., Wennberg, P. O., Griffith, D. W. T., Deutscher, N. M., Warneke, T., Notholt, J., Robinson, J., Sherlock, V., Connor, B., Rettinger, M., Sussmann, R., Ahonen, P., Heikkinen, P., Kyrö, E., Mendonca, J., Strong, K., Hase, F., Dohe, S., and Yokota, T.: Improvement of the retrieval algorithm for GOSAT SWIR XCO2 and XCH4 and their validation using TCCON data, Atmos. Meas. Tech., 6, 1533–1547, https://doi.org/10.5194/amt-6-1533-2013, 2013.