the Creative Commons Attribution 4.0 License.
the Creative Commons Attribution 4.0 License.
 | 09 Oct 2020
An examination of enhanced atmospheric methane detection methods for predicting performance of a novel multiband uncooled radiometer imager
Cody M. Webber
John P. Kerekes
To evaluate the potential for a new uncooled infrared radiometer imager to detect enhanced atmospheric levels of methane, three different analysis methods were examined. A single-pixel brightness temperature to noise-equivalent delta temperature (NEdT) comparison study performed using data simulated from MODTRAN6 revealed that a single thermal band centered on the 7.68 µm methane feature leads to a detectable brightness temperature difference exceeding the sensor noise level for a plume of about 17 ppm at ambient atmospheric temperature compared to an ambient plume with no enhanced methane present. Application of a normalized differential methane index method, a novel approach for methane detection, demonstrated how a simple two-band method can be utilized to detect a plume of methane that is 10 ppm above ambient atmospheric concentration and −10 K from ambient atmospheric temperature with an 80 % hit rate and 17 % false alarm rate. This method was capable of detecting methane with similar levels of success as the third method, a proven multichannel method, matched filter. The matched-filter approach was performed with six spectral channels. Results from these examinations suggest that given a high enough concentration and temperature contrast, a multispectral system with a single band allocated to a methane absorption feature can detect enhanced levels of methane.
- Article
(1449 KB) - Full-text XML
-
Supplement
(162 KB) - BibTeX
- EndNote


With the increased risk of climate change, the value of global environmental monitoring has become increasingly important. Methane (CH4), which naturally exists as the most abundant organic gas in the atmosphere (Cicerone, 1988), is a potent greenhouse gas with a radiative forcing per molecule approximately 20 times greater than carbon dioxide (CO2) (Ramaswamy, 2001; Solomon et al., 2007). While the atmospheric concentration of CH4 is lower than that of CO2, the world has seen a rise in CH4 emissions since 2007, primarily from anthropogenic sources. CH4 also has a moderately short lifespan in the atmosphere (about 10 years), which means that efforts to reduce anthropogenic emission of CH4 would aid in slowing human contribution to climate change in a relatively short amount of time. The benefit of curbing CH4 emissions makes it desirable to monitor likely sources of CH4 in order to quantify and limit emission from human activity (Saunois et al., 2016).
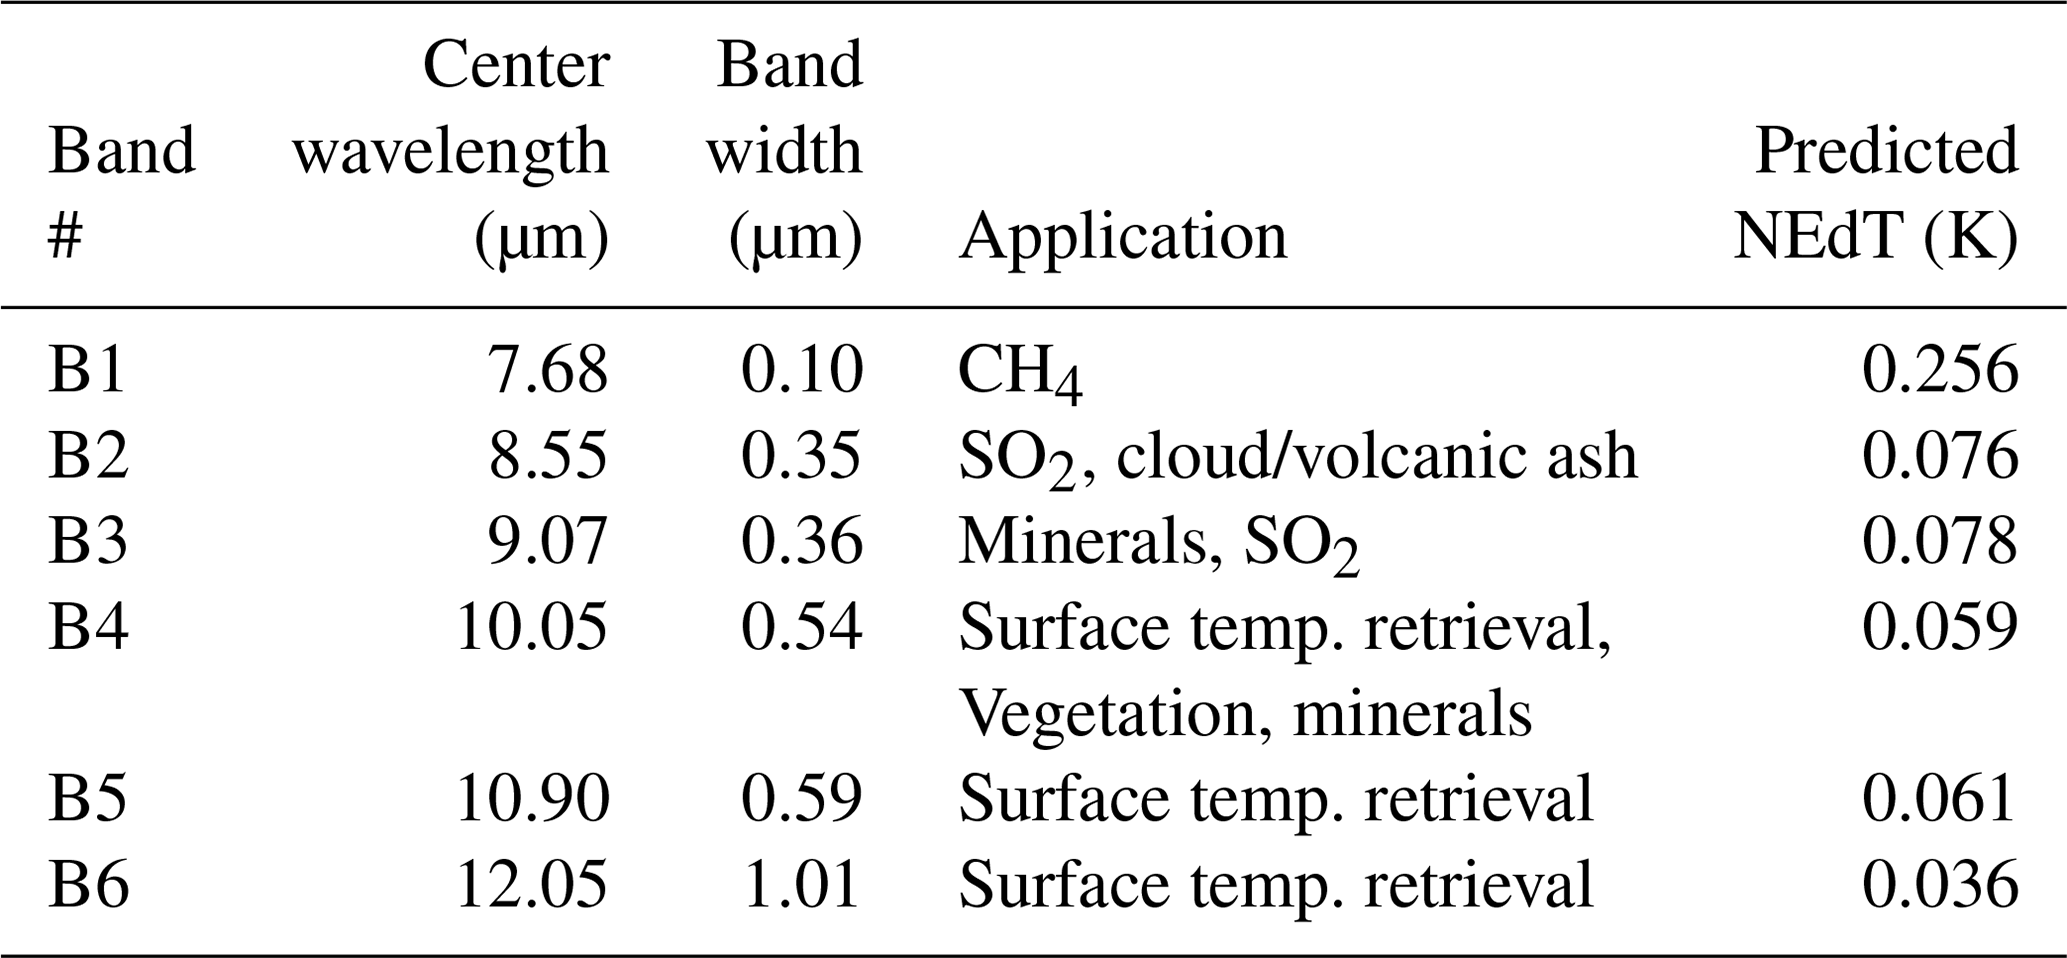
Table 1MURI band allocations and predicted noise-equivalent delta temperature.
Airborne and satellite-mounted remote imaging systems provide researchers with the ability to rapidly survey large swaths of Earth's surface and the atmospheric columns above the surface. This feature of remote imaging makes it a useful tool for monitoring atmospheric gas content and sources of rogue emissions. In the shortwave infrared (SWIR), the Airborne Visible/Infrared Imaging Spectrometer AVIRIS and its successor AVIRIS-NG (Next Generation) are high-spatial-resolution, high-spectral-resolution imagers that have demonstrated the ability to detect enhanced levels of atmospheric CH4 by observing strong CH4 absorption features present between 2.0 and 2.5 µm (Thorpe et al., 2016, 2014). The satellite-mounted systems, TROPOspheric Measuring Instrument (TROPOMI) and Greenhouse gases Observing SATellite (GOSAT), are capable of measuring global atmospheric CH4 content using solar backscattering (Hu et al., 2018). The Methane Remote Sensing Lidar Mission (MERLIN) minisatellite is scheduled to launch in 2020 and will utilize a SWIR source to detect CH4 plumes (Jacob et al., 2016).
Longwave, or thermal, infrared hyperspectral imagery has been used to identify and track the movement of gas plumes in cluttered urban environments (Broadwater et al., 2008). The Hyperspectral Thermal Emission Spectrometer (HyTES) is a high-spectral-resolution imager that has been proven capable of detecting rogue CH4 emission sources by utilizing a clutter matched-filter approach (Hulley et al., 2016). The clutter matched-filter method, when applied to HyTES imagery, has been proved capable of detecting enhanced levels of CH4 gas from both cluttered urban environments, such as the La Brea tar pits in Los Angeles, California, and from managed rural scenes, such as oil fields in Kern County, California. HyTES has also been used to develop an algorithm that can predict CH4 concentration from thermal imagery (Kuai et al., 2016). Unlike SWIR imagers like AVIRIS and TROPOMI, thermal infrared imagers utilize thermal emissions and thermal contrast between gas plumes and background surfaces to detect enhanced levels of atmospheric gases without relying on solar backscattering or an additional source. This feature of thermal imagers makes them useful for nighttime operation as well as removes dependency on surface reflectance properties (Hulley et al., 2016). However, thermal imagers, such as HyTES, require focal plane array (FPA) cooling systems in order to reduce noise (Broadwater et al., 2008; Hulley et al., 2016).
Improvements in remote thermal imaging systems and the design of new systems necessitate the evaluation of CH4 detection capabilities. DRS Technologies has constructed a multiband uncooled radiometer imager (MURI) for the National Aeronautics and Space Administration's Instrument Incubator Program (IIP). MURI is designed to collect images in the thermal infrared, which will be applied to the study of land surface climatology, soil moisture content, ecosystem dynamics, hazard and volcano emission (SO2) monitoring, and CH4 detection (Ely et al., 2018). The goal of this project is to demonstrate the value of utilizing low-cost microbolometers in earth observation imaging systems. DRS Technologies aims to show that implementing methods applied in the construction of MURI will reduce the cost and development time for airborne and space-based imagers while demonstrating the ability to record remote imaging data that are valuable for environmental applications. A primary advantage of this design is that by utilizing a low-cost microbolometer focal plane array, the system does not require the installation of a potentially heavy and expensive cooling system. Two designs have been compiled for the MURI: an airborne demonstration system and a satellite-mounted system. The study presented here utilizes the specifications of the MURI airborne demonstration instrument. The system utilizes a 17 µm per pixel microbolometer FPA, an integration time of 14 µs, and optics with an effective focal length of 120 mm and an fnumber of 1. The design utilizes six spectral channels, which are detailed in Table 1, along with DRS predictions of noise-equivalent delta temperature (NEdT) – the minimum brightness temperature difference each band can detect for the airborne instrument. MURI's band 1 has been allocated to be centered on a CH4 feature located around 7.68 µm (Ely et al., 2018). The inspiration for this study was to determine if it is possible to detect enhanced levels of atmospheric CH4 in the thermal infrared using a multispectral instrument with a single band allocated to CH4 absorption features. To accomplish this, three different types of detection schemes were examined in order to predict performance and provide evidence for which methods provide useful results when applied to multispectral data from an instrument like MURI.
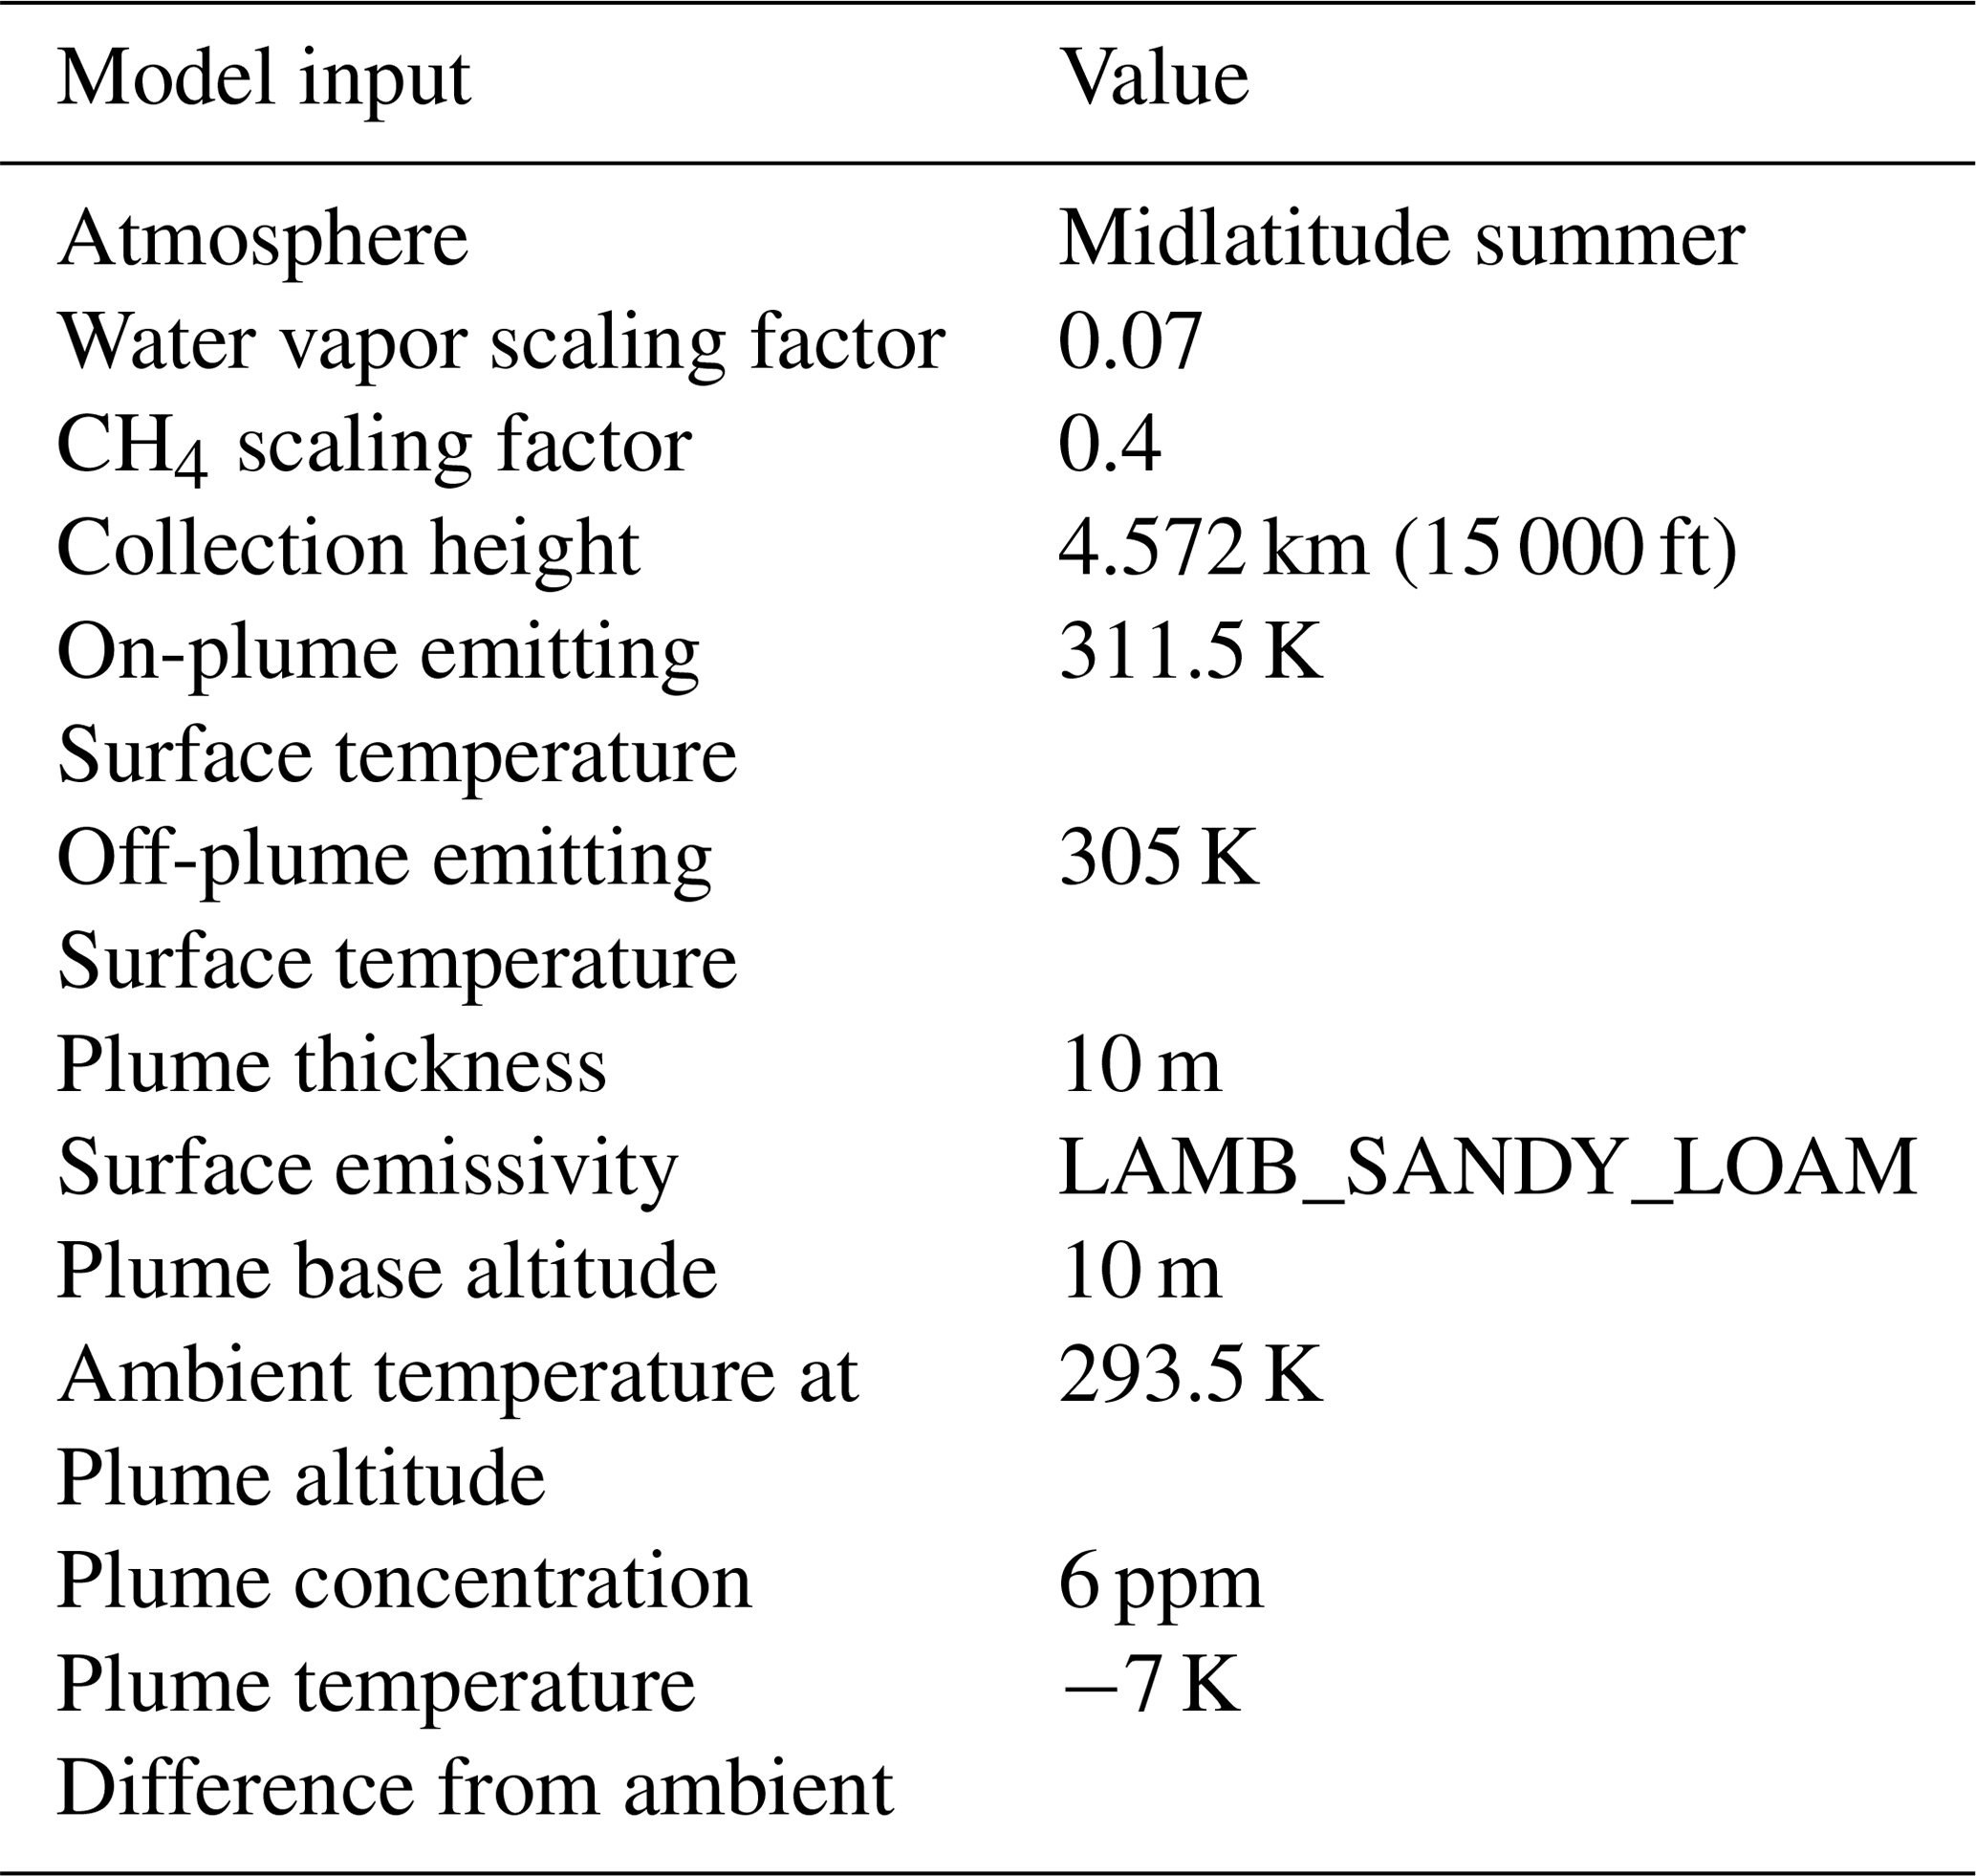
Table 2MODTRAN Parameter Settings for Validation of HyTES Simulated Radiances.
In this section, three methods of methane detection used to determine detectable cases for the uncooled instrument are described.
2.1 Single-pixel NEdT comparison
The first study presented here investigates the potential contrast for a single thermal infrared spectral band centered on the CH4 absorption feature present at 7.68 µm. Here, a narrow bandpass of 100 nm is considered. The goal of the study is to determine under what scenarios a single band allocated to CH4 detection is capable of detecting the temperature difference indicative of an enhanced level of atmospheric CH4.
In order to accomplish this, sensor-reaching radiances were calculated using radiative transfer models produced with MODTRAN6. This modeling code provides the ability to define a background surface, surface temperature, and atmosphere to calculate the spectral radiance that reaches a single pixel at the system's height. Utilizing the local chemical plume model option in MODTRAN6, spectral radiances, Lspec were calculated for a background case – or a case without enhanced levels of CH4 – and a plume-present case – or a case with enhanced levels of CH4 (Berk et al., 2016).
Effective radiances, the amount of light energy that the system is responsive to, can be calculated from the spectral radiance:
where R is the responsivity of the pixel, and λi and λj are the wavelength limits (Schott, 2007). Note that this effective radiance is normalized by the responsivity curve of the spectral channel of the instrument. From effective radiance, the brightness or effective temperature can be calculated, which is the temperature perceived from the imaging system with reference to a blackbody.
where h is Planck's constant, c is the speed of light, kb is the Stephan Boltzmann constant, and λcenter is the center wavelength of the band (Schott, 2007). By calculating a brightness temperature for both the background and plume-present case and then taking the difference of the resultant brightness temperatures, a brightness temperature difference was found. Comparing this brightness temperature difference to the noise-equivalent delta temperature (NEdT) – the minimum brightness temperature difference the system is capable of detecting – reveals if the system would be able to detect the increased concentration of CH4 utilizing only the CH4 band.

Figure 1A 7.68 µm HyTES band image recorded on 5 February 2015 with a ground sample distance of 2 m This image was used to validate our model method in MODTRAN 6.
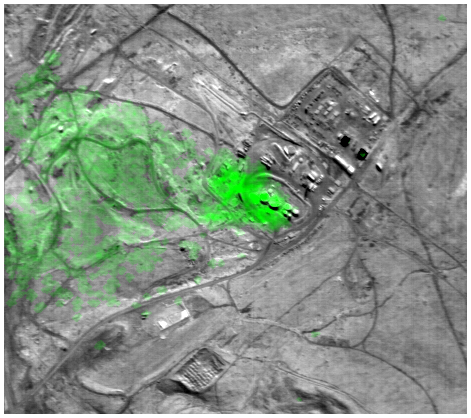
Figure 2Flagged image; green indicates the HyTES clutter matched filter has detected methane in that pixel.
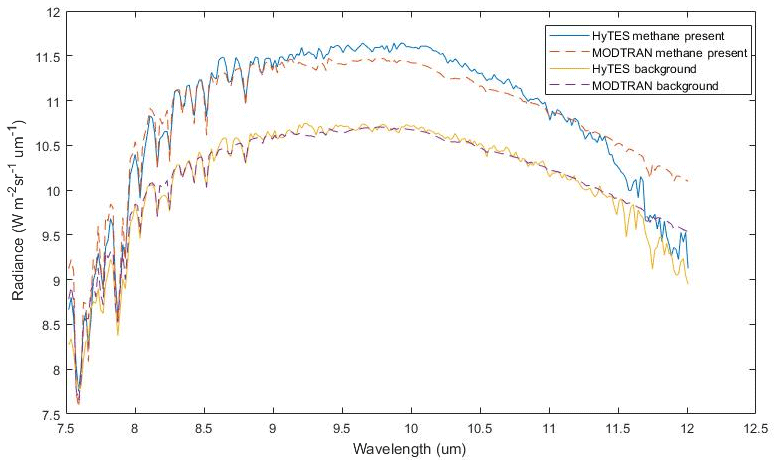
Figure 3Recreation of HyTES spectra from data set used by Kuai et al. (2016) using MODTRAN 6. This is the recreation of one on-plume and one off-plume pixel from the 5 February 2015 data set.
2.2 Methane detection utilizing a matched filter
In order to better assess the system's methane detection capabilities, an approach proven to work for hyperspectral imagery was considered. The study presented here utilizes a matched-filter approach to assess MURI's capability of detecting enhanced levels of atmospheric CH4. While this method has been proven capable of detecting CH4 using thermal infrared HyTES data, applying the matched filter here is to investigate the viability of this method with a system with considerably fewer spectral bands (6 compared to 256) and only a single band allocated to the thermal infrared CH4 absorption feature.
The objective of developing a matched filter is to create a weighting function that when applied to an N spatial pixel by n spectral channel radiance matrix, L, the output is a new image where intensity correlates with the presence of the signal of inquiry. Application of the matched filter begins with the assumption that there exists a signal, in this case a methane plume absorption or emission signal, b, that is linearly superimposed on a background of the image, which can be written as
where r is the sensor-reaching radiance, α is the strength of the spectral signal, and c is a combination of noise and background signal (Funk et al., 2001; Hulley et al., 2016). A realistic model of c considers the correlation between spectral channels, which can be described in terms of the covariance matrix K:
where L′ is mean subtracted radiance over all the pixels from matrix L. Knowing, K, the covariance of the image, the optimal matched filter can be matched to both the desired signal b and the background, i.e., “clutter”. This clutter matched filter is defined as
It should be noted that q is normalized so that if the signal is not present in the original image, the resultant matched-filter image will prove to have a variance of 1. By applying the matched filter q to the N by n matrix of radiances L, the clutter matched-filter image is created,
After computing the CMFI, a simple threshold is applied to determine if the signal is present (Funk et al., 2001; Hulley et al., 2016). For this study, the threshold was varied in order to produce a receiver–operator characteristic (ROC) curve to assess the effectiveness of the method, rather than the effectiveness of a single threshold.
The study presented here provides a comparison between the six-channel multispectral MURI instrument and the 256-channel hyperspectral HyTES instrument when applying the matched filter to simulated imagery containing enhanced levels of atmospheric CH4.
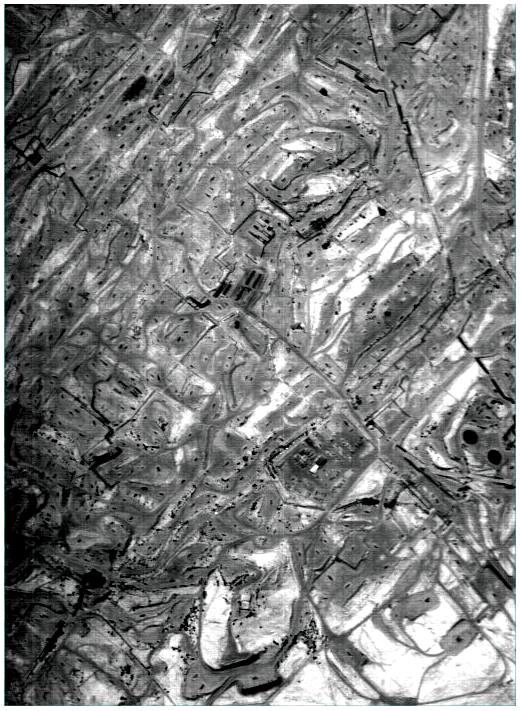
Figure 4Single-band view of HyTES image subset from 8 July 2014. This subset was used to produce the simulated data set.
2.3 Methane detection using a normalized differential methane index
The final study described here aims to determine if detection of enhanced atmospheric CH4 is possible using information from a pair of thermal spectral channels. This method has seen use in vegetation-based studies in the form of the normalized difference vegetation index, i.e., NDVI (Rouse et al., 1973). Here, a normalized difference methane index, i.e., NDMI, is calculated using the following equation:
where SB2 and SB1 are the radiance values recorded by two different spectral bands from the instrument which cover the same spatial pixel area, one that includes a CH4 feature (SB1) and one that does not (SB2). The result is an image of intensity values that can be compared to threshold to determine if CH4 is present. If the plume is absorbing more thermal energy than passes through and is emitted by it, higher values for NDMI indicate a stronger likelihood of enhanced CH4. If the plume is emitting more thermal energy than it absorbs, which is characteristic of hotter plumes, lower values of NDMI indicate a stronger likelihood of enhanced CH4. All cases considered for this study included plumes that produced spectral absorption features, and therefore higher NDMI values were indicative of a stronger likelihood of enhanced CH4.
For this study, two different band combinations were chosen to be compared. SB1 for each combination was MURI band 1. Centered at 7.68 µm, this band contains the strongest CH4 absorption feature. Two different bands were chosen for SB2 for comparison, the first was MURI band 2. This band was chosen as this band contains less CH4 absorption features than band 1 and covers a spectral region that has comparatively higher atmospheric transmission than band 1. The other band chosen for SB2 was MURI band 6. This band was chosen because CH4 has the weakest effect on this band. After calculating the NDMI, a threshold varying from the lowest value pixel to the highest value pixel of the NDMI image was used to create ROC curves, which inform on how well the NDMI is an indicator of enhanced CH4 presence.
This section discusses the process of creating data sets for the three studies above and the validation of the simulated data.
3.1 Single-pixel simulation validation
In order to create a realistic data set of sensor-reaching radiances for these studies, a scenario in which a rogue emission source has been detected was chosen as a reference in order to produce a more realistic simulated model. Data from HyTES collections are fitting for this purpose as the system's 256 spectral channels roughly cover the same region in the thermal infrared as the MURI design and collects over the CH4 absorption feature at 7.68 µm. The chosen HyTES collection is shown in Fig. 1 and was recorded over Kern River oil fields on 5 February 2015 (Jet Propulsion Laboratory, 2019). The data set provided by the Jet Propulsion Laboratory includes a flagged image, shown in Fig. 2, that identifies pixels that a matched filter predicted contained enhanced CH4 concentrations. Figure 3 shows typical on- and off-plume spectra, as well as a simulated recreation of the data using MODTRAN6. Surface level air temperature was retrieved from Weather Underground (https://www.wunderground.com/, last access: 2 July 2019) and was set to 293.5 K. The concentration of the plume was determined by Kuai et al. (2016) to be 6 ppm (Kuai et al., 2016). A list of notable model inputs is recorded in Table 2. The model was able to recreate the HyTES spectra with a RMSE of 0.25 W m−2 sr−1 µm−1 for the CH4 present case and 0.15 W m−2 sr−1 µm−1 for the background case. Recreation of this data provided confidence that realistic scenes could be reproduced in MODTRAN6 and helped inform the input parameters for the other simulated data sets.
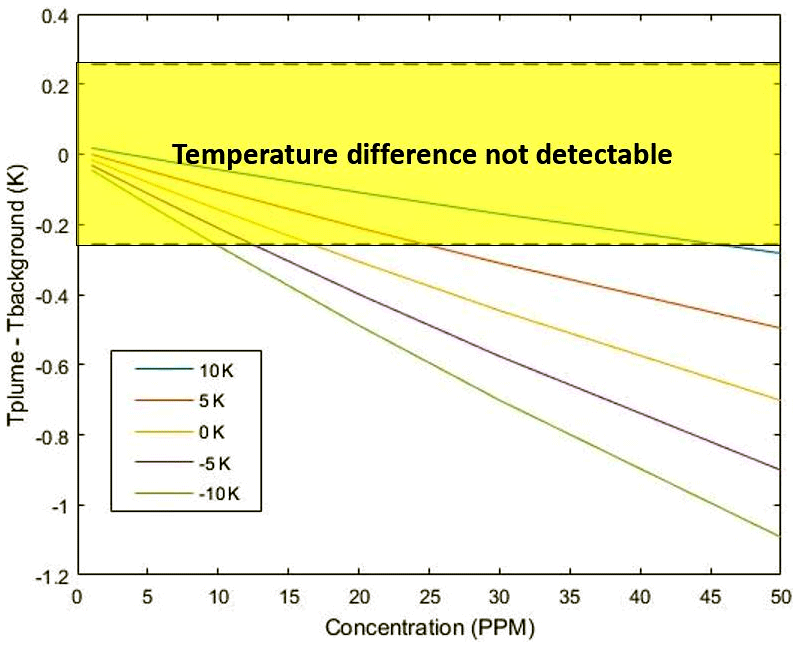
Figure 5Low-altitude plume model results displaying brightness temperature difference as a function of plume concentration. Figure identifies detectable and undetectable scenarios for MURI's predicted NEdT.
3.2 Matched-filter and NDMI data set creation
To evaluate the multiband methods, a simulated MURI image was created using higher-spectral-resolution HyTES imagery. By applying the MURI spectral response to the HyTES data, a six-channel image with MURI's spectral channels was created. It should be noted that HyTES data do not fully cover the bandpass of MURI's band 6. The synthetic MURI image was created using a subset of HyTES images recorded over Kern County, California, on 8 July 2014, which can be seen in Fig. 4. The chosen subset was determined to contain no detected enhanced CH4 pixels (Jet Propulsion Laboratory, 2019).
The images created by applying MURI's spectral response initially had less noise than the predicted noise for MURI. The noise in this image is defined as
This means that additional noise needed to be simulated in the image in order to better estimate a MURI image. The amount of additional noise can be defined as
This additional noise was calculated from the noise-equivalent delta temperature by first calculating noise-equivalent delta radiance:
where is the derivative of Planck's blackbody function with respect to temperature. The noise was then added to the image by multiplying the difference in quadrature of the NEdLs with a Gaussian random number with mean 0 and standard deviation of 1.
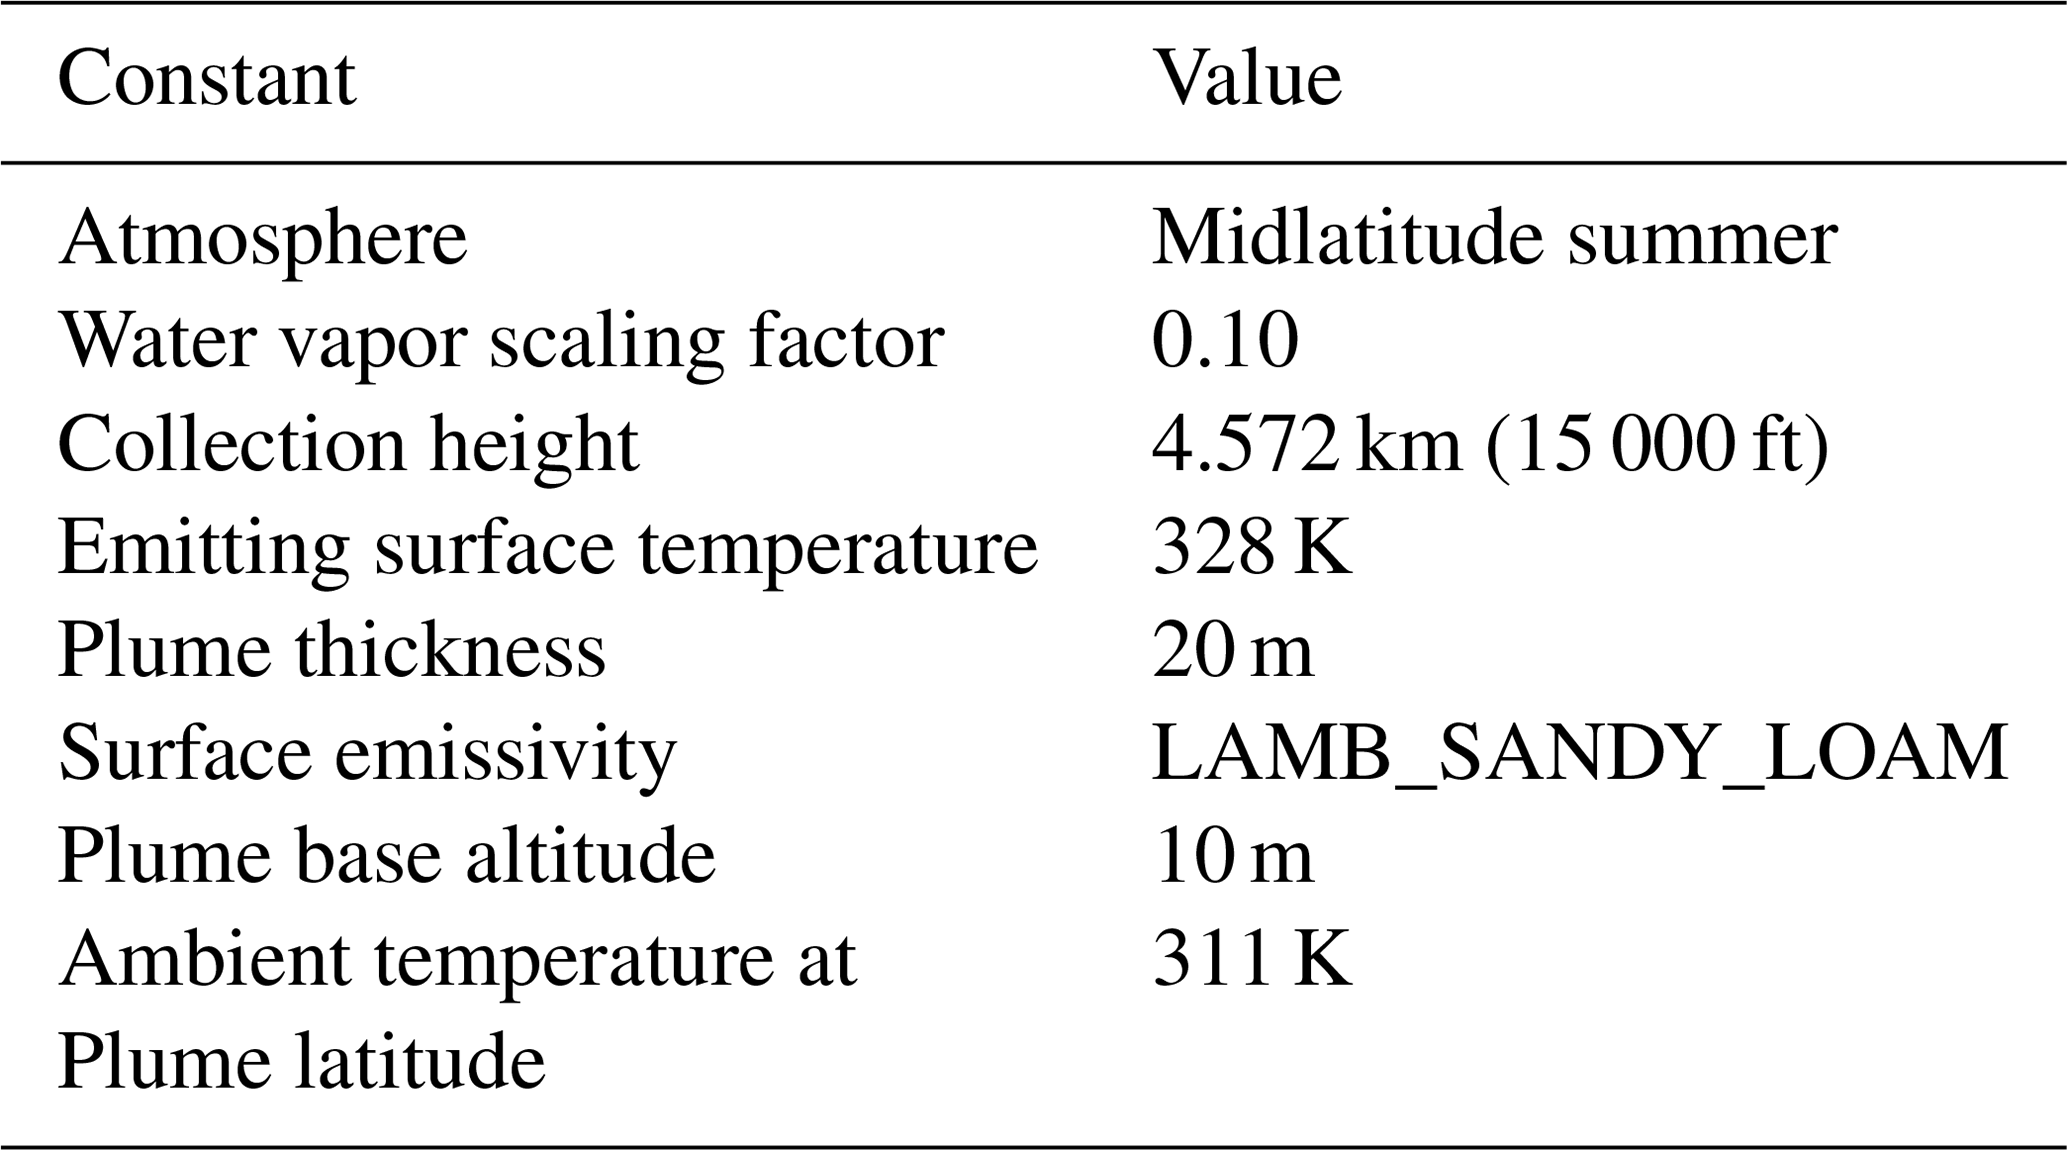
Table 4Matched-filter and NDMI data set MODTRAN simulation parameter settings.

The simulated data set was created to determine the ability of MURI to detect higher-concentration CH4 plumes. The data set for this investigation required an image with realistic variation and a known presence of CH4. In order to accomplish this, a set of CH4 present HyTES images were created. These images were created using the local chemical plume model of MODTRAN6, which outputs an on-plume and off-plume curve for at sensor radiance (Berk et al., 2016). Both the off-plume and on-plume simulations were run with a limited atmosphere with only small amounts of CO2. The off-plume simulation contained only background levels of CH4, while the on-plume model contained an enhanced concentration plume, ranging from 1 to 20 ppm above ambient methane. Then a radiance difference was calculated between the off-plume and on-plume spectral curves, removing the effects of the small amount of CO2 and background CH4 levels. The differences were then added to copies of the background HyTES image to create a set of plume-present images with realistic background variation and known methane quantity. The MURI images were then created by applying MURI's spectral response to the HyTES data set. Additional noise was added to the images by the same method stated above. The final data set consists of five images derived from the scene depicted in Fig. 4. The first image has no enhanced levels of methane present, and the rest of the images have only enhanced levels of methane present across the entire image. Each image has a plume of constant concentration ranging from 1 to 20 ppm and plume temperature difference of −10 K from ambient atmospheric temperature. This also provides a simple truth map, as a perfect accuracy method would indicate the background image as having no methane present pixels (zero false alarms) and the plume-present images as having every pixel be indicated as plume present (hit rate of 1).
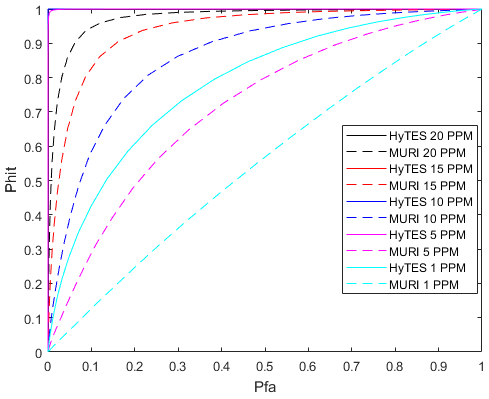
Figure 6ROC curves for matched-filter detection experiment. Results indicate high detection for most HyTES cases. Performance for MURI is high for 15 and 20 ppm but low for 1 to 5 ppm (see Table S1 in the Supplement for the area under each of the MURI ROC curves).
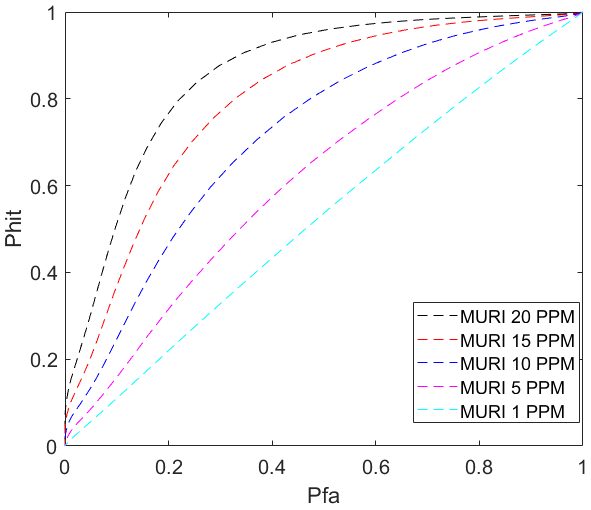
Figure 7ROC curve describing the performance of applying the NDMI to the simulated data set using the methane feature band, band 1, and a relatively more transparent band, band 2 (see Table S2 for the area under each curve).
This section presents the results of applying each of the three methods for methane detection described above.
4.1 Single-pixel NEdT study results
For this study, a low-altitude plume is considered. Spectral radiances in the CH4 band were simulated using MODTRAN6, as described in Sect. 3. Table 3 contains a list of notable constants and their values, which were derived from examining HyTES images, metadata, and the conditions under which the images were recorded (Jet Propulsion Laboratory, 2019). Ambient atmospheric temperature was estimated from Weather Underground, which was recorded by the Meadows Field Station in Bakersfield, California, on 8 July 2014 at 11:54 am. Modern estimates of ambient atmospheric CH4 concentration are at about 1.8 ppm (Saunois et al., 2016), while the lower explosive limit is around 50 000 ppm (Bjerketvedt et al., 1997). For this experiment, the CH4 concentration within the plume was varied from 1 to 50 ppm or 0.1 % of the lower explosive limit. The plume temperature was defined by a temperature difference from ambient temperature. The plume for this study varied from −10 to +10 K of ambient temperature at the plume height. This is a range of −27 to −7 K to the background surface. Brightness temperature differences between the plume-present and background cases were calculated. These differences were compared to the NEdT computed by DRS, which is 0.256 K for band 1, i.e., the CH4 feature band. The results of the low-altitude plume model can be seen in Fig. 5 (see Fig. S1 in the Supplement for low-altitude plume model results described using the temperature difference between the methane plume and the surface).
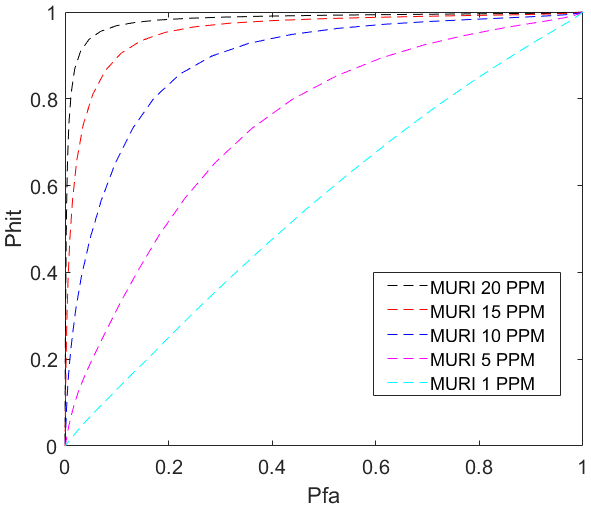
Figure 8ROC curve describing the performance of applying the NDMI to the simulated data set using the methane feature band, band 1, and the MURI band with the least powerful methane signature, band 6 (see Table S3 for the area under each curve).
The results here indicate that a plume with a temperature difference as high as +10 K from ambient temperature is absorbing energy, which is consistent with knowledge that the background surface temperature is 17 K higher than the ambient atmospheric temperature. The higher-temperature plumes require higher concentrations to detect, with the hottest in this study requiring a plume of more than 45 ppm to provide a detectable contrast (about 25 times background levels). At ambient temperature, a plume of about 17 ppm (about 10 times background levels) is required for the temperature difference to have a detectable contrast, and for the coldest plume temperature, a concentration of 10 ppm creates a high enough temperature difference to display a detectable contrast. This study gives a baseline for detection for a single band allocated to CH4 absorption features.
4.2 Detection using matched filter
For the purposes of this study, a low-temperature plume (−10 K from ambient atmospheric temperature or −27.6 K from background surface temperature) with various concentrations of CH4 were simulated in the column and added to the background image containing only background levels of CH4. Table 4 contains a list of notable constants and their values. Ambient atmospheric temperature was retrieved from Weather Underground, which was the daily high temperature recorded by the Meadows Field Station in Bakersfield, California, on 8 July 2014. Surface temperature was determined by matching a blackbody to a selection of random pixels from the HyTES imagery. The signal, b in Eq. (5), was defined as an absorbing CH4 plume and was extracted from the HITRAN data set. The ROC curves in Fig. 6 provide an understanding of how well the system distinguishes CH4 present pixels and background clutter using a the matched-filter approach. The probability of false alarm (Pfa) indicates the fraction of background clutter pixels incorrectly categorized as CH4 present pixels, while the hit probability (Phit) indicates the fraction of pixels correctly identified as CH4 present pixels. In the perfect detection case, an ideal circumstance, there exists a threshold value where Phit is 1, and Pfa is zero. A straight line with a slope of 1 indicates that the detection scheme is performing as well as chance. Otherwise, a high hit rate and low false alarm rate indicate a reliably detectable scenario.
Utilizing the matched-filter approach shows HyTES is capable of detecting as low as 5 ppm with a low false alarm rate. The hyperspectral system is even capable of detecting an additional plume of 1 ppm above background levels with a hit rate of 70 % and a false alarm rate of 30 %. MURI's matched-filter approach shows that an additional plume of 10 ppm can be detected with 80 % accuracy and about 23 % false alarm rate. Utilizing the matched filter on the two systems reveals that the narrow-band hyperspectral system is outperforming the broader-band multispectral system.
4.3 NDMI detection results
The result of applying the normalized differential methane index method for MURI data simulated from HyTES imagery and MODTRAN6 can be seen in Figs. 7 and 8.
The results indicate the MURI system performs better using the NDMI using bands 1 and 6 compared to bands 1 and 2. The NDMI method performed on MURI bands 1 and 6 performs as well as the matched-filter approach being applied to all MURI bands, as the NDMI method shows 80 % accuracy and about 17 % false alarm rate for a scenario with an enhanced CH4 plume of 10ppm. This provides evidence indicating that given a high enough concentration and temperature contrast, a simple two-band approach can be used to detect enhanced levels of atmospheric CH4 with similar accuracy to a six-band approach.
The studies detailed here predict the ability of an uncooled microbolometer imager to detect enhanced levels of atmospheric CH4. The single-band investigation confirmed that CH4 plumes with large concentrations and temperature differences compared to background surface temperature lead to detectable contrasts, indicating that detection with a single pixel is possible, given the proper conditions. If a CH4 plume was large enough to be captured by multiple pixels, detection of plumes with smaller temperature differences and CH4 concentrations could be possible by averaging over the pixels that collect plume signals. Future work includes examining additional scenarios, including different surface types and atmospheric parameters as well as validation of these results with the MURI system.
Application of the matched filter indicated the higher-spectral-resolution HyTES system would outperform the multispectral MURI instrument. This study also shows that the NDMI approach provides detection similar to the matched filter using the multispectral MURI system. Given a significant quantity and temperature differential of CH4, the NDMI performs well enough to be useful for a thermal imager with a single channel allocated for CH4 detection and a second band in a region with little overlap with a CH4 absorption feature. The results also indicate that the NDMI should be defined using one band that records in a region with a CH4 absorption feature and a broad channel that records in a region with no CH4-specific spectral features. Future investigations aim to validate the results of these studies with images collected from test flights of the MURI system.
The HyTES data used in this study can be requested from http://hytes.jpl.nasa.gov/order (last access: 22 January 2019).
The supplement related to this article is available online at: https://doi.org/10.5194/amt-13-5359-2020-supplement.
CMW and JPK designed the study. Modeling and experimental work was performed by CMW under the supervision of JPK. This paper was prepared by CMW with assistance from JPK.
The authors declare that they have no conflicts of interest.
Any opinions, conclusions, recommendations, or findings described in this paper are those of the authors and do not reflect the views of the National Aeronautics and Space Administration.
The research described here was carried out at the Rochester Institute of Technology and was supported in part by the Earth Science Technology Office of the National Aeronautics and Space Administration.
This research has been supported in part by the NASA Earth Science Technology Office (grant no. 80NSSC18K0114).
This paper was edited by John Worden and reviewed by two anonymous referees.
Berk, A., Conforti, P., Hawes, F., Perkins, T. C., Guiang, C., Acharya, P., Kennett, R., Gregor, B., and Bosch, J. V. D.: “Next Generation Modtran for Improved Atmospheric Correction of Spectral Imagery”, AFRL-RV-PS-TR-2016-0105, Air Force Research Laboratory, 2016. a, b
Bjerketvedt, D., Roar Bakke, J., and van Wingerden, K.: Gas Explosion Handbook, J. Hazard. Mat., 52, 1–150, 1997. a
Broadwater, J. B., Spisz, T. S., and Carr, A. K.: Detection of gas plumes in cluttered environments using long-wave infrared hyperspectral sensors, P. SPIE, 6954, 69540R–169540R–169512, 2008. a, b
Cicerone, R. J.: Biogeochemical aspects of atmosphereic methane, Global Biogeochem. Cy., 2, 229–327, 1988. a
Ely P., Wagoner, R., and Kerekes, J.: Multiband Uncooled Radiometer Instrument (MURI) for NASA Instrument Incubator Program (IIP). Earth Science Technology Forum 2018. Silver Spring, Maryland, 12–14 June, A7P3, available at: https://esto.nasa.gov/forum/estf2018/Index.html (last access: 3 July 2020). 2018 a, b
Funk, C. C., Theiler, J., Roberts, D. A., and Borel, C. C.: Clustering to improve matched filter detection of weak gas plumes in hyperspectral thermal imagery, IEEE T. Geosci. Remote, 39, 1410–1420, 2001. a, b
Hu, H., Landgraf, J., Detmers, R., Birsdorff, ., Aan de Brugh, J., Aben, I., Butz, A., and Hasekamp, O.: Toward global mapping of methane with TROPOMI: First results and intersatellite comparison to GOSAT, Geophys. Res. Lett., 45, 3682–3689, https://doi.org/10.1002/2018GL077259, 2018. a
Hulley, G. C., Duren, R. M., Hopkins, F. M., Hook, S. J., Vance, N., Guillevic, P., Johnson, W. R., Eng, B. T., Mihaly, J. M., Jovanovic, V. M., Chazanoff, S. L., Staniszewski, Z. K., Kuai, L., Worden, J., Frankenberg, C., Rivera, G., Aubrey, A. D., Miller, C. E., Malakar, N. K., Sánchez Tomás, J. M., and Holmes, K. T.: High spatial resolution imaging of methane and other trace gases with the airborne Hyperspectral Thermal Emission Spectrometer (HyTES), Atmos. Meas. Tech., 9, 2393–2408, https://doi.org/10.5194/amt-9-2393-2016, 2016. a, b, c, d, e
Jacob, D. J., Turner, A. J., Maasakkers, J. D., Sheng, J., Sun, K., Liu, X., Chance, K., Aben, I., McKeever, J., and Frankenberg, C.: Satellite observations of atmospheric methane and their value for quantifying methane emissions, Atmos. Chem. Phys., 16, 14371–14396, https://doi.org/10.5194/acp-16-14371-2016, 2016. a
Jet Propulsion Laboratory: Hyperspectral Thermal Emission Spectrometer (HyTES), available at: http://hytes.jpl.nasa.gov, last access: 22 January 2019. a, b, c
Kuai, L., Worden, J. R., Li, K.-F., Hulley, G. C., Hopkins, F. M., Miller, C. E., Hook, S. J., Duren, R. M., and Aubrey, A. D.: Characterization of anthropogenic methane plumes with the Hyperspectral Thermal Emission Spectrometer (HyTES): a retrieval method and error analysis, Atmos. Meas. Tech., 9, 3165–3173, https://doi.org/10.5194/amt-9-3165-2016, 2016. a, b, c, d
Ramaswamy: The Third Assessment Report of the Intergovernmental Panel on Climate Change, edited by: Houghton, J. T., Ding, Y., Griggs, D. J., Noguer, M., van der Linden, P. J., Dai, X., Maskell, K., and Johnson, C. A., Cambridge Univ. Press, 349–416, 2001. a
Rouse, J. W., Haas, R. H., Schell, J. A., and Deering, D. W.: Monitoring vegetation systems in the Great Plains with ERTS, Third ERTS Symposium, NASA SP-351 I, 309–317, 1973. a
Saunois, M., Jackson, R. B., Bousquet, P., Poulter, B., and Canadell, J. G.: The growing role of methane in anthropogenic climate change, Environ. Res. Lett., 11, 120207, https://doi.org/10.1088/1748-9326/11/12/120207, 2016. a, b
Schott, J. R.: Remote Sensing The Image Chain Approach, 2nd Edition, Oxford University Press, Inc., New York, New York, 2007. a, b
Solomon, S., Qin, D., Manning, M., Chen, Z., Marquis, M., Averyt, K. B., Tignor, M., and Miller, H. L. (Eds.): IPCC: Climate Change 2007: The Physical Science Basis. Contribution of Working Group I to the Fourth Assessment Report of the Intergrovernmental Panel on Climate Change, Intergovernmental Panel on Climate Change (IPCC), Cambridge Univ. Press, UK and New York, USA, 996, 2007. a
Thorpe, A. K., Frankenberg, C., and Roberts, D. A.: Retrieval techniques for airborne imaging of methane concentrations using high spatial and moderate spectral resolution: application to AVIRIS, Atmos. Meas. Tech., 7, 491–506, https://doi.org/10.5194/amt-7-491-2014, 2014. a
Thorpe, A. K., Frankenberg, C., Aubrey, A. D., Roberts, D. A., Nottrott, A. A., Rahn, T. A., Sauer, J. A., Dubey, M. K., Costigan, K. R., Arata, C., Steffke, A. M., Hills, S., Haselwimmer, C., Charlesworth, D., Funk, C. C., Green, R. O., Lundeena, S. R., Boardman, J. W., Eastwood, M. L., Sarture, C. M., Nolte, S. H., Mccubbin, I. B., Thompson, D. R., and McFadden, J. P.: Mapping methane concentrations from a controlled release experiment using the next generation airborne visible/infrared imaging spectrometer (AVIRIS-NG), Remote Sens. Environ., 179, 104–115, 2016. a