the Creative Commons Attribution 4.0 License.
the Creative Commons Attribution 4.0 License.
 | 09 Oct 2020
Ground-based Fourier transform infrared (FTIR) O3 retrievals from the 3040 cm−1 spectral range at Xianghe, China
Pucai Wang
Bavo Langerock
Corinne Vigouroux
Christian Hermans
Nicolas Kumps
Ting Wang
Yang Yang
Denghui Ji
Liang Ran
Jinqiang Zhang
Yuejian Xuan
Hongbin Chen
Françoise Posny
Valentin Duflot
Jean-Marc Metzger
Martine De Mazière
In this study, we present O3 retrievals from ground-based Fourier transform infrared (FTIR) solar absorption measurements between June 2018 and December 2019 at Xianghe, China (39.75∘ N, 116.96∘ E). The FTIR spectrometer at Xianghe is operated with indium gallium arsenide (InGaAs) and indium antimonide (InSb) detectors, recording the spectra between 1800 and 11 000 cm−1. As the harmonized FTIR O3 retrieval strategy (Vigouroux et al., 2015) within the Network for the Detection of Atmospheric Composition Change (NDACC) uses the 1000 cm−1 spectral range, we apply the O3 retrieval in the 3040 cm−1 spectral range at Xianghe.
The retrieved O3 profile is mainly sensitive to the vertical range between 10 and 40 km, and the degrees of freedom for signal is 2.4±0.3 (1σ), indicating that there are two individual pieces of information in partial columns between the surface and 20 km and between 20 and 40 km. According to the optimal estimation method, the systematic and random uncertainties of the FTIR O3 total columns are about 13.6 % and 1.4 %, respectively. The random uncertainty is consistent with the observed daily standard deviation of the FTIR retrievals.
To validate the FTIR O3 total and partial columns, we apply the same O3 retrieval strategy at Maïdo, Réunion (a.k.a. Reunion Island; 21.08∘ N, 55.38∘ E). The FTIR O3 (3040 cm−1) measurements at Xianghe and Maïdo are then compared with the nearby ozonesondes at Beijing (39.81∘ N, 116.47∘ E) and at Gillot (20.89∘ S, 55.53∘ E), respectively, as well as with co-located TROPOspheric Monitoring Instrument (TROPOMI) satellite measurements at both sites. In addition at Maïdo, we compare the FTIR O3 (3040 cm−1) retrievals with the standard NDACC FTIR O3 measurements using the 1000 cm−1 spectral range. It was found that the total columns retrieved from the FTIR O3 3040 cm−1 measurements are underestimated by 5.5 %–9.0 %, which is mainly due to the systematic uncertainty in the partial column between 20 and 40 km (about −10.4 %). The systematic uncertainty in the partial column between surface and 20 km is relatively small (within 2.4 %). By comparison with other measurements, it was found that the FTIR O3 (3040 cm−1) retrievals capture the seasonal and synoptic variations of the O3 total and two partial columns very well. Therefore, the ongoing FTIR measurements at Xianghe can provide useful information on the O3 variations and (in the future) long-term trends.
- Article
(4221 KB) - Full-text XML
- BibTeX
- EndNote


Ozone (O3) is an important atmospheric trace species: about 90 % of the O3 abundance is in the stratosphere, where it protects life on the Earth's surface from harmful ultraviolet (UV) rays from the sun in the stratosphere (IPCC, 2013). The main source of stratospheric O3 is a photochemical process involving oxygen, the so-called Chapman cycle (Langematz, 2019). The stratospheric O3 has been observed to decrease since the 1970s, and it has been found that this depletion is highly related to the anthropogenic release of chlorofluorocarbons and other halocarbons (Molina and Rowland, 1974; Montzka et al., 1996). Therefore, 27 nations around the world signed the Montreal Protocol in 1987 to control the emissions of the ozone-depleting species (Murdoch and Sandler, 1997). However, Montzka et al. (2018) monitored an unexpected and persistent increase in global emissions of trichlorofluoromethane (CFC-11) since 2017, and Rigby et al. (2019) pointed out that the increase in CFC-11 emission is attributed to eastern China. Lickley et al. (2020) recently found that CFC-11 and dichlorodifluoromethane (CFC-12) concentrations, leaking out of old cooling equipment and from building insulation, are much larger than had been estimated. Therefore, it is very important to continue the monitoring of ozone all over the world.
The remaining ∼10 % abundance of O3 is located in the troposphere, where it is a pollutant gas that is produced, among others, from interactions with nitrogen oxides and volatile organic compounds (Monks et al., 2015). In addition, the O3 in the free troposphere is also an important greenhouse gas (IPCC, 2013). Xianghe (39.75∘ N, 116.96∘ E; 50 m a.s.l.), a site located about 50 km east of Beijing, is in a polluted region in North China, with high anthropogenic emissions for O3 precursor gases: carbon monoxide, nitrogen oxides, non-methane volatile organic compounds and methane (European Commission, 2013). Previous studies found that the tropospheric O3 concentrations around Beijing have increased significantly since 2002 (Wang et al., 2012; Zhang et al., 2014a; Ma et al., 2016). The high tropospheric O3 concentration has become a serious air pollutant in China, and the tropospheric O3 level in 2015 led to a noticeably increased premature mortality of 0.9 % (Feng et al., 2019).
The ground-based Fourier transform infrared (FTIR) solar absorption spectrometry is a well-established remote-sensing technique which measures an ever-increasing list of chemical compounds along the entire line of sight between the ground-based instrument and the sun, thus providing information about the total column as well as the vertical profile for some species on both short and very long timescales. Within the Network for the Detection of Atmospheric Composition Change – Infrared Working Group (NDACC-IRWG), O3 is an important target gas (De Mazière et al., 2018), and there are about 20 active FTIR sites around the world providing ongoing O3 measurements (http://www.ndacc.org/, last access: 20 September 2020). The O3 retrieval strategy has been harmonized within NDACC (Vigouroux et al., 2015) and uses the absorption around 1000 cm−1 from the spectra recorded with a mercury cadmium telluride (MCT) detector. As NDACC provides long-term time series of O3 measurements with high accuracy and precision, these data are used to understand the atmospheric O3 trend (Vigouroux et al., 2015; Steinbrecht et al., 2017) and to validate the satellite measurements (Boynard et al., 2018).
A ground-based FTIR spectrometer (Bruker IFS 125HR) was installed at Xianghe (39.75∘ N, 116.96∘ E; 50 m a.s.l.) in June 2018 to measure the atmospheric carbon dioxide, methane and carbon monoxide (Yang et al., 2020). The FTIR instrument at Xianghe is operated with indium gallium arsenide (InGaAs) and indium antimonide (InSb) detectors, recording the spectra with a spectral range from 1800 to 11 000 cm−1. Therefore, the NDACC standard O3 retrieval strategy cannot be applied directly to the Xianghe spectra. Several other infrared microwindows have been applied to retrieve O3 from the ground-based FTIR spectra: Lindenmaier et al. (2010) summarized all the related FTIR O3 studies, and it appears that the 3040 cm−1 range is often used within the ground-based FTIR community. Takele Kenea et al. (2013) used six microwindows in the spectral range of 3039.37–3051.90 cm−1 for the O3 retrieval at Addis Ababa, Ethiopia. García et al. (2014) tested O3 retrievals in both the 3040 and 4030 cm−1 ranges at Izaña, Spain, and they found that the precision of O3 total column retrievals from the 3040 cm−1 range is 2 %, which is much better than the 5 % precision obtained in the 4030 cm−1 range. However, they found that the total column of O3 from the 3040 cm−1 range is about 7 % smaller than that retrieved in the standard NDACC 1000 cm−1 range.
The aim of this paper is to study the FTIR O3 retrieval in the 3040 cm−1 spectral range at Xianghe and to evaluate the retrieval uncertainty. Section 2 presents the retrieval strategy and the characteristics of the FTIR O3 retrieval at Xianghe. After that, we show the time series and seasonal variations of FTIR O3 retrievals between June 2018 and December 2019. In Sect. 3, the same retrieval strategy is applied for Maïdo, Réunion (21.08∘ N, 55.38∘ E; 2155 m a.s.l.), which is a NDACC-IRWG affiliated instrument. At both sites, we compare the FTIR O3 measurements with the nearby ozonesonde measurements and the co-located TROPOspheric Monitoring Instrument (TROPOMI) satellite measurements. In addition, the FTIR O3 retrievals (3040 cm−1) are compared to standard NDACC FTIR O3 retrievals (1000 cm−1) at Maïdo. Finally, the conclusions are drawn in Sect. 4.
The FTIR site at Xianghe Observatory of Whole Atmosphere is operated by the Institute of Atmospheric Physics (IAP), the Chinese Academy of Sciences (CAS). The FTIR system includes a Bruker IFS 125HR instrument, an automatic weather station and a sun tracker system (Yang et al., 2020). The spectra suitable for O3 retrievals are recorded with a maximum optical path difference of 180 cm, corresponding to a spectral resolution of 0.005 cm−1. The standard, wedged narrow-bandpass filter 3 (2420–3080 cm−1) used by the NDACC-IRWG community is inserted in front of the InSb detector in order to improve the signal-to-noise ratio (SNR). The mean SNR of the spectra used in this study is about 1400.
2.1 Retrieval strategy
The SFIT4_v9.4.4 algorithm (Pougatchev et al., 1995) is applied to retrieve the O3 profile using the optimal estimation method (OEM) (Rodgers, 2000):
where xr, xa and xt are retrieved, a priori and true state vectors (all retrieved parameters); A is the averaging kernel, representing the sensitivity of the retrieved parameters to the true status; and ϵ is the retrieved error. The SFIT4 algorithm minimizes the cost function (J(x)):
where y and F(x) are the observed and fitted spectra, respectively; Sϵ is the measurement covariance matrix; and Sa is the a priori covariance matrix. J(x) is the combination of the measurement information and the a priori information, with their weightings determined by Sϵ and Sa; Sϵ is derived from the SNR of the spectra, with its diagonal values set to 1∕SNR2 and off-diagonal values to 0; Sa is derived from the covariance matrix of the Whole Atmosphere Community Climate Model (WACCM) v4 O3 monthly means between 1980 and 2020 (Eyring et al., 2007; Marsh et al., 2013). The square root values of the diagonal elements of Sa are about 3 % near the surface, 2 % in the troposphere, 2.5 % in the stratosphere and 1 % above the stratosphere.
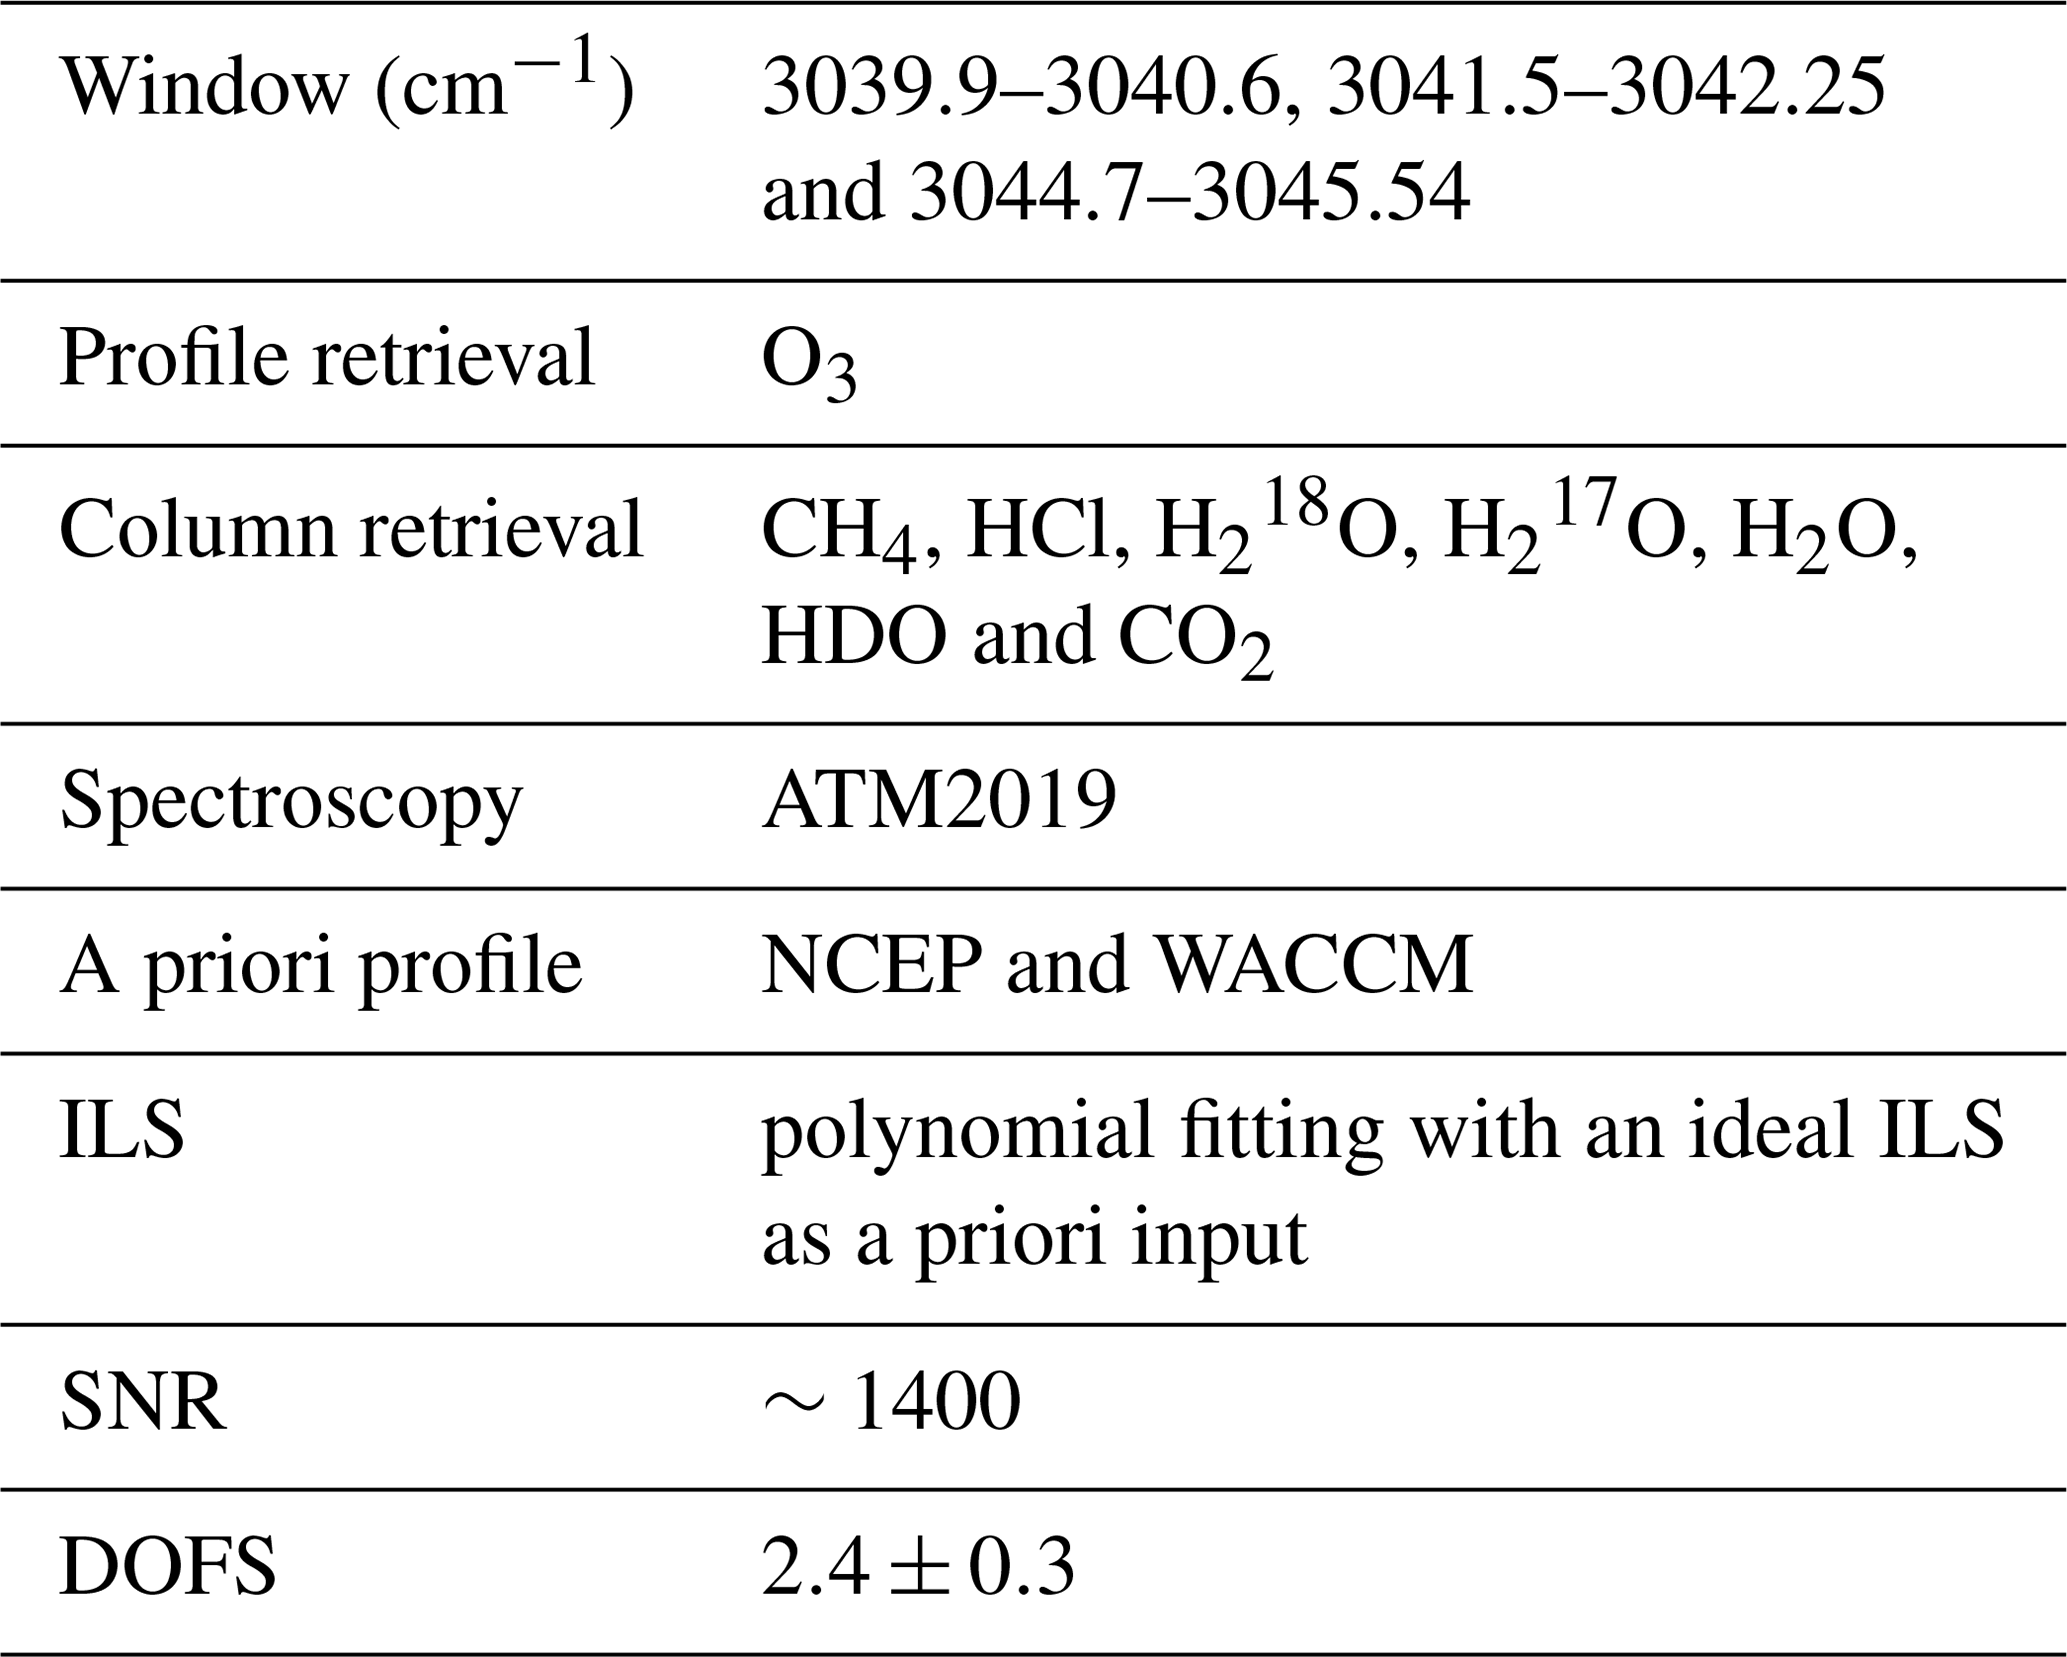
Table 1 lists the parameters adopted in the retrieval strategy for the FTIR O3 measurements at Xianghe in this study. We selected three retrieval windows (3039.9–3040.6, 3041.5–3042.25 and 3044.7–3045.54 cm−1) in this study, where the last two windows are taken from the study of García et al. (2014); the first window has the strongest O3 absorption lines and the least interference with H2O. Comparing to the retrieval windows used in García et al. (2014), the FTIR-retrieved O3 total columns from the three windows in this study are similar but slightly less affected by H2O abundances (see Appendix A). For the spectroscopic data, we use the atmospheric line list ATM2019 (https://mark4sun.jpl.nasa.gov/pseudo.html, last access: 26 March 2019). Figure 1 shows an example of the absorption lines and residuals in the three retrieval windows at Xianghe. The root-mean square (rms) of the residual is about 0.2 %. It contains a few badly fitted absorptions at O3 line positions in these three windows, caused by uncertainties in the spectroscopy. Further investigations are needed to improve the spectroscopic parameters in this spectral range, but that is beyond the scope of this study. To reduce the influence from the interfering species, CH4, HCl, , , H2O, HDO and CO2 columns are retrieved simultaneously with the O3 profile. The specific interfering species are selected for each window (see Fig. 1), because they have relatively larger absorptions compared to other weak species, e.g., CH3Cl, NH3 and OH. In addition, the solar intensity and wavenumber shift are retrieved simultaneously. Note that the H2O isotopes (, and HDO) are treated as individual species in the SFIT4 algorithm. The instrument line shape (ILS) is part of the state vector and retrieved simultaneously along with the O3 profile, with an ideal ILS being applied as the a priori input.
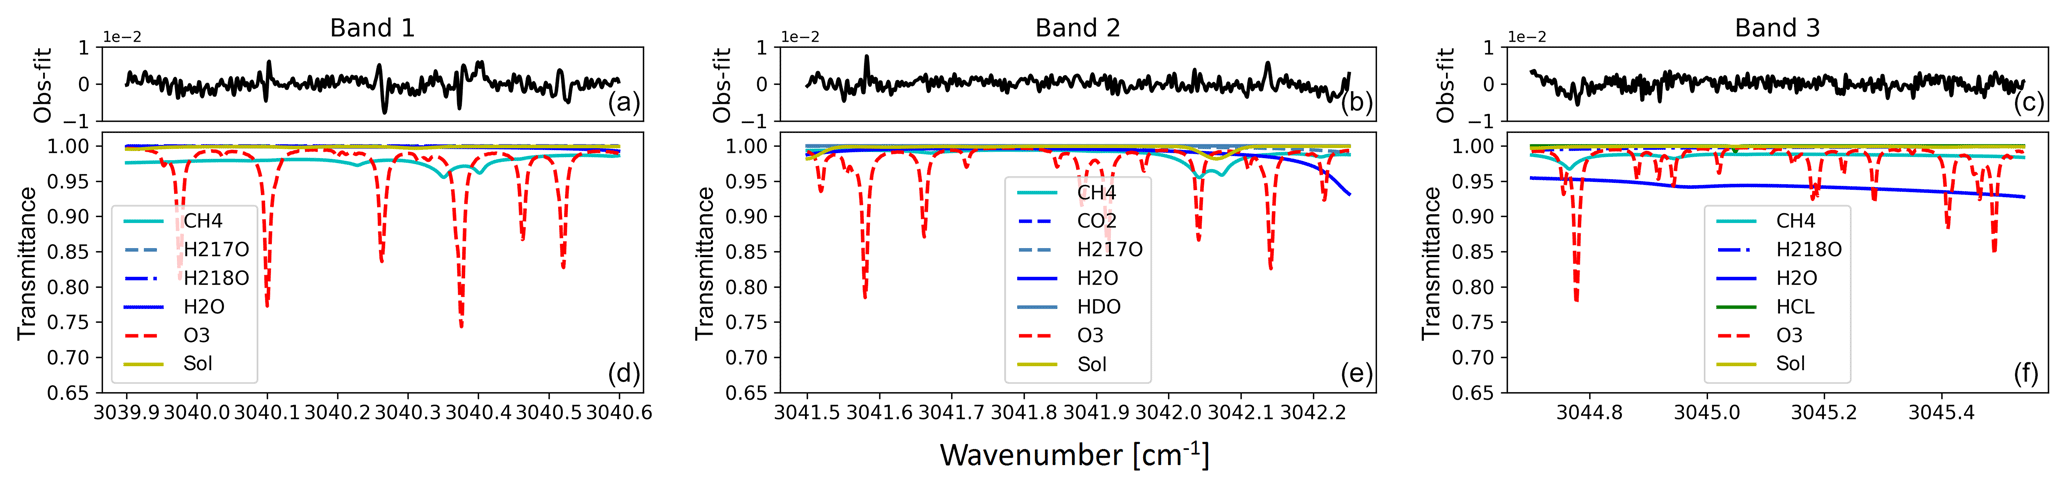
Figure 1Example of spectral fits in the three microwindows for O3 retrievals at Xianghe. (d, e, f) The normalized transmittance from each atmospheric species and solar lines. (a, b, c) The difference between the observed and fitted spectra (“Obs-fit”).
The temperature, pressure and H2O profiles are from the National Centers for Environmental Prediction (NCEP) 6-hourly reanalysis data. For the a priori profiles of O3 and other interfering species, we use the mean of the WACCM model data between 1980 and 2020. Since the broadening effect of absorption lines is related to the pressure and temperature, we can obtain limited vertical information of O3 by fitting the spectra. Figure 2 shows an example of the typical averaging kernel of the FTIR O3 retrieval at Xianghe. The retrieved O3 profile is mainly sensitive to the vertical range between 10 and 40 km. The degrees of freedom for signal (DOFS) is 2.4±0.3 (1σ), indicating that there are two individual pieces of information: partial columns between the surface and 20 km and between 20 and 40 km. Note that the lower partial column (surface to 20 km) is mainly sensitive to the upper troposphere and lower stratosphere (UTLS) and less sensitive to the boundary layer.
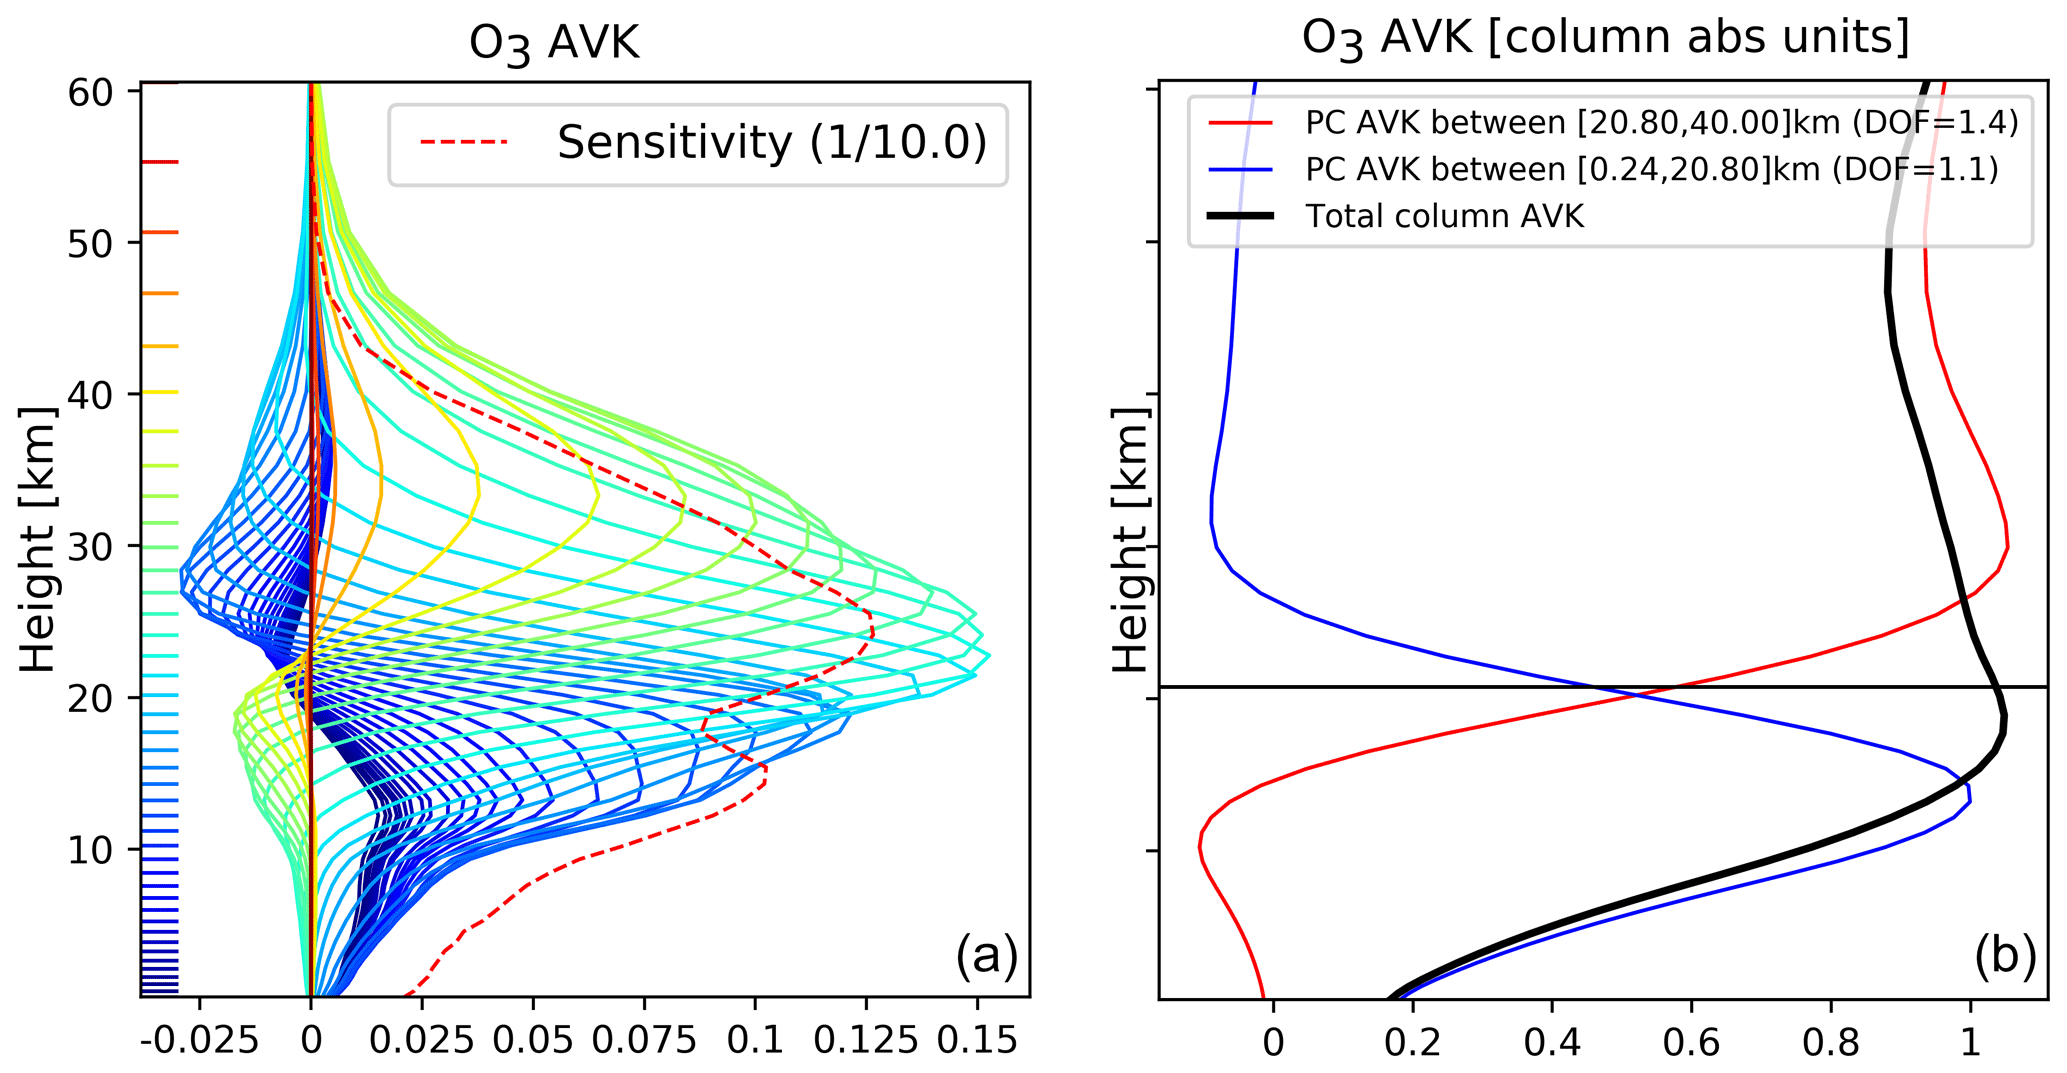
Figure 2Typical vertical sensitivity of the O3 retrieval at Xianghe. (a) The averaging kernel (AVK) matrix whose rows are color coded with the altitude of the retrieval grid (48 layers from the surface to the top of atmosphere). The dashed red line is the sensitivity curve (sum of averaging kernel rows) scaled by 1∕10 to bring it to the same scale as the averaging kernel. (b) The total column averaging kernel (black) and the partial column (PC) averaging kernels of two individual layers (surface–20 km and 20–40 km) with DOFS equal to 1.1 and 1.4, respectively.
Table 1The retrieval strategy of the FTIR O3 measurements using the 3040 cm−1 spectral range at Xianghe.
2.2 Uncertainty estimation
According to Rodgers (2000), the error () of the retrieved O3 profile is
where bt and b are the true and used model parameters, respectively, e.g., solar zenith angle (SZA), spectroscopy, temperature; I is the unit matrix; Gy is the contribution matrix; Kb is the Jacobian matrix for the model parameters; and ϵm is the noise of the spectra. The right-hand side of Eq. (3) contains the smoothing error (), the model parameter error (GyKb(bt−b)) and the measurement noise (Gyϵm). For each component, the systematic and random uncertainties are estimated individually. As the state vector contains the O3 profile, interfering species and other retrieved parameters, the smoothing error () can be divided into three portions (Zhou et al., 2016), corresponding to smoothing (from the O3 profile), interfering species and retrieval parameters in Table 2.
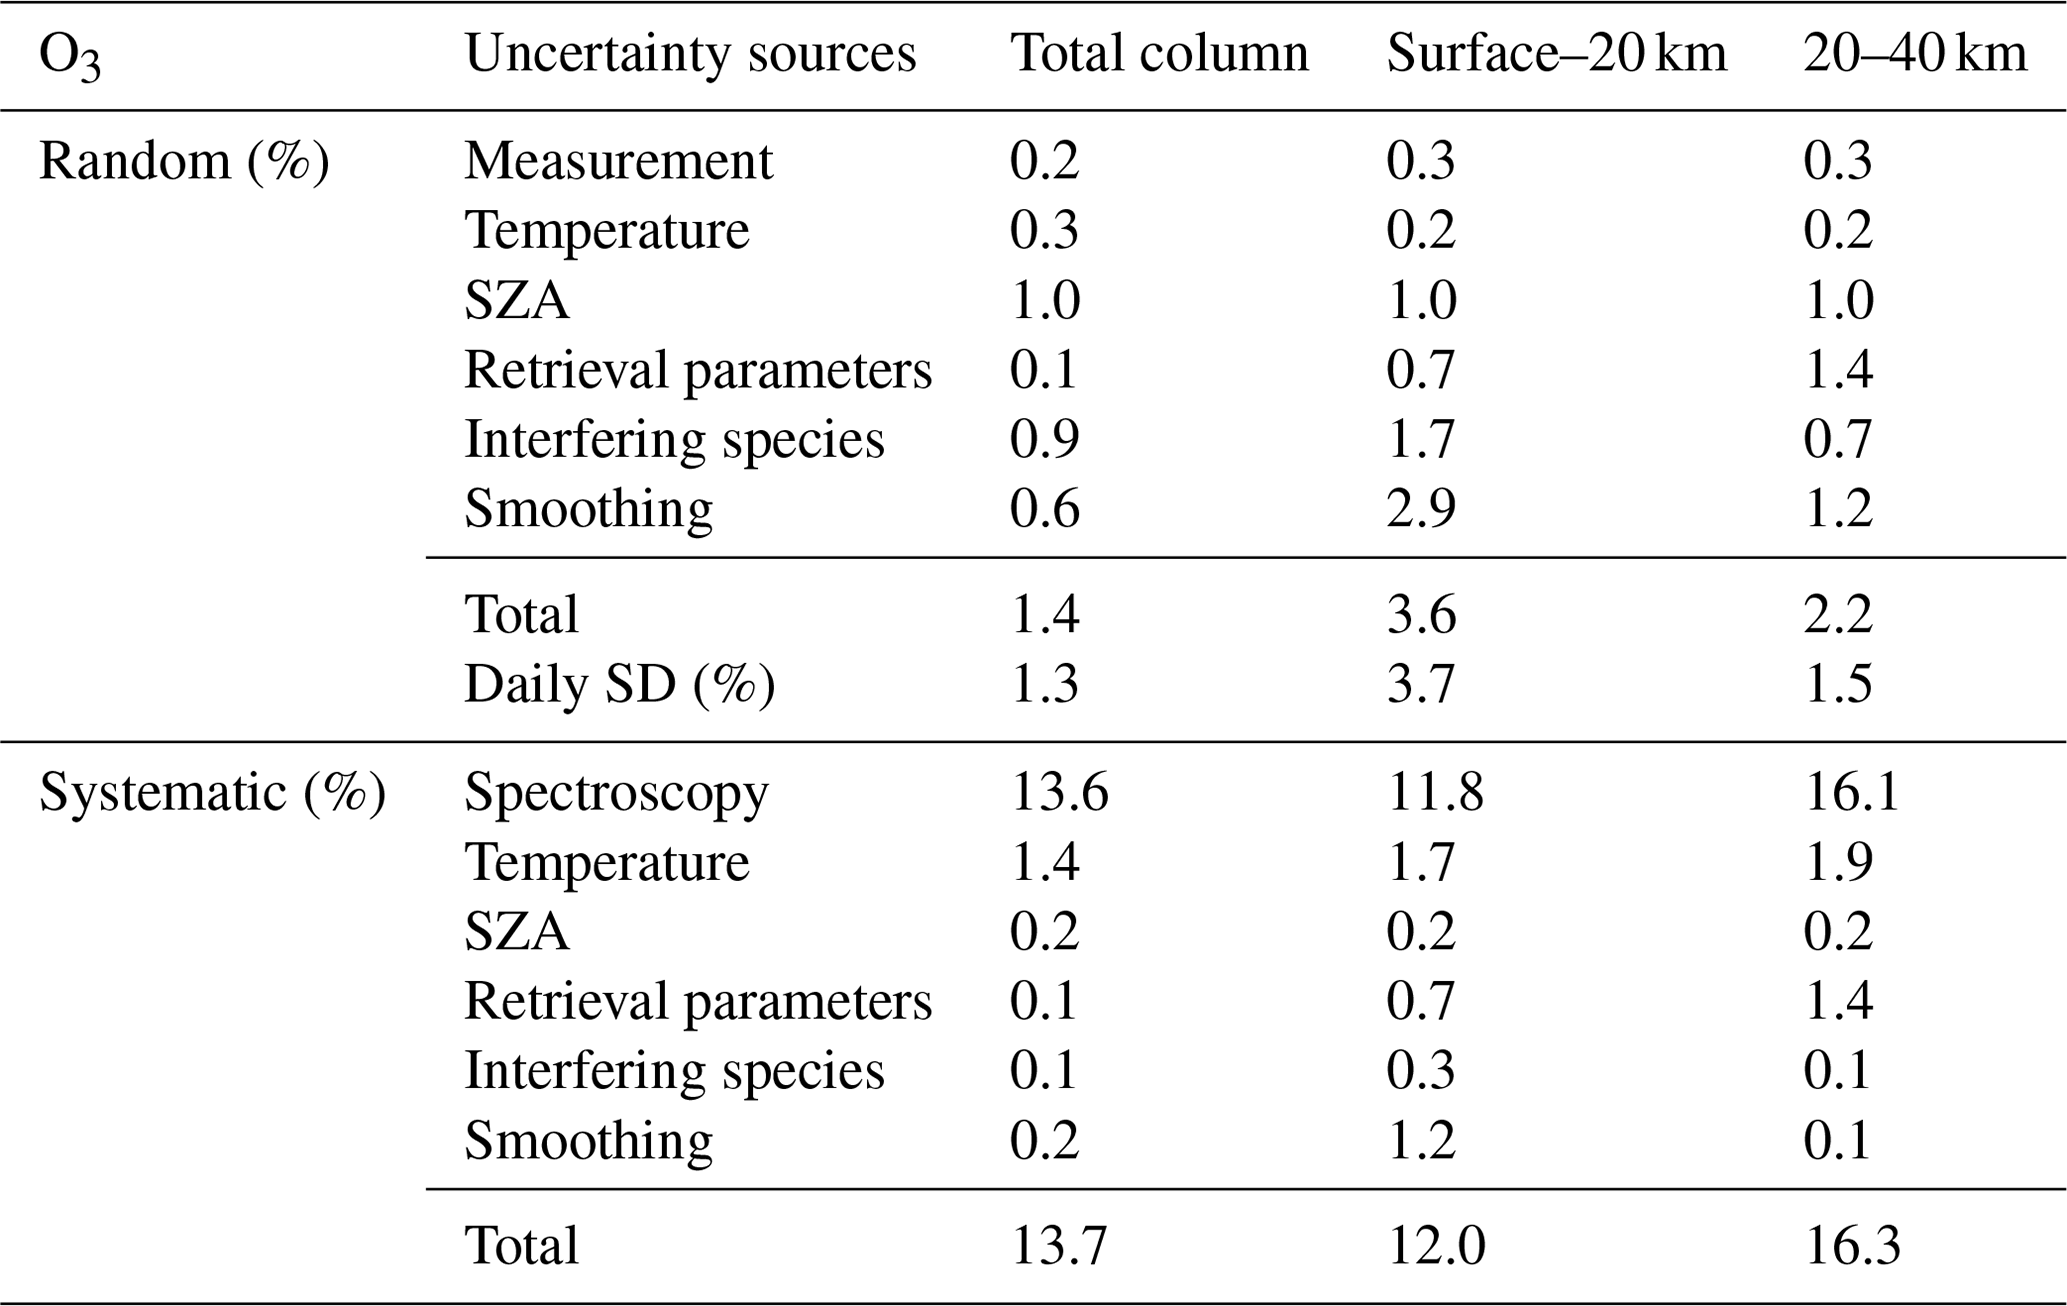
The ϵm is derived from the SNR. The systematic uncertainties of both O3 and interfering species a priori profiles are set to 10 %, and their random uncertainties are derived from the WACCM data. According to the ATM2019 line list, the systematic uncertainties of O3 line intensity, air broadening and pressure broadening are 10 %–20 %, 5 %–10 % and 5 %–10 %, respectively. In this study, we set 15 %, 7.5 % and 7.5 % for the systematic uncertainties of the O3 line intensity, air broadening and pressure broadening, respectively, and we assume that there are no random uncertainties. The uncertainties for temperature and H2O are derived from the difference between NCEP reanalysis data and the European Centre for Medium-Range Weather Forecasts (ECMWF) ERA5 reanalysis data, where the mean difference is set as the systematic uncertainty, and the standard deviation (SD) of the differences is set as the random uncertainty. The systematic uncertainty of the temperature profile is about 0.5 K for the whole altitude range, and its random uncertainty is about 2 K below 2 km and 1 K above. The random and systematic uncertainties for SZA are set to 0.5 % and 0.1 %, respectively. Table 2 shows the resulting total uncertainty on the retrieved O3 total column and two partial columns. The systematic uncertainty is dominated by the uncertainty from the spectroscopy. The random uncertainty of the total column is 1.4 %, which is coming mainly from the SZA and interfering species uncertainties. The random uncertainty of the lower partial column (surface–20 km) is 3.6 %, which comes mainly from the smoothing error and SZA uncertainty. The random uncertainty of the upper partial column (20–40 km) is 2.2 %, which comes mainly from the smoothing error and retrieval parameter uncertainties. To check the estimated random uncertainty, we calculated the mean of daily SD for all days with more than four measurements (see Table 2). Keep in mind that daily SD still includes the signal of the diurnal variation; therefore, it might be slightly larger when compared to the random uncertainty. In general, the SDs of the total column and the two partial columns are close to the estimated uncertainties, indicating that the random uncertainties have been estimated correctly.
Table 2The estimated retrieval uncertainty of the retrieved O3 total column and two partial columns at Xianghe, together with the corresponding means of the daily SD of the FTIR O3 retrievals.
2.3 Time series and seasonal variations
Figure 3 shows the time series of the total column of FTIR O3 measurements, as well as two partial columns (surface–20 km and 20–40 km) from June 2018 to December 2019 at Xianghe. The seasonal variation is fitted with a periodic third-order function (), with t in fraction of year) using all the individual measurements. The mean total column is 8.70×10¹⁸ molecules cm−2, and the mean partial columns between the surface and 20 km and between 20 and 40 km are 3.42×10¹⁸ and 5.05×10¹⁸ molecules cm−2, respectively. The lower partial column (surface–20 km) has a minimum in August–September and a maximum in February–April, while the upper partial column (20–40 km) has a minimum in October–December and a maximum in May–July. The peak-to-peak amplitude of the seasonal variation in the partial column between surface and 20 km is 1.3×10¹⁸ molecules cm−2, which is much larger than that in the partial column between 20 and 40 km of 0.4×10¹⁸ molecules cm−2. Therefore, the seasonal variation of the total column is dominated by the lower partial column (surface–20 km). The FTIR O3 retrieved lower partial column (surface–20 km) has a maximum sensitivity in the UTLS region (see Fig. 2). The ozonesonde measurements between 2002 and 2010 at Beijing (Wang et al., 2012) showed that the high O3 concentrations are in the UTLS in late winter and spring with a year-to-year variation and the low O3 concentrations are in the UTLS in August–September. In the middle and upper stratosphere (20–40 km), the maximum observed in summer is mainly due to the higher photochemical production in this season (Perliski et al., 1989).

Figure 3The time series of the FTIR retrieved O3 total column (c), as well as the partial column between surface and 20 km (b) and the partial column between 20 and 40 km (a) from June 2018 to December 2019 at Xianghe. The gray dots are individual retrievals. The orange dots and error bars are the monthly means and SDs. The dashed red line is the mean, and the solid red line is the fitted seasonal variation. N is the measurement number.
For the purpose of validating the FTIR O3 retrievals at Xianghe in the 3040 cm−1 spectral range, we first compare them with nearby ozonesonde and co-located TROPOMI measurements. Secondly, we apply the same retrieval strategy (3040 cm−1) to the FTIR observations at Maïdo (Réunion), which is a NDACC affiliated site, and we compare them with the standard NDACC O3 retrievals (1000 cm−1) at this site, as well as with nearby ozonesonde and co-located TROPOMI measurements.
3.1 Ozonesonde
The ozonesonde is a compact, lightweight balloon-borne instrument which is coupled to a meteorological radiosonde. The balloon is launched at the surface and ascends up to the upper stratosphere (about 35 km), providing in situ measurements of the ozone profile with a high vertical resolution of about a few hundred meters (Thompson et al., 2003). According to Deshler et al. (2017), the accuracy of the ozonesonde profile is within 10 % in the troposphere and 5 % in the stratosphere. The precision of the ozonesonde is about 3 %–5 % (Deshler et al., 2008; Liu et al., 2009).
The ozonesondes were launched at Beijing Nanjiao Meteorological Observatory (39.81∘ N, 116.47∘ E; 31 m a.s.l.), which is about 50 km west of the Xianghe site. The ozonesonde instrument was developed at IAP, CAS (named as IAP ozonesonde). The IAP ozonesonde consists of an anode cell and a cathode cell, and uses an electrochemical method, which is similar to the electrochemical concentration cell (ECC)-type ozonesonde. For detailed information about the instrument, please refer to Zhang et al. (2014b). The performance of the IAP ozonesonde measurements has been evaluated by comparison with other ECC ozonesonde measurements (Zhang et al., 2014b): the average difference in the ozone partial pressure between the IAP and ECC ozonesondes is 0.3 mPa from the surface to 2.5 km, close to zero from 2.5 to 9 km and generally less than 1 mPa for layers higher than 9 km, and the precision of the IAP ozonesonde is within 5 % in the troposphere and within 10 % in the stratosphere. Note that we have applied the pressure pump efficiency corrections to the IAP ozonesonde (Zheng et al., 2018). The IAP ozonesonde measurements used in this study cover the period between June 2018 and February 2019, after which the ozonesonde measurements stopped.
The ozonesonde data performed at Gillot, Réunion (20.89∘ S, 55.53∘ E; 8 m a.s.l.), are affiliated with NDACC (De Mazière et al., 2018) and the Southern Hemisphere ADditional OZonesondes (SHADOZ) network (Thompson et al., 2003). Detailed information about the ozonesonde measurements at Gillot can be found in Thompson et al. (2014) and Witte et al. (2017), where the ozonesonde measurements are applied to understand the tropospheric ozone increases over the southern Africa region. Gillot is about 26 km away from Maïdo and is considered representative for the ozone concentrations at Maïdo (Duflot et al., 2017). The ozonesonde measurements used in this study cover the period between April 2013 and July 2017.
We select FTIR measurements within a ±3 h window around each ozonesonde, and we take the averaged FTIR retrieval and the ozonesonde measurement as one FTIR–sonde data pair. In total, we have 16 and 53 data pairs at Xianghe and Maïdo, respectively. As the vertical resolution of ozonesondes is much higher than that of the FTIR retrievals, the ozonesonde profiles are smoothed with the FTIR averaging kernel to reduce the smoothing error in the comparison between both (Rodgers and Connor, 2003):
where xF, a is the FTIR a priori profile, xs is the ozonesonde profile, is the smoothed ozonesonde profile, and A is the FTIR averaging kernel. To apply the smoothing correction, we have extended the ozonesonde profile to the top of atmosphere using the FTIR a priori profile.
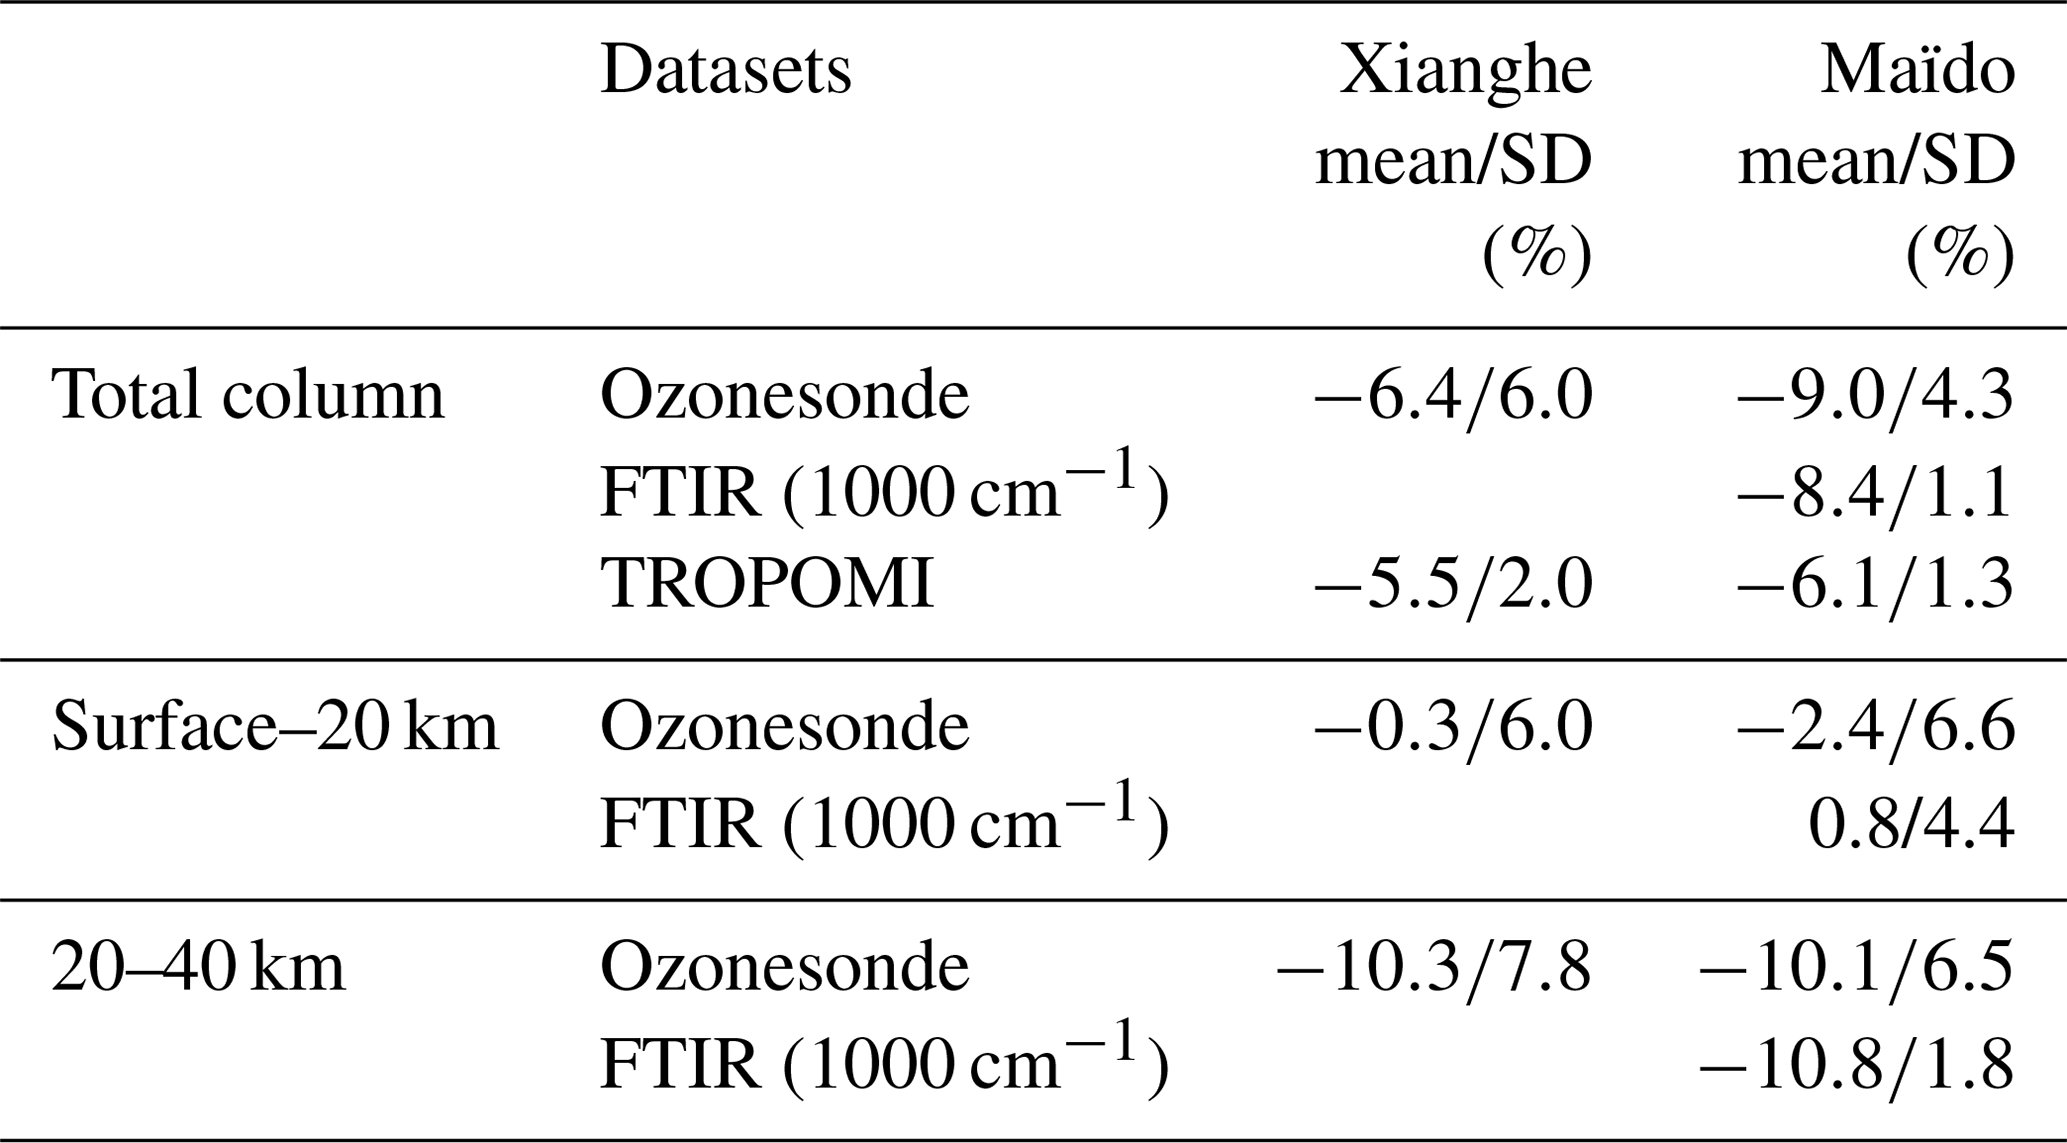
The profiles of the FTIR retrievals and ozonesonde measurements, together with their relative differences at Xianghe and Maïdo, are shown in Fig. 4. In general, the relative difference profiles at these two sites are similar: within ±15 % below 20 km and between −30 % and 10 % between 20 and 40 km. The total column observed by ozonesonde is 6.4±6.0 (1σ) % and 9.0±4.3 % larger than the FTIR (3040 cm−1) retrievals at Xianghe and Maïdo, respectively. To check the impact of the O3 columns above the maximum height of the ozonesonde, we also compare the FTIR column between the surface to the maximum altitude of each co-located ozonesonde profile, where the ozonesonde measurements are 6.2±6.1 % and 9.7±7.0 % larger than the FTIR retrievals at Xianghe and Maïdo, respectively. As a result, the impact of extending the ozonesonde profile to higher altitude with the FTIR a priori profile is relatively small compared to the large uncertainty. The comparisons between the total and partial columns (surface–20 km and 20–40 km) retrieved from the FTIR and the ozonesonde measurements are listed in Table 3.
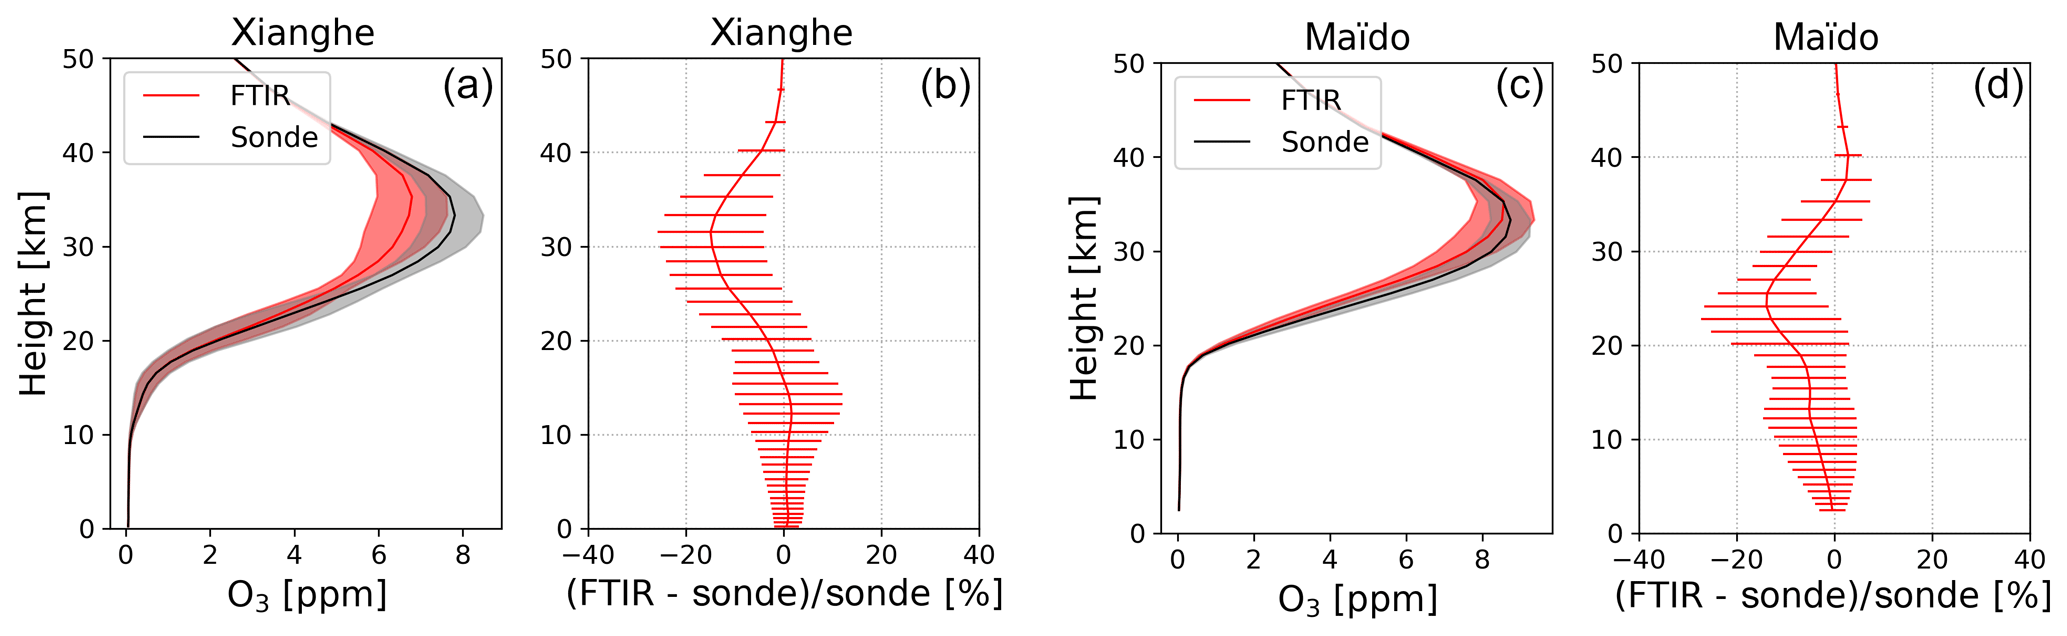
Figure 4The O3 profiles from the smoothed ozonesonde and FTIR retrievals (the solid line is the mean and the shading is the SD), together with their relative differences (the solid line is the mean and the error bar is the SD) at Xianghe (a, b) and Maïdo (c, d).
Table 3The mean and SD (“mean/SD”) of the relative differences between the FTIR O3 (3040 cm−1) retrievals with other datasets (ozonesonde, TROPOMI and FTIR O3 (1000 cm−1 retrievals)) in total column and two partial columns (surface–20 km and 20–40 km) at Xianghe and Maïdo. The relative difference is calculated as %.
3.2 TROPOMI satellite measurements
The Sentinel-5 Precursor (S5P) satellite, carrying the TROPOMI instrument, was successfully launched into a sun-synchronous orbit on 13 October 2017, providing a high horizontal resolution of 7×3.5 km2 before 6 August 2019 and of 5.5×3.5 km2 since then. TROPOMI observes a number of trace species globally, including O3, with a nadir view. In this section, the TROPOMI offline (OFFL) total ozone column measurements are compared with the FTIR O3 (3040 cm−1) retrievals at Xianghe and Maïdo. The prelaunch requirements regarding accuracy and precision of the TROPOMI OFFL O3 total column product are 3.5 %–5.0 % and 1.6 %–2.5 %, respectively. TROPOMI OFFL O3 total column products have been validated by ground-based Brewer, Dobson and zenith scattered light differential optical absorption spectroscopy (ZSL-DOAS) measurements. It is found that the mean bias between the TROPOMI and ground-based measurements is +0.1 %, and the SD of the relative differences is about 2.0 %, which is within the mission requirements (Garane et al., 2019).
We select TROPOMI satellite OFFL data within a ±6 h temporal window and within a ±1.0∘ latitude and ±3.0∘ longitude box of each FTIR O3 measurement at Xianghe and Maïdo. As the FTIR measurements at Xianghe start in June 2018, in this section, we compare the FTIR O3 (3040 cm−1) measurements with TROPOMI OFFL data between June 2018 and December 2019 at both sites. As mentioned in Sect. 2.1, the FTIR a priori profile is derived from the WACCM model, while the a priori profile of the TROPOMI retrieval is from a column-classified ozone profile climatology (Heue et al., 2018). In order to reduce the influence of different a priori profiles, we substitute the satellite a priori profile for the ground-based FTIR a priori profile when comparing both datasets:
where is the adapted FTIR profile by using the satellite a priori profile as the a priori profile, xr is the original FTIR retrieved profile, and xs, a and xF, a are the satellite and FTIR a priori profiles. TROPOMI provides the column averaging kernel (As) together with the total column; therefore, we applied the smoothing correction to the adapted FTIR profile:
where TCs, a is the TROPOMI a priori total column and is the FTIR retrieved total column after a priori profile substitution and taking TROPOMI vertical sensitivity into account.
Figure 5 shows the time series of the co-located FTIR and TROPOMI O3 total columns, together with their differences and correlations at Maïdo and Xianghe. Similar to ozonesonde measurements, the TROPOMI measurements are 5.5±2.0 % and 6.1±1.3 % larger than the FTIR (3040 cm−1) total columns at Xianghe and Maïdo, respectively. In addition, there is no clear time dependence in the relative differences between FTIR and TROPOMI total columns.
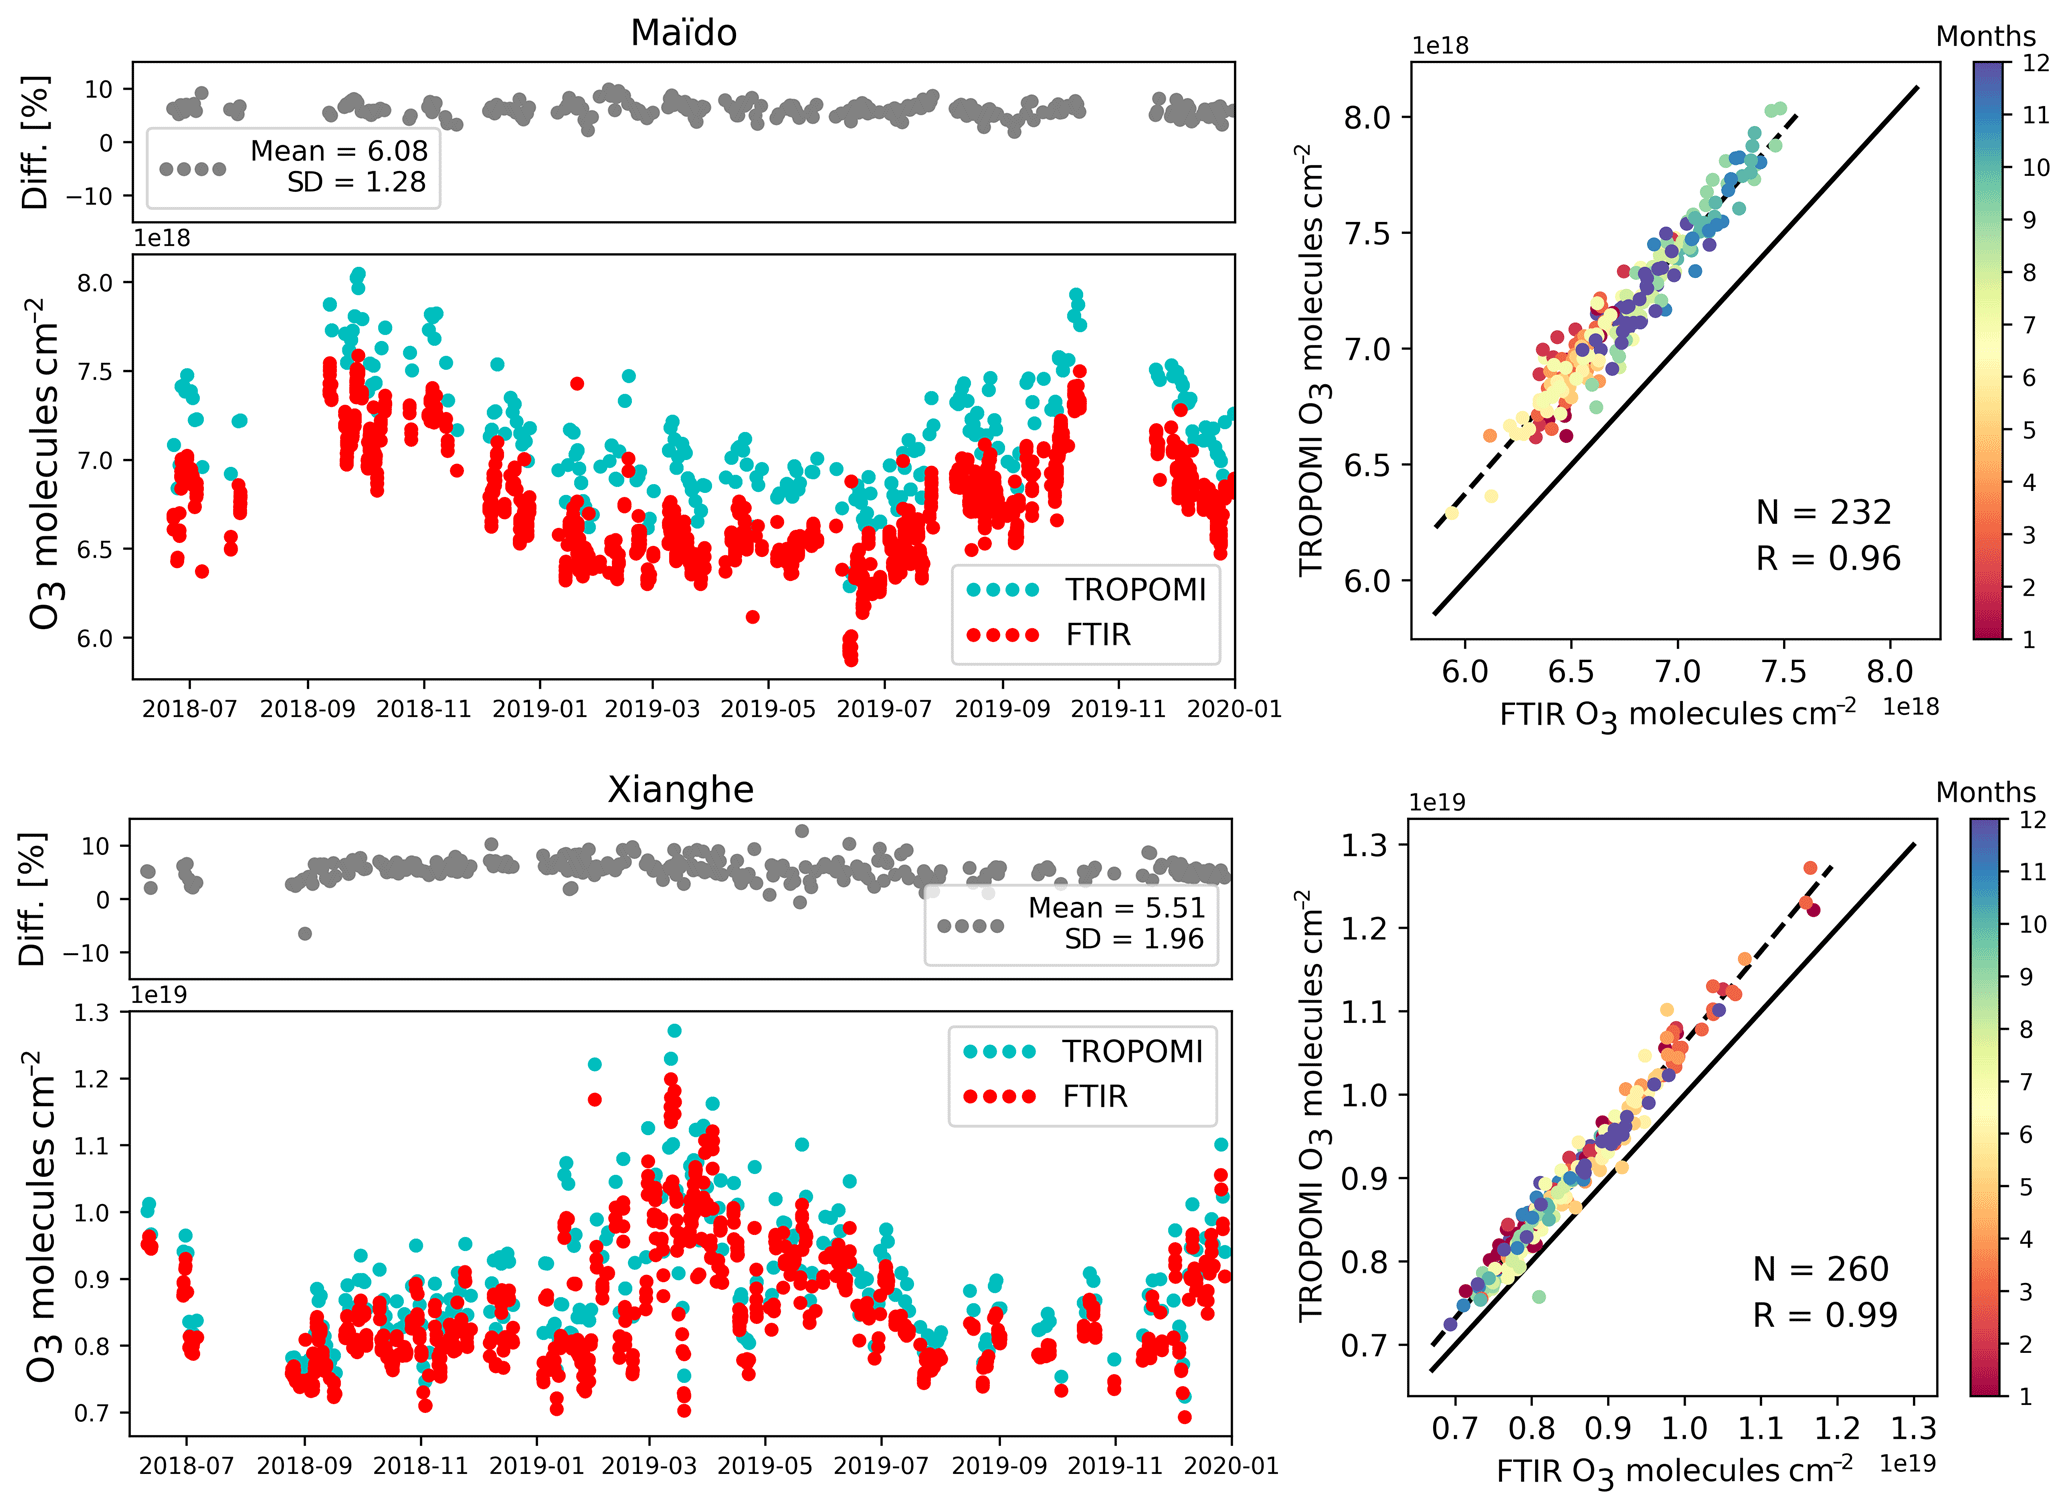
Figure 5The time series of the co-located total columns from FTIR and TROPOMI measurements, together with their relative differences ( %) and their correlations at Maïdo and Xianghe between June 2018 and December 2019. N is the co-located number of data pairs and R is the correlation coefficient. The correlation dots are colored with their measurement months. The dashed black line is the linear regression line.
There is a good correlation between the FTIR and TROPOMI measurements at Xianghe (R=0.99) and Maïdo (R=0.96). The seasonal and synoptic variations (phase and amplitude) of total columns of O3 from the FTIR and TROPOMI measurements are very close to each other at both sites. As an example, FTIR and TROPOMI measurements show that there is a large enhancement of O3 total column on 31 January 2019 at Xianghe (see Fig. 6). Keep in mind that we should focus on the total column and two partial columns of FTIR measurements instead of the FTIR retrieved O3 profile due to its limited vertical information. According to the FTIR measurements, both partial columns increase on that day, but the large increase of the total column mainly results from the enhancement of the lower partial column from the surface to 20 km altitude. There is one ozonesonde profile available on 31 January 2019, which confirms that the O3 mole fraction is much larger compared to the FTIR a priori profile above 10 km, especially in the UTLS region. The smoothed ozonesonde profile is close to the FTIR retrieved profile below 23 km, which is consistent with our results in Table 3.
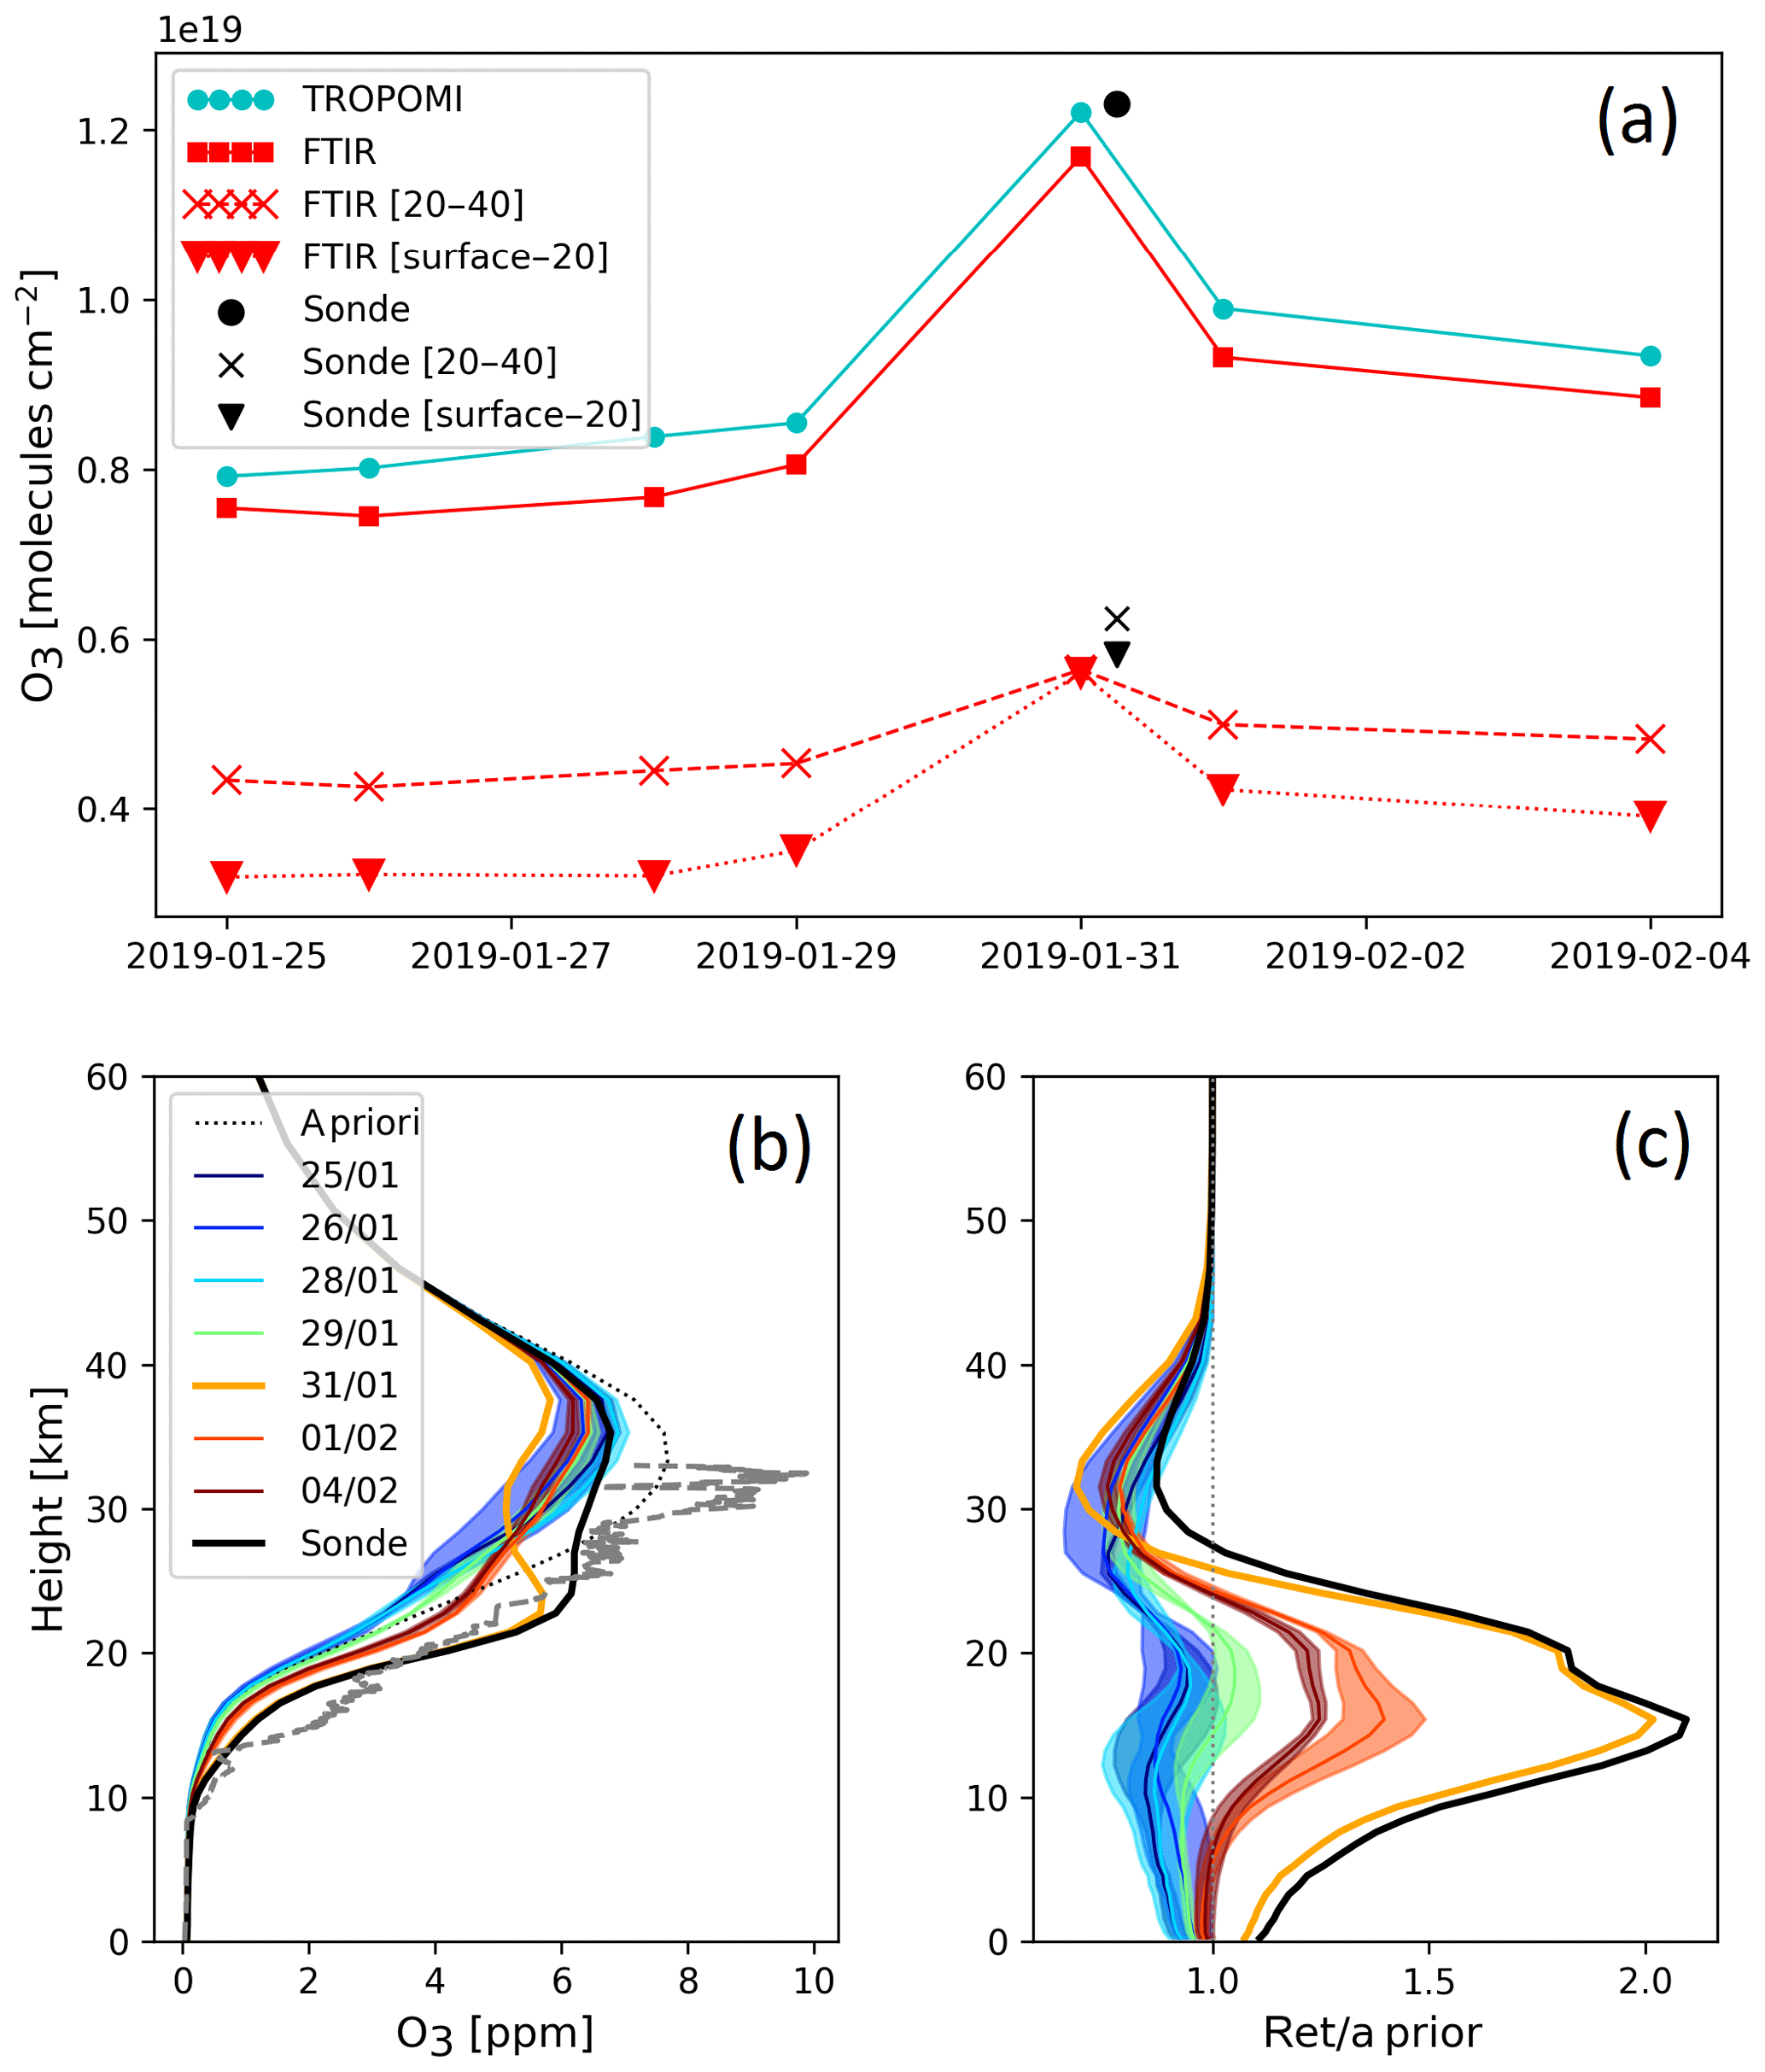
Figure 6(a) The time series of the daily-mean total and partial columns from co-located FTIR and TROPOMI measurements between 25 January and 4 February 2019, as well as one ozonesonde profile (with smoothing using FTIR averaging kernel) on 31 January 2019 at Xianghe. For visualizing, the ozonesonde measurement is shifted by 6 h. (b) The FTIR a priori (dotted gray line) and retrieved (colored with date) profiles during this period. The shading is the SD of the retrieved profile for each day. The dashed grey line is the original ozonesonde profile, and the solid black line is the smoothed ozonesonde profile. (c) The ratios of the FTIR retrieved profiles and the smoothed ozonesonde profile to the FTIR a priori profile are shown.
3.3 FTIR (1000 cm−1) retrievals
Maïdo is an NDACC station, where FTIR measurements using an MCT detector are carried out (Baray et al., 2013; Zhou et al., 2018). The harmonized O3 standard retrieval strategy using 1000–1005 cm−1 has been performed at Maïdo so that we can compare the FTIR (3040 cm−1) with the FTIR (1000 cm−1) retrievals for total column as well as for two partial columns. The FTIR O3 (1000 cm−1) retrieval has a DOFS of about 4 to 5, because in this spectral range it benefits from more O3 lines with different intensities. The systematic and random uncertainties of the total column from FTIR O3 (1000 cm−1) retrievals are about 3.0 % and 1.0 %, respectively. The systematic and random uncertainties of the surface to 20 km partial column retrievals are about 3.2 % and 2.5 %, respectively, and of the 20 to 40 km partial column retrievals are about 3.4 % and 1.5 %, respectively. Both precision and accuracy are better using O3 (1000 cm−1) than O3 (3040 cm−1), which explains why the MCT spectral region is preferred at NDACC stations where these measurements are available. The systematic uncertainty is also dominated by the spectroscopy (HITRAN2008; Rothman et al., 2009), where we set 3 % for the uncertainty of line intensity (NDACC-IRWG recommendation, based on total column comparisons with Dobson and Brewer measurements, e.g., in Vigouroux et al., 2008).
The a priori profiles of the FTIR O3 (1000 cm−1) retrievals are the same as those of the FTIR O3 (3040 cm−1) retrievals (see Sect. 2.1). To take the low vertical resolution of the FTIR (3040 cm−1) retrieval into account, the FTIR (1000 cm−1) retrieved profile is smoothed with the FTIR (3040 cm−1) averaging kernel:
where xa is the FTIR a priori profile, x1000 is the FTIR (1000 cm−1) retrieved profile, and is the FTIR (1000 cm−1) retrieved profile after smoothing with the FTIR (3040 cm−1) averaging kernel (A).
The time series of the hourly-mean retrieved O3 total column and partial columns (surface–20 and 20–40 km) in the 3040 and 1000 cm−1 spectral ranges, together with their differences and correlations, are shown in Fig. 7. Both O3 datasets show the same seasonal variations in the total column and the two partial columns. The mean and SD of their relative differences are also listed in Table 3. The O3 (3040 cm−1) total columns have a negative bias of 8.4±1.1 % compared to the O3 (1000 cm−1) total columns. For the lower partial column (surface–20 km), the two FTIR O3 retrievals are close to each other, with a mean relative difference of 0.8±4.4 %. The O3 upper partial column (20–40 km) retrieved in the 3040 cm−1 spectral range is 10.8±1.8 % smaller than the one retrieved in the 1000 cm−1 spectral range.
García et al. (2014) found that there is an underestimation of 7 % in the FTIR O3 (3040 cm−1) total column compared to FTIR O3 (1000 cm−1) retrievals at Izaña based on the HITRAN2012 spectroscopy (Rothman et al., 2013), which is generally in good agreement with our result (8.4±1.1 %) at Maïdo. In this study, we also looked at comparisons between the two partial columns. The biases observed between FTIR O3 (3040 cm−1) and FTIR O3 (1000 cm−1), on the one hand, and between FTIR O3 (3040 cm−1) and ozonesondes, on the other hand, are similar (see Table 3), pointing to an underestimation of the FTIR retrieved total and partial columns products in the 3040 cm−1 spectral range; the bias is coming mainly from the 20–40 km partial column bias.
The FTIR O3 (3040 cm−1) retrievals and the FTIR O3 (1000 cm−1) retrievals are highly correlated, with R values of 0.95, 0.87 and 0.89 in the total column, the lower partial column (surface–20 km) and the upper partial column (20–40 km), respectively. The mean of daily SDs for the days for which more than four measurements are available are 0.57 % and 0.58 % in the total column, 2.41 % and 0.85 % in the lower partial column (surface–20 km), and 0.77 % and 0.71 % in the upper partial column (20–40 km) for FTIR O3 (3040 cm−1) and smoothed FTIR O3(1000 cm−1) retrievals, respectively. In summary, the two FTIR O3 retrievals at Maïdo show a similar precision in the total column and the upper partial column (20–40 km), while the FTIR O3 lower partial columns (surface–20 km) retrievals are more variable in the 3040 cm−1 than in the 1000 cm−1 spectral ranges.
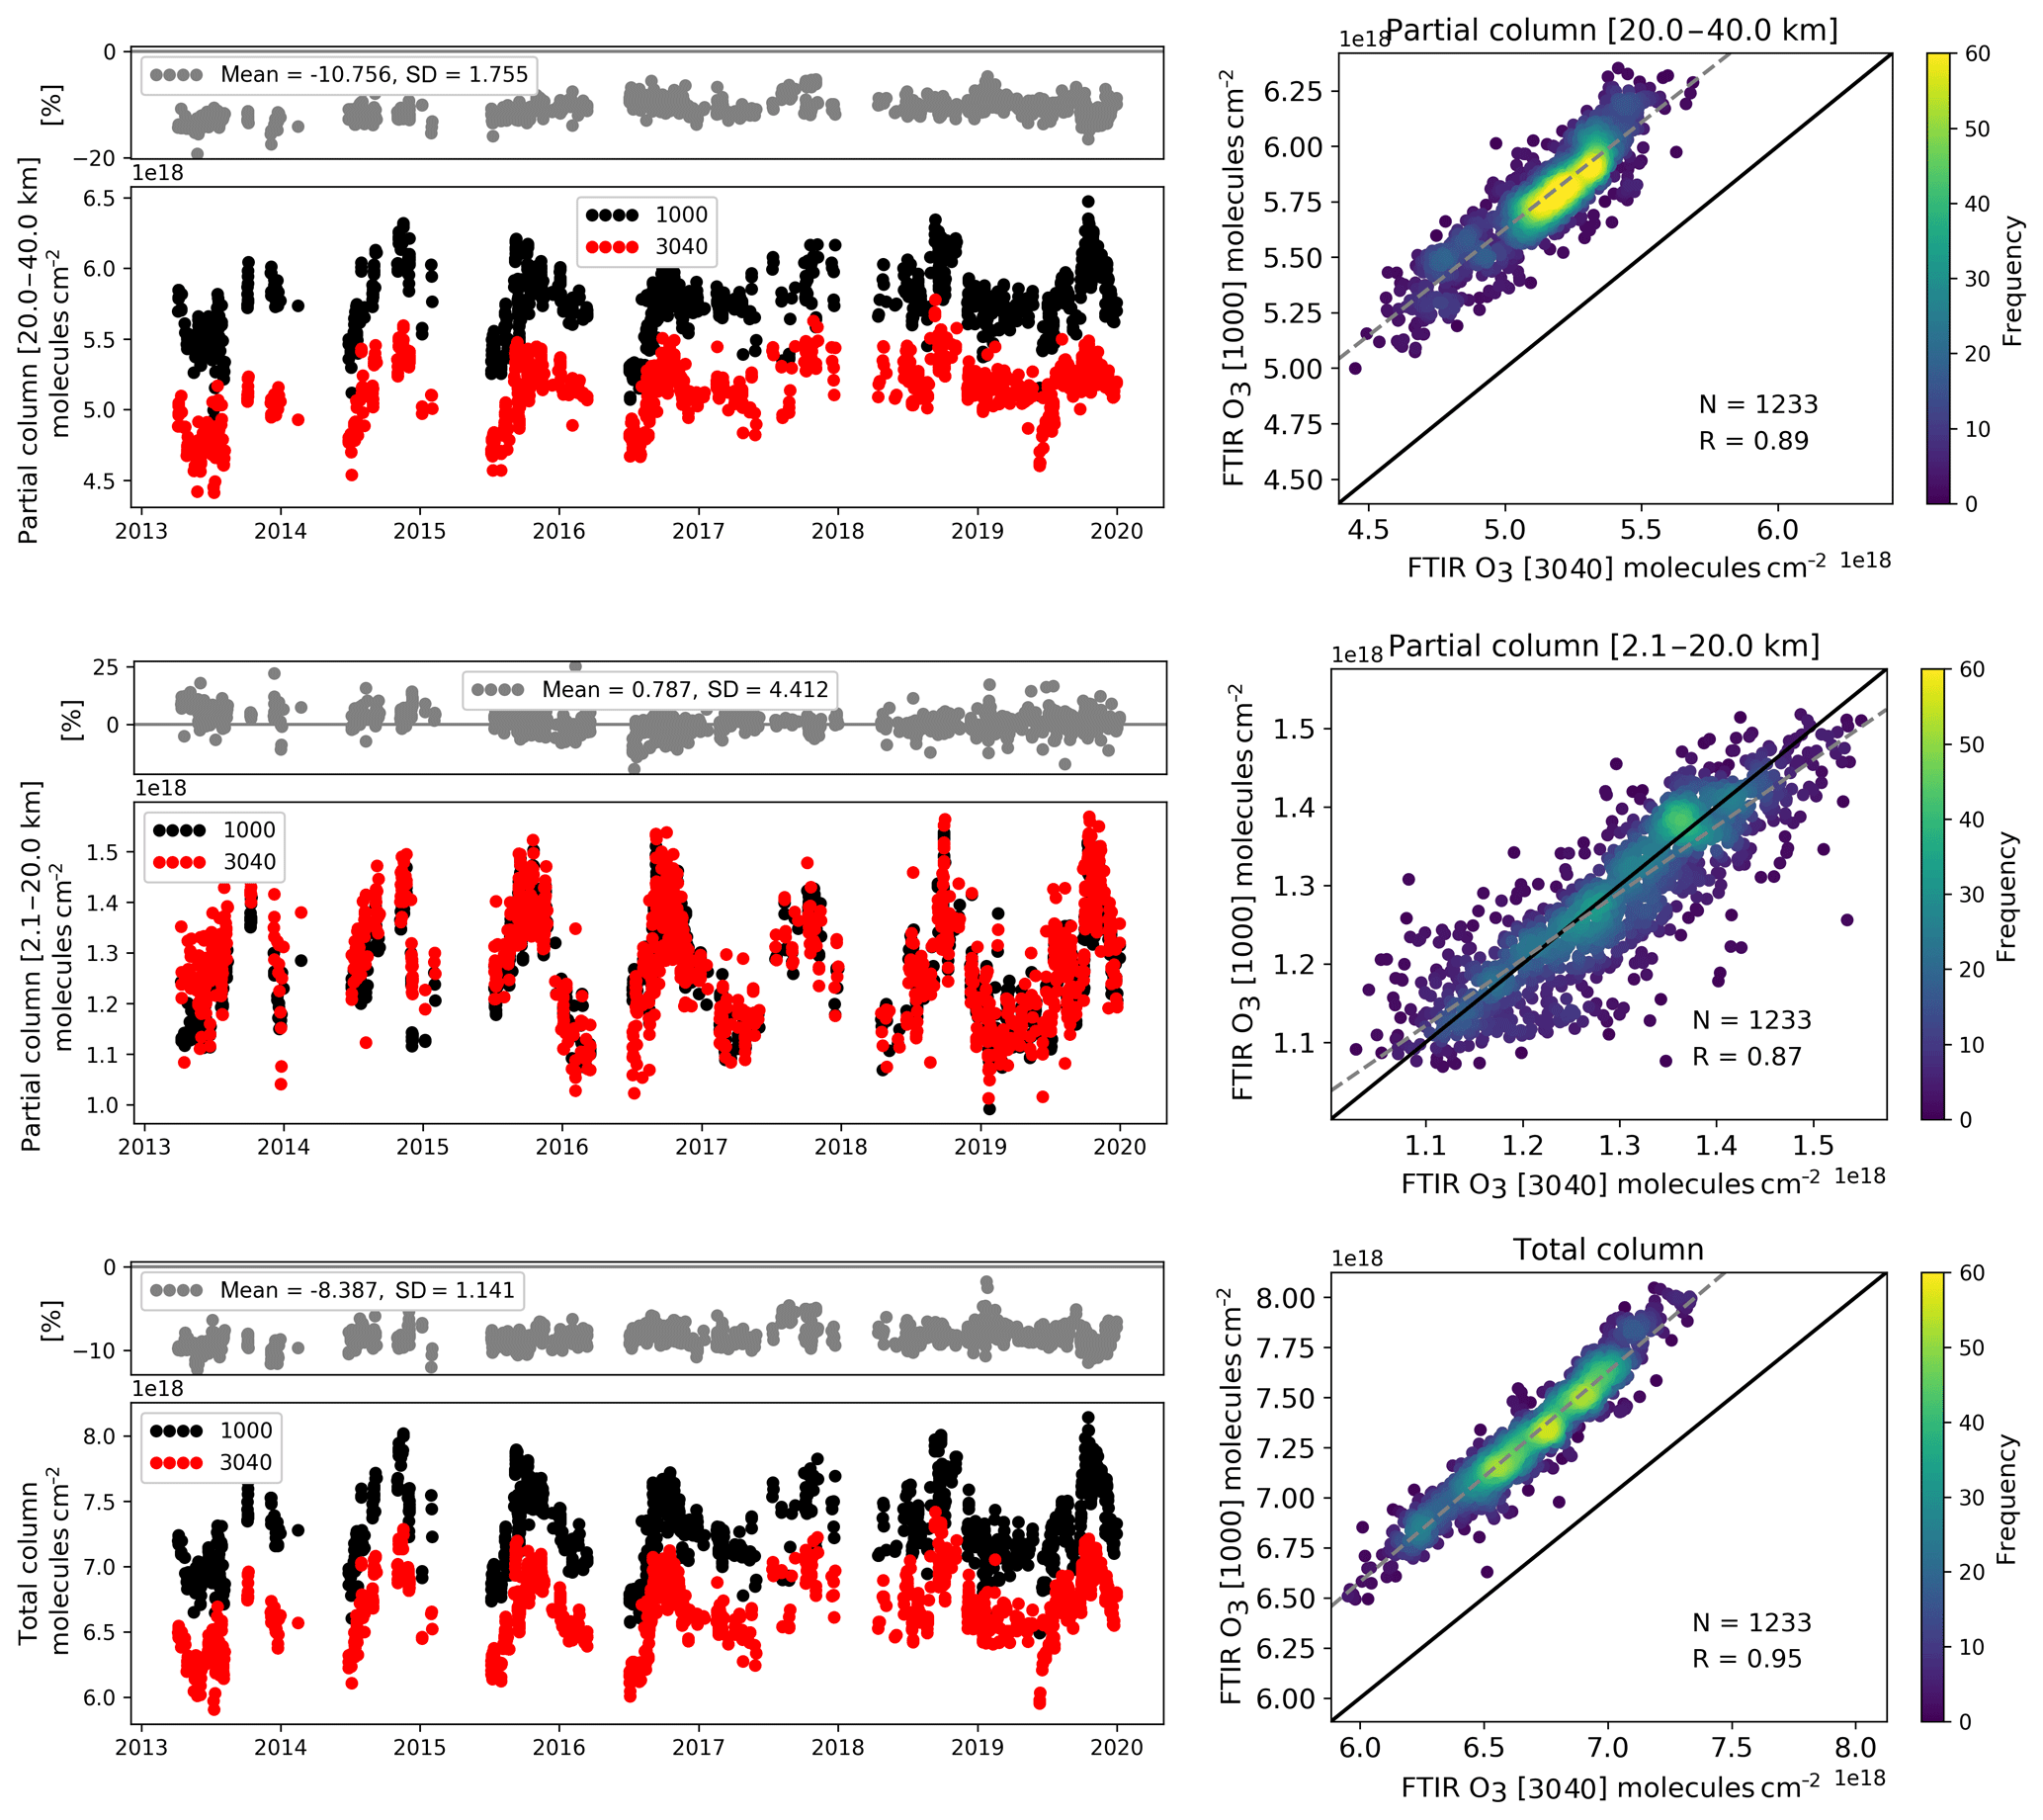
Figure 7The time series of the co-located hourly means of total columns (bottom), partial columns between surface and 20 km (middle), and partial columns between 20 and 40 km (top) from FTIR retrievals using the 3040 cm−1 (red) and the 1000 cm−1 (black) spectral ranges, together with their relative differences ( %) and their correlations, in which color intensity corresponds to data frequency, at Maïdo between 2013 and 2019. The dashed gray line is the linear regression line. N is the co-located number of data pairs and R is the correlation coefficient.
The standard NDACC-IRWG O3 retrieval uses the retrieval window of 1000–1005 cm−1 recorded with an MCT detector. However, at some ground-based atmospheric observatories the FTIR solar absorption instruments are not configured for operation with an MCT detector. This is the case at Xianghe, China (39.75∘ N, 116.96∘ E), where the FTIR instrument is operated with InSb and InGaAs detectors covering the spectral range from 1800 to 11000 cm−1. Therefore, in this paper, we present ground-based FTIR O3 retrievals at Xianghe between June 2018 and December 2019 using the standard NDACC-IRWG SFIT4 v9.4.4 retrieval algorithm and the spectral windows (3039.9–3040.6, 3041.5–3042.25 and 3044.7–3045.54 cm−1). The resulting averaging kernel shows that the retrieved O3 profile is mainly sensitive to the vertical range between 10 and 40 km, and the DOFS is 2.4±0.3 (1σ), indicating that we can retrieve two independent partial columns: one from the surface to 20 km and a second one from 20 to 40 km altitude. Based on the optimal estimation method, we have estimated the systematic and random uncertainties of the retrieved FTIR O3 total columns to be about 13.6 % and 1.4 %, respectively, in which the random error is generally in good agreement with the observed daily SD of the FTIR retrievals.
The FTIR retrieval systematic uncertainty is then verified by comparing the FTIR O3 retrievals in the 3040 cm−1 spectral range with nearby ozonesonde and co-located TROPOMI measurements at Xianghe and Maïdo and with NDACC standard FTIR O3 (1000 cm−1) retrievals at Maïdo. There is a systematic underestimation by 5.5 %–9.0 % in the FTIR O3 (3040 cm−1) total column retrievals, which is within the estimated systematic uncertainty and mainly due to the spectroscopic uncertainties. According to ozonesonde measurements and standard NDACC FTIR O3 retrievals, the underestimation of the FTIR (3040 cm−1) O3 total column mainly results from the underestimation by 10.1 %–10.8 % in the upper partial column (20–40 km). The systematic uncertainty is relatively small in the lower partial column (surface–20 km), which is within 2.4 %.
At Xianghe, the FTIR retrieved O3 partial columns between the surface and 20 km show a maximum in February–April and a minimum in August–September, with a peak-to-peak amplitude of 1.3×10¹⁸ molecules cm−2, while the 20–40 km partial columns show a maximum in May–July and a minimum in October–December, with a peak-to-peak amplitude of 0.4×10¹⁸ molecules cm−2. As the amplitude of the seasonal variation in the lower partial column (surface–20 km) is much larger than the one in the upper partial column (20–40 km), the seasonal variation of the total column is dominated by the lower partial column. The FTIR (3040 cm−1) retrievals at Xianghe and Maïdo show the same seasonal and synoptic O3 variations as seen by the TROPOMI satellite measurements and the NDACC standard FTIR O3 retrievals at Maïdo.
The ongoing FTIR O3 total and partial columns (surface–20 km and 20–40 km) data at Xianghe can provide useful information on O3 synoptic and seasonal variations and long-term trends. Based on the successful and consistent O3 retrieval results at Xianghe and Maïdo, the retrieval strategy used in this study can be extended to other FTIR sites recording the 3040 cm−1 spectral range.
The retrieval windows used in this study are modified from the 3040 cm−1 method of García et al. (2014). As mentioned in Sect. 2.1, windows 2 and 3 are taken from their method, but we use window 1 (3039.9–3040.6 cm−1) instead of the window between 3042.48 and 3043.72 cm−1 to reduce the impact from water vapor. To better understand the influence of retrieval window, we also perform the FTIR O3 retrieval at Xianghe using the window in García et al. (2014) (3041.47–3045.66 cm−1 disregarding the residuals in the 3042.28–3042.48 and 3043.72–3044.04 cm−1 ranges), and we keep other settings the same as the retrieval strategy described in Sect. 2.1. Note that the columns of interfering species (CH4, HCl, , , H2O, HDO, and CO2) are retrieved simultaneously. Figure A1 shows the observed and fitted transmittances between 3042.48 and 3043.72 cm−1 of the same spectrum shown in Fig. 1, containing several absorption lines of water vapor. It is noticed that the CH4 lines are not well fitted in this region so that the rms of the residual in this region is about 20 % larger as compared to the windows used in this study. Figure A2 shows the time series and the correlation plot of the FTIR-retrieved O3 total columns using the windows in this study and the window by García et al. (2014) at Xianghe. The mean and standard deviation of the relative difference (this study minus García) are 0.8 % and 1.2 %, respectively, and the correlation coefficient (R) is 0.99, indicating that the two FTIR O3 retrieved total columns are close to each other. However, the number of successfully retrieved spectra using the windows in this study is 937, which is larger than the 895 spectra using the method by García et al. (2014), especially in summer with high humidity. Besides, the mean of the daily standard deviation of the retrieved total column for all days with more than four measurements using window by García et al. (2014) is 1.4 %, which is slightly larger when compared to 1.3 % using the windows in this study. Therefore, we use the 3039.9–3040.6 cm−1 window instead of the 3042.48–3043.72 cm−1 window, which gives us a better result at Xianghe.
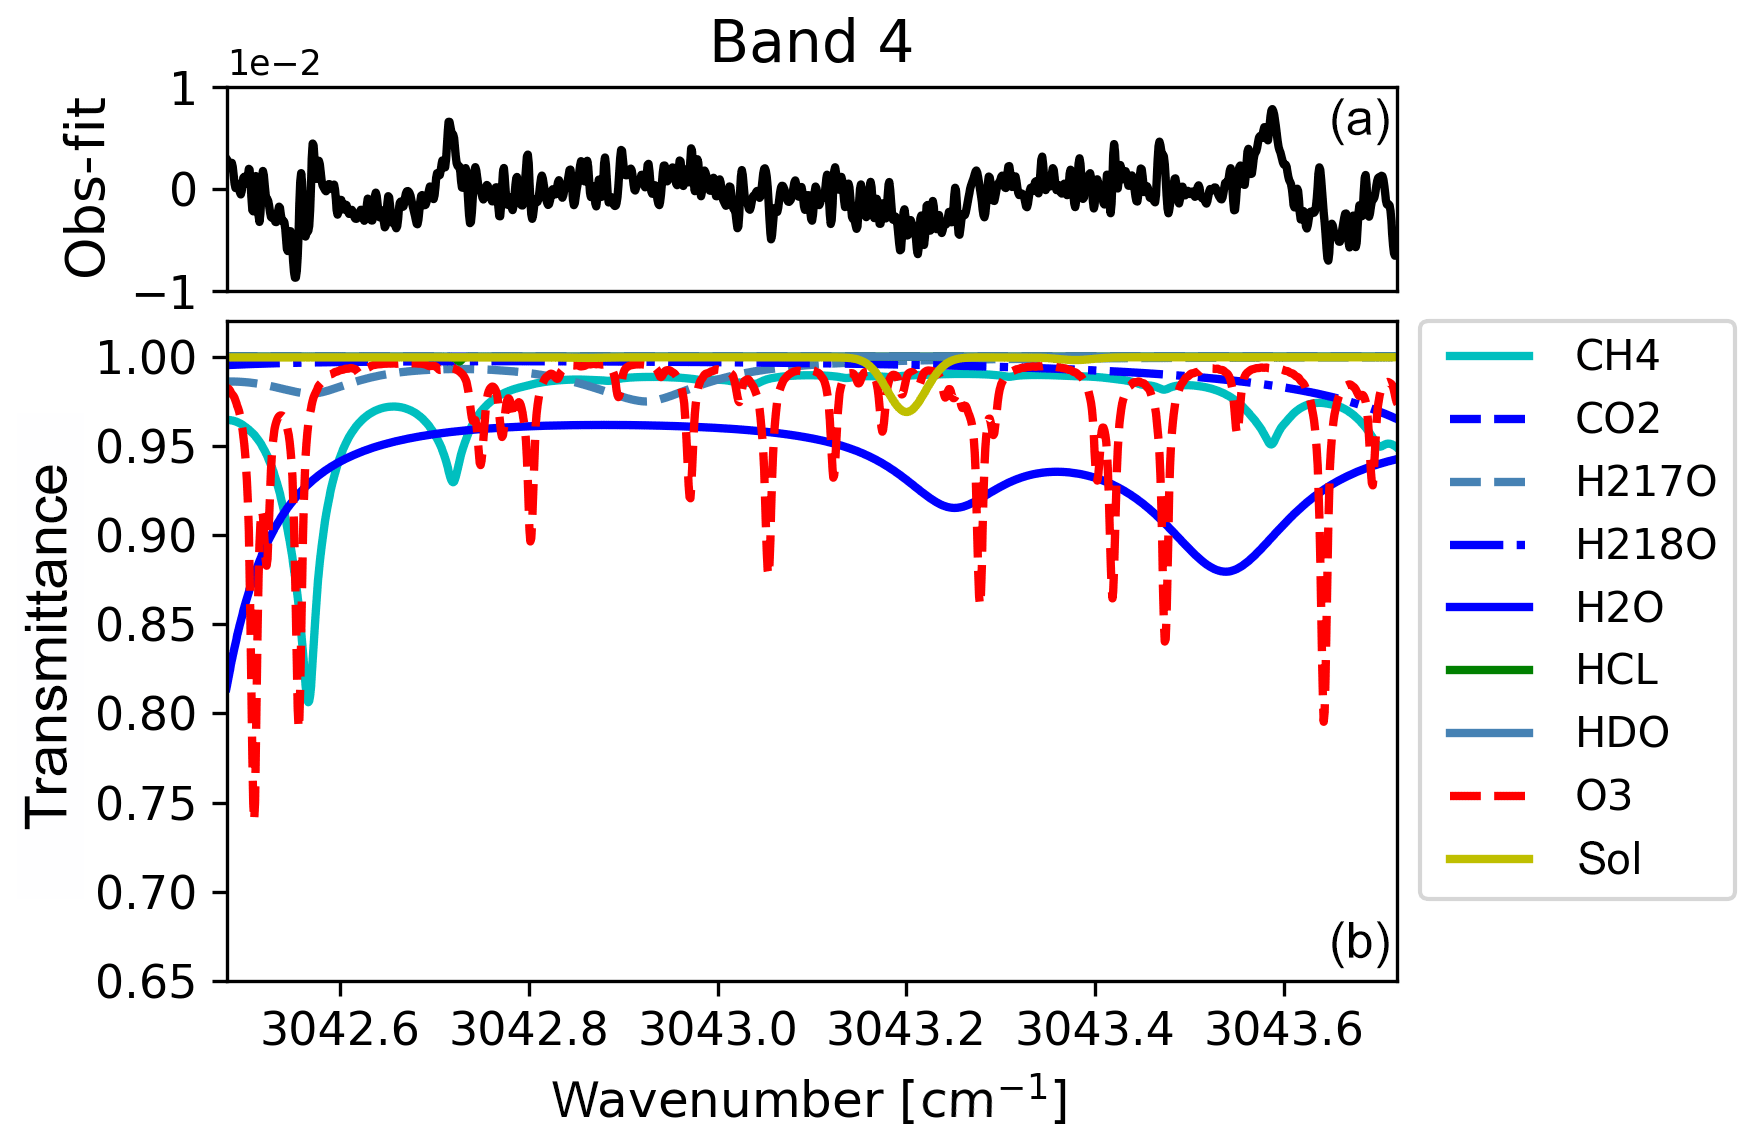
Figure A1An example of spectral fit in the microwindow between 3042.48 and 3043.72 cm−1 using the method of García et al. (2014) at Xianghe. It is the same spectrum shown in Fig. 1. (b) The normalized transmittance from each atmospheric species and solar lines. (a) The difference between the observed and fitted spectra (“Obs-Fit”).

Figure A2The time series the FTIR-retrieved O3 total column using the windows in this study and by García et al. (2014) at Xianghe (a), together with their correlation (b).
The NDACC standard FTIR O3 (1000 cm−1) retrievals at Maïdo and the ozonesonde measurements are publicly available at the NDACC archive (http://www.ndacc.org, last access: 20 January 2019, InfraRed working Group, 2020). The TROPOMI offline data are publicly available at the ESA Copernicus Open Access Hub (https://scihub.copernicus.eu/, last access: 20 September 2020, Copernicus Open Access Hub, 2020). The FTIR O3 (3040 cm−1) retrievals at Xianghe used in this study are available via https://github.com/zmq814/O3_xianghe.git (last access: 17 August 2020, Zhou, 2020).
MZ wrote the article. MZ and PW designed the experiment, with significant inputs from BL, CV, LR and MDM. CH, NK, TW, YY, DJ and JMM collected the FTIR measurements at Xianghe and Maïdo. JZ, YX, HC, VD and FP provided and studied the ozonesonde measurements at Beijing and Gillot. All the authors read and commented on the article.
The authors declare that they have no conflict of interest.
This research was supported by the National Key R&D Program of Chin and the National Natural Science Foundation of China. The FTIR site at Réunion is operated by the BIRA-IASB and locally supported by LACy/UMR8105, Université de La Réunion. We would like to thank Weidong Nan, Qun Cheng and Rongshi Zou (IAP) for the FTIR maintenance at Xianghe; Geoffrey C. Toon (JPL, NASA) for sharing the ATM2019 spectroscopy; Daan Hubert (BIRA-IASB) for useful discussion about the ozonesonde measurements; James Hannigan (NCAR) for providing the WACCM data at Xianghe; and Ball William (ETH Zürich) for useful discussions. We also acknowledge the NDACC-IRWG network for providing the retrieval code and ESA for providing the TROPOMI products.
This research has been supported by the Copernicus Atmosphere Monitoring Service (contracts nos. CAMS-84 and CAMS-27) and National funding (grant no. 0INFRARED), the National Key R&D Program of China (grant nos. 2017YFB0504000 and 2017YFC1501701) and the National Natural Science Foundation of China (grant no. 41975035).
This paper was edited by Kimberly Strong and reviewed by two anonymous referees.
Baray, J.-L., Courcoux, Y., Keckhut, P., Portafaix, T., Tulet, P., Cammas, J.-P., Hauchecorne, A., Godin Beekmann, S., De Mazière, M., Hermans, C., Desmet, F., Sellegri, K., Colomb, A., Ramonet, M., Sciare, J., Vuillemin, C., Hoareau, C., Dionisi, D., Duflot, V., Vérèmes, H., Porteneuve, J., Gabarrot, F., Gaudo, T., Metzger, J.-M., Payen, G., Leclair de Bellevue, J., Barthe, C., Posny, F., Ricaud, P., Abchiche, A., and Delmas, R.: Maïdo observatory: a new high-altitude station facility at Reunion Island (21∘ S, 55∘ E) for long-term atmospheric remote sensing and in situ measurements, Atmos. Meas. Tech., 6, 2865–2877, https://doi.org/10.5194/amt-6-2865-2013, 2013. a
Boynard, A., Hurtmans, D., Garane, K., Goutail, F., Hadji-Lazaro, J., Koukouli, M. E., Wespes, C., Vigouroux, C., Keppens, A., Pommereau, J.-P., Pazmino, A., Balis, D., Loyola, D., Valks, P., Sussmann, R., Smale, D., Coheur, P.-F., and Clerbaux, C.: Validation of the IASI FORLI/EUMETSAT ozone products using satellite (GOME-2), ground-based (Brewer–Dobson, SAOZ, FTIR) and ozonesonde measurements, Atmos. Meas. Tech., 11, 5125–5152, https://doi.org/10.5194/amt-11-5125-2018, 2018. a
Copernicus Open Access Hub: ESA, available at: https://scihub.copernicus.eu/, last access: 20 September 2020. a
De Mazière, M., Thompson, A. M., Kurylo, M. J., Wild, J. D., Bernhard, G., Blumenstock, T., Braathen, G. O., Hannigan, J. W., Lambert, J.-C., Leblanc, T., McGee, T. J., Nedoluha, G., Petropavlovskikh, I., Seckmeyer, G., Simon, P. C., Steinbrecht, W., and Strahan, S. E.: The Network for the Detection of Atmospheric Composition Change (NDACC): history, status and perspectives, Atmos. Chem. Phys., 18, 4935–4964, https://doi.org/10.5194/acp-18-4935-2018, 2018. a, b
Deshler, T., Mercer, J. L., Smit, H. G., Stubi, R., Levrat, G., Johnson, B. J., Oltmans, S. J., Kivi, R., Thompson, A. M., Witte, J., Davies, J., Schmidlin, F. J., Brothers, G., and Sasaki, T.: Atmospheric comparison of electrochemical cell ozonesondes from different manufacturers, and with different cathode solution strengths: The Balloon Experiment on Standards for Ozonesondes, J. Geophys. Res., 113, D04307, https://doi.org/10.1029/2007JD008975, 2008. a
Deshler, T., Stübi, R., Schmidlin, F. J., Mercer, J. L., Smit, H. G. J., Johnson, B. J., Kivi, R., and Nardi, B.: Methods to homogenize electrochemical concentration cell (ECC) ozonesonde measurements across changes in sensing solution concentration or ozonesonde manufacturer, Atmos. Meas. Tech., 10, 2021–2043, https://doi.org/10.5194/amt-10-2021-2017, 2017. a
Duflot, V., Baray, J.-L., Payen, G., Marquestaut, N., Posny, F., Metzger, J.-M., Langerock, B., Vigouroux, C., Hadji-Lazaro, J., Portafaix, T., De Mazière, M., Coheur, P.-F., Clerbaux, C., and Cammas, J.-P.: Tropospheric ozone profiles by DIAL at Maïdo Observatory (Reunion Island): system description, instrumental performance and result comparison with ozone external data set, Atmos. Meas. Tech., 10, 3359–3373, https://doi.org/10.5194/amt-10-3359-2017, 2017. a
European Commission: Emission Database for Global Atmospheric Research (EDGAR), release EDGARv4.2 FT2010, Tech. rep., Joint Research Centre (JRC)/Netherlands Environmental Assessment Agency (PBL), available at: https://edgar.jrc.ec.europa.eu/ (last access: 12 April 2020), 2013. a
Eyring, V., Waugh, D. W., Bodeker, G. E., Cordero, E., Akiyoshi, H., Austin, J., Beagley, S. R., Boville, B. A., Braesicke, P., Brühl, C., Butchart, N., Chipperfield, M. P., Dameris, M., Deckert, R., Deushi, M., Frith, S. M., Garcia, R. R., Gettelman, A., Giorgetta, M. A., Kinnison, D. E., Mancini, E., Manzini, E., Marsh, D. R., Matthes, S., Nagashima, T., Newman, P. A., Nielsen, J. E., Pawson, S., Pitari, G., Plummer, D. A., Rozanov, E., Schraner, M., Scinocca, J. F., Semeniuk, K., Shepherd, T. G., Shibata, K., Steil, B., Stolarski, R. S., Tian, W., and Yoshiki, M.: Multimodel projections of stratospheric ozone in the 21st century, J. Geophys. Res., 112, D16303, https://doi.org/10.1029/2006JD008332, 2007. a
Feng, Z., De Marco, A., Anav, A., Gualtieri, M., Sicard, P., Tian, H., Fornasier, F., Tao, F., Guo, A., and Paoletti, E.: Economic losses due to ozone impacts on human health, forest productivity and crop yield across China, Environ. Int., 131, 104966, https://doi.org/10.1016/J.ENVINT.2019.104966, 2019. a
Garane, K., Koukouli, M.-E., Verhoelst, T., Lerot, C., Heue, K.-P., Fioletov, V., Balis, D., Bais, A., Bazureau, A., Dehn, A., Goutail, F., Granville, J., Griffin, D., Hubert, D., Keppens, A., Lambert, J.-C., Loyola, D., McLinden, C., Pazmino, A., Pommereau, J.-P., Redondas, A., Romahn, F., Valks, P., Van Roozendael, M., Xu, J., Zehner, C., Zerefos, C., and Zimmer, W.: TROPOMI/S5P total ozone column data: global ground-based validation and consistency with other satellite missions, Atmos. Meas. Tech., 12, 5263–5287, https://doi.org/10.5194/amt-12-5263-2019, 2019. a
García, O. E., Schneider, M., Hase, F., Blumenstock, T., Sepúlveda, E., and González, Y.: Quality assessment of ozone total column amounts as monitored by ground-based solar absorption spectrometry in the near infrared (>3000 cm−1), Atmos. Meas. Tech., 7, 3071–3084, https://doi.org/10.5194/amt-7-3071-2014, 2014. a, b, c, d, e, f, g, h, i, j, k
Heue, K.-P., Spurr, R., Loyola, D., Van Roozendael, M., Lerot, C., and Xu, J.: S5P/TROPOMI Total Ozone ATBD, S5P-L2-DLRATBD-400A, available at: http://www.tropomi.eu/documents/atbd (last access: 20 September 2020), 2018. a
InfraRed working Group: NDACC datasets, NDACC, available at: http://www.ndacc.org, last access: 20 September 2020. a
IPCC: Climate change 2013: The physical science basis. Contribution of Working Group I to the Fifth Assessment Report of the Intergovernmental Panel on Climate Change, Cambridge University Press, Cambridge, United Kingdom and New York, NY, USA, 2013. a, b
Langematz, U.: Stratospheric ozone: down and up through the anthropocene, ChemTexts volume, 5, 8, https://doi.org/10.1007/s40828-019-0082-7, 2019. a
Lickley, M., Solomon, S., Fletcher, S., Velders, G. J. M., Daniel, J., Rigby, M., Montzka, S. A., Kuijpers, L. J. M., and Stone, K.: Quantifying contributions of chlorofluorocarbon banks to emissions and impacts on the ozone layer and climate, Nat. Commun., 11, 1380, https://doi.org/10.1038/s41467-020-15162-7, 2020. a
Lindenmaier, R., Batchelor, R. L., Strong, K., Fast, H., Goutail, F., Kolonjari, F., Thomas McElroy, C., Mittermeier, R. L., and Walker, K. A.: An evaluation of infrared microwindows for ozone retrievals using the Eureka Bruker 125HR Fourier transform spectrometer, J. Quant. Spectrosc. Ra., 111, 569–585, https://doi.org/10.1016/j.jqsrt.2009.10.013, 2010. a
Liu, G., Tarasick, D. W., Fioletov, V. E., Sioris, C. E., and Rochon, Y. J.: Ozone correlation lengths and measurement uncertainties from analysis of historical ozonesonde data in North America and Europe, J. Geophys. Res., 114, D04112, https://doi.org/10.1029/2008jd010576, 2009. a
Ma, Z., Xu, J., Quan, W., Zhang, Z., Lin, W., and Xu, X.: Significant increase of surface ozone at a rural site, north of eastern China, Atmos. Chem. Phys., 16, 3969–3977, https://doi.org/10.5194/acp-16-3969-2016, 2016. a
Marsh, D. R., Mills, M. J., Kinnison, D. E., Lamarque, J.-F., Calvo, N., and Polvani, L. M.: Climate Change from 1850 to 2005 Simulated in CESM1(WACCM), J. Climate, 26, 7372–7391, https://doi.org/10.1175/JCLI-D-12-00558.1, 2013. a
Molina, M. J. and Rowland, F. S.: Stratospheric sink for chlorofluoromethanes: chlorine atom-catalysed destruction of ozone, Nature, 249, 810–812, https://doi.org/10.1038/249810a0, 1974. a
Monks, P. S., Archibald, A. T., Colette, A., Cooper, O., Coyle, M., Derwent, R., Fowler, D., Granier, C., Law, K. S., Mills, G. E., Stevenson, D. S., Tarasova, O., Thouret, V., von Schneidemesser, E., Sommariva, R., Wild, O., and Williams, M. L.: Tropospheric ozone and its precursors from the urban to the global scale from air quality to short-lived climate forcer, Atmos. Chem. Phys., 15, 8889–8973, https://doi.org/10.5194/acp-15-8889-2015, 2015. a
Montzka, S. A., Butler, J. H., Myers, R. C., Thompson, T. M., Swanson, T. H., Clarke, A. D., Lock, L. T., and Elkins, J. W.: Decline in the Tropospheric Abundance of Halogen from Halocarbons: Implications for Stratospheric Ozone Depletion, Science, 272, 1318–1322, https://doi.org/10.1126/science.272.5266.1318, 1996. a
Montzka, S. A., Dutton, G. S., Yu, P., Ray, E., Portmann, R. W., Daniel, J. S., Kuijpers, L., Hall, B. D., Mondeel, D., Siso, C., Nance, J. D., Rigby, M., Manning, A. J., Hu, L., Moore, F., Miller, B. R., and Elkins, J. W.: An unexpected and persistent increase in global emissions of ozone-depleting CFC-11, Nature, 557, 413–417, 2018. a
Murdoch, J. C. and Sandler, T.: The voluntary provision of a pure public good: The case of reduced CFC emissions and the Montreal Protocol, J. Public Econ., 63, 331–349, https://doi.org/10.1016/S0047-2727(96)01598-8, 1997. a
Perliski, L. M., Solomon, S., and London, J.: On the interpretation of seasonal variations of stratospheric ozone, Planet. Space Sci., 37, 1527–538, https://doi.org/10.1016/0032-0633(89)90143-8, 1989. a
Pougatchev, N. S., Connor, B. J., and Rinsland, C. P.: Infrared measurements of the ozone vertical distribution above Kitt Peak, J. Geophys. Res., 100, 16689–16697, https://doi.org/10.1029/95JD01296, 1995. a
Rigby, M., Park, S., Saito, T., Western, L. M., Redington, A. L., Fang, X., Henne, S., Manning, A. J., Prinn, R. G., Dutton, G. S., Fraser, P. J., Ganesan, A. L., Hall, B. D., Harth, C. M., Kim, J., Kim, K. R., Krummel, P. B., Lee, T., Li, S., Liang, Q., Lunt, M. F., Montzka, S. A., Mühle, J., O'Doherty, S., Park, M. K., Reimann, S., Salameh, P. K., Simmonds, P., Tunnicliffe, R. L., Weiss, R. F., Yokouchi, Y., and Young, D.: Increase in CFC-11 emissions from eastern China based on atmospheric observations, Nature, 569, 546–550, https://doi.org/10.1038/s41586-019-1193-4, 2019. a
Rodgers, C. D.: Inverse Methods for Atmospheric Sounding – Theory and Practice, in: Series on Atmospheric Oceanic and Planetary Physics, vol. 2, World Scientific Publishing Co. Pte. Ltd, Singapore, https://doi.org/10.1142/9789812813718, 2000. a, b
Rodgers, C. D. and Connor, B. J.: Intercomparison of remote sounding instruments, J. Geophys. Res., 108, 46–48, https://doi.org/10.1029/2002JD002299, 2003. a
Rothman, L. S., Gordon, I. E., Barbe, A., Benner, D. C., Bernath, P. F., Birk, M., Boudon, V., Brown, L. R., Campargue, A., Champion, J. P., Chance, K., Coudert, L. H., Dana, V., Devi, V. M., Fally, S., Flaud, J. M., Gamache, R. R., Goldman, A., Jacquemart, D., Kleiner, I., Lacome, N., Lafferty, W. J., Mandin, J. Y., Massie, S. T., Mikhailenko, S. N., Miller, C. E., Moazzen-Ahmadi, N., Naumenko, O. V., Nikitin, A. V., Orphal, J., Perevalov, V. I., Perrin, A., Predoi-Cross, A., Rinsland, C. P., Rotger, M., Šimečková, M., Smith, M. A., Sung, K., Tashkun, S. A., Tennyson, J., Toth, R. A., Vandaele, A. C., and Vander Auwera, J.: The HITRAN 2008 molecular spectroscopic database, J. Quant. Spectrosc. Ra., 110, 533–572, https://doi.org/10.1016/j.jqsrt.2009.02.013, 2009. a
Rothman, L. S., Gordon, I. E., Babikov, Y., Barbe, A., Chris Benner, D., Bernath, P. F., Birk, M., Bizzocchi, L., Boudon, V., Brown, L. R., Campargue, A., Chance, K., Cohen, E. A., Coudert, L. H., Devi, V. M., Drouin, B. J., Fayt, A., Flaud, J. M., Gamache, R. R., Harrison, J. J., Hartmann, J. M., Hill, C., Hodges, J. T., Jacquemart, D., Jolly, A., Lamouroux, J., Le Roy, R. J., Li, G., Long, D. A., Lyulin, O. M., Mackie, C. J., Massie, S. T., Mikhailenko, S., Müller, H. S. P., Naumenko, O. V., Nikitin, A. V., Orphal, J., Perevalov, V., Perrin, A., Polovtseva, E. R., Richard, C., Smith, M. A. H., Starikova, E., Sung, K., Tashkun, S., Tennyson, J., Toon, G. C., Tyuterev, V. G., and Wagner, G.: The HITRAN2012 molecular spectroscopic database, J. Quant. Spectrosc. Ra., 130, 4–50, https://doi.org/10.1016/j.jqsrt.2013.07.002, 2013. a
Steinbrecht, W., Froidevaux, L., Fuller, R., Wang, R., Anderson, J., Roth, C., Bourassa, A., Degenstein, D., Damadeo, R., Zawodny, J., Frith, S., McPeters, R., Bhartia, P., Wild, J., Long, C., Davis, S., Rosenlof, K., Sofieva, V., Walker, K., Rahpoe, N., Rozanov, A., Weber, M., Laeng, A., von Clarmann, T., Stiller, G., Kramarova, N., Godin-Beekmann, S., Leblanc, T., Querel, R., Swart, D., Boyd, I., Hocke, K., Kämpfer, N., Maillard Barras, E., Moreira, L., Nedoluha, G., Vigouroux, C., Blumenstock, T., Schneider, M., García, O., Jones, N., Mahieu, E., Smale, D., Kotkamp, M., Robinson, J., Petropavlovskikh, I., Harris, N., Hassler, B., Hubert, D., and Tummon, F.: An update on ozone profile trends for the period 2000 to 2016, Atmos. Chem. Phys., 17, 10675–10690, https://doi.org/10.5194/acp-17-10675-2017, 2017. a
Takele Kenea, S., Mengistu Tsidu, G., Blumenstock, T., Hase, F., von Clarmann, T., and Stiller, G. P.: Retrieval and satellite intercomparison of O3 measurements from ground-based FTIR Spectrometer at Equatorial Station: Addis Ababa, Ethiopia, Atmos. Meas. Tech., 6, 495–509, https://doi.org/10.5194/amt-6-495-2013, 2013. a
Thompson, A. M., Witte, J. C., McPeters, R. D., Oltmans, S. J., Schmidlin, F. J., Logan, J. A., Fujiwara, M., Kirchhoff, V. W., Posny, F., Coetzee, G. J., Hoegger, B., Kawakami, S., Ogawa, T., Johnson, B. J., Vömel, H., and Labow, G.: Southern Hemisphere Additional Ozonesondes (SHADOZ) 1998–2000 tropical ozone climatology 1. Comparison with Total Ozone Mapping Spectrometer (TOMS) and ground-based measurements, J. Geophys. Res., 108, 8238, https://doi.org/10.1029/2001jd000967, 2003. a, b
Thompson, A. M., Balashov, N. V., Witte, J. C., Coetzee, J. G. R., Thouret, V., and Posny, F.: Tropospheric ozone increases over the southern Africa region: bellwether for rapid growth in Southern Hemisphere pollution?, Atmos. Chem. Phys., 14, 9855–9869, https://doi.org/10.5194/acp-14-9855-2014, 2014. a
Vigouroux, C., De Mazière, M., Demoulin, P., Servais, C., Hase, F., Blumenstock, T., Kramer, I., Schneider, M., Mellqvist, J., Strandberg, A., Velazco, V., Notholt, J., Sussmann, R., Stremme, W., Rockmann, A., Gardiner, T., Coleman, M., and Woods, P.: Evaluation of tropospheric and stratospheric ozone trends over Western Europe from ground-based FTIR network observations, Atmos. Chem. Phys., 8, 6865–6886, https://doi.org/10.5194/acp-8-6865-2008, 2008. a
Vigouroux, C., Blumenstock, T., Coffey, M., Errera, Q., García, O., Jones, N. B., Hannigan, J. W., Hase, F., Liley, B., Mahieu, E., Mellqvist, J., Notholt, J., Palm, M., Persson, G., Schneider, M., Servais, C., Smale, D., Thölix, L., and De Mazière, M.: Trends of ozone total columns and vertical distribution from FTIR observations at eight NDACC stations around the globe, Atmos. Chem. Phys., 15, 2915–2933, https://doi.org/10.5194/acp-15-2915-2015, 2015. a, b, c
Wang, Y., Konopka, P., Liu, Y., Chen, H., Müller, R., Plöger, F., Riese, M., Cai, Z., and Lü, D.: Tropospheric ozone trend over Beijing from 2002–2010: ozonesonde measurements and modeling analysis, Atmos. Chem. Phys., 12, 8389–8399, https://doi.org/10.5194/acp-12-8389-2012, 2012. a, b
Witte, J. C., Thompson, A. M., Smit, H. G., Fujiwara, M., Posny, F., Coetzee, G. J., Northam, E. T., Johnson, B. J., Sterling, C. W., Mohamad, M., Ogino, S. Y., Jordan, A., and da Silva, F. R.: First reprocessing of Southern Hemisphere ADditional OZonesondes (SHADOZ) profile records (1998–2015): 1. Methodology and evaluation, J. Geophys. Res.-Atmos., 122, 6611–6636, https://doi.org/10.1002/2016JD026403, 2017. a
Yang, Y., Zhou, M., Langerock, B., Sha, M. K., Hermans, C., Wang, T., Ji, D., Vigouroux, C., Kumps, N., Wang, G., De Mazière, M., and Wang, P.: New ground-based Fourier-transform near-infrared solar absorption measurements of XCO2, XCH4 and XCO at Xianghe, China, Earth Syst. Sci. Data, 12, 1679–1696, https://doi.org/10.5194/essd-12-1679-2020, 2020. a, b
Zhang, H., Xie, B., Zhao, S.-Y., and Chen, Q.: PM2.5 and tropospheric O3 in China and an analysis of the impact of pollutant emission control, in Climate, 5, 136–141, https://doi.org/10.1016/J.ACCRE.2014.11.005, 2014a. a
Zhang, J., Xuan, Y., Yan, X., Liu, M., Tian, H., Xia, X., Pang, L., and Zheng, X.: Development and preliminary evaluation of a double-cell ozonesonde, Adv. Atmos. Sci., 31, 938–947, https://doi.org/10.1007/s00376-013-3104-1, 2014b. a, b
Zheng, X., Xuan, Y., Lin, W., Tang, J., Tian, H., Zhang, J., and Xing, Y.: Performance Tests and Outdoor Comparison Observations of Domestic Remade ECC Ozonesondes, J. Appl. Meteorol. Sci., 29, 460–473, https://doi.org/10.11898/1001-7313.20180407, 2018. a
Zhou, M.: FTIR O3 measurements at Xianghe, GitHub, available at: https://github.com/zmq814/O3_xianghe.git, last access: 17 August 2020. a
Zhou, M., Vigouroux, C., Langerock, B., Wang, P., Dutton, G., Hermans, C., Kumps, N., Metzger, J.-M., Toon, G., and De Mazière, M.: CFC-11, CFC-12 and HCFC-22 ground-based remote sensing FTIR measurements at Réunion Island and comparisons with MIPAS/ENVISAT data, Atmos. Meas. Tech., 9, 5621–5636, https://doi.org/10.5194/amt-9-5621-2016, 2016. a
Zhou, M., Langerock, B., Vigouroux, C., Sha, M. K., Ramonet, M., Delmotte, M., Mahieu, E., Bader, W., Hermans, C., Kumps, N., Metzger, J.-M., Duflot, V., Wang, Z., Palm, M., and De Mazière, M.: Atmospheric CO and CH4 time series and seasonal variations on Reunion Island from ground-based in situ and FTIR (NDACC and TCCON) measurements, Atmos. Chem. Phys., 18, 13881–13901, https://doi.org/10.5194/acp-18-13881-2018, 2018. a