the Creative Commons Attribution 4.0 License.
the Creative Commons Attribution 4.0 License.
 | 12 Oct 2020
The development of the “Storm Tracker” and its applications for atmospheric high-resolution upper-air observations
Wei-Chun Hwang
Po-Hsiung Lin
Hungjui Yu
In this study, we introduce a newly developed upper-air observational instrument for atmospheric research. The “Storm Tracker” is an ultra-lightweight (about 20 g including battery), multi-channel simultaneous capable radiosonde designed by the Department of Atmospheric Sciences at National Taiwan University. Developed in 2016, the Storm Tracker aims to provide an alternative for observing atmospheric vertical profiles with a high temporal resolution, especially the lower-level atmosphere under severe weather conditions such as extreme thunderstorms and tropical cyclones.
Field experiments were conducted as trial runs in Wu-Chi, Taichung, Taiwan, to examine the ability of the Storm Tracker to observe the boundary layer, in addition to the intercomparison between the Storm Tracker and the widely used Vaisala RS41-SGP radiosonde. Among the co-launches of the Storm Tracker and Vaisala RS41 radiosondes, the measurements of pressure, wind speed, and wind direction are highly consistent between the measurements of the Storm Tracker and the Vaisala RS41-SGP. However, a significant daytime warm bias in the Storm Tracker was found due to solar heating. A metal shield specifically for the Storm Tracker was thus installed and showed mitigation for the warm biases and the overall variance.
With the much lower costs of the radiosondes and the simultaneous multi-channel receiver, the Storm Tracker system has shown great potential for high-frequency observational needs in atmospheric research.
- Article
(8579 KB) - Full-text XML
- BibTeX
- EndNote


With a long history of development, the upper-air radiosonde has been one of the essential and the most reliable methods to measure the atmosphere above us so far. Operational weather agencies worldwide share their daily to twice-a-day (00:00 and 12:00 UTC) radiosonde observational data through the WMO (World Meteorological Organization) GTS (Global Telecommunication System) for synoptic weather analysis and numerical model forecast. According to the European Centre for Medium-Range Weather Forecasts (ECMWF), in 2017, there were about 818 upper-air radiosonde stations worldwide in addition to more than 12 radiosonde manufacturers (Ingleby, 2017). Most radiosonde manufacturers had participated in the field intercomparison program hosted by the World Meteorological Organization (WMO) throughout 1984–2010, and there were 11 different types of operational radiosondes processed in the recent intercomparison experiment in Yangjiang, China, in 2011 (Nash et al., 2011)
Among all different types of radiosondes, the Vaisala RS41 is the one used most often and weighs 110 g. The previous version, RS92, weighs 280 g. The Japan radiosonde from Meisei Corporation, iMS-100, weighs only 38 g, which is so far the lightest operational radiosonde. However, occasionally there are needs for many radiosondes within a short period of time to acquire higher temporal resolution data. For the atmospheric research community, most of these radiosondes on the market are often a burden regarding the research budget when many radiosondes are needed. Secondly, the lighter the radiosonde weighs, the smaller the balloons and the less the helium is needed. Lighter radiosondes also enable launches using a low-cost constant plastic balloon, which can also be deployed as a driftsonde. In Sect. 4, we will present two scenarios: vertical profiling and driftsonde operation.
In this study, we introduce a newly developed, smaller, lighter, and cheaper upper-air radiosonde system designed with the capability of simultaneously receiving multiple radiosondes, which is explicitly for high temporal resolution observations on mesoscale weather systems. This so-called Storm Tracker system, developed at the Department of Atmospheric Sciences at National Taiwan University, has been tested in several field experiments since 2016. In Sect. 2, the configuration of the Storm Tracker system is described in detail. Trial runs of preliminary comparisons between the Storm Tracker and the Vaisala RS41-SGP radiosonde are discussed in Sect. 3. Section 4 concludes the current status of the Storm Tracker system and its applications in different field campaigns. Section 5 contains concluding remarks.
The Storm Tracker upper-air observation system is described in this section, which consists of the upper-air radiosonde (the Storm Tracker) and the surface signal receiving unit (the ground receiver). Figure 1 shows the system block diagram of the Storm Tracker system.
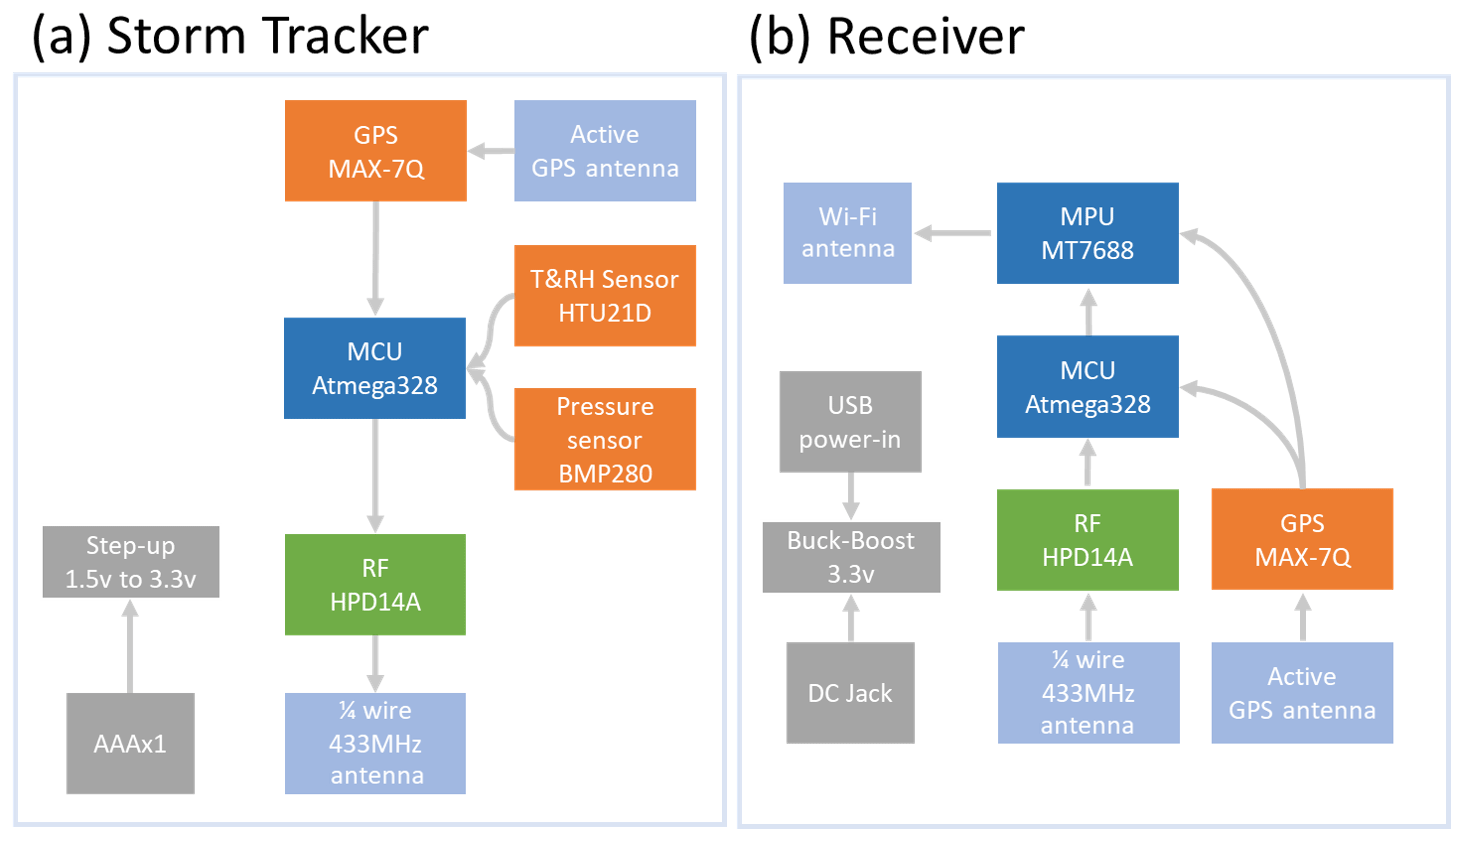
Figure 1System block diagram for the Storm Tracker system, including Storm Tracker (a) and receiver (b). The part number for the chipset is indicated in the box, and the arrow indicates the dataflow.
2.1 The Storm Tracker radiosonde
The Storm Tracker radiosonde is packed with sensors and supporting hardware, as shown in Fig. 2. The main portion includes the ATMEGA328p microcontroller, the U-blox MAX7-Q GPS sensor, the Bosch BMP280 pressure sensor, the TE-Connectivity HTU21D temperature–humidity sensor, and the LoRa™ transmitter.
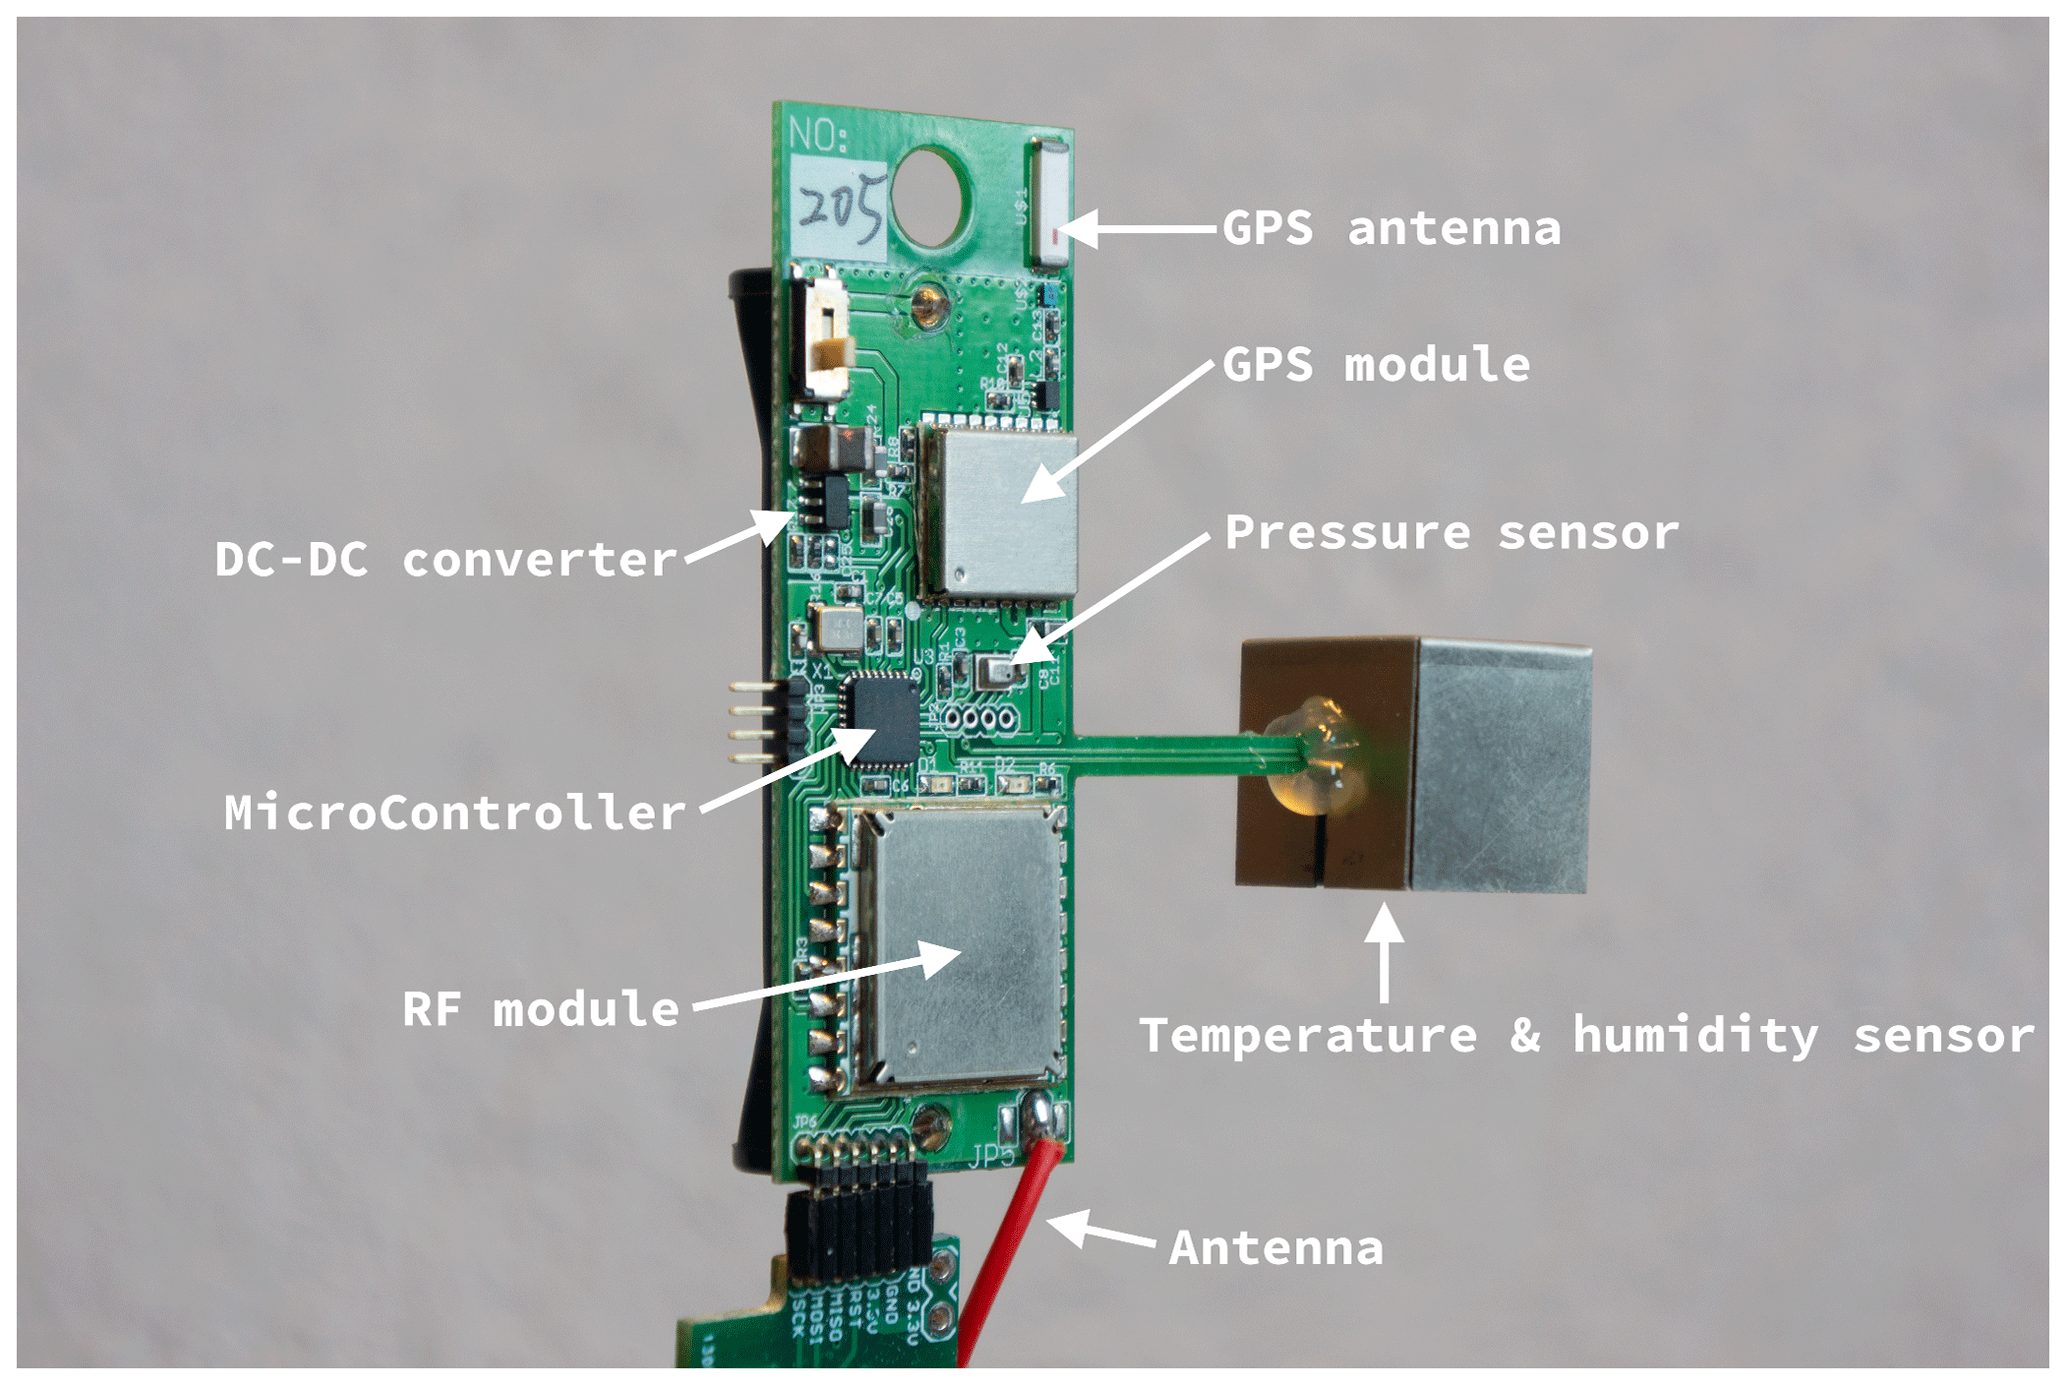
Figure 2Photo of a PCB-assembled Storm Tracker product from PCBA. The diameter of the Storm Tracker is 58.1 mm×50.2 mm (height × width, including sensor arm). The GPS antenna and GPS module are located on the top right of Storm Tracker, along with the power switch on the top left. The RF module is located on the bottom, and the red wire is the quarter-wave antenna. The extended arm hosts the temperature and humidity sensor, and the pins on the bottom are for programming and debug purposes. Lastly, in the middle are the microcontroller and pressure sensor.
The main processor of the Storm Tracker is the Microchip ATMEGA328p microcontroller (Atmel Corporation, 2015). The microcontroller processes all measurements from the sensors and sends them to the radio transmitter.
For the GPS module, the U-blox MAX-7Q is selected (U-blox, 2014). This GPS module provides the altitude and speed as well as the direction of the Storm Tracker. The overall GPS module possesses an accuracy of 2.0 m for horizontal position and 0.1 m s−1 for velocity (U-blox, 2014).
The pressure sensor on the Storm Tracker is Bosch BMP280, with an overall operation range from 1100 to 300 hPa and from −40 to 85 ∘C, in addition to a typical accuracy of ±1 hPa (Bosch Sensortec, 2018). This sensor has been applied widely to indoor navigation, where a precise pressure measurement is required.
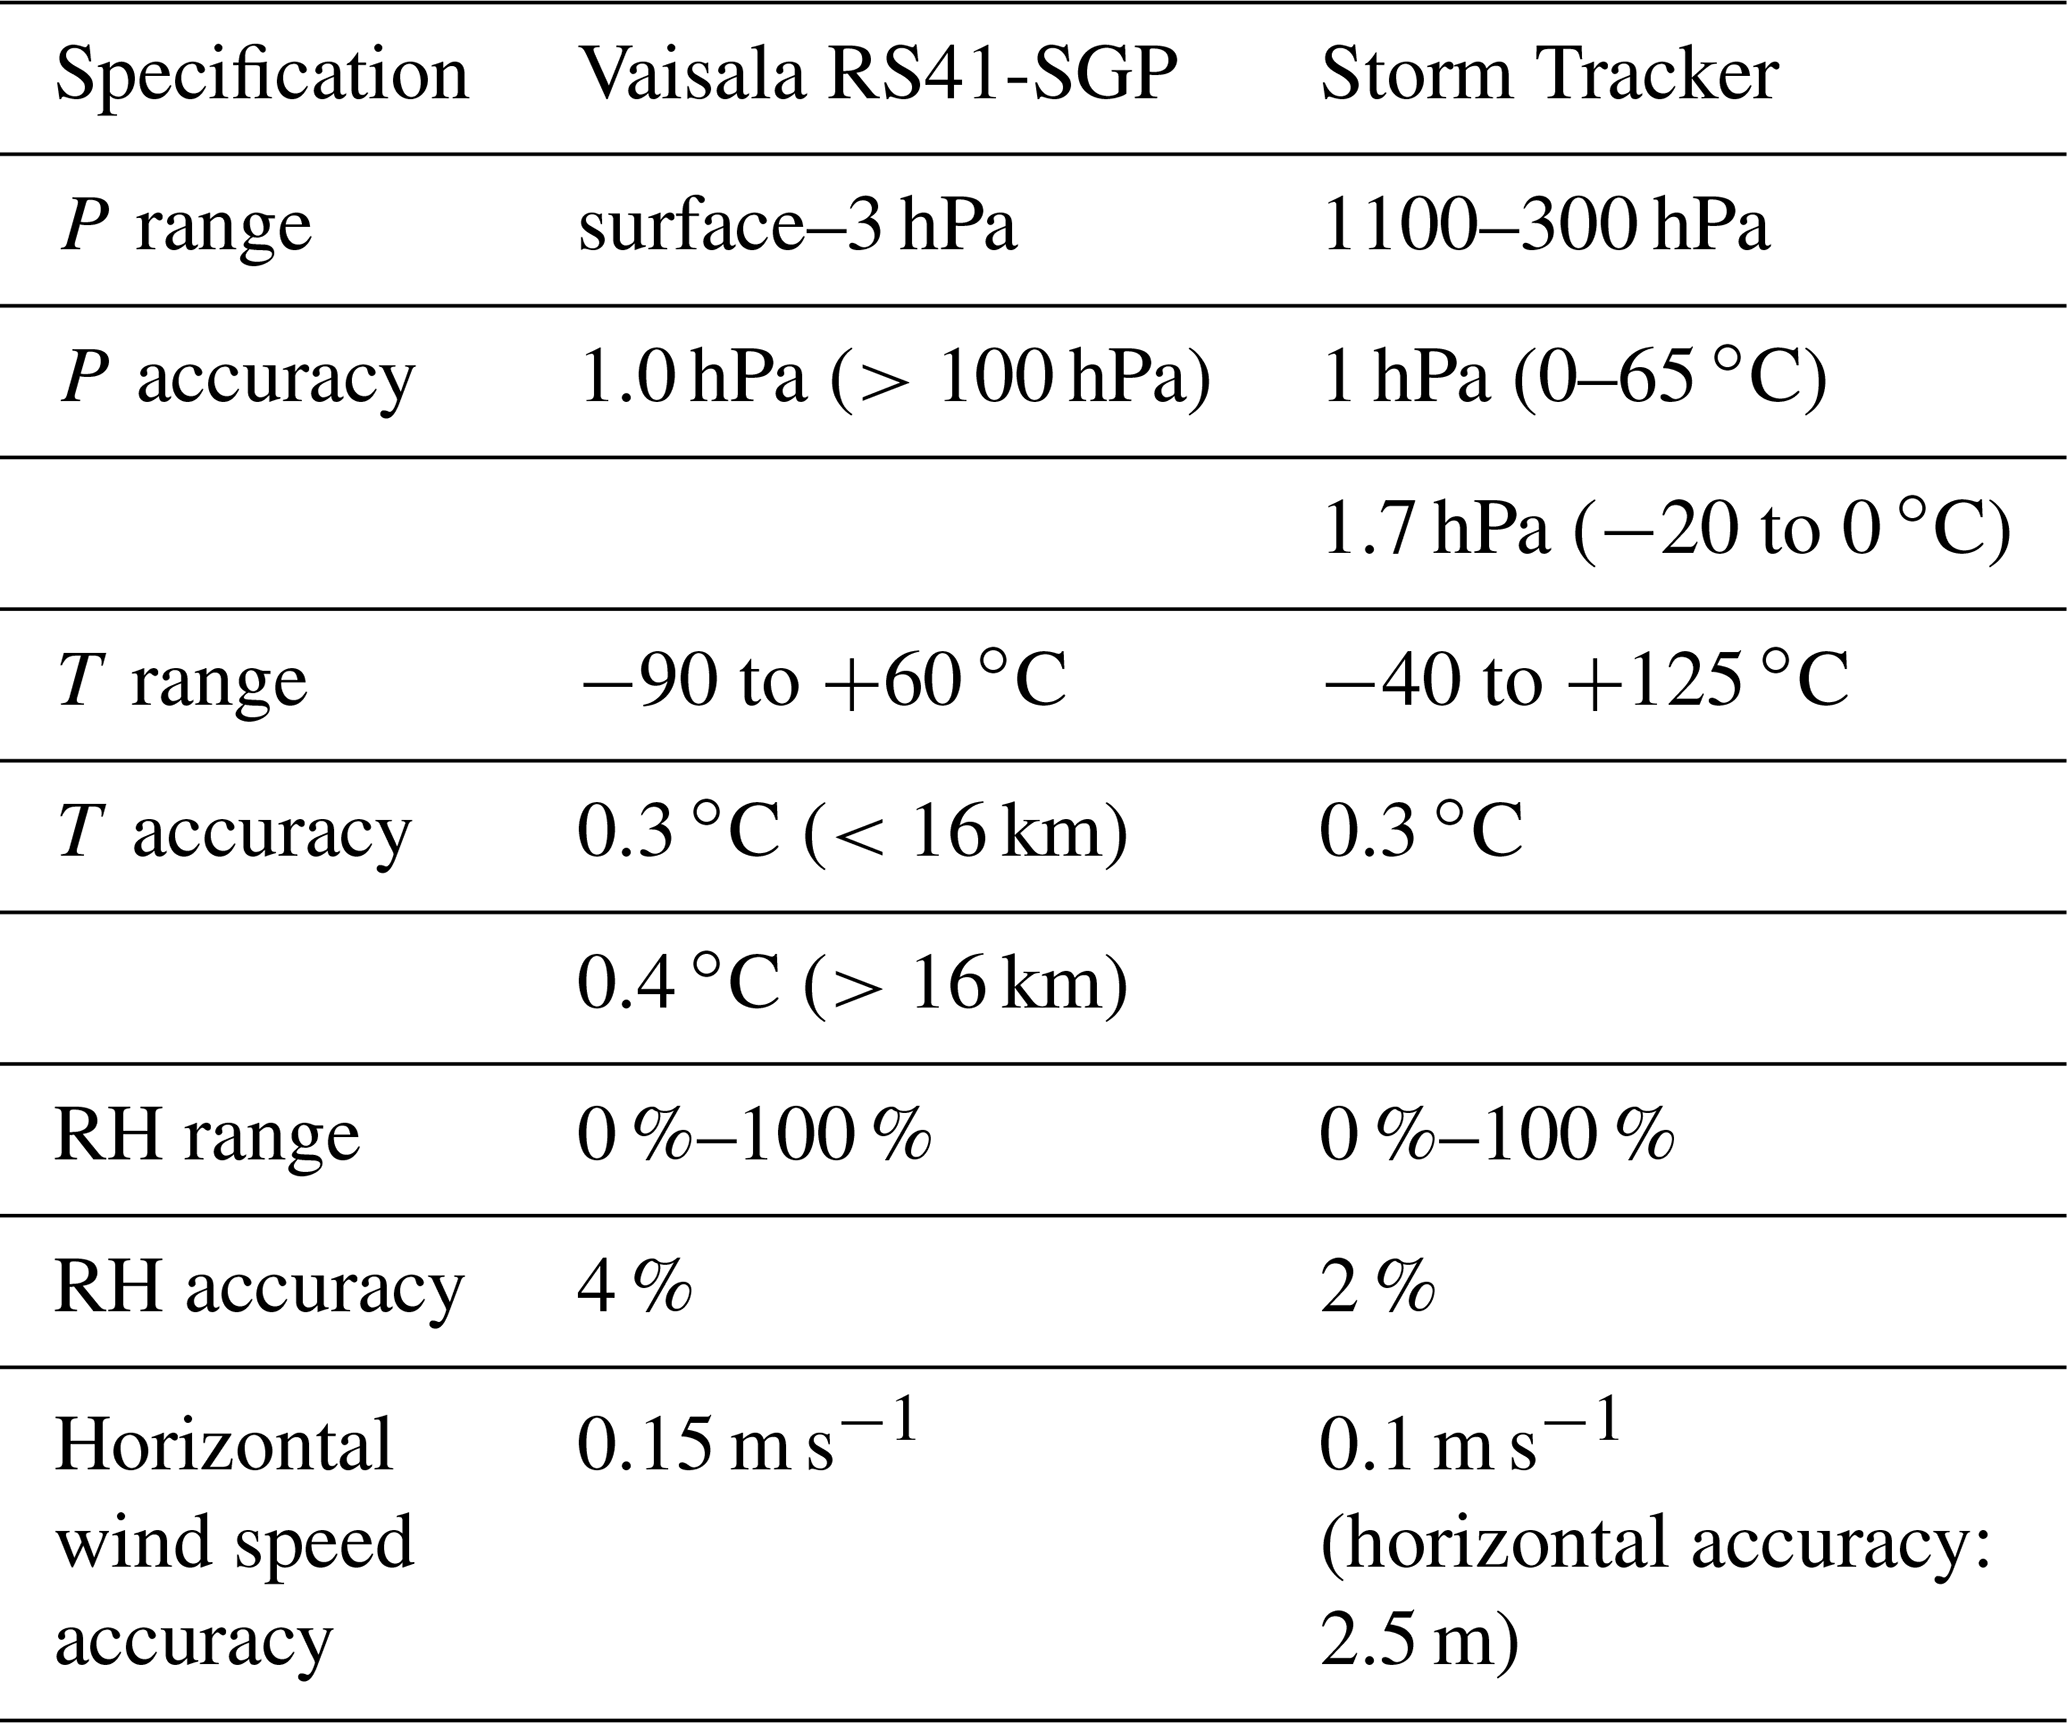
For the sensor of temperature (T) and relative humidity (RH), we used the HTU21D, a digital relative humidity sensor with temperature output from TE Connectivity. This sensor is chosen regarding its high accuracy (±0.3 ∘C in T and ±2 % in RH), wide operational range (−40 to 125 ∘C, 0 %–100 %), the short response time (5 s), and cutting-edge energy-saving property (TE Connectivity, 2017). The HTU21D sensor is located at the 3 cm arm, as shown in Fig. 2, to extend outside of the protection box to measure the environment. Table 1 briefly summarizes the operational ranges and typical accuracies of atmospheric measurements for the Storm Tracker and the Vaisala RS41-SGP radiosonde (Vaisala Corporation, 2017).
Table 1List of the operational ranges and typical accuracies of basic atmospheric measurements for Vaisala RS41-SGP radiosonde (Vaisala Corporation, 2017) and the Storm Tracker.
The power for Storm Tracker comes from one AAA battery, and this minimizes the total weight. The radio transmitter is powered by LoRa™, which is a long-range, low-power wide-area network technology (Augustin et al., 2016). The radio frequency used by Storm Tracker ranges from 432 to 436.5 MHz, the configuration for LoRa™ is 7 for spreading factor (SF) and 4∕5 for code rate (CR) with 125 kHz channel bandwidth. SF and CR, along with the channel bandwidth, define the transmission speed. Specifically, SF indicates the system's ability to receive the signal with a low signal-to-noise ratio; the larger the number, the higher the sensitivity. For the Storm Tracker system, we set the SF to the lowest number of 7 in order to speed up the baud rate but still able to maintain the communication range to ∼100 km. Lastly, to extend the battery life, the transmit power is set to 18 dB with 1 Hz of transmission frequency. The resulted battery power can last for 2–4 h.
As for the Storm Tracker enclosure, we use thick white paper with a waterproof coating. Facing the temperature and humidity solar radiation biases found during the trial runs in 2017, we design a 1 mm thick tinplate metal shield to cover the temperature and humidity sensors outside of the paper enclosure to prevent direct solar radiation. A detailed picture of the metal shield added to the Storm Tracker radiosonde is shown in Fig. 3. The complete package of the Storm Tracker and the enclosure with the metal shield is shown in Fig. 4.

Figure 3A closeup picture of the metal shield. The metal shield is a square cube, and the inner sensor PCB is a 7 mm×7 mm square.
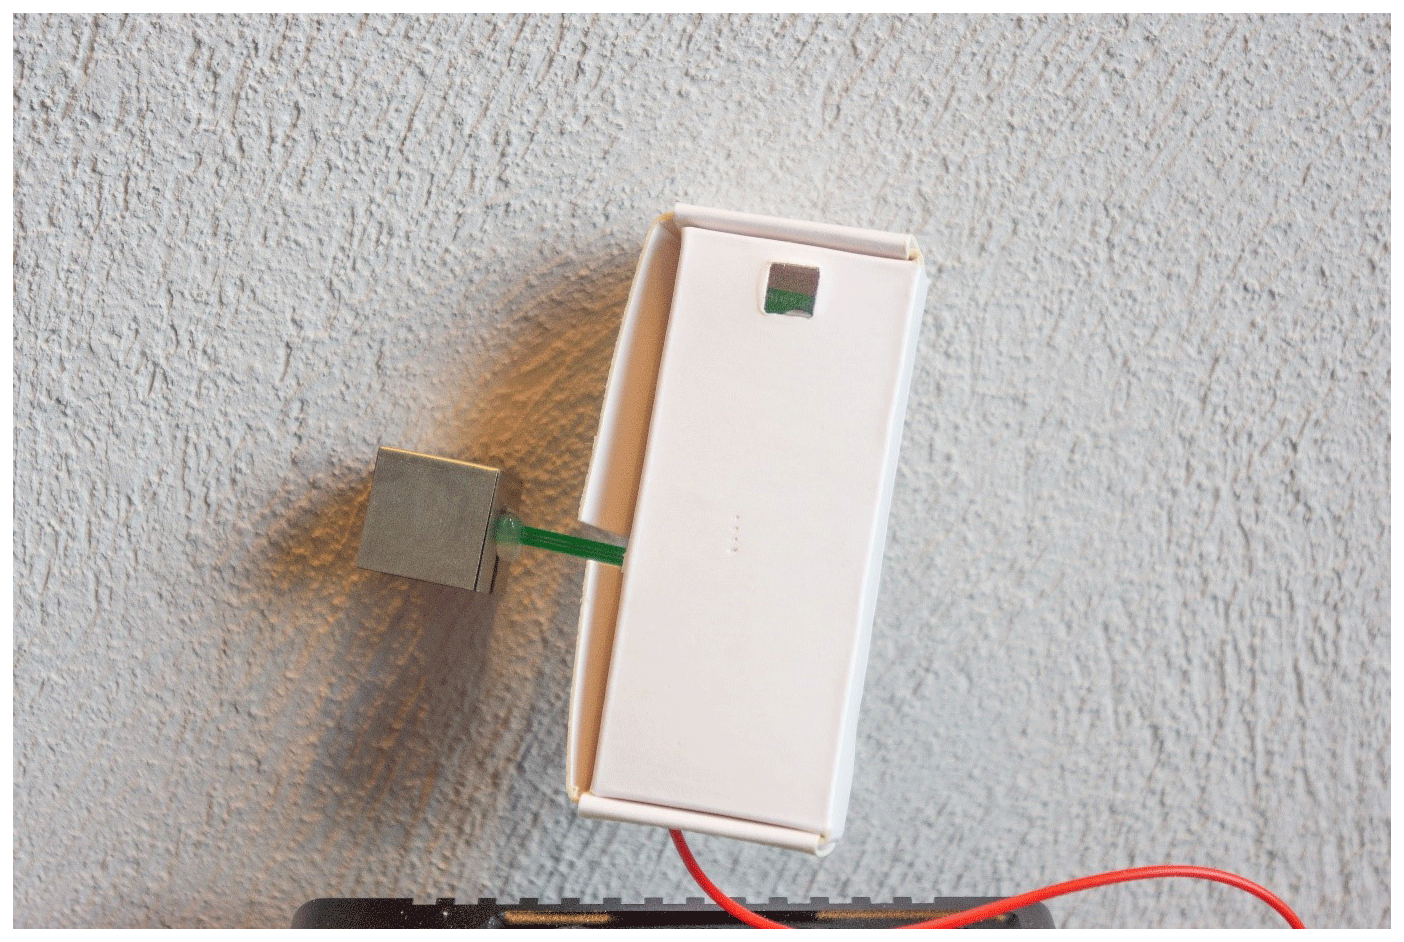
Figure 4A Storm Tracker with the enclosure and the metal shield. The enclosure is composed of paper, and the hole on the top (bottom) is for connecting to the balloon (passing of the antenna). The metal shield is attached to the PCB with hot glue.
For the production, a local printed circuit board (PCB) assembly factory manages the production of both the Storm Tracker and the ground receiver. The final cost of each Storm Tracker sonde is about ∼ USD 50.
Furthermore, since the Storm Tracker only weighs about 20 g, including a battery, it can be easily carried by a constant volume foil balloon for constant-height flight or pilot rubber balloon for regular upper-air observation. Figure 5 shows a typical Storm Tracker launch with a pilot rubber balloon, and Table 2 summarizes the Storm Tracker properties.
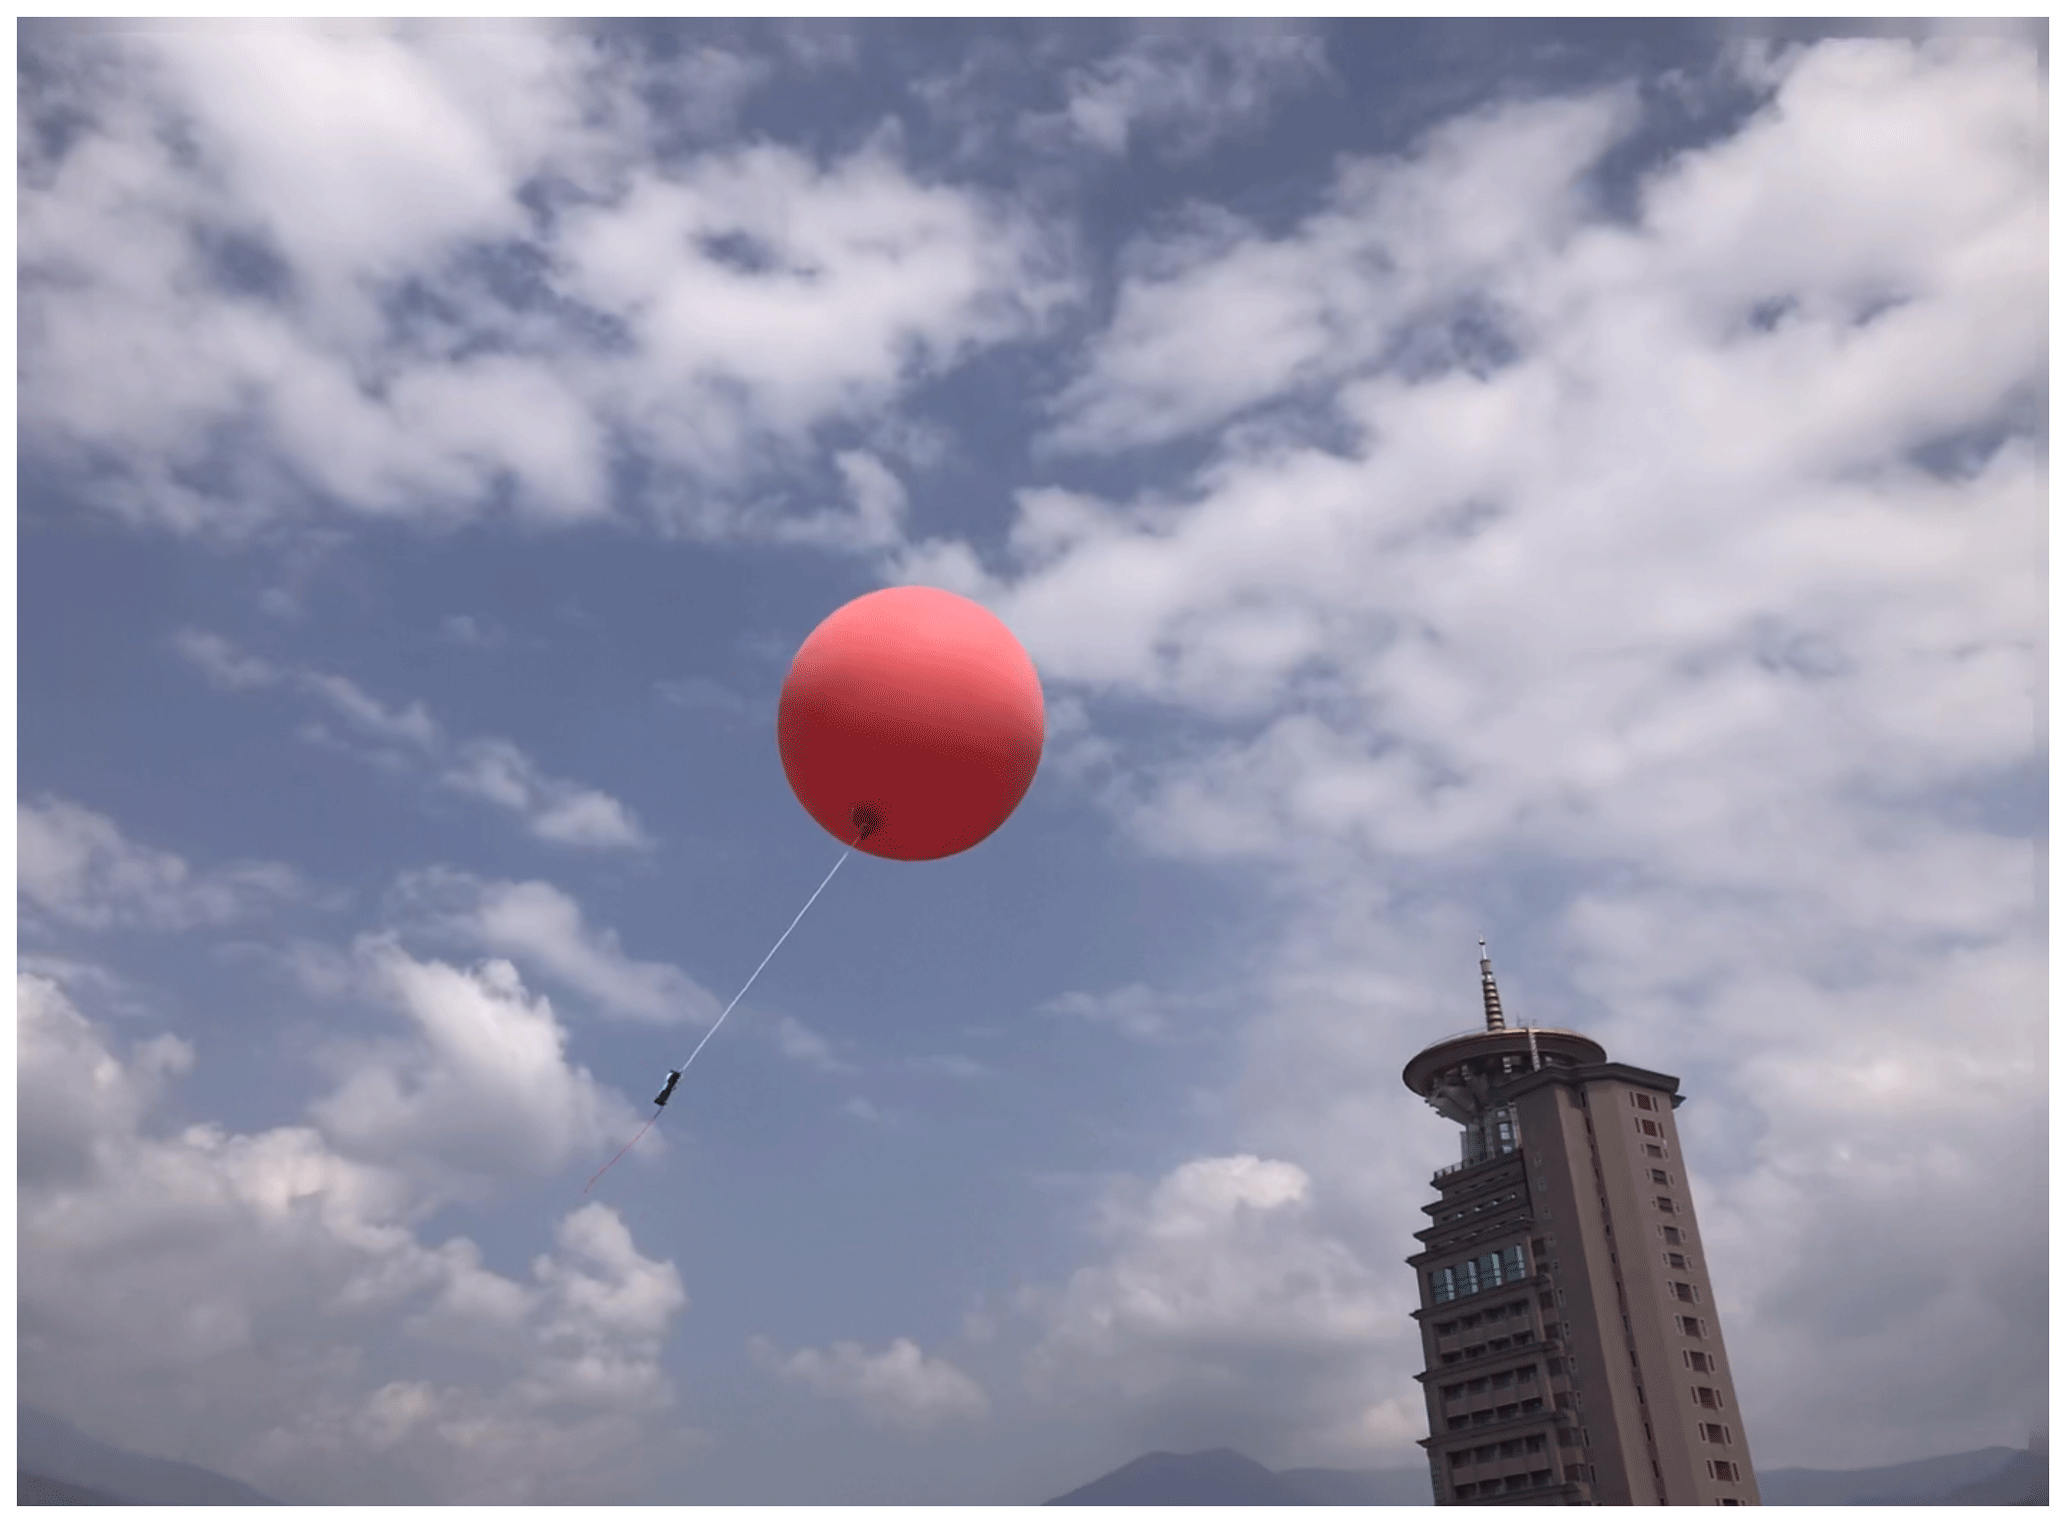
Figure 5A Storm Tracker (without enclosure) launched with a pilot rubber balloon (20 g) during a field campaign.

2.2 The ground receiver
A ground receiver was also designed to receive and process the data from the Storm Tracker radiosondes. Figure 1b shows the system block diagram of the ground receiver. The radiofrequency (RF) module, as shown by the green block, will capture the incoming radio signal. The RF modules on the Storm Tracker radiosonde and the ground receiver are the same. The package will then be sent to the microcontroller unit (MCU) for data parsing before being sent to the MPU (main processing unit). The MCU we chose is the same as Storm Tracker (ATMEGA328p), and the MPU is a WiFi-capable MT7688 SoC (system on chip) (MediaTek, 2016). MPU hosts the web server and records the data to the external micro SD card. The power supply for the ground receiver can be either a USB power supply or a wide range of DC power supply (3–16 V) through a DC jack. Figure 6 shows a complete set of Storm Tracker ground receiver installed in a 3D-printed box (). The ground receiver is then connected to an omnidirectional antenna with a 6 dB gain. A typical setup for the ground receiver outside in the field is shown in Fig. 7.
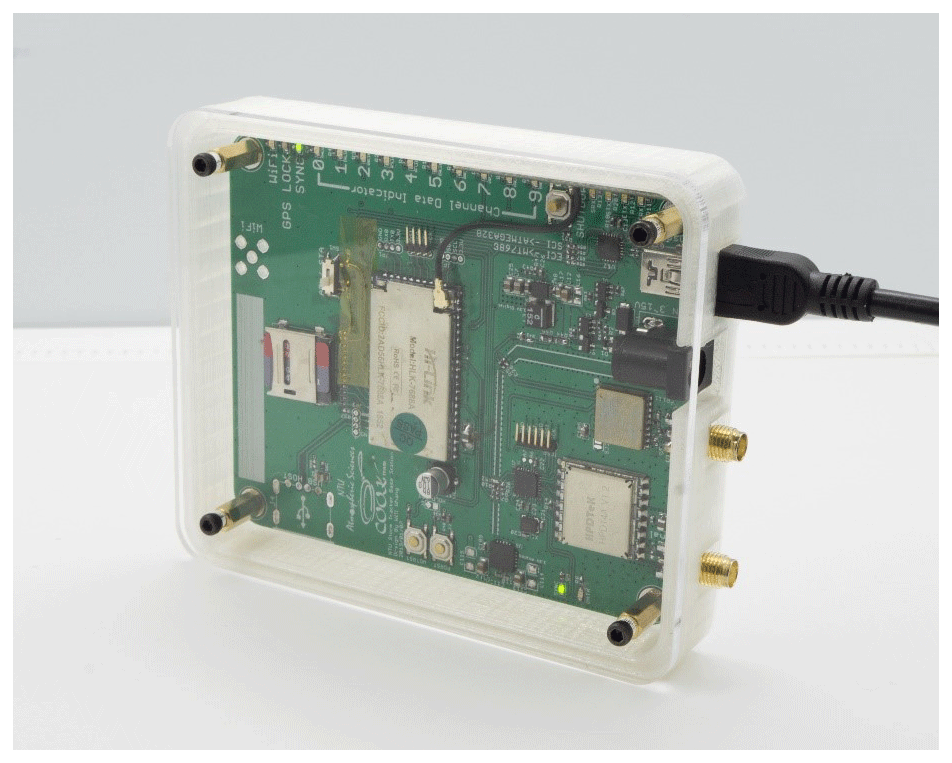
Figure 6Photo of a Storm Tracker ground receiver. On the right are the GPS module and RF module to receive the signal, along with the USB and DC power jack for power input and the console access. In the middle is the central processor, which handles data recording and hosts the website. On the left is the SD card for storage. On the top are the indicator LEDs, which show the current status of the receiver and the received data channels.
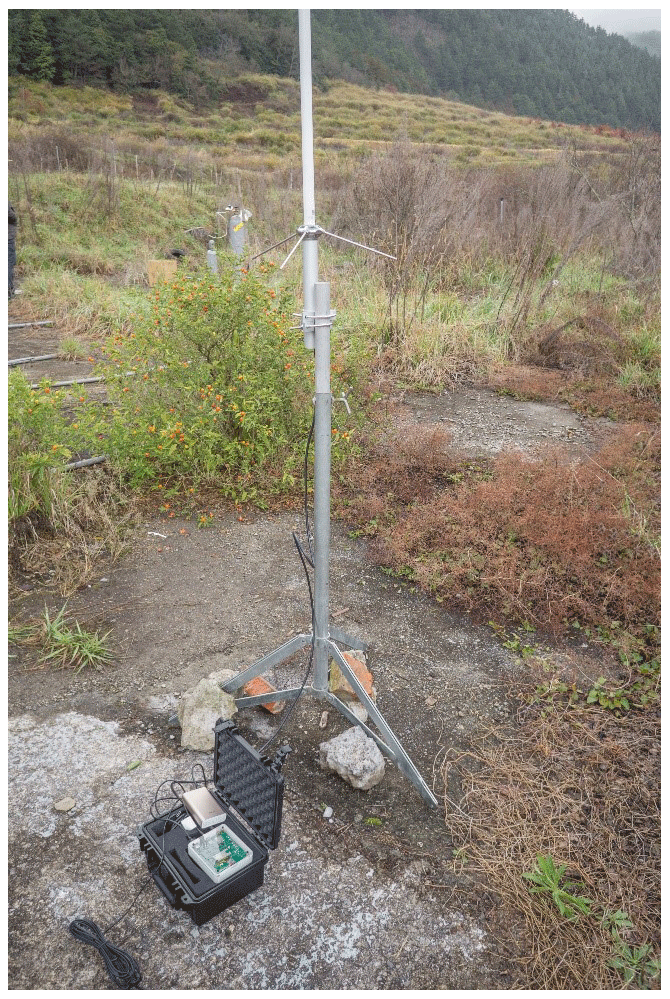
Figure 7A typical setup of the ground receiver in the field, with the 433 MHz antenna in the middle and the receiver, GPS antenna, and power bank in the bottom black box.
The most powerful feature of the Storm Tracker system is the ability to receive data from up to 10 radiosondes simultaneously, which provides the opportunity for upper-air observations with extremely high spatiotemporal resolution. In summary, one can launch up to 10 Storm Trackers at once with only one receiver or launch a series of Storm Trackers at a very short time interval, say hourly, every 30 min, or even every 10 min depending on the mission.
To accomplish this goal with a single-channel transmitter on the Storm Tracker, time-divided multi-access (TDMA) technology was implemented into the Storm Tracker system. Since each Storm Tracker takes about 76 ms for data transmission, the system splits every second into 10 time slots, and each Storm Tracker transmits the data on the different time slots pre-assigned during Storm Tracker manufacture programming. In practice, the ground receiver is constantly scanning 10 different frequencies per second and tracking up to 10 Storm Trackers at the same time.
A newer version of the ground receiver is currently underway, which is powered by Raspberry Pi and a unique in-house designed LoRa™ gateway, which can receive eight channels simultaneously. In the future, this new design with TDMA could monitor 80 Storm Trackers at the same time.
2.3 The launch procedure
Numerous developing processes and tests are still needed for the Storm Tracker system. Here we present the launch and ground check procedure for the latest intercomparison field experiment. First, we install the battery and place the Storm Tracker at a location where it can receive the GPS signal from satellites. Once the GPS signal has been received, the data will be transmitted and show up on the receiver's web page. The user can check whether the measurements are stable as well as other parameters such as the Storm Tracker ID number and battery voltage. The Storm Tracker is then clear to launch.
The overall setup of the Storm Tracker system before the actual launch is relatively easy and takes less time (∼10 min) compared to a regular Vaisala ground system. This also shortens the preparation time for the observation of short-term weather events such as an afternoon thunderstorm.
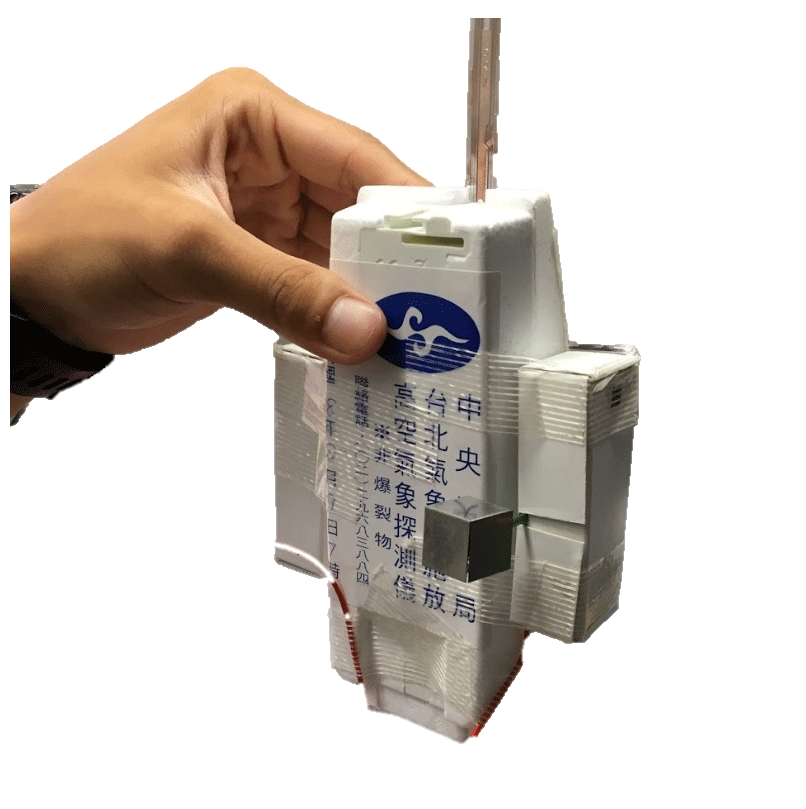
Figure 8A photo of the intercomparison launch setup. The Storm Tracker is attached to the side of a Vaisala RS41 radiosonde with double-sided tape.
3.1 Field experiment design
Two trial field experiments were conducted to examine the performance of the Storm Tracker system on the boundary layer (BL) observations. In these trial runs, we attached the Storm Tracker to the side of Vaisala RS41-SGP by double-sided foam tape, with the sensor arm of Storm Tracker sticking out from the main body, as shown in Fig. 8. The first trial run was conducted for 4 d in December 2017 in Wu-Chi, Taichung, Taiwan, and in total 28 sets of Storm Tracker and Vaisala RS41 were launched. One of the results from this trial run is that the solar radiation affected the temperature and moisture measurements. Therefore, we installed a thin metal shell (i.e., the “hat”) around the temperature–humidity sensor, as shown in Fig. 3, to prevent the direct solar heating in the second trial run conducted at the same location in July 2018. During the second run, every launch includes a Vaisala RS41 attached with two Storm Trackers, with and without the hat. Similar to the first run, the data from 19 co-launches under clear-sky conditions were collected. The average vertical profile from the Vaisala RS41 shows a clear signature of subsidence and an overall dry atmosphere (Fig. 9). In this section, the data from the second run will be shown to examine the effects of adding the metal shield.
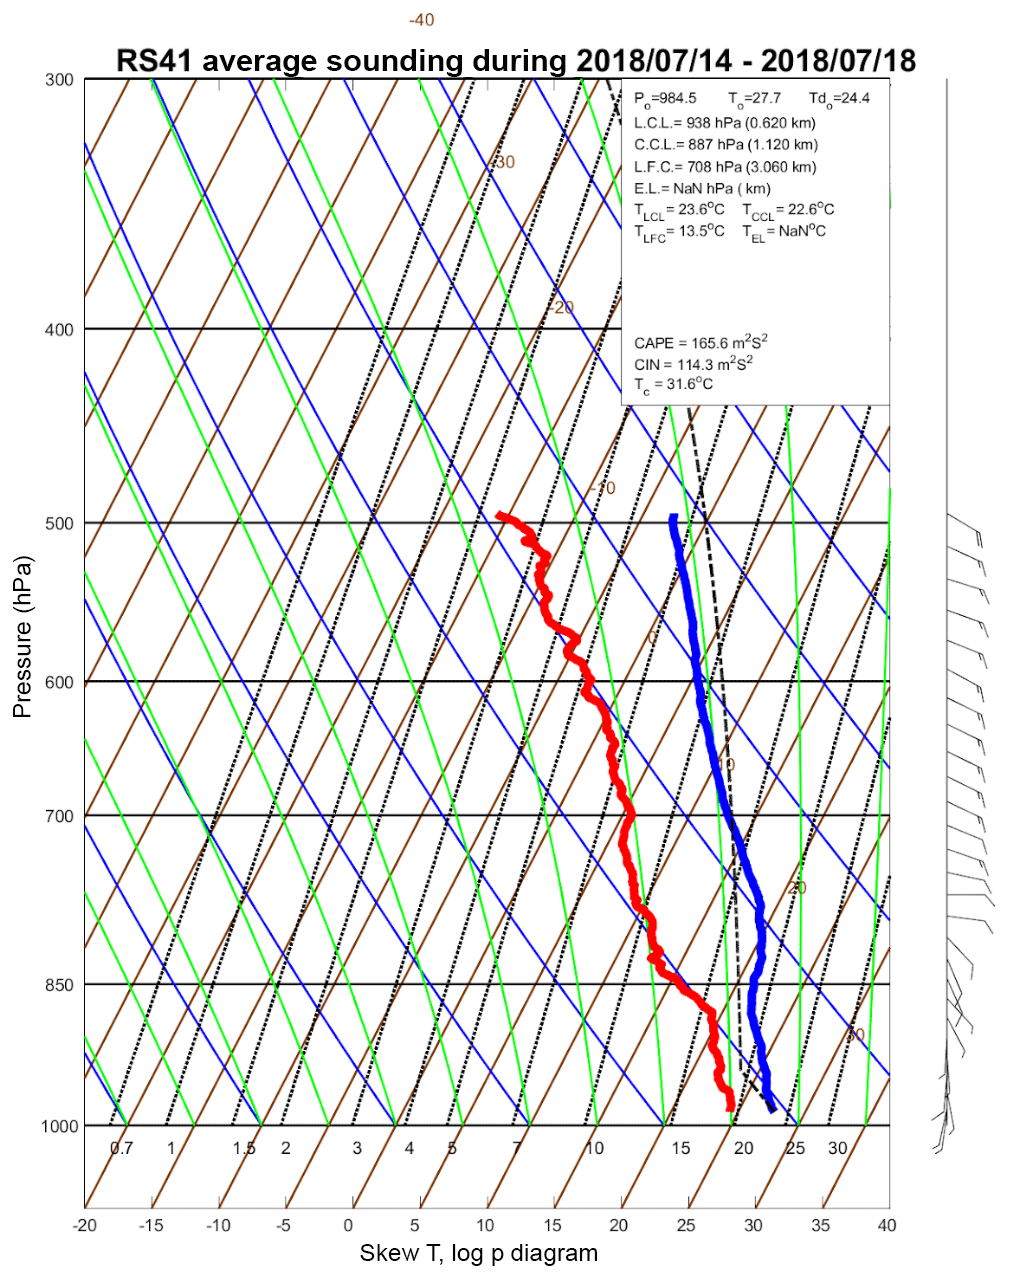
Figure 9The skew-T-log-P diagram of the average vertical profile measured by Vaisala RS41 radiosondes during the intercomparison run in July 2018 in Wu-Chi. The thick red line indicated the dew point, and the thick blue line indicated the temperature profile.
The overall vertical profile data collected during this experiment are shown in Fig. 10. It is similar to Figs. 2 and 3 of Fujiwara et al. (2003), who shift each vertical profile according to the launch time and plot all the vertical profiles. Here we added 2 % h−1 to humidity data, 2 ∘C h−1 for temperature data, and 2 m s−1 h− for wind data. According to Fig. 10, the Storm Trackers could measure properly at least up to 5000 m high and obtain overall good agreement among each Storm Tracker. In addition, we also present one of the time-series comparisons between the Storm Tracker and the Vaisala RS41-SGP in Fig. 11. According to Fig. 11, the Storm Tracker shows high consistency with the RS41-SGP, especially in the pressure and wind measurements. Slight lags were found in temperature and humidity measurements, which will be discussed in the following section.
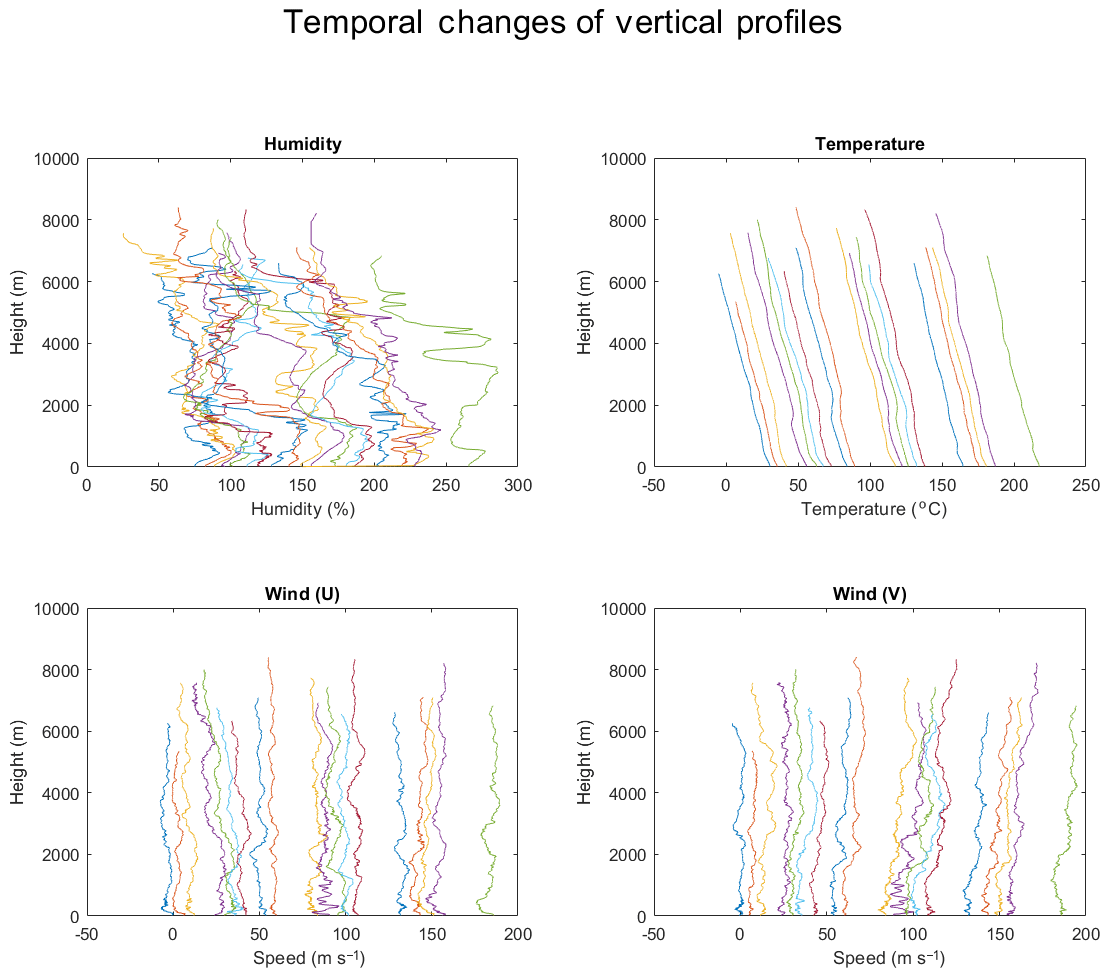
Figure 10Temporal changes in the vertical profile during the intercomparison run in July 2018 in Wu-Chi. Each vertical profile was shifted according to the launch time. Here we added 2 % h−1 to humidity data, 2 ∘C h−1 for temperature data, and 2 m s−1 h−1 for wind data.
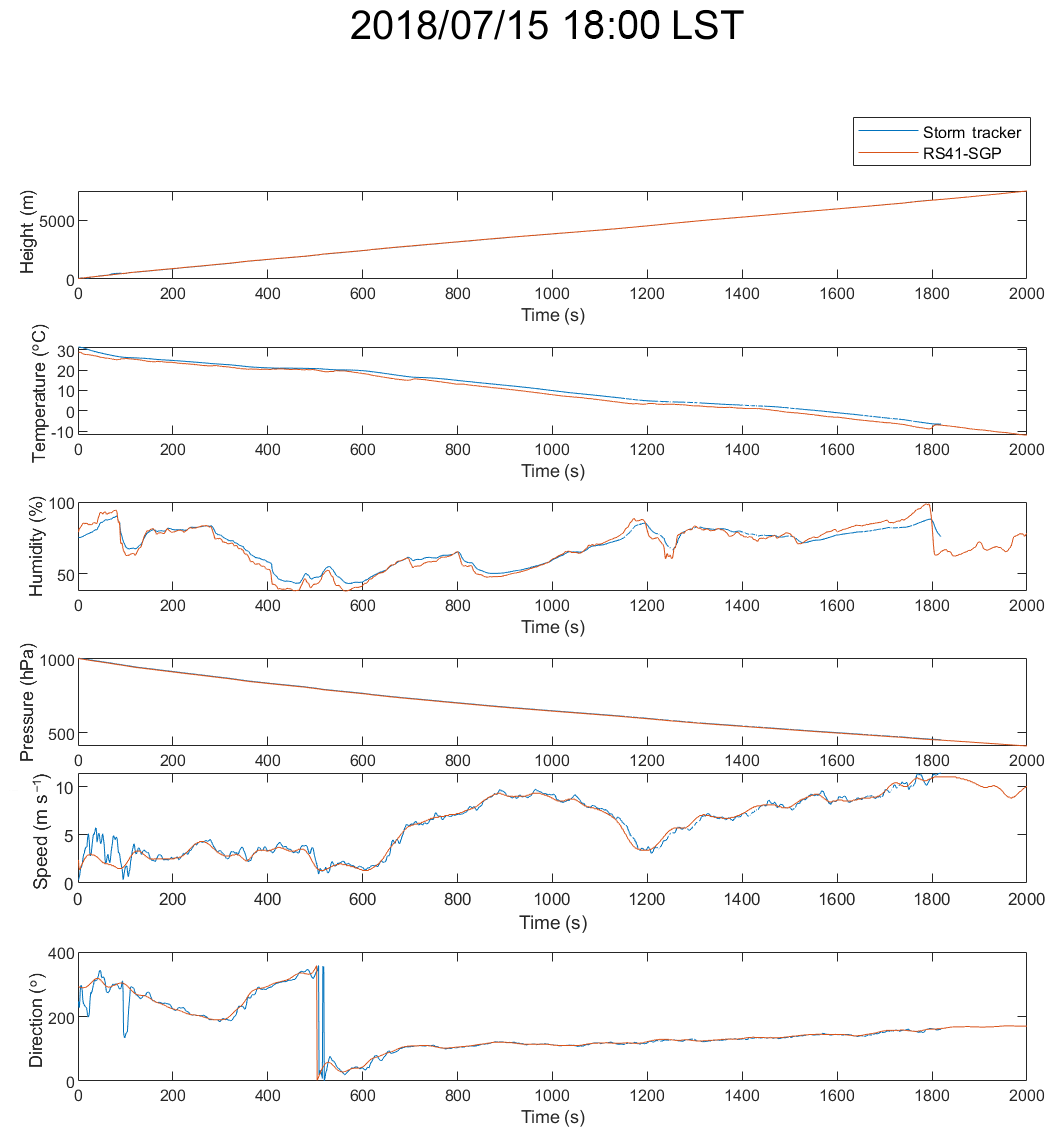
Figure 11One of the time-series comparisons during the intercomparison run in July 2018 in Wu-Chi. The blue line indicates Storm Tracker time-series data, and the orange line indicates RS41-SGP time-series data.
3.2 Humidity time-lag error analysis
Since both the Storm Tracker and the Vaisala RS41-SGP transmit data every second, we could first analyze the time-lag error for humidity. The analysis is done by separating the time-series data into three different altitude sections: 200–3000, 3000–4500, and >4500 m. For each section of the time series, we find the resulting delay that maximizes the cross-correlation. To exclude the effect of solar radiation heating, we use only the nighttime data to calculate the time lag. The average time lags are shown in Table 4.
Table 3Temperature and humidity error (Storm Tracker minus Vaisala RS41-SGP) statistics for the second intercomparison experiment in July 2018 in Wu-Chi.
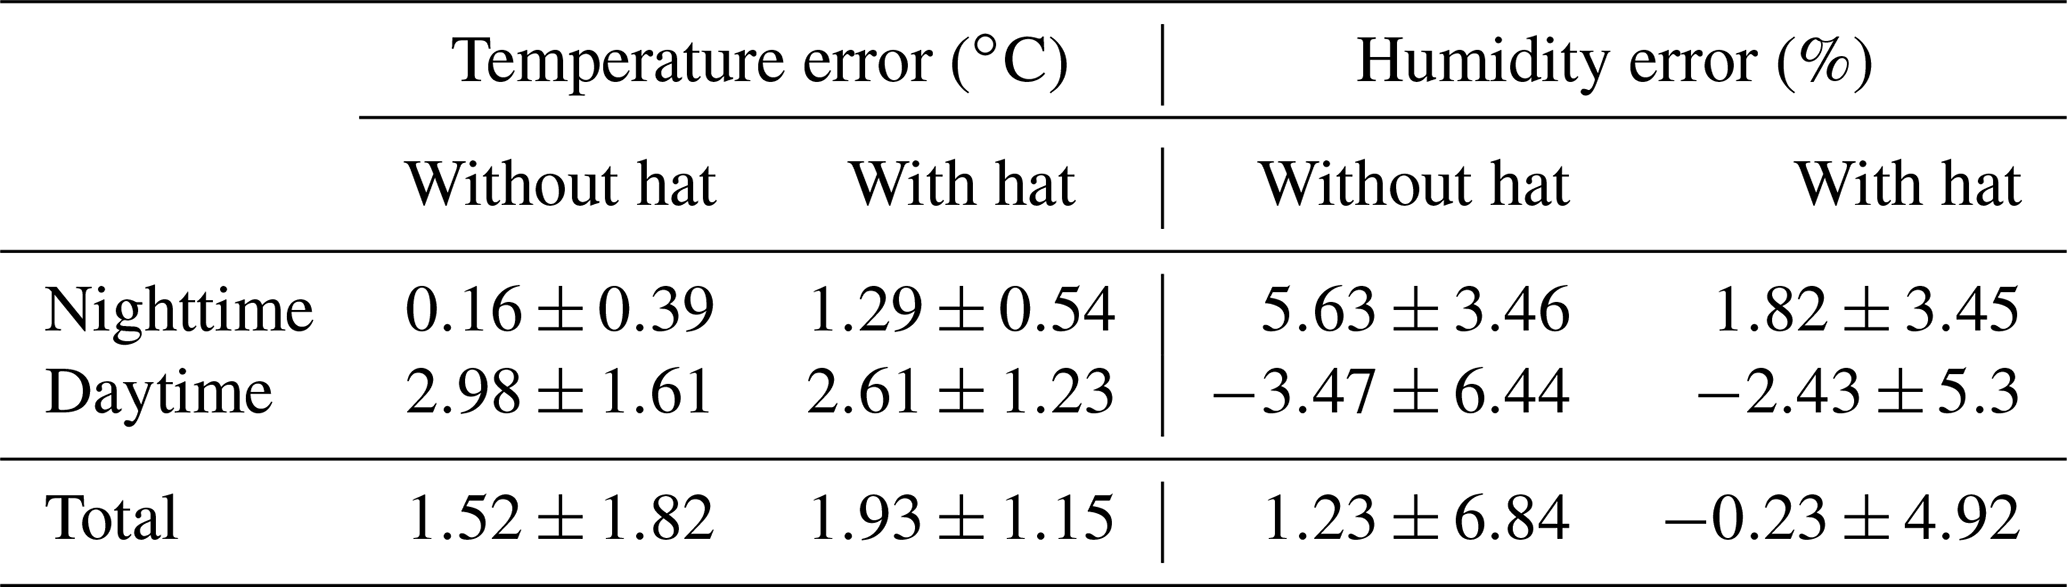
Table 4Average time lag for the second intercomparison experiment in July 2018 in Wu-Chi.
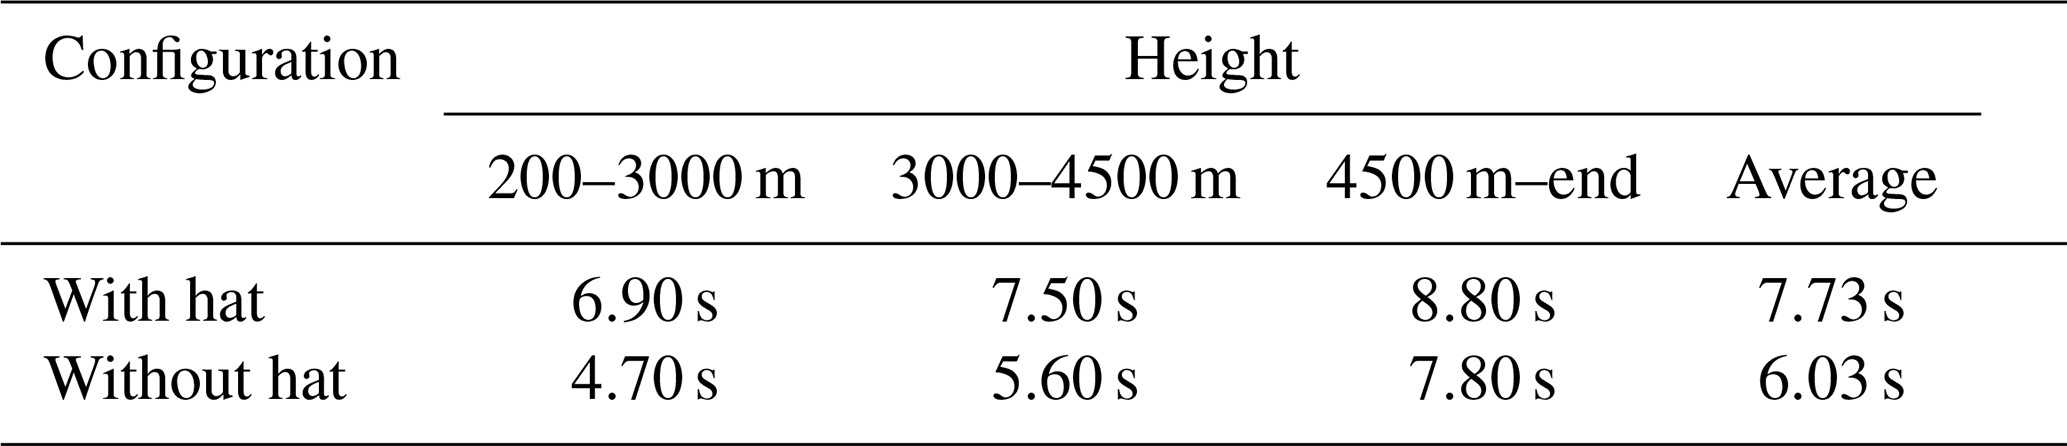
One example of the time series is shown in Fig. 12. We could see that for the humidity measurements without the metal shield, the time lag is about 5 to 8 s. And the higher the altitude, the longer the time lag. Furthermore, in the case of adding the metal shield, the time lag is longer compared to the case without a metal shield, which indicates that the metal shield might affect the ventilation, but overall the time lags are still within an acceptable range of 7 to 9 s. According to the results, the time-lag correction is omitted at this stage of analyses.

Figure 12One of the results for the time-lag analysis. The original time series are at the top. The time-lag-corrected time series are at the bottom, with three segments of the time series for the three altitude bins. The time lags for this case are 2 s (200–3000 m), 4 s (3000–4500 m), and 4 s (above 4500 m).
3.3 Temperature and humidity solar radiation biases analysis
The raw data from both Storm Tracker and Vaisala RS41-SGP were analyzed by calculating the difference along with the time series. For calculating the mean and standard deviation of the biases across different altitudes, the Vaisala RS41 altitude data were used as the reference, and the vertical profiles are from 200 to 6000 m at a 20 m interval. The data during daytime (08:00–18:00 LST) and nighttime (18:00–08:00 LST) were separated to see how the sensor response to solar radiation. The vertical profiles of temperature and humidity biases are shown in Fig. 13, and the statistics are in Table 3.
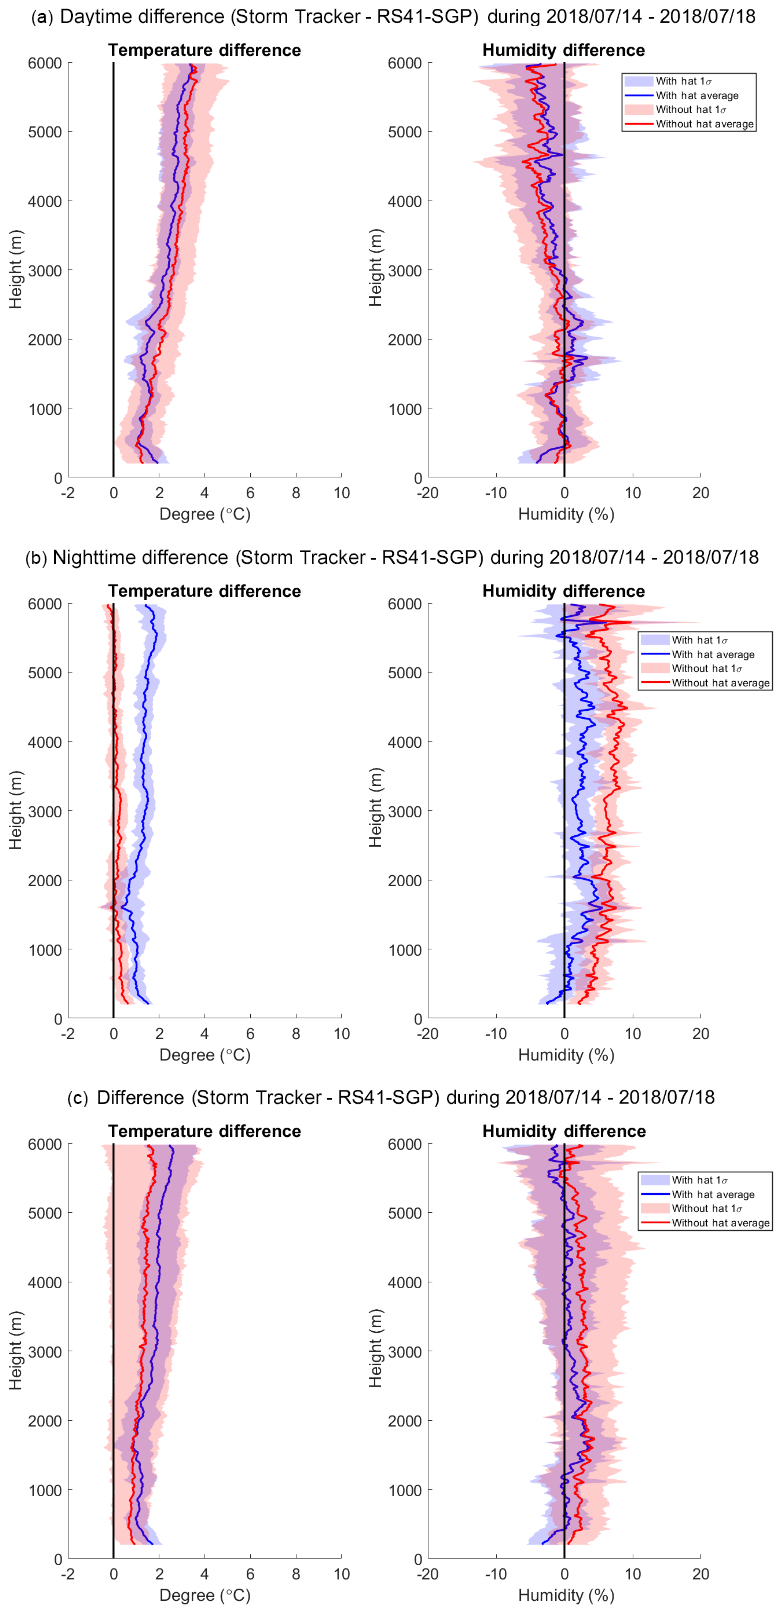
Figure 13The vertical profiles for temperature and humidity differences during both the daytime and nighttime in July 2018 during the Wu-Chi experiment. The lines indicate the mean, and 1-standard-deviation ranges are shaded. The red color indicates daytime data, and blue color indicates nighttime data.
First, we can see from Fig. 13 that either with or without the metal shield, the temperature and humidity sensor had experienced significant solar heating during the daytime, which also caused the solar radiation dry bias (Vömel et al., 2007) in moisture measurements. Furthermore, temperature bias increases with altitude. Overall, with the metal shield added, the standard deviation and mean of the biases are smaller at most altitudes, as shown in Fig. 13c. As shown in Table 3, during the daytime, the mean temperature warm bias drops from 2.98 to 2.61 ∘C by adding the hat. The standard deviation also drops from 1.61 to 1.23 ∘C. Likewise, the mean dry bias drops from 3.47 % drier to 2.43 % drier with the hat. Moreover, the standard deviation decreases from 6.44 % to 5.3 %. These results show that the reflective metal shield does help to prevent direct solar heating when the Storm Tracker is in the air.
However, the installation of the metal shield causes a further warm bias when there is no solar heating. From Fig. 13b, we can see that the case with the metal shield experienced a warm bias in the profile, which also caused the humidity moist bias to drop and brought down the overall humidity difference. In Table 3, the mean warm bias increases from 0.16 ∘C without the hat to 1.29 ∘C with the hat, and the standard deviation increases from 0.39 to 0.54 ∘C. The mean humidity bias, on the other hand, drops from 5.63 % moister for Storm Tracker without the hat to 1.82 % for Storm Tracker with the hat. In both cases, the standard deviation is similar ∼3.5 %. During the nighttime, the results show that the metal shield further induces a warm bias, which may be the leading cause of the drying moist bias.
Finally, in Fig. 13c, we can see the benefit of lowering the variances of measurements by adding the metal shield onto the temperature–humidity sensor. In Table 3, on average, even though the mean warm bias increases from 1.52 to 1.93 ∘C with the hat added, the standard deviation decreases from 1.82 to 1.15 ∘C. Moreover, the mean humidity bias improves from 1.23 % to −0.23 % with the hat, and the standard deviation also drops from 6.84 % to 4.92 % with the hat.
Even though the metal shield causes a warm bias during the nighttime, it mitigates the solar radiation heating effects and the solar radiation dry bias during the daytime when most of the severe weather occurs. For such events in Taiwan, it is worthwhile to apply these new instruments to acquire much higher resolution data, especially for afternoon thunderstorms triggered by daytime solar heating.
Table 5All the sensor error (Storm Tracker minus Vaisala RS41-SGP) statistics for the second intercomparison experiment in July 2018 in Wu-Chi.
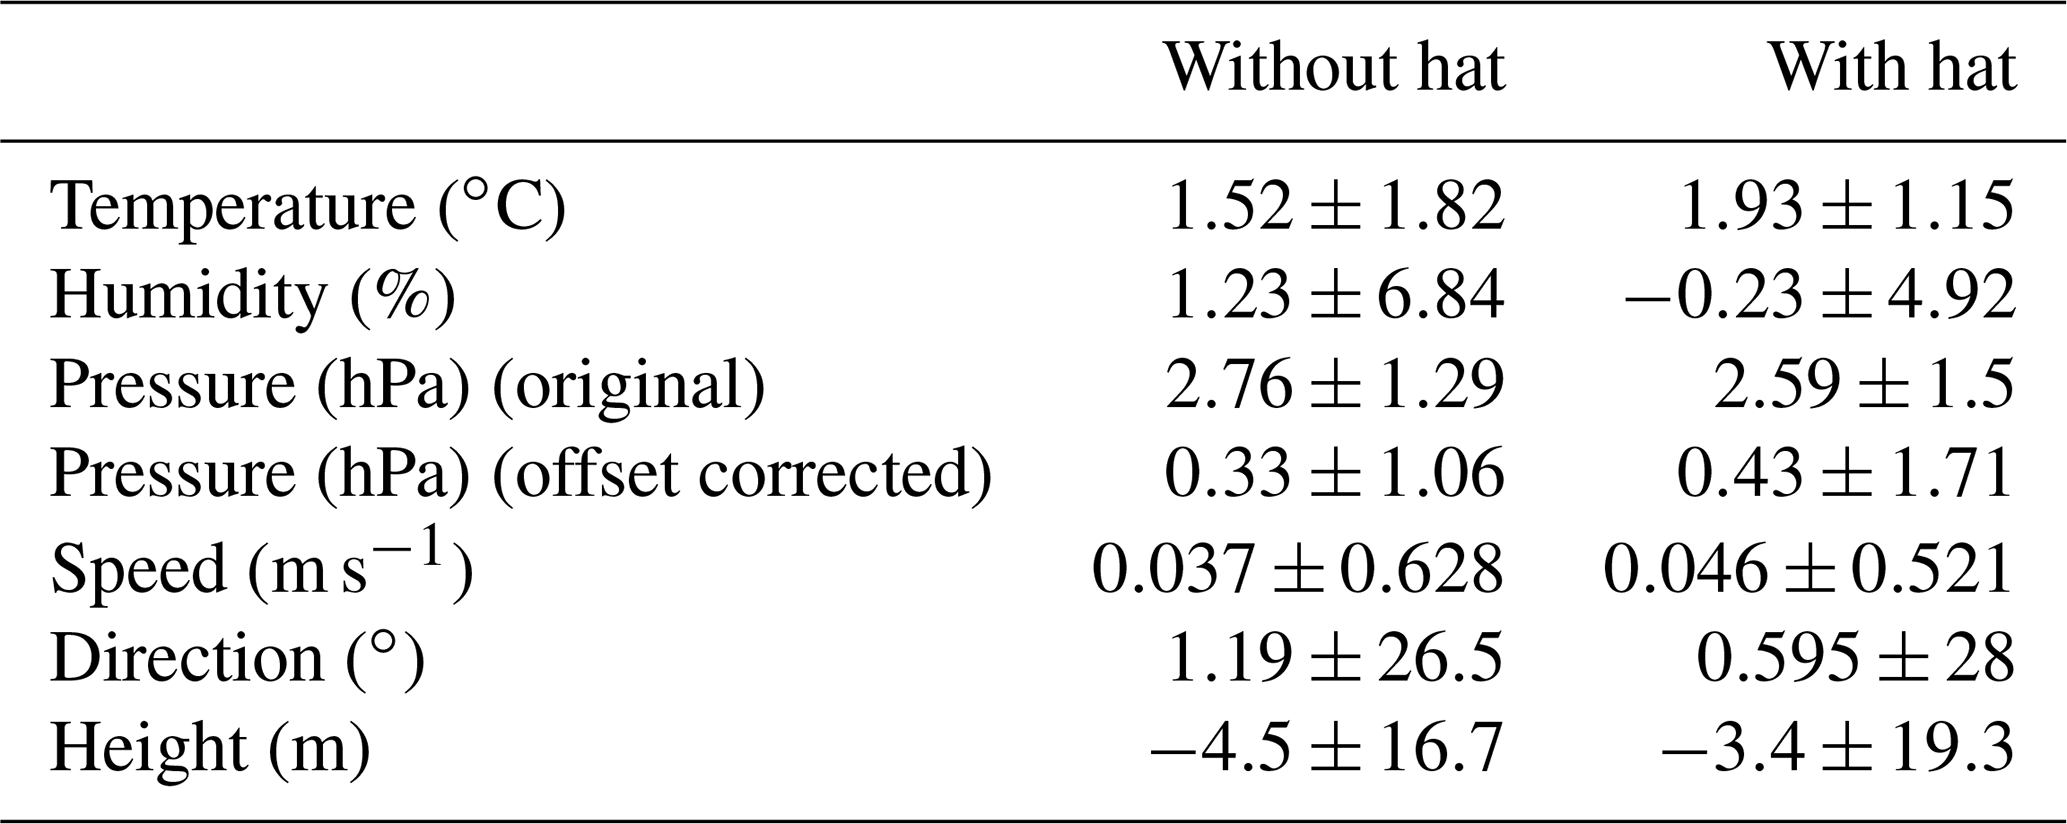

Figure 14The time-series–height data for the experiment done during July 2018 in Wu-Chi. The shaded color represents θe, and the arrow direction indicates wind direction with length indicating the wind speed. Lastly, the gray line is the boundary height calculated with the algorithm developed by Liu and Liang (2010).

Figure 15Synoptic chart during the experiment done during July 2018 in Wu-Chi. Credit to Central Weather Bureau for providing the synoptic chart.
3.4 Pressure and GPS analysis
Since the Vaisala RS41-SGP is equipped with a pressure sensor, we also compared our BMP280 sensor with that of the Vaisala RS41-SGP, as shown in Table 5. Although the resulting initial error is higher than BMP280's accuracy, we tried to mitigate the difference by applying a ground check procedure on the pressure measurements for each launch. As indicated in Table 5, the pressure measurement result was further improved that the mean pressure error drops from 2.76 (2.59) hPa to 0.33 (0.43) hPa for Storm Tracker without (with) the hat. In addition, for the measurements derived from the GPS sensor, the Storm Tracker performs very well comparing to the Vaisala RS41-SGP.
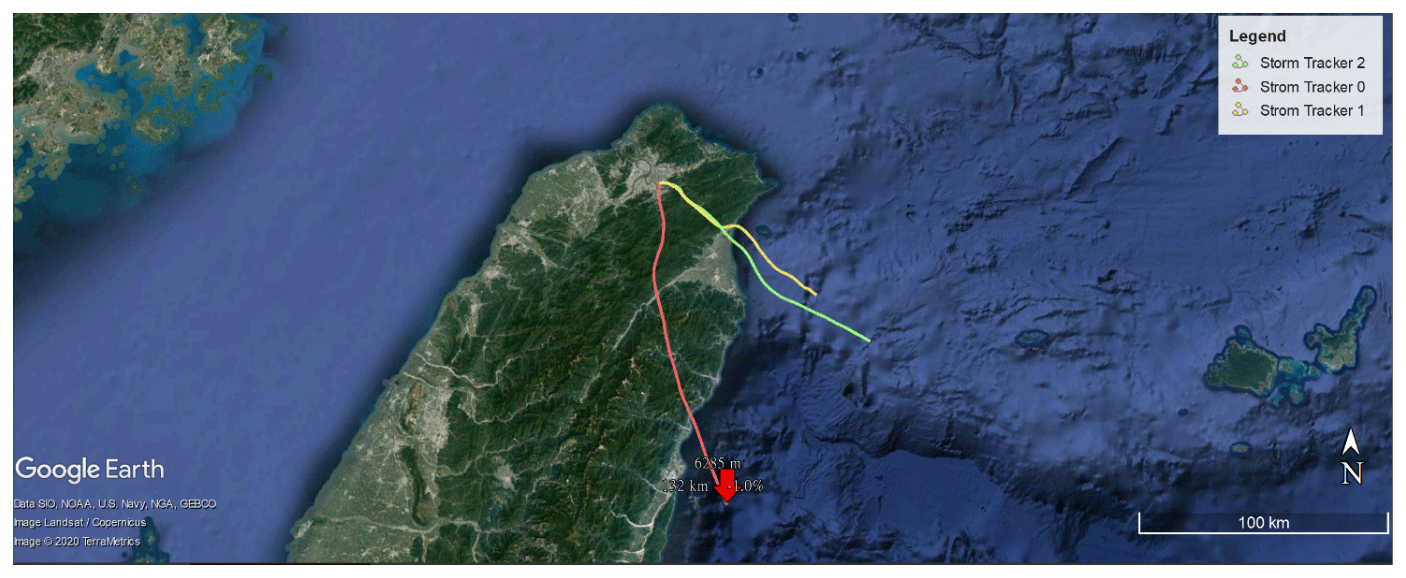
Figure 16Three balloon tracks during Typhoon Talim (red, yellow, and green tracks are Storm Tracker 0, 1, and 2). The launching site is located on the campus of National Taiwan University. The maximum range of the Storm Tracker from the site is 132 km. Credit to © Google Earth Pro for providing the satellite image.
One of the main scientific purposes of the experiments conducted is to examine the performance of the Storm Tracker system on the BL observations. In Fig. 14, we present the time–height series data across the experiment timeline. The colors represent θe (equivalent potential temperature), and the arrow represents the wind speed and direction. The BL heights (gray lines) were calculated according to the method described in Liu and Liang (2010), which is mainly based on the vertical profiles of θe and wind speeds. During the 2018 trial run, the overall Taiwan area is dominated by the subtropical high, resulting in the subsidence, as seen in Fig. 9 and relatively clear weather (Fig. 15).
Here we can see that the evolution of the boundary layer grows and maximized near noon. Moreover, with the higher temporal resolution of up to 3-hourly, we could see the diurnal cycle of the development of the boundary layer. This demonstrates one of the use cases for the Storm Tracker in gathering high temporal or spatial data enabled by the ability of simultaneous signal receiving.
Another campaign during Typhoon Talim on 13 September 2017 was conducted with three Storm Trackers to see whether the observations within the tropical cyclones are possible (the tracks are shown in Fig. 16). The light-weight Storm Tracker can be launched with a conventional and small constant balloon, which then can stay afloat at a fixed altitude. Figure 17 shows the time-series instrument data of Storm Tracker 0. In this experiment, the Storm Tracker stayed at about 6200 m. Although the signal was lost eventually by the mountains blocking between the ground receiver and the Storm Tracker, this launch shows the potential of Storm Tracker to conduct drift sound experiments in the future.
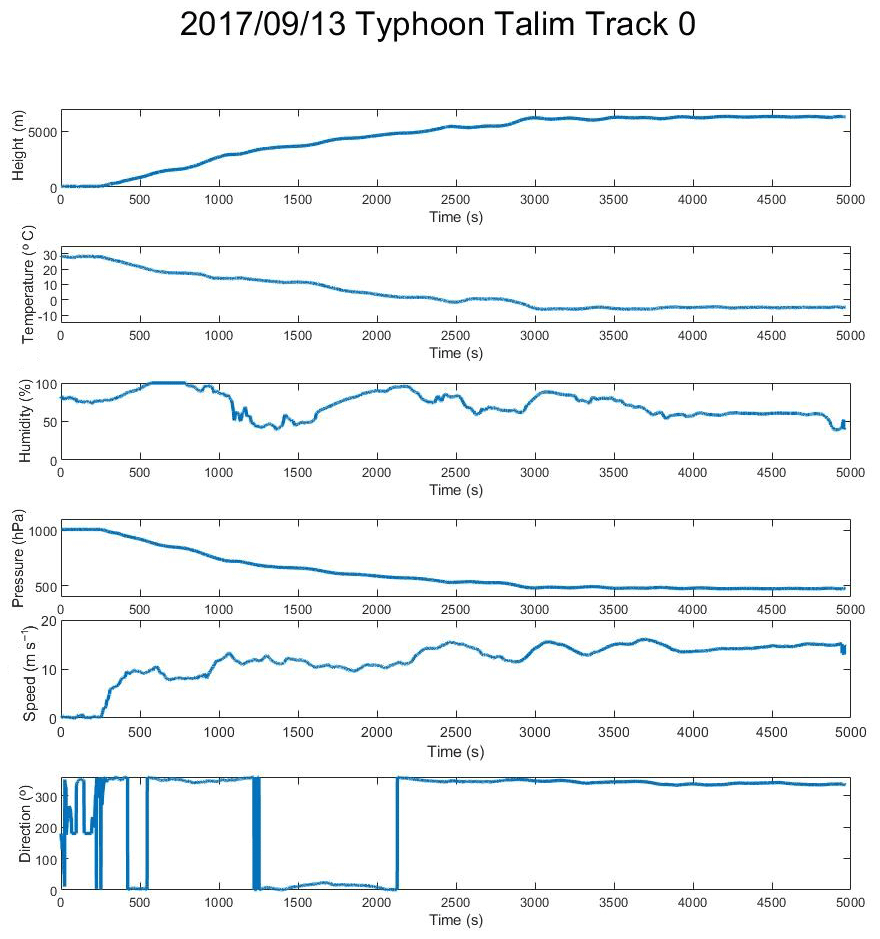
Figure 17Storm Tracker 0 time-series data during Typhoon Talim. The altitude of Storm Tracker can be maintained at around 6200 m.
Although the Storm Tracker system is incorporated with the new low-cost sensors, we show that it can accomplish decent performance compared with Vaisala radiosondes with a significant cost reduction. Moreover, with the capability of tracking multi-tracker simultaneously and incorporating LoRa™ technology, it enables future missions to deploy many radiosondes to collect higher spatiotemporal resolution data.
These trial runs show that the Storm Tracker radiosondes still have issues regarding temperature and moisture measurements. Still, the current configuration with a thin metal shield does help with the daytime biases and lowering the variance. More experiments to compare the measurements between the Storm Tracker and Vaisala RS41 are underway, in addition to the intercomparison among different individual instruments such as radiometers. More importantly, with more intercomparison data, the objective correction algorithms are currently developed and tested for better data quality control.
All field measurement data from our Storm Tracker and Vaisala RS41-SGP could be accessed through FTP by request.
WCH made the printed circuit board, performed program coding, and documented the draft. PHL procured the funding of this study and coordinated field tests. HY participated in the discussion of data intercomparison.
The authors declare that there is no conflict of interest.
The authors appreciate the RS-41 data sharing from the RCEC (Research Center for Environmental Changes) at Academia Sinica and the field tests supported by the Ministry of Science and Technology in Taiwan (MOST) managed by Hung-Chi Kuo at National Taiwan University. We also appreciate the efforts of the associate editor and the reviewers, whose comments improved this paper. Additional appreciations to the NTU COOK lab members for collecting the data, and Min-Duan Tzeng for the Skew-T diagram plotting tools.
This research has been supported by the Ministry of Science and Technology in Taiwan (MOST) by the TASSE program (grant no. MOST 108-2119-M-002-022).
This paper was edited by Ad Stoffelen and reviewed by Masatomo Fujiwara and two anonymous referees.
Atmel Corporation: ATmega328P 8-bit AVR Microcontroller with 32K Bytes In-System Programmable Flash Datasheet, ATmega328P [DATASHEET] 7810D–AVR–01/15, 294 pp., available at: http://ww1.microchip.com/downloads/en/DeviceDoc/Atmel-7810-Automotive-Microcontrollers-ATmega328P_Datasheet.pdf (last access: 21 September 2020), 2015.
Augustin, A., Yi, J., Clausen, T., and Townsley, W. M.: A Study of LoRa: Long Range & Low Power Networks for the Internet of Things, Sensors, 16, 1466, https://doi.org/10.3390/s16091466, 2016.
Bosch Sensortec: Datasheet BMP280 Digital Pressure Sensor, BST-BMP280-DX001-19, 49 pp., available at: https://ae-bst.resource.bosch.com/media/_tech/media/datasheets/BST-BMP280-DS001.pdf (last access: 21 September 2020), 2018.
Fujiwara, M., Xie, S.-P., Shiotani, M., Hashizume, H., Hasebe, F., Vömel, H., Oltmans, S. J., and Watanabe, T.: Upper-tropospheric inversion and easterly jet in the tropics, J. Geophys. Res., 108, 4796, https://doi.org/10.1029/2003JD003928, 2003.
Ingleby, B.: An assessment of different radiosonde types 2015/2016, ECMWF, Technical Memoranda 807, 1–69, https://doi.org/10.21957/0nje0wpsa, 2017.
Liu, S. and Liang, X.: Observed Diurnal Cycle Climatology of Planetary Boundary Layer Height, J. Climate, 23, 5790–5809, https://doi.org/10.1175/2010JCLI3552.1, 2010.
MediaTek: MediaTek MT7688 Datasheet, 294 pp., available at: http://labs.mediatek.com/en/chipset/MT7688 (last access: 21 September 2020), 2016.
Nash, J., Oakley, T., Vömel, H., and Wei, L.: Instruments and Observing methods, in: WMO intercomparison of high quality radiosonde systems, 12 July–3 August 2010, Yangjiang, China, World Meteorological Organization, Report No. 107, 58–189, 2011.
TE Connectivity: HTU21D(F) RH/T SENSOR IC Digital Relative Humidity sensor with Temperature output, HTU21D(F) RH/T SENSOR IC, 22 pp., available at: https://www.te.com/usa-en/product-CAT-HSC0004.html (last access: 21 September 2020), 2017.
U-blox: MAX-7 u-blox 7 GNSS modules Data Sheet, UBX-13004068, 24 pp., https://www.u-blox.com/sites/default/files/products/documents/MAX-7_DataSheet_(UBX-13004068).pdf (last access: 21 September 2020), 2014.
Vaisala Corporation: Vaisala Radiosonde RS41-SGP. B211444EN-E, 2 pp., available at: https://www.vaisala.com/sites/default/files/documents/WEA-MET-RS41SGP-Datasheet-B211444EN.pdf (last access: 21 September 2020), 2017.
Vömel, H., Selkirk, H., Miloshevich, L., Valverde-Canossa, J., Valdés, J., Kyrö, E., Kivi, R., Stolz, W., Peng, G., and Diaz, J. A.: Radiation dry bias of the Vaisala RS92 humidity sensor, J. Atmos. Ocean. Tech., 24, 953–963, 2007.
- Abstract
- Introduction
- Configuration for Storm Tracker upper-air observation system
- The intercomparison between the Storm Tracker and Vaisala RS41-SGP
- Applications in the field campaigns
- Concluding remarks
- Data availability
- Author contributions
- Competing interests
- Acknowledgements
- Financial support
- Review statement
- References