the Creative Commons Attribution 4.0 License.
the Creative Commons Attribution 4.0 License.
 | 06 Nov 2020
Impact of using a new ultraviolet ozone absorption cross-section dataset on OMI ozone profile retrievals
Xiong Liu
Manfred Birk
Georg Wagner
Iouli E. Gordon
Kelly Chance
We evaluate different sets of high-resolution ozone absorption cross-section data for use in atmospheric ozone profile measurements in the Hartley and Huggins bands with a particular focus on BDM 1995 (Daumont et al. 1992; Brion et al., 1993; Malicet et al., 1995), currently used in our retrievals, and a new laboratory dataset by Birk and Wagner (2018) (BW). The BDM cross-section data have been recommended to use for retrieval of ozone profiles using spaceborne nadir-viewing backscattered ultraviolet (BUV) measurements since its improved performance was demonstrated against other cross-sections including Bass and Paur (1985) (BP) and those of Serdyuchenko et al. (2014) and Gorshelev et al. (2014) (SER) by the “Absorption Cross-Sections of Ozone” (ACSO) activity. The BW laboratory data were recently measured within the framework of the European Space Agency (ESA) project SEOM-IAS (Scientific Exploitation of Operational Missions – Improved Atmospheric Spectroscopy Databases) to provide an advanced absorption cross-section database. The BW cross-sections are made from measurements at more temperatures and in a wider temperature range than BDM, especially for low temperatures. Relative differences of cross-sections between BW and BDM range from ∼2 % at shorter UV wavelengths to ∼5 % at longer UV wavelengths at warm temperatures. Furthermore, these differences dynamically increase by up to ±40 % at cold temperatures due to no BDM measurements having been made below 218 K. We evaluate the impact of using different cross-sections on ozone profile retrievals from Ozone Monitoring Instrument (OMI) measurements. Correspondingly, this impact leads to significant differences in individual ozone retrievals by up to 50 % in the tropopause where the coldest atmospheric temperatures are observed. Bottom atmospheric layers illustrate the significant change of the retrieved ozone values, with differences of 20 % in low latitudes, which is not the case in high latitudes because the ozone retrievals are mainly controlled by a priori ozone information in high latitudes due to less photon penetration down to the lower troposphere. Validation with ozonesonde observations demonstrates that BW and BDM retrievals show altitude-dependent bias oscillations of similar magnitude relative to ozonesonde measurements, much smaller than those of both BP and SER retrievals. However, compared to BDM, BW retrievals show significant reduction in standard deviation, by up to 15 %, especially at the coldest atmospheric temperatures. Such improvement is achieved mainly by the better characterization of the temperature dependence of ozone absorption.
- Article
(2253 KB) - Full-text XML
- BibTeX
- EndNote


Accurate knowledge of the absorption cross-sections of ozone and their temperature dependence is essential for highly accurate measurements of atmospheric ozone (Orphal et al., 2016) as well as other trace gases affected by the strong ozone absorption such as BrO, NO2, SO2 and CH2O (e.g., Seo et al., 2019; Theys et al., 2017). In the laboratory, measuring ozone cross-sections which can meet the high requirements for accurate ozone profile measurements covering a wide spectral range (at least 270–340 nm) at high resolution (typically 0.01 nm) for a wide range of atmospheric temperatures (180–300 K) is still challenging. The difficulties range from reactivity of ozone to calibration standards. For instance, as discussed in the recent review by Hodges et al. (2019), the accepted calibration of ozone cross-sections at the 254 nm mercury line (Hearn, 1961) was in need of revision. In addition, simultaneous measurements of ozone in the microwave, infrared and ultraviolet regions are subject to uncertainties due to systematic differences in the respective regions (see discussion in Birk et al. 2019, and Tyuterev et al. 2019, for instance). The need to evaluate existing cross-sections used for all atmospheric measurements of ozone and to make its recommendations initiated the “Absorption Cross-Section of Ozone” (ACSO) activity that was established in 2008 and conducted in two phases (2009–2011, 2013) (Orphal et al., 2016). The ACSO activity shows the need to continue laboratory ozone cross-section measurements of the highest quality.
Prior to ACSO activities, the available ultraviolet (UV) ozone cross-sections were thoroughly reviewed by Orphal (2002, 2003) and as a result three datasets of ozone cross-sections were found to be in agreement of 1 %–2 % with each other, including BP 1985 (Bass and Paur, 1985), BDM 1995 (Daumont et al. 1992; Brion et al., 1993; Malicet et al., 1995) and the Global Ozone Monitoring Experiment (GOME) flight model (Burrows et al., 1999) (GMFM). The BP dataset is no longer recommended for any atmospheric ozone measurements (Orphal et al., 2016) but still used to keep the long-term consistency of ground-based Dobson–Brewer total ozone records and spaceborne Total Ozone Mapping Spectrometer (TOMS)/Ozone Monitoring Instrument (OMI) total ozone records (McPeters et al., 2015). These cross-sections were also included in the 2004 edition of the high-resolution transmission molecular absorption database (HITRAN) (Rothman et al., 2005) and remained unchanged in subsequent editions including HITRAN2016 (Gordon et al., 2017). Using GMFM is restricted to GOME measurements because these cross-sections were measured at GOME resolution (∼0.2 nm). On the other hand, the high-resolution cross-sections of BDM were first applied by Liu et al. (2005) for GOME ozone profile retrievals in the literature. In Liu et al. (2007), these three datasets were thoroughly assessed to find the most suitable cross-sections for GOME ozone profile retrievals (290–307 and 325–340 nm). As a result, they recommended using the BDM for ozone profile retrievals due to much smaller fitting residuals and better agreement with ozonesonde measurements. Such improvement is likely due to better spectral resolution and wavelength calibration of BDM than BP and GMFM. After that, the recommendation of BDM for satellite ozone profile retrievals has been officially made by the ACSO activities during the first phase (2009–2011) and the second phase (2013), respectively. The first activity was focused on the intercomparison between BDM and BP, while the second activity was additionally organized in response to the new publication of a high-resolution laboratory dataset covering the temperature range of 193 to 293 K in 10 K steps by Serdyuchenko et al. (2014) and Gorshelev et al. (2014) (abbreviated as SER 2014). In the framework of the ACSO activity, Liu et al. (2013) evaluated the impact of changing from BDM to SER on OMI ozone profile retrievals (270–330 nm). The recommendation of the BDM was made again for use in ozone profile retrievals. Recently, a new laboratory dataset was measured at the German Aerospace Center (DLR) within the framework of the European Space Agency (ESA) project SEOM-IAS (Scientific Exploitation of Operational Missions – Improved Atmospheric Spectroscopy Databases) in order to improve the atmospheric backscattered ultraviolet (BUV) retrievals from the TROPOspheric Monitoring Instrument (TROPOMI) aboard the Sentinel-5 Precursor satellite (Birk and Wagner, 2018) (abbreviated as BW 2018). A publication with more details on the experiment and analysis is in preparation. Here, we investigate if the current recommendation should be replaced with the BW dataset. This work will also help in making the decision on which cross-sections should replace BP measurements in the HITRAN database.
This paper is organized as follows: Sect. 2 compares quadratic coefficients in the parameterization of temperature dependence and evaluates the parameterized cross-sections against interpolated ones. Section 3 analyzes the differences in individual OMI retrievals due to different cross-sections, which are evaluated against ozonesonde observations in Sect. 4. The paper is summarized and discussed in Sect. 5.
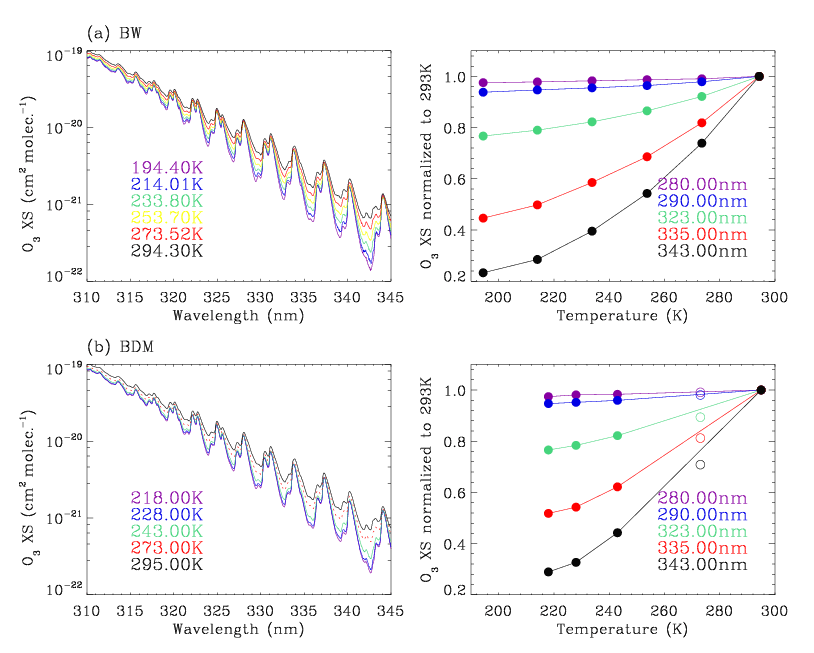
Figure 1Left: measurements of ozone absorption cross-sections at all selected temperatures in the Huggins bands taken from (a) BW 2018 and (b) BDM 1995, respectively. Right: for BW, the experimental data are plotted without the quadratic parameterization for a fair comparison with BDM. BDM measurements at 273 K are plotted with a dotted line on the left and with open circles on the right, because the data at this temperature are not recommended for use, by Liu et al. (2007).

Figure 2Quadratic coefficients (cm2 molecule−1) to parameterize the temperature dependence of ozone cross-sections for BDM (red) and BW (blue), respectively, with their relative differences (BDM–BW)/BW in black.
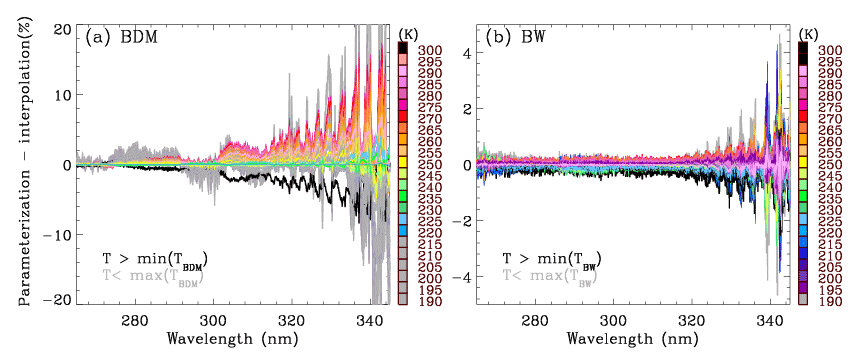
Figure 3Relative differences of ozone cross-sections parameterized and spline interpolated at temperatures between 190 and 300 K for (a) BDM and (b) BW, respectively. In the legend, the temperatures not covered by each dataset are indicated with gray and black for values beyond lower and upper boundaries, respectively; thus, slightly different color scales are used in these two panels for those outside the measured temperature range.
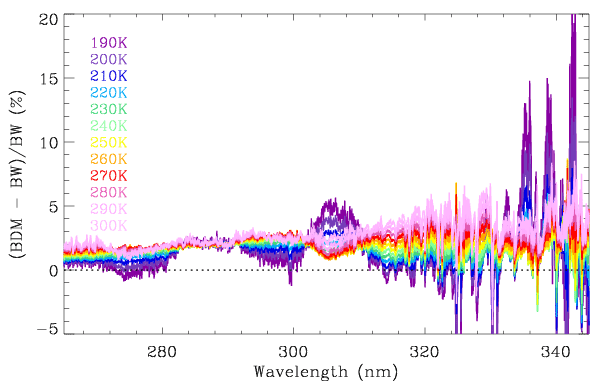
Figure 4Same as Fig. 3 but for relative differences (%) of parameterized ozone cross-sections of BDM and BW.
The BW dataset is publicly available at https://doi.org/10.5281/zenodo.1485588, along with experimental descriptions. A detailed publication is planned to describe the details of the experimental setup and procedure, so only a brief overview is given here. The cross-sections are given at six temperatures (193, 203, 233, 253, 273 and 293 K) and at vacuum wavelengths in the spectral range of 244 to 346 nm, measured by means of Fourier-transform spectroscopy (FTS) at DLR at a spectral resolution of 3.3 cm−1 (0.02–0.04 nm). A total of 191 measurements were recorded in two spectral ranges. Absorption cross-sections were obtained at each temperature by means of a global least squares fit. Below 285.71 nm, absorption cross-sections were smoothed to 7.7 cm−1 (0.04–0.06 nm) resolution by convolving with a Gaussian to reduce the noise. Offset corrections were made for each of the six temperatures by fitting to the SER dataset (constant for all wavelengths) since it was measured at higher ozone column density and thus considered more reliable regarding offset. After offset correction, polynomials of first order (<270.27 nm) and second order (>270.27 nm) in temperature were fitted for each spectral point to improve the statistical uncertainty. The offset corrections have a minor effect on the cross-sections except for wavelengths above ∼330 nm. Figure 1a illustrates BW measurements without polynomial fit in temperatures to be fairly compared with BDM measurements (Fig. 1b) with respect to the dependence of cross-sections on wavelength and temperature. The BDM measurements are given at five temperatures (218, 228, 243, 273 and 295 K) and at air wavelengths over the spectral range of 195–519 nm with a spectral resolution of 0.01–0.02 nm. Note that the wavelengths of these measurements are converted to vacuum wavelengths in Fig. 1b. Measured cross-sections are typically parameterized quadratically to be applied conveniently at any atmospheric temperature using the following equation:
This quadratic equation was first found to represent well the temperature dependence of ozone cross-section in the UV (Paur and Bass, 1985) and has now become the standard approach (Liu et al., 2007, 2013; Chehade et al., 2013a, b; Serdyuchenko et al., 2014). The non-linear least squares fitting between measured and parameterized spectrum converges typically within three iterations for both BDM and BW. Measurements at 273 K are excluded for the BDM quadratic temperature fitting, according to Liu et al. (2007). In Fig. 2, the derived temperature dependent coefficients are illustrated with their relative differences. Co values are similar to each other in the Hartley band (<310 nm) with relative biases of 2 %–3 %. However, the Huggins band (>310 nm) shows large spiky biases of up to 8 %. C1 and C2 represent linear and quadratic temperature dependence of absorption cross-sections, respectively. The cross-sections in the Hartley band are almost independent of the temperature variation and thereby large differences of these coefficients between two datasets are due the large correlation between C1 and C2 and are of minor importance to the parameterized cross-sections. However, the Huggins band shows the distinctly different temperature dependence between the two cross-section datasets, especially for the quadratic terms. For C2, the BW data show more monotonic wavelength dependence in the range of 290–310 nm. Note that we determined that the parameterization schemes used in this work and in Birk and Wagner (2018) are very similar by the fact that no residuals remain when comparing BW cross-sections with these two schemes (not shown here). Figure 3 compares the residuals of the fitted cross-sections relative to the original measurements interpolated to many atmospheric temperatures using a spline scheme. The BDM quadratic approximation has large positive residuals of up to 15 % for the temperatures ranging from 243 to 295 K due to insufficient sampling to account for the non-linearity of the temperature dependence, especially for the longer UV wavelength range. Moreover, approximating the BDM cross-sections at temperatures below 218 K results in errors of ±5 % below 315 nm and up to ±40 % above it. Compared to the BDM dataset, the parameterization of BW cross-sections results into significantly reduced residuals of 0.25 % below 320 nm and typically less than 2 % at longer wavelengths if the temperature is within the boundaries of the measurements. Residuals are within 5 % even if the temperatures are out of the boundaries. This demonstrates that the temperatures of BW measurements are well selected to characterize the temperature dependence of ozone cross-sections, whereas there are cross-section errors due to the BDM parameterization. Figure 4 shows the direct comparison of parameterized cross-sections between BDM and BW. The difference in cross-sections between BDM and BW is generally consistent with the corresponding comparison of C0 around 270 K. The differences at different temperatures are typically within 2 % for wavelengths below 310 nm except for several spikes around 276, 297 and 306 nm that are correlated with the differences of C2. At wavelengths larger than 315 nm, the inconsistency between BDM and BW shows large temperature dependence, with the differences increasing from ∼5 % at 315 nm to ∼20 % at 340 nm.
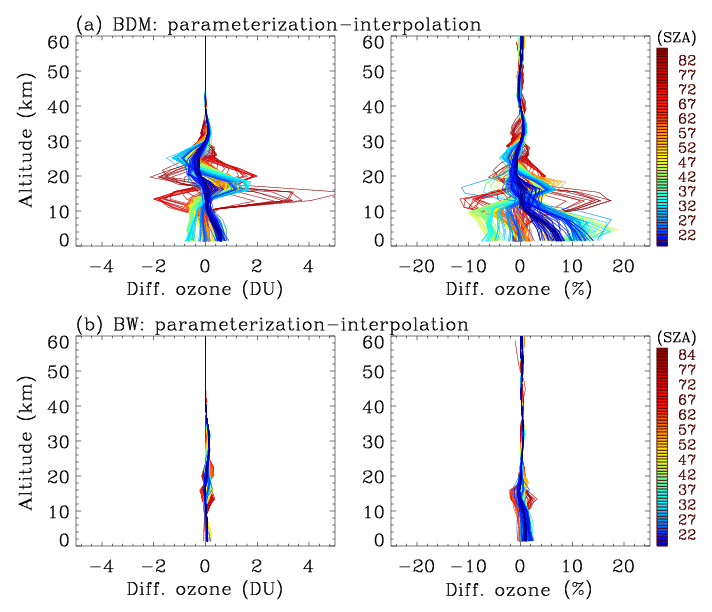
Figure 5The impact of parameterizing the cross-sections shown in Fig. 3 on ozone profile retrievals for (a) BDM and (b) BW, as a function of solar zenith angle (SZA). The differences of retrieved ozone profiles are assessed in absolute (left panels) and relative (right panels) units, respectively.
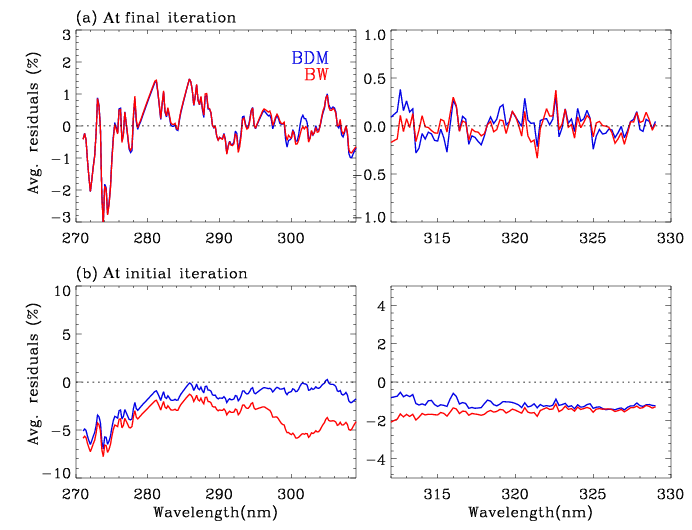
Figure 6Comparison of mean fitting residuals at latitudes of 15∘ S to 15∘ N at (a) final iteration and (b) initial iteration, respectively, when using BDM (blue) and BW (red).
OMI ozone profiles are retrieved at 24 layers from BUV spectra for 270–309 nm in UV1 and 312–330 nm in UV2 using an optimal estimation technique (Liu et al., 2010). The configurations implemented in this work are similar to those in Liu et al. (2013). One orbit of measurements on 1 July 2006 is used to see how our retrievals are changed due to using different cross-sections. Figure 5 shows the response of our retrievals to the parameterization errors shown in Fig. 3 as functions of solar zenith angle (SZA). Compared to the BDM, the ozone retrievals are almost independent of the BW parameterization errors, with individual differences of 2 %–3 % below 20 km and ∼0 % above it. The differences of the BDM cross-sections with and without the parameterization are −5 % to 15 % in the lower troposphere at smaller SZAs and up to ±20 % around 10 km at higher SZAs. The UV photon penetration down to the lower atmosphere decreases with SZAs increasing, and thereby tropospheric ozone retrievals become insensitive due to cross-section errors at high SZAs, while a priori ozone information becomes more important to the retrieval. Figures 6–8 show the retrieval differences when parameterized BW and BDM cross-sections are implemented, respectively. To evaluate the different implementations, both fitting and retrieval accuracies are assessed. However, it is very hard to see large differences in fitting residuals at the final iteration compared to differences of the retrieved elements of the state vector because the algorithm iteratively updates the state vector toward minimizing the differences in the spectral residuals. The fitting residuals are comparable at final iteration when applying the BW and BDM datasets as shown in Fig. 6a except for noticeable smaller residuals for 310–320 nm. However, we can find distinct changes in the mean residuals of measured radiance to simulated radiance at the initial iteration, mainly over the wavelength range of 290 to 315 nm, up to 5 %, as shown in Fig. 6b. On the other hand, Liu et al. (2007, 2013) demonstrated the distinct change of final fitting residuals when changing BDM to BP and GMFM, implying that using BW dataset improves fitting accuracies over using BP and GMFM but produces similar fitting accuracies to when BDM and SER are used. Figure 7 shows both relative and absolute differences of the retrieved ozone profiles with the corresponding temperature profiles taken from the National Centers for Environmental Prediction (NCEP) final (FNL) operational global analysis data. Differences of 20 %–50 % commonly exist along the tropopause, where the original BDM measurements could not cover atmospheric temperatures below 218 K (Fig. 7a). Some larger differences occur throughout the troposphere in the tropics likely due to the relatively smaller retrieved partial ozone columns. The individual differences of retrieved ozone in the lower troposphere are ∼20 %. However, the corresponding impact on the total column ozone from integrating retrieved ozone profiles is overwhelmed by the stratospheric layers (20–30 km), as shown in Fig. 7b, where the ozone amount is relatively large and the dependence of ozone cross-sections on temperature is still important. As a result, applying BDM causes an underestimation of total ozone except at the South Pole due to the biggest inconsistency of two cross-sections at the coldest temperature just above the tropopause in spite of a smaller amount of ozone compared to upper stratospheric layers. The magnitude of this underestimation/overestimation is ∼1 %, which is comparable to the overall accuracy (∼1.5 %) of the OMI operational total ozone product against ground-based measurements (McPeters et al., 2015). The wavelength shifts between ozone cross-sections and radiances are iteratively and simultaneously fitted with ozone for their respective UV1 and UV2 channels. Figure 8 compares how the wavelengths of different cross-sections are adjusted in each fitting window at nadir view. According to Schenkeveld et al. (2017), wavelength errors of OMI radiances are expected to be ∼0.002 nm in UV2 and ∼0.015 nm in UV1. The fitted wavelength shifts fall in the ranges of the OMI wavelength accuracy. Compared to the BDM, the BW dataset has the relative shifts of ∼0.002 nm in UV2. The mean shifts in UV1 are comparable, 0.0087 and 0.0081 nm for BDM and BW, respectively, whereas the variance of the fitted shifts over the latitude is reduced with the use of BW dataset as the shifts are more stable south of 30∘ S. On the other hand, Liu et al. (2013) show that the relative shifts between SER and BDM are ∼0.007 nm in both UV1 and UV2, and BP shifts vary largely with latitude by up 0.01 nm. These results indirectly demonstrate the similarity of the wavelength calibration quality between BDM and BW measurements.

Figure 7(a) Percent difference ((BDM–BW)/BW ×100 %) of retrieved ozone profiles using BDM and BW datasets at nadir view, (b) absolute differences in Dobson units and (c) corresponding temperature profiles in the retrievals. In panels (a) and (b), the black line represents the differences of integrated column ozone. The white line in both panels represents the tropopause height.
Ozonesonde measurements at five stations during the period of 2005 to 2008 are used to evaluate the retrieval accuracy of ozone profile retrievals using different cross-sections. In addition to the currently used BDM and the new BW datasets, BP and SER previously assessed in Liu et al. (2013) are included in this evaluation. Typically, high-resolution vertical structures of ozonesonde profiles (∼100 m) are degraded to OMI resolution (6–10 km in the stratosphere, 10–15 km in the troposphere) using retrieval averaging kernels to eliminate the effect of OMI smoothing errors (80 % of total retrieval errors in the lower stratosphere and troposphere) in comparison with ozonesondes; as a result, the standard deviations of comparisons are typically reduced by a factor of 2 in the troposphere and lower stratosphere, while the comparisons of mean biases are less impacted by using OMI smoothing errors or not. In this paper, the conclusion on which cross-section data should be used stays the same regardless of whether ozonesonde profiles are vertically smoothed or not, so we present validation results only using original ozonesonde measurements. In Fig. 9, mean biases of the retrieved ozone profiles relative to ozonesondes and the corresponding standard deviations are presented at each station, arranged in latitude from north to south, together with corresponding ozonesonde ozone profiles and temperature profiles.
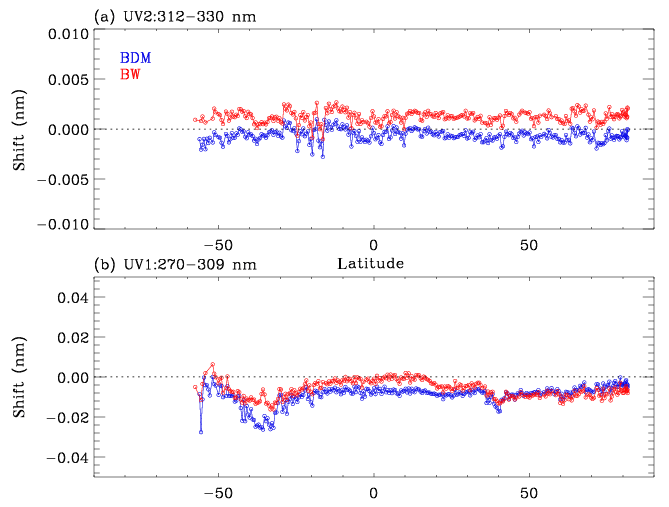
Figure 8Comparison of the wavelength shifts (nm) between ozone cross-sections and OMI radiances at the nadir view for using BDM (blue) and BW cross-sections, respectively.
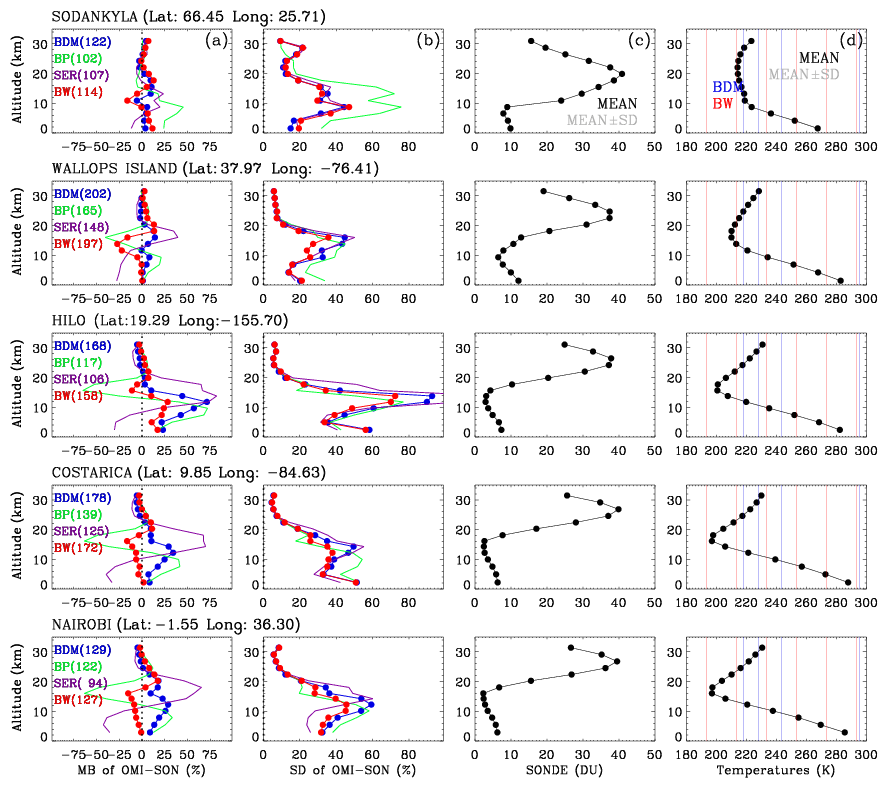
Figure 9(a) Mean biases of relative differences between OMI and ozonesonde ozone profiles at five stations arranged with decreasing latitude when four different cross-sections are applied to OMI retrievals, with (b) the corresponding standard deviations. (c) Ozonesonde and (d) temperatures (black circles) averaged from individual profiles (gray). The numbers after the four cross-sections in the legends show the number of successful retrievals. Vertical blue and red colors in (d) represent the temperatures used to derive the quadratic coefficients from BDM and BW measurements, respectively.
In layers above ∼20 km, a negligible impact of using different cross-sections is found because the measurement information comes mainly from the Hartley ozone absorption band with little dependence on temperature variation. Both BP and SER measurements provide a wider temperature range and more sampling than BDM, but switching from BDM to BP/SER results in large altitude-dependent oscillations of mean biases below ∼20 km and noticeably fewer successful retrievals, consistent with Liu et al. (2013). These oscillations tend to be wider with the minimum atmospheric temperatures, decreasing such that the mean biases increase ±50 % at midlatitudes/high latitudes (210–215 K) to ±70 % at low latitudes (200–205 K), which is partly due to smaller ozone concentration in the tropics and hence the larger relative differences. This result implies a defect in accounting for the temperature dependence in both the BP/SER cross-section datasets, especially in the lower temperature range. Using BDM and BW cross-sections generally shows much smaller altitude-dependent oscillations of mean biases. The magnitudes of the biases are smaller for BDM for the two midlatitude/high-latitude stations but smaller for BW at the other (lower-latitude) stations. The BW retrievals typically show negative biases of up to 30 % relative to BDM retrievals. The number of successful BW retrievals is slightly smaller than that of BDM retrievals because the negative biases cause more occurrences of negative ozone so that the retrieval convergence is more difficult. It is difficult to determine which one is better for ozone profile retrievals from the mean biases as OMI radiances contain systematic radiometric calibration errors (Liu et al., 2010) and ozonesonde observations can also contain systematic measurement errors (Liu et al., 2006).
As seen from the comparison of standard deviations in the second column of Fig. 9, the use of BW consistently gives significantly smaller standard deviations by 5 %–20 % in the lower stratosphere and upper troposphere except for the high-latitude station, Sodankylä. BW, BDM and SER retrievals show similar standard deviations at this station probably due to relatively warmer temperatures of ∼210–220 K in this altitude range. In Fig. 10, individual differences of layer column ozone between OMI retrievals and ozonesondes using BDM and BW datasets are plotted as functions of temperature for eight layers below ∼20 km. In this comparison, the noticeable reduction of the scatter between OMI and ozonesonde, by 5 %–15 % at layers from 17 to 8.5 km as well as by a few percent below or above them, after applying BW cross-sections, is further evident. Improvements of the retrieval precision, corresponding to standard deviations, have been less often achieved than those of the retrieval accuracy corresponding to mean biases; for example, systematic errors in ozone profile retrievals could be reduced by accounting for polar mesospheric clouds (Bak et al., 2016) and slit function errors (Bak et al., 2019) as well as by applying empirical calibration (Bak et al., 2017), whereas the reduction of the standard deviations was achieved only in Bak et al. (2013) by better representing dynamically induced ozone variability in the a priori ozone. This significant improvement in standard deviations indicates that temperature dependence is better characterized at the lower temperatures near ∼200 K by the BW dataset.
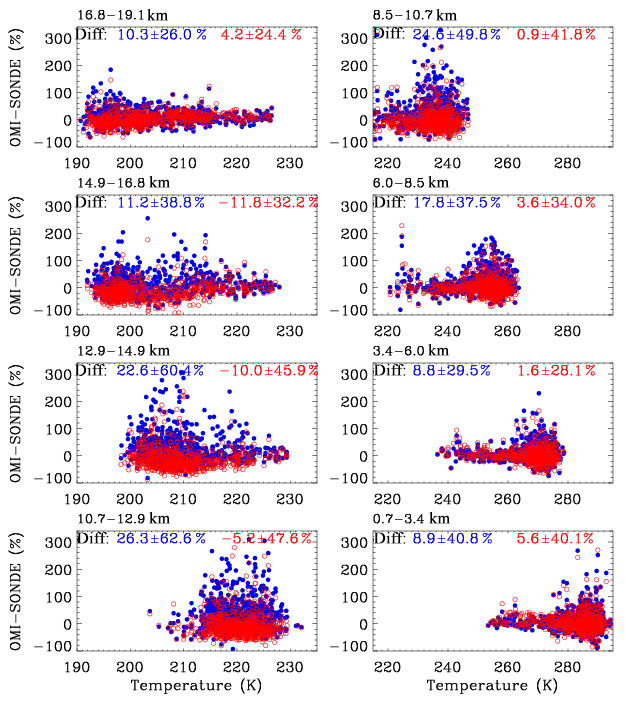
Figure 10Scatter plots of individual differences between OMI retrievals using BDM (blue) and BW (red) cross-sections and ozonesonde measurements for each layer from the surface (bottom right) to 19.1 km (top left) as functions of layer temperature. Mean differences and standard deviations for both cross-sections are shown in the legends.
This paper evaluates the recently measured laboratory high-resolution BW 2018 ozone cross-section data within the framework of the ESA SEOM-IAS project to see whether or not the current recommendation should be changed for improving ozone profile retrievals from UV measurements. The BDM 1995 dataset has been regarded as the standard ozone absorption cross-section in space-based ozone profile retrievals from BUV measurements; thereby, we focused on comparing BW and BDM datasets and their impact on our ozone profile retrievals from OMI BUV measurements. Compared to BDM, given at five temperatures ranging from 218 to 295 K, the BW dataset provides improved temperature coverage of 193 to 293 K, every 20 K. To conveniently apply the cross-section measurements at any temperature, we quadratically parameterized its temperature dependence using iterative non-linear least squares fitting. The 273 K measurements are excluded in the BDM parameterization to improve the fitting residuals at other temperatures. However, the BDM parameterization causes increasing fitting residuals in approximate cross-sections at lower temperatures using their 243 and 218 K measurements, especially at longer wavelengths in the Huggins band (up to 20 %). It reveals serious errors of up to ±40 % in representing the values at lower temperatures out of the BDM measurements. In comparison, the BW approximation is very closely parameterized to the original data, typically within 2 %, while most of the atmospheric temperatures are covered by the BW dataset; the residuals increase to ±5 % at temperatures below 195 K. Correspondingly, individual ozone profile retrievals show less sensitivity to the BW parameterization errors, with differences of ∼2 % or less over the altitude range. On the other hand, using the parameterized BDM causes an overestimation of 5 %–10 % at bottom layers in the low latitudes and 10 %–20 % at the tropopause. Relative to the BDM dataset, the BW data show systematic differences of 2 %–3 % in the cross-section at 273 K (Co) at shorter wavelengths below 300 nm but larger spikey differences of up to 8 % at wavelengths longer than 315 nm. The differences in C1 and C2 imply a distinctly different temperature dependence especially in non-linearity in the Huggins bands. We then compared ozone profile retrievals from one orbit of OMI measurements with BW and BDM cross-section datasets. Using different datasets gives comparable results in the wavelength shifts of cross-sections relative to OMI radiance wavelengths and fitting residuals at the final iteration, respectively. However, the initial iteration gives ∼5 % differences in fitting residuals near 290–315 nm, which results in significant differences of the adjusted ozone profiles at the final iteration, ∼50 % at the tropopause across most latitudes and ∼20 % at the bottom layers in the low latitudes. To evaluate the quality of ozone retrievals, ozonesonde measurements are compared at five stations. In this validation, we include other cross-section datasets, BP 1985 and SER 2014. Compared to the large vertical oscillation of mean biases for OMI ozone profiles using BP and SER, the BW retrievals show mean biases comparable to or sometimes improved over the BDM retrievals. The most important improvement due to switching from BDM to BW is the significant reduction of the standard deviations, by up to 15 %, in the lower stratosphere and upper troposphere where atmospheric temperatures are lower than ∼200 K.
Based on this evaluation, switching our ozone absorption cross-section reference from BDM to BW is very promising for OMI ozone profile retrievals. However, in this evaluation, soft calibration is turned off, and thereby the final decision on our algorithm will be made after further evaluating our retrievals with BW-based soft calibration. In order to make a robust recommendation, it might be useful for the ACSO committee to organize another activity to assess the impact of applying this new dataset on other ozone measurements on column ozone or profiles from various platforms. The results of this work in addition to that of Orphal et al. (2016) will help the HITRAN committee to decide which cross-sections should be included in HITRAN2020 edition.
Using different ozone cross-sections could also cause an important change in SO2 retrievals fitted in the Huggins band, and therefore the impact of applying both ozone and SO2 cross-sections available from the BW datasets (https://zenodo.org/record/1492582, last access: 19 September 2020) should be evaluated. However, the spectral coverage of the BW dataset is insufficient for the spectral fitting of other trace gases such as BrO and HCHO, both of which have significant interference from ozone. Ozone cross-sections in other wavelength ranges, such as the mid-infrared region near 9.6 µm and the Chappuis band (400–650 nm), have not been thoroughly evaluated in the literature. The ozone profile algorithm used in this work will be implemented for the Tropospheric Emissions: Monitoring of Pollution (TEMPO) satellite combining the UV and visible measurements to improve the detection of boundary layer ozone. Therefore, we should extend this work to find the most suitable ozone cross-sections in the TEMPO visible ozone channel (540–740 nm), focusing on SER 2014 covering from 213 to 1100 nm (193–293 K in 10 K steps) and that of Brion et al. (1998) which provides measurements at 218 and 295 K from ∼520 to ∼650 nm. Moreover, the need to improve wide spectral range laboratory cross-section measurements of ozone is still required to advance atmospheric ozone and other trace gases measurements.
The BW cross-section dataset is available at https://doi.org/10.5281/zenodo.1485588 (Birk and Wagner, 2018). OMI level-1b radiance datasets are available at https://aura.gesdisc.eosdis.nasa.gov/data/Aura_OMI_Level1/ (last access: 19 September 2020; NASA, 2020). The ozonesonde data used to validate our ozone profile retrievals were obtained though the WOUDC and SHADOZ. The WOUDC dataset is available at https://woudc.org/data/products/ozonesonde/ (last access: 19 September 2020; Government of Canada, 2020) and for the SHADOZ dataset at https://tropo.gsfc.nasa.gov/shadoz/Archive.html (last access: 19 September 2020; NASA/GSFC SHADOZ, 2020).
JB and XL designed the research; MB, GW and IEG contributed to oversight and guidance for ozone cross-sections; JB conducted the research and wrote the paper; XL and KC contributed to analysis and writing.
The authors declare that they have no conflict of interest.
We acknowledge the OMI science team for providing their satellite data and the WOUDC and SHADOZ networks for their ozonesonde datasets. Research at the Smithsonian Astrophysical Observatory by Juseon Bak, Xiong Liu and Kelly Chance was funded by the NASA Aura science team program (NNX17AI82G). Manfred Birk and Georg Wagner thank the European Space Agency (ESA) for funding the SEOM-IAS project (ESA/AO/1-7566/13/I-BG).
This research has been supported by the NASA Aura science team program (grant no. NNX17AI82G) and the SEOM-IAS project (grant no. ESA/AO/1-7566/13/I-BG).
This paper was edited by Andreas Hofzumahaus and reviewed by two anonymous referees.
Bak, J., Liu, X., Wei, J. C., Pan, L. L., Chance, K., and Kim, J. H.: Improvement of OMI ozone profile retrievals in the upper troposphere and lower stratosphere by the use of a tropopause-based ozone profile climatology, Atmos. Meas. Tech., 6, 2239–2254, https://doi.org/10.5194/amt-6-2239-2013, 2013.
Bak, J., Liu, X., Kim, J. H., Deland, M. T., and Chance, K.: Improvement of OMI ozone profile retrievals by simultaneously fitting polar mesospheric clouds, Atmos. Meas. Tech., 9, 4521–4531, https://doi.org/10.5194/amt-9-4521-2016, 2016.
Bak, J., Liu, X., Kim, J.-H., Haffner, D. P., Chance, K., Yang, K., and Sun, K.: Characterization and correction of OMPS nadir mapper measurements for ozone profile retrievals, Atmos. Meas. Tech., 10, 4373–4388, https://doi.org/10.5194/amt-10-4373-2017, 2017.
Bak, J., Liu, X., Sun, K., Chance, K., and Kim, J.-H.: Linearization of the effect of slit function changes for improving Ozone Monitoring Instrument ozone profile retrievals, Atmos. Meas. Tech., 12, 3777–3788, https://doi.org/10.5194/amt-12-3777-2019, 2019.
Bass, A. M. and Paur, R. J.: The ultraviolet cross-sections of ozone. I. The measurements, in: Atmospheric ozone, Proc. Quadrennial, 1, 606–610, 1985.
Birk, M. and Wagner, G.: ESA SEOM-IAS – Measurement and ACS database O3 UV region (Version I) [Data set], Zenodo, https://doi.org/10.5281/zenodo.1485588, 2018.
Birk, M., Wagner, G., Gordon, I. E., and Drouin, B. J.: Ozone intensities in the rotational bands, J. Quant. Spectrosc. Ra. Transf., 226, 60–65, https://doi.org/10.1016/J.JQSRT.2019.01.004, 2019.
Brion, J., Chakir, A., Charbonnier, J., Daumont, D., Parisse, C., and Malicet, J.: Absorption spectra measurements for the ozone molecule in the 350–830 nm region, J. Atmos. Chem., 30, 291–99, 1998.
Brion, J., Chakir, A., Daumont, D., Malicet, J., and Parisse, C.: High-resolution laboratory absorption cross section of O3. Temperature effect, Chem. Phys. Lett., 213, 610–612, 1993.
Chehade, W., Gür, B., Spietz, P., Gorshelev, V., Serdyuchenko, A., Burrows, J. P., and Weber, M.: Temperature dependent ozone absorption cross section spectra measured with the GOME-2 FM3 spectrometer and first application in satellite retrievals, Atmos. Meas. Tech., 6, 1623–1632, https://doi.org/10.5194/amt-6-1623-2013, 2013a.
Chehade, W., Gorshelev, V., Serdyuchenko, A., Burrows, J. P., and Weber, M.: Revised temperature-dependent ozone absorption cross-section spectra (Bogumil et al.) measured with the SCIAMACHY satellite spectrometer, Atmos. Meas. Tech., 6, 3055–3065, https://doi.org/10.5194/amt-6-3055-2013, 2013b.
Daumont, Brion, J., Charbonnier, J., and Malicet, J.: Ozone UV spectroscopy I: Absorption crosssections at room temperature, J. Atmos. Chem., 15, 145–155, 1992.
Gordon, I., Rothman, L., Hill, C., Kochanov, R., Tan, Y., Bernath, P., Birk, M., Boudon, V., Campargue, A., Chance, K., Drouin, B., Flaud, J.-M., Gamache, R., Hodges, J., Jacquemart, D., Perevalov, V., Perrin, A., Shine, K., Smith, M.-A., Tennyson, J., Toon, G., Tran, H., Tyuterev, V., Barbe, A., Császár, A., Devi, V., Furtenbacher, T., Harrison, J., Hartmann, J.-M., Jolly, A., Johnson, T., Karman, T., Kleiner, I., Kyuberis, A., Loos, J., Lyulin, O., Massie, S., Mikhailenko, S., Moazzen-Ahmadi, N., Müller, H., Naumenko, O., Nikitin, A., Polyansky, O., Rey, M., Rotger, M., Sharpe, S., Sung, K., Starikova, E., Tashkun, S., Auwera, J. V., Wagner, G., Wilzewski, J., Wcisło, P., Yu, S., and Zak, E.: The HITRAN2016 molecular spectroscopic database, J. Quant. Spectrosc. Ra. Transf., 203, 3–69, https://doi.org/10.1016/j.jqsrt.2017.06.038, 2017.
Gorshelev, V., Serdyuchenko, A., Weber, M., Chehade, W., and Burrows, J. P.: High spectral resolution ozone absorption cross-sections – Part 1: Measurements, data analysis and comparison with previous measurements around 293 K, Atmos. Meas. Tech., 7, 609–624, https://doi.org/10.5194/amt-7-609-2014, 2014.
Government of Canada: World Ozone and Ultraviolet Radiation Dta Centre, Ozonesonde Plots, available at: https://woudc.org/data/products/ozonesonde/, last access: 19 September 2020.
Hearn, A. G.: The absorption of ozone in the ultra-violet and visible regions of the spectrum, Proc. Phys. Soc., 78, 932–940, https://doi.org/10.1088/0370-1328/78/5/340, 1961.
Hodges, J. T., Viallon, J., Brewer, P. J., Drouin, B. J., Gorshelev, V., Janssen, C., Lee, S., and Possolo, A.: Recommendation of a consensus value of the ozone absorption cross-section at 253.65 nm based on a literature review, Metrologia, 56, https://doi.org/10.1088/1681-7575/ab0bdd, 2019.
Liu, C., Liu, X., and Chance, K.: The impact of using different ozone cross sections on ozone profile retrievals from OMI UV measurements, J. Quant. Spectrosc. Ra., 130, 365–372, https://doi.org/10.1016/j.jqsrt.2013.06.006, 2013.
Liu, X., Bhartia, P. K., Chance, K., Spurr, R. J. D., and Kurosu, T. P.: Ozone profile retrievals from the Ozone Monitoring Instrument, Atmos. Chem. Phys., 10, 2521–2537, https://doi.org/10.5194/acp-10-2521-2010, 2010.
Liu, X., Chance, K., Sioris, C. E., and Kurosu, T. P.: Impact of using different ozone cross sections on ozone profile retrievals from Global Ozone Monitoring Experiment (GOME) ultraviolet measurements, Atmos. Chem. Phys., 7, 3571–3578, https://doi.org/10.5194/acp-7-3571-2007, 2007.
Liu, X., Chance, K., Sioris, C. E., Kurosu, T. P., and Newchurch, M. J.: Intercomparison of GOME, ozonesonde, and SAGE II measurements of ozone: Demonstration of the need to homogenize available ozonesonde data sets, J. Geophys. Res., 111, D14305, https://doi.org/10.1029/2005JD006718, 2006.
Liu, X., Chance, K., Sioris, C. E., Spurr, R. J. D., Kurosu, T. P., Martin, R. V., and Newchurch, M. J.: Ozone profile and tropospheric ozone retrievals from Global Ozone Monitoring Experiment: algorithm description and validation, J. Geophys. Res., 110, D20307, https://doi.org/10.1029/2005JD006240, 2005.
Malicet, Daumont, D., Charbonnier, J., Parisse, C., Chakir, A., and Brion, J.: Ozone UV spectroscopy. II. Absorption cross-sections and temperature dependence, J. Atmos. Chem, 21, 263–273, 1995.
McPeters, R. D., Frith, S., and Labow, G. J.: OMI total column ozone: extending the long-term data record, Atmos. Meas. Tech., 8, 4845–4850, https://doi.org/10.5194/amt-8-4845-2015, 2015.
NASA: aura.gesdisc.eosdis.nasa.gov, available at: https://aura.gesdisc.eosdis.nasa.gov/data/Aura_OMI_Level1/, last access: 19 September 2020.
NASA/GSFC SHADOZ: Shadoz – Southern Hemisphere ADitional OZonesondes, available at: https://tropo.gsfc.nasa.gov/shadoz/Archive.html, last access: 19 September 2020.
Orphal, J.: A critical review of the absorption cross-sections of O3 and NO2 in the 240–790 nm region, Part 1. ozone, in ESA Technical Note MO-TN-ESA-GO-0302, ESA-ESTEC, Noordwijk, The Netherlands, 2002.
Orphal, J.: A critical review of the absorption cross-sections of O3 and NO2 in the 240–790 nm region, J. Phtotochem. Photobiol. A., 157, 185–209, 2003.
Orphal, J., Staehelin, J., Tamminen, J., Braathen, G., De Backer, M.-R., Bais, A., Balis, D., Barbe, A., Bhartia, P. K., Birk, M., Burkholder, J. B., Chance, K., von Clarmann, T., Cox, A., Degenstein, D., Evans, R., Flaud, J. M., Flittner, D., Godin-Beekmann, S., Gorshelev, V., Gratien, A., Hare, E., Janssen, C., Kyrölä, E., McElroy, T., McPeters, R., Pastel, M., Petersen, M., Petropavlovskikh, I., Picquet-Varrault, B., Pitts, M., Labow, G., Rotger-Languereau, M., Leblanc, T., Lerot, C., Liu, X., Moussay, P., Redondas, A., Van Roozendael, M., Sander, S. P., Schneider, M., Serdyuchenko, A., Veefkind, P., Viallon, J., Viatte, C., Wagner, G.,Weber, M.,Wielgosz, R. I., and Zehner, C.: Absorption cross-sections of ozone in the ultraviolet and visible spectral regions: Status report 2015, J. Mol. Spectrosc., 327, 105–121, 2016.
Paur, P. J. and Bass, A. M.: The ultraviolet cross-sections of ozone: II. Results and temperature dependence, in Atmospheric Ozone, in: Proceedings of the Quadrennial Ozone Symposium 1984, edited by: Zerefos, C. S. and Ghazi, A., 611–615, Dordrecht Reidel, Norwell, MA, 1985.
Rothman, L. S., Jacquemart, D., Barbe, A., Chris Benner, D., Birk, M., Brown, L. R., et al.: The HITRAN 2004 molecular spectroscopic database, J. Quant. Spectrosc. Rad. Transf., 96, 139–204, https://doi.org/10.1016/j.jqsrt.2004.10.008, 2005.
Schenkeveld, V. M. E., Jaross, G., Marchenko, S., Haffner, D., Kleipool, Q. L., Rozemeijer, N. C., Veefkind, J. P., and Levelt, P. F.: In-flight performance of the Ozone Monitoring Instrument, Atmos. Meas. Tech., 10, 1957–1986, https://doi.org/10.5194/amt-10-1957-2017, 2017.
Seo, S., Richter, A., Blechschmidt, A.-M., Bougoudis, I., and Burrows, J. P.: First high-resolution BrO column retrievals from TROPOMI, Atmos. Meas. Tech., 12, 2913–2932, https://doi.org/10.5194/amt-12-2913-2019, 2019.
Serdyuchenko, A., Gorshelev, V., Weber, M., Chehade, W., and Burrows, J. P.: High spectral resolution ozone absorption cross-sections – Part 2: Temperature dependence, Atmos. Meas. Tech., 7, 625–636, https://doi.org/10.5194/amt-7-625-2014, 2014.
Theys, N., De Smedt, I., Yu, H., Danckaert, T., van Gent, J., Hörmann, C., Wagner, T., Hedelt, P., Bauer, H., Romahn, F., Pedergnana, M., Loyola, D., and Van Roozendael, M.: Sulfur dioxide retrievals from TROPOMI onboard Sentinel-5 Precursor: algorithm theoretical basis, Atmos. Meas. Tech., 10, 119–153, https://doi.org/10.5194/amt-10-119-2017, 2017.
Tyuterev, V. G., Barbe, A., Jacquemart, D., Janssen, C., Mikhailenko, S. N., and Starikova, E. N.: Ab initio predictions and laboratory validation for consistent ozone intensities in the MW, 10 and 5 µm ranges, The J. Chem. Phys., 150, 184303, https://doi.org/10.1063/1.5089134, 2019.
- Abstract
- Introduction
- Comparison of BDM and BW
- Impact of using different cross-sections on ozone profile retrievals
- Validation with ozonesonde observations
- Summary and discussion
- Data availability
- Author contributions
- Competing interests
- Acknowledgements
- Financial support
- Review statement
- References