the Creative Commons Attribution 4.0 License.
the Creative Commons Attribution 4.0 License.
 | 10 Nov 2020
Interference from alkenes in chemiluminescent NOx measurements
Mohammed S. Alam
Leigh R. Crilley
James D. Lee
Louisa J. Kramer
Christian Pfrang
Mónica Vázquez-Moreno
Milagros Ródenas
Amalia Muñoz
William J. Bloss
Nitrogen oxides () are critical intermediates in atmospheric chemistry and air pollution. NOx levels control the cycling and hence abundance of the primary atmospheric oxidants OH and NO3 and regulate the ozone production which results from the degradation of volatile organic compounds (VOCs) in the presence of sunlight. They are also atmospheric pollutants, and NO2 is commonly included in air quality objectives and regulations. NOx levels also affect the production of the nitrate component of secondary aerosol particles and other pollutants, such as the lachrymator peroxyacetyl nitrate (PAN). The accurate measurement of NO and NO2 is therefore crucial for air quality monitoring and understanding atmospheric composition. The most commonly used approach for the measurement of NO is the chemiluminescent detection of electronically excited NO2 (NO) formed from the NO + O3 reaction within the NOx analyser. Alkenes, ubiquitous in the atmosphere from biogenic and anthropogenic sources, also react with ozone to produce chemiluminescence and thus may contribute to the measured NOx signal. Their ozonolysis reaction may also be sufficiently rapid that their abundance in conventional instrument background cycles, which also utilises the reaction with ozone, differs from that in the measurement cycle such that the background subtraction is incomplete, and an interference effect results. This interference has been noted previously, and indeed, the effect has been used to measure both alkenes and ozone in the atmosphere. Here we report the results of a systematic investigation of the response of a selection of commercial NOx monitors to a series of alkenes. These NOx monitors range from systems used for routine air quality monitoring to atmospheric research instrumentation. The species-investigated range was from short-chain alkenes, such as ethene, to the biogenic monoterpenes. Experiments were performed in the European PHOtoREactor (EUPHORE) to ensure common calibration and samples for the monitors and to unequivocally confirm the alkene levels present (via Fourier transform infrared spectroscopy – FTIR). The instrument interference responses ranged from negligible levels up to 11 %, depending upon the alkene present and conditions used (e.g. the presence of co-reactants and differing humidity). Such interferences may be of substantial importance for the interpretation of ambient NOx data, particularly for high VOC, low NOx environments such as forests or indoor environments where alkene abundance from personal care and cleaning products may be significant.
- Article
(2352 KB) - Full-text XML
-
Supplement
(800 KB) - BibTeX
- EndNote


Measurement of atmospheric trace constituents is central to atmospheric chemistry research and air pollution monitoring. Key challenges to trace measurements are sensitivity, reactivity and selectivity as many components of interest are only present in parts per billion (ppb; 10−9) or parts per trillion (ppt; 10−12) mixing ratios; in many cases, their inherent reactivity necessitates in situ detection. Atmospheric trace composition comprises many thousands of different chemical components (Goldstein and Galbally, 2007). Consequently, specific measurement approaches have been developed to measure key atmospheric species within the specific conditions (analyte abundance; presence of other constituents) anticipated (Heard, 2008). This paper reports a systematic study of the interference arising in measurements of nitrogen oxides from the presence of alkenes in sampled air when using their most widespread air quality monitoring technique of chemiluminescence detection.
NOx (= NO + NO2) abundance controls the cycling and, hence, the concentration of the primary atmospheric oxidants, hydroxyl (OH) and nitrate (NO3) radicals and regulates the ozone production which results from the degradation of volatile organic compounds (VOCs) in sunlight. NOx are also atmospheric pollutants in their own right, and NO2 is commonly included in air quality objectives and regulations (as the more harmful component of NOx; European Environment Agency, 2018; Chaloulakou et al., 2008). In addition to their role in controlling ozone formation, NOx levels affect the production of other pollutants, such as the lachrymator peroxyacetyl nitrate (PAN) and the nitrate component of secondary aerosol particles. Consequently, accurate measurement of nitrogen oxides in the atmosphere is of major importance for monitoring pollution levels and assessing consequent health impacts and understanding atmospheric chemical processing. Atmospheric NO and NO2 are formed from natural processes (lightning, soil emissions of NO, biomass burning and even snowpack emissions) and anthropogenic activities (high temperature combustion in air leading to the breakdown of N2 and O2; NOx production via the Zeldovich mechanism), where road traffic is the predominant source in many urban areas (Keuken et al., 2009; Grice et al., 2009; Carslaw and Rhys-Tyler, 2013). Consequently, boundary layer NOx abundance varies over many orders of magnitude, from sub-5 ppt levels in the remote marine boundary layer to parts per million (ppm) levels in some urban environments (Crawford et al., 1997).
Techniques used for the measurement of atmospheric NOx include laser-induced fluorescence (LIF) spectroscopy for both NO and NO2; absorption spectroscopy (e.g. long path differential optical absorption spectroscopy – LP-DOAS; cavity-enhanced differential optical absorption spectroscopy – CE-DOAS; cavity attenuated phase shift spectroscopy – CAPS; cavity ring-down spectroscopy – CRDS; passive diffusion tubes, primarily for NO2), chemical ionisation mass spectrometry (CIMS) and both on- and offline wet chemical methods, for example, a long path absorption photometer (LOPAP; Heard, 2008; Sandholm et al., 1990; Kasyutich et al., 2003; Kebabian et al., 2005; Cape, 2009; Fuchs et al., 2009; Thalman and Volkamer, 2010; Villena et al., 2011). However, the most commonly employed technique for the measurement of NOx species, including for statutory air quality monitoring purposes, is the detection of the chemiluminescence arising from electronically excited NO2 (NO) formed from the reaction between NO and O3 (via reaction R1) as follows:
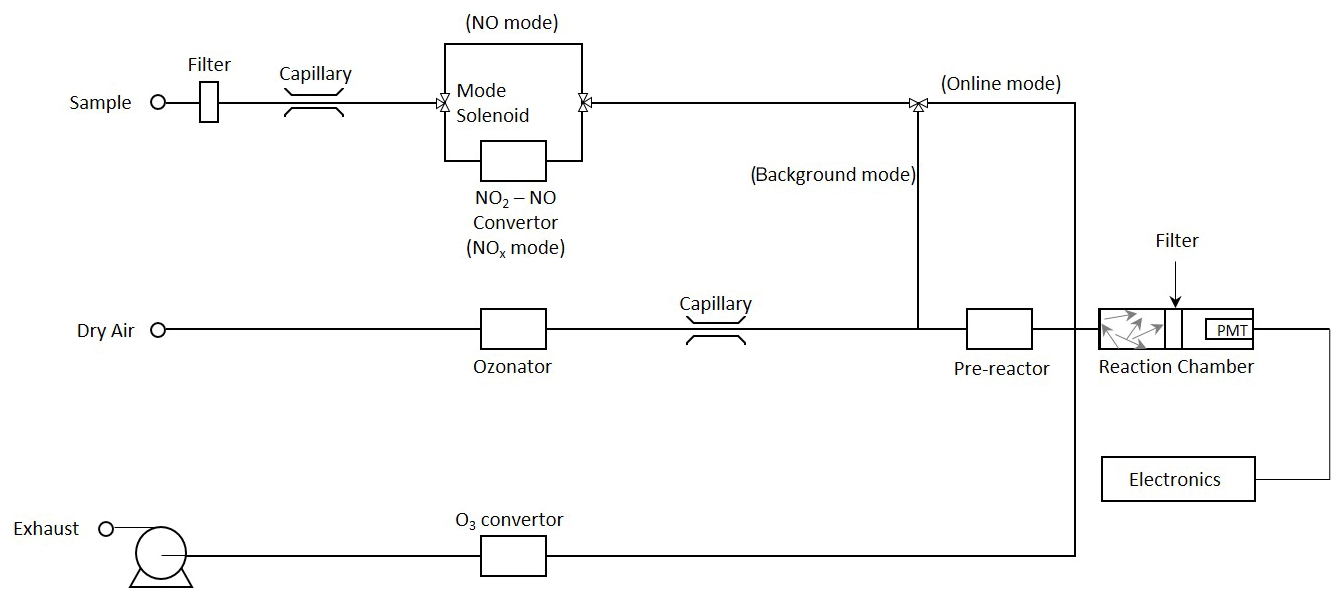
The intensity of the light emitted via reaction (R2) is in the wavelength range 600–3000 nm, peaking at ∼ 1200 nm. Chemiluminescent instruments mix sampled ambient air with a reagent stream containing an excess of ozone to promote the chemiluminescent reaction (see the schematic in Fig. 1); the resulting emission signal is measured using a photomultiplier tube (PMT) and consists of contributions from NO formed, as above, but also potentially from other chemiluminescence processes, detector dark counts and other noise contributions. Contributions to the measured emission from other species are minimised by using a red filter on the detector to block emission wavelengths below ca. 600 nm and by employing a background subtraction cycle; chemiluminescent NOx monitors commonly acquire a background by increasing the reaction time between NO (from the sampled air) and O3 (reagent formed within the instrument), using a pre-reactor volume, such that nearly all of the NO present (specifications typically state levels in excess of 99 %) is converted to NO2. The difference in PMT signals between the online and background signals is then taken to be proportional to the NO present in the air sample, following the assumption that the abundance of other species, which may contribute to the measured signal, is not affected by the background cycle.
Chemiluminescent instruments typically alternate between two operation modes, namely one that directly measures NO and one that measures Σ(NO + NO2) by first converting NO2 to NO. The difference between the two values determines the NO2 mixing ratio (if only NO and NO2 are present). This is most commonly achieved by using a molybdenum (Mo) catalyst heated to 300–350 ∘C. However, the reduction in other NOz species to NO has led to the use of these catalysts in chemiluminescent NOy monitors to measure total reactive nitrogen rather than NO2 (NOy = NOz + NOx; i.e. NOz equals other reactive nitrogen species catalysed by Mo convertors, e.g. HNO3, nitrous acid (HONO), N2O5, HO2NO2, PAN, NO3 and organic nitrates but not NH3; Navas et al., 1997; Murphy et al., 2007). If atmospheric mixing ratios of NOz species are high relative to NO2, then NO2 measurements with monitors equipped with Mo catalysts are increasingly inaccurate. This has led to the adoption of photolytic NO2 conversion stages in research instruments, where a blue light LED convertor is illuminated in a photolysis cell to convert NO2 to NO (Lee et al., 2015).
The photolytic conversion technique can have greater specificity than the heated Mo catalyst, as the photolysis wavelengths may be selected to match the NO2 photolysis action spectrum, while potential NOz interferents for an NO2 measurement are thermally unstable and may convert to NO2 when exposed to heat in the latter approach (Heard, 2008). Despite this, the chemiluminescent analyser with the heated Mo catalyst is the most widely used technique for air quality monitoring of NO and NO2 worldwide. It is the reference method of measurement specified in the EU directive (BS EN 14211, 2012), providing real-time data with a short time resolution for 212 monitoring sites in the UK, including kerbside, roadside, urban background, industrial and rural locations (AQEG, 2004).
While NOx measurements are sometimes perceived to be straightforward and routine, in practice a number of factors are known to affect the accuracy of the levels obtained using chemiluminescence approaches. A detailed account of the factors affecting atmospheric NOx measurement overall is given elsewhere (e.g. Gerboles et al., 2003; Villena et al., 2012; Reed et al., 2016); here we do not focus upon surface sources and losses but rather upon chemical interferences in chemiluminescent NOx analysers, which may arise from the following possible general mechanisms:
-
Collisional quenching of NO by an interferent species with a greater collisional efficiency than the bath gas (e.g. air) used for calibration (this is typically a negative interference, although the magnitude and sign of this depends upon the calibration conditions employed).
-
Conversion of other nitrogen-containing species to NOx within the NO2 conversion unit (a positive interference).
-
Chemical removal or interconversion of NO and/or NO2 by an interferent species generated within the instrument (a positive or negative interference).
-
Chemiluminescence of other chemical species, which is not fully accounted for during the instrument background cycle (a positive interference).
Collisional quenching of excited species, mechanism (1), results in a reduction in the chemiluminescence intensity, which is to an extent dependent upon the pressure and quenching efficiency, i.e. the efficacy with which the quenching species may accept or remove energy from the excited moiety. In the case of electronically excited NO2, effective quenching agents have been shown to include H2O, CO2, H2 and hydrocarbons (Matthews et al., 1977; Gerboles et al., 2003; Dillon and Crowley, 2018), of which only quenching by water vapour is considered to be significant under most common (ambient air) conditions, and sensitivity reductions of up to 8 % have been reported (Steinbacher et al., 2007). Mechanism (2), the conversion of other nitrogen-containing species to NO, alongside NO2, is a recognised issue with heated Mo converters; interferences between 18 % and 100 % have been reported for species such as HONO, HNO3, PAN, alkyl nitrates and N2O5 (Dunlea et al., 2007; Lamsal et al., 2008). To address these uncertainties, photolytic converters are now commonly employed in research measurements, although, for most routine air quality monitoring, heated Mo converters are still employed. Recently, it has been shown that a further interference can arise within the photolytic converter stage from the generation of HOx radicals through the photolysis of photolabile carbonyl species, such as glyoxal, forming peroxy radicals promoting NO to NO2 conversion within the instrument (Villena et al., 2012), resulting in a negative NO2 interference, which may (under some conditions) exceed the positive interference from retrieval of NOz species associated with heated Mo converter instruments, i.e. mechanism (3).
The focus of this work relates to mechanism (4), namely interference in the chemiluminescent measurements of NO and NO2 (using both catalytic and photolytical converters) arising from the chemiluminescence of alkenes in the presence of ozone. Alkene–ozone reactions have received substantial attention as a dark source of HOx radicals and are a route to the formation of semi-volatile compounds which contribute to secondary organic aerosol (SOA), particularly for biogenic alkenes such as isoprene and the mono- and sesquiterpenes (e.g. Johnson and Marston, 2008; Shrivastava et al., 2017). Rate constants for ozonolysis reactions depend on the alkene structure and are typically larger for biogenic alkenes. Chemiluminescence from the ozonolysis of 14 short chain species at total pressures of 2–10 Torr was first reported by Pitts et al. (1972). Excited formaldehyde (HCHO), vibrationally excited OH and electronically excited OH in the wavelengths 350–520, 700–1100 and 306 nm, respectively, were the identified chemiluminescent species (Finlayson et al., 1974) and, indeed, have been used to perform field measurements of both ozone and alkenes (e.g. Velasco et al., 2007; Hills and Zimmerman, 1990). This combination of alkene–ozone reactions giving rise to a chemiluminescent interference signal and alkene–ozone reactions being sufficiently rapid that alkenes can be appreciably consumed in the background (pre-reactor) cycle and, hence, the interference contribution not being fully subtracted during the background correction gives rise to the potential for interference in NOx measurements, which is the focus of this study.
3.1 Sampling
Experiments were performed using chamber A of the two 200 m3 simulation chambers of the European PHOtoREactor (EUPHORE) facility in Valencia, Spain, to provide a common, homogeneous air volume for multiple NOx analysers to sample from. The EUPHORE chambers are formed from fluorine-ethene-propene (FEP) Teflon foil fitted with housings that exclude ambient light (Wiesen, 2001; Munoz et al., 2011). The chambers are fitted with large horizontal and vertical fans to ensure rapid mixing (timescale of 3 min). Instrumentation used comprises long path Fourier transform infrared spectroscopy (FTIR; for absolute and specific alkene/VOC measurements), monitors for temperature, pressure, humidity (dew point hygrometer), ozone (UV absorption) and CO (infrared absorption). NOx levels were measured using four independent chemiluminescent monitors plus (in the case of NO2) LP-DOAS absorption spectroscopy. All monitor sampling lines were of similar lengths and attached to one inlet sampling from the centre of the chamber.
Table 1Details of the NOx monitoring instruments used. Note: ppt – parts per trillion.
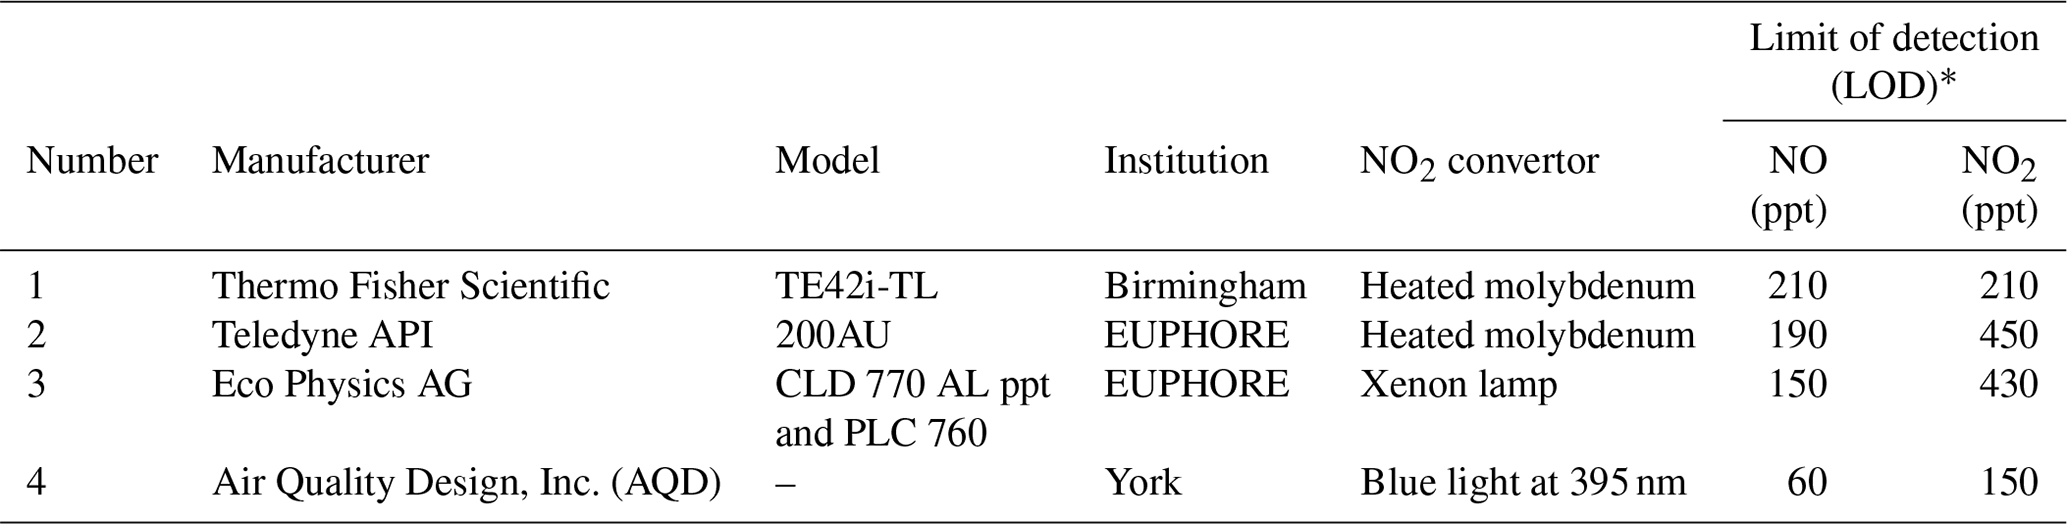
∗ Calculated in this study.
Monitors 1 and 2 employed heated Mo catalysts, while 3 and 4 used photolytic NO2 converters (see Table 1). All NOx monitors were calibrated (in the range 0–100 ppb) at the start and end of the 2-week measurement period, using a multipoint calibration derived from a primary NO standard (BOC 5 ppm alpha standard; certified to the National Physics Laboratory (NPL) scale) in addition to single-point calibrations performed on a daily basis. NO2 calibration was achieved via gas-phase titration, using added ozone within the chamber. In some experiments, the calibrations and interference were confirmed with use of the EUPHORE LP-DOAS system to unequivocally identify and quantify NO2.
All experiments were performed with the chamber housing closed (i.e. dark conditions; j(NO2) < 2 s−1) at near-atmospheric pressure and ambient temperature. For most experiments, humidity was low (dew point ca. −45 ∘C). The experimental procedure, starting with a clean flushed chamber, was to add SF6 (as a dilution tracer) followed by successive aliquots of various alkenes and, in certain cases, additional species (H2O and CO), whilst recording the measured NO and NO2 levels over periods of 1–3 h. For some systems, ozone was added at the end of the experiment; under such dark, high-O3 conditions, we can be confident that negligible NO could actually be present in the chamber (e.g. from wall sources) and, hence, that any NO signal observed by the monitors was unequivocally an interference response (as any NO remaining would be rapidly consumed by reaction with O3). The potential interferant species investigated were cis-2-butene (C2B), trans-2-butene (T2B), tetra-methyl ethylene (2,3-dimethyl-butene or TME), α-terpinene, limonene, methyl chavicol (estragole) and terpinolene, with four to five additions of 20–50 ppb in each case, together with single- or dual-point interference measurements for ethene, propene, isobutene, isoprene, α-pinene, β-pinene and myrcene. Repeat experiments were performed for T2B, terpinolene and α-terpinene under conditions of increased humidity (up to ca. 30 % relative humidity – RH). Alkene mixing ratios introduced into the chamber are given in Table S1. Propene, C2B and T2B were supplied by Linde plc. (purity > 99 %), isobutene (purity > 99 %) and terpinolene (purity > 85 %) were from Fluka Analytical and TME (purity > 98 %), isoprene (purity > 99 %), limonene (purity > 97 %), α-pinene (purity > 97 %), β-pinene (purity > 97 %), α-terpinene (purity > 85 %), estragole (purity > 98 %) and myrcene (purity > 99 %) were from Sigma-Aldrich. All reagents were used as supplied.
3.2 Data analysis
The limit of detection (LOD) for each instrument was determined, under the actual experimental conditions, as three times the standard deviation of the NO and NO2 signal recorded each day from the empty chamber prior to the start of experiments (i.e. before addition of any reactants). The mean LODs determined for NO and NO2 are shown in Table 1. These LOD values are higher than those quoted by the manufacturers for monitors 1–4 (typically 2–100 ppt) but accurately reflect the actual performance of the instruments as used during these experiments. In the analysis which follows, in order to confirm that any change in the measured NO and NO2 mixing ratio for each alkene addition was not due to noise or drift and therefore came from signal, the readings were compared to the experimentally determined LOD for each instrument. Only in cases where the measured change was greater than the experimentally determined LOD were these readings used for determining an interference. The interference due to the VOC was determined by means of linear regression (least squares fit), with the slopes and their uncertainty and Pearson's correlation coefficients calculated in IGOR (see Tables 2 and 3).
Table 2Measured NO interference (% ± 1 SD of the slope) for each monitor across a range of different alkenes. Note: LOD – limit of detection; TME – 2,3-dimethyl-butene; T2B – trans-2-butene; C2B – cis-2-butene.
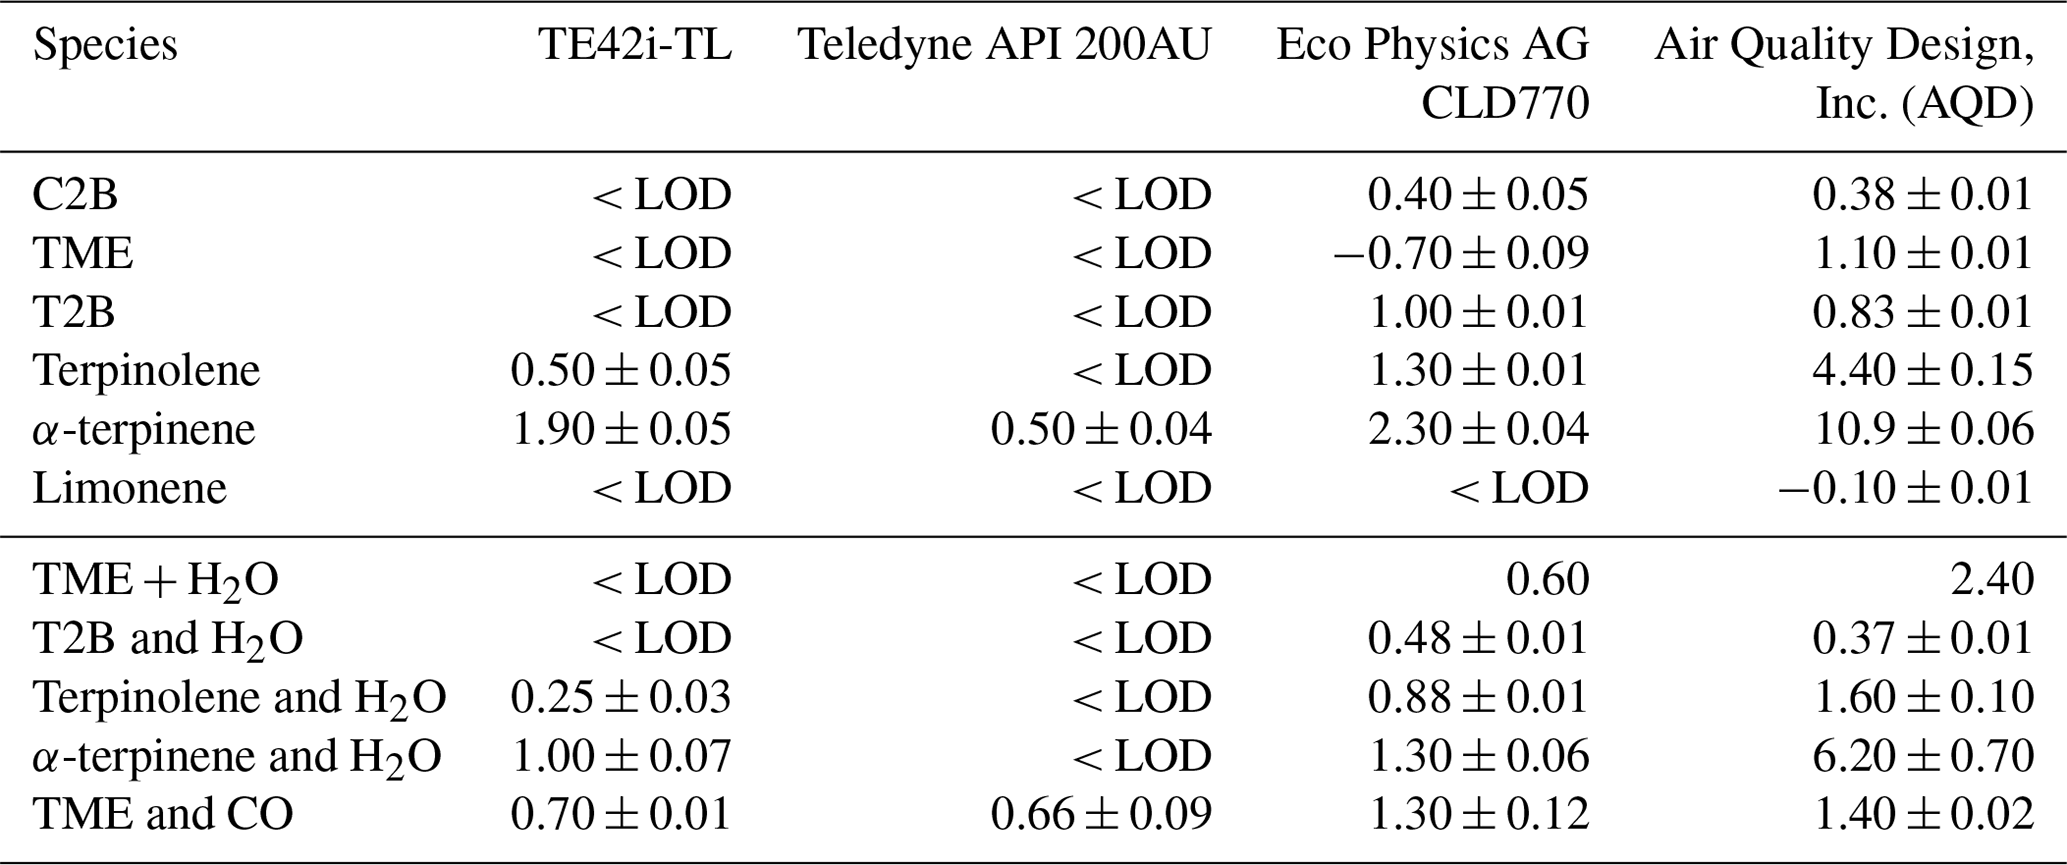
Table 3Measured NO2 interference (% ± 1 SD of the slope) for each monitor across a range of different alkenes (LOD – limit of detection).

∗ determined by method (a) – see Sect. 5.3, # determined by method (b) – see Sect. 5.3.
Figures 2–4 give the measured VOC mixing ratios and the retrieved NO and NO2 measurements of the four monitors during the experiment for selected alkenes, along with the regression analysis for determining the interference levels. Spikes in NO and NO2 mixing ratios observed after an alkene addition (e.g. Fig. 4) arise from sampling close to the addition point prior to the initial period of mixing in the chamber (∼ 3 min) and were disregarded in the analysis. The slow decay of alkene and NOx mixing ratios following each addition arises from dilution effects (with a first-order rate constant of ∼ 5.7 s−1 derived from the decay of SF6).
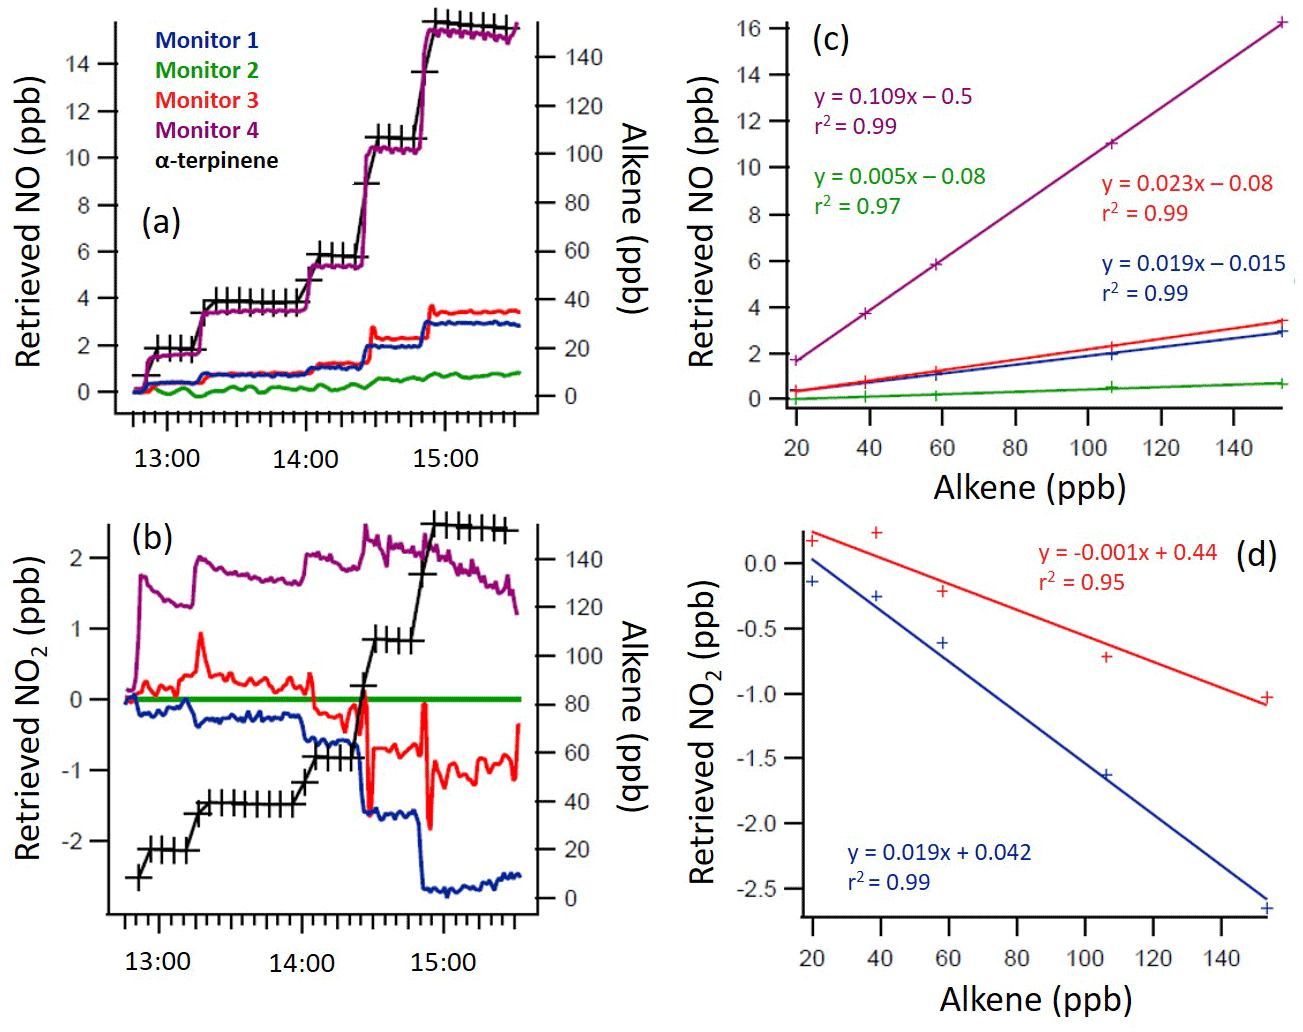
Figure 2Time series of the α-terpinene mixing ratio and indicated/measured NO (a, c) and NO2 (b, d) mixing ratios, as directly retrieved by each monitor (a, b), with 1 min time resolution, and the regression calculations for the monitors that demonstrated significant interference with the addition of α-terpinene (c, d). Note the different y axis scales.
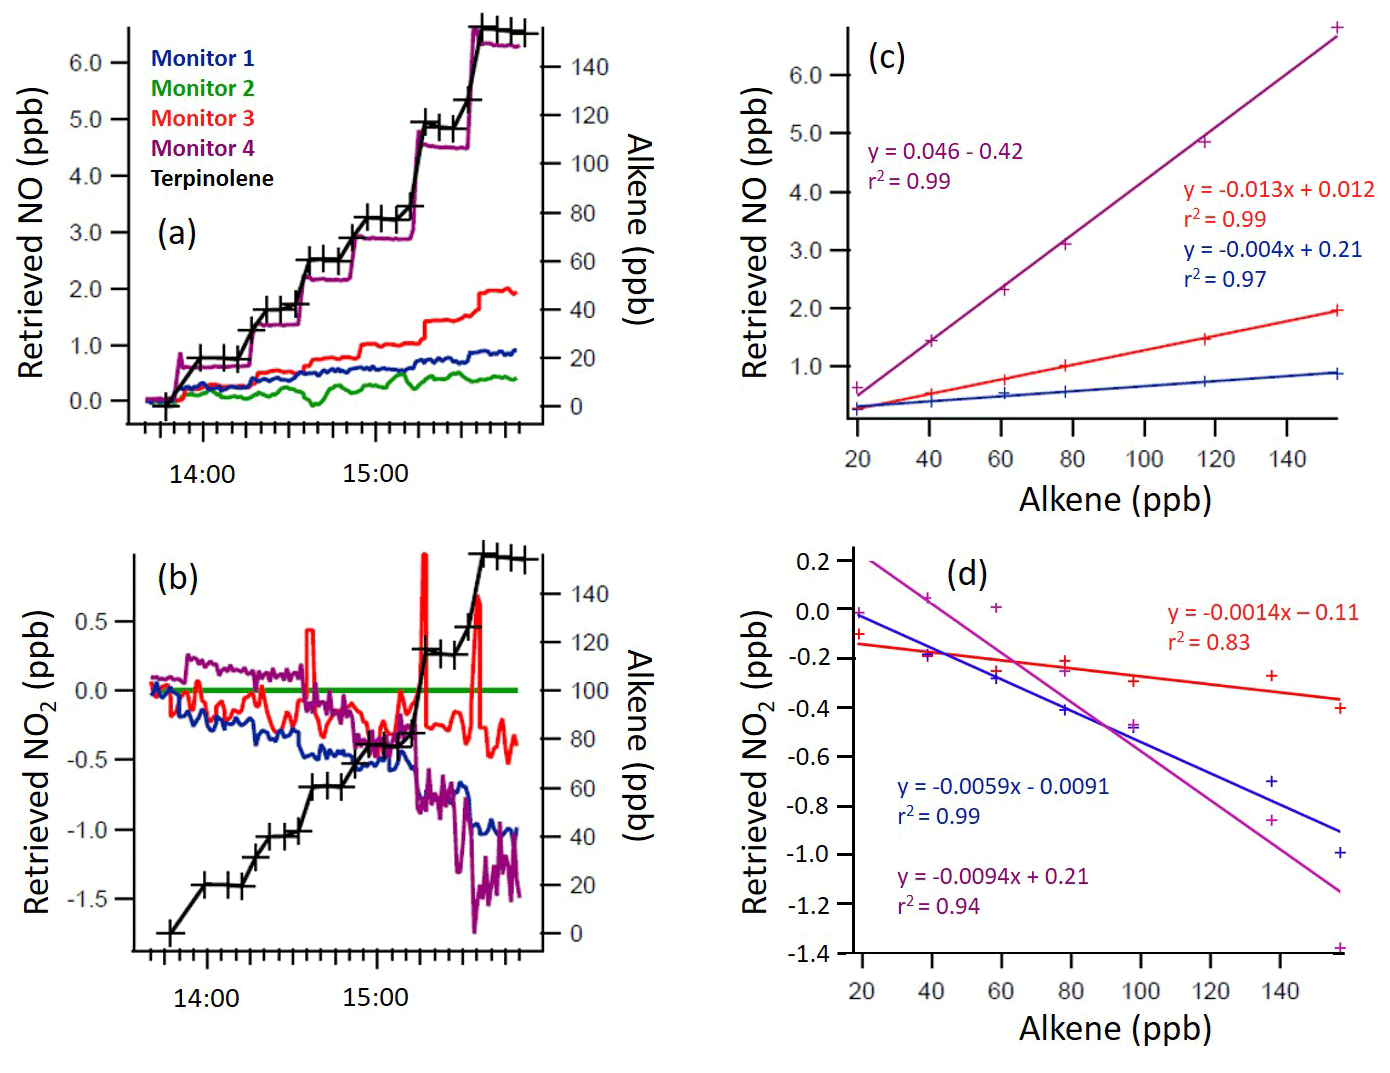
Figure 3Time series of the terpinolene mixing ratio and measured NO and NO2 mixing ratios, as retrieved by each monitor (a, b), with 1 min time resolution, and the regression calculations for the monitors that demonstrated significant interference with the addition of terpinolene (c, d). Note the different y axis scales.
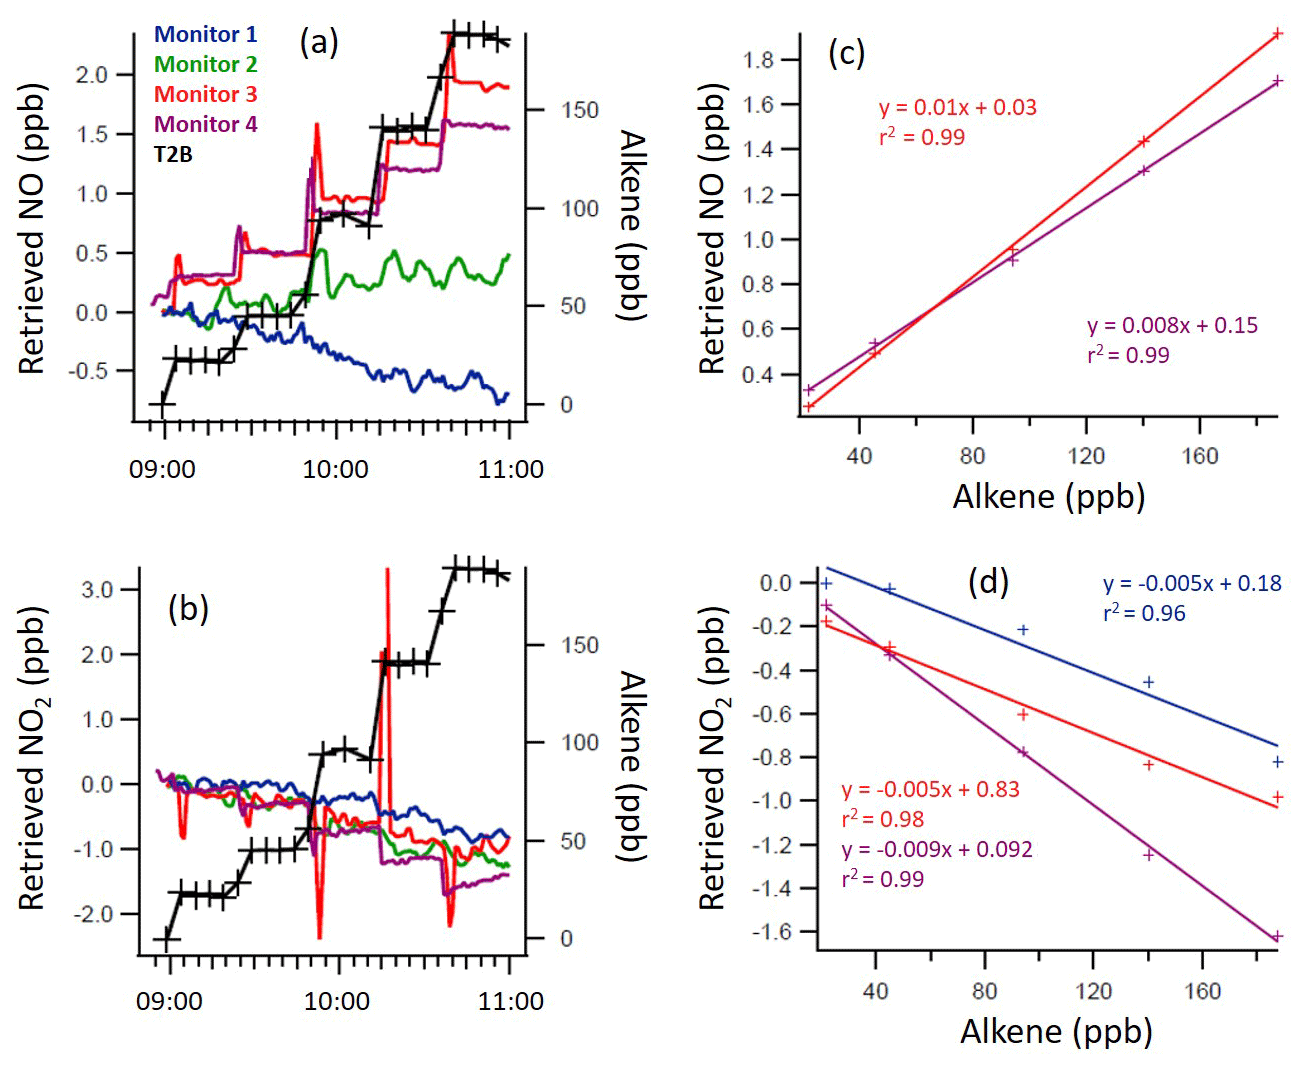
Figure 4Time series of the trans-2-butene (T2B) mixing ratio and measured NO (a, c) and NO2 (b, d) mixing ratios, as retrieved by each monitor (a, b), with 1 min time resolution, and the regression calculations for the monitors that demonstrated significant interference with the addition of T2B (c, d). Note the different y axis scales.
From Figs. 2 to 4, a clear and systematic response from the monitors to the presence of α-terpinene, terpinolene and T2B was observed, with the magnitude varying between the monitors. In addition to the alkenes shown in Figs. 2–4, significant interference effects were also observed for C2B, TME and limonene for some of the monitors, as summarised in Tables 2 and 3. No interference was observed, within the detection uncertainty, for ethene, propene, isobutene, α-pinene, β-pinene, myrcene or methyl chavicol in any of the monitors. For isoprene, no statistically significant interference was observed for monitors 1–3, while monitor 4 observed very small positive interferences of 0.035 ± 0.001 % (NO channel) and 0.076 ± 0.002 % (NO2 channel).
For the alkenes in which a significant interference was observed, in general a positive interference was observed for NO and a negative interference for NO2 by monitors 1–4 (Tables 2 and 3), with the exception of TME, in which a negative NO interference was observed by monitor 3 (discussed later). Generally, for monitor 4, a positive NO interference and a mixture of both positive and negative NO2 interferences was observed. Overall, while the magnitude of interference differed between the monitors, the same trend in the interference was observed, with α-terpinene having the largest interference effect, followed by terpinolene, TME/T2B, C2B and limonene.
The addition of water (RH ca. 30 %) led to the observed NO and NO2 interference for T2B, terpinolene and α-terpinene decreasing by 30 %–60 %, as shown in Tables 2 and 3. The addition of CO resulted in an increase in the NO interference observed for TME from below the LOD to 0.7 % for monitors 1 and 2, while monitors 3 and 4 exhibited a larger interference increase (Table 2).
5.1 Interference effects on retrieved NO abundance
Positive NO interferences were observed for those alkenes which reacted most rapidly with ozone and, hence, will be present within the monitor reaction chamber at different levels in the measurement and background modes. This interference is attributed to chemiluminescent emission following the alkene–ozone reaction and may be attributed to a combination of two factors, namely the formation of excited products in the alkene–ozone reaction, which emit chemiluminescence, coupled with the significant removal of some alkenes during the instrument background phase compared with the measurement phase through their reaction with (elevated levels of) ozone within the instrument, i.e. mechanism (4), outlined above.
Possible origins of this signal are the production of excited HCHO, vibrationally excited OH and electronically excited OH (e.g. Finlayson et al., 1974). While the long-pass filters used in chemiluminescence NOx monitors should preclude emissions from electronically excited species, vibrationally excited OH produced through the hydroperoxide mechanism is known to emit in the 700–1100 nm wavelength range (Finlayson et al., 1974; Schurath et al., 1976; Hansen et al., 1977; Toby, 1984) and would be detected as NO2. Specifications of the long-pass filters used in the chemiluminescence NOx monitors in this study are not reported in their respective user manuals but typically block light below ca. 600 nm, while typical PMT response characteristics are between 400 and 950 nm (Jernigan, 2001). Any chemiluminescence signal in the 600–950 nm wavelength range can therefore cause a potential interference.
The difference in the interference effect among monitors may then reflect differences in the conditions (e.g. ozone abundance, pressure and residence time) within the reaction cell and filter specifications. The relative magnitudes of the positive interference signals observed between the different monitors are consistent with this picture as the reaction chamber pressure is much lower for monitors 3 and 4 (ca. 1–10 Torr) compared with monitors 1 and 2 (ca. 300 Torr), leading to greater collisional quenching. Similarly, the addition of H2O, which would be expected to efficiently accept vibrational energy from OH radicals (Gerboles et al., 2003), was found to substantially reduce the apparent interference. In the experiments with higher humidity, a reduced interference (factor of ca. 2; see Table 2) was observed for all NO experiments for all instruments, except for TME for the photolytic converters for which an increase was observed. There is currently no recommended relative humidity under which calibrations should be performed for any of the instruments or within EU and EPA guidelines (AQEG, 2004; USEPA, 2002). However, the installation of permeation driers at the sample inlet should (in principle) reduce the impact of different H2O/relative humidity levels upon the quenching of NO2 or other species and are a common feature of most modern samplers (AQEG, 2004).
5.2 Interference magnitude – kinetic and structural effects
The most significant effects are the large positive NO interferences observed for the monoterpenes, namely α-terpinene and terpinolene, within monitors 1, 3 and 4. The criteria for an alkene to display such a positive interference (i.e. via mechanism 4) are that it reacts with ozone to produce excited products which exhibit a chemiluminescent signal at appropriate wavelengths. In addition, the alkene must have a sufficiently rapid reaction with ozone so that its mixing ratio is substantially reduced during the instrument background phase compared with the measurement phase, thus precluding the correct subtraction of the interference signal. The reaction rate constants for many alkenes with ozone are well known, allowing the calculation of a kinetic interference potential (KIP) ranking for this second factor, and are calculated by Eq. (1).
where k=k[O3]t and (i.e. 1 % of NO left after reaction with excess O3; see the Supplement for calculation details). The calculated KIP are shown in Table 4 as the percentage of a given alkene's potential chemiluminescent signal which would not be subtracted in the standard background cycle, under the assumption that the background cycle conditions (O3 mixing ratio and residence time) would be sufficient to remove 99 % of the NO present.
Table 4Kinetic ranking of the interference potential, namely the percentage of the potential chemiluminescent signal from the ozonolysis of a given alkene which would not be removed by a standard instrument background cycle under conditions (e.g. ozone mixing ratio and residence time) which would remove 99 % of the NO sampled. Rate constants are taken from Calvert et al. (2000); cm3 molecule−1 s−1 (298 K). Note: this ranking does not include variations in the yield of chemiluminescent products with an alkene structure which will modulate the values given. Species marked with an ∗ are investigated in this study.
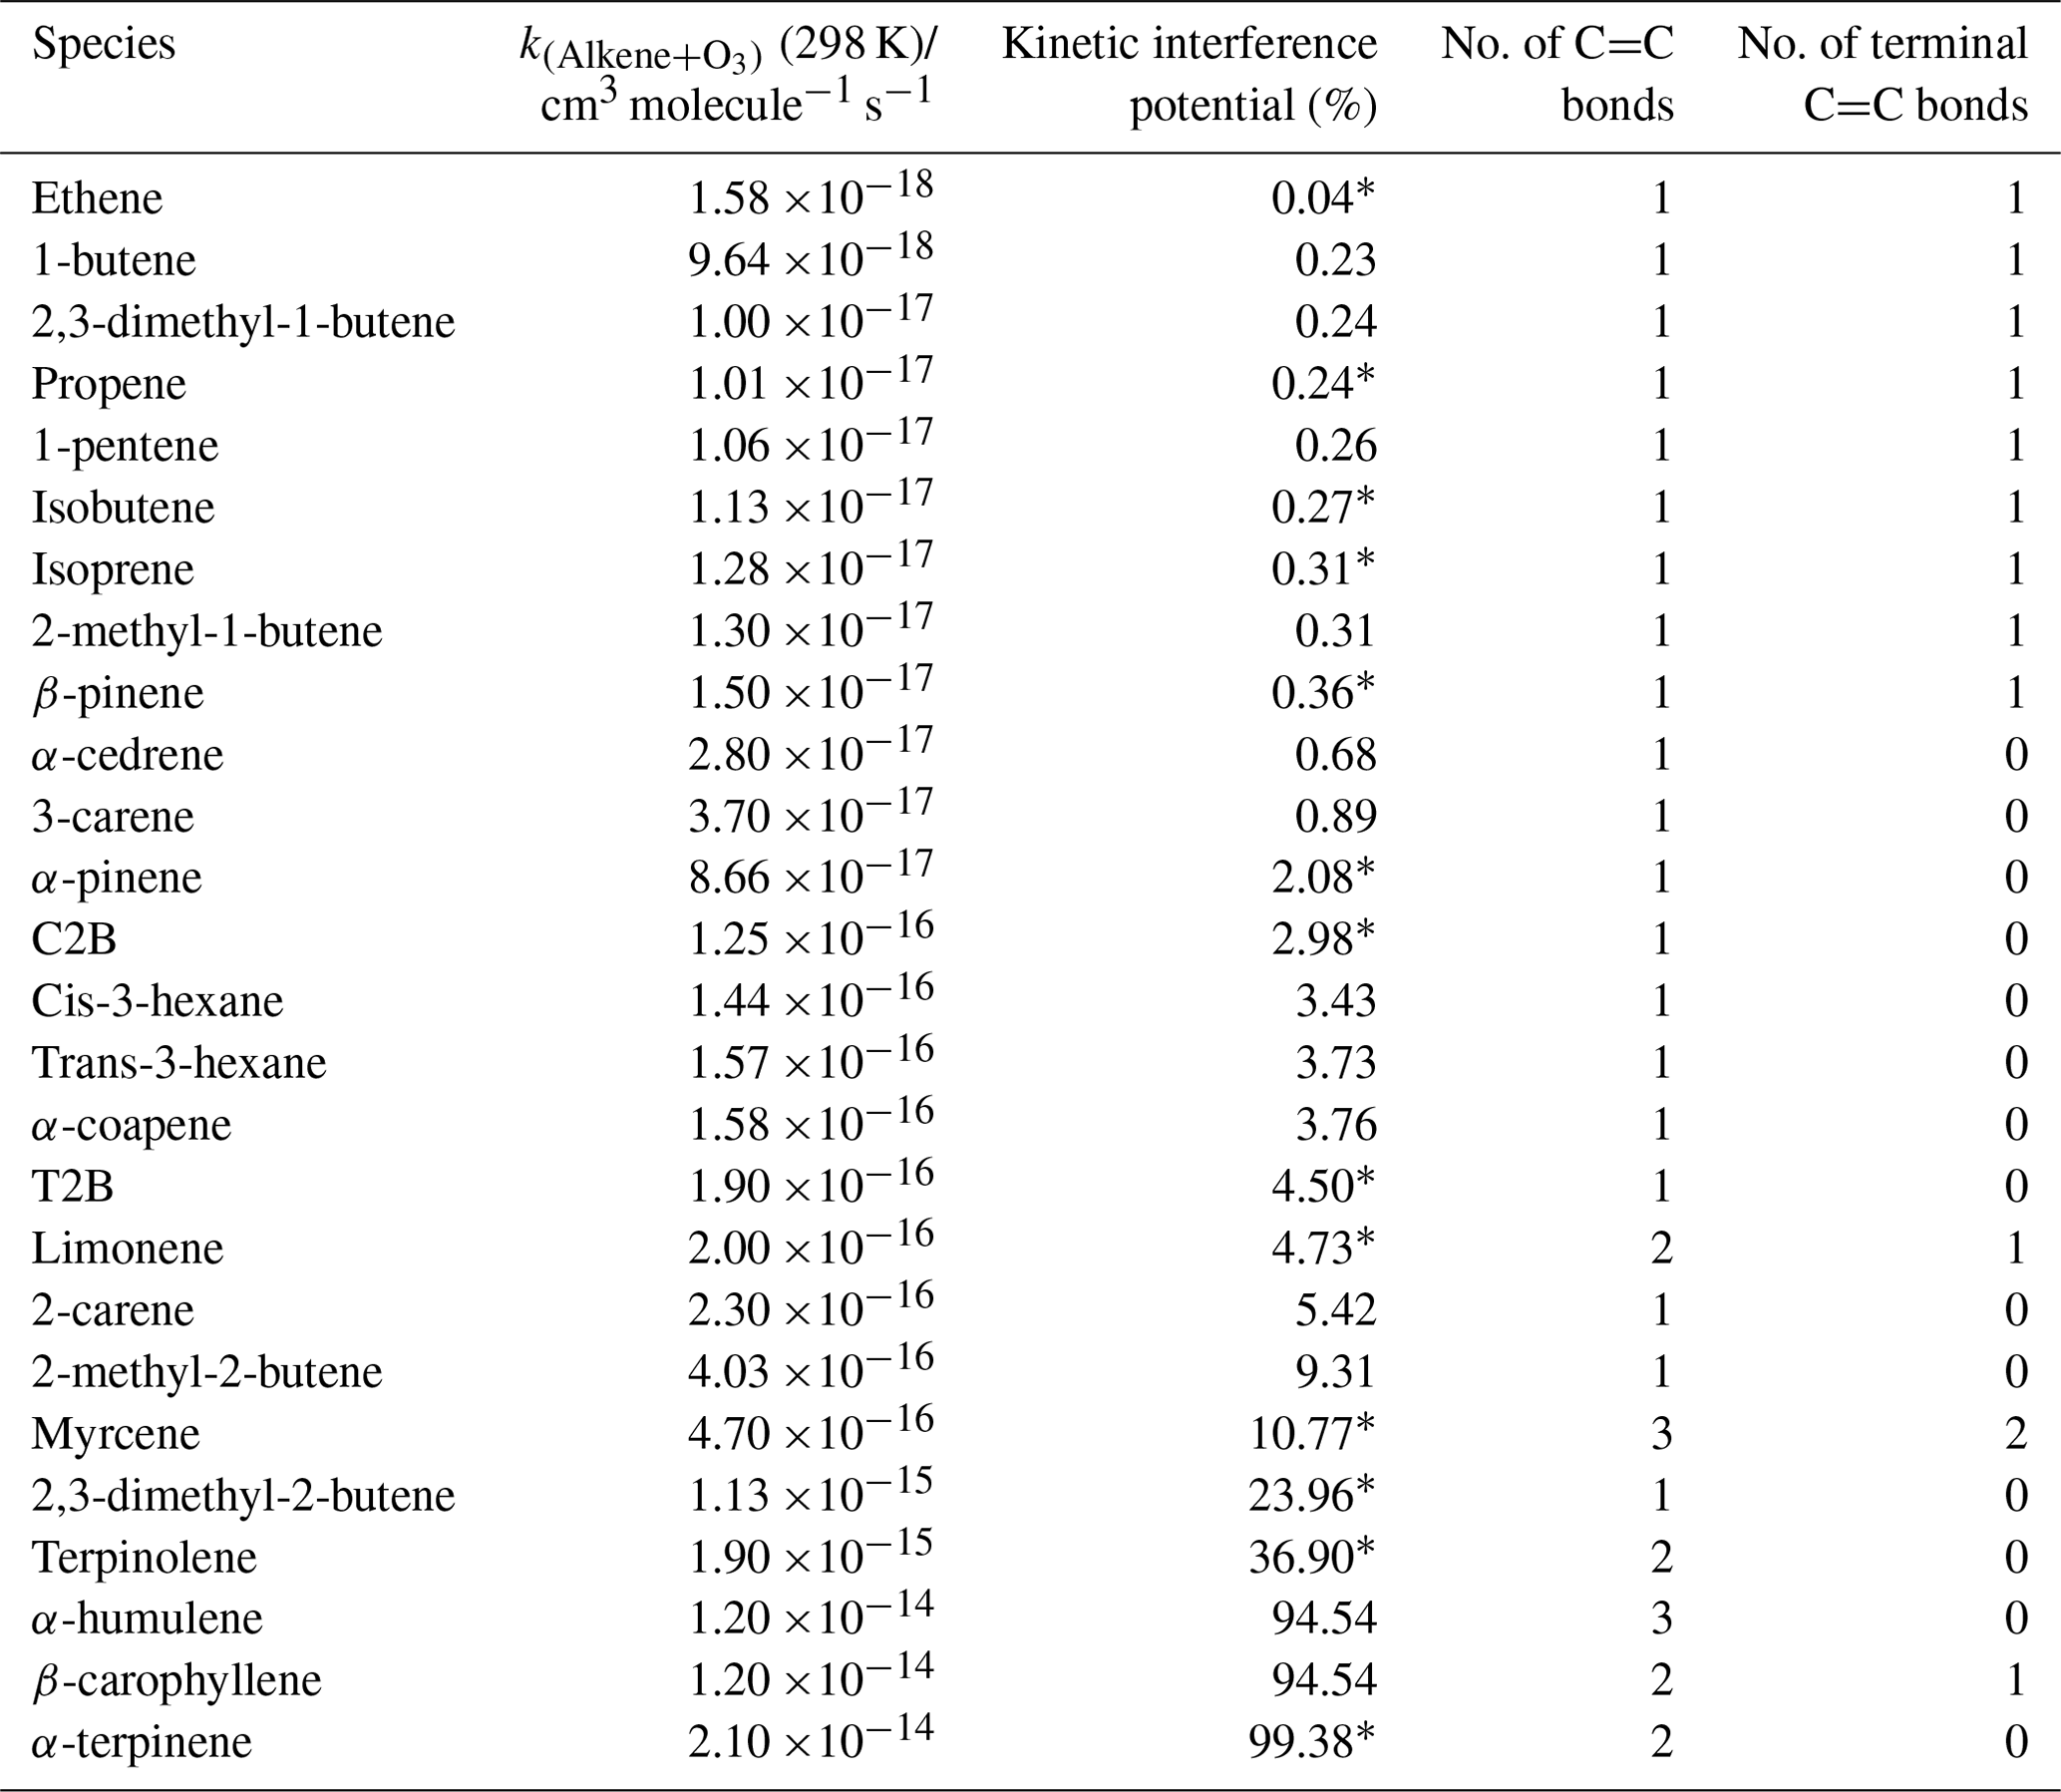
This ranking does not reflect the precise (relative) interference which is observed as it neglects structural features which will affect the yield (and state i.e. electronic or vibrationally excited) of the chemiluminescent products from the ozonolysis reaction, but it is consistent with the trend and relative magnitudes for the substantial positive interferences shown in Tables 2 and 3. For example, a lack of interference is observed for myrcene and limonene, both of which exhibit terminal C=C bonds (see Table 4) and, after reaction with ozone, lead to the production of the CH2OO Criegee intermediate (CI), which subsequently decomposes or undergoes rearrangement to form small yields of OH (Alam et al., 2011). The ozonolysis of internal alkenes, such as C2B and T2B, produce the CH3CHOO CI, which predominantly decomposes via the vinyl hydroperoxide mechanism, forming larger yields of OH (Johnson and Marston, 2008; Alam et al., 2013). Such chemically formed OH that produces a detectable signal may also be augmented by contributions from HO2 and RO2 converted into OH within the instrument by reaction with NO, especially in the NO2 channel of photolytic converter instruments.

Figure 5Relationship between measured NO interference (%) and kinetic interference potential (KIP; %) for monitors 1 (green), 3 (purple), 4 (red) and the average of the observed NO interference across all instruments (black).
The relationship between the KIP (Table 4) and measured NO interference (Tables 2 and 3) is illustrated in Fig. 5 and can be used for predicting the potential interference of a given alkene to the NO signal from a kinetic perspective. For example, α-humulene has a KIP of 94.54 %, which could give rise to a 1.7 %, 2.4 % or 10.2 % NO interference for monitors 1, 3 and 4, respectively. This estimate is, however, based on the rate constant of α-humulene alone and does not include any structural features such as the presence of terminal and non-terminal C=C bonds.
5.3 Explanation of the interference observed for NO2
The above discussion considers only the interference effect arising from alkene chemiluminescent emission; further measurement impacts are also evident in the (negative) interferences apparent for other species/monitors in Tables 2 and 3. An inspection of Tables 2 and 3 shows smaller positive interferences, and some negative interferences, from alkenes in the NO2 measurements.
NO2 measurements using chemiluminescence approaches are usually obtained by measuring NOx (i.e. Σ(NO + NO2), after passing the sampled air through an NO2 converter) and subtracting the (independently determined) NO contribution. If the actual interference signal (additional chemiluminescence) during the NOx measurement mode arises solely from mechanism (4), ozonolysis chemiluminescence, then this would be expected to match that in the NO mode (subject to the alkene abundance not being altered in the NO2 conversion stage and the detection conditions for the NO and NOx phases being identical) and, consequently, would not affect the retrieved NO2 mixing ratio. Monitors 1, 2 and 3 used a single detection cell, alternating between NO and NO2 (NOx) modes, and measured the NO chemiluminescence signal under identical conditions (optical arrangement, filtering and pressure). The observed negative interference for NO2, therefore, may have arisen due to the removal of alkene by the Mo catalyst within the monitors.
For monitor 1 (TE42i-TL), the negative interference observed for NO2 was the same magnitude as that observed for the positive interference for NO, including the experiments with H2O and CO (see Fig. 6 and Tables 2–3). This response is thought to arise as a consequence of the calculation methodology, combined with removal of alkenes during the NO2 conversion by the Mo catalyst.
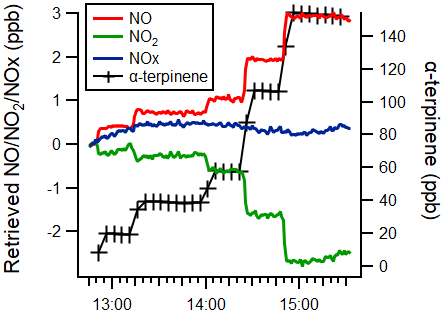
Figure 6Time series of the α-terpinene mixing ratio (black) and measured NO (red), NO2 (green) and NOx (blue) mixing ratios, as retrieved by monitor 1 (TE42i-TL), with a 1 min time resolution.
There are three modes of operation in monitor 1 (TE42i-TL), namely NO measurement, NO2 ∕ NOx measurement and background (pre-reactor) measurement, given by Eqs. (2)–(4), respectively, as follows:
where sNO and sNOx are the NO and NOx signals produced by the chemiluminescence monitor, respectively, sNOreal and are the real NO and NOx signals, Xi denotes the interference alkene i, y is the fraction of the interferant (alkene) Xi remaining after the Mo convertor, sP denotes signal at the pre-reactor, and f is the fraction of Xi remaining after the pre-reactor. The mixing ratios of NO, NO2 and NOx are given by the following:
where c is the span factor and CE represents the conversion efficiency. If we assume , then the following applies:
From Eq. (13), it may be seen that if y=1 (i.e. if the interferant alkene abundance is not affected by passage through the Mo converter), then there would be no interference observed in the retrieved NO2, while if the interferant species is subject to removal during its passage through the converter, then y < 1 and a negative interference would be observed. Molybdenum oxide catalysts have been reported to efficiently isomerise alkenes at temperatures between 300 and 400 ∘C (Wehrer et al., 2003) and are also effective catalysts for the epoxidation of alkenes (Shen et al., 2019). The observed small negative interference effects (for monitors 1 and 2; the Mo converter units), in the absence of significant sampled NOx, may reflect the partial removal of the alkene in the converter.
The negative NO2 interference apparent for monitors 3 and 4 (photolytic converter instruments) is more difficult to rationalise (as no Mo catalyst is present). Under ambient conditions, where NOx is present, mechanism (3) may occur, as outlined below. In reality, the conversion efficiency for photolytic converters is substantially lower than 100 % (Reed et al., 2016) as a consequence of both the finite photolysis intensity achievable and the occurrence of the NO+O3 back reaction. If the instrument calibration factor for NOx is not equal to that for NO (see Eq. 12), or if alkene was removed in the convertor stage, then this will lead to different interferences for NO and NO2, as CE is also (significantly) less than 1. This trend is apparent in the values shown in Table 3, in particular for the instruments fitted with photolytic convertors. However, in the absence of sampled NOx, the observed less positive or even negative NO2 interference suggests that less alkene is present in the NOx mode. Direct photolysis of alkenes is unlikely to cause such a change, considering the photolytic converter wavelength envelope, but the photolytic production of HOx radicals (which then react with the alkene) may be responsible.
Monitor 4 (Air Quality Design, Inc. – AQD) used independent NO detection channels; tests were conducted using both channels for C2B and terpinolene systems and revealed significant differences between the two detectors (ca. 40 % lower interference response for NO in the NO2 detection channel). With two independent detection channels, NO2 may be determined from the NOx measurement by either subtracting the NO level obtained from the NO channel (method a) or via the difference in signal observed in the NO2 ∕ NOx channel when turning the photolysis lamp on and off (method b). Under method (a), as employed for C2B and terpinolene, a lower positive interference from alkene chemiluminescence results as a consequence of the difference in the detection cell conditions (results marked ∗ in Table 3), while under method (b), as employed for the other alkenes studied here with the AQD system, the interference (from mechanism 4 alone) should cancel out (results marked with a # in Table 3).
5.4 Effect of quenching by the alkenes
The data presented in Figs. 2–4 and Tables 2 and 3 show both negative and positive interferences, while mechanism 4 alone would be expected to result in positive interference signals for NO for all alkenes. We therefore conclude that additional mechanisms are occurring. Under the conditions of these chamber experiments, the retrieval of additional NOy species can be precluded. The chamber wall source of HONO has been characterised and shown to produce ppt levels of HONO under the dark, dry conditions of these experiments (Zádor et al., 2005) and would be equally present for all experiments. We attribute the negative (or reduced positive) interference effects to a combination of mechanisms (1) and (3), where the quenching of excited OH (produced by alkene and ozone reaction) by alkenes (electron-rich alkenes have been shown to be effective quenchers; Gersdorf et al., 1987; Chang and Schuster, 1987) and the generation of HOx radicals within the instrument follow on from the ozonolysis reaction.
The alkene–ozone reactions are known to produce OH, HO2 and RO2 radicals both directly (e.g. Johnson and Marston, 2008), following the photolysis of other alkene–ozone reaction products (e.g. carbonyl compounds), and through OH–alkene reactions. Peroxy radicals promote the conversion of NO to NO2, altering the abundance of both species (the formation of NOx reservoirs, such as nitric acid and organic nitrates, will also occur but will be negligible on the timescale of the operation of most instruments).
The ozonolysis of the TME results in the production of OH with a close to unity yield (IUPAC, 2020), and if taking into account the above mechanism (4) only, might be expected to exhibit a large interference in NO mode. Table 2 shows no interference for monitors 1 and 2 (Mo convertor units) and negative and positive interferences for monitors 3 and 4 (photolytic convertor units), respectively, and so it is hard to rationalise (for NO mode). The addition of CO as a scavenger for OH led to an increase in the NO signal for all monitors. A possible origin of this signal is the chemiluminescence production of the excited intermediate HOCO (from the reaction of vibrationally excited OH, which is from the ozonolysis of TME, with CO), which has a temperature and pressure-dependent rate of reaction (Atkinson et al., 2006; Li and Francisco, 2000) and is consistent with the larger NO signal in the photolytic monitors (Table 2).
The interference in chemiluminescence NOx measurements from alkenes has been systematically investigated using four commercially available monitors. Varying degrees of interference in the NO and NO2 signals were observed for all monitors investigated, which has been attributed to a combination of mechanisms 1, 3 and 4, particularly for the incomplete subtraction of chemiluminescence from the products of alkene–ozone reactions that manifest due to a significant removal of the alkene during the instrument background cycle. Monoterpenes, α-terpinene and terpinolene, exhibit the largest interferences, followed by 2,3-dimethyl-2-butene (TME) and trans-2-butene (T2B), which is in line with the calculated kinetic interference potential (KIP; see Table 4). The KIP can be used as a crude indicator of a potential interference of an alkene to an NO signal but has large margins of error as it does not take into account the variation in the yield of chemiluminescent products and other instrumental differences. The alkene interference observed with enhanced RH conditions also indicates the need to accurately calibrate chemiluminescence NOx analysers under actual sampling conditions.
The interferences in NO measurements arising from alkenes among the monitors investigated in this study range from 1 % to 11 %. The varying responses exhibited by the different monitors reflect differences in the conditions within the instrument (ozone abundance, pressure and residence time) within the reaction cell and filter specifications. The magnitude of the NO and NO2 interferences not only vary with different alkenes and commercial monitors but will also be dependent upon sampling environments (and with ambient NOx and alkene concentrations). Notably, in these experiments, the alkene abundance is high compared with most ambient air samples; consequently, internally generated OH will react essentially exclusively with the alkene, which may not reflect ambient sampling but which we do not expect to impact the conclusions reached with respect to mechanism 4, i.e. interference in retrieved NO levels. Further research to explore these impacts, and other parameters (e.g. H2O abundance), is urgently needed. The chemiluminescence from the monoterpene ozonolysis should also be investigated to identify the emission spectra of possible interfering species; given the varying OH yields and energetics from the ozonolysis of different alkenes, their intensity of emission are likely to vary. A combination of selective long-pass filters and detector characteristics can then be exploited within chemiluminescence NOx monitors to eliminate such interferences with similar emission spectra to NO.
Mixing ratios of NOx vary from > 100 ppb in some urban areas, e.g. Marylebone Road (Carslaw, 2005), < 300 ppt in biogenic environments (Hewitt et al., 2010) and < 35 ppt in remote areas (Lee et al., 2009). For typical urban environments where alkene mixing ratios are relatively low (< 2 ppb; e.g. von Schneidemesser et al., 2010), the interferences identified here are not likely to be significant (∼ 1 % of the NO signal). However, for biogenic environments where monoterpenes and sesquiterpenes, which react rapidly with ozone, are abundant, the interference could be significantly larger. For example, the average mixing ratios for isoprene (∼ 1 ppb), five monoterpenes (∼ 220 ppt), three short chain alkenes (∼ 240 ppt) and NO (0.14 ppb) were measured within a southeast Asian tropical rainforest (Jones et al., 2011). Using the relationship between KIP and NO interference, an overestimation of NO levels of to up to 58 % would result, with very significant implications for the prediction of other atmospheric chemical processes involving NOx. Given that NOx mixing ratios are relatively small in biogenic and remote environments, these interferences could lead to their substantial overestimation. Such alkene interference may contribute to the relatively high NO and low NO2 reported in the tropical rainforests at night, which could not otherwise be accounted for (Pugh et al., 2010).
Within indoor environments, NOx primarily arises from outdoor sources or indoor combustion sources (Young et al., 2019). Typically, in the absence of a known indoor combustion source, indoor NO levels are low (ca. 13 % of outdoor levels), with NO2 comprising the majority of the NOx (Zhou et al., 2019). There are multiple sources of alkenes indoors, such as fragranced volatile personal care products (Nemafollahi et al., 2019; Yeoman et al., 2020) and cleaning products (Kristenson et al., 2019), resulting in much larger levels of alkenes than NOx (McDonald et al., 2018; Kristenson et al., 2019). Consequently, monoterpenes are among the most ubiquitous VOCs reported for indoor air, with the main species including linalool, α-pinene, β-myrcene and limonene (Krol et al., 2014; Nematollahi et al., 2019). Peak limonene mixing ratios may be a factor of ca. 50 higher indoors than in outdoor environments (Lerner et al., 2012). Although the monoterpenes, α-pinene, myrcene and limonene show no significant NO interferences in chemiluminescence NOx monitors, other fast-reacting monoterpenes (with O3), such as α-terpinene and terpinolene which are not generally reported in the literature, exhibit quite large interferences and may lead to very substantial overestimations in indoor NOx measurements. Monoterpene mixing ratios in indoor environments can be further enhanced by cleaning activities (Singer et al., 2006; Kristenson et al., 2019; Weschler and Carslaw, 2018). Indoor α-terpinene and α-pinene mixing ratios have exceeded 10 and 68 ppb, respectively (Singer et al., 2006; Brown et al., 1994). These relatively large monoterpene mixing ratios may lead to substantial interferences in chemiluminescence NOx monitors; their incorrect retrieval, as measured NOx, will impact assessments of indoor air chemistry, indoor air quality and, hence, health.
Experimental data are available at https://doi.org/10.25500/eData.bham.00000566 (Alam et al., 2020) and also from the Eurochamp Data Center at https://data.eurochamp.org/data-access/chamber-experiments/ (last access: 4 August 2020).
The supplement related to this article is available online at: https://doi.org/10.5194/amt-13-5977-2020-supplement.
MSA, WJB and JDL conceived and planned the experiments. MSA, JDL, MVM, AM and MR performed the experiments. LRC, LJK and MSA performed the data analysis. LRC, LJK, MSA, CP and WJB contributed to the data investigation and curation. MSA wrote the original draft, and all co-authors contributed to the reviewing and editing of the paper.
The authors declare that they have no conflict of interest.
The authors would like to thank Eva Clemente for her work in these experiments.
This work was funded in part through the UK Natural Environment Research Council (NERC) project “ICOZA: Integrated Chemistry of Ozone in the Atmosphere” (grant no. NE/ K012169/1) and by the EUROCHAMP-2 Transnational access project “NOxINT: NOx analyser interference in chemically complex mixtures” (grant no. E2-2010-05-26-0033). Part of this work has received funding from the European Union's Horizon 2020 research and innovation programme through the EUROCHAMP-2020 Infrastructure Activity (grant no. 730997). CEAM is partly supported by the IMAGINA-Prometeo project (grant no. PROMETEO2019/110) and by Generalitat Valenciana.
This paper was edited by Keding Lu and reviewed by two anonymous referees.
Alam, M. S., Camredon, M., Rickard, A. R., Carr, T., Wyche, K. P., Hornsby, K. E., Monks, P. S., and Bloss, W. J.: Total radical yields from tropospheric ethene ozonolysis, Phys. Chem. Chem. Phys., 13, 11002–11015, 2011.
Alam, M. S., Rickard, A. R., Camredon, M., Wyche, K. P., Carr, T., Hornsby, K. E., Monks, P. S., and Bloss, W. J.: Radical product yields from the ozonolysis of short chain alkenes under atmospheric boundary layer conditions, J. Phys. Chem. A, 117, 12468–12483, 2013.
Alam, M. S., Crilley, L. R., Lee, J. D., Kramer, L. J., Pfrang, C., Vazquez-Moreno, M., Rodenas, M., Munoz, A., and Bloss, W. J.: NOx interference data, University of Birmingham, https://doi.org/10.25500/eData.bham.00000566, 2020.
AQEG: Air quality expert group. Nitrogen dioxide in the United Kingdom, London, UK, 2004.
Atkinson, R., Baulch, D. L., Cox, R. A., Crowley, J. N., Hampson, R. F., Hynes, R. G., Jenkin, M. E., Rossi, M. J., Troe, J., and IUPAC Subcommittee: Evaluated kinetic and photochemical data for atmospheric chemistry: Volume II – gas phase reactions of organic species, Atmos. Chem. Phys., 6, 3625–4055, https://doi.org/10.5194/acp-6-3625-2006, 2006.
Brown, S. K., Sim, M. R., Abramson, M. J. and Gray, C. N.: Concentrations of volatile organic compounds in indoor air – a review, Indoor air, 4, 123–134, 1994
BS EN 14211: Ambient air. Standard method for the measurement of the concentration of nitrogen dioxide and nitrogen monoxide by chemiluminescence, The British Standards Institution, London, UK, 2012.
Calvert, J. G., Atkinson, R., Kerr, J. A., Madronich, S., Moortgat, G. K., Wallington, T. J., and Yarwood, G.: The mechanism of atmospheric oxidation of the alkenes, Oxford University Press, New York, USA, 2000.
Cape, J. N.: The Use of Passive Diffusion Tubes for Measuring Concentrations of Nitrogen Dioxide in Air, Crit. Rev. Anal. Chem., 39, 289–310, 2009.
Carslaw, D. C.: Evidence of an increasing NO2∕NOx emissions ratio from road traffic emissions, Atmos. Environ., 39, 4793–4802, 2005.
Carslaw, D. C. and Rhys-Tyler, G.: New insights from comprehensive on-road measurements of NOx, NO2 and NH3 from vehicle emission remote sensing in London, UK, Atmos. Environ., 81, 339–347, 2013.
Chaloulakou, A., Mavroidis, I., and Gavriil, I.: Compliance with the annual NO2 air quality standard in Athens. Required NOx levels and expected health implications, Atmos. Environ., 42, 454–465, 2008.
Chang, S. L. P. and Schuster, D. I.: Fluorescence quenching of 9,10-dicyanoanthracene by dienes and alkenes, J. Phys. Chem., 91, 3644–3649, 1987.
Crawford, J., Davis, D., Chen, G., Bradshaw, J., Sandholm, S., Kondo, Y., Merrill, J., Liu, S., Browell, E., and Gregory, G.: Implications of large scale shifts in tropospheric NOx levels in the remote tropical Pacific, J. Geophys. Res.-Atmos., 102, 28447–28468, 1997.
Dillon, T. J. and Crowley, J. N.: Reactive quenching of electronically excited NO and NO by H2O as potential sources of atmospheric HOx radicals, Atmos. Chem. Phys., 18, 14005–14015, https://doi.org/10.5194/acp-18-14005-2018, 2018.
Dunlea, E. J., Herndon, S. C., Nelson, D. D., Volkamer, R. M., San Martini, F., Sheehy, P. M., Zahniser, M. S., Shorter, J. H., Wormhoudt, J. C., Lamb, B. K., Allwine, E. J., Gaffney, J. S., Marley, N. A., Grutter, M., Marquez, C., Blanco, S., Cardenas, B., Retama, A., Ramos Villegas, C. R., Kolb, C. E., Molina, L. T., and Molina, M. J.: Evaluation of nitrogen dioxide chemiluminescence monitors in a polluted urban environment, Atmos. Chem. Phys., 7, 2691–2704, https://doi.org/10.5194/acp-7-2691-2007, 2007.
European Environmental Agency.: Air quality in Europe – 2018 report, ISSN 1997-8449, Report No: TH-AL-18-013-EN-N, Luxembourg, 2018.
Finlayson, B., Pitts Jr., J., and Atkinson, R.: Low-pressure gas-phase ozone-olefin reactions. Chemiluminescence, kinetics, and mechanisms, J. Am. Chem. Soc., 96, 5356–5367, 1974.
Fuchs, H., Dubé, W. P., Lerner, B. M., Wagner, N. L., Williams, E. J., and Brown, S. S.: A sensitive and versatile detector for atmospheric NO2 and NOx based on blue diode laser cavity ring-down spectroscopy, Environ. Sci. Technol., 43, 7831–7836, 2009.
Gerboles, M., Lagler, F., Rembges, D., and Brun, C.: Assessment of uncertainty of NO2 measurements by the chemiluminescence method and discussion of the quality objective of the NO2 European Directive, J. Environ. Monit., 5, 529–540, 2003.
Gersdorf, J., Mattay, J., and Goerner, H.: Photoreactions of biacetyl, benzophenone, and benzil with electron-rich alkenes, J. Am. Chem. Soc., 109, 1203–1209, 1987.
Goldstein, A. H. and Galbally, I. E.: Known and Unexplored organic constituents in the Earth's Atmosphere, Environ. Sci. Technol., 2007, 1515–1521, 2007.
Grice, S., Stedman, J., Kent, A., Hobson, M., Norris, J., Abbott, J., and Cooke, S.: Recent trends and projections of primary NO2 emissions in Europe, Atmos. Environ., 43, 2154–2167, 2009.
Hansen, D., Atkinson, R., and Pitts Jr., J.: Structural effects on the chemiluminescence from the reaction of ozone with selected organic compounds, J. Photochem., 7, 379–404, 1977.
Heard, D.: Analytical techniques for atmospheric measurement, John Wiley & Sons, Oxford, UK, 2008.
Hewitt, C. N., Lee, J. D., MacKenzie, A. R., Barkley, M. P., Carslaw, N., Carver, G. D., Chappell, N. A., Coe, H., Collier, C., Commane, R., Davies, F., Davison, B., DiCarlo, P., Di Marco, C. F., Dorsey, J. R., Edwards, P. M., Evans, M. J., Fowler, D., Furneaux, K. L., Gallagher, M., Guenther, A., Heard, D. E., Helfter, C., Hopkins, J., Ingham, T., Irwin, M., Jones, C., Karunaharan, A., Langford, B., Lewis, A. C., Lim, S. F., MacDonald, S. M., Mahajan, A. S., Malpass, S., McFiggans, G., Mills, G., Misztal, P., Moller, S., Monks, P. S., Nemitz, E., Nicolas-Perea, V., Oetjen, H., Oram, D. E., Palmer, P. I., Phillips, G. J., Pike, R., Plane, J. M. C., Pugh, T., Pyle, J. A., Reeves, C. E., Robinson, N. H., Stewart, D., Stone, D., Whalley, L. K., and Yin, X.: Overview: oxidant and particle photochemical processes above a south-east Asian tropical rainforest (the OP3 project): introduction, rationale, location characteristics and tools, Atmos. Chem. Phys., 10, 169–199, https://doi.org/10.5194/acp-10-169-2010, 2010.
Hills, A. J. and Zimmerman, P. R.: Isoprene measurement by ozone-induced chemiluminescence, Anal. Chem., 62, 1055–1060, 1990.
IUPAC: Subcommittee for Gas Kinetic Data Evaluation, Data sheet Ox_VOC41, available at: http://iupac.pole-ether.fr/htdocs/datasheets/pdf/Ox_VOC41_O3_2,3-dimethyl-but-2-ene.pdf, last access: 3 September 2020.
Jernigan, J. R.: Chemiluminescence NOx and GFC NDIR CO analyzers for low level source monitoring, Thermo Environmental Instruments, Massachusetts, USA, 2001.
Johnson, D. and Marston, G.: The gas-phase ozonolysis of unsaturated volatile organic compounds in the troposphere, Chem. Soc. Rev., 37, 699–716, 2008.
Jones, C. E., Hopkins, J. R., and Lewis, A. C.: In situ measurements of isoprene and monoterpenes within a south-east Asian tropical rainforest, Atmos. Chem. Phys., 11, 6971–6984, https://doi.org/10.5194/acp-11-6971-2011, 2011.
Kasyutich, V. L., Bale, C. S. E., Canosa-Mas, C. E., Pfrang, C., Vaughan, S., and Wayne, R. P.: Cavity-enhanced absorption: detection of nitrogen dioxide and iodine monoxide using a violet laser diode, Appl. Phys. B, 76, 691–697, 2003.
Kebabian, P. L., Herndon, S. C., and Freedman, A.: Detection of Nitrogen Dioxide by Cavity Attenuated Phase Shift Spectroscopy, Anal. Chem., 77, 724–728, 2005.
Keuken, M., Roemer, M., and van den Elshout, S.: Trend analysis of urban NO2 concentrations and the importance of direct NO2 emissions versus ozone/NOx equilibrium, Atmos. Environ., 43, 4780–4783, 2009.
Kristensen, K., Lunderberg, D. M., Liu, Y., Misztal, P. K., Tian, Y., Arata, C., Nazaroff, W. W., and Goldstein, A. H.: Sources and dynamics of semivolatile organic compounds in a single-family residence in northern California, Indoor Air, 29, 645–655, 2019.
Król, S., Namieśnik, J., and Zabiegała, B.: α-Pinene, 3-carene and d-limonene in indoor air of Polish apartments: The impact on air quality and human exposure, Sci. Total Environ., 468, 985–995, 2014.
Lamsal, L., Martin, R., Van Donkelaar, A., Steinbacher, M., Celarier, E., Bucsela, E., Dunlea, E., and Pinto, J.: Ground-level nitrogen dioxide concentrations inferred from the satellite-borne Ozone Monitoring Instrument, J. Geophys. Res.-Atmos., 113, D16308, https://doi.org/10.1029/2007JD009235, 2008.
Lee, J. D., Moller, S. J., Read, K. A., Lewis, A. C., Mendes, L., and Carpenter, L. J.: Year-round measurements of nitrogen oxides and ozone in the tropical North Atlantic marine boundary layer, J. Geophys. Res.-Atmos., 114, D21302, https://doi.org/10.1029/2009JD011878, 2009.
Lerner, J. C., Sanchez, E. Y., Sambeth, J. E., and Porta, A. A.: Characterization and health risk assessment of VOCs in occupational environments in Buenos Aires, Argentina, Atmos. Environ., 55, 440–447, 2012.
Li, Y. and Francisco, J.S.: High level ab initio studies on the excited states of HOCO radical, J. Chem. Phys., 113, 7963–7970, 2000.
Matthews, R. D., Sawyer, R. F., and Schefer, R. W.: Interferences in chemiluminescent measurement of nitric oxide and nitrogen dioxide emissions from combustion systems, Environ. Sci. Technol., 11, 1092–1096, 1977.
McDonald, B. C., de Gouw, J. A., Gilman, J. B., Jathar, S. H., Akherati, A., Cappa, C. D., Jimenez, J. L., Lee-Taylor, J., Hayes, P. L., McKeen, S. A., and Cui, Y. Y.: Volatile chemical products emerging as largest petrochemical source of urban organic emissions, Science, 359, 760–764, 2018.
Muñoz, A., Vera, T., Sidebottom, H., Mellouki, A., Borrás, E., Ródenas, M., Clemente, E., and Vázquez, M.: Studies on the Atmospheric Degradation of Chlorpyrifos-Methyl, Environ. Sci. Technol., 45, 1880–1886, 2011.
Murphy, J. G., Day, D. A., Cleary, P. A., Wooldridge, P. J., Millet, D. B., Goldstein, A. H., and Cohen, R. C.: The weekend effect within and downwind of Sacramento – Part 1: Observations of ozone, nitrogen oxides, and VOC reactivity, Atmos. Chem. Phys., 7, 5327–5339, https://doi.org/10.5194/acp-7-5327-2007, 2007.
Navas, M. J., Jiménez, A. M., and Galán, G.: Air analysis: determination of nitrogen compounds by chemiluminescence, Atmos. Environ., 31, 3603–3608, 1997.
Nematollahi, N., Kolev, S. D., and Steinemann, A.: Volatile chemical emissions from 134 common consumer products, Air Qual. Atmos. Hlth., 12, 1259–1265, 2019.
Pitts Jr., J. N., Kummer, W. A., Steer, R. P., and Finlayson, B. J.: The chemiluminescent reactions of ozone with olefins and organic sulphides, Adv. Chem., 113, 246–254, 1972.
Pugh, T. A. M., Ryder, J., MacKenzie, A. R., Moller, S. J., Lee, J. D., Helfter, C., Nemitz, E., Lowe, D., and Hewitt, C. N.: Modelling chemistry in the nocturnal boundary layer above tropical rainforest and a generalised effective nocturnal ozone deposition velocity for sub-ppbv NOx conditions, J. Atmos. Chem., 65, 89–110, 2010.
Reed, C., Evans, M. J., Di Carlo, P., Lee, J. D., and Carpenter, L. J.: Interferences in photolytic NO2 measurements: explanation for an apparent missing oxidant?, Atmos. Chem. Phys., 16, 4707–4724, https://doi.org/10.5194/acp-16-4707-2016, 2016.
Sandholm, S., Bradshaw, J., Dorris, K., Rodgers, M., and Davis, D.: An airborne compatible photofragmentation two-photon laser-induced fluorescence instrument for measuring background tropospheric levels of NO, NOx, and NO2, J. Geophys. Res.-Atmos., 95, 10155–10161, 1990.
Schurath, U., Guesten, H., and Penzhorn, R.-D.: Phosphorescence of α-diketones from ozone-olefin reactions, J. Photochem., 5, 33–40, 1976.
Shen, Y., Jiang, P., Wai, P. T., Gu, Q., and Zhang, W.: Recent Progress in Application of Molybdenum-Based Catalysts for Epoxidation of Alkenes, Catalysts, 9, 31, https://doi.org/10.3390/catal9010031, 2019.
Shrivastava, M., Cappa, C. D., Fan, J., Goldstein, A. H., Guenther, A. B., Jimenez, J. L., Kuang, C., Laskin, A., Martin, S. T., and Ng, N. L.: Recent advances in understanding secondary organic aerosol: Implications for global climate forcing, Rev. Geophys., 55, 509–559, 2017.
Singer, B. C., Coleman, B. K., Destaillats, H., Hodgson, A. T., Lunden, M. M., Weschler, C. J. and Nazaroff, W. W.: Indoor secondary pollutants from cleaning product and air freshener use in the presence of ozone, Atmos. Environ., 40, 6696–6710, 2006.
Steinbacher, M., Zellweger, C., Schwarzenbach, B., Bugmann, S., Buchmann, B., Ordonez, C., Prévôt, A. S., and Hueglin, C.: Nitrogen oxide measurements at rural sites in Switzerland: Bias of conventional measurement techniques, J. Geophys. Res.-Atmos., 112, D11307, https://doi.org/10.1029/2006JD007971, 2007.
Thalman, R. and Volkamer, R.: Inherent calibration of a blue LED-CE-DOAS instrument to measure iodine oxide, glyoxal, methyl glyoxal, nitrogen dioxide, water vapour and aerosol extinction in open cavity mode, Atmos. Meas. Tech., 3, 1797–1814, https://doi.org/10.5194/amt-3-1797-2010, 2010.
Toby, S.: Chemiluminescence in the reactions of ozone, Chem. Rev., 84, 277–285, 1984.
USEPA: Quality assurance handbook. Reference method for determination of nitrogen dioxide in the atmosphere (chemiluminescence), Volume 2, Section 2.3., Research Triangle Park, North Carolina, USA, 2002.
Velasco, E., Lamb, B., Westberg, H., Allwine, E., Sosa, G., Arriaga-Colina, J. L., Jobson, B. T., Alexander, M. L., Prazeller, P., Knighton, W. B., Rogers, T. M., Grutter, M., Herndon, S. C., Kolb, C. E., Zavala, M., de Foy, B., Volkamer, R., Molina, L. T., and Molina, M. J.: Distribution, magnitudes, reactivities, ratios and diurnal patterns of volatile organic compounds in the Valley of Mexico during the MCMA 2002 & 2003 field campaigns, Atmos. Chem. Phys., 7, 329–353, https://doi.org/10.5194/acp-7-329-2007, 2007.
Villena, G., Bejan, I., Kurtenbach, R., Wiesen, P., and Kleffmann, J.: Development of a new Long Path Absorption Photometer (LOPAP) instrument for the sensitive detection of NO2 in the atmosphere, Atmos. Meas. Tech., 4, 1663–1676, https://doi.org/10.5194/amt-4-1663-2011, 2011.
Villena, G., Bejan, I., Kurtenbach, R., Wiesen, P., and Kleffmann, J.: Interferences of commercial NO2 instruments in the urban atmosphere and in a smog chamber, Atmos. Meas. Tech., 5, 149–159, https://doi.org/10.5194/amt-5-149-2012, 2012.
von Schneidemesser, E., Monks, P. S., and Plass-Duelmer, C.: Global comparison of VOC and CO observations in urban areas, Atmos. Environ., 44, 5053–5064, 2010.
Wehrer, P., Libs, S., and Hilaire, L.: Isomerization of alkanes and alkenes on molybdenum oxides, Appl. Catal. A-Gen., 238, 69–84, 2003.
Weschler, C. J. and Carslaw, N.: Indoor chemistry, Environ. Sci. Technol, 52, 2419–2428, 2018.
Wiesen, P.: Photooxidant Studies Using the European Photoreactor EUPHORE, Springer-Verlag, Berlin, Heidelberg, Germany, 155–162, 2001.
Yeoman, A. M., Shaw, M., Carslaw, N., Murrells, T., Passant, N., and Lewis, A. C.: Simplified speciation and atmospheric volatile organic compounds emission rates from non-aerosol personal care products, Indoor Air, 30, 459–472, https://doi.org/10.1111/ina.12652, 2020.
Young, C. J., Zhou, S., Siegel, J. A., and Kahan, T. F.: Illuminating the dark side of indoor oxidants, Environ. Sci.-Proc. Imp., 21, 1229–1239, 2019.
Zádor, J., Wagner, V., Wirtz, K., and Pilling, M. J.: Quantitative assessment of uncertainties for a model of tropospheric ethene oxidation using the European Photoreactor (EUPHORE), Atmos. Environ., 39, 2805–2817, 2005.
Zhou, S., Young, C. J., VandenBoer, T. C., and Kahan, T. F.: Role of location, season, occupant activity, and chemistry in indoor ozone and nitrogen oxide mixing ratios, Environ. Sci. Proc. Imp., 21, 1374–1383, 2019.