the Creative Commons Attribution 4.0 License.
the Creative Commons Attribution 4.0 License.
 | 24 Nov 2020
Correction of a lunar-irradiance model for aerosol optical depth retrieval and comparison with a star photometer
Ramiro González
Carlos Toledano
África Barreto
Daniel Pérez-Ramírez
Jose A. Benavent-Oltra
Francisco J. Olmo
Victoria E. Cachorro
Lucas Alados-Arboledas
Ángel M. de Frutos
The emergence of Moon photometers is allowing measurements of lunar irradiance over the world and increasing the potential to derive aerosol optical depth (AOD) at night-time, which is very important in polar areas. Actually, new photometers implement the latest technological advances that permit lunar-irradiance measurements together with classical Sun photometry measurements. However, a proper use of these instruments for AOD retrieval requires accurate time-dependent knowledge of the extraterrestrial lunar irradiance over time due to its fast change throughout the Moon's cycle. This paper uses the RIMO (ROLO Implementation for Moon's Observation) model (an implementation of the ROLO – RObotic Lunar Observatory – model) to estimate the AOD at night-time assuming that the calibration of the solar channels can be transferred to the Moon by a vicarious method. However, the obtained AOD values using a Cimel CE318-T Sun–sky–Moon photometer for 98 pristine nights with low and stable AOD at the Izaña Observatory (Tenerife, Spain) are not in agreement with the expected (low and stable) AOD values estimated by linear interpolations from daytime values obtained during the previous evening and the following morning. Actually, AOD calculated using RIMO shows negative values and with a marked cycle dependent on the optical air mass. The differences between the AOD obtained using RIMO and the expected values are assumed to be associated with inaccuracies in the RIMO model, and these differences are used to calculate the RIMO correction factor (RCF). The RCF is a proposed correction factor that, multiplied by the RIMO value, gives an effective extraterrestrial lunar irradiance that provides AOD closer to the expected values. The RCF varies with the Moon phase angle (MPA) and with wavelength, ranging from 1.01 to 1.14, which reveals an overall underestimation of RIMO compared to the lunar irradiance. These obtained RCF values are modelled for each photometer wavelength to a second-order polynomial as a function of MPA. The AOD derived by this proposed method is compared with the independent AOD measurements obtained by a star photometer at Granada (Spain) for 2 years. The mean of the Moon–star AOD differences is between −0.015 and −0.005, and the standard deviation (SD) is between 0.03 and 0.04 (which is reduced to about 0.01 if 1 month of data affected by instrumental issues is not included in the analysis) for 440, 500, 675, and 870 nm; however, for 380 nm, the mean and standard deviation of these differences are higher. The Moon–star AOD differences are also analysed as a function of MPA, showing no significant dependence.
- Article
(4600 KB) - Full-text XML
- BibTeX
- EndNote


Atmospheric aerosols interact with radiation by scattering and absorption mechanisms and with clouds mainly by acting as cloud condensation nuclei, which modify the cloud properties like cloud lifetime or droplet size (Boucher et al., 2013). These issues make the aerosol direct and indirect effects play a crucial role in the Earth's energy budget, its impact still being subject to large uncertainties (IPCC, 2014) due to the large aerosol diversity in size, chemical composition, or spatial distribution. These current uncertainties in climate models point out the need to monitor aerosol properties and motivate the study of their interaction mechanisms with the Earth–Atmosphere system (Myhre et al., 2013). In addition, the impact of aerosols is important in several fields, such as air quality and human health (Davidson et al., 2005), marine and land ecosystems (Koren et al., 2006; Ravelo-Pérez et al., 2016), primary productivity (Jickells et al., 2005), precipitation (Twomey, 1977; Stevens and Feingold, 2009), solar-energy production (Neher et al., 2017), or air traffic (Flentje et al., 2010), among others.
Most of the aerosol studies focused on the role of aerosol in the field of climate change are based on daytime measurements. However, the knowledge of aerosol properties at night-time is also important, especially in polar areas, where a lack of aerosol observations over winter still exists (Herber et al., 2002; Mazzola et al., 2012; Graßl and Ritter, 2019). In addition, a large fraction of aerosols at night-time remains in the residual layer, which may even act as a source for aerosol formation into the boundary layer the next day (Sun et al., 2013; Liu et al., 2020). Moreover, the lack of ultraviolet (UV) radiation at night-time should reduce the events of new-particle formation at night since it is reported that solar UV radiation helps to induce some nucleation events (Petäjä et al., 2009). Moreover, the aerosols at night-time can profoundly modify the longwave balance by means of the change in cloud properties, such as cloud lifetime, and the impact on the longwave radiation absorbed by clouds, which is back-emitted to the Earth’s surface (Ramanathan et al., 1989; Boucher et al., 2013).
Two of the most important and used aerosol properties in climate change studies and modelling are the aerosol optical depth (AOD), which represents the light extinction in the atmospheric column caused by aerosols, and the so-called Ångström exponent (AE; Angström, 1961), which quantifies the AOD spectral variation. These two parameters provide information about the aerosol load and the particle size predominance, respectively. Moreover, AOD values are useful to estimate other aerosol properties in combination with other measurements (e.g. sky radiance and lidar signal) or even without them (Lopatin et al., 2013; Torres et al., 2017; Román et al., 2017, 2018; Benavent-Oltra et al., 2019). However, ground-based AOD values are usually obtained by solar-radiation-extinction measurements. In situ instrumentation is useful to obtain aerosol properties at night-time, but they are usually representative only of the aerosol at ground level, with the exception of airborne in situ measurements (e.g. Remer et al., 1997). Some remote-sensing techniques used to derive the aerosol properties at night-time are the Raman lidar systems (Ansmann et al., 1990), which provide AOD but also vertically resolved extinction profiles, and the star photometers, which derive the AOD from star light extinction measurements (Pérez-Ramírez et al., 2008a; Baibakov et al., 2015). The availability of star photometers is very scarce, with approximately only five star photometers existing at present in the world operating for aerosol monitoring (Barreto et al., 2019). Recent technical advances allow accurate measurements of direct lunar irradiance (Berkoff et al., 2011; Barreto et al., 2013); therefore the emerging Moon photometry technique appears to be a plausible and operative alternative for AOD calculation at night-time. One disadvantage of Moon photometry is that lunar irradiance is only recorded from the first to third Moon quarter, which implies a lack of data during half of the Moon cycle.
Some Moon photometers are capable of taking measurements of solar and lunar direct irradiances, like the CE318-T Sun–sky–Moon photometer (Cimel Electronique S.A.S.), which is the standard instrument in AERONET (AErosol RObotic NETwork; Holben et al., 1998). This fact allows the well-established calibration of the solar channels in the AERONET protocols to be transferred to the Moon (Barreto et al., 2016; Li et al., 2016). The main difference between Sun and Moon photometry is that the extraterrestrial lunar irradiance quickly varies even in the course of one night, while the extraterrestrial solar irradiance is more stable, with a smooth variation over the year. This demonstrates the need for knowledge of accurate extraterrestrial lunar-irradiance values and their temporal variations. To this end, some models are used, ROLO (RObotic Lunar Observatory, Kieffer and Stone, 2005) being the most widely used in the literature. Here we make use of one implementation of the ROLO named RIMO (ROLO Implementation for Moon's Observation; Barreto et al., 2019). The irradiance from these models is usually assumed as true for the AOD calculation; however different authors reported some uncertainties and biases in these models (e.g.Viticchie et al., 2013; Lacherade et al., 2014; Barreto et al., 2017; Geogdzhayev and Marshak, 2018).
In this framework, the main objective of this work is to evaluate the RIMO accuracy from the differences between the expected AOD in a pristine environment (where AOD is assumed to be low and stable) and the AOD derived by the RIMO with the CE318-T in the same place. The purpose behind this evaluation is to find a correction of the RIMO model that provides an effective lunar extraterrestrial irradiance, which will be assumed as true, useful at least to derive accurate AOD values in the CE318-T bands using the operative Sun–Moon calibration transfer technique. In addition, this paper aims to study the performance of the AOD obtained with Moon photometry using the proposed RIMO correction through a comparison with the AOD from a star photometer.
This paper is structured as follows: Sect. 2 introduces the sites and instrumentation used in this paper; Sect. 3 presents the development of the proposed correction to the RIMO lunar-irradiance model, while the comparison of the AOD derived using this correction and the one obtained by a star photometer is shown in Sect. 4. Finally, Sect. 5 summarizes the main conclusions of this work.
2.1 Sites
The RIMO correction proposed in this paper is based on photometer data recorded at the Izaña Meteorological Observatory (IZO; 28.309∘ N, 16.499∘ W; 2401 m a.s.l.) in the Canary Islands (Tenerife, Spain), which is managed by the Spanish Meteorological Agency (AEMET). This high-mountain observatory is representative most of the time of the subtropical free troposphere over the North Atlantic because of its location in the descending branch of the Hadley cell (Rodríguez et al., 2009; Cuevas et al., 2019). Pristine skies, dry atmospheric conditions, and atmospheric stability prevail throughout the year as a consequence of the quasi‐permanent temperature inversion layer, normally located below the altitude of Izaña. This situation prevents the vertical transport of anthropogenic pollution from lower levels (Rodríguez et al., 2009).
In terms of AOD, pristine conditions are prevalent in this station, with AOD at 500 nm below 0.1 and AE above 0.6 (Guirado-Fuentes, 2015). Relatively high-AOD conditions due to the Saharan dust transport from North Africa sources to the Atlantic Ocean above the trade wind inversion are prevalent in summer (Basart et al., 2009; Rodríguez et al., 2011), typically associated with the presence of coarse particles (AE below 0.25) and AOD at 500 nm above 0.1 (Basart et al., 2009; García et al., 2012; Guirado-Fuentes, 2015). These privileged conditions make Izaña Observatory a suitable place for calibration and validation activities (Toledano et al., 2018). Notwithstanding, Izaña is a calibration site for the GAW-PFR (Global Atmosphere Watch precision-filter radiometer) and AERONET networks (Cuevas et al., 2019), holding a comprehensive measurement programme for atmospheric composition monitoring and designated by the WMO (World Meteorological Organization) as a CIMO (Commission for Instruments and Methods of Observation) test bed for aerosols and water vapour remote-sensing instruments (WMO, 2014). More details about monitoring programmes at Izaña can be found in Cuevas et al. (2017).
The star photometer measurements of this paper were carried out at the University of Granada (UGR) experimental station, which is the main station of the three belonging to AGORA (Andalusian Global ObseRvatory of the Atmosphere). This station is located at the Andalusian Institute for Earth System Research (IISTA-CEAMA; 37.164∘ N, 3.605∘ W; 680 m a.s.l.). The UGR station operates many remote-sensing instruments in the framework of the ACTRIS (Aerosols, Clouds and Trace Gases; https://www.actris.eu/default.aspx, last access: 17 November 2020) infrastructure, the star photometry data at UGR being the only available of this type in ACTRIS. The UGR experimental site is located in the city of Granada (Spain), which is a medium-size city (535 000 inhabitants in the metropolitan area) in south-eastern Spain. The region presents a continental Mediterranean climate, and the city is located in a natural basin surrounded by the Sierra Nevada mountains (up to 3500 m a.s.l.). The city experiences a seasonal evolution of columnar aerosol types, with larger AOD in summer and lower values in winter, while the opposite occurs for AE (e.g. Alados-Arboledas et al., 2003; Pérez-Ramírez et al., 2012a). The seasonal cycle in columnar-aerosol properties is mostly associated with the air mass pattern (Pérez-Ramírez et al., 2016) dominated by the more frequent and intense arrival of Saharan dust during summer (e.g. Lyamani et al., 2006; Valenzuela et al., 2012; Antón et al., 2012; Román et al., 2013; Benavent-Oltra et al., 2017). Anthropogenic aerosol sources in the region are mainly domestic heating and traffic (Lyamani et al., 2010; Titos et al., 2012). Nevertheless, the region experiences long periods of air mass stagnations in winter that increase their pollution levels to values compared with other European megacities (e.g. Casquero-Vera et al., 2019).
2.2 Instrumentation
The Sun–sky–Moon CE318-T photometer (Cimel Electronique S.A.S.) is used in this work to derive AOD at daytime and night-time. This photometer is mounted on a two-axis robot, and a tracking system allows measurements of direct solar and lunar irradiance and diffuse sky radiance at different geometries. The photometer head is mainly formed by a collimator, a filter wheel (with narrow interference filters), and two detectors. The usual nominal wavelengths of the photometer filters are 340, 380, 440, 500, 675, 870, 935, 1020, and 1640 nm. The detectors are a silicon sensor to measure the wavelengths of 1020 nm and shorter and an InGaAs sensor to measure the wavelengths equal to or longer than 1020 nm; hence 1020 nm is measured by both detectors. Sky radiance at solar aureole and direct Moon irradiance are measured with the same detectors used to measure direct solar irradiance but with an electronic amplification factor (gain) of 128 and 4096, respectively; the sky measurements out of the solar aureole are recorded with the same gain as Moon observations.
The CE318-T photometer (and older versions without the capability to observe the Moon) is the standard instrument in AERONET. The photometers used in this paper belong to AERONET, no. 933 being a reference photometer operated at Izaña, and the photometers no. 918 (from 16 March 2016 to 25 July 2016), no. 751 (from 25 July 2016 to 26 May 2017), and no. 788 (from 25 May 2017 to 11 October 2017) the ones operated at the UGR station. These photometers were regularly calibrated following the AERONET protocols (Holben et al., 1998; Giles et al., 2019).
The star photometer EXCALIBUR (EXtinction CAmera and LumInance BackgroUnd Register; Astronómica S.L.) operated at the UGR station continuously from 2006 to 2011 and has been operated during special field campaigns since 2013. A detailed description of the star photometer EXCALIBUR can be found in Pérez-Ramírez et al. (2008a, b). A brief overview is provided here. The largest innovation of the star photometer EXCALIBUR is the use of a charge-coupled device (CCD) camera as a detector attached to a commercial telescope of 30 cm diameter. A filter wheel permits the allocation of 10 interference filters cantered at 380, 436, 500, 532, 670, 880, and 1020 nm for aerosol studies, and an additional filter at 940 nm for precipitable-water-vapour measurement. In this work the 380, 436, 500, 670, and 880 nm channels are used. The one at 1020 nm could not be used due to technical problems. AOD in these spectral bands is compared to the AOD at 440, 500, 675 and 870 nm of the CE318-T photometer; the central wavelengths of these bands are close enough (below 10 nm difference) to allow a direct comparison of measured AOD and avoid interpolated data. If AOD of the CE318-T is interpolated to match the star photometer bands, the comparison does not significantly change (in general AOD differences below 0.001). The AOD is computed from direct star irradiance using the one-star method, which is the same approach used for Sun photometry. The one-star method needs only a relative calibration of the instrument but requires a first calibration for the entire set of stars used (Pérez-Ramírez et al., 2011). Nevertheless, a first calibration of the stars (isolated and stable stars) is enough as the recalibration of the instruments consists only of computing wavelength-dependent calibration factors that are the same for all the stars. Star photometer EXCALIBUR is able to provide measurements for all filters in approximately 1–2 min, but to minimize the effects of atmospheric turbulence, data were averaged every 30 min (Pérez-Ramírez et al., 2011). A procedure based on moving averages, an outlier removal is used for cloud-screening and data quality check (Pérez-Ramírez et al., 2012n). In addition, a visual inspection of data has been carried out to remove spurious data. Final uncertainties in AOD are 0.02 for wavelengths below 800 nm and 0.01 for wavelengths above 800 nm (Pérez-Ramírez et al., 2011). Other authors reported a higher uncertainty in AOD from star photometry, about 0.02–0.03 (Baibakov et al., 2015; Barreto et al., 2019). The analysed period in this work is for coincident measurements of star and Moon photometers and can be divided in two periods in the framework of the SLOPE (Sierra Nevada Lidar AerOsol Profiling Experiment) I and II field campaigns (de Arruda Moreira et al., 2018; Bedoya-Velásquez et al., 2018; Casquero-Vera et al., 2020): from 25 May 2016 to 17 September 2016 and from 1 July 2017 to 17 October 2017. Just before the second measurement period, EXCALIBUR was measuring at Izaña in the first multi-instrument nocturnal intercomparison campaign (Barreto et al., 2019).
2.3 Data management
The University of Valladolid (UVa; Spain) has been in charge of one AERONET calibration centre since 2006, and, in this framework, the UVa staff developed the CÆLIS software tool (Fuertes et al., 2018) with the aim of managing the data generated by AERONET photometers and for calibration and quality control purposes. This tool contains relevant information about the different photometers, like the spectral response of the filters or the signal temperature correction coefficients, and also includes climatology tables of different atmospheric variables (like pressure or the abundance of several absorption gases) useful to perform the atmospheric correction in the AOD calculation. An AOD calculation algorithm has recently been implemented in CÆLIS (González et al., 2020). Therefore, the daytime and night-time AOD data from the CE318-T measurements used in this work have been obtained from CÆLIS.
A main advantage of Sun photometry is that the measured irradiance is directly emitted by the Sun, and then the solar irradiance reaching the top of the atmosphere (extraterrestrial irradiance) does not significantly change, at least throughout 1 d. The Earth–Sun distance is the main factor modulating this irradiance, causing variations of about ±3 % throughout the year. Following the Beer–Bouguer–Lambert law, the extraterrestrial signal of the instrument (rather than irradiance in physical units) is needed for AOD calculation. This can be obtained by the Langley plot method (Shaw, 1976, 1983), in which direct Sun irradiance is observed at different solar elevations in order to extrapolate the top-of-the-atmosphere signal of the instrument. Side-by-side comparison with a reference instrument is common practice in AERONET for calibration transfer in field instruments (Holben et al., 1998; Toledano et al., 2018; Giles et al., 2019; González et al., 2020). However, the Moon is not a self-illuminating body. It reflects solar radiation with exceptional stability (Kieffer and Stone, 2005). Due to the changing positioning of the Sun, Moon, and Earth, lunar irradiance at the top of the Earth’s atmosphere significantly changes with the Moon phase angle (MPA), even throughout one single night. This fact points out the need for accurate knowledge of the extraterrestrial lunar irradiance for Moon photometry purposes. In this framework, AOD from lunar-irradiance observations can be calculated following the Beer–Bouguer–Lambert law as follows (Barreto et al., 2013):
where τa and κM are the AOD and the Moon calibration coefficient, respectively, for a nominal λ wavelength; and VM are the extraterrestrial lunar1 irradiance and the photometer lunar signal at the same nominal λ wavelength, respectively; and ma, mR, and mg are the optical air mass for aerosols, Rayleigh scattering, and gaseous absorption, respectively, using the Moon zenith angle (MZA) instead of solar zenith angle (SZA). Finally, τR and τg represent the optical depth of Rayleigh scattering and gaseous absorption, respectively. More details about these calculations in CÆLIS can be found in González et al. (2020).
3.1 Extraterrestrial lunar irradiance
As already mentioned, the knowledge of the extraterrestrial lunar irradiance is necessary in Moon photometry. To this end, the RIMO model has been implemented in CÆLIS. RIMO (http://testbed.aemet.es/rimoapp, last access: 17 November 2020), which is described in detail in Barreto et al. (2019), is an implementation of the ROLO model (Kieffer and Stone, 2005), which is mainly based on empirical relationships between the lunar irradiance measured at 32 channels by two CCD devices, both mounted in a telescope, and the different geometrical factors of the Moon–observer positions. RIMO firstly calculates the reflectance of the Moon's disk following the next equation (Eq. 12 in Barreto et al., 2019):
where A is the Moon's reflectance at one of the 32 wavelengths k of the ROLO model; the a, b, c, d, and p values are the coefficients shown in Kieffer and Stone (2005); gr and gd are the absolute value of MPA in radians and in degrees, respectively; Φ is the selenographic longitude of the Sun (in radians); θ and ϕ are the selenographic latitude and longitude of the observer, respectively, both in degrees (Barreto et al., 2019).
The Moon's reflectance A is calculated by RIMO using Eq. (2) at the 32 ROLO wavelengths, and then each one is multiplied by a correction factor which was previously calculated by the comparison between a composite spectrum (95 % soil) of the Moon's reflectance based on Apollo 16 samples (soil and breccia) and the reflectance obtained with the Eq. (2), assuming zero libration and ∘ (see Barreto et al., 2019, for more details). The Moon's reflectance at any different wavelength is obtained by linear interpolation of the calculated A values. Finally, in order to obtain the lunar irradiance from the Moon's reflectance, some geometric factors such as the distances between the Moon, the Sun, and the observer must be taken into account as follows:
where and A are the extraterrestrial lunar irradiance and the Moon's reflectance, respectively, both at the λ wavelength; is the extraterrestrial solar irradiance at the λ wavelength, obtained from Wehrli (1985) and smoothed by a Gaussian filter of 2 nm width; ΩM is the solid angle of the Moon (6.4177E-5 sr); and DS−M and DO−M are the distances between the Sun and the Moon (in astronomical units) and between the observer and the Moon (in kilometres), respectively. These distances, the MZA, and all the geometrical angles involved in Eq. (2) are obtained from the SPICE Toolkit (http://naif.jpl.nasa.gov/naif/toolkit.html, last access: 17 November 2020; Acton Jr., 1996; Acton et al., 2018) developed by NASA’s Navigation and Ancillary Information Facility (NAIF). SPICE is run using the planetary and lunar ephemeris DE421 (Folkner et al., 2008) in addition to a planetary-constant kernel for the Moon (moon_pa_de421_1900-2050.bpc) and a lunar-frame kernel (moon_080317.tp; Seidelmann et al., 2007; Speyerer et al., 2016); the SPICE kernels pck00010.tpc and naif0011.tls are also used for other planetary and time parameters. The NAIF pinpoint tool is used to calculate the position of the observer in each station regarding the mean Earth body-fixed reference system (MOON_ME).
3.2 Gain calibration method
Once the extraterrestrial lunar irradiance is obtained from geographical and time inputs, the AOD can be calculated at night-time using Eq. (1) if the calibration coefficient κ is known. Different methods are proposed in the literature for calibration purposes (calculation of κ) since the accuracy of the Langley plot method could be affected by the fast variations in the Moon illumination. One way is the so-called Lunar Langley calibration method (Barreto et al., 2013, 2016), which is similar to a classic Langley plot calibration but where the photometer signal is divided by the extraterrestrial lunar irradiance as follows:
Under stable atmospheric conditions, κM can be obtained from the y intercept of a least-square fit between ln and the aerosol optical air mass. However, the possible errors and uncertainties in are propagated to the value of κ obtained by this method, although these uncertainties are partially masked in the AOD retrieval (Eq. 1) because the values are also used in the calculation. Recently, Barreto et al. (2017) found a dependence on MPA and MZA of the AOD calculated by this Lunar Langley method.
Another way to calculate κM without the use of is by the so-called gain calibration method (Barreto et al., 2016). This method, based on a vicarious calibration, consists of transferring the calibration of the solar channels to the respective Moon ones. Both CE318-T detectors are the same for solar- and lunar-irradiance measurements. In order to reach a higher signal range, the Moon signal is amplified, being multiplied by a gain factor, G. In fact, this factor is formed by two amplification steps, the first one being the Sun-to-solar-aureole gain (≈ 128) and the second one the solar-aureole-to-Moon gain (≈ 32). The nominal value of G is therefore equal to 4096 (212). The values of G were measured with an integrating sphere in the laboratory by Barreto et al. (2016) and Li et al. (2016). These authors found experimental values for G to differ by less than 0.3 % from the nominal value of 4096; hence, G is assumed in CÆLIS to be wavelength-independent and to have a constant value of 4096. Taking into account that the only difference between Sun and Moon measurements is this gain factor, the Sun calibration can be transferred to the Moon as follows:
where is the Sun calibration coefficient and the extraterrestrial solar irradiance (Wehrli, 1985), both at the λ wavelength. The gain calibration is simpler than the Lunar Langley method because it is not dependent on the RIMO (or another lunar-irradiance model), and it only requires the daytime calibration, which provides more operational character to this method.
3.3 RIMO correction factor
In order to evaluate the AOD obtained by the gain calibration, the method of Barreto et al. (2017) has been followed, who assumed as a reference AOD, AODref, the temporally interpolated (linear) values using the last daytime AOD value of the previous afternoon and the first AOD of the following morning, which makes sense if stable and pristine conditions were found during the night. Hence, the AOD obtained by the gain calibration, Eqs. (5) and (3) in Eq. (1), has been calculated for several nights that satisfied pristine and stable conditions to be compared against AODref. Data from the no. 933 CE318-T photometer located at IZO have been selected for this purpose since this high-elevation remote site usually presents unique atmospheric conditions with very low and stable AOD values. The morning and afternoon solar Langley plots from this photometer have been calculated, and stable conditions have been assumed when these Langley plots present more than 25 data, the AOD at 500 nm is below 0.025, and the standard deviation (SD) is below 0.006 (see Toledano et al., 2018). The nights for which the solar Langley plots of both the previous afternoon and the next morning fulfil the mentioned criteria have been selected as the “stable and pristine” nights. The AOD has been calculated for these selected nights but discarding optical air masses larger than 6 and data under MPA absolute values above 90∘. Moreover, a total of 37 cloud-contaminated nights have been manually discarded by visual inspection (nights without a smooth AOD time series) in order to guarantee the AOD quality. As a result, around 13 500 AOD data points per wavelength, corresponding to 98 pristine and stable nights from June 2014 to March 2018 at IZO, have been selected.
The differences between the AOD obtained by the gain calibration and the reference values (ΔAODG−r) have been calculated following the next equation:
where ΔτG−r, τGain, and τref are ΔAODG−r, the AOD from the gain calibration, and the interpolated AOD used for reference (AODref), respectively, for the λ wavelength. Figure 1a shows the obtained ΔAODG−r values as a function of the MPA at IZO for the 98 chosen stable nights and for all photometer channels. These differences show negative values, which is because the calculated AOD with the gain method and RIMO model is mostly below 0. A fictitious nocturnal cycle, symmetrical to the optical air mass, appears in these differences and hence in the calculated AOD with the gain method and RIMO; this kind of fictitious cycle is usually associated in Sun photometry with a deficient calibration (Cachorro et al., 2004, 2008; Guirado et al., 2014). However, in Moon photometry this cycle, as evidenced by Eq. (1), could also be caused by inaccuracies in the used values. Barreto et al. (2017) found a similar behaviour in these differences but being close to 0 for MPA ≈ 0 and increasing with the absolute phase, which could be explained by the fact that they used Lunar Langley calibration near the full Moon, and it masked the possible bias on RIMO at least close to MPA ≈ 0. Assuming the gain calibration and AODref are accurate, and all the differences between AOD and the reference are caused by RIMO inaccuracies, the ΔAODG−r can be expressed as2
where is the extraterrestrial lunar irradiance from RIMO (the one used in CÆLIS), and is the extraterrestrial lunar irradiance that provides the AODref if the gain calibration is applied, both for the λ wavelength. A correction factor that transforms RIMO irradiance into the reference irradiance, named the RIMO correction factor (RCF), is defined as the ratio between the extraterrestrial lunar irradiance assumed as a reference and that obtained by RIMO. The RCF can be derived for each λ wavelength from Eq. (7) as

Figure 1(a) Differences between AOD from gain calibration and the reference values at night as a function of Moon phase angle (MPA) for different wavelengths; (b) RIMO correction factor (RCF) against MPA for different wavelengths; (c) fitted RCF and ± its propagated uncertainty vs. MPA for different wavelengths (340 nm values are not shown because they are out of the axis limits); and (d) fitted RCF and ± its propagated uncertainty (error bars) against the nominal wavelength of each CE318-T channel, for different MPA values.
The RCF values have been calculated by Eq. (8) using the data of Fig. 1a, and they are shown in Fig. 1b. The UV channels present high dispersion, while the longer wavelengths point out a decay in RCF close to the full Moon. The other channels show less dependence on MPA, and, excluding the UV channels, the extraterrestrial lunar irradiance from RIMO underestimates the values assumed as references between 1 % and 14 % (between 3 % and 12 % for MPA absolute values between 5 and 70∘). This last result is in agreement with the differences reported by Lacherade et al. (2014), who found that ROLO underestimates around 6 %–12 % (in the same MPA range as in this paper) for wavelengths between 505 and 844 nm, using an imagery absolute calibrated system on board two Pléiades satellites for reference. Geogdzhayev and Marshak (2018) observed that ROLO underestimates, within 10 %, the irradiance at six wavelengths between 443 and 780 nm using EPIC (Earth Polychromatic Imaging Camera) images, calibrated using MODIS (Moderate Resolution Imaging Spectroradiometer) data. Viticchie et al. (2013) also found a positive bias around 15 % between Moon observations from SEVIRI (Spinning Enhanced Visible and Infrared Imager) on board the MSG2 satellite (Meteosat Second Generation) and the ROLO model at 1600 nm as well as a behaviour close to the full Moon similar to that observed in Fig. 1b for the longer wavelengths. These independent results point out that ROLO – and hence its implementation RIMO – underestimates the extraterrestrial lunar irradiance, which is in concordance with the obtained results and reinforces the hypothesis that the gain calibration method is appropriate.
Viticchie et al. (2013) and Lacherade et al. (2014) observed a dependence of the differences between ROLO and satellite observations on MPA, and these dependencies on MPA are also observed in RIMO in Fig. 1b. Uchiyama et al. (2019) used the Lunar Langley technique to observe an underestimation of the ROLO reflectance (given by Eq. 2) with an MPA dependence fitted to a quadratic equation of the absolute value of the Moon phase angle (; g = Moon phase angle) compared with the reflectance obtained with photometer measurements; however, these authors considered neither the use of the solar spectrum of Wehrli (1985), which was used by Kieffer and Stone (2005) to derive the Moon reflectance of ROLO, nor asymmetries on the phase angle dependence of ROLO reflectance correction. Considering the results reported in the literature, RCF values of Fig. 1b have been fitted by a least-square method to a second-order polynomial as a function of MPA:
where g is the MPA, and a, b, and c are the fitting coefficients at λ wavelength. The obtained coefficients are shown in Table 1 for the different wavelengths. The uncertainty of the a coefficient is for 340 nm, for 380 nm, and for the other channels; this uncertainty of b is rad−1 for 340 nm; rad−1 for 380 nm; rad−1 for 440, 675, and 1020 (InGaAs) nm channels; and rad−1 for the rest. In the case c the uncertainty is rad−2 for 340 nm, rad−2 for 380 nm, rad−2 for 440 nm and 1020 (InGaAs), and rad−2 for the other channels. This uncertainty has been calculated by the propagation of the uncertainty of τGain (assumed as 0.02 as a conservative value; Barreto et al., 2016) and τref (assumed as 0.02 for the UV channels and 0.01 for the others) of Eq. (6).
Table 1Fitting coefficients of the RIMO correction factor (Eq. 8), the number of data used (N), and median (MD) and standard deviation (SD) of the residuals in the RIMO correction factor (RCF) and aerosol optical depth (AOD) for different photometer wavelengths. The fitting values at 340 nm have been obtained without MPA absolute values above 55∘.

The RCF values produced by the retrieved coefficients are also shown in Fig. 1c, indicating RCF values between 1.03 and 1.14 for all MPA ranges except for the UV channel, for which the fit indicates much larger dependence on MPA. The coefficients for the 340 nm channel have been calculated only using data with MPA absolute values lower or equal to 55∘ since the AOD at 340 nm is too noisy due to the low lunar signal, especially far from the full Moon. The discrepancies in the RCF value for 1020 nm between silicon and InGaAs (1020i) channels (see Fig. 1b) are also marked in the fitting coefficients, which point out an RCF overestimation of InGaAs over silicon around 0.03. The median (MD) and standard deviation (SD) of the RCF fitting residuals (RCFresid) are also in Table 1, showing the worst fit for UV channels followed by 440 nm and the InGaAs channels; the InGaAs channels present a median and standard deviation in the RCF residuals of around −0.001 and 0.013, respectively, which could explain part of the mentioned discrepancies between the RCF values at 1020 nm in both silicon and InGaAs channels. On the other hand, the lowest deviation (around 0.01) is reached for 675, 870, and 935 nm. The uncertainty of RCF caused by the uncertainty of the coefficients is also shown in Fig. 1c. This uncertainty increases with MPA and is in general low except for the UV channels. Figure 1d shows the RCF values as a function of the nominal wavelengths of the photometer channels and for a set of MPA values. The uncertainty of the RCF increases with MPA as observed in Fig. 1c. Regarding the variation in RCF with wavelength, it is similar for the different MPA values, always being larger for negative MPA values than for positive ones, except for the 1020 nm channel. The RCF strongly decreases from 340 to 440 nm, while from 440 to 935 nm the variation is smoother, increasing from 440 to 675 nm and decreasing from 675 to 935 nm. This result could lead us to think that RCF can be calculated for other wavelengths by interpolation. However, the spectral variation in RCF is unknown, and smooth or linear behaviour cannot be assumed. RIMO lunar reflectance values are calculated at 32 spectral bands, which are interpolated to the other wavelengths; the accuracy of RIMO could drastically vary between two different RIMO bands. Therefore, the interpolation of RCF to other bands is not recommended or at least must be taken with care. The spectral uncertainty and accuracy of RCF are not known out of the CE318-T spectral bands.
Unifying Eqs. (1), (3), (5), and (9) with the coefficients of Table 1, the AOD can be calculated using the gain calibration method as
which is the final way used by CÆLIS to derive AOD at night-time, adding the RCF values and using the gain method to transfer Sun-to-Moon calibration. It is important to remark that this AOD retrieval is based on the assumption of linear behaviour of the instrument with respect to the measured irradiance, but this assumption is reasonable as observed by Taylor et al. (2018), who found that non-linearity can be considered negligible for the CE318-T instrument at Moon irradiance levels.
Finally, in order to see how the residuals in the RCF fitting are propagated to the AOD, the median and standard deviation of the residuals between the AOD from Eq. (10) and the AODref in the 98 chosen stable nights (used in the RCF fitting) are calculated and shown in Table 1. The highest AOD deviation appears for the UV channels, especially for 340 nm (even taking into account that MPA absolute values above 55∘ have been discarded), being about 0.12. The AOD deviations are below 0.01 for all channels above 400 nm, the highest being for 440 nm and the InGaAs channels (1020i and 1640 nm). As in RCF residuals, the lowest deviations are found in the 675, 870, and 935 nm channels. These results point out that the 340 nm channel (at least for MPA absolute values above 55∘) and possibly 380 nm should not be used due to the high dispersion, which is caused by the low signal-to-noise ratio of these channels. In addition, the AOD from the InGaAs channels should be used carefully since they present the highest deviation (apart from the UV channels). An example of the AOD at night-time obtained by the proposed method using CÆLIS is shown in Fig. 8 of González et al. (2020), where the AOD continuity from day to night-time can be appreciated for different sites and MPA values.
In order to evaluate the performance of the AOD calculated by the method developed in Sect. 3, the AOD from a Moon photometer has been compared with the AOD measured by a star photometer. To this end, the AOD from the different Moon photometers at the UGR station in 2016–2017 has been obtained from CÆLIS. These AOD data have been previously cloud-screened using the criteria explained in González et al. (2020), who use a similar cloud-screening as that at daytime by Giles et al. (2019). The applied criteria are mainly based on: the recorded signal must be higher than a threshold value in some infrared channel (to guarantee the Moon is correctly pointed at), the AOD variation in a triplet observation must be below a threshold, and the temporal variation in AOD at 500 nm must be smooth (below 0.01 per minute), among others. The AOD negative values – or those below an established threshold – have not been discarded in this work since these kinds of criteria are usually based on a threshold marked by the AOD uncertainty, but in this case the uncertainty is still not well known. Finally the cloud-free AOD values from the Moon photometer have been averaged in 30 min intervals for comparison purposes with the star photometer outputs, which are 30 min averaged values (see Sect. 2.2).
Figure 2 shows AODs and AEs for daytime and night-time for the Moon cycle (first to third quarter) in July 2016. Data presented are from Sun photometry (daytime) and Moon and star photometry (night-time). Moon phase angle values are also provided. Generally good day-to-night continuity is observed for different aerosol loads and MPA values. However AOD at 380 nm from Moon observations looks noisier, reaching high (low) values at the beginning (end) of the night (similar to a daytime calibration problem) for the lowest MPA values. The data period shown includes different aerosol episodes, such as Saharan desert dust outbreaks during 18–19 and 20–21 July 2016 (both events studied by Benavent-Oltra et al., 2019 and Román et al., 2018); the presence of these coarse particles leads to a reduction in the AE values (calculated only if the four wavelengths between 440 and 870 nm are available), which is also shown in Fig. 2. The AE from Moon observations fits well between daytime and night-time even near the Moon quarters, but AE from star measurements presents more fluctuation, especially from 22 to 24 July 2016. These results point out the goodness of the AOD from Moon observations, except at 380 nm, which is not used for AE calculations; however, the fluctuations in AE from the star photometer could indicate some extra uncertainties or measurement issues in some channels.
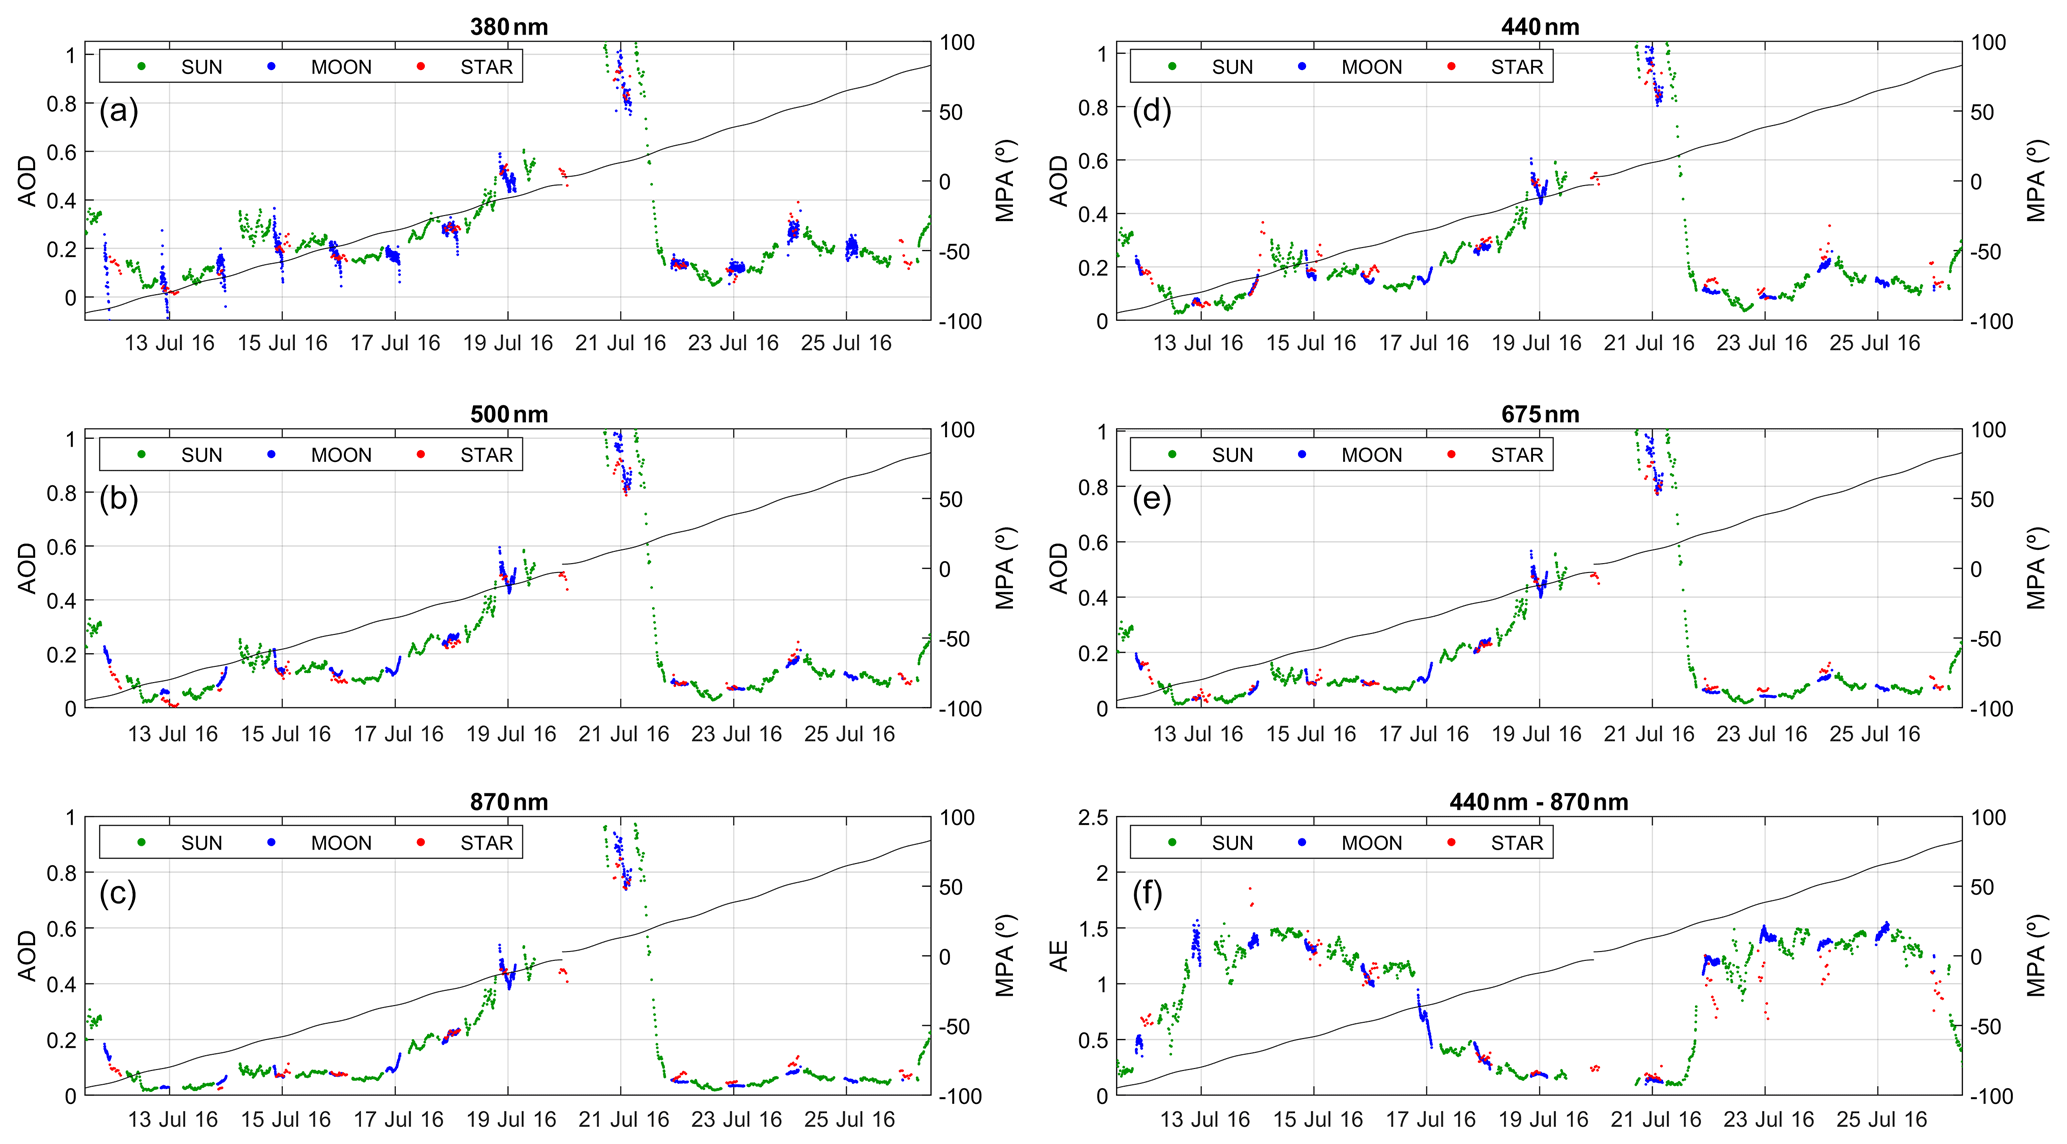
Figure 2Aerosol optical depth (AOD) values from the Sun, Moon, and star photometer at Granada (Spain) from the first to third Moon quarters in July 2016. Panel (f) shows the Ångström exponent (AE) calculated with the wavelengths of 440, 500, 675 and 870 nm (436, 500, 670, and 880 nm for the star photometer). Moon phase angle (MPA) is represented with a black line in each panel.
Figure 3 shows 1:1 comparisons of Moon photometer AODs and AE versus star photometer values for all data acquired during the intensive field campaigns. All channels show correlation between both AOD data sources, the correlation coefficient (shown in Table 2) being higher than 0.96 (0.97 if only 2016 is considered) except for 380 nm, which presents a lower value around 0.71. Table 2 also shows the slope and y intercept of the linear fits shown in Fig. 3, both ranging from 0.975 (440 nm) to 1.038 (870 nm) and from −0.012 (870 nm) to −0.004 (500 nm), respectively, for the wavelengths between 440 and 870 nm; these results reveal that the obtained fitted lines are close to the 1:1 line. Table 2 also shows the mentioned statistical estimators calculated using only data of 2016 or 2017 separately. For the wavelengths between 440 and 870 nm, the correlation decreases to about 0.94, and the linear fits are farther than the 1:1 line for 2017. This worse relationship between both instruments in 2017 could be caused by some technical problems observed in the star photometer in 2017 after the participation of the instrument in the first multi-instrument nocturnal intercomparison campaign (Barreto et al., 2019) at Izaña, likely linked to the transport of the instrument from Granada to Izaña and vice versa. In the case of 380 nm, this channel presents higher agreement in 2017 than in 2016 due to the large number of negative values of AOD from Moon observations registered in August and September 2016, especially during periods close to the Moon quarters. The AOD data in both of these months were derived from measurements recorded by the no. 751 photometer; AOD from this photometer also showed this behaviour for 380 nm for all the periods of measurements at Granada in 2016 and 2017 (even out of SLOPE campaigns). These values are not cloud-screened because the removal of negative AOD values is not included in the screening algorithm. These negative values are the main cause of the shifted linear fit shown in Fig. 3 for 380 nm. This plot, however, shows that there are many data points of AOD (380 nm) close to the 1:1 line. In fact, if the agreement in the 380 nm channel is recalculated without the 2 mentioned months, the r coefficient, y intercept, and slope are 0.94, −0.03, and 0.97, respectively, using 309 data totally. The behaviour in the agreement of the other channels also shows a little improvement, but in this case it is due to some negative AOD values acquired in August 2016 from the star photometer (although within the uncertainties). The same statistical analysis has been done for the AE, showing worse agreement than the AOD. The AE agreement improves if the 2 troublesome months in 2016 are not included in the analyses. Actually, the improved analysis presents a correlation coefficient of 0.79, slope of 0.85, and y intercept of 0.20. However, removing the most problematic periods, the AE values do not show as good agreement between both instruments as for the AOD, probably because individual deviations in AOD affect AE computations, which is particularly critical for low AOD (Cachorro et al., 2008).
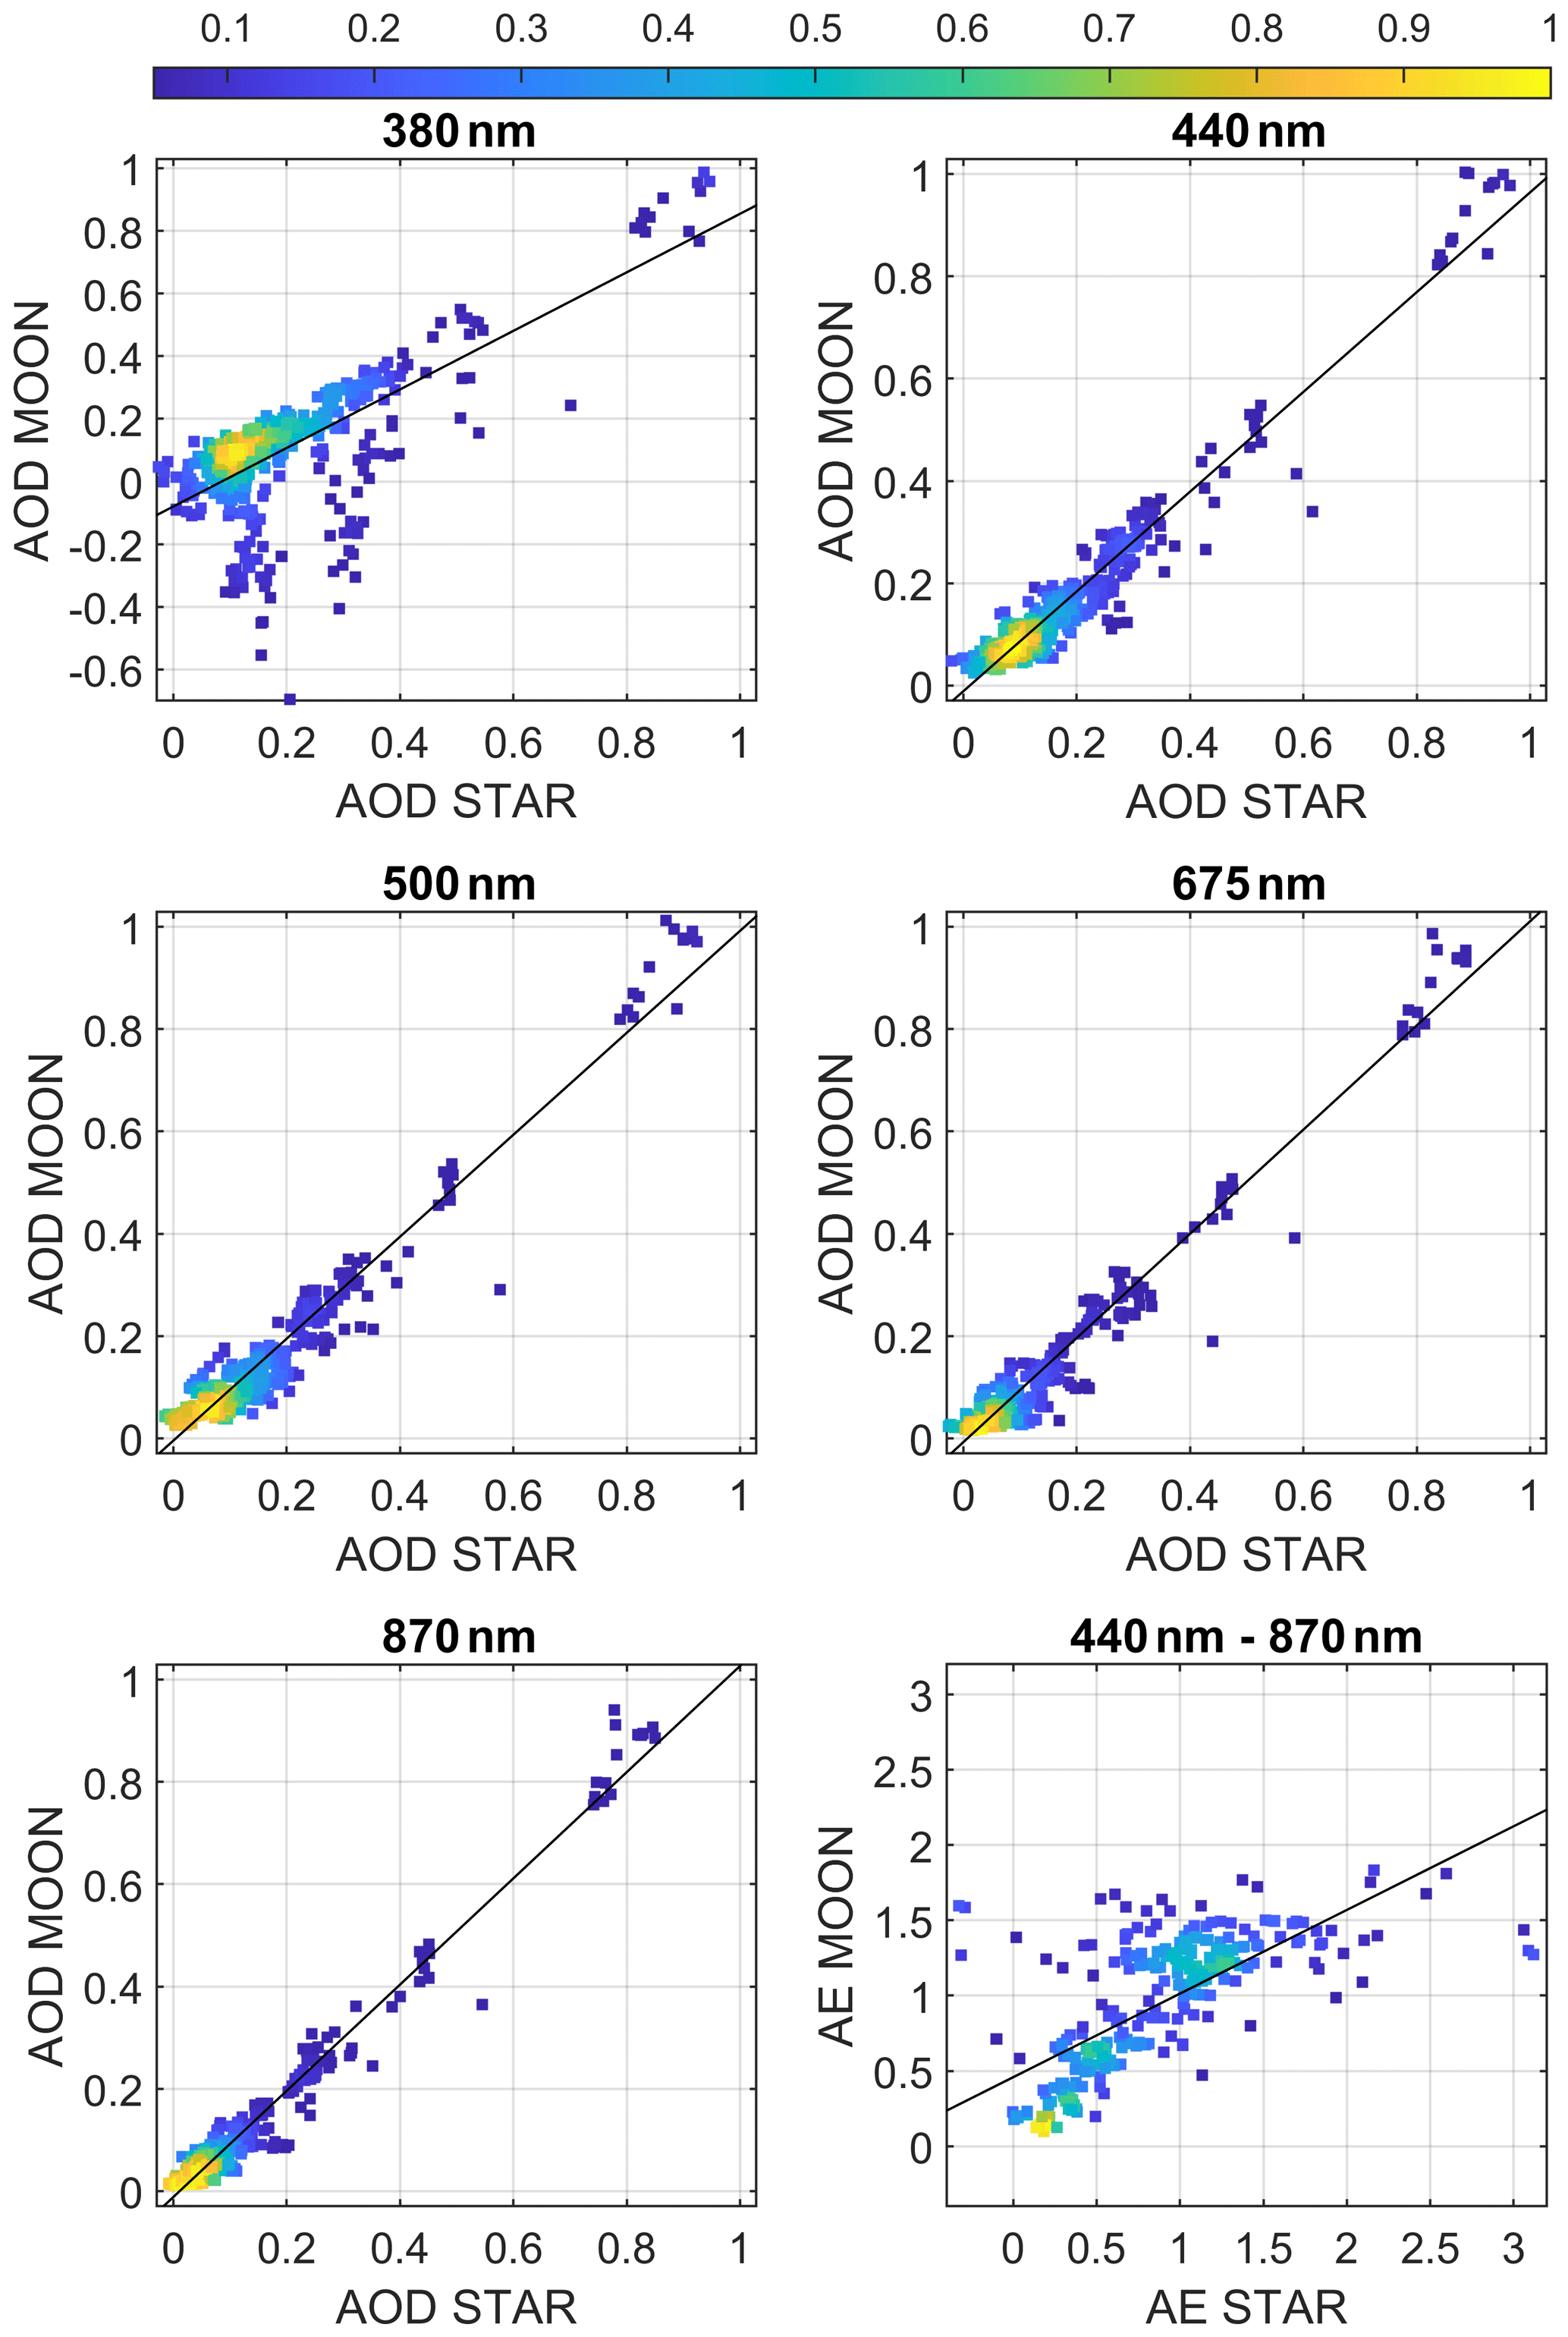
Figure 3Aerosol optical depth (AOD) and Ångström exponent (AE) from the Moon photometer versus the AOD and AE from the star photometer for the 2016–2017 period and for different wavelengths. The colour legend represents the relative density of data points. Black lines indicate linear fit to the data.
Table 2Statistical estimators of the differences between the aerosol optical depth (AOD) from the Moon and star photometers for different wavelengths and periods. N is the number of data used; M, MD, and SD represents the mean, median, and standard deviation of these differences, respectively; y0, slp, and r are the y intercept, slope, and correlation coefficient from the linear fit between the AOD from the Moon and star photometers. These estimators are also presented for the Ångström exponent (AE) in the 440–870 nm range.
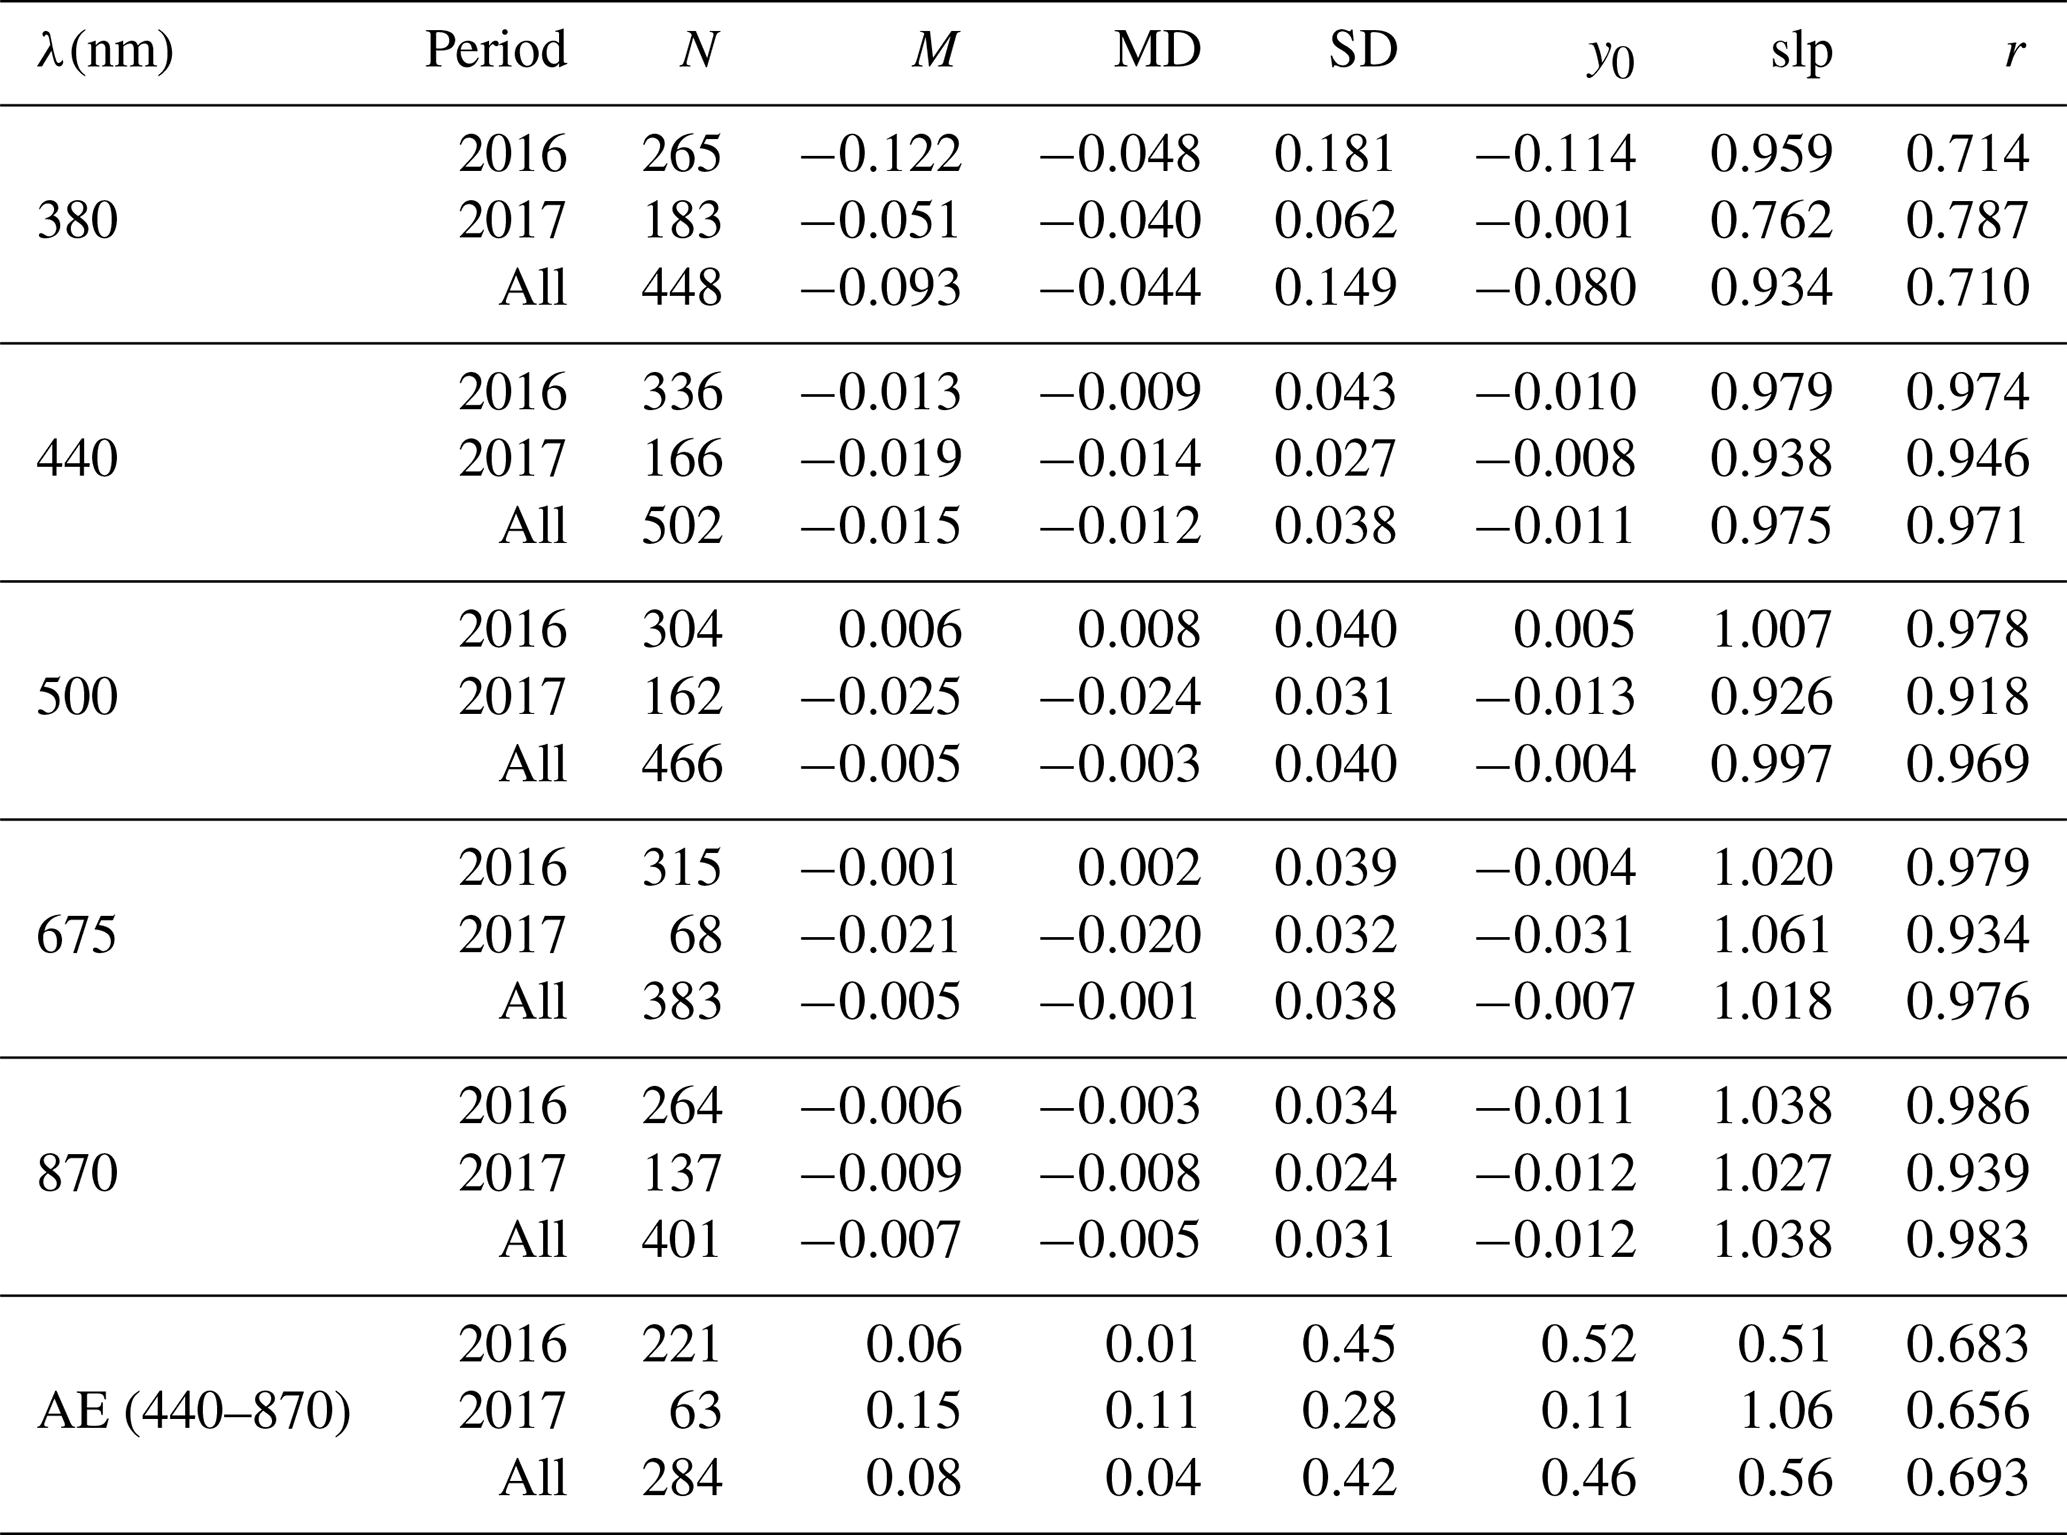
In order to quantify the discrepancies between the AOD retrieved by Moon and star photometers, Fig. 4 shows frequency histograms of relative differences in AOD, using the star photometer for reference. Figure 4 reveals that in general the differences are centred around zero and normally distributed. The influence of the negative AOD at 380 nm from Moon observations can be observed in the negative tail shown by the differences in this channel distribution. The percentage of AOD absolute difference values below 0.02 are 27 %, 47 %, 45 %, 57 %, and 63 % for 380, 440, 500, 675, and 870 nm, respectively; these percentages rise up to 46 %, 65 %, 63 %, 69 %, and 75 % for differences below 0.03. Table 2 shows the mean, median, and standard deviation of the differences given in Fig. 4. For the wavelengths between 440 and 870 nm, the mean and median of the differences are close to zero, the absolute value being below 0.01 except for 440 nm, where the median in all measurement periods is −0.012. These results point out that, for these wavelengths, there is no significant under- or overestimation of AOD from the Moon compared to the star photometer, except a very small underestimation of about 0.01 at 440 nm (within the uncertainty). The standard deviation, associated with the uncertainty, shows values about 0.04 for 440 to 675 nm and 0.03 for 870 nm; these values are reduced by around 0.01 if they are calculated only with data from 2017, which can be due to the influence of the mentioned AOD values in August 2016. If this month is removed from the dataset, then all the mentioned standard deviations go down to 0.03. The mean, median, and standard deviation of the differences in the 380 nm channel are high but significantly lower for 2017, likely due to the impact of negative AOD values from Moon observations obtained in the period August–September 2016. The median and standard deviation are −0.03 and 0.06 when this period is removed. Regarding AE differences, the mean and median are below 0.10 for all data, indicating a lack of significant over- or underestimation, but the standard deviation is around 0.4, revealing a high dispersion.
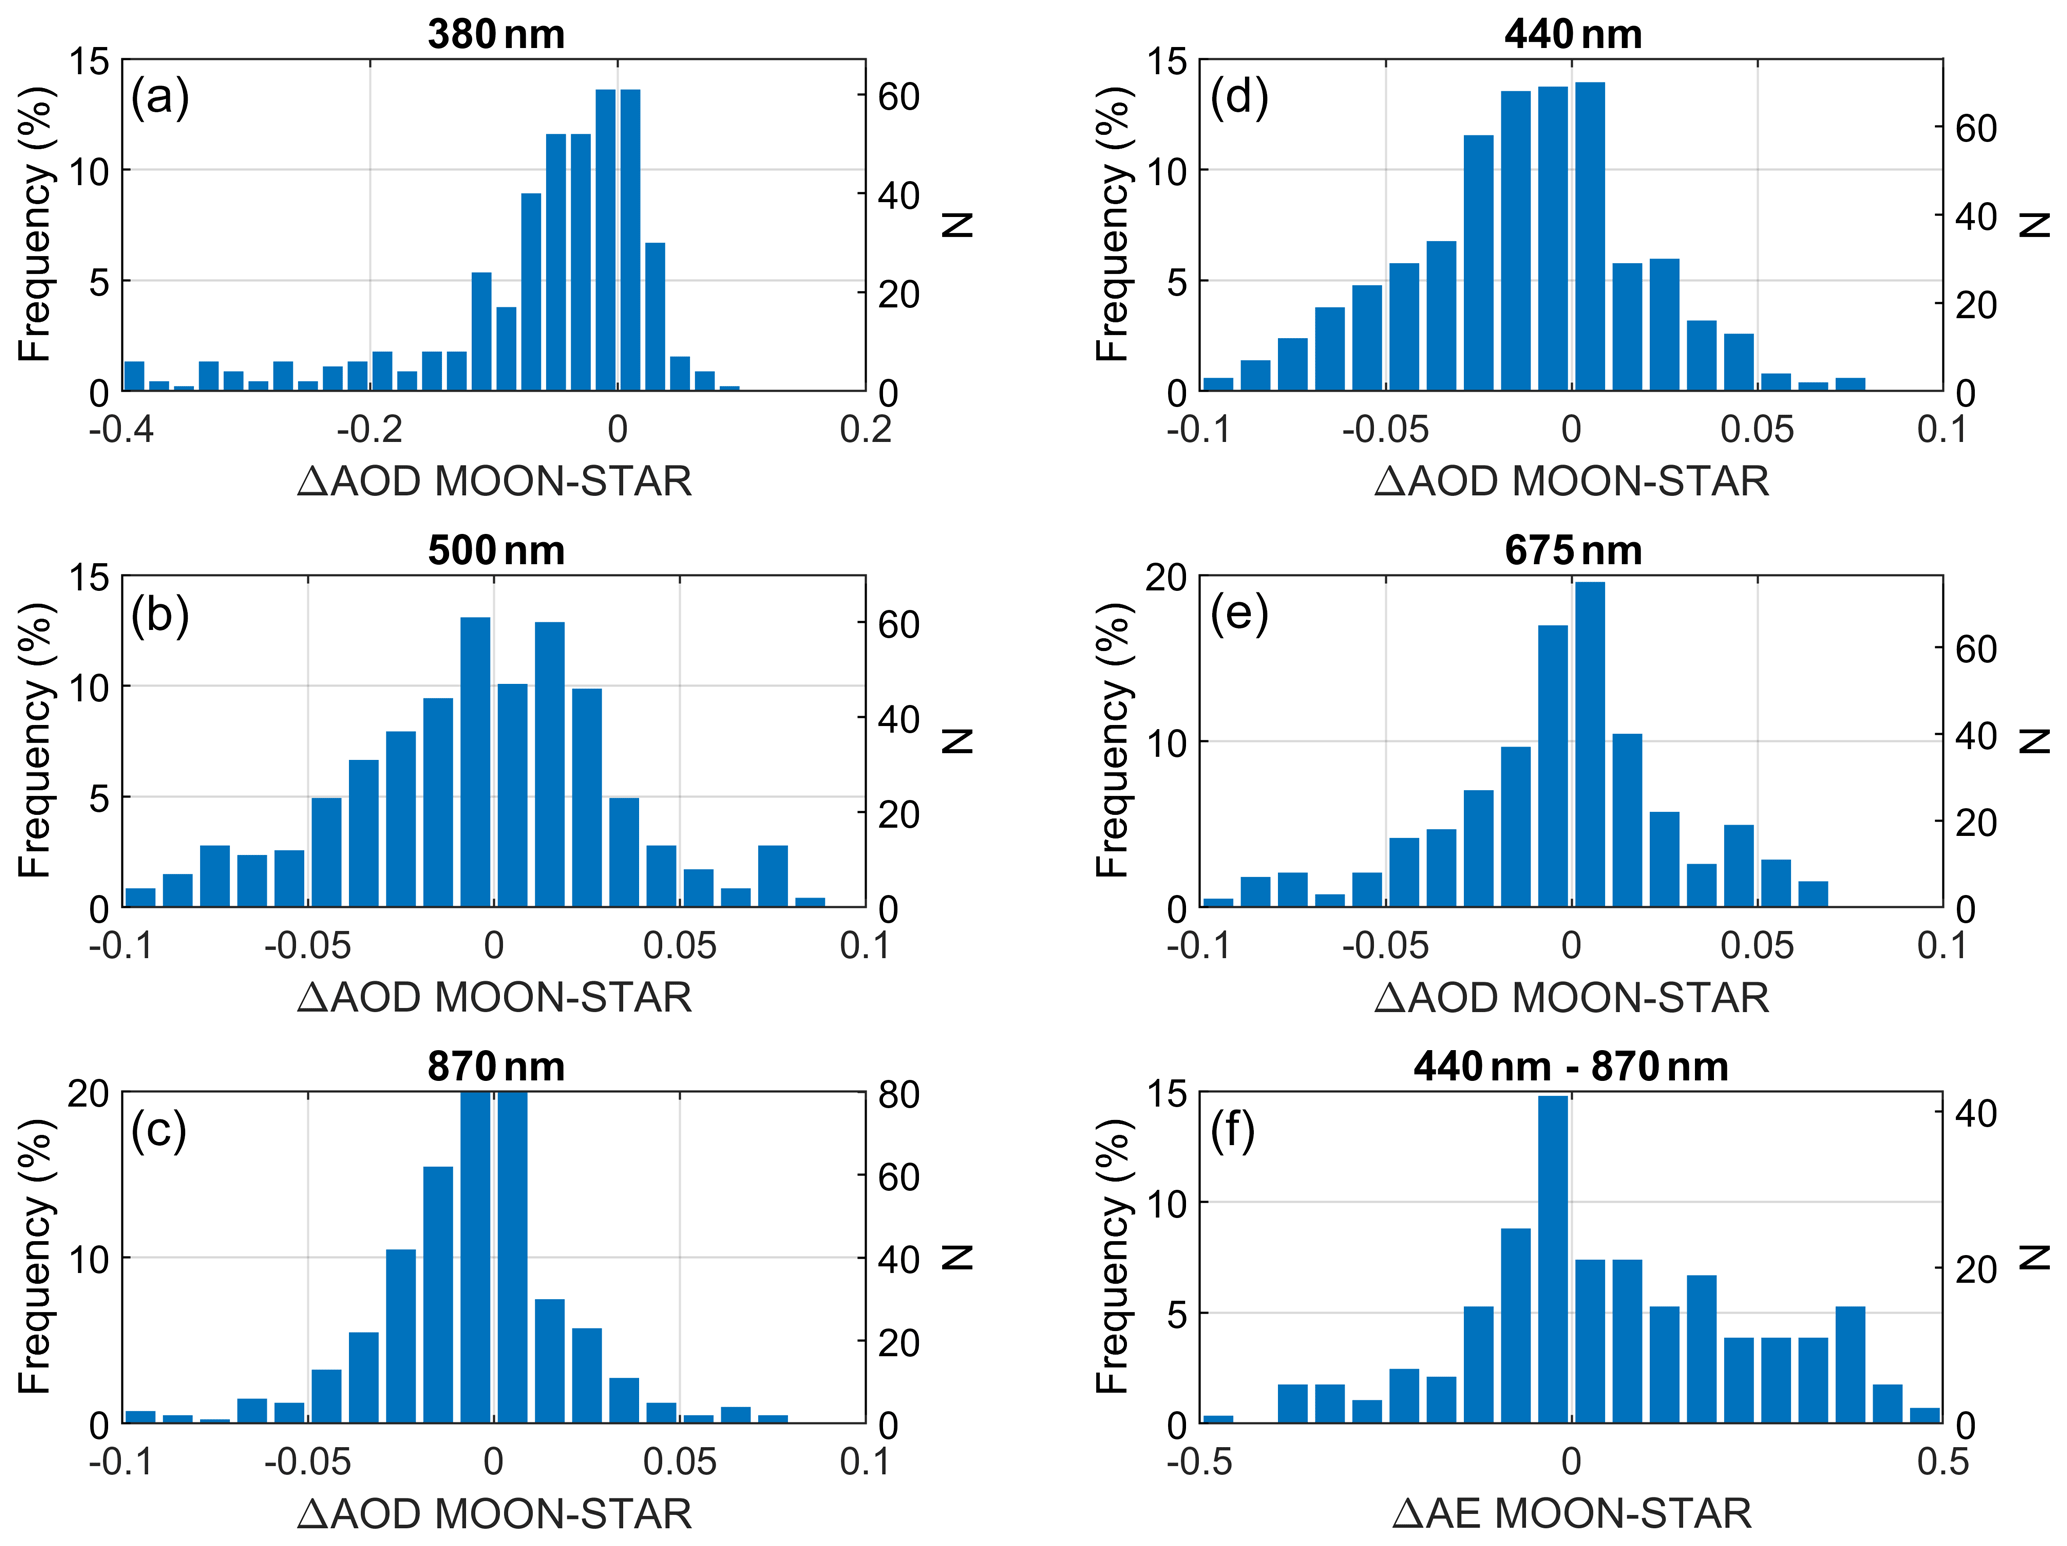
Figure 4Frequency of the aerosol optical depth (AOD) differences between the Moon and star photometers for different wavelengths. Panel (f) shows the frequency of these differences for the Ångström exponent (AE) in the 440–870 nm range.
We have also investigated whether the performance of the AOD depends on the MPA due to the influence of this parameter on the incoming lunar irradiance and on the RCF values (see Sect. 3.3). Figure 5 shows the Moon–star AOD differences as a function of MPA for the different wavelengths. Dependence of the relative differences on MPA is observed for neither the median values nor the standard deviations. A high reduction in the differences can be observed for 380 nm in the 70–80∘ MPA bin, which surely is the MPA bin with more negative AOD values from Moon observations at this wavelength, as mentioned above. Finally, the AE differences do not show any clear pattern with MPA, but the high dispersion observed before can also be appreciated.

Figure 5Aerosol optical depth (AOD) differences between the Moon and star photometers as a function of Moon phase angle (MPA) for different wavelengths. Panel (f) shows these differences for the Ångström exponent (AE) in the 440–870 nm range. Black circles represent the median of all differences in a ±5∘ MPA interval, while error bars indicate ± standard deviation of the data in the same interval.
Moon photometry needs accurate knowledge of the extraterrestrial lunar irradiance in order to calculate the aerosol optical depth (AOD). This paper uses the RIMO model (an implementation of the ROLO model) to calculate this irradiance and a Sun–sky–Moon photometer (CE318-T) located at the high-altitude station of Izaña to take measurements of the lunar irradiance at the ground to derive the AOD. However, the AOD values obtained using these measurements and the RIMO model are not in agreement with the expected values even under pristine and clear conditions. The discrepancies between the obtained and the expected AOD can be mainly caused by two issues: (1) bad calibration coefficients of the photometer or (2) lack of accuracy in the RIMO values. The calibration used in this work has been based on transferring the calibration of the solar channels (well established) to the Moon channel by a vicarious method based on the fact that the photometer takes the Moon observations with the same sensor as Sun measurements but with a two-step electronic amplification of 4096 in the signal. In principle, nothing suggests that AOD errors could come from the calibration, while other works in the literature pointed out discrepancies in the ROLO model. This fact has motivated us to assume the lack of accuracy of RIMO as being responsible for the observed differences, and these differences have been used to determine the RIMO accuracy.
Detailed analyses of the differences between expected AOD and the AOD derived by RIMO have shown a bias revealing an underestimation of RIMO compared to the real extraterrestrial lunar irradiance of about 1 %–14 % for visible and infrared channels, which also depends on the Moon phase angle (MPA); this result agrees with other works in the literature. The mentioned bias has been modelled as a function of MPA by a second-order polynomial (for each wavelength). These proposed polynomials represent the named RIMO correction factor (RCF) since, if a RIMO irradiance output is multiplied by this factor, the derived AOD from the corrected irradiance will be closer to the expected AOD. The obtained RCF values are at least useful for the retrieval of AOD from Moon observations. Differences of around 0.03 in the RCF values have been found for the same wavelength (1020 nm) using two different detectors (silicon and InGaAs); this result has apparently no physical sense since the lunar irradiance cannot take two different values for one single wavelength. Consequently, this result must be caused by the uncertainty of the measurements and the method itself, indicating that the uncertainty of the estimated extraterrestrial lunar irradiance with RCF might be about 3%, at least for 1020 nm. The obtained results at 340 nm have been too noisy; hence the use of this channel is not recommended. This new methodology based on the modelled RCF to correct RIMO for AOD calculation has been implemented in CÆLIS, achieving a night-time AOD calculation in near-real time for all photometers managed by this tool in an operational way. This is possible because the calibration used only needs the routine Sun calibration (the so-called gain calibration method).
The RIMO-corrected AODs have been evaluated versus alternative and independent measurements from a star photometer. This instrument was deployed at Granada, a different location than the one used for the proposed RCF calculation. To our knowledge this is the first long-term AOD comparison between Moon and star observations. The obtained results for wavelengths between 440 and 870 nm have pointed out a good agreement between both databases, the absolute mean difference being below 0.01, except for 440 nm, which is below 0.02. This indicates only a slight underestimation of AOD from Moon compared to star observations (used for reference) at 440 nm but within the uncertainty of the star photometer (about 0.02–0.03). The standard deviation of the Moon–star AOD differences for the mentioned wavelengths is about 0.03–0.04, but if some problematic periods in the star photometer data are neglected, these values are reduced to approximately 0.01, which leads to an uncertainty in AOD from Moon observations of between 0.019 (870 nm) and 0.028 (500 nm). However, these uncertainties could be lower because part of the observed differences could be caused by detected technical problems in the star photometer filter wheel; the differences in the effective wavelengths used in both instruments and in the way to correct atmospheric gaseous scattering and absorption at these wavelengths; and the inhomogeneity of aerosol spatial distribution since both instruments point to different targets, which also affects the time interval used for the averages (clouds can block the Moon but not the pointed star, and vice versa). The differences at 380 nm are higher, showing in the best case an underestimation of around 0.03 and an uncertainty of about 0.06. These results suggest current limitations in using this channel, mainly caused by the low signal at this wavelength, which usually produces high dispersion and noisy AOD values close to the Moon quarters. Further improvements and analyses need to be done in order to guarantee AOD quality in the UV region. The analysed wavelengths have not shown any dependence on MPA in the Moon–star AOD comparison.This is an important result because it indicates that the proposed correction is able to remove any influence of the Moon cycle on the AOD.
The night-time cloud-screening used is in general the same that is used for daytime but without rejecting AOD values below a given threshold. In spite of providing apparently good results, the night-time cloud-screening is still in development, and it could change or add other specific criteria in the future due to the particularities of night-time measurements. The development of new cloud-screening criteria is out of the scope of this paper, but, in the future, it could be based on the consideration of temporal smoothness in individual wavelengths or the addition of a threshold value for the minimum acceptable AOD and for the minimum acceptable recorded signal per channel; this could help to guarantee the AOD quality, especially in the noisier channels like 380 nm. Recently, AERONET has also been providing AOD values from Sun–sky–Moon photometers with its own method (https://aeronet.gsfc.nasa.gov/new_web/Documents/Lunar_Algorithm_Draft_2019.pdf, last access: 19 November 2020), but this product is still labelled as provisional at present; hence a direct comparison between the AOD from the proposed and the AERONET methods has not been considered.
To sum up, this work provides more evidence about the reported underestimation of the RIMO–ROLO model compared to the real extraterrestrial lunar irradiance and points to the need for a correction of this model or the development of a new extraterrestrial lunar-irradiance model, at least for accurate AOD calculation purposes. Meanwhile, at least until a more accurate lunar-irradiance model is available, the proposed correction can help in providing AOD retrievals with the Moon. Moreover, additional studies using different Moon photometer and spectroradiometer models or using alternative and independent night-time instrumentation, like lidar or star photometers, are highly recommended to characterize the AOD uncertainty, the accuracy of the proposed method, and the feasibility of its use with other instrumentation.
The data used are available from the authors upon request.
RR, RG, and CT designed and developed the main concepts and ideas behind this work and wrote the paper with input from all authors. RG, AB, and RR implemented the RIMO model in CÆLIS. RR, JABO, and DPR carried out the routine and calibration measurements of the star photometer. DPR computed and processed the AOD data from the star photometer. VEC, FJO, LAA, and AMdF aided in interpreting the results and worked on the manuscript. All authors were involved in helpful discussions and contributed to the manuscript.
The authors declare that they have no conflict of interest.
The authors are grateful to the Spanish Ministry of Science, Innovation and Universities for the support through the ePOLAAR project (RTI2018-097864-B-I00). This work was also supported by the Spanish Ministry of Economy and Competitiveness through projects CGL2016-81092-R and CGL2017-90884-REDT, by the Andalusia Regional Government through project P18-RT-3820, and by the European Union's Horizon 2020 research and innovation programme through ACTRIS-IMP (grant agreement no. 871115). We thank Emilio Cuevas and their staff for establishing and maintaining the Izaña station used in this investigation.
This research has been supported by the Spanish Ministry of Science, Innovation and Universities (grant no. RTI2018-097864-b-I00); the Spanish Ministry of Economy and Competitiveness (grant nos. CGL2016-81092-R and CGL2017-90884-REDT); the European Union's Horizon 2020 research and innovation programme (grant no. ACTRIS IMP 871115); and the Andalusia Regional Government (grant no. P18-RT-3820).
This paper was edited by Omar Torres and reviewed by two anonymous referees.
Acton Jr., C., Bachman, N., Semenov, B., and Wright, E.: A look towards the future in the handling of space science mission geometry, Planet. Space Sci., 150, 9–12, 2018. a
Acton Jr., C. H.: Ancillary data services of NASA's navigation and ancillary information facility, Planet. Space Sci., 44, 65–70, 1996. a
Alados-Arboledas, L., Lyamani, H., and Olmo, F.: Aerosol size properties at Armilla, Granada (Spain), Quarterly Journal of the Royal Meteorological Society: A journal of the atmospheric sciences, Appl. Meteorol. Phys. Oceanogr., 129, 1395–1413, 2003. a
Angström, A.: Techniques of determining the turbidity of the atmosphere, Tellus, 13, 214–223, 1961. a
Ansmann, A., Riebesell, M., and Weitkamp, C.: Measurement of atmospheric aerosol extinction profiles with a Raman lidar, Opt. Lett., 15, 746–748, 1990. a
Antón, M., Valenzuela, A., Cazorla, A., Gil, J., Fernández-Gálvez, J., Lyamani, H., Foyo-Moreno, I., Olmo, F., and Alados-Arboledas, L.: Global and diffuse shortwave irradiance during a strong desert dust episode at Granada (Spain), Atmos. Res., 118, 232–239, 2012. a
Baibakov, K., O'Neill, N. T., Ivanescu, L., Duck, T. J., Perro, C., Herber, A., Schulz, K.-H., and Schrems, O.: Synchronous polar winter starphotometry and lidar measurements at a High Arctic station, Atmos. Meas. Tech., 8, 3789–3809, https://doi.org/10.5194/amt-8-3789-2015, 2015. a, b
Barreto, A., Cuevas, E., Damiri, B., Guirado, C., Berkoff, T., Berjón, A. J., Hernández, Y., Almansa, F., and Gil, M.: A new method for nocturnal aerosol measurements with a lunar photometer prototype, Atmos. Meas. Tech., 6, 585–598, https://doi.org/10.5194/amt-6-585-2013, 2013. a, b, c
Barreto, Á., Cuevas, E., Granados-Muñoz, M.-J., Alados-Arboledas, L., Romero, P. M., Gröbner, J., Kouremeti, N., Almansa, A. F., Stone, T., Toledano, C., Román, R., Sorokin, M., Holben, B., Canini, M., and Yela, M.: The new sun-sky-lunar Cimel CE318-T multiband photometer – a comprehensive performance evaluation, Atmos. Meas. Tech., 9, 631–654, https://doi.org/10.5194/amt-9-631-2016, 2016. a, b, c, d, e
Barreto, Á., Román, R., Cuevas, E., Berjón, A. J., Almansa, A. F., Toledano, C., González, R., Hernández, Y., Blarel, L., Goloub, P., Guirado, C., and Yela, M.: Assessment of nocturnal aerosol optical depth from lunar photometry at the Izaña high mountain observatory, Atmos. Meas. Tech., 10, 3007–3019, https://doi.org/10.5194/amt-10-3007-2017, 2017. a, b, c, d
Barreto, A., Román, R., Cuevas, E., Pérez-Ramírez, D., Berjón, A., Kouremeti, N., Kazadzis, S., Gröbner, J., Mazzola, M., Toledano, C., Benavent-Oltra, J. A., Doppler, L., Jurysek, J., Almansa, F., Victori, S., Maupin, F., Guirado-Fuentes, C., González, R., Vitale, V., Goloub, P., Blarel, L., Alados-Arboledas, L., Woolliams, E., Greenwell, C., Taylor, S., Antuña, J. C., and Yela, M.: Evaluation of night-time aerosol optical depth measurements and lunar irradiance models in the frame of the first multi-instrument nocturnal intercomparison campaign, Atmos. Environ., 202, 190–211, 2019. a, b, c, d, e, f, g, h, i
Basart, S., Pérez, C., Cuevas, E., Baldasano, J. M., and Gobbi, G. P.: Aerosol characterization in Northern Africa, Northeastern Atlantic, Mediterranean Basin and Middle East from direct-sun AERONET observations, Atmos. Chem. Phys., 9, 8265–8282, https://doi.org/10.5194/acp-9-8265-2009, 2009. a, b
Bedoya-Velásquez, A. E., Navas-Guzmán, F., Granados-Muñoz, M. J., Titos, G., Román, R., Casquero-Vera, J. A., Ortiz-Amezcua, P., Benavent-Oltra, J. A., de Arruda Moreira, G., Montilla-Rosero, E., Hoyos, C. D., Artiñano, B., Coz, E., Olmo-Reyes, F. J., Alados-Arboledas, L., and Guerrero-Rascado, J. L.: Hygroscopic growth study in the framework of EARLINET during the SLOPE I campaign: synergy of remote sensing and in situ instrumentation, Atmos. Chem. Phys., 18, 7001–7017, https://doi.org/10.5194/acp-18-7001-2018, 2018. a
Benavent-Oltra, J. A., Román, R., Granados-Muñoz, M. J., Pérez-Ramírez, D., Ortiz-Amezcua, P., Denjean, C., Lopatin, A., Lyamani, H., Torres, B., Guerrero-Rascado, J. L., Fuertes, D., Dubovik, O., Chaikovsky, A., Olmo, F. J., Mallet, M., and Alados-Arboledas, L.: Comparative assessment of GRASP algorithm for a dust event over Granada (Spain) during ChArMEx-ADRIMED 2013 campaign, Atmos. Meas. Tech., 10, 4439–4457, https://doi.org/10.5194/amt-10-4439-2017, 2017. a
Benavent-Oltra, J. A., Román, R., Casquero-Vera, J. A., Pérez-Ramírez, D., Lyamani, H., Ortiz-Amezcua, P., Bedoya-Velásquez, A. E., de Arruda Moreira, G., Barreto, Á., Lopatin, A., Fuertes, D., Herrera, M., Torres, B., Dubovik, O., Guerrero-Rascado, J. L., Goloub, P., Olmo-Reyes, F. J., and Alados-Arboledas, L.: Different strategies to retrieve aerosol properties at night-time with the GRASP algorithm, Atmos. Chem. Phys., 19, 14149–14171, https://doi.org/10.5194/acp-19-14149-2019, 2019. a, b
Berkoff, T. A., Sorokin, M., Stone, T., Eck, T. F., Hoff, R., Welton, E., and Holben, B.: Nocturnal Aerosol Optical Depth Measurements with a Small-Aperture Automated Photometer Using the Moon as a Light Source, J. Atmos. Ocean. Technol., 28, 1297–1306, https://doi.org/10.1175/JTECH-D-10-05036.1, 2011. a
Boucher, O., Randall, D., Artaxo, P., Bretherton, C., Feingold, G., Forster, P., Kerminen, V.-M., Kondo, Y., Liao, H., Lohmann, U., Rasch, P., Satheesh, S. K., Sherwood, S., Stevens, B. and Zhang, X. Y.: Clouds and aerosols, in: Climate change 2013: the physical science basis. Contribution of Working Group I to the Fifth Assessment Report of the Intergovernmental Panel on Climate Change, pp. 571–657, Cambridge University Press, 2013. a, b
Cachorro, V. E., Romero, P. M., Toledano, C., Cuevas, E., and de Frutos, A. M.: The fictitious diurnal cycle of aerosol optical depth: A new approach for “in situ” calibration and correction of AOD data series, Geophys. Res. Lett., 31, L12106, https://doi.org/10.1029/2004GLO19651, 2004. a
Cachorro, V. E., Toledano, C., Sorribas, M., Berjon, A., de Frutos, A. M., and Laulainen, N.: An “in situ” calibration-correction procedure (KCICLO) based on AOD diurnal cycle: Comparative results between AERONET and reprocessed (KCICLO method) AOD-alpha data series at El Arenosillo, Spain, J. Geophys. Res., 113, D02207, https://doi.org/10.1029/2007JD009001, 2008. a, b
Casquero-Vera, J. A., Lyamani, H., Titos, G., Borrás, E., Olmo, F., and Alados-Arboledas, L.: Impact of primary NO2 emissions at different urban sites exceeding the European NO2 standard limit, Sci. Total Environ., 646, 1117–1125, 2019. a
Casquero-Vera, J. A., Lyamani, H., Dada, L., Hakala, S., Paasonen, P., Román, R., Fraile, R., Petäjä, T., Olmo-Reyes, F. J., and Alados-Arboledas, L.: New particle formation at urban and high-altitude remote sites in the south-eastern Iberian Peninsula, Atmos. Chem. Phys., https://doi.org/10.5194/acp-2020-394, in press, 2020. a
Cuevas, E., Milford, C., Bustos, J. J., del Campo-Hernández, R., García, O. E., García, R. D., Gómez-Peláez, A. J., Guirado-Fuentes, C., Marrero, C., Prats, N., Ramos, R., Redondas, A., Reyes, E., Rodríguez, S., Romero-Campos, P. M., Schneider, M., Belmonte, J., Yela, M., Almansa, F., Barreto, A., López-Solano, C., Basart, S., Terradellas, E., Afonso, S., Bayo, C., Berjón, A., Bethencourt, J., Carreño, V., Castro, N. J., Cruz, A. M., Damas, M., De Ory-Ajamil, F., García, M., Gómez-Trueba, V., González, Y., Hernández, C., Hernández, Y., Hernández-Cruz, B., Jover, M., León-Luís, S. F., López-Fernández, R., López-Solano, J., Rodríguez, E., Rodríguez-Franco, J. J., Rodríguez-Valido, M., Sálamo, C., Sanromá, E., Santana, D., Santo Tomás, F., Sepúlveda, E., Sierra, M., and Sosa, E.: Izaña Atmospheric Research Center Activity Report 2015–2016, Tech. rep., State Meteorological Agency of Spain (AEMET), Madrid, Spain and World Meteorological Organization, Geneva, Switzerland, edited by: Cuevas, E., Milford, C., and Tarasova, O. NIPO: 014-17-012-9, WMO/GAW Report No. 236, 2017. a
Cuevas, E., Romero-Campos, P. M., Kouremeti, N., Kazadzis, S., Räisänen, P., García, R. D., Barreto, A., Guirado-Fuentes, C., Ramos, R., Toledano, C., Almansa, F., and Gröbner, J.: Aerosol optical depth comparison between GAW-PFR and AERONET-Cimel radiometers from long-term (2005–2015) 1 min synchronous measurements, Atmos. Meas. Tech., 12, 4309–4337, https://doi.org/10.5194/amt-12-4309-2019, 2019. a, b
Davidson, C. I., Phalen, R. F., and Solomon, P. A.: Airborne particulate matter and human health: a review, Aerosol Sci. Technol., 39, 737–749, 2005. a
de Arruda Moreira, G., Guerrero-Rascado, J. L., Bravo-Aranda, J. A., Benavent-Oltra, J. A., Ortiz-Amezcua, P., Róman, R., Bedoya-Velásquez, A. E., Landulfo, E., and Alados-Arboledas, L.: Study of the planetary boundary layer by microwave radiometer, elastic lidar and Doppler lidar estimations in Southern Iberian Peninsula, Atmos. Res., 213, 185–195, 2018. a
Flentje, H., Claude, H., Elste, T., Gilge, S., Köhler, U., Plass-Dülmer, C., Steinbrecht, W., Thomas, W., Werner, A., and Fricke, W.: The Eyjafjallajökull eruption in April 2010 – detection of volcanic plume using in-situ measurements, ozone sondes and lidar-ceilometer profiles, Atmos. Chem. Phys., 10, 10085–10092, https://doi.org/10.5194/acp-10-10085-2010, 2010. a
Folkner, W. M., Williams, J. G., and Boggs, D. H.: The planetary and lunar ephemeris DE 421, JPL IOM 343R-08-003, 2008. a
Fuertes, D., Toledano, C., González, R., Berjón, A., Torres, B., Cachorro, V. E., and de Frutos, Á. M.: CÆLIS: software for assimilation, management and processing data of an atmospheric measurement network, Geosci. Instrum. Method. Data Syst., 7, 67–81, https://doi.org/10.5194/gi-7-67-2018, 2018. a
García, O. E., Díaz, J. P., Expósito, F. J., Díaz, A. M., Dubovik, O., Derimian, Y., Dubuisson, P., and Roger, J.-C.: Shortwave radiative forcing and efficiency of key aerosol types using AERONET data, Atmos. Chem. Phys., 12, 5129–5145, https://doi.org/10.5194/acp-12-5129-2012, 2012. a
Geogdzhayev, I. V. and Marshak, A.: Calibration of the DSCOVR EPIC visible and NIR channels using MODIS Terra and Aqua data and EPIC lunar observations, Atmos. Meas. Tech., 11, 359–368, https://doi.org/10.5194/amt-11-359-2018, 2018. a, b
Giles, D. M., Sinyuk, A., Sorokin, M. G., Schafer, J. S., Smirnov, A., Slutsker, I., Eck, T. F., Holben, B. N., Lewis, J. R., Campbell, J. R., Welton, E. J., Korkin, S. V., and Lyapustin, A. I.: Advancements in the Aerosol Robotic Network (AERONET) Version 3 database – automated near-real-time quality control algorithm with improved cloud screening for Sun photometer aerosol optical depth (AOD) measurements, Atmos. Meas. Tech., 12, 169–209, https://doi.org/10.5194/amt-12-169-2019, 2019. a, b, c
González, R., Toledano, C., Román, R., Fuertes, D., Berjón, A., Mateos, D., Guirado-Fuentes, C., Velasco-Merino, C., Antuña-Sánchez, J. C., Calle, A., Cachorro, V. E., and de Frutos, Á. M.: Daytime and nighttime aerosol optical depth implementation in CÆLIS, Geosci. Instrum. Method. Data Syst., 9, 417–433, https://doi.org/10.5194/gi-9-417-2020, 2020. a, b, c, d, e
Graßl, S. and Ritter, C.: Properties of Arctic Aerosol Based on Sun Photometer Long-Term Measurements in Ny-Ålesund, Svalbard, Remote Sens., 11, 1362, 2019. a
Guirado, C., Cuevas, E., Cachorro, V. E., Toledano, C., Alonso-Pérez, S., Bustos, J. J., Basart, S., Romero, P. M., Camino, C., Mimouni, M., Zeudmi, L., Goloub, P., Baldasano, J. M., and de Frutos, A. M.: Aerosol characterization at the Saharan AERONET site Tamanrasset, Atmos. Chem. Phys., 14, 11753–11773, https://doi.org/10.5194/acp-14-11753-2014, 2014. a
Guirado-Fuentes, C.: Caracterización de las propiedades de los aerosoles en columna en la región subtropical, Ph.D. thesis, Universidad de Valladolid, 2015. a, b
Herber, A., Thomason, L. W., Gernandt, H., Leiterer, U., Nagel, D., Schulz, K., Kaptur, J., Albrecht, T., and Notholt, J.: Continuous day and night aerosol optical depth observations in the Arctic between 1991 and 1999, J. Geophys. Res., 107, 4097, https://doi.org/10.1029/2001JD000536, 2002. a
Holben, B. N., Eck, T. F., Slutsker, I., Tanré, D., Buis, J. P., Setzer, A., Vermote, E., Reagan, J. A., Kaufman, Y. J., Nakajima, T., Lavenu, F., Jankowiak, I., and Smirnov, A.: AERONET – a federated instrument network and data archive for aerosol characterization, Remote Sens. Environ., 66, 1–16, 1998. a, b, c
IPCC: Climate Change 2014: Synthesis Report. Contribution of Working Groups I, II and III to the Fifth Assessment Report of the Intergovernmental Panel on Climate Change. IPCC,, Tech. rep., Intergovernmental Panel on Climate Change, Geneva, Switzerland, 151 pp., 2014. a
Jickells, T. D., An, Z. S., Andersen, K. K., Baker, A. R., Bergametti, G., Brooks, N., Cao, J. J., Boyd, P. W., Duce, R. A., Hunter, K. A., Kawahata, H., Kubilay, N., laRoche, J., Liss, P. S., Mahowald, N., Prospero, J. M., Ridgwell, A. J., Tegen, I., and Torres, R.: Global iron connections between desert dust, ocean biogeochemistry, and climate, Science, 308, 67–71, 2005. a
Kieffer, H. H. and Stone, T. C.: The spectral irradiance of the Moon, The Astronom. J., 129, 2887, 2005. a, b, c, d, e
Koren, I., Kaufman, Y. J., Washington, R., Todd, M. C., Rudich, Y., Martins, J. V., and Rosenfeld, D.: The Bodélé depression: a single spot in the Sahara that provides most of the mineral dust to the Amazon forest, Environ. Res. Lett., 1, 014005, https://doi.org/10.1088/1748-9326/1/1/014005, 2006. a
Lacherade, S., Aznay, O., Fougnie, B., and Lebègue, L.: POLO: a unique dataset to derive the phase angle dependence of the Moon irradiance, in: Sensors, Systems, and Next-Generation Satellites XVIII, vol. 9241, p. 924112, International Society for Optics and Photonics, 2014. a, b, c
Li, Z., Li, K., Li, D., Yang, J., Xu, H., Goloub, P., and Victori, S.: Simple transfer calibration method for a Cimel Sun–Moon photometer: calculating lunar calibration coefficients from Sun calibration constants, Appl. Opt., 55, 7624–7630, 2016. a, b
Liu, B., Ma, Y., Shi, Y., Jin, S., Jin, Y., and Gong, W.: The characteristics and sources of the aerosols within the nocturnal residual layer over Wuhan, China, Atmos. Res., 241, p. 104959, 2020. a
Lopatin, A., Dubovik, O., Chaikovsky, A., Goloub, P., Lapyonok, T., Tanré, D., and Litvinov, P.: Enhancement of aerosol characterization using synergy of lidar and sun-photometer coincident observations: the GARRLiC algorithm, Atmos. Meas. Tech., 6, 2065–2088, https://doi.org/10.5194/amt-6-2065-2013, 2013. a
Lyamani, H., Olmo, F., Alcántara, A., and Alados-Arboledas, L.: Atmospheric aerosols during the 2003 heat wave in southeastern Spain I: Spectral optical depth, Atmos. Environ., 40, 6453–6464, 2006. a
Lyamani, H., Olmo, F. J., and Alados-Arboledas, L.: Physical and optical properties of aerosols over an urban location in Spain: seasonal and diurnal variability, Atmos. Chem. Phys., 10, 239–254, https://doi.org/10.5194/acp-10-239-2010, 2010. a
Mazzola, M., Lupi, A., Vitale, V., Tomasi, C., Stone, R. S., Herber, Andreas, Toledano, C., Cachorro, V. E., Torres, B., Berfon, A., Orziz, J. P., O'Neill, N. T., Masataka, S., Stebel, K., Aaltonen, V., Zielinski, T., Petelski, T., Goloub, P., Blarel, L., Li, Z., Abboud, I., Cuevas, E., Stock, Maria, Schulz, K. H., and Virkkula, A.: Evaluation of sun photometer capabilities for retrievals of aerosol optical depth at high latitudes: The POLAR-AOD intercomparison campaigns, Atmos. Environ., 52, 4–17, 2012. a
Myhre, G., Shindell, D., Bréon, F.-M., Collins, W., Fuglestvedt, J., Huang, J., Koch, D., Lamarque, J.-F., Lee, D., Mendoza, B., Nakajima, T., Robock, A., Stephens, G., Takemura, T., and Zhang, H.: Anthropogenic and natural radiative forcing, pp. 659–740, Cambridge University Press, Cambridge, UK, https://doi.org/10.1017/CBO9781107415324.018, 2013. a
Neher, I., Buchmann, T., Crewell, S., Evers-Dietze, B., Pfeilsticker, K., Pospichal, B., Schirrmeister, C., and Meilinger, S.: Impact of atmospheric aerosols on photovoltaic energy production Scenario for the Sahel zone, Energy Proc., 125, 170–179, 2017. a
Pérez-Ramírez, D., Aceituno, J., Ruiz, B., Olmo, F., and Alados-Arboledas, L.: Development and calibration of a star photometer to measure the aerosol optical depth: Smoke observations at a high mountain site, Atmos. Environ., 42, 2733–2738, 2008a. a, b
Pérez-Ramírez, D., Ruiz, B., Aceituno, J., Olmo, F., and Alados-Arboledas, L.: Application of Sun/star photometry to derive the aerosol optical depth, Int. J. Remote Sens., 29, 5113–5132, 2008b. a
Pérez-Ramírez, D., Lyamani, H., Olmo, F. J., Whiteman, D. N., and Alados-Arboledas, L.: Columnar aerosol properties from sun-and-star photometry: statistical comparisons and day-to-night dynamic, Atmos. Chem. Phys., 12, 9719–9738, https://doi.org/10.5194/acp-12-9719-2012, 2012a. a
Pérez-Ramírez, D., Lyamani, H., Olmo, F. J., Whiteman, D. N., Navas-Guzmán, F., and Alados-Arboledas, L.: Cloud screening and quality control algorithm for star photometer data: assessment with lidar measurements and with all-sky images, Atmos. Meas. Tech., 5, 1585–1599, https://doi.org/10.5194/amt-5-1585-2012, 2012. a
Pérez-Ramírez, D., Lyamani, H., Smirnov, A., O'Neill, N., Veselovskii, I., Whiteman, D., Olmo, F., and Alados-Arboledas, L.: Statistical study of day and night hourly patterns of columnar aerosol properties using sun and star photometry, in: Remote Sensing of Clouds and the Atmosphere XXI, vol. 10001, p. 100010K, International Society for Optics and Photonics, Edinburgh, United Kingdom, 2016. a
Petäjä, T., Mauldin, III, R. L., Kosciuch, E., McGrath, J., Nieminen, T., Paasonen, P., Boy, M., Adamov, A., Kotiaho, T., and Kulmala, M.: Sulfuric acid and OH concentrations in a boreal forest site, Atmos. Chem. Phys., 9, 7435–7448, https://doi.org/10.5194/acp-9-7435-2009, 2009. a
Pérez-Ramírez, D., Lyamani, H., Olmo, F., and Alados-Arboledas, L.: Improvements in star photometry for aerosol characterizations, J. Aerosol Sci., 42, 737–745, https://doi.org/10.1016/j.jaerosci.2011.06.010, 2011. a, b, c
Ramanathan, V., Cess, R. D., Harrison, E. F., Minnis, P., Barkstrom, B. R., Ahmad, E., and Hartmann, D.: Cloud-Radiative Forcing and Climate: Results from the Earth Radiation Budget Experiment, Science, 243, 57–63, https://doi.org/10.1126/science.243.4887.57, 1989. a
Ravelo-Pérez, L. M., Rodríguez, S., Galindo, L., García, M. I., Alastuey, A., and López-Solano, J.: Soluble iron dust export in the high altitude Saharan Air Layer, Atmos. Environ., 133, 49–59, 2016. a
Remer, L. A., Gassó, S., Hegg, D. A., Kaufman, Y. J., and Holben, B. N.: Urban/industrial aerosol: Ground-based Sun/sky radiometer and airborne in situ measurements, J. Geophys. Res.-Atmos., 102, 16849–16859, 1997. a
Rodríguez, S., González, Y., Cuevas, E., Ramos, R., Romero, P. M., Abreu-Afonso, J., and Redondas, A.: Atmospheric nanoparticle observations in the low free troposphere during upward orographic flows at Izaña Mountain Observatory, Atmos. Chem. Phys., 9, 6319–6335, https://doi.org/10.5194/acp-9-6319-2009, 2009. a, b
Rodríguez, S., Alastuey, A., Alonso-Pérez, S., Querol, X., Cuevas, E., Abreu-Afonso, J., Viana, M., Pérez, N., Pandolfi, M., and de la Rosa, J.: Transport of desert dust mixed with North African industrial pollutants in the subtropical Saharan Air Layer, Atmos. Chem. Phys., 11, 6663–6685, https://doi.org/10.5194/acp-11-6663-2011, 2011. a
Román, R., Antón, M., Valenzuela, A., Gil, J., Lyamani, H., De Miguel, A., Olmo, F., Bilbao, J., and Alados-Arboledas, L.: Evaluation of the desert dust effects on global, direct and diffuse spectral ultraviolet irradiance, Tellus B, 65, 19578, 2013. a
Román, R., Torres, B., Fuertes, D., Cachorro, V. E., Dubovik, O., Toledano, C., Cazorla, A., Barreto, A., Bosch, J., Lapyonok, T., González, R., Goloub, P., Perrone, M. R., Olmo, F. J., de Frutos, A., and Alados-Arboledas, L.: Remote sensing of lunar aureole with a sky camera: Adding information in the nocturnal retrieval of aerosol properties with GRASP code, Remote Sens. Environ., 196, 238–252, 2017. a
Román, R., Benavent-Oltra, J. A., Casquero-Vera, J. A., Lopatin, A., Cazorla, A., Lyamani, H., Denjean, C., Fuertes, D., Pérez-Ramírez, D., Torres, B., Toledano, C., Dubovik, O., Cachorro, V. E., de Frutos, A. M., Olmo, F. J., and Alados-Arboledas, L.: Retrieval of aerosol profiles combining sunphotometer and ceilometer measurements in GRASP code, Atmos. Res., 204, 161–177, 2018. a, b
Seidelmann, P. K., Archinal, B. A., A'hearn, M. F., Conrad, A., Consolmagno, G., Hestroffer, D., Hilton, J., Krasinsky, G., Neumann, G., Oberst, J., Stooke, P., Tedesco, E. F., Tholen, D. J., Thomas, P. C., and Williams, I. P.: Report of the IAU/IAG Working Group on cartographic coordinates and rotational elements: 2006, Celestial Mechanics and Dynamical Astronomy, 98, 155–180, 2007. a
Shaw, G.: Error analysis of multi-wavelength sun photometry, Pure Appl. Geophys., 114, 1–14, 1976. a
Shaw, G. E.: Sun photometry, B. Am. Meteorol. Soc., 64, 4–10, 1983. a
Speyerer, E., Wagner, R., Robinson, M., Licht, A., Thomas, P., Becker, K., Anderson, J., Brylow, S., Humm, D., and Tschimmel, M.: Pre-flight and on-orbit geometric calibration of the lunar reconnaissance orbiter camera, Space Sci. Rev., 200, 357–392, 2016. a
Stevens, B. and Feingold, G.: Untangling aerosol effects on clouds and precipitation in a buffered system, Nature, 461, 607–613, 2009. a
Sun, Y., Song, T., Tang, G., and Wang, Y.: The vertical distribution of PM2. 5 and boundary-layer structure during summer haze in Beijing, Atmos. Environ., 74, 413–421, 2013. a
Taylor, S., Greenwell, C., and Woolliams, E.: D3: Lunar Photometer Calibration for Lunar Spectral Irradiance Measurements, Tech. rep., available at: http://calvalportal.ceos.org/documents/10136/703678/Lunar%2BIrradiance%2BD3%2B-%2BCalibration.pdf (last access: 17 November 2020), 2018. a
Titos, G., Foyo-Moreno, I., Lyamani, H., Querol, X., Alastuey, A., and Alados-Arboledas, L.: Optical properties and chemical composition of aerosol particles at an urban location: An estimation of the aerosol mass scattering and absorption efficiencies, J. Geophys. Res-.Atmos., 117, D04206, https://doi.org/10.1029/2011JD016671, 2012. a
Toledano, C., González, R., Fuertes, D., Cuevas, E., Eck, T. F., Kazadzis, S., Kouremeti, N., Gröbner, J., Goloub, P., Blarel, L., Román, R., Barreto, Á., Berjón, A., Holben, B. N., and Cachorro, V. E.: Assessment of Sun photometer Langley calibration at the high-elevation sites Mauna Loa and Izaña, Atmos. Chem. Phys., 18, 14555–14567, https://doi.org/10.5194/acp-18-14555-2018, 2018. a, b, c
Torres, B., Dubovik, O., Fuertes, D., Schuster, G., Cachorro, V. E., Lapyonok, T., Goloub, P., Blarel, L., Barreto, A., Mallet, M., Toledano, C., and Tanré, D.: Advanced characterisation of aerosol size properties from measurements of spectral optical depth using the GRASP algorithm, Atmos. Meas. Tech., 10, 3743–3781, https://doi.org/10.5194/amt-10-3743-2017, 2017. a
Twomey, S.: The influence of pollution on the shortwave albedo of clouds, J. Atmos. Sci., 34, 1149–1152, 1977. a
Uchiyama, A., Shiobara, M., Kobayashi, H., Matsunaga, T., Yamazaki, A., Inei, K., Kawai, K., and Watanabe, Y.: Nocturnal aerosol optical depth measurements with modified sky radiometer POM-02 using the moon as a light source, Atmos. Meas. Tech., 12, 6465–6488, https://doi.org/10.5194/amt-12-6465-2019, 2019. a
Valenzuela, A., Olmo, F., Lyamani, H., Antón, M., Quirantes, A., and Alados-Arboledas, L.: Classification of aerosol radiative properties during African desert dust intrusions over southeastern Spain by sector origins and cluster analysis, J. Geophys. Res.-Atmos., 117, D06214, https://doi.org/10.1029/2011JD016885, 2012. a
Viticchie, B., Wagner, S., Hewison, T., Stone, T., Nain, J., Gutierrez, R., Muller, J., and Hanson, C.: Lunar calibration of MSG/SEVIRI solar channels, in: Proceedings of the EUMETSAT Meteorological Satellite Conference, Vienna, Austria, 16–20 September 2013, 16–20, 2013. a, b, c
Wehrli, C.: WRC Reference Spectrum, PMOD Publication, 615, 1985. a, b, c
WMO: Commission for Instruments and Methods of Observation (WMO-No. 1138) Sixteenth session: abridged final report with resolutions and recommendations, 2014. a