the Creative Commons Attribution 4.0 License.
the Creative Commons Attribution 4.0 License.
 | 15 Dec 2020
TROPOMI aerosol products: evaluation and observations of synoptic-scale carbonaceous aerosol plumes during 2018–2020
Omar Torres
Hiren Jethva
Changwoo Ahn
Glen Jaross
Diego G. Loyola
TROPOspheric Monitoring Instrument (TROPOMI) near-ultraviolet (near-UV) radiances are used as input to an inversion algorithm that simultaneously retrieves aerosol optical depth (AOD), single-scattering albedo (SSA), and the qualitative UV aerosol index (UVAI). We first present the TROPOMI aerosol algorithm (TropOMAER), an adaptation of the currently operational OMI near-UV (OMAERUV and OMACA) inversion schemes that takes advantage of TROPOMI's unprecedented fine spatial resolution at UV wavelengths and the availability of ancillary aerosol-related information to derive aerosol loading in cloud-free and above-cloud aerosols scenes. TROPOMI-retrieved AOD and SSA products are evaluated by direct comparison to sun-photometer measurements. A parallel evaluation analysis of OMAERUV and TropOMAER aerosol products is carried out to separately identify the effect of improved instrument capabilities and algorithm upgrades. Results show TropOMAER improved levels of agreement with respect to those obtained with the heritage coarser-resolution sensor. OMI and TROPOMI aerosol products are also intercompared at regional daily and monthly temporal scales, as well as globally at monthly and seasonal scales. We then use TropOMAER aerosol retrieval results to discuss the US Northwest and British Columbia 2018 wildfire season, the 2019 biomass burning season in the Amazon Basin, and the unprecedented January 2020 fire season in Australia that injected huge amounts of carbonaceous aerosols in the stratosphere.
- Article
(7678 KB) - Full-text XML
- BibTeX
- EndNote


The TROPOspheric Monitoring Instrument (TROPOMI) on the Sentinel-5 Precursor (S5P) satellite launched on 13 October 2017 is the first atmospheric monitoring mission within the European Union Copernicus program. The objective of the mission is the operational monitoring of trace gas concentrations for atmospheric chemistry and climate applications. TROPOMI is the follow-on mission to the successful Aura Ozone Monitoring Instrument (OMI; Levelt et al., 2006) that has been operating since October 2004, the Global Ozone Monitoring Experiment-2 (GOME-2; Munro et al., 2016) sensors on the Metop (Meteorological Operational Satellite Program of Europe) satellites operating since 2006, and previous missions such as SCanning Imaging Absorption SpectroMeter for Atmospheric CHartographY (SCIAMACHY; Bovensmann et al., 1999). The S5P mission precedes the upcoming Sentinel-5 (S5), a TROPOMI-like sensor, and the geostationary Sentinel-4 (S4) missions (Ingmann et al., 2012).
TROPOMI is a high-spectral-resolution spectrometer covering eight spectral windows from the ultraviolet (UV) to the shortwave infrared (SWIR) regions of the electromagnetic spectrum. The instrument operates in a push-broom configuration, with a swath width of about 2600 km on the Earth's surface. The typical pixel size (near nadir) is 5.5×3.5 km2 for all spectral bands, with the exception of the UV1 (5.5×28 km2) and SWIR (5.5×7 km2) bands. On behalf of the European Space Agency (ESA), the German Aerospace Center (DLR, Deutsches Zentrum für Luft- und Raumfahrt) generates level 1b calibrated radiance data and level 2 derived products including trace gas (O3, NO2, SO2, CO, CH4, and CH2O), aerosols (UV aerosol index, UVAI), O2 A-band aerosol layer height (ALH), and cloud properties. Currently, no ESA-produced standard quantitative aerosol products are available from TROPOMI. Per an established NASA–ESA (NASA: National Aeronautics and Space Administration) interagency collaboration agreement, TROPOMI level 1b calibrated radiance data and level 2 retrieved products are available at the Goddard Earth Sciences Data and Information Services Center (GES DISC; https://disc.gsfc.nasa.gov/datasets/, last access: 2 December 2020).
In this paper, we report the first results of a NASA research aerosol algorithm using TROPOMI observations at near-UV wavelengths. TROPOMI aerosol observations will further extend the multi-decadal near-UV aerosol record started with the Total Ozone Mapping Spectrometer (TOMS) series of sensors (1978–1992, 1996–2001; Torres et al., 1998) and continued into the new millennium by the currently operational OMI (Torres et al., 2007). A similar multi-year AOD–SSA record is also available from EPIC (Earth Panchromatic Imaging Camera) on the DSCOVR (Deep Space Climate Observatory) parked at Lagrange point 1 (Marshak et al., 2018; Ahn et al., 2020).
A description of the algorithm is presented in Sect. 2, followed by a detailed evaluation of retrieval results in Sect. 3. In Sect. 4, we use TROPOMI-derived information to discuss synoptic-scale aerosol events in different regions of the world since the launch of TROPOMI in 2017.
2.1 Heritage algorithm
The NASA OMI aerosol retrieval algorithms for cloud-free conditions (OMAERUV; Torres et al., 2007, 2013, 2018), and for above-cloud aerosols (OMACA; Torres et al., 2012; Jethva et al., 2018) have been combined into a single algorithm (TropOMAER) and applied to TROPOMI observations. TropOMAER uses observations at two near-UV wavelengths to calculate the UVAI and to retrieve total column aerosol optical depth (AOD) and single-scattering albedo (SSA). Although detailed documentation on the heritage algorithm is available in the published literature, a brief description is presented here for completeness.
2.1.1 UV aerosol index
TropOMAER ingests measured TROPOMI radiances at 354 and 388 nm to calculate the UVAI, a parameter that allows distinguishing UV-absorbing particles (carbonaceous and desert dust aerosols, volcanic ash) from non-absorbing particles (Herman et al., 1997; Torres et al., 1998). It is defined as
where I represents the observed and calculated radiances at 354 nm. Measurements at 388 nm are used to obtain a wavelength-independent cloud fraction that is required for the calculation of the term (Torres et al., 2018). UVAI yields positive values in the presence of absorbing particles, near-zero for clouds, and small negative values for non-absorbing aerosols.
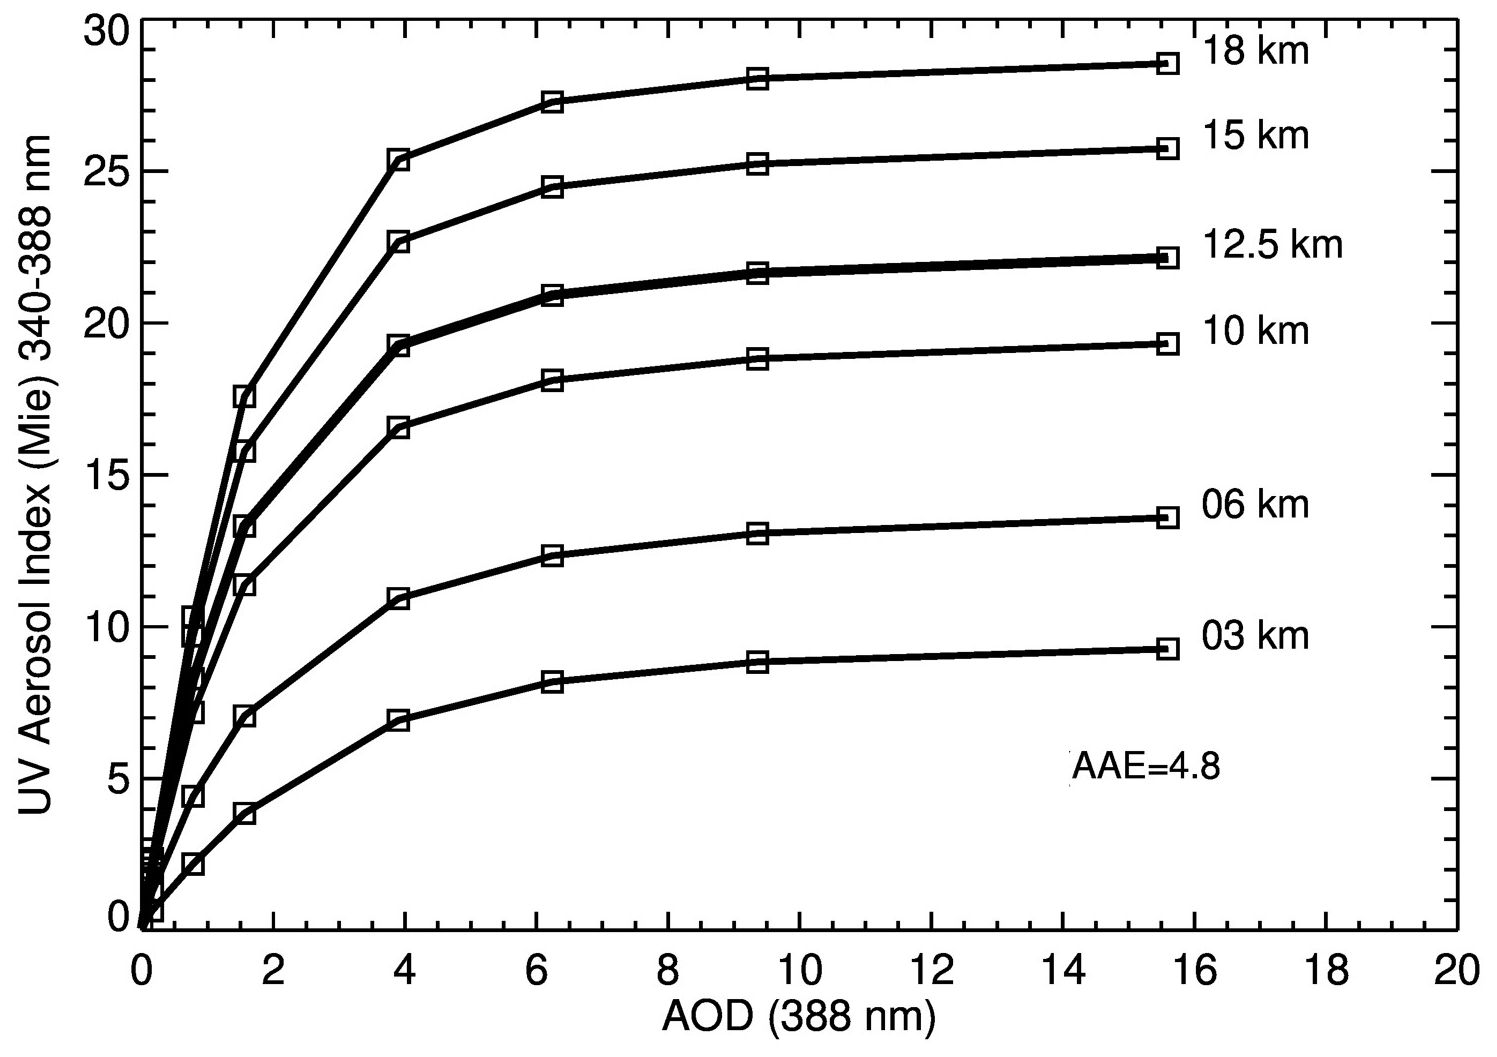
Figure 1Modeled relationship between UVAI and AOD as a function of ALH for carbonaceous aerosols with an assumed 340–388 nm aerosol absorption exponent of 4.8 (see text for details).
The magnitude of the aerosol UVAI signal depends mainly on AOD, ALH, and the aerosol absorption exponent (AAE). For instance, as shown in Fig. 1, for the OMI carbonaceous aerosol model (Torres et al., 2013) and an AAE of 4.8 (i.e., imaginary component of refractive index at 340 nm about 70 % higher than at 388 nm), the UVAI increases rapidly with AOD and ALH up to AOD of about 4, at which point the sensitivity to AOD goes down rapidly. For AODs larger than 6, the UVAI saturates as aerosol absorption of Rayleigh-scattered photon peaks, and further UVAI enhancements are only possible for increased values of ALH and/or an enhanced aerosol absorption exponent (AAE). Thus, for AOD values larger than about 6, the UVAI effectively becomes a measure of ALH. Although most tropospheric aerosol events fall in the lower left section of Fig. 1 (AOD as large as 4.0 and UVAI as large as 8), observed cases of extraordinarily large UVAI values are generally associated with the injection of huge quantities of UV-absorbing aerosol particles in the upper troposphere–lower stratosphere (UTLS), such as ash layers in the aftermath of volcanic eruptions (Krotkov et al., 1999) or wildfire-triggered pyro-cumulonimbus (pyroCb) episodes (Torres et al., 2020).
The UVAI also contains non-aerosol-related information such as ocean color and wavelength-dependent land surface reflectance. It is calculated over the oceans and the continents for all cloud conditions and over ice- and/or snow-covered surfaces. TropOMAER UVAI explicitly accounts for the angular scattering effects of water clouds. By doing so the UVAI across-track angular dependence is reduced, and spurious nonzero values produced by the previously used representation of clouds as opaque Lambert equivalent reflectors (LERs; Torres et al., 2018) are largely eliminated.
2.1.2 Aerosol algorithm for cloud-free conditions
TROPOMI-measured radiances at 354 and 388 nm are input into a two-channel inversion algorithm that simultaneously retrieves AOD and SSA for cloud-free conditions (Torres et al., 2007, 2013). Precalculated lookup tables (LUTs) of top-of-atmosphere reflectances for predefined aerosol types, with nodal points on AOD, SSA, ALH, surface reflectance, and viewing geometry, are used in the inversion process. Ancillary information on surface albedo, ALH, and surface type (Torres et al., 2013) is required.
In the inversion algorithm, it is assumed that for each pixel, the aerosol load can be uniquely represented by one of three types: carbonaceous, desert dust, or sulfate particles. Each aerosol type is associated with assumed bimodal particle size distributions and the real component of the refractive index (Torres et al., 2007; Jethva and Torres, 2011). Carbonaceous and sulfate particles are assumed to be spherical, whereas desert dust aerosols are modeled as nonspherical particles (Torres et al., 2018). UV-absorbing aerosol types are easily differentiated from the non-absorbing kind based on UVAI interpretation. As in the heritage algorithm, observations of carbon monoxide (CO) by AIRS (Atmospheric Infrared Sounder) on the Aqua satellite are used as a tracer of carbonaceous aerosols to separate them from desert dust particles (Torres et al., 2013).
Because of the known sensitivity of satellite-measured UV radiances emanating from UV-absorbing aerosols to ALH (Torres et al., 1998), aerosol layer altitude is prescribed using a combination of a monthly ALH climatology based on CALIOP (Cloud–Aerosol Lidar with Orthogonal Polarization) and transport model calculations (Torres et al., 2013).
For each cloud-free, fully characterized pixel in terms of satellite viewing geometry, surface albedo and type, ALH, and aerosol type, a set of AOD and SSA (388 nm) values is extracted from the LUTs by direct matching to the measured radiances. The aerosol absorption optical depth (AAOD), given by the product of AOD and the single-scattering co-albedo (1-SSA), is also reported. In addition to the nominal 388 nm wavelength, parameters are also reported at 354 and 500 nm using the assumed extinction and absorption spectral dependence of the predefined aerosol models.
Future algorithm enhancements will explore the utilization of TROPOMI-retrieved information on ALH and CO, as well as the additionally available spectral measurements for aerosol typing.
Retrievals are carried out over all ice- and snow-free land surface types. Over the oceans, retrievals are made only for pixels characterized by UVAI larger than about 1.0, indicating the clear presence of absorbing aerosols in the atmospheric column. No attempt is made to retrieve properties of weakly absorbing or non-absorbing aerosols over the ocean because of the difficulty in separating the atmospheric aerosol signal from that of ocean color. TropOMAER uses an ESA-produced cloud mask based on sub-kilometer-resolution radiance measurements at 1.385 µm by the NOAA (National Oceanic and Atmospheric Administration) Visible Infrared Imaging Radiometer Suite (VIIRS) on the S-NPP (Suomi-National Polar-orbiting Partnership) platform, re-gridded to the TROPOMI spatial resolution (Siddans, 2016a, b). On 7 March 2020 (TROPOMI orbit 12432), the initial NOAA VIIRS cloud mask used with TROPOMI was replaced with the NOAA Enterprise Cloud Mask (ECM) product. The availability of this product, which facilitates the identification of TROPOMI pixels suitable for aerosol AOD–SSA retrieval, is the only algorithmic improvement of TropOMAER in relation to OMAERUV. The heritage algorithm uses thresholds in measured reflectance, UVAI, and aerosol type (Torres et al., 2013) to identify minimally cloud-contaminated pixels for aerosol retrieval.
2.1.3 Retrieval of above-cloud aerosol optical depth
When absorbing aerosol are present above clouds in overcast conditions, TROPOMI observations at 354 and 388 nm are used to simultaneously retrieve the above-cloud aerosol optical depth (ACAOD) of carbonaceous or desert aerosols and the optical depth of the underlying cloud (COD) corrected for aerosol absorption effects (Torres et al., 2014).
The algorithmic approach is similar to that of the cloud-free case, except that the two retrieved parameters are ACAOD and COD. Information on single-scattering albedo is currently prescribed using an OMI-based long-term SSA climatology (Jethva et al., 2018). The steps involved in aerosol type selection and ALH determination are the same as in the cloud-free retrieval algorithm. A detailed description of the algorithm physical basis and derived products is given in Torres et al. (2014) and Jethva et al. (2018).
2.2 Calibration
In this work, we use the UV–Vis (UV–visible) band 3 of the TROPOMI level 1b product (Kleipool et al., 2018). TROPOMI version 1 reflectances for band 3 are within 5 %–10 % compared with OMI and OMPS (Rozemeijer and Kleipool, 2019a, b). It is expected that the upcoming version 2 of the TROPOMI level 1b product will solve inconsistencies of the radiometric calibration detected in the UV and UV–Vis spectrometers using in-flight measurements, and it will include degradation correction for the affected bands (Ludewig et al., 2020).
For this application, we use TROPOMI correction coefficients at 354 and 388 nm derived using an ice-reflectance-based vicarious approach that has been used to evaluate the calibration of UV–Vis sensors (Jaross and Warner, 2008).
TROPOMI-measured reflectances over Antarctica on 28 and 29 November 2017 were compared to radiative transfer model results. We calculate the ratio of each observed across-track ground pixel's reflectance at a specified wavelength to that of the modeled value for the same viewing conditions to obtain an error for that measurement. The model used is exactly the same as was used in the generation of OMI Collection 3 level 1b data (Dobber et al., 2008). The static corrections applied to TROPOMI reflectances elsewhere on the globe were derived by first averaging over all measurement errors at a given across-track position, then further smoothing with a five-pixel boxcar in the across-track direction. Corrections range from −4 % to +2 % in the across-track direction for the two wavelengths. We plan to repeat the calibration adjustments and to reprocess when an improved version 2 of the level 1b product is released by the ESA.
Improved performance of the TropOMAER algorithm in relation to the OMI heritage algorithm is expected as a consequence of both instrumental and algorithmic enhancements. The TROPOMI 5.5×3.5 km2 spatial resolution represents a factor of 16 improvement in relation to OMI's 13×24 km. In addition to its finer nadir resolution, TROPOMI's extreme off-nadir resolution does not increase as much as OMI's. As discussed in Sect. 2.1, the TROPOMI-dedicated VIIRS cloud mask is the only algorithmic improvement in the current version of TropOMAER.
In this section, we evaluate the TropOMAER UVAI product in relation to its OMAERUV predecessor and also compare it to the operational ESA/KNMI (Koninklijk Nerderlands Meteorogisch Instituut) TROPOMI UVAI product (Stein Zweers, 2018a, b). We also evaluate the accuracy of TROPOMI quantitative AOD and SSA aerosol products by comparison to ground-based independent observations. TROPOMI-derived aerosol parameters are also compared to OMI results during the same time and in similar regions.

Figure 2Observed UVAI on 18 August 2018 over North America from (a) OMI observations, (b) TROPOMI observations using the NASA algorithm, and (c) the TROPOMI operational ESA/KNMI product.
3.1 UV aerosol index evaluation
Two consecutive orbit views by OMI and TROPOMI of the smoke plume from the Pacific Northwest fires on 18 August 2018 are shown in Fig. 2. OMI's depiction of this event appears in Fig. 2a, whereas Fig. 2b illustrates the same aerosol feature as reported by the TropOMAER algorithm. Both products cover a similar range of UVAI values from a slightly negative background to values as high as 10. OMI's coarse spatial resolution, however, is in stark contrast to TROPOMI's fine resolution that allows for the mapping of the smoke plume UVAI signal with an unprecedented level of detail. Missing data in OMI's depiction in Fig. 2a is associated with the row anomaly that has reduced the sensor's observing capability by nearly 50 % since about 2008 (Torres et al., 2018; Schenkeveld et al., 2017). Figure 2c shows the operational TROPOMI ESA/KNMI UVAI product for the same event. The main difference between the NASA (Fig. 2b) and ESA/KNMI (Fig. 2c) UVAI products is the background values that, while near zero for the NASA product, reach values a low as −2 for the KNMI product. The large background difference between the two products is likely the combined effect of calibration uncertainties in the operational ESA/KNMI product and algorithmic differences in the treatment of clouds in the calculated component of the UVAI definition. In the KNMI UVAI calculation, clouds are modeled as opaque reflectors at the ground (Herman et al., 1997), whereas in the NASA UVAI, clouds are explicitly modeled as polydispersions of liquid water droplets using Mie theory (Torres et al., 2018). A comparative analysis of OMAERUV and TropOMAER UVAI is presented in Sect. 3.3.
3.2 Evaluation of retrieved aerosol optical depth and single-scattering albedo
We separately evaluate the effect of instrumental and algorithmic improvements in the TropOMAER retrieval algorithm by direct comparison of the satellite product to ground-based globally distributed (over land) level 2 version 3 measurements of AOD (Giles et al., 2019) by the Aerosol Robotic Network (AERONET; Holben et al., 1998).
Table 1AERONET sites used for the AOD validation analysis presented in this study.
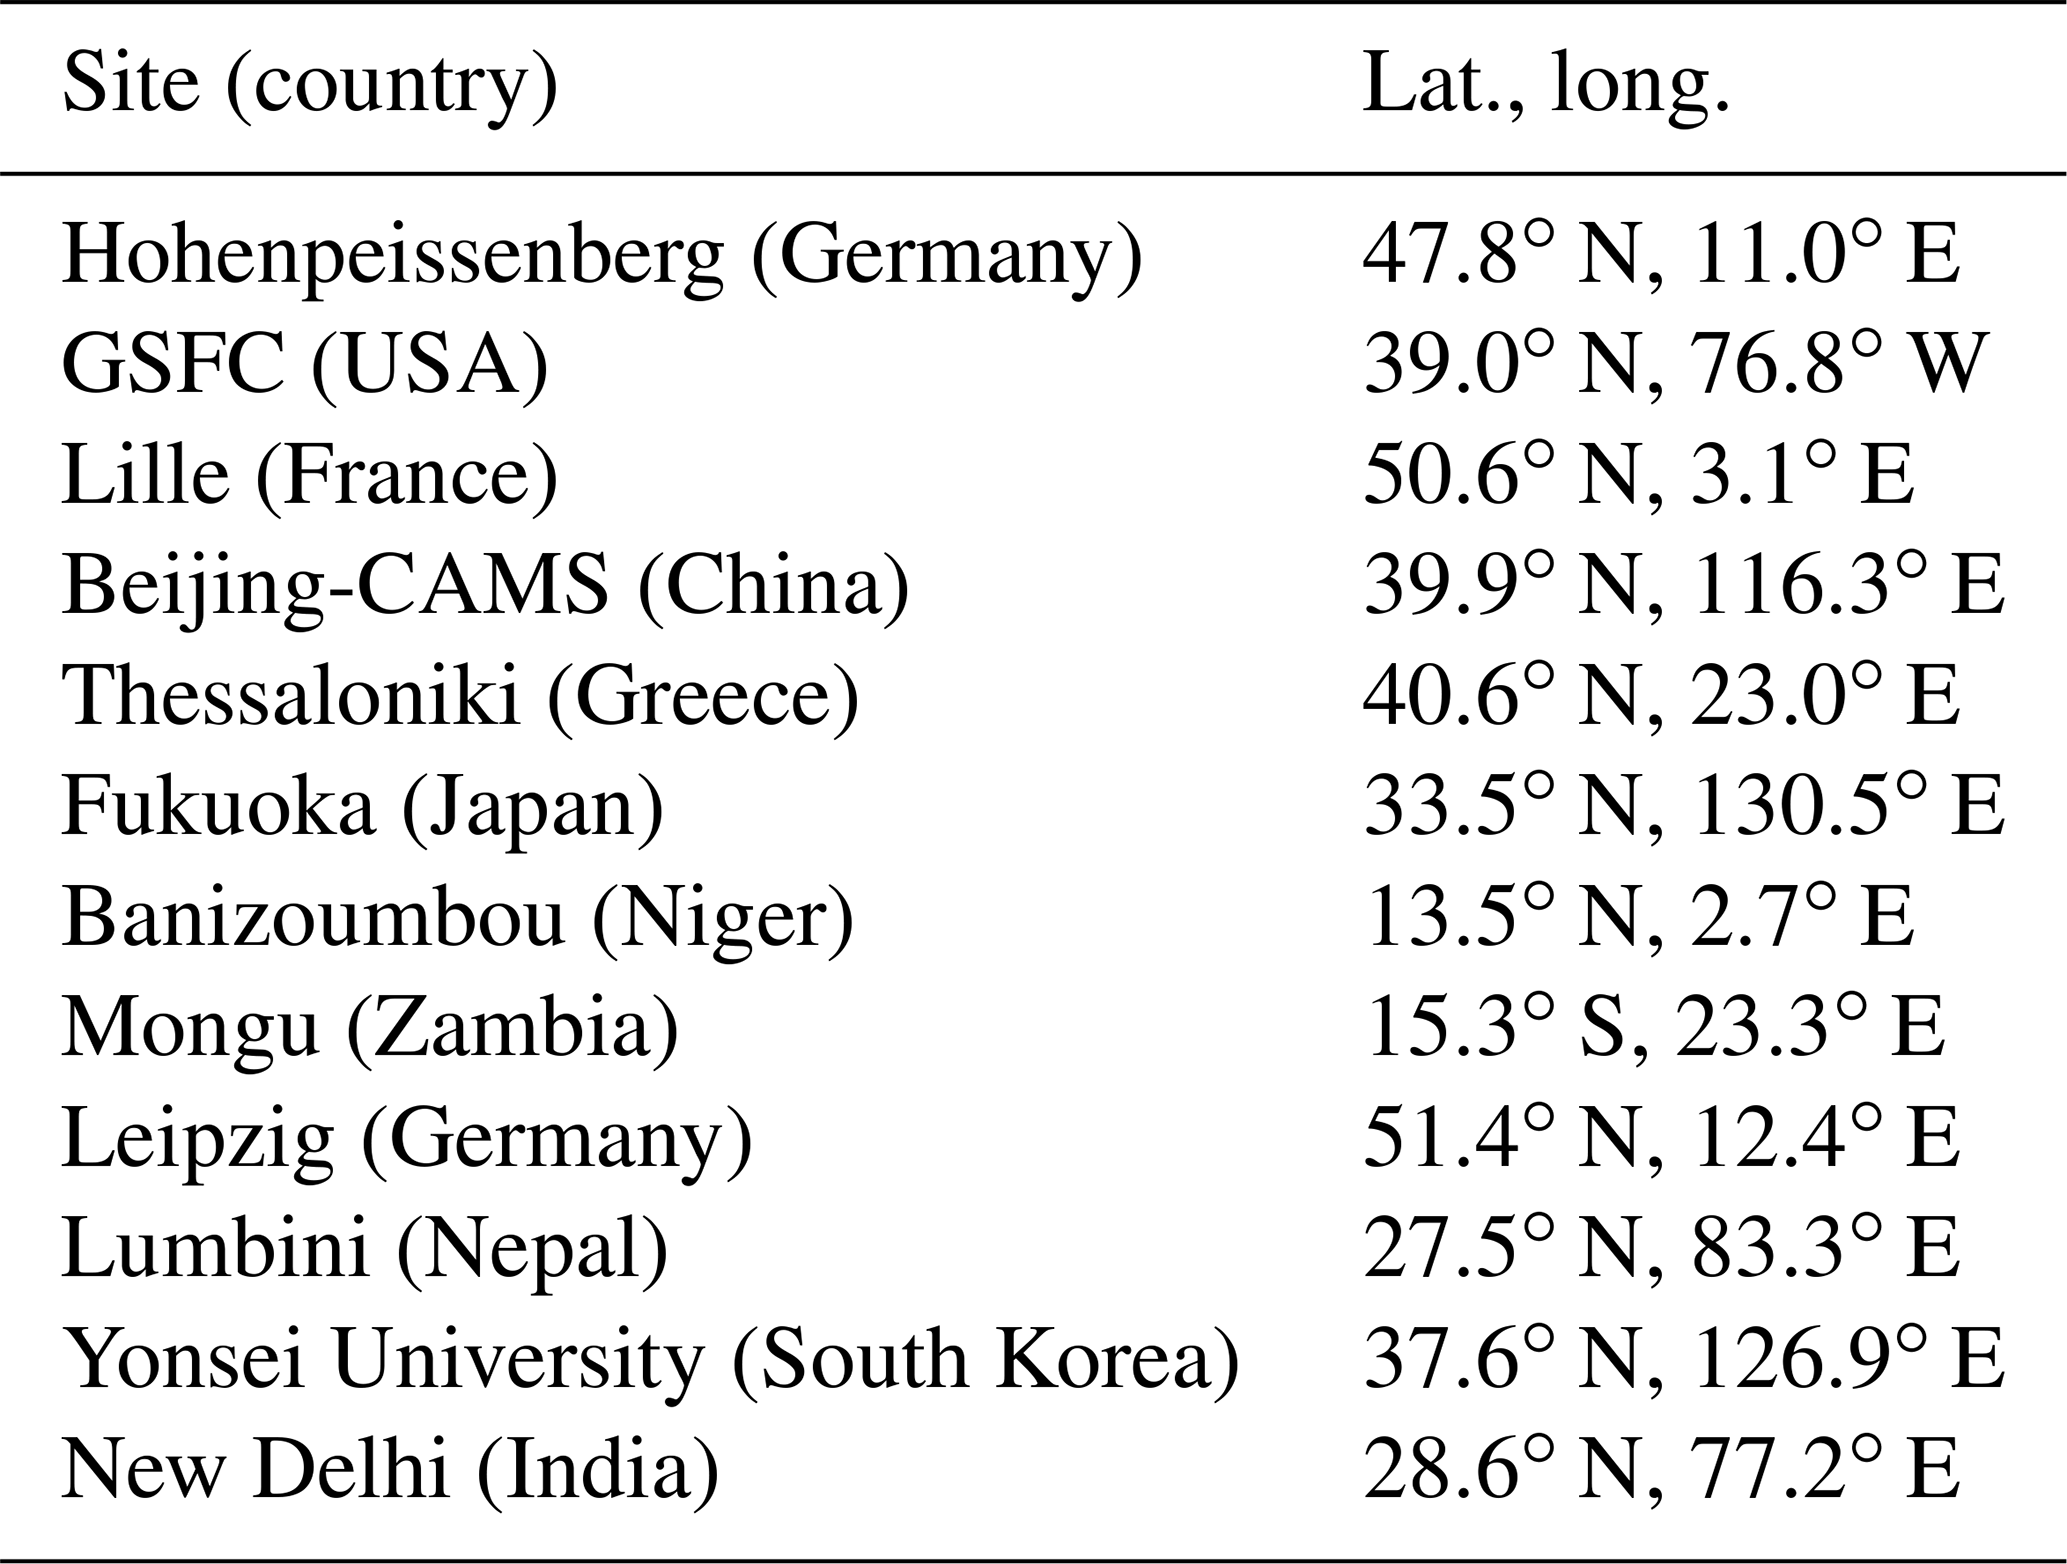
Measurements of AOD at 380 nm are available at most AERONET sites, allowing for a direct comparison to OMI and TROPOMI 388 nm retrievals. No attempt was made to account for the small AERONET–TROPOMI wavelength difference. AERONET AOD measurements at the 12 sites listed in Table 1 over a 2-year period (May 2018 through May 2020) were used in the analysis. These locations were chosen based on the availability of 380 nm AOD measurements and on the representativity of environments where most common aerosol types (carbonaceous, desert dust, and sulfate-based) are observed.
3.2.1 Impact of TROPOMI's fine resolution on AOD retrieval
We first analyze the impact of the enhanced spatial resolution by independently comparing OMI retrievals by the OMAERUV algorithm and TropOMAER AOD inversions to AERONET measurements over the selected set of AERONET sites. In this validation exercise, the VIIRS cloud mask is ignored, and the heritage algorithm cloud mask (Torres et al., 2013) is applied to both OMI and TROPOMI observations. Resulting relevant statistics for the two validations were compared. These statistics, based on an admittedly small sample of observations, are only intended to illustrate the relative improvement in the accuracy of retrieved parameters associated with TROPOMI-enhanced instrumental and algorithmic capabilities with respect to OMI. This is by no means an exhaustive validation exercise of the TROPOMI record for which a lot more AERONET observations are needed.
Table 2Summary of statistics of comparisons between AERONET-measured and satellite-retrieved AOD at 12 locations (column 1) by the OMAERUV algorithm (column 2), TropOMAER heritage algorithm (column 3), and TropOMAER algorithm with VIIRS cloud mask (column 4).
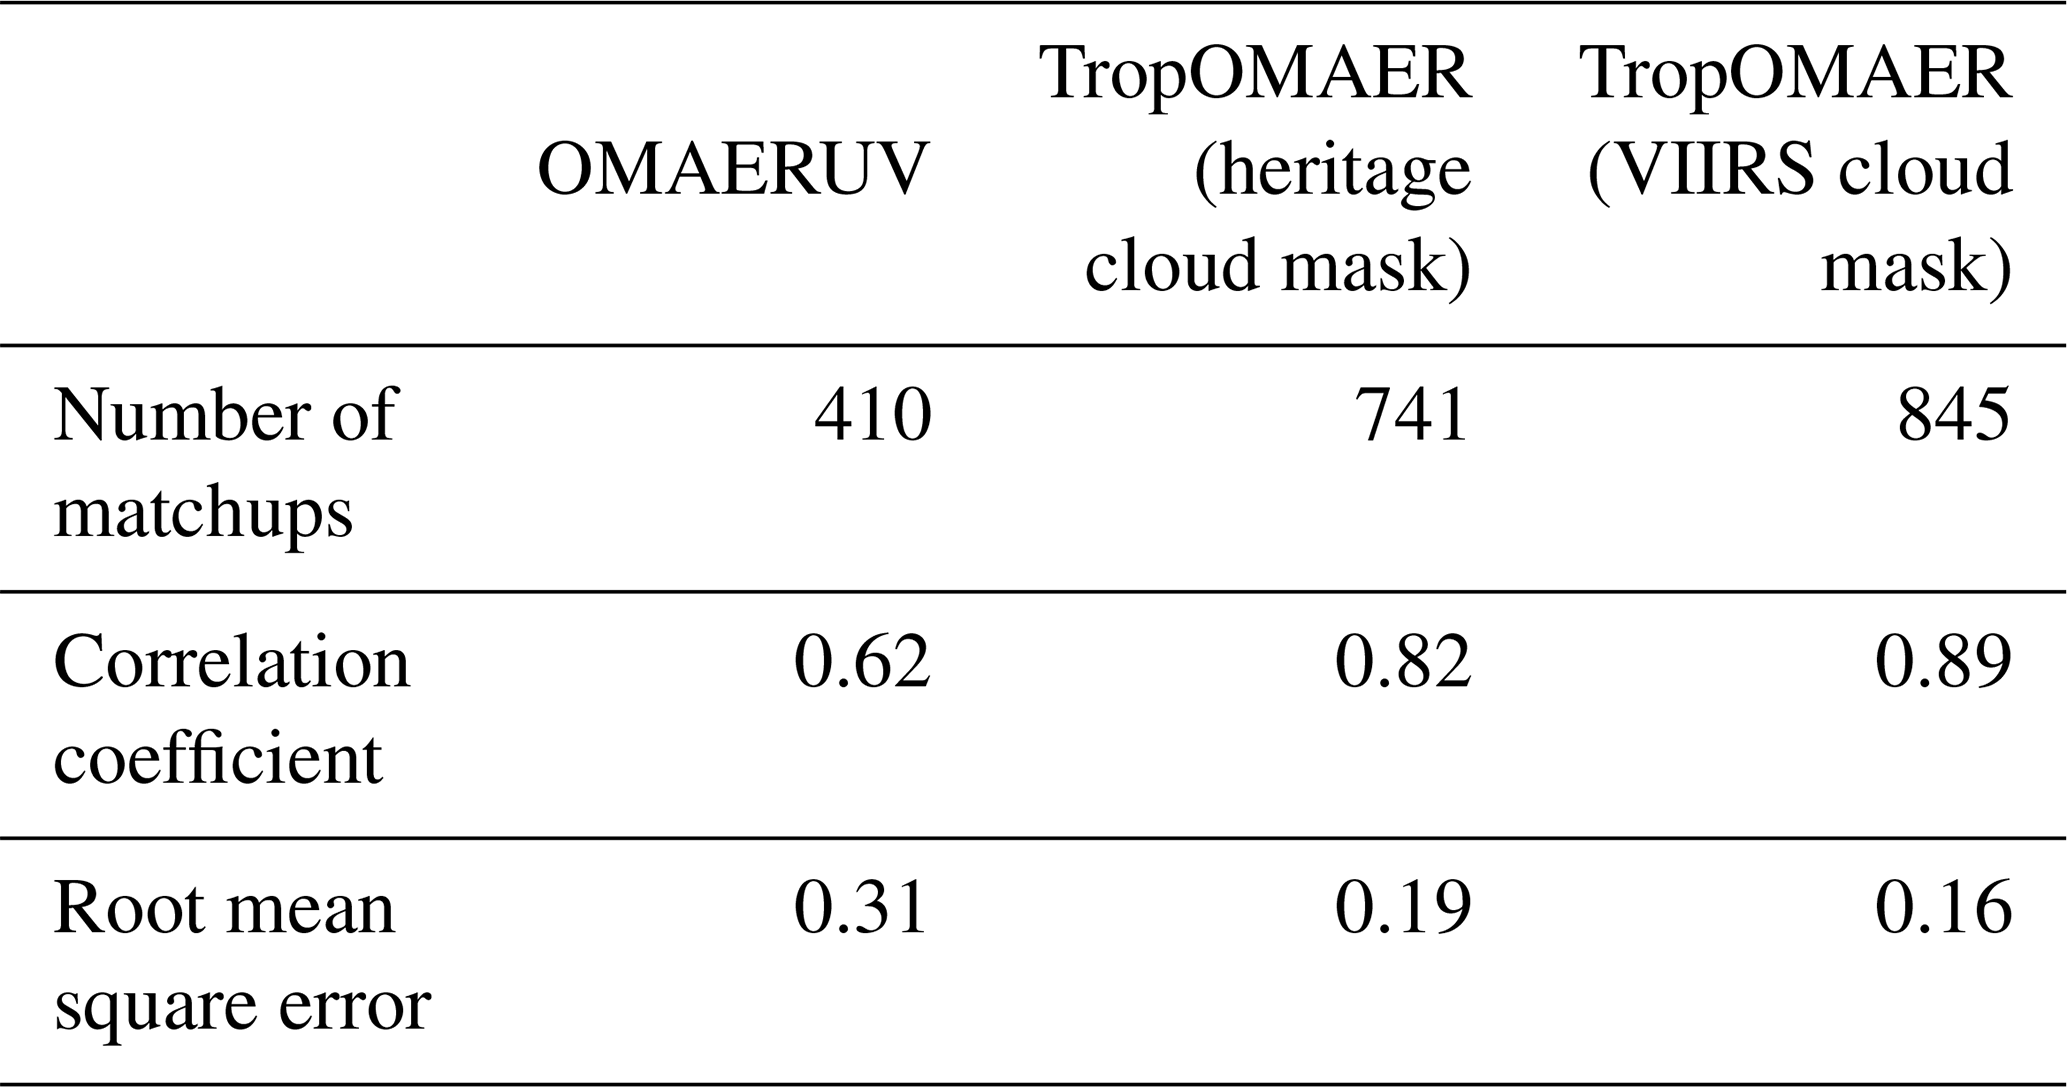

Figure 3AERONET–satellite comparisons of OMI-retrieved 388 nm AOD (a), TROPOMI using heritage cloud screening (b), and TROPOMI using VIIRS cloud mask (c). The dotted line indicates the one-to-one line, and dashed lines represent expected retrieval uncertainty (largest of 0.1 % or 30 %). See text and Table 2 for details.
Ground-based AOD values averaged within ±10 min of the satellite overpass are compared to spatially averaged retrievals by OMAERUV within a 40 km radius and by TropOMAER within 20 km (because of the smaller pixel size) of the AERONET site. Figure 3 shows scatter plots of the AERONET–satellite comparisons at the combined 12 sites for OMAERUV (Fig. 3a) and TropOMAER (Fig. 3b). The dotted envelope lines indicate the calculated expected uncertainty of retrieved AOD (larger of 0.1 % or 30 %) associated with uncertainties in assumed ALH and cloud contamination (Torres et al., 1998, 2007). The calculated relevant statistics are listed in columns 2 and 3 of Table 2. The TROPOMI–AERONET comparison yields 741 matchups compared to OMI's 410, representing an 80 % increase. The larger number of coincidences is the result of the combined effect of TROPOMI's finer spatial resolution and the OMI row anomaly. In spite of a large number of outliers in the lower AOD range (up to about 0.7) coming from a few sites (see Sect. 3.2.2), the TROPOMI–AERONET comparison in Fig. 3b yields an improved correlation coefficient (0.82) with respect to the one (0.60) associated with the OMI observations. The lowest OMAERUV-reported correlation coefficients are associated with outlying large AOD estimates resulting from mixtures of UV-absorbing aerosols and clouds, which are difficult to identify at OMAERUV's coarse spatial resolution. Resulting root mean square error (RMSE) values are 0.31 and 0.19 for OMI and TROPOMI, respectively. The reported statistics suggest a clear performance improvement of the TROPOMI algorithm directly linked to the sensor's smaller pixel size.
3.2.2 Effect of VIIRS cloud masking on AOD retrieval
The effect of using the VIIRS cloud mask re-gridded to the S5P resolution (Siddans, 2016a, b) to identify cloud-free pixels was evaluated by means of a third validation exercise. This time, the TROPOMI–AERONET comparison was carried out for an enhanced TropOMAER algorithm that makes use of the VIIRS dedicated cloud mask. The scatter plot illustrating the outcome of the later comparison is shown in Fig. 3c. The corresponding correlation coefficient and root mean square errors are listed in column 4 of Table 2. An inspection of columns 3 and 4 shows that using the VIIRS cloud mask translates into an increase in the number of matchups of over 100 (to 845), a higher correlation coefficient (0.89), and a slightly improved RMSE (0.16) value than that reported for the TropOMAER algorithm with the heritage cloud mask. A slightly reduced number of TROPOMI AOD outliers in the 0 to 0.5 range are still observed in Fig. 3c. A close examination of the source of those points indicates that most of them come from likely cloud-contaminated observations at the Banizoumbou, Beijing, and Mongu sites (shown in the scatter plots for each of the 12 sites in the analysis shown in Appendix A) where carbonaceous aerosols and sub-pixel-sized clouds coexist, making cloud screening a particularly difficult task.
3.2.3 SSA evaluation
An analysis similar to that carried out for AOD evaluation is performed for SSA using the AERONET version 3 level 2 inversion product (Sinyuk et al., 2020). The AERONET inversion algorithm that infers aerosol particle size distribution and complex refractive index (from which SSA is calculated) does not include measured sky radiances or retrieved AOD at wavelengths shorter than 440 nm. Therefore, the evaluation of OMI- and TROPOMI-retrieved 388 nm SSA requires a wavelength transformation of the satellite products to 440 nm based on the assumed spectral dependence of absorption for each aerosol type in the algorithm (Jethva et al., 2014). Unlike in the AOD validation, in which the AERONET observation is considered a ground-truth measurement, the AERONET SSA product is the result of a remote sensing inversion and, just like the satellite retrievals, subject to nonunique solutions. Thus, the AERONET–satellite SSA analyses discussed here cannot be regarded as a validation of the satellite product, but merely a comparison of the outcome of two independent inversion methods.
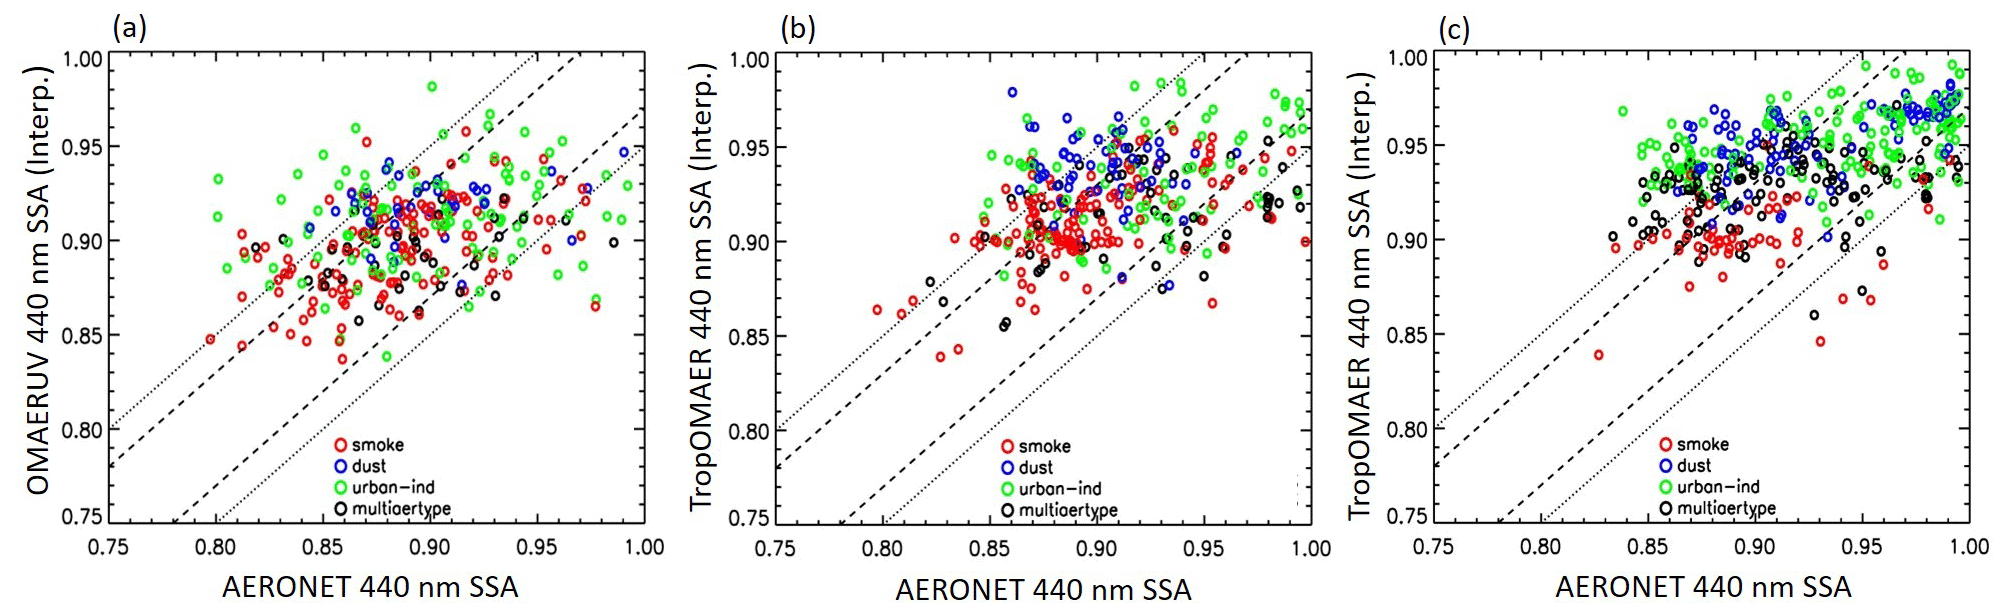
Figure 4As in Fig. 3 for single-scattering albedo of dust aerosols (blue), smoke aerosols (red), urban–industrial aerosols (green), and aerosol mixtures (black). The dashed line indicates agreement ±0.03, and the solid line indicates agreement ±0.05.
Since AERONET-retrieved SSA is accurate within 0.03 for 440 nm AOD ≥ 0.4 (Dubovik et al., 2002; Sinyuk et al., 2020), observations at many sites are required to get meaningful statistics. Thus, OMI and TROPOMI SSA retrievals were averaged in a grid box of size 0.5∘ × 0.5∘ centered at the AERONET station at 164 sites. Because AERONET SSA derived from almucantar scans is considered unreliable near noon (Dubovik et al., 2002) when a satellite overpass occurs, the AERONET level 2 SSA data were averaged within a ±3 h window from the TROPOMI overpass time under the implicit (and admittedly untested) assumption that SSA does not vary significantly throughout the day. The chosen 6 h temporal window allows for early morning and late afternoon inversions that are expected to have better accuracy due to larger solar zenith angle and longer atmospheric path length. Although the version 3 AERONET product has recently introduced hybrid scans aimed at sampling larger air masses covering a wider range of scattering angles during the middle of the day, only a fraction of currently deployed sensors are capable of such measurements (Sinyuk et al., 2020).
Table 3Number of coincidences, root mean square difference, and percent of SSA retrievals within 0.03 and 0.05 of AERONET values (column 1) for OMAERUV (column 2), TropOMAER with heritage cloud mask, and TropOMAER with VIIRS cloud mask (column 3).
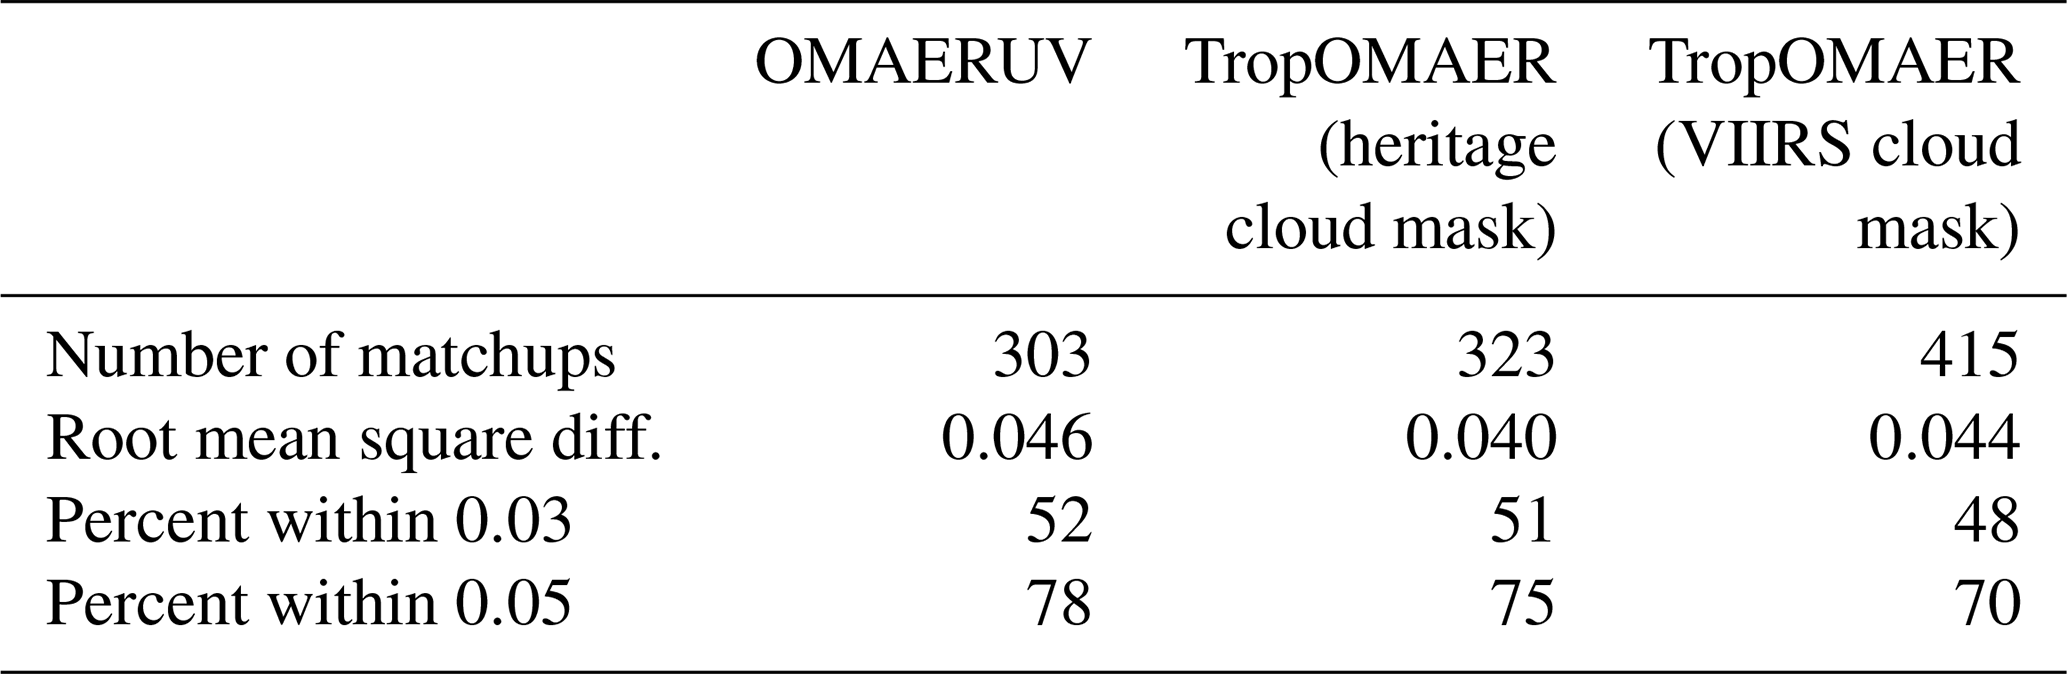
Similarly to the previously described AOD validation exercise, satellite-AERONET SSA comparisons were made by independently applying the heritage cloud screening to OMAERUV retrievals and both heritage and VIIRS-based cloud masking approaches to TropOMAER. Figure 4 displays the results of the comparison for different aerosol types. The AERONET–OMI analysis is shown in Fig. 4a, and the result of the AERONET–TROPOMI comparison using heritage cloud screening is displayed in Fig. 4b, whereas the outcome when using the VIIRS cloud mask in the TROPOMI inversion appears in Fig. 4c. A numerical summary of the results is presented in Table 3. In a similar fashion as observed in the AOD retrieval evaluation, the number of coincidences increases from 303 for OMI to 323 for TROPOMI with heritage cloud screening and to 415 for the TROPOMI–VIIRS cloud mask combination. The reported root mean square difference (RMSD) between the two measurements varies little among the three comparisons. The percent of retrievals within the stated uncertainty levels is marginally better for OMI than TROPOMI with heritage cloud screening and significantly better for OMI than TROPOMI with the VIIRS cloud mask. A visual inspection of Fig. 4 shows that the satellite-retrieved SSA for dust is overestimated for AERONET SSA values lower than about 0.9 in the three comparisons. The observed apparent overestimation of the satellite SSA values for desert dust aerosols (blue symbols) in the OMI comparisons (Fig. 4a) has been previously observed and discussed in the literature (Jethva et al., 2014). The apparent overestimation shown in the TROPOMI results (Fig. 4b and c) is discernibly larger than seen in the OMI data (Fig. 4a). Figure 4b and c also show a clear overestimate in the retrieved SSA of smoke aerosols (red symbols) not seen in the OMI retrievals in Fig. 4a. In general, for all three aerosol types, TROPOMI SSA retrievals are seemingly biased high by 0.01–0.02 compared to those from OMI, suggesting a possible connection with remaining TROPOMI L1 calibration issues.
3.3 OMI–TROPOMI long-term continuity
The continuity of the OMI and TROPOMI records of aerosol properties is analyzed in this section. Monthly average values of AOD and AAOD for the May 2018 to May 2020 2-year period are calculated for three regions: the eastern United States (EUS) between 25–45∘ N and 60–90∘ W, southern Africa (SAF) bounded by 5–25∘ S and 15–35∘ E, and the Saharan desert (SAH) zone between 15–30∘ N and 30∘ E–10∘ W. The EUS region is representative of areas predominantly associated with non-absorbing aerosols and clouds. The SAF region is known as an important source area of carbonaceous aerosol–cloud mixtures, whereas the SAH region is the source area of the desert dust part, the most abundant aerosol type.
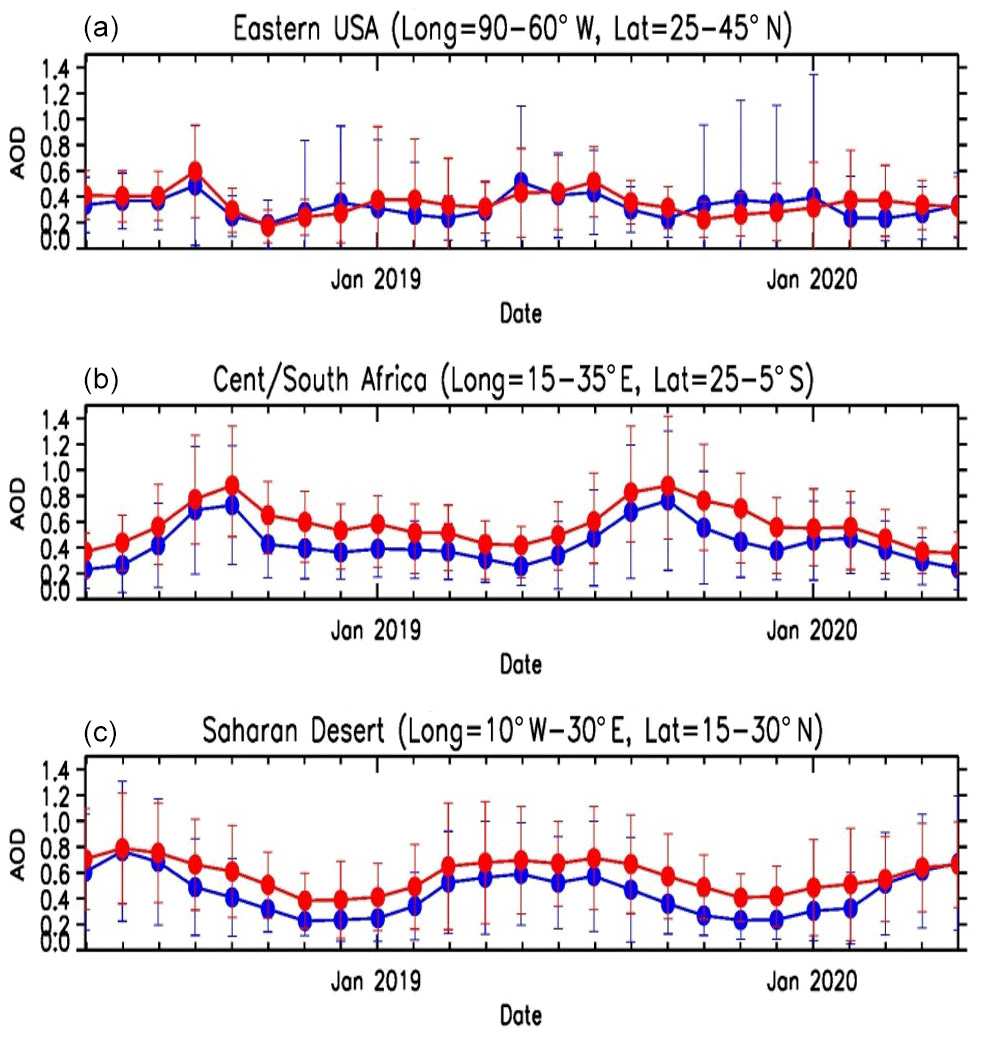
Figure 5The 2-year time series of monthly average OMI (in red) and TROPOMI (in blue) 388 nm AOD values for the eastern United States (a), southern Africa (b), and Saharan desert (c). Vertical lines indicate the standard deviation of the mean associated with both temporal and spatial variability.
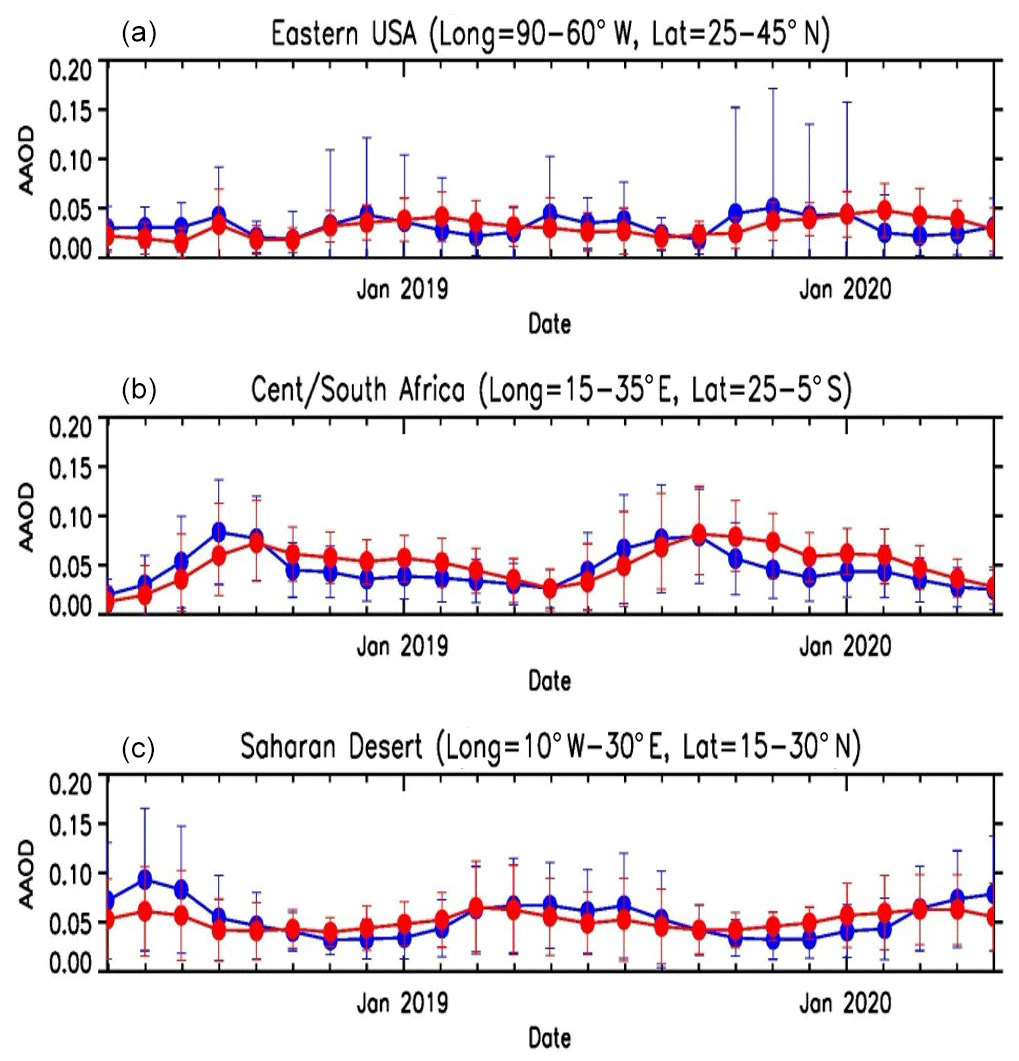
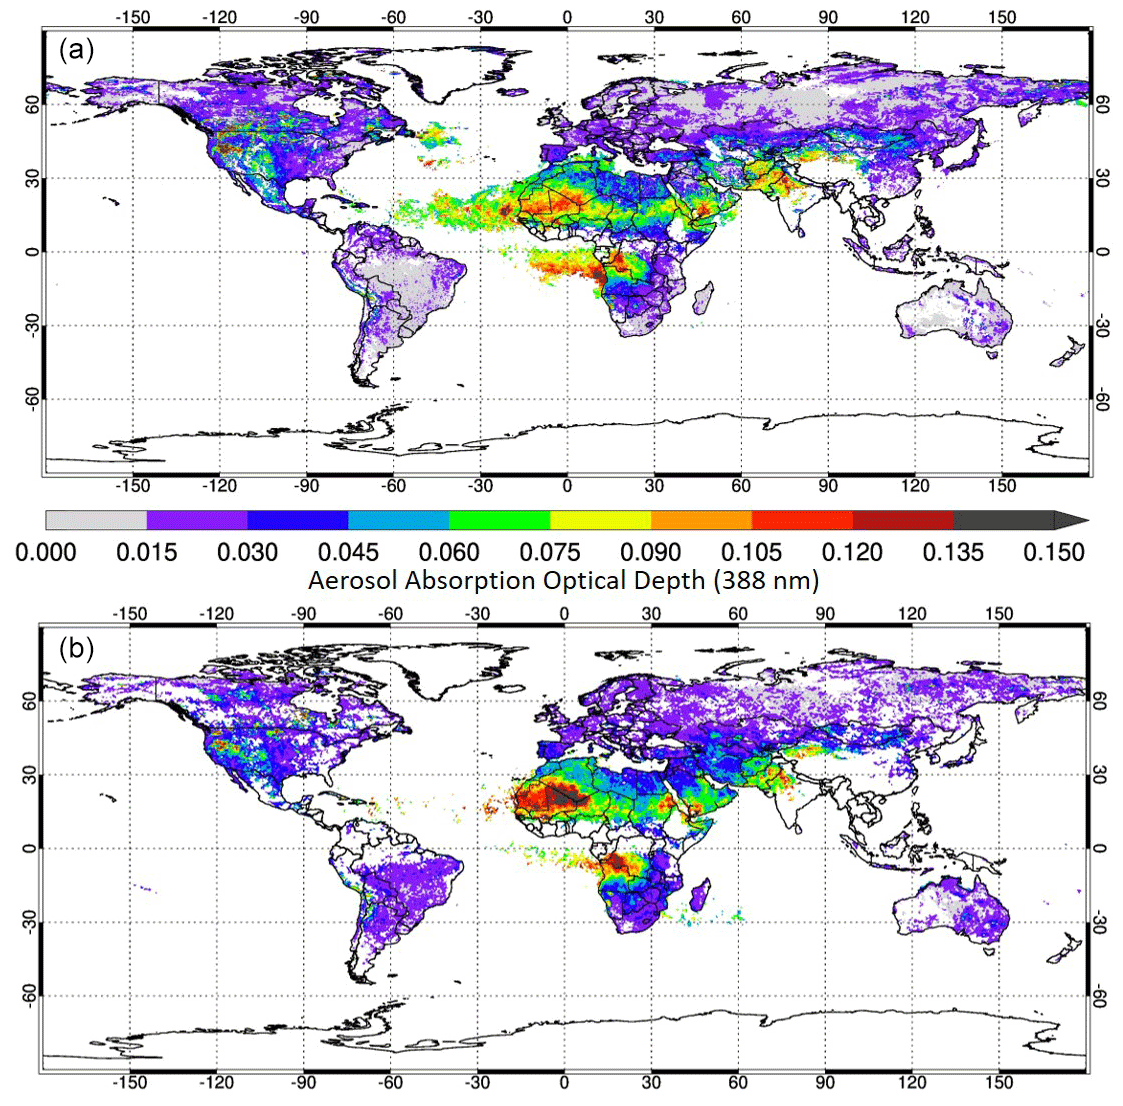
Figure 7NH summer season (June–July–August 2018) global map of 388 nm aerosol absorption optical depth from TROPOMI (a) and OMI (b) observations.
Figure 5 shows the 2-year AOD record produced by the OMAERUV (blue) and TropOMAER (red) algorithms for the three regions. TropOMAER-generated AOD values are consistently higher by about 0.2 than the OMAERUV record for the SAF and SAH regions where the absorbing aerosol load is typically large most of the year. The EUS region shows significantly smaller OMI–TROPOMI differences in monthly mean values. The comparison was also done using a TropOMAER version of the algorithm that uses the heritage cloud screening approach, yielding similar results.
Figure 6 depicts the 2-year record in terms of AAOD. Differences as large as 0.03 in the SAH region during the 2018 spring–summer months are significantly lower in the 2019 record. Overall, the AAOD time series over the three regions show closer agreement between the two sensors, suggesting a partial cancellation of retrieval errors in SSA and AOD when combined in the AAOD parameter.
Figure 7 shows global 3-month (June, July, August 2018) average maps of AAOD from TROPOMI (top) and OMI (bottom) observations. Seasonally occurring features, such as the Saharan desert dust signal over northern Africa and the smoke plumes associated with biomass burning over Namibia, Angola, and Congo, are clearly picked by both sensors with comparable AAOD values. Other continental aerosol features, such as a dust and smoke signal over the western US and smoke plumes from wildfires in the Northwest Pacific moving eastward across Canada, are detected at similar AAOD values by the two sensors, albeit with a higher level of detail in the TROPOMI product. Similar aerosol signals are also picked up by the two sensors over Saudi Arabia, northwest India, Pakistan, and western China. Perhaps the most striking continental difference in the seasonal map in Fig. 7 is the much larger OMI background AAOD in South America, possibly linked to the difficulty of removing sub-pixel cloud effects at OMI's resolution.
Surprisingly, OMI only shows a very scattered signal of the North Atlantic Saharan dust plume between northern Africa and the plume's leading edge north of Venezuela over the Caribbean, whereas the TROPOMI product shows an almost continuous North Atlantic plume. In spite of the geographically sparse nature of the OMI AAOD data, there is high consistency in the retrieved values by the two sensors. A similar but less severe difference is also observed over the South Atlantic, where the OMI-retrieved carbonaceous aerosol plume is more disperse than what is shown in the TROPOMI map. The combined effect of prevailing sub-pixel cloud contamination and OMI's row anomaly explains the spatially scattered OMI retrievals over the oceans.
Clearly, the full TROPOMI coverage at much higher spatial resolution than OMI and the high-resolution VIIRS cloud mask contribute to significantly improving the near-UV aerosol product.
The OMI and TROPOMI gridded 2018 monthly data used to produce the seasonal average maps discussed above are also displayed in Fig. 8 as density AAOD (left) and UVAI (right) plots. Although small offsets in UVAI (∼ 0.2) and AAOD (∼ 0.02) between the sensors are apparent, a high degree of correlation between the observations by the two instruments is clearly observed.
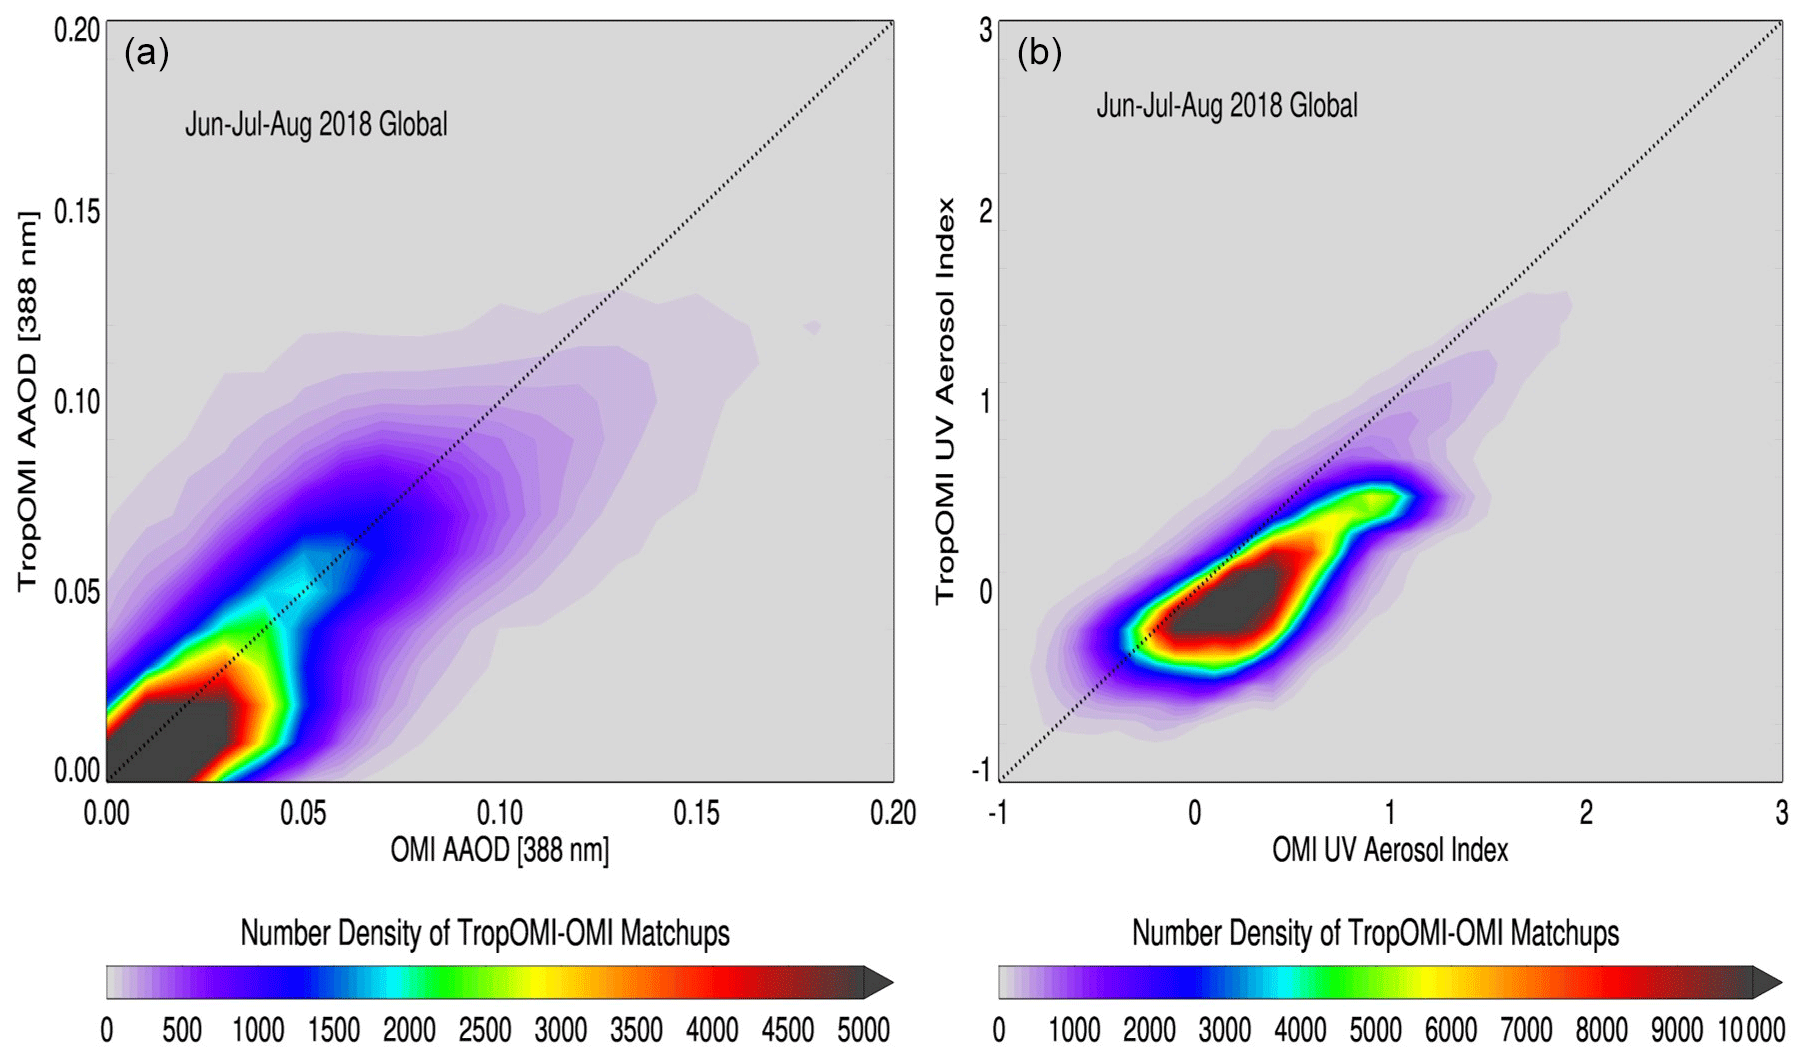
Figure 8Density plots of OMI (x axis) and TROPOMI (y axis) gridded monthly mean (June, July, August 2018) values of 388 nm AAOD (a) and UVAI (b). The dotted line indicates the one-to-one line of agreement.
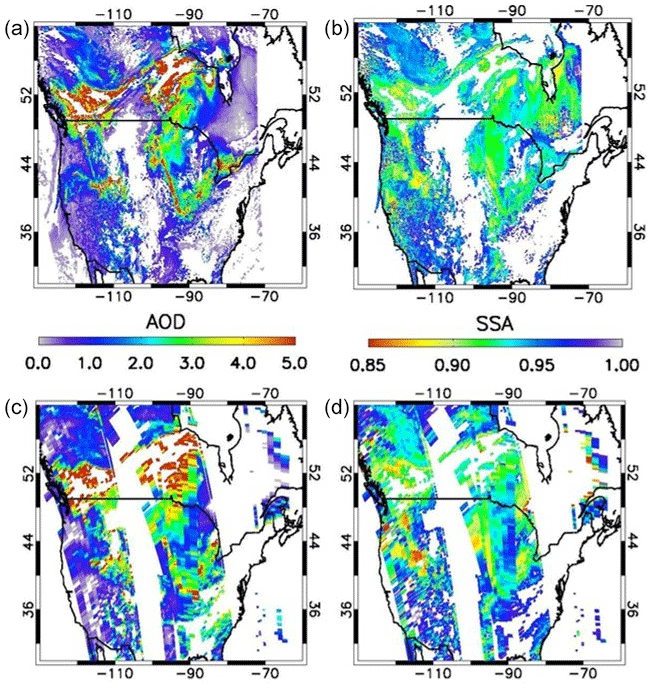
Figure 9Spatial distribution of 388 nm AOD (a, c) and SSA (b, d) on 18 August 2018 derived from TROPOMI (a, b) and OMI (c, d) observations.
In this section, we briefly discuss three major continental-scale aerosol events that took place during the 2-year period following the operational implementation of the S5P mission. The discussed cases include the occurrence of wildfire plumes in both hemispheres, while the third one is likely associated with agricultural practices involving biomass burning in the Amazon region.
4.1 2018 fire season in the northwestern USA and Canadian British Columbia
The 2018 fire season in the western USA and Canadian British Columbia territory was one of the most active of the last few years. It is estimated that over 8500 fires were responsible for the burning of over 0.8 million ha, which is the largest burned area ever recorded according to the California Department of Forestry and Fire Protection (http://fire.ca.gov, last access: 2 December 2020) and the National Interagency Fire Center (http://nfic.gov, last access: 2 December 2020). From mid-July to August, intense fires in northern California, including the destructive Carr and Mendocino Complex fires, produced elevated smoke layers that drifted to the east and northeast. In 2018, the British Columbia (BC) province of Canada encountered its worst fire season on record, surpassing the 2017 record with more than 2000 wildfires and 1.55 million ha burned and accounting for about 60 % of the total burned area in Canada in 2018 (https://www2.gov.bc.ca/gov/content/safety/wildfire-status, last access: 2 December 2020). Figure 9 shows the spatial extent of the smoke plume generated by wildfires in Canadian BC and the northwestern USA on 18 August in terms of the 388 nm AOD and SSA products from both TROPOMI (top) and OMI (bottom) observations (the corresponding UVAI depiction is shown in Fig. 2). Observed gaps in the core of the plume are due to out-of-bounds retrieval conditions. The carbonaceous aerosol layers produced by the fires spread over a huge area, covering large regions of the US Midwest and central Canada. The height of the aerosol layer varies between 3 and 5 km according to CALIOP observations (not shown). Although OMI's coarse resolution and row-anomaly-related reduced spatial coverage are clearly observable, the retrieved AOD and SSA fields by the two sensors look remarkably similar. TROPOMI and OMI AOD retrievals reach values as high as 5.0 near the sources, generally consistent with AERONET ground-based observations that, on this day, reported AOD values as large as 1.5 (412 nm) at the Lake Erie site (41.8∘ N, 83.2∘ W) and values in excess of 3.0 at the Toronto station (43.8∘ N, 79.5∘ W). SSA values in the range 0.85–0.92 are retrieved by both sensors over the extended area. Minimum OMI-retrieved SSA (0.85) in the vicinity of a source area, however, is lower by about 0.02 than the corresponding TROPOMI measurement, consistent with the relative OMI–TROPOMI SSA differences reported in Fig. 4.
4.2 Amazon Basin 2019 fires
Figure 10 shows the spatial distribution of the September 2019 average TROPOMI UVAI, AOD, and AAOD over the region between the Equator and 40∘ S and between 35∘ W and 85∘ W. Monthly average AOD values of around 2.0 prevailed over the source areas. The smoke plumes were mobilized downwind towards southern Brazil, reaching highly populated areas where TROPOMI-measured monthly average AOD in the range 0.9 to 1.0 are reported.
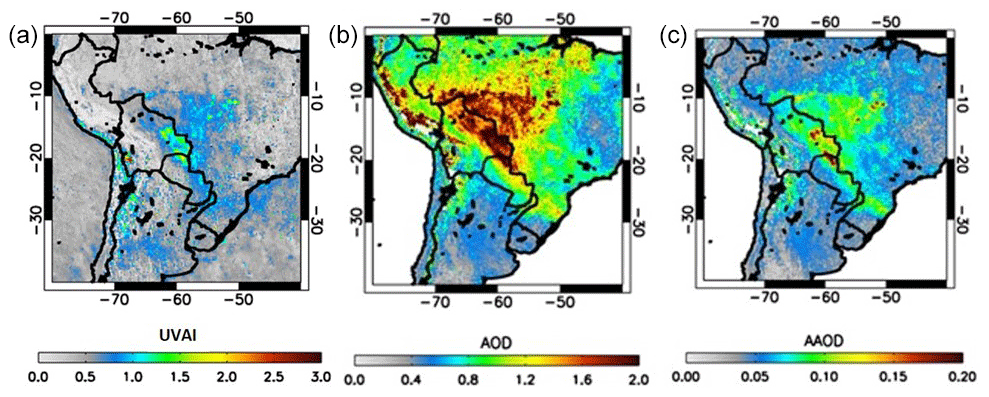
Figure 10September 2019 monthly average values of TROPOMI UVAI (a), 388 nm AOD (b), and AAOD (c) over South America.
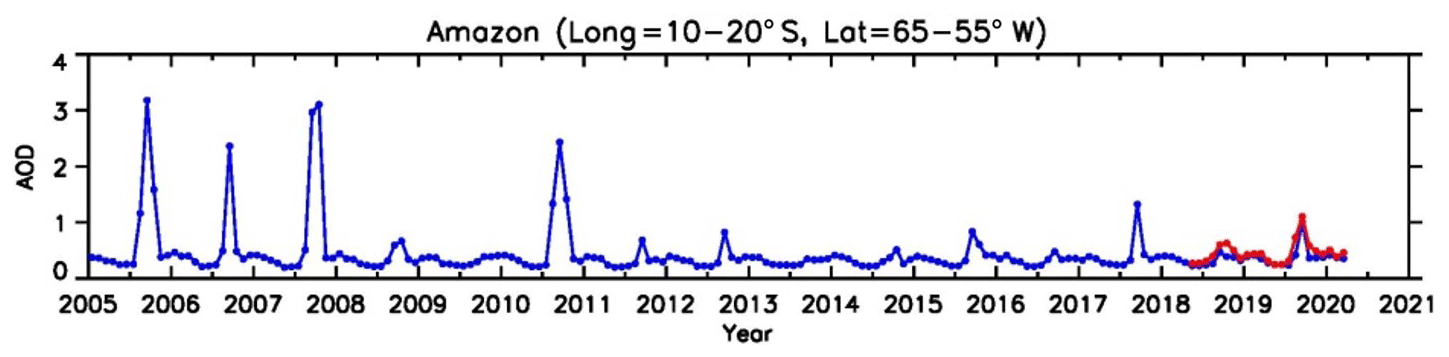
Figure 11Time series of 388 nm AOD over the Amazon Basin from OMI (blue line) and TROPOMI (red line) observations.
Figure 11 shows the time series of monthly average OMI 388 nm AOD over the region for the last 15 years, along with the overlapping TROPOMI AOD observations over the last 2 years, illustrating the importance of the continuity of the long-term record. Although, as discussed earlier, there are small differences in the time series between the two sensors, these differences are not large enough to question the ability to differentiate years with large seasonal events from years with comparably reduced biomass burning activity. The seasonal carbonaceous aerosol concentration over the Amazon Basin, associated with intense agriculture-related biomass burning, has significantly decreased over the last 12 years since 2008. The OMI record shows a remarkable decrease since 2008 when near-record-high values were observed (Torres et al., 2010). After consecutive AOD September peaks larger than 2.0, in the 3-year 2005–2007 period, the monthly average AOD over the Amazon Basin was reduced to values of about 0.5. An isolated abrupt increase to larger than 2.0 was again observed in 2010. Since then, the September peak AOD value has remained much lower than 1, except for 2017 and 2019 when September average AOD larger than unity was observed. The 2019 peak AOD value (1.25) was also retrieved by TROPOMI observations. Although the overall regional average was slightly larger than in the previous year, it was about a third of the 2010 peak value. As a result of the prevailing regional atmospheric dynamics in 2019, carbonaceous aerosols generated by seasonal biomass burning over regions up north were transported towards the southeast, reaching large urban centers such as São Paulo and Curitiba, generating a lot of media attention (Hughes, 2019).
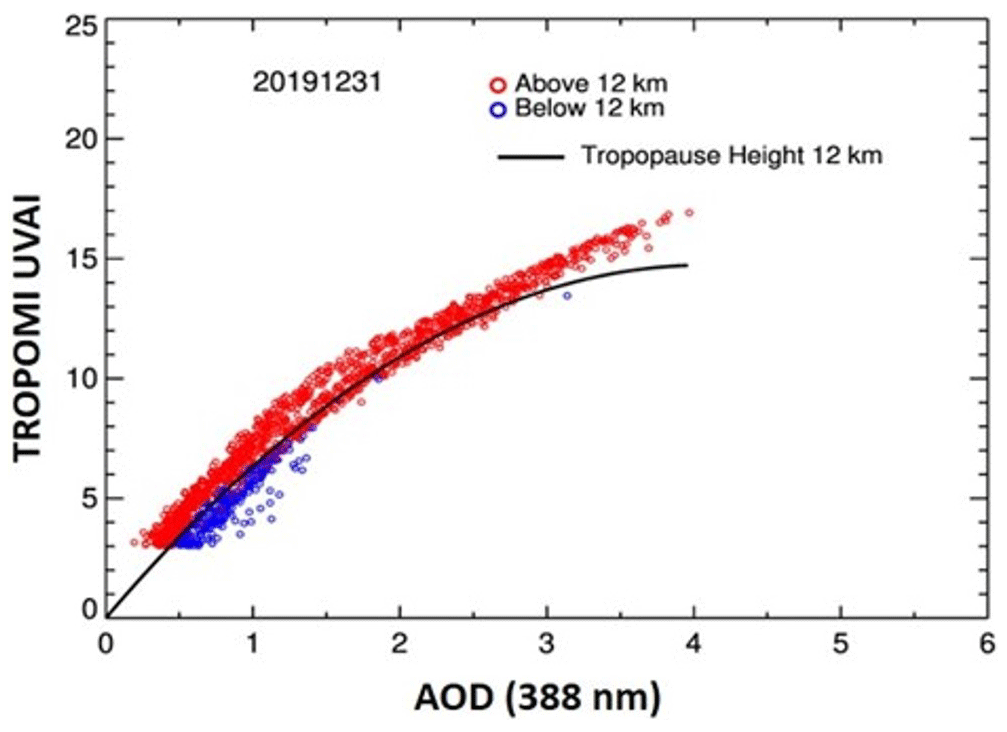
Figure 12UVAI–AOD relationship at ALH 12 km for the 2019–2020 Australian fires (black line) on 31 December 2019. Red symbols represent aerosol retrievals at 12 km and higher. Blue symbols indicate retrievals at heights lower than 12 km.
4.3 Australia 2019–2020 fires
The 2019–2020 fire season in Australia resulted in 18.6 million burned hectares, most of them in the New South Wales and Victoria southeastern states (SBS News, 2020). It is estimated that tens of people died along with billions of animals that were exterminated, including species that were near extinction before the fire (Readfearn, 2020). The intense fire activity likely triggered a number of pyroCb clouds over a few days between 30 December 2019 and early January 2020, injecting large quantities of carbonaceous aerosols into the Southern Hemisphere UTLS (Ohneiser et al., 2020). In this section, we describe TROPOMI observations of these events in terms of UVAI and AOD retrievals. As observed in visible satellite imagery (not shown) most of the UTLS-injected carbonaceous aerosol material was initially above clouds. TROPOMI near-UV observations were used in conjunction with aerosol layer height from CALIOP observations as input to a modified version of the TROPOMI aerosol algorithm that handles stratospheric aerosol layers (TropOMAER-UTLS). The retrieved SSA over clear scenes was then used as input in the retrieval of AOD over cloudy pixels by the above-cloud aerosol module described in Sect. 2.1.3.
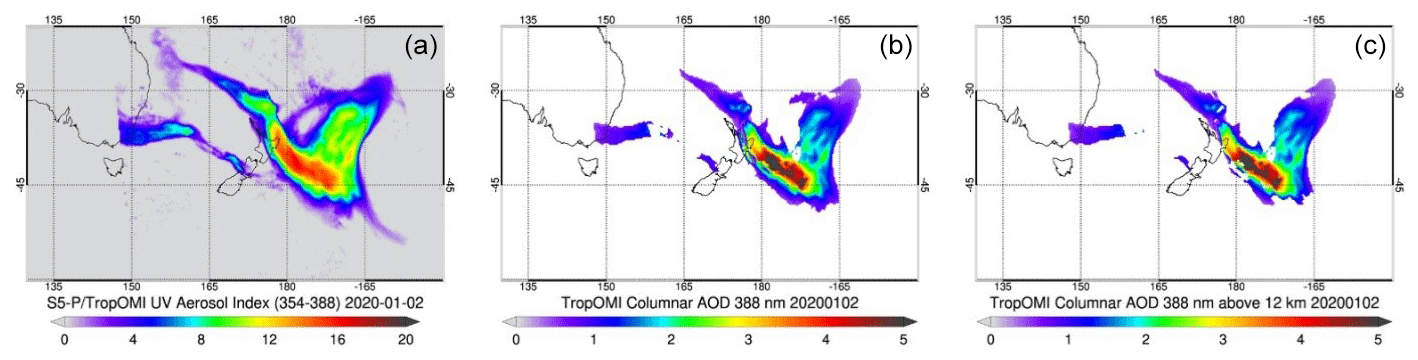
Figure 13TROPOMI UVAI (a), total column 388 nm AOD (b), and above 12 km AOD (c) fields of Australian smoke plume on 2 January 2020.
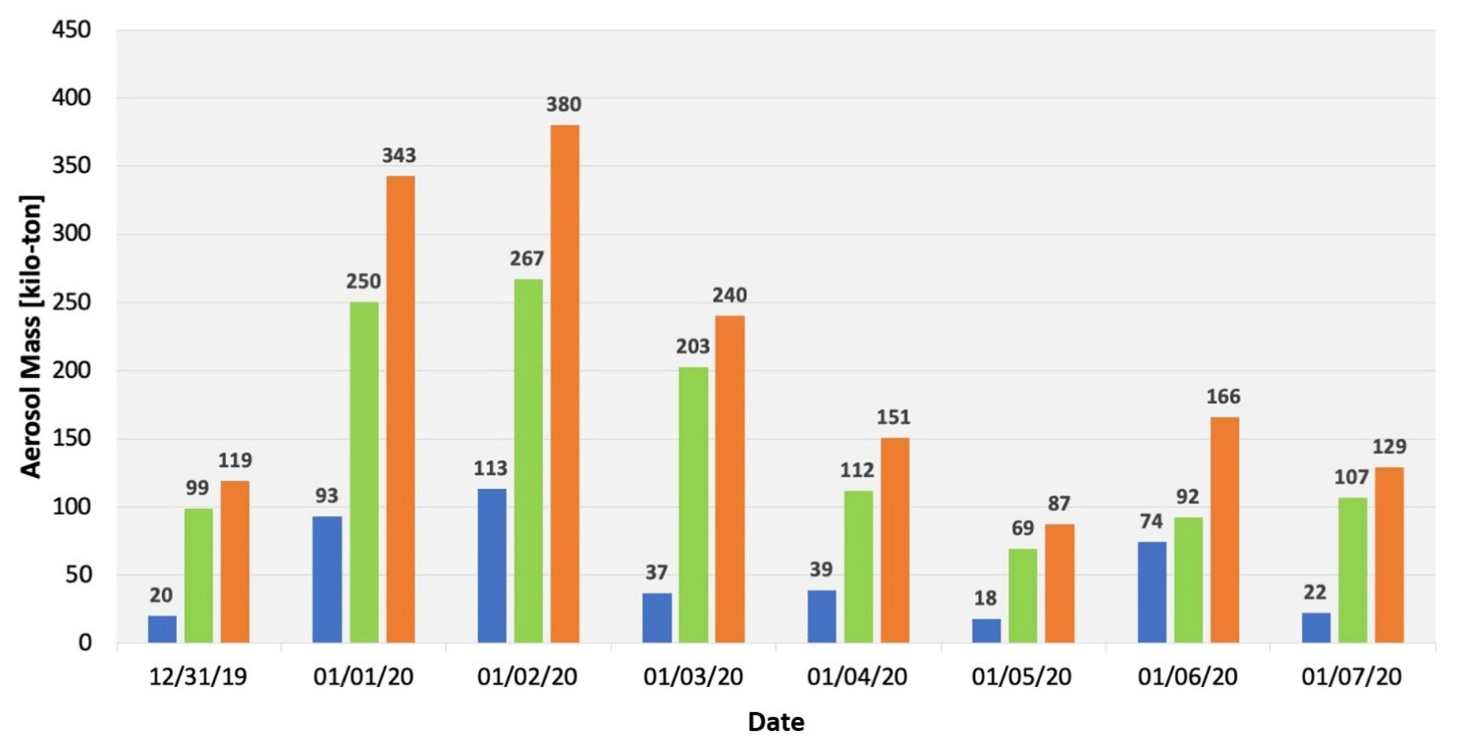
Figure 14Calculated daily aerosol mass (kilotons) in the stratosphere from TROPOMI observations from 31 December 2019 to 7 January 2020. Results are reported for aerosols in cloud-free conditions (blue bars), aerosol above cloudy scenes (green bars), and their sum (orange bars).
TROPOMI-retrieved AOD was used to produce an estimate of resulting stratospheric aerosol mass (SAM). The SAM calculation procedure involves the separation of the stratospheric AOD component from the total AOD column measurement and the use of an extinction-to-mass conversion approximation described in Appendix B. This approach was previously applied to EPIC near-UV AOD retrievals to calculate the SAM associated with the 2017 British Columbia pyroCb events (Torres et al., 2020).
The identification of stratospheric aerosols is carried out by establishing a theoretical relationship between AOD and UVAI for a hypothetical aerosol layer at the tropopause for assumed values of ALH and AAE (see the discussion in Sect. 2.1). CALIOP-provided ALH information and an assumed AAE value of 4.8, similar to that in Torres et al. (2020), were used as input to TropOMAER-UTLS. AOD retrievals associated with UVAI values larger than those indicated by the AOD–UVAI relationship at the tropopause height are assumed to correspond to stratospheric aerosols. Figure 12 shows TROPOMI-observed UVAI (y axis) and retrieved AOD (x axis) for CALIOP-reported ALH on 31 December 2019. Data points in red indicate retrievals above the estimated tropopause height (12 km), while the blue points show retrievals at heights below that level. The altitudes of the retrievals in relation to the tropopause are determined based on a unique viewing-geometry-dependent UVAI–AOD relation for each pixel, which is difficult to visualize on a single plot. Therefore, a quadratic fit (black line) to all data, i.e., above and below the tropopause, was derived to illustrate, for visualization purposes, the separation of tropospheric and stratospheric aerosols.
Unlike during the 2017 British Columbia fire episodes, when a large fraction of the pyroCb-generated aerosol plume initially remained in the troposphere and some of it diabatically ascended to the stratosphere over the next few days (Torres et al., 2020), during the Australian 2020 pyro-convective fires most of the produced carbonaceous aerosols appear to have gone directly into the stratosphere. Figure 13 shows TROPOMI-retrieved UVAI and AOD fields (total column and stratospheric component) on 2 January 2020. Only small differences in the total column and above-tropopause AOD fields are observed, as most of the aerosol material was directly deposited in the stratosphere.
Stratospheric AOD values were converted to mass estimates using the procedure described in Torres et al. (2020) and also included as Appendix B of this paper. For mass estimation purposes, TropOMAER 388 nm AOD data were gridded to lat.–long. resolution. Figure 14 shows calculated daily SAM values (in kilotons) from 31 December 2019 through 7 January 2020 resulting from aerosols above 12 km, the altitude used as a proxy for the tropopause height. Separate aerosol mass retrievals were carried out for cloud-free (blue bars) and cloudy scenes (green bars), with the daily total SAM given as the sum of these two components (orange bars). The observed daily monotonic increase from 119 kt on 31 December 2019 to 380 kt on 2 January 2020 is likely the result of distinct pyroCb events that seemingly injected most of the aerosol mass directly in the stratosphere. Following the 2 January maximum, SAM decreases over the following 3 d to a minimum of 87 kt on 5 January, likely due to the combined effect of dilution processes that spread the aerosol layer horizontally and thin it out to extremely low AOD values beyond the sensor's sensitivity to the total AOD column measurement and aerosol deposition bringing it down to lower than 12 km and therefore no longer included in the SAM calculation.
The sudden increase to 166 kt on 6 January is likely associated with another pyroCb event observed on 4 January that injected an additional 166 kt. Thus, the TROPOMI-based total SAM estimate is the sum of the two peaks on 2 and 6 January, yielding a total of 546 kt, which about twice as much as the 268 kt estimated SAM for the 2017 British Columbia pyroCb (Torres et al., 2020) using the same mass estimation technique. The uncertainty of the estimated SAM is ±40 %, which represents the combined effect of uncertainties on assumed AAE (±0.5) in the AOD retrieval and the uncertainty associated with the assumed aerosol density range of 0.79 to 1.53 g cm−3 (Reid et al., 2005).
The NASA TropOMAER aerosol algorithm applied to TROPOMI observations is an adapted version of the OMAERUV algorithm developed for OMI. Currently, the only algorithm upgrade of TropOMAER is the use of a dedicated VIIRS-based cloud mask. Initial retrieval results for the first 2 years of operation of the TROPOMI sensor were reported.
Since radiometric calibration uncertainties in the range 5 %–10 % relative to OMI and S-NPP OMPS measurements are reportedly present the TROPOMI version 1 level 1b UV–Vis (UV–visible) band 3 (Rozemeijer and Kleipool, 2019a, b), we applied vicariously derived correction factors to TROPOMI-measured radiances at 354 and 388 nm. The approach, based on measured ice reflectances and radiative transfer calculations, yields corrections in the range from −4 % to +2 % in the across-track direction for both wavelengths.
The AERONET version 3 level 2 380 nm AOD data record was used to evaluate the performance of the TropOMAER algorithm. An AERONET AOD data aggregate consisting of 2 years (May 2018–May 2020) of observations at 12 sites representative of the most common aerosol types (i.e., carbonaceous, desert dust, and urban–industrial aerosols) was used in the analysis. To separately evaluate the effects of instrumental and algorithmic improvements on retrieved products, we carried out a three-way comparison of satellite-retrieved AOD to AERONET observations: (1) OMI retrievals by the OMAERUV algorithm, (2) TropOMAER retrievals using the heritage (OMAERUV) cloud screening method, and (3) TropOMAER retrievals using a VIIRS-based cloud mask were independently compared to AERONET observations. A comparative analysis of evaluations 1 and 2 shows the impact of enhanced instrumental capabilities, whereas the analysis of evaluations 2 and 3 highlights the effect of using the VIIRS cloud mask.
Results from comparisons 1 and 2 indicate that a large increase in the number of matched observations (from 410 to 741) and a higher correlation coefficient (from 0.60 to 0.82) are the main benefit of TROPOMI's enhanced resolution. Resulting RMSE values are similar for both comparisons. The comparison of evaluations 2 and 3, intended to evaluate benefits associated with the availability of the VIIRS cloud mask, shows an additional increase in the number of matched pairs (from 741 to 845) and a higher correlation coefficient (from 0.82 to 0.89). The multi-site AERONET–TROPOMI analysis shows the presence of overestimated AOD values in the 0 to 0.5 range. The presence of these outliers is not a common feature at all sites but is primarily associated with the presence of carbonaceous aerosols and cloud mixtures that the current cloud masking scheme apparently fails to identify. Future work to improve the current cloud masking approach is planned. A similar analysis using observations at 164 sites was carried out to evaluate TROPOMI's SSA product, yielding a similar main conclusion of an increased number of retrieval opportunities for the higher-spatial-resolution sensor.
The observed improvement associated with TROPOMI's higher spatial resolution and therefore increased number of retrieval opportunities compared to OMI may be overestimated in view of the row anomaly affecting the OMI sensor that has reduced its viewing capability by nearly 50 %.
The TropOMAER aerosol products were also evaluated by direct comparison to OMI at daily, monthly, and seasonal temporal scales. A comparative analysis of OMI and TROPOMI 2-year time series of 388 nm AOD monthly values shows that TROPOMI AOD values are higher than OMI by about 0.2. This AOD offset is of about the same magnitude as identified in the validation analysis using AERONET observations.
Although TROPOMI products show improved spatial coverage, especially over the oceans where clouds are a significant obstacle at OMI's coarse resolution, the reported comparisons show an overall consistent picture that allows for the long-term continuity of the near-UV aerosol record.
Three continental-scale carbonaceous aerosol events over the last 2 years captured the attention of climate scientists and news media alike. These events, observed by TROPOMI, were briefly described here in terms of TropOMAER products.
The atmospheric aerosol load generated by the hundreds of fires in the western USA and southern Canada in the summer of 2018 was measured by both ground-based and spaceborne sensors. The fire-triggered aerosol layers extended over a huge area, covering large regions of the US Midwest and central Canada. Except for the difference in spatial resolution, OMI and TROPOMI observations yield a consistent view of this event, with produced UVAI values as large as 10 and retrieved AOD values as high as 5.0, consistent with AERONET ground-based observations at several sites.
After 8 years of noticeable reduced biomass burning in southern Brazil during August and September, high levels of carbonaceous aerosols were detected in 2019 by both OMI and TROPOMI. As a result of prevailing regional atmospheric dynamics in 2019, carbonaceous aerosols generated by seasonal biomass burning were transported towards the southeast, reaching large urban centers. OMI- and TROPOMI-reported September 2019 monthly and regional average AOD was slightly larger than in the previous year and about a third of the OMI-reported 2010 peak (∼ 2.5) value.
A number of pyroCbs likely triggered by intense bushfires in the New South Wales province of Australia between 30 December 2019 and early January 2020 injected large amounts of carbonaceous aerosols into the Southern Hemisphere UTLS. Very large values of TROPOMI UVAI observations pointed to an elevated aerosol layer, which was confirmed by CALIOP reports of a distinct high-altitude aerosol layer near 12 km above tropospheric clouds. TROPOMI-retrieved AOD over both cloud-free and cloudy scenes was used to produce an estimate of the injected aerosol mass above 12 km, yielding a total of 546 kt, which is at least twice as much as the estimated carbonaceous aerosol mass injected into the stratosphere by the 2017 Canadian fires.
Future TropOMAER algorithm enhancement will explore the utilization of TROPOMI-retrieved information on aerosol layer height (Nanda et al., 2020), CO (Martínez-Alonso et al., 2020), clouds (Loyola et al., 2018), geometry-dependent effective LER (Loyola et al., 2020), and additional available spectral measurements for aerosol typing. Work is currently underway on the development of higher-spatial-resolution surface albedo data and on the optimization of the instrument characterization.
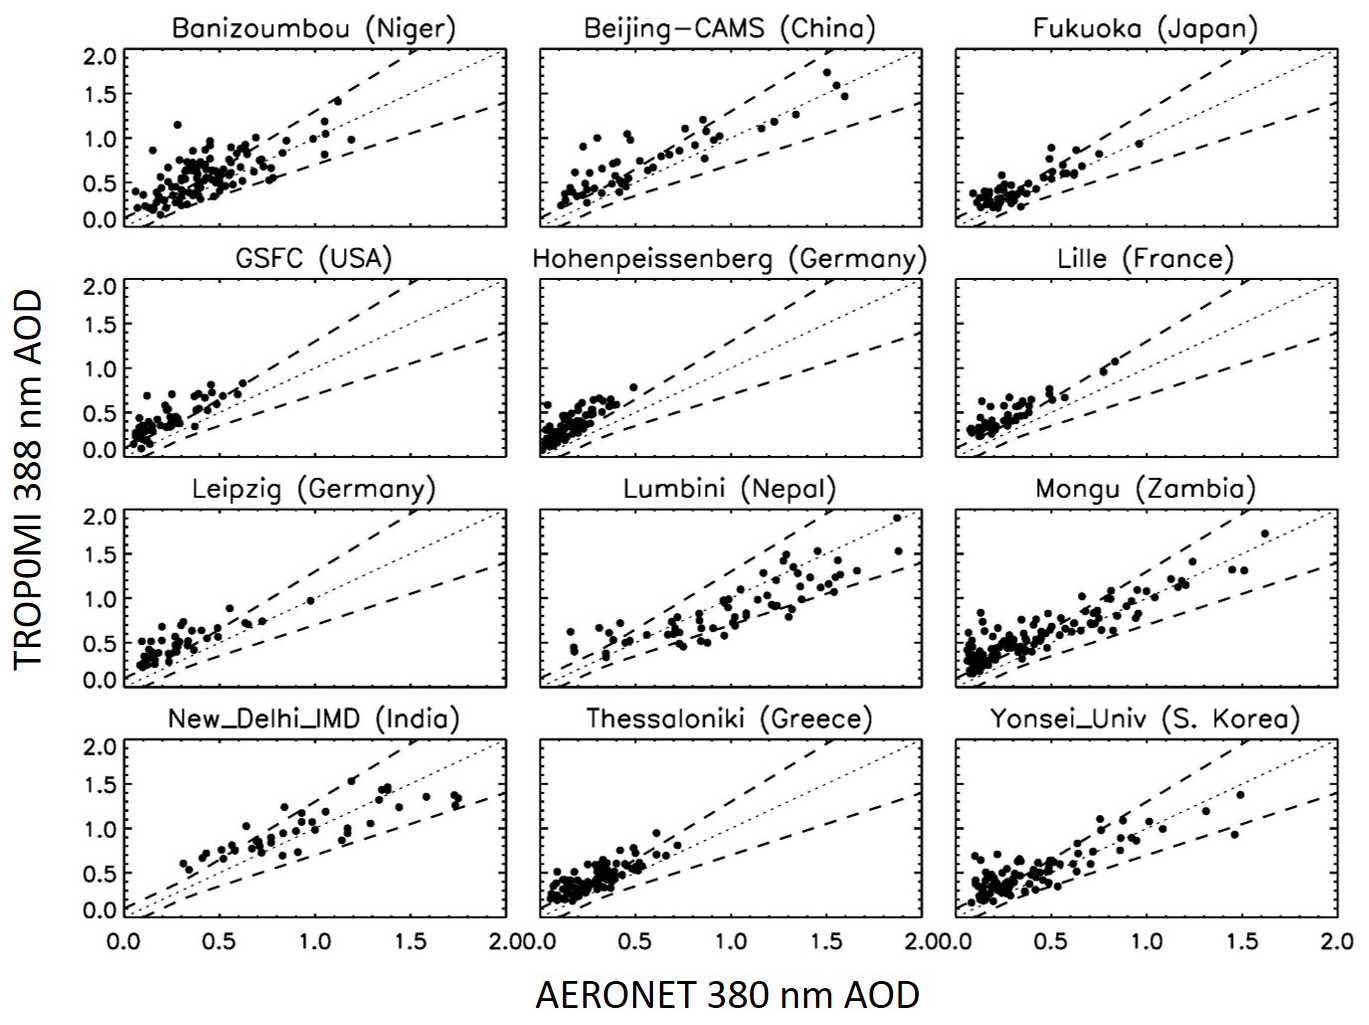
Figure A1Scatter plots of AERONET-measured 380 nm AOD (x axis) and TROPOMI-retrieved 388 nm AOD (y axis) at each of the sites used in the analysis. Dotted line indicates the one-to-one line, and dashed lines represent expected retrieval uncertainty (largest of 0.1 % or 30 %).
The total aerosol mass injected in the stratosphere, M, can be estimated by converting stratospheric AOD (τstr; see below) into an equivalent aerosol mass per unit area using the equation (Krotkov et al., 1999)
which yields the summation of the aerosol mass over the total area covered by the aerosol plume. In Eq. (B1), ρ is the aerosol particle mass density in grams per cubic centimeter (g cm is the effective radius (µm) associated with the particle size distribution (van de Hulst, 1957), A is the effective geographical area in square kilometers (km2) associated with the retrieved stratospheric AOD averaged over each lat.–long. grid (see text for details), and f(λ,reff) is a dimensionless extinction-to-mass conversion factor, averaging over particle size distribution, defined as
where n(r)dr is the assumed number particle size distribution and Qext(λ,r) is the extinction efficiency factor calculated using Mie theory. Calculations were carried out for particle mass density values of 0.79 and 1.53 g cm−3, which cover the range of values reported in the literature (Reid et al., 2005).
The data discussed in this paper is available from the first author upon request. Data will be publicly accessible in the future upon application of final instrument calibration and further refinement of the current research algorithm.
The leading author conceptualized the study and wrote the paper. Co-authors HJ, CA, and DL contributed to the data analysis in the paper. Co-author GJ contributed the vicarious instrumental calibration work used in the interpretation of the satellite observations.
The authors declare that they have no conflict of interest.
This article is part of the special issue “TROPOMI on Sentinel-5 Precursor: first year in operation (AMT/ACP inter-journal SI)”. It is not associated with a conference.
Thanks are due to the anonymous reviewers whose constructive feedback led to significant improvement of the article.
This paper was edited by Daniel Perez-Ramirez and reviewed by three anonymous referees.
Ahn, C., Torres, O., and Jethva, H.: Assessment of OMI near-UV aerosol optical depth over land, J. Geophys. Res.-Atmos., 119, 2457–2473, https://doi.org/10.1002/2013JD020188, 2014.
Ahn, C., Torres, O., Jethva, H., and Tiruchirapalli, R., and Huang, L.-K.: Diurnal Variability of Aerosol Properties observed by the DSCOVR/EPIC Instrument from the Earth-Sun Lagrange 1 Orbit, J. Geophys. Res.-Atmos., in review, 2020.
Bovensmann, H., Burrows, J. P., Buchwitz, M., Frerick, J., Noël, S., Rozanov, V. V., Chance, K. V., and Goede, A. P. H.: SCIAMACHY: Mission Objectives and Measurement Modes, J. Atmos. Sci., 56, 127–150, https://doi.org/10.1175/1520-0469(1999)056<0127:SMOAMM>2.0.CO;2, 1999.
Dobber, M., Kleipool, Q., Dirksen, R., Levelt, P., Jaross, G.,Taylor, S., Kelly, T., Flynn, L., Leppelmeier, G., and Roze-Meijer, N.: Validation of Ozone Monitoring Instrument level1b data products, J. Geophys. Res.-Atmos., 113, D15S06, https://doi.org/10.1029/2007JD008665, 2008.
Gassó, S. and Torres, O.: The role of cloud contamination, aerosol layer height and aerosol model in the assessment of the OMI near-UV retrievals over the ocean, Atmos. Meas. Tech., 9, 3031–3052, https://doi.org/10.5194/amt-9-3031-2016, 2016.
Genkova, I., Robaidek, J., Roebling, R., Sneep, M., and Veefkind, P.: Temporal co-registration for TROPOMI cloud clearing, Atmos. Meas. Tech., 5, 595–602, https://doi.org/10.5194/amt-5-595-2012, 2012.
Giles, D. M., Sinyuk, A., Sorokin, M. G., Schafer, J. S., Smirnov, A., Slutsker, I., Eck, T. F., Holben, B. N., Lewis, J. R., Campbell, J. R., Welton, E. J., Korkin, S. V., and Lyapustin, A. I.: Advancements in the Aerosol Robotic Network (AERONET) Version 3 database – automated near-real-time quality control algorithm with improved cloud screening for Sun photometer aerosol optical depth (AOD) measurements, Atmos. Meas. Tech., 12, 169–209, https://doi.org/10.5194/amt-12-169-2019, 2019.
Hashimoto, M., Nakajima, T., Dubovik, O., Campanelli, M., Che, H., Khatri, P., Takamura, T., and Pandithurai, G.: Development of a new data-processing method for SKYNET sky radiometer observations, Atmos. Meas. Tech., 5, 2723–2737, https://doi.org/10.5194/amt-5-2723-2012, 2012.
Hughes, R.: Amazon Fires: What is the latest in Brazil?, BBC News, available at: https://www.bbc.com/news/world-latin-america-49971563 (last access: 2 December 2020), 2019.
Ingmann, P., Veihelmann, B., Langen, J., Lamarre, D., Stark, H., and Courrèges-Lacoste, G. B.: Requirements for the GMES Atmosphere Service and ESA's implementation concept: Sentinels-4/-5 and -5p, Remote Sens. Environ., 120, 58–69, https://doi.org/10.1016/j.rse.2012.01.023, 2012.
Jaross, G. and Warner, J.: Use of Antarctica for validating reflected solar radiation measured by satellite sensors, J. Geophys. Res., 113, D16S34, https://doi.org/10.1029/2007JD008835, 2008.
Jethva, H., Torres, O., and Ahn, C.: Global assessment of OMI aerosol single-scattering albedo using ground-based AERONET inversion, J. Geophys. Res.-Atmos., 119, 9020–9040, https://doi.org/10.1002/2014JD021672, 2014.
Jethva, H., Torres, O., and Ahn, C.: A 12-year long global record of optical depth of absorbing aerosols above the clouds derived from the OMI/OMACA algorithm, Atmos. Meas. Tech., 11, 5837–5864, https://doi.org/10.5194/amt-11-5837-2018, 2018.
Kleipool, Q., Ludewig, A., Babić, L., Bartstra, R., Braak, R., Dierssen, W., Dewitte, P.-J., Kenter, P., Landzaat, R., Leloux, J., Loots, E., Meijering, P., van der Plas, E., Rozemeijer, N., Schepers, D., Schiavini, D., Smeets, J., Vacanti, G., Vonk, F., and Veefkind, P.: Pre-launch calibration results of the TROPOMI payload on-board the Sentinel-5 Precursor satellite, Atmos. Meas. Tech., 11, 6439–6479, https://doi.org/10.5194/amt-11-6439-2018, 2018.
Krotkov, N. A., Torres, O., Seftor, C., Krueger, A. J., Konstinski, A., Rose, W. I., Bluth, G. J. S., Schneider, D., and Schaefer, S. J.: Comparison of TOMS and AVHRR Volcanic Ash Retrievals from the August 1992 Eruption of Mt Spurr, Geophys. Res. Lett., 26, 455–458, 1999.
Levelt, P. F., van den Oord, G. H., Dobber, M. R., Malkki, A., Visser, H., de Vries, J., Stammes, P., Lundell, J. O., and Saari, H.: The ozone monitoring instrument, IEEE T. Geosci. Remote, 44, 1093–1101, https://doi.org/10.1109/TGRS.2006.872333, 2006.
Loyola, D. G., Gimeno García, S., Lutz, R., Argyrouli, A., Romahn, F., Spurr, R. J. D., Pedergnana, M., Doicu, A., Molina García, V., and Schüssler, O.: The operational cloud retrieval algorithms from TROPOMI on board Sentinel-5 Precursor, Atmos. Meas. Tech., 11, 409–427, https://doi.org/10.5194/amt-11-409-2018, 2018.
Loyola, D. G., Xu, J., Heue, K.-P., and Zimmer, W.: Applying FP_ILM to the retrieval of geometry-dependent effective Lambertian equivalent reflectivity (GE_LER) daily maps from UVN satellite measurements, Atmos. Meas. Tech., 13, 985–999, https://doi.org/10.5194/amt-13-985-2020, 2020.
Ludewig, A., Kleipool, Q., Bartstra, R., Landzaat, R., Leloux, J., Loots, E., Meijering, P., van der Plas, E., Rozemeijer, N., Vonk, F., and Veefkind, P.: In-flight calibration results of the TROPOMI payload on board the Sentinel-5 Precursor satellite, Atmos. Meas. Tech., 13, 3561–3580, https://doi.org/10.5194/amt-13-3561-2020, 2020.
Marshak, A., Herman, J., Adam, S., Karin, B., Carn, S., Cede, A., Geogdzhayev, I., Huang, D., Huang, L., Knyazikhin, Y., Kowalewski, M., Krotkov, N., Lyapustin, A., McPeters, R., Meyer, K. G., Torres, O., and Yang, Y.: Earth Observations from DSCOVR EPIC Instrument, B. Am. Meteorol. Soc., 99, 1829–1850, https://doi.org/10.1175/BAMS-D-17-0223.1, 2018.
Martínez-Alonso, S., Deeter, M., Worden, H., Borsdorff, T., Aben, I., Commane, R., Daube, B., Francis, G., George, M., Landgraf, J., Mao, D., McKain, K., and Wofsy, S.: 1.5 years of TROPOMI CO measurements: comparisons to MOPITT and ATom, Atmos. Meas. Tech., 13, 4841–4864, https://doi.org/10.5194/amt-13-4841-2020, 2020.
Munro, R., Lang, R., Klaes, D., Poli, G., Retscher, C., Lindstrot, R., Huckle, R., Lacan, A., Grzegorski, M., Holdak, A., Kokhanovsky, A., Livschitz, J., and Eisinger, M.: The GOME-2 instrument on the Metop series of satellites: instrument design, calibration, and level 1 data processing – an overview, Atmos. Meas. Tech., 9, 1279–1301, https://doi.org/10.5194/amt-9-1279-2016, 2016.
Nakajima, T., Tonna, G., Rao, R., Boi, P., Kaufman, Y., and Holben, B.: Use of sky brightness measurements from ground for remote sensing of particulate polydispersions, Appl. Optics, 35, 2672–2686, 1996.
Nanda, S., de Graaf, M., Veefkind, J. P., Sneep, M., ter Linden, M., Sun, J., and Levelt, P. F.: A first comparison of TROPOMI aerosol layer height (ALH) to CALIOP data, Atmos. Meas. Tech., 13, 3043–3059, https://doi.org/10.5194/amt-13-3043-2020, 2020.
Ohneiser, K., Ansmann, A., Baars, H., Seifert, P., Barja, B., Jimenez, C., Radenz, M., Teisseire, A., Floutsi, A., Haarig, M., Foth, A., Chudnovsky, A., Engelmann, R., Zamorano, F., Bühl, J., and Wandinger, U.: Smoke of extreme Australian bushfires observed in the stratosphere over Punta Arenas, Chile, in January 2020: optical thickness, lidar ratios, and depolarization ratios at 355 and 532 nm, Atmos. Chem. Phys., 20, 8003–8015, https://doi.org/10.5194/acp-20-8003-2020, 2020.
Readfearn, G.: Silent death: Australia's bushfires push countless species to extinction, Guardian Australia, available at: https://www.theguardian.com/environment/2020/jan/04/ ecologists-warn-silent-death-australia-bushfires-endangered-species-extinction, last access: 2 December 2020.
Reid, J. S., Koppmann, R., Eck, T. F., and Eleuterio, D. P.: A review of biomass burning emissions part II: intensive physical properties of biomass burning particles, Atmos. Chem. Phys., 5, 799–825, https://doi.org/10.5194/acp-5-799-2005, 2005.
Rozemeijer, N. C. and Kleipool, Q.: S5P Level 1b Product Readme File, S5P-MPC-KNMI-PRF-L1B, available at: http://www.tropomi.eu/documents/level-0-1b (last access: 2 December 2020), 2019a.
Rozemeijer, N. C. and Kleipool, Q.: S5P Level 1b Product Readme File, S5P-MPC-KNMI-PRF-L1B, available at: https://sentinel.esa.int/web/sentinel/technical-guides/sentinel- 5p/products-algorithms (last access: 2 December 2020), 2019b.
SBS News: The numbers behind Australia's catastropic bushfire season, available at: https://www.sbs.com.au/news/the- numbers-behind-australia-s-catastrophic-bushfire-season, 2020.
Schenkeveld, V. M. E., Jaross, G., Marchenko, S., Haffner, D., Kleipool, Q. L., Rozemeijer, N. C., Veefkind, J. P., and Levelt, P. F.: In-flight performance of the Ozone Monitoring Instrument, Atmos. Meas. Tech., 10, 1957–1986, https://doi.org/10.5194/amt-10-1957-2017, 2017.
Siddans, R.: S5P-NPP Cloud Processor ATBD, S5P-NPPCRALATBD-0001, available at: https://sentinel.esa.int/web/sentinel/technical-guides/sentinel-5p/products-algorithms (last access: 2 December 2020), 2016a.
Siddans, R.: S5P-NPP Cloud Processor ATBD, S5P-NPPCRALATBD-000 http://www.tropomi.eu/documents/atbd (last access: 2 December 2020), 2016b.
Sinyuk, A., Holben, B. N., Eck, T. F., Giles, D. M., Slutsker, I., Korkin, S., Schafer, J. S., Smirnov, A., Sorokin, M., and Lyapustin, A.: The AERONET Version 3 aerosol retrieval algorithm, associated uncertainties and comparisons to Version 2, Atmos. Meas. Tech., 13, 3375–3411, https://doi.org/10.5194/amt-13-3375-2020, 2020.
Stein Zweers, D. C.: TROPOMI ATBD of the UV aerosol index, S5P-KNMI-L2-0008-RP, available at: https://sentinel.esa.int/web/sentinel/technical-guides/sentinel-5p/products-algorithms (last access: 2 December 2020), 2018a.
Stein Zweers, D. C.: TROPOMI ATBD of the UV aerosol index, S5P-KNMI-L2-0008-RP, available at: http://www.tropomi.eu/documents/atbd (last access: 2 December 2020), 2018b.
Torres, O., Tanskanen, A., Veihelman, B., Ahn, C., Braak, R., Bhartia, P. K., Veefkind, P., and Levelt, P.: Aerosols and Surface UV Products from OMI Observations: An Overview, J. Geophys. Res., 112, D24S47, https://doi.org/10.1029/2007JD008809, 2007.
Torres, O., Jethva, H., and Bhartia, P. K.: Retrieval of Aerosol Optical Depth above Clouds from OMI Observations: Sensitivity Analysis and Case Studies, J. Atmos. Sci., 69, 1037–1053, https://doi.org/10.1175/JAS-D-11-0130.1, 2012.
Torres, O., Ahn, C., and Chen, Z.: Improvements to the OMI near-UV aerosol algorithm using A-train CALIOP and AIRS observations, Atmos. Meas. Tech., 6, 3257–3270, https://doi.org/10.5194/amt-6-3257-2013, 2013.
Torres, O., Bhartia, P. K., Jethva, H., and Ahn, C.: Impact of the ozone monitoring instrument row anomaly on the long-term record of aerosol products, Atmos. Meas. Tech., 11, 2701–2715, https://doi.org/10.5194/amt-11-2701-2018, 2018.
Torres, O., Bhartia, P. K., Taha, G., Jethva, H., Das, S., Colarco, P., Krotkov, N., Omar, A., and Ahn, C.: Stratospheric Injection of Massive Smoke Plume from Canadian Boreal Fires in 2017 as seen by DSCOVR-EPIC, CALIOP and OMPS-LP Observations, J. Geophys. Res.-Atmos., 125, e2020JD032579. https://doi.org/10.1029/2020JD032579, 2020.
van de Hulst, H. C.: Light Scattering by Small Particles, chap. 6, New York, Dover Publications, Inc., 1957.
- Abstract
- Introduction
- NASA TROPOMI aerosol products
- Evaluation TropOMAER performance
- TROPOMI view of important aerosol events
- Summary and future work
- Appendix A: AERONET–TROPOMI comparisons at individual sites
- Appendix B: Extinction-to-mass conversion
- Data availability
- Author contributions
- Competing interests
- Special issue statement
- Acknowledgements
- Review statement
- References