the Creative Commons Attribution 4.0 License.
the Creative Commons Attribution 4.0 License.
 | 13 Feb 2020
XCO2 observations using satellite measurements with moderate spectral resolution: investigation using GOSAT and OCO-2 measurements
Joost aan de Brugh
Yasjka Meijer
Bernd Sierk
Otto Hasekamp
Andre Butz
Jochen Landgraf
In light of the proposed space segment of Europe's future CO2 monitoring system, we investigate the spectral resolution of the CO2 spectrometer, which measures earthshine radiance in the three relevant spectral bands at 0.76, 1.61, and 2.06 µm. The Orbiting Carbon Observatory-2 (OCO-2) mission covers these bands with fine spectral resolution but limited spatial coverage, which hampers the monitoring of localized anthropogenic CO2 emission. The future European CO2 monitoring constellation, currently undergoing feasibility studies at the European Space Agency (ESA), is targeting a moderate spectral resolution of 0.1, 0.3, and 0.3–0.55 nm in the three spectral bands with a high signal-to-noise ratio (SNR) as well as a spatial resolution of 4 km2 and an across-track swath width >250 km. This spectral and radiometric sizing is deemed to be favorable for large-swath imaging of point sources of CO2 emission. To assess this choice, we use real and synthetic OCO-2 satellite observations, which we spectrally degrade to the envisaged lower spectral resolution. We evaluate the corresponding CO2 retrieval accuracy by taking the Total Carbon Column Observing Network (TCCON) observations as reference. Here, a lower spectral resolution enhances the scatter error of the retrieved CO2 column mixing ratio (XCO2) but has little effect on the station-to-station variation in the biases. We show that the scatter error gradually increases with decreasing spectral resolution. Part of the scatter error increase can be attributed to the retrieval noise error which can be compensated for by a future instrument with improved SNR. Moreover, we consider the effect of the reduced spectral resolution on the capability to capture regional XCO2 variations and XCO2 plumes from selected OCO-2 orbits. The investigation using measurements from the Greenhouse gases Observing SATellite (GOSAT) and synthetic measurements confirms our finding and indicates that one major source of uncertainties regarding CO2 retrieval is the insufficient information on aerosol properties that can be inferred from the observations. We hence recommend the implementation of simultaneous, co-located measurements that have a larger information content on aerosols with an auxiliary instrument in the future European observing system.
- Article
(6631 KB) - Full-text XML
- BibTeX
- EndNote


The atmospheric concentration of the most important anthropogenic greenhouse gas carbon dioxide (CO2) is increasing rapidly due to fossil fuel combustion and changes in land use with serious environmental consequences such as global temperature rise, ocean acidification, and an increase in extreme weather events (Cox et al., 2000; Caldeira and Wickett, 2003). At the same time, our knowledge about sources and sinks of CO2 is still limited. Here, satellite observations of the column-averaged dry-air mole fraction of CO2 (XCO2) gives both scientists and policy makers a powerful tool to develop and evaluate mitigation strategy in the face of future climate change. To derive CO2 hot spot emissions and the strength of regional CO2 sources and sinks, XCO2 satellite observations are needed with unprecedented precision and accuracy, good spatial coverage, and high spatial resolution. For anthropogenic CO2 monitoring, Ciais et al. (2015) and Crisp et al. (2018) listed the main driving requirements as a XCO2 precision ≤0.7 ppm and systematic error ≤0.5 ppm with a spatial resolution of 4 km2 and a swath of >250 km with a coverage requirement of 2–3 d. Here the high accuracy and precision are needed because even the largest CO2 surface sources and sinks produce only small changes in the atmospheric XCO2.
Table 1Spectral resolutions of the OCO-2 and GOSAT instruments and the four spectral sizing points MSR-a to MSR-d with reduced spectral resolution, which are investigated in this study. Here the spectral sizing point of MSR-d is adapted from the CarbonSat design. The listed signal-to-noise ratios per spectral sampling for each instrument concept are calculated under the same incoming radiance of 75.2, 10.4, and 2.4 W m−2 sr µm−1 for the 0.76, 1.61, and 2.06 µm bands, respectively (Sierk et al., 2018).
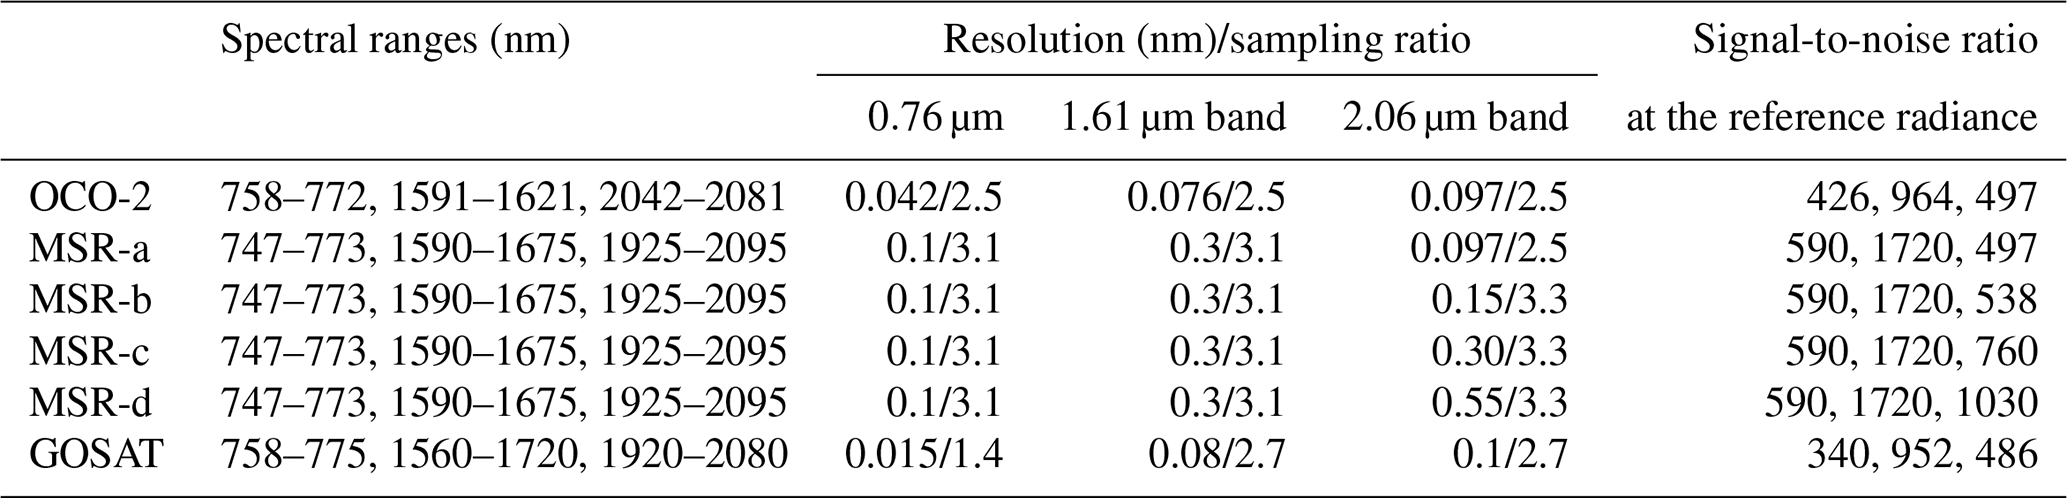
The SCanning Imaging Absorption spectroMeter for Atmospheric CHartographY (SCIAMACHY) on board ENVISAT (March 2002–April 2012) is the pioneering passive remote sensing spectrometer which can measure atmosphere CO2 and CH4 columns down to the Earth surface (Buchwitz et al., 2005). Currently, the Greenhouse Gases Observing Satellite (GOSAT; Yokota et al., 2009; Kuze et al., 2016) and the Orbiting Carbon Observatory-2 (OCO-2; Crisp et al., 2017) missions are in orbit, dedicated to observing XCO2 from space. Additionally, the Carbon Monitoring Satellite (CarbonSat; Bovensmann et al., 2010; Buchwitz et al., 2013) was proposed to the European Space Agency (ESA) with the objective to advance our knowledge on the natural and anthropogenic sources and sinks of CO2 from regional and country scales down to local scales, but was not selected for mission implementation. Recently, NASA's OCO-3 instrument was launched and mounted successfully on the Japanese Experiment Module – Exposed Facility on board the International Space Station (Eldering et al., 2019). As a successor of this series of dedicated greenhouse gas missions, CNES aspire to launch the MicroCarb satellite in the year 2021 (Pascal et al., 2017). Table 1 includes the spectral and spatial properties of the GOSAT, OCO-2, and CarbonSat satellite instruments, observing the Earth-reflected sunlight in the oxygen (O2) A-band around 0.765 µm, the weak CO2 absorption band around 1.61 µm, and the strong CO2 absorption band around 2.06 µm. Among those instruments, the CarbonSat concept has the largest swath with good spatial resolution but with significantly reduced spectral resolution compared to GOSAT and OCO-2. At the same time, the CarbonSat sizing concept would offer a much higher signal-to-noise ratio and broader spectral bandwidth. These properties were chosen to enable simultaneous measurement of CH4 in the 1.61 µm band (1.590–1.675 µm) and include an additional CO2 band (1.990–2.035 µm). The selected moderate spectral resolution is expected to reduce the sensitivity to instrument errors, e.g., distortions of the instrument spectral response function (ISRF) and detector nonlinearity. It also enables the use of low-order diffraction grating technologies with high efficiencies and low stray light (Sierk et al., 2016). On the other hand, the design introduces the risk of XCO2 errors due to spectral interference with other absorbers and enhanced aerosol-induced errors. To evaluate this risk Galli et al. (2014) analyzed a spectral degradation of GOSAT observations and the induced error on XCO2.
Proceeding from the CarbonSat proposal and the Paris Agreement, which was signed in 2015 by 195 countries agreeing to combat climate change and to accelerate and intensify the actions for a sustainable low-carbon future, the European Commission gave ESA the mandate to investigate the implementation of a satellite mission monitoring anthropogenic CO2 emissions. To meet the mission objectives, a careful trade-off has to be made between different requirements. With the successful launch of OCO-2 and the application of several algorithms to infer XCO2 from the observations (Boesch et al., 2011; O'Dell et al., 2012; Wu et al., 2018), we have, next to GOSAT, an additional data set at hand to verify the impact of a reduced spectral resolution on XCO2 retrieval. In particular, applying the same degradation approach to both GOSAT and OCO-2 observations may help to identify instrument-specific aspects of the induced errors due to a reduced spectral resolution.
In this study, we investigated the retrieval performance of OCO-2 observations degraded to different spectral resolutions building upon the work by Galli et al. (2014). We evaluate the XCO2 retrieval accuracy and precision using both OCO-2 measurements and produce spectra with the reduced spectral resolution and the sampling ratio as listed in Table 1, which in the remainder of the study will be referred to as the moderate-spectral-resolution (MSR) concepts. Due to the coarser spectral resolution and sampling for the MSR concepts, the SNR performance is enhanced in the corresponding spectral bands. We first investigate the impact of reduced spectral resolution with simulated OCO-2 and MSR measurements for a global ensemble. For satellite observations, the differences between retrieved XCO2 and collocated ground-based observations from the Total Carbon Column Observing Network (TCCON) are used to estimate the retrieval uncertainty. We also compare XCO2 retrievals over Europe, the Middle East, and Africa (EMEA) and selected orbits with hot spots as reported by Nassar et al. (2017) using both OCO-2 and MSR measurements. A corresponding analysis is done for GOSAT observations to relate our analysis to the previous work done by Galli et al. (2014).
The paper is organized as follows: Section 2 describes our approach to lower the spectral resolution of observed OCO-2 or GOSAT spectra and introduces the XCO2 retrieval algorithm RemoTeC and its particular settings for this study. Section 3 summarizes the satellite observations and validation data used in the study and Sect. 4 evaluates the OCO-2 and GOSAT XCO2 retrievals for the original and reduced spectral resolutions using collocated TCCON data. Here, the impact of a reduced spectral resolution on XCO2 retrievals is further investigated over EMEA and selected OCO-2 orbits with hot spots. Finally, Sect. 5 concludes the paper with recommendations for a future European CO2 monitoring mission.
2.1 Retrieval method and setup
To retrieve CO2 columns from spaceborne earthshine radiance observations in the 0.76, 1.61, and 2.06 µm spectral ranges with different spectral resolutions, we use the RemoTeC full-physics retrieval algorithm (Hasekamp and Butz, 2008), which was first applied for GOSAT measurements and later extensively used for greenhouse gas retrievals of different missions including GOSAT, OCO-2, and Sentinel-5P (Butz et al., 2009; Schepers et al., 2012; Guerlet et al., 2013; Hu et al., 2016, 2018; Wu et al., 2018). The algorithm employs an iterative inverse scheme combined with an efficient forward radiative transfer model developed by Landgraf et al. (2001), Hasekamp and Landgraf (2005), Hasekamp and Butz (2008), and Schepers et al. (2014). For a given model atmosphere, the forward model simulates the intensity vector field, including its Stokes parameter Q and U on a line-by-line spectral sampling, and its derivatives with respect to both the amount of all relevant trace gases and the optical properties of spherical aerosols in different layers of the model atmosphere. Moreover, RemoTeC infers state parameters of the atmosphere by minimizing the difference between forward model and satellite observations. Due to the different spectral coverage of the 1.61 µm band and corresponding sensitivities, for GOSAT measurements 12-layer profiles of CO2 and CH4 partial column are retrieved whereas for OCO-2 measurements we only infer the corresponding CO2 profile. Apart from that, the algorithm setup is the same for both missions, which infers additionally: H2O total column, surface properties, spectral shifts, intensity offsets and aerosol optical properties. To describe the size distribution of the atmospheric aerosol, RemoTeC uses a power-law size distribution ( with the particle radius r) and retrieves the size parameter α and total amount of aerosol particles N. Here, the size parameter α is unitless. For the aerosol height distribution, we assume a Gaussian profile with a full width at half maximum of 2 km and retrieve its center height haer. For this study, we consider only satellite observations over land, where we assume a Lambertian surface reflection model with describing the inter-band spectral dependence of the surface albedo as a second order polynomial.
In terms of spectral calibration, we adjust spectral shifts for both the Earth radiance measurement and solar reference model in each spectral band while an intensity offset is only fitted in the 0.76 µm band for both GOSAT and OCO-2 spectra. These RemoTeC retrieval settings were also used in GOSAT retrievals by Butz et al. (2011); Schepers et al. (2012); Guerlet et al. (2013); Buchwitz et al. (2017). It should be noted that in the recent study by Wu et al. (2018) we found that retrieving an intensity offset in all three OCO-2 bands significantly improves the accuracy of the data product. Measurements of the OCO-2 push-broom spectrometer with high SNR include most likely larger stray-light errors than the TANSO-FTS (Thermal And Near infrared Sensor for carbon Observation – Fourier Transform Spectrometer) on board GOSAT. In this study, however, we use the same retrieval settings for both GOSAT and OCO-2 data for the following reasons.
-
A consistent retrieval setting can help to identify the origin of the product uncertainties. Assuming that the error analysis differs significantly for two satellite missions, it seems likely to be an instrument-specific issue rather than due to the algorithm itself.
-
It turns out to be difficult to fit an intensity offset in the 2.06 µm band for spectra with a coarse spectral resolution of 0.55 nm.
-
The primary target of the study is to understand the impact of a reduced spectral resolution and so the relative change of retrieval performances with spectral resolution is the main focus of this study.
Table 2Settings of the filters used for excluding low-quality XCO2 retrievals in OCO-2 retrievals.

a The blended albedo filter was first introduced in Wunch et al. (2011).
To account for line mixing as well as collision-induced absorption of O2 and CO2, we employ the spectroscopic model by Tran and Hartmann (2008). The molecular absorption database HITRAN 2008 is used for CH4 and H2O considering the Voigt line shape model. The algorithm also requires auxiliary information on vertical profiles of pressure, temperature and humidity, and surface wind speed, which are adapted from the European Centre for Medium-Range Weather Forecasts (ECMWF). Surface elevation information is taken from the 90 m digital elevation data of NASA's Shuttle Radar Topography Mission (Farr et al., 2007). Prior information on CO2 and CH4 profiles is interpolated from CarbonTracker and the TM5 model for the years 2013 and 2010 (Peters et al., 2007; Houweling et al., 2014), while prior information of the surface albedo is estimated from the mean radiance of the observation. Aerosol priors are the same for all retrievals.
Cloud-contaminated observations are rejected by strict data filtering using prior non-scattering retrievals (Schepers et al., 2012), and so clouds do not need to be considered in the retrieval algorithm. Here, the cloud clearing relies on the fact that the difference of CO2 and H2O columns, retrieved independently from the 1.61 and 2.06 µm bands for a non-scattering model atmosphere, indicates the measurement contamination by clouds (Taylor et al., 2016). Furthermore, the difference between the O2 column inferred from the O2 A-band with a non-scattering atmosphere and the corresponding column derived from the ECMWF surface pressure can be used for cloud filtering. Additionally, we reject spectra with low signal-to-noise ratio, extreme viewing geometry, cirrus contamination, and high aerosol load to avoid large retrieval errors. The applied quality filtering variables and corresponding ranges are listed in Table 2. The data screening is described in more detail by Detmers and Hasekamp (2015) and Wu et al. (2018) for the GOSAT and OCO-2 retrievals, respectively, where for OCO-2 the data screening does not rely on the intensity offsets in the 1.61 and 2.06 µm bands because it is not retrieved from the measurement in the context of this study.
2.2 Degradation of spectral resolution
To simulate a spectral measurement Iobs from a top-of-atmosphere line-by-line spectrum Irad, we apply the convolution
where Hi(λi−λ) is the instrument spectral response function (ISRF) of a spectrometer at the central wavelength λi. The spectral resolution of the spectrometer is characterized by the full width at half maximum (FWHM) of the ISRF. This equation holds both for the spectra recorded by OCO-2 and GOSAT and for the spectra degraded in spectral resolution but with different ISRFs. To estimate the ISRF of a degraded spectral resolution, we convolve the original GOSAT and OCO-2 ISRF Hi with a Gaussian function g,
with
Here α is the full width at the half maximum of the Gaussian and A is a normalization factor. From Eqs. (1) and (3), we can derive the spectra of reduced resolution from original GOSAT and OCO-2 observations by
The corresponding error covariance , which describes the measurement uncertainties of the target spectrometer, can be deduced from the original error covariance matrix Sy by
Obviously, the degraded spectra need to be sampled according to the spectrometer's sampling ratio. For the MSR spectral sizing points in Table 1, the sampling ratios are 3.1, 3.1, and 3.3 at the 0.76, 1.61, and 2.06 µm bands, respectively. This approach allows us to degrade high-spectral-resolution measurements to lower-resolution measurements using the specification of the target instrument with the exception of the noise performance, which is adapted from the original GOSAT or OCO-2 spectrometer. Similarly, the forward model employs the same convolution in Eq. (5) before comparing the simulation with the degraded spectra. Thus both the satellite measurements and the forward model simulation as part of the retrieval are adapted accordingly.
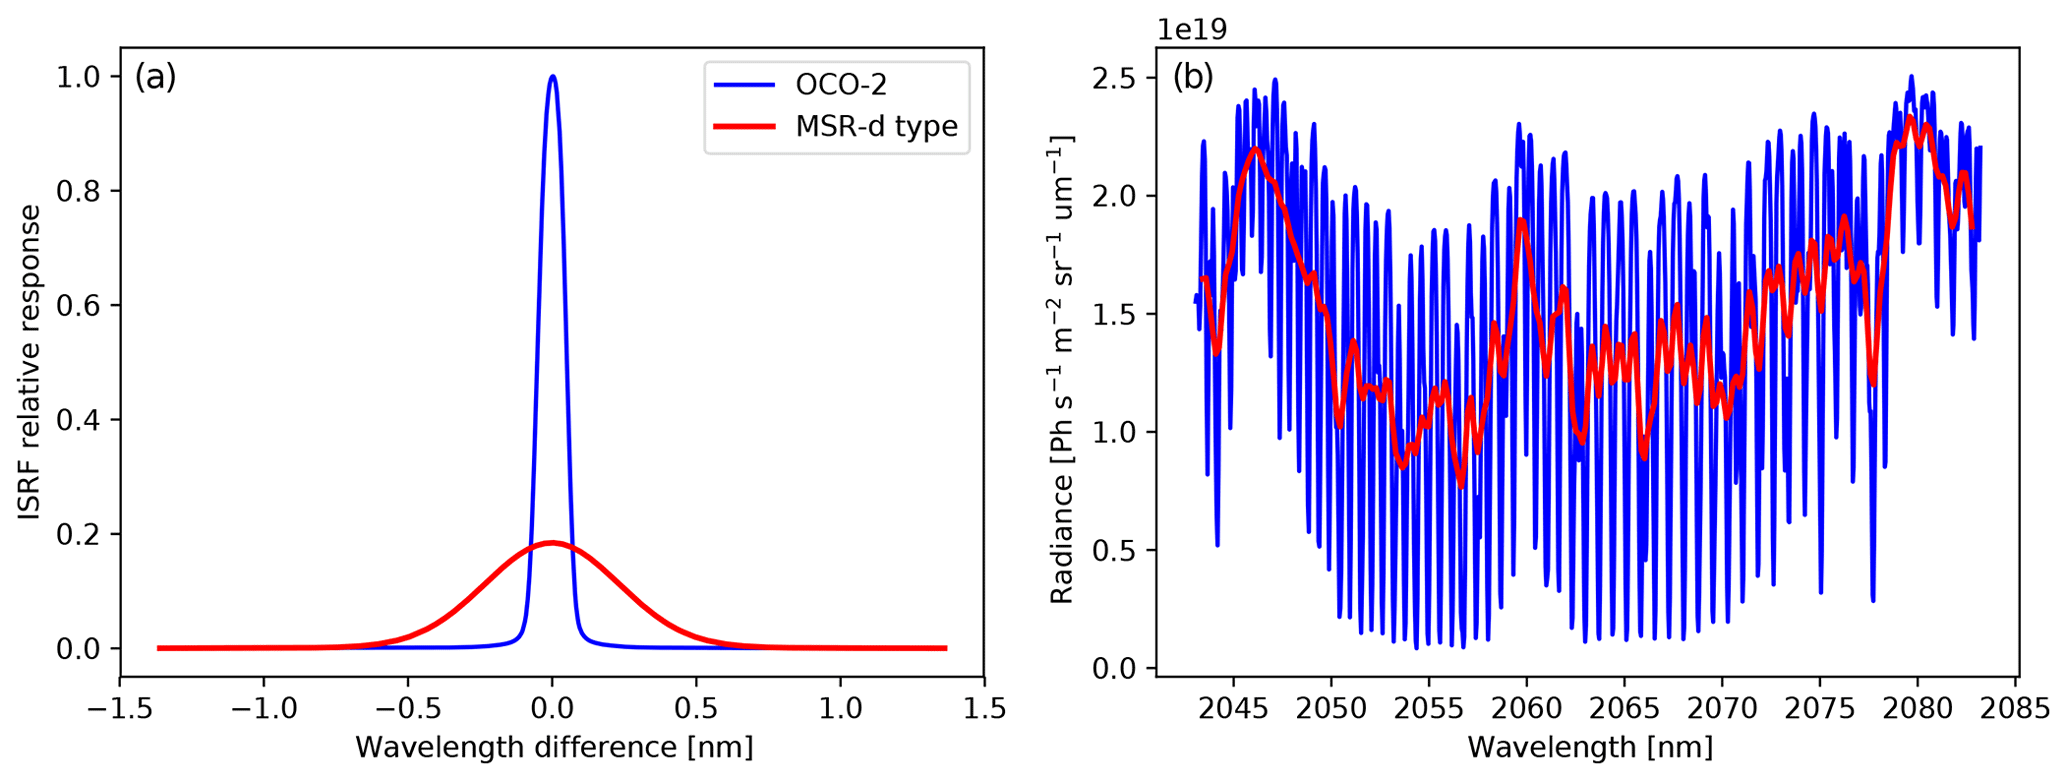
Figure 1Example spectra and instrument spectral response functions of the OCO-2 and MSR-d instruments in the 2.06 µm band. Both OCO-2 and MSR-d ISRFs are scaled to the maximum of OCO-2 ISRF.
Figure 1 shows an example of ISRF and spectra of OCO-2 in the 2.06 µm band degraded to a spectral resolution of 0.55 nm using a Gaussian g with a FWHM of α=0.530 nm. Analogously, we generated spectra with a resolution of 0.10 and 0.30 nm in the two other spectral bands as listed in Table 1 with α=0.093 and 0.294, respectively.
With these modifications, we aim to evaluate the spectral sizing of ESA's concept for a CO2 monitoring mission (CO2M). In this study, we investigate retrieval performance of the MSR instrument under spectral resolutions of 0.097, 0.15, 0.30, and 0.55 nm for the 2.06 µm band while recently a spectral resolution of 0.35 nm was specified for the CO2M mission. It should be noted that, for a real MSR instrument, the signal-to-noise ratio (SNR) will be much higher than that of a degraded GOSAT or OCO-2 spectrum. Another limitation of using OCO-2 measurements, apart from adapting its SNR, is that the generated MSR measurements are limited to the instrument's spectral range, which differs from that of the CO2M mission. Retrieval results here are therefore not expected to be representative for the CO2M mission adopting an MSR sizing approach.
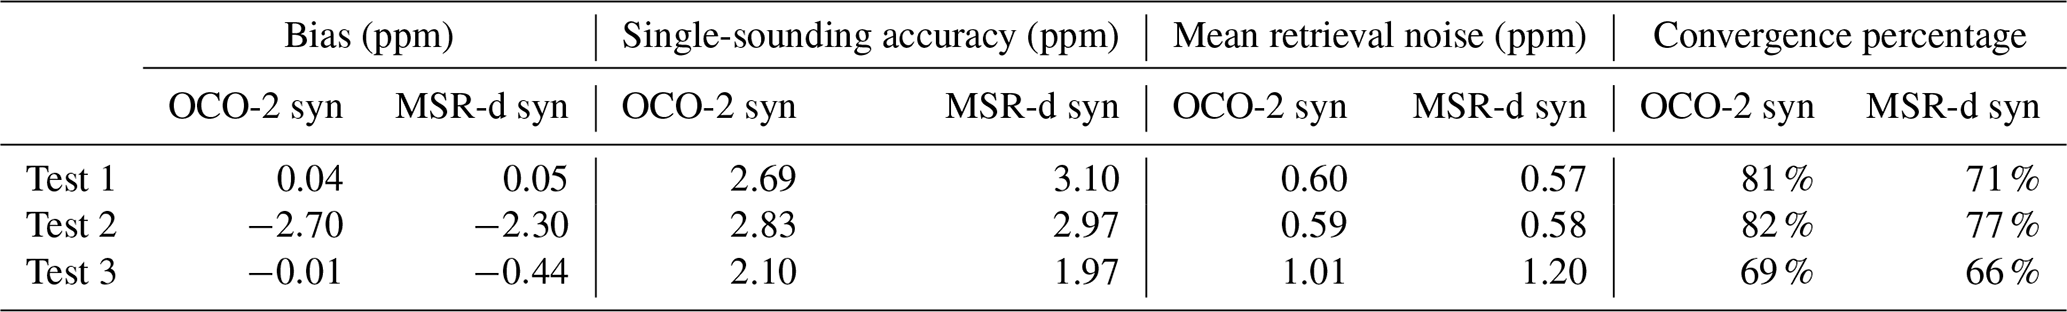
Table 3XCO2 retrieval performance for synthetic OCO-2 and MSR-d measurements. Intensity offsets are added to spectra in test 2 and test 3 but only fitted for test 3. The bias and the single-sounding accuracy are the mean and standard deviation of differences between retrievals and truths, respectively. Noise errors are retrieval uncertainties from linear noise propagation.

For our study, we considered OCO-2 observations only over land in the period from September 2014 to October 2017 that are spatiotemporally collocated within 3∘ × 3∘ longitude–latitude and within 2 h with XCO2 ground-based observations of the TCCON network. Here, we use OCO-2 version 8 L1b data and obtained about 463 000 soundings collocated with 16 TCCON sites as shown in Table 4. Analogously, we proceeded with GOSAT land observations (L1b version V201) for the years 2009–2016 using only “high-gain” measurements of the instrument. Given the sparse spatial sampling of GOSAT, we employed a coarse spatial collocation criteria within 5∘ × 8∘ latitude–longitude which results in 270 000 individual observations collocated with observations from 10 different TCCON stations. Some TCCON sites are not used in this study mainly due to the following two reasons: (1) limited overpass, for example, for high-latitude sites and island sites; at high-latitude areas, satellite observations over land usually have low SNR and low Sun which has to be filtered out; (2) sites located within polluted or elevated areas, such as Caltech, USA, and Zugspitze, Germany. As part of the processing chain, the data were filtered further with respect to latitudinal position, impact from regional CO2 sources, and terrain roughness. For both data sets, we retrieved the column densities of CO2 and in the case of GOSAT also CH4 using the RemoTeC algorithm for measurements at their original resolutions. Subsequently, we reduced the spectral resolution to that of the MSR spectral sizing point of Table 1 assuming a fixed sampling ratio, as described in the previous section, and repeated the retrieval. To better understand the impact of the spectral resolution on CO2 retrieval quality, the different MSR spectral sizing points first included a spectral degradation of the 0.76 band and 1.6 µm band of the original OCO-2 data to a resolution of 0.1 and 0.3 nm, respectively (MSR-a), and subsequently we gradually degraded the spectral resolution in the 2.06 µm band to 0.15, 0.30, and 0.55 nm while retaining the spectral resolutions in the 0.76 µm band and 1.6 µm band (MSR-b, MSR-c, MSR-d).
In order not to be affected by unknown instrument-related issues such as spectrometer stray light, we generated simulated spectra for a global ensemble as described by Butz et al. (2009). The ensemble comprises 11 036 spectra and is designed to estimate retrieval errors induced by aerosol and cirrus for 4 typical days representing four seasons (Butz et al., 2012). In the ensemble, the description of aerosol and cirrus is much more complex than in the retrieval and so the assessment of the induced XCO2 retrieval error can be used to estimate the scattering-induced error for different spectral resolutions of the measurement. More details on the ensemble can be found in Butz et al. (2009, 2012) and Hu et al. (2016).
To start off our analysis, we would like to emphasize that in this work no bias correction is applied to the data. The differences between the XCO2 retrieval product and the TCCON observations are summarized per station by the mean bias b and the corresponding single-sounding accuracy σ defined by the root-mean-square deviation. To estimate the retrieval error caused by measurement noise, we use the mean of retrieval noise, which is obtained through linear error propagation in the retrieval. Additionally, we estimate the station-to-station variability σs as the standard deviation of the mean biases among all TCCON sites to estimate the data product accuracy on regional scales, which is crucial for regional flux inversion. The validation with TCCON measurements is limited by its spatial coverage. To compensate for the spatial sparseness of TCCON sites, we start with synthetic retrievals for global ensembles.
4.1 OCO-2 synthetic spectra
First, we studied the XCO2 retrieval error for synthetic spectra calculated for the OCO-2 spectral ranges and resolutions and for the MSR-d spectra derived from simulated OCO-2 measurements according to Sect. 2. The reported XCO2 retrieval error is induced by the limited aerosol information that can be inferred from the measurement and the different sensitivity to the assumed measurement noise, which is on the level of the OCO-2 instrument (Mandrake et al., 2015). Any systematic error due to erroneous molecular spectroscopy or instrument calibration errors is not addressed here.
For performance evaluation, we considered the global ensemble as described in Sect. 3 without cirrus contamination and performed three different retrieval analyses.
-
Test 1. No radiometric offsets are included in the measurements.
-
Test 2. The OCO-2 radiance offsets identified by Wu et al. (2018) of 0.15 %, 0.5 %, and 0.14 % of the mean radiance of each band are added to the 0.76, 1.6, and 2.06 µm bands, respectively. No radiometric offset is fit.
-
Test 3. Same radiometric offset as above are included but with a radiometric offset fit.
Table 3 shows the bias, single-sounding accuracy, and mean retrieval noise of synthetic OCO-2 and MSR-d measurements for the three test cases. We included all converged cases in our analysis without applying extra quality filtering. For test 1, aerosols induced a scatter in the retrieved XCO2 with a single-sounding accuracy of 2.7 and 3.1 ppm for OCO-2 and MSR-d synthetic measurements, respectively. Albeit with different sampling ratios, the mean retrieval noises are quite similar between OCO-2 and MSR-d synthetic measurements. When adding intensity offsets but not accounting for the offset in the retrieval (test 2), the OCO-2 and MSR-d retrievals exhibit single-sounding accuracy similar to that in test 1 but with an increased negative bias of −2.70 and −2.30 ppm, respectively. The results of test 3 indicate that for simulated measurements the radiometric offset can be fully mitigated by fitting a radiometric offset in each band as additional elements of the state vector for both OCO-2 and MSR-d measurements. However, we can not prove this for MSR-d measurements reproduced from real OCO-2 observations. Moreover, test 1 and test 2 have similar noise-propagated errors but decreased single-sounding precision in the case of moderate spectral sizing. For the CO2M mission, this will be partly mitigated by an MSR instrument with an improved SNR performance.
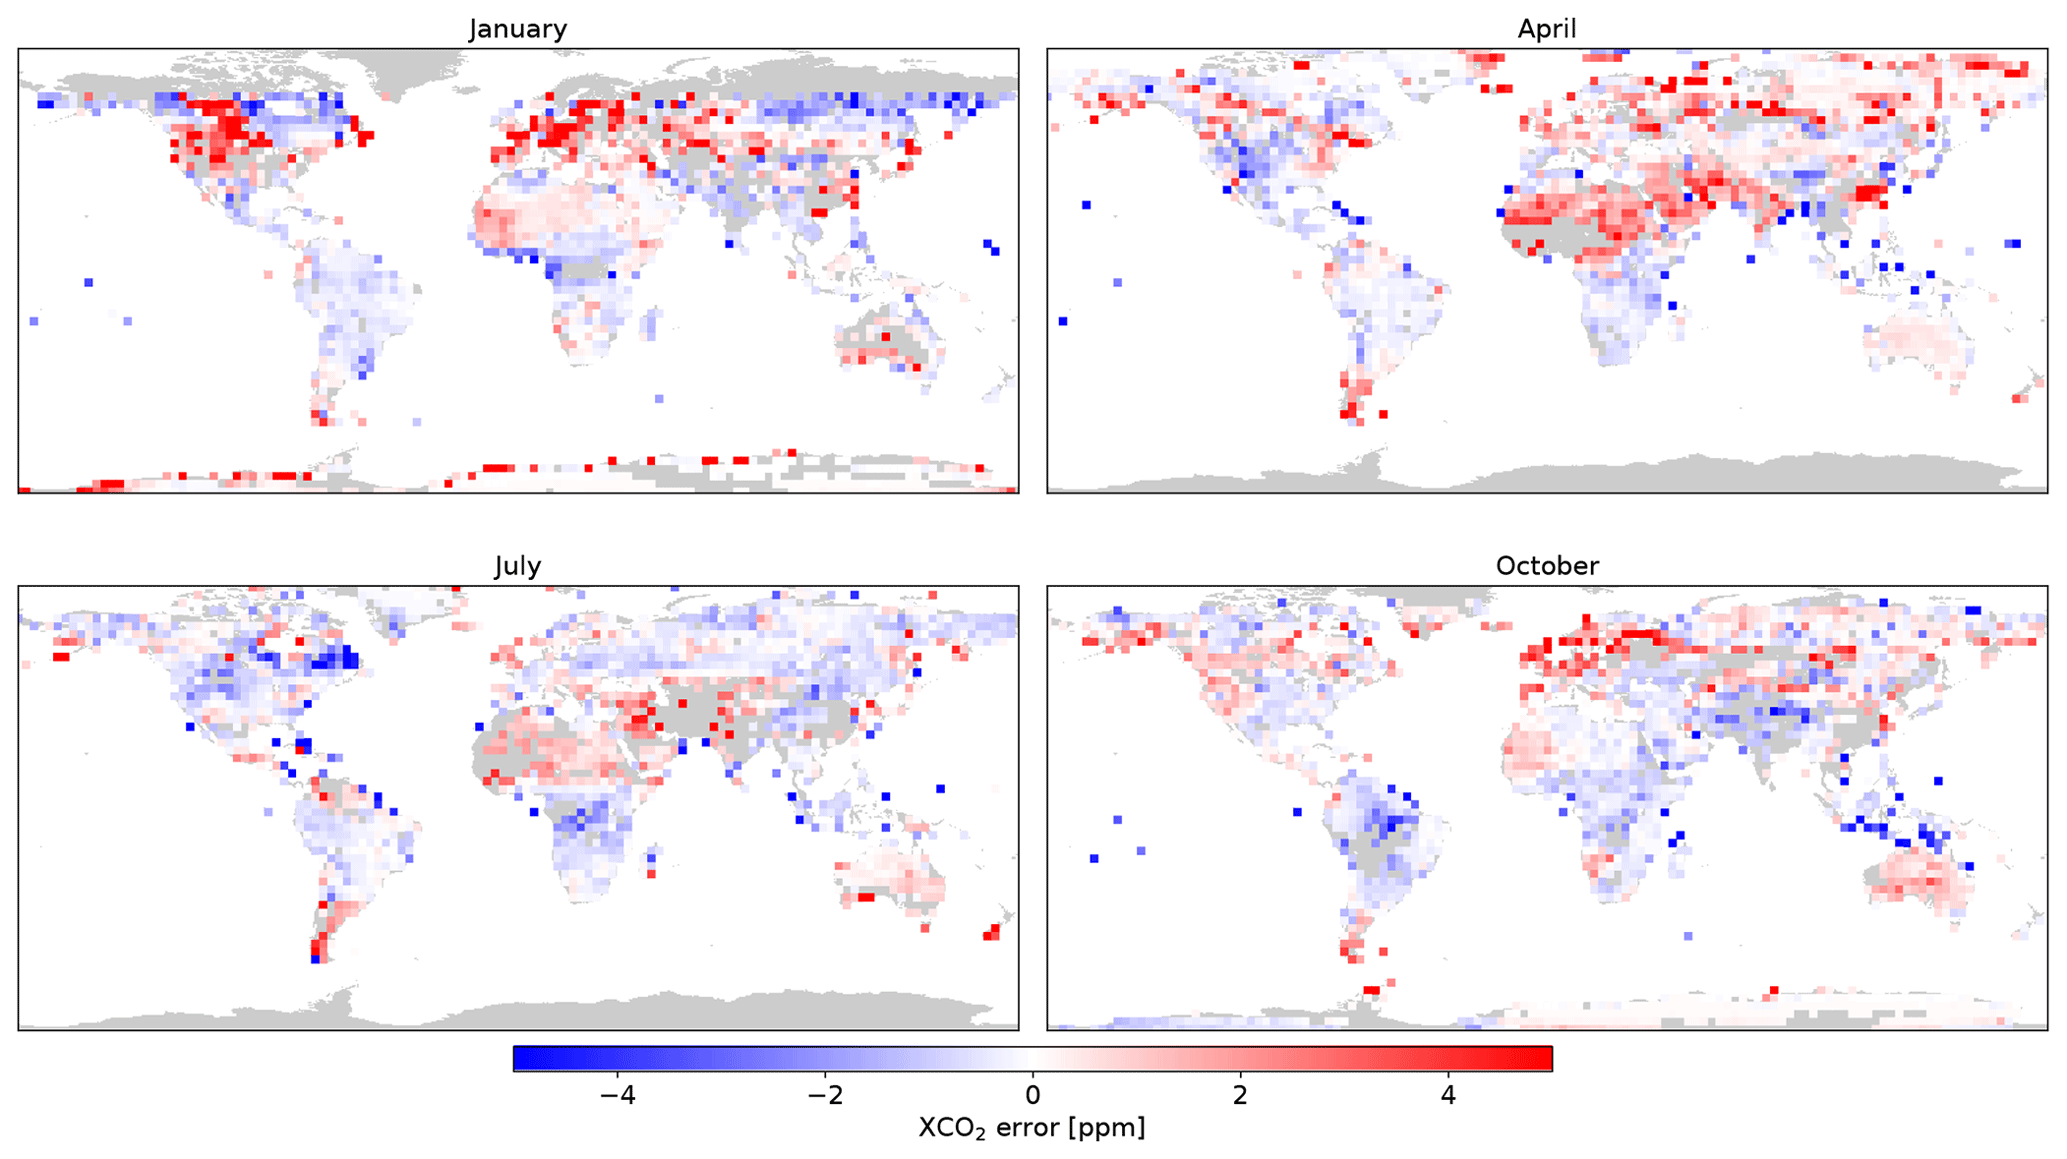
Figure 2XCO2 retrieval errors from MSR-d synthetic spectra of the test 1 for the global ensemble of Butz et al. (2009). Gray areas over land are not processed or retrievals do not converge.
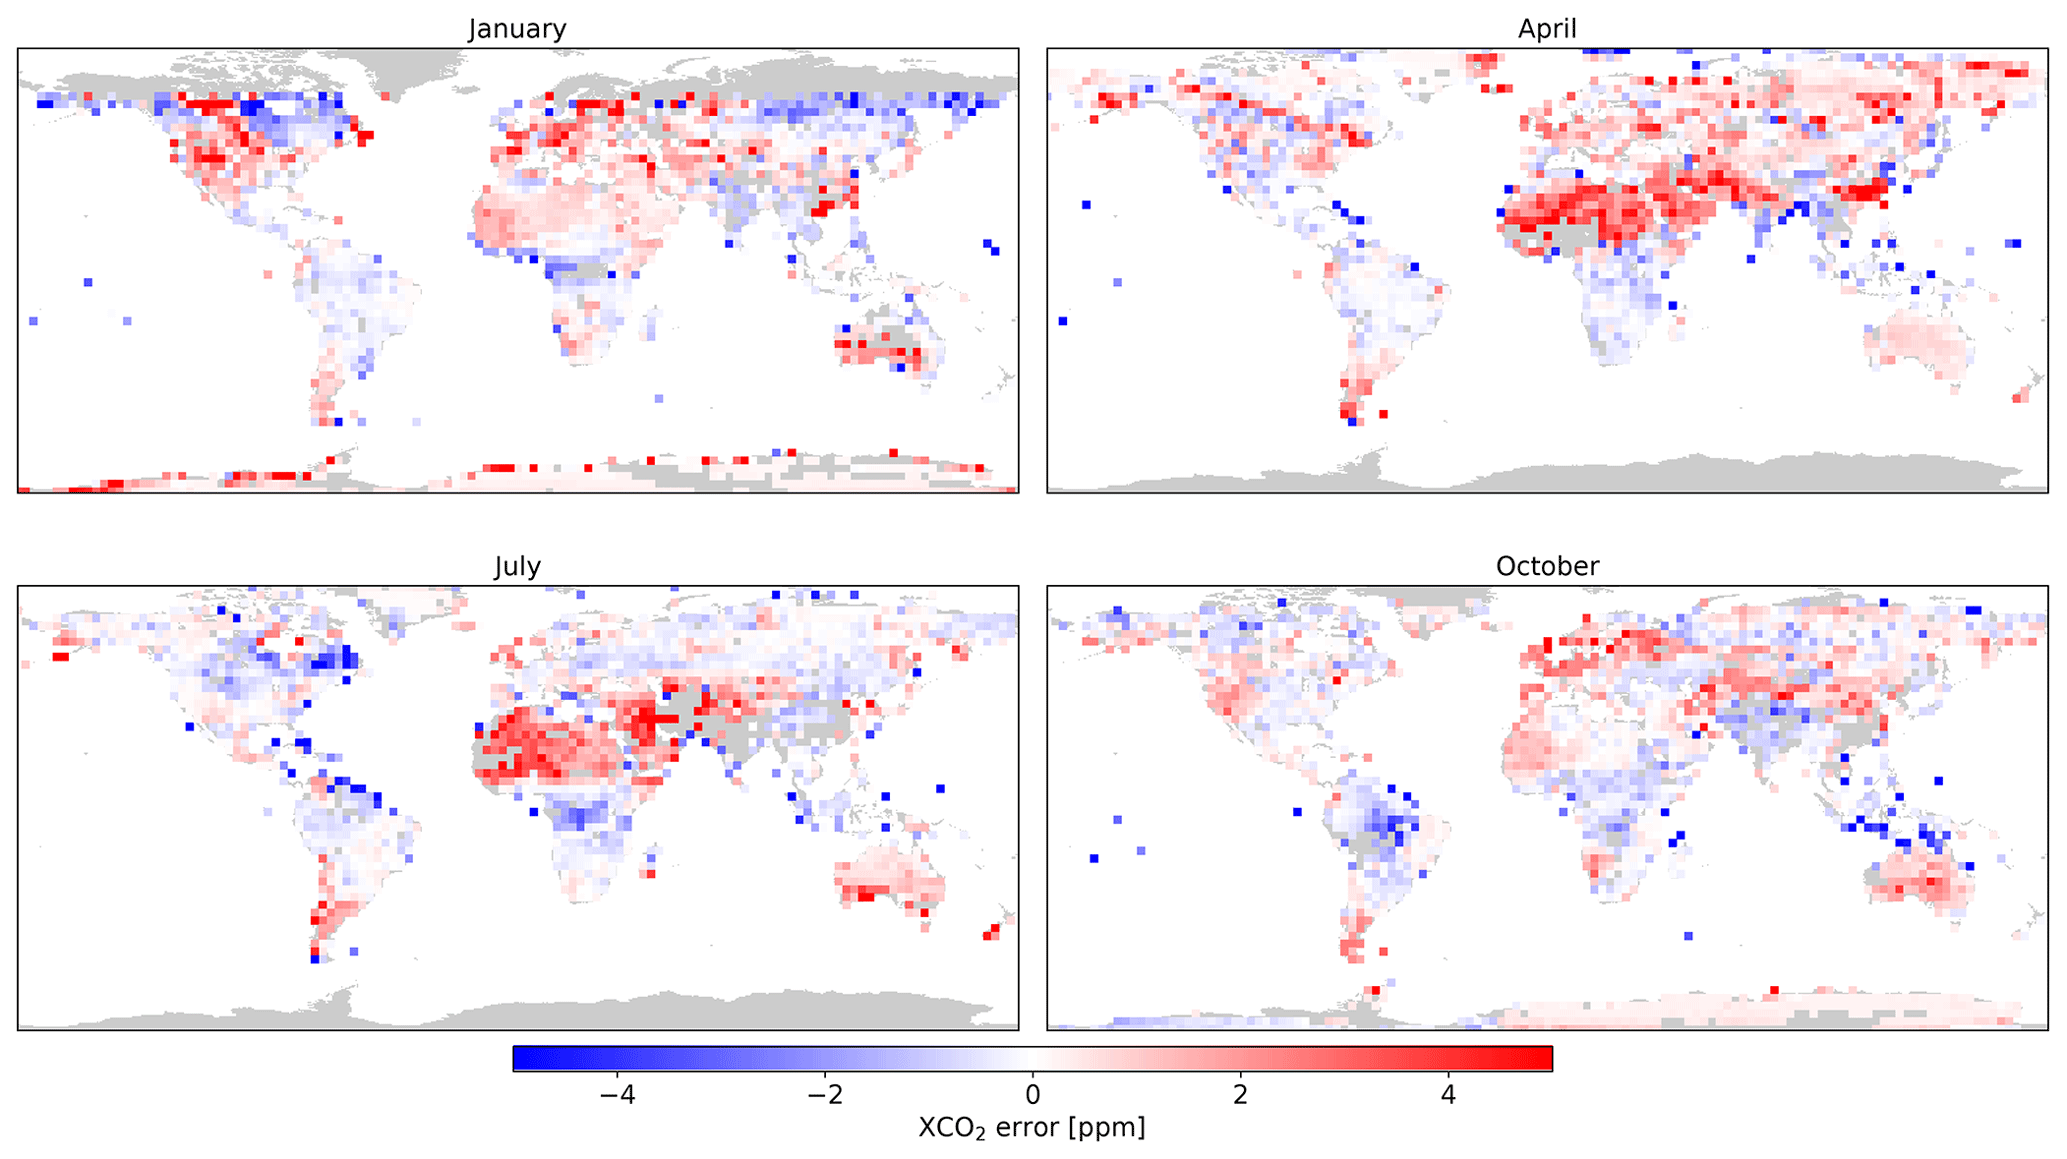
Figure 3Similar to Fig. 3 but for OCO-2 synthetic spectra.
Figures 2 and 3 show the global XCO2 retrieval errors from the MSR-d and OCO-2 synthetic spectra for test 1. In both cases, XCO2 retrieval errors are typically smaller than 4 ppm in most regions. As discussed by Butz et al. (2012), aerosol-introduced uncertainties strongly depend on the concentration, the profile, and the micro-physical properties of the aerosol, like size distribution and refractive index, as well as on the surface albedo. Although it is difficult to identify the exact source of retrieval errors, we see that with reduced spectral resolution MSR-d retrievals have error distribution and global coverage similar to that of OCO-2. Large errors usually occur at high-latitude regions with low surface albedo or in the Sahara and Asia with seasonal high aerosol loading.
4.2 OCO-2 TCCON validation
Due to the spatial sampling approach of the OCO-2 instrument with a continuous sampling in the flight direction and with eight cross-track samplings, we typically obtain several collocations of OCO-2 measurements with TCCON observations for our collocation criteria. To evaluate the data quality, we consider overpass averages for both the OCO-2 and TCCON XCO2 data. This averaging helps to reduce the impact of random and representation errors in our comparison, where we assume that the latter shows a pseudo-random error pattern.
For OCO-2 around 386 600 of the retrievals converged and 313 500 finally passed the a posteriori quality filtering and are classified as good-quality data. Here, the overall data yield is similar to that reported by Wu et al. (2018). The OCO-2 retrievals have a global bias of −2.50 ppm, an averaged single-sounding precision of σa=1.36 ppm, a mean retrieval noise of 0.25 ppm, and a station-to-station variability of σs=0.56 ppm.
We first degraded the spectral resolution of the 0.76 band and 1.61 µm band but used the original measurements of the 2.06 µm band (MSR-a). Subsequently, we gradually degraded the spectral resolution in the 2.06 µm band as described for the spectral sizing points MSR-b, MSR-c, and MSR-d. We applied the same RemoTeC algorithm settings and similar quality filtering options as above. The filtering is adjusted to guarantee that the percentage of good-quality retrievals in all four MSR retrievals is around 67 % as for the original OCO-2 data, although the number of overpasses per station can still differ for the different spectral sizing points.

Figure 4XCO2 retrievals from MSR-d spectra reproduced from OCO-2 measurements. Panel (a) shows the overall validation and (b) shows the number of observations (NOBS) per station. In (a) we included the total number of observations (n), overall bias (b), single-sounding accuracy (σ), station-to-station variability (σs), Pearson correlation coefficient (r), and one-to-one line. We subtracted a global bias of ppm.

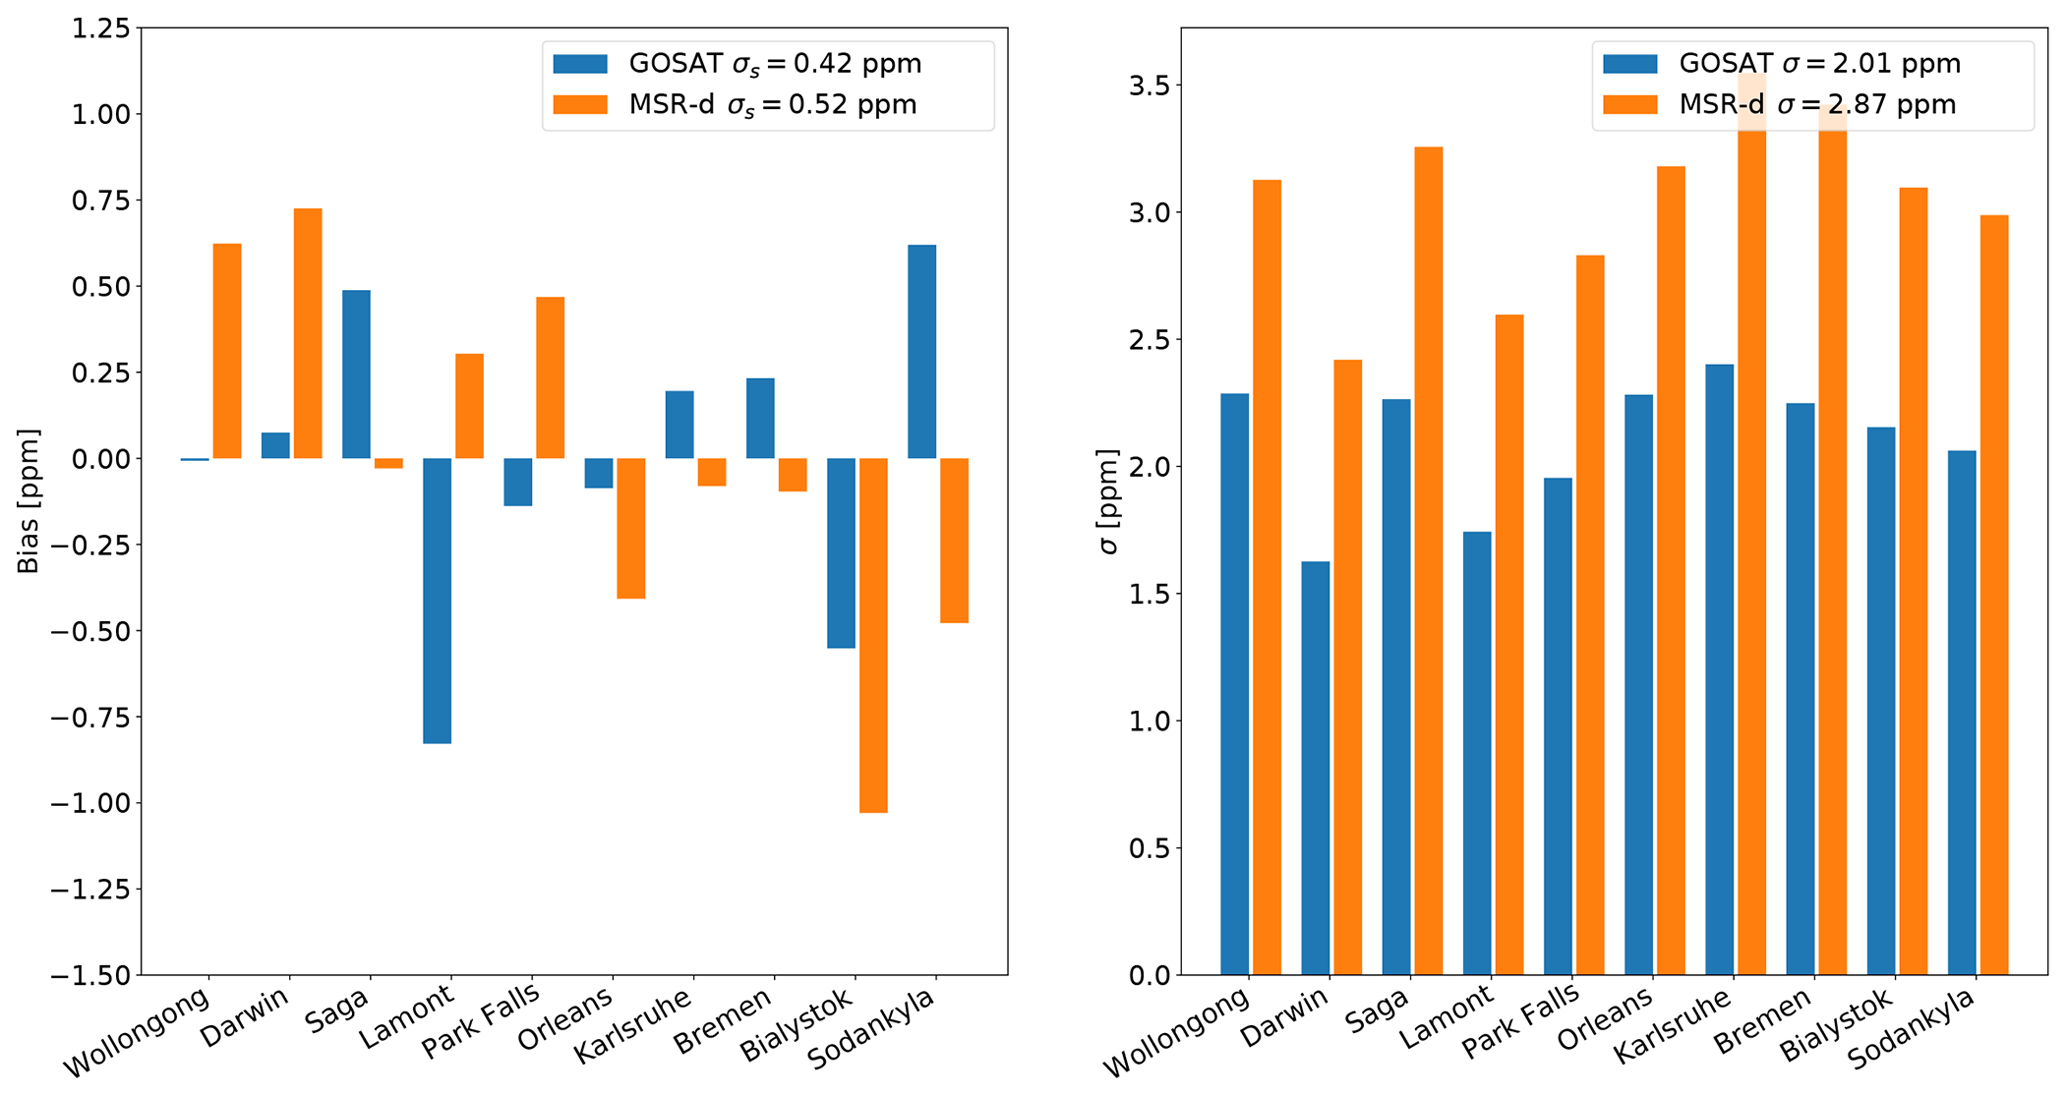
Figure 5Bias and standard deviation (σ) at different TCCON stations for OCO-2 and MSR retrievals. Mean biases are subtracted accordingly for OCO-2 and MSR retrievals to show the bias variation on the same reference level. The station-to-station variability (σs) and single-sounding accuracy (σ) are included in the (a) and (b) legends, respectively. Here, MSR measurements are reproduced from OCO-2 measurements.
Figure 4 summarizes XCO2 retrieval performance for the MSR-d sizing point with an average single precision accuracy of σ=1.68 ppm, a retrieval noise error of 0.83 ppm, and a station-to-station variability of σs=0.56 ppm. Here, the XCO2 data product has a large negative global bias of −6.97 ppm, which is subtracted in the plot. The variation in biases between 16 different stations is depicted in Fig. 5 while the station-to-station variability σs is more or less the same as that in OCO-2 retrievals.
Table 5XCO2 retrieval performance for OCO-2, MSR-a, MSR-b, MSR-c, and MSR-d measurements under similar throughput. Here, MSR measurements are generated using OCO-2 measurements.
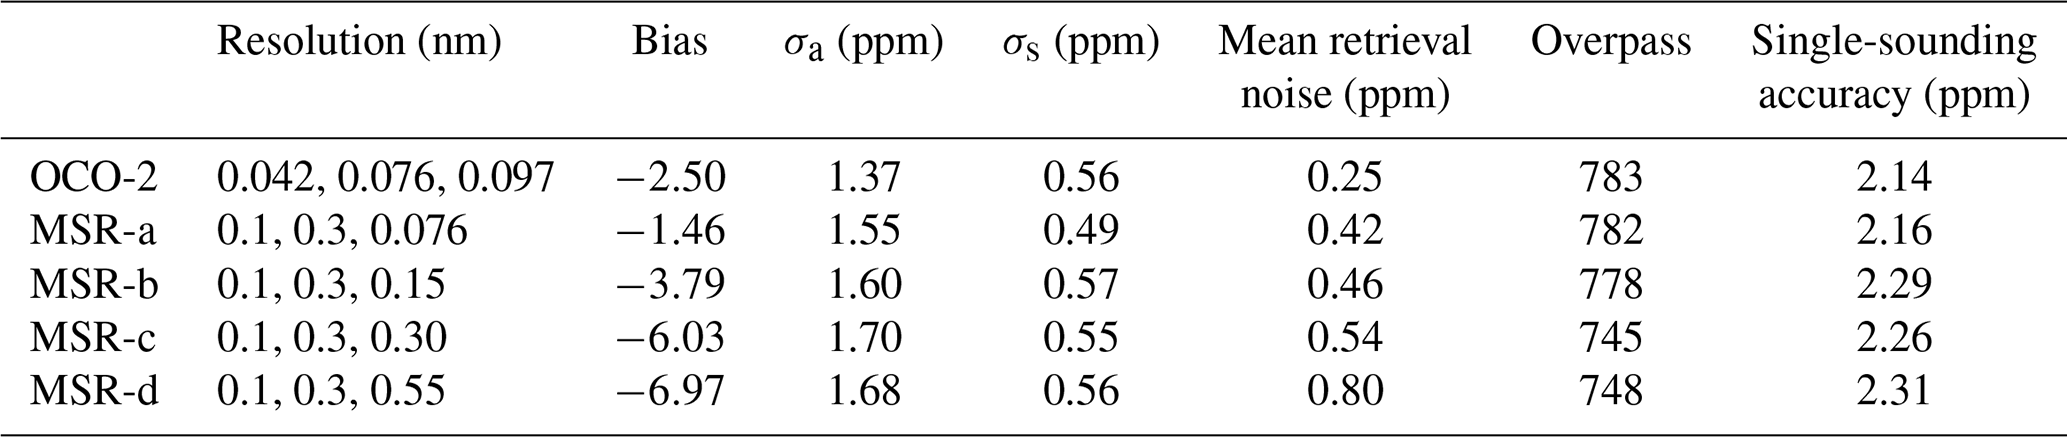
Table 6Same as Table 5, but for the intersection between OCO-2 and MSR retrievals.
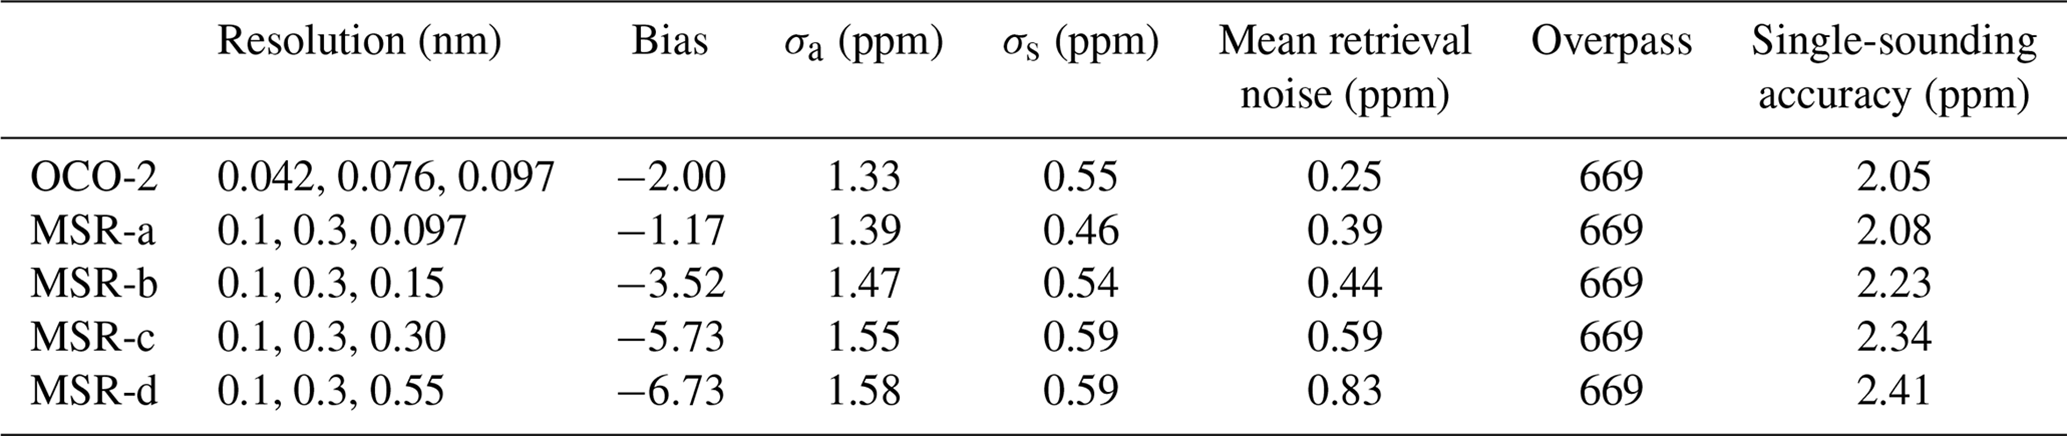
To better understand these results and in particular the increase in the global bias, Table 5 summarizes the XCO2 retrieval performance for OCO-2 and all MSR measurements, i.e., also the MSR-a, MSR-b, and MSR-c spectral sizing points. Here the overall data yield is very similar for the different data sets although differences may occur due to a different percentage of convergence. Therefore, we also analyzed the results for the subset of identical data points, shown in Table 6.
From MSR-a retrievals, we see that degrading the 0.76 µm band and 1.61 µm band has limited impact on the XCO2 retrieval performance. For both selection approaches, lowering the spectral resolution in the 2.06 µm band causes an increase in single-sounding precision, mean retrieval noise, and mean bias, where the station-to-station variability shows little sensitivity to the different resolutions. Part of the scatter error can be attributed to retrieval noise, which is also gradually increased when lowering the spectral resolution. This part of the uncertainty will be reduced by an instrument with better SNR, which is the advantage of the MSR instruments.
The discrepancy in the mean bias could be for a large part due to intensity offset in the 2.06 µm band of OCO-2. As shown in Tables 5 and 6, the global mean bias increases greatly only when we degrade the 2.06 µm band. As reported by Wu et al. (2018), fitting additive intensity offsets to the two CO2 absorption bands can improve both the accuracy and the single-sounding precision of the XCO2 retrieval. The fitted intensity offsets are also highly correlated (r>0.70) with the mean signal in each band. This may hint at a stray-light-related radiometric error. Not fitting such an intensity offset reduces the depth of telluric absorption lines with respect to the continuum and so leads to an underestimation of the CO2 column. The sensitivity to this radiometric error seems higher for low-resolution spectra.
4.3 OCO-2 hot spot and regional gradient detection
One of the main objectives of the European CO2 monitoring mission is to capture CO2 variations from regional to local scales. In this section, we evaluate to what extent this capability is affected by a reduced spectral resolution of the MSR-c spectral sizing concept. To this end we use OCO-2 observations from 8 September to 31 October 2014, and we compare the OCO-2 and the spectrally degraded MSR-c retrievals over Europe, the Middle East, and Africa and for two individual orbits with XCO2 hot spots as presented by Nassar et al. (2017).
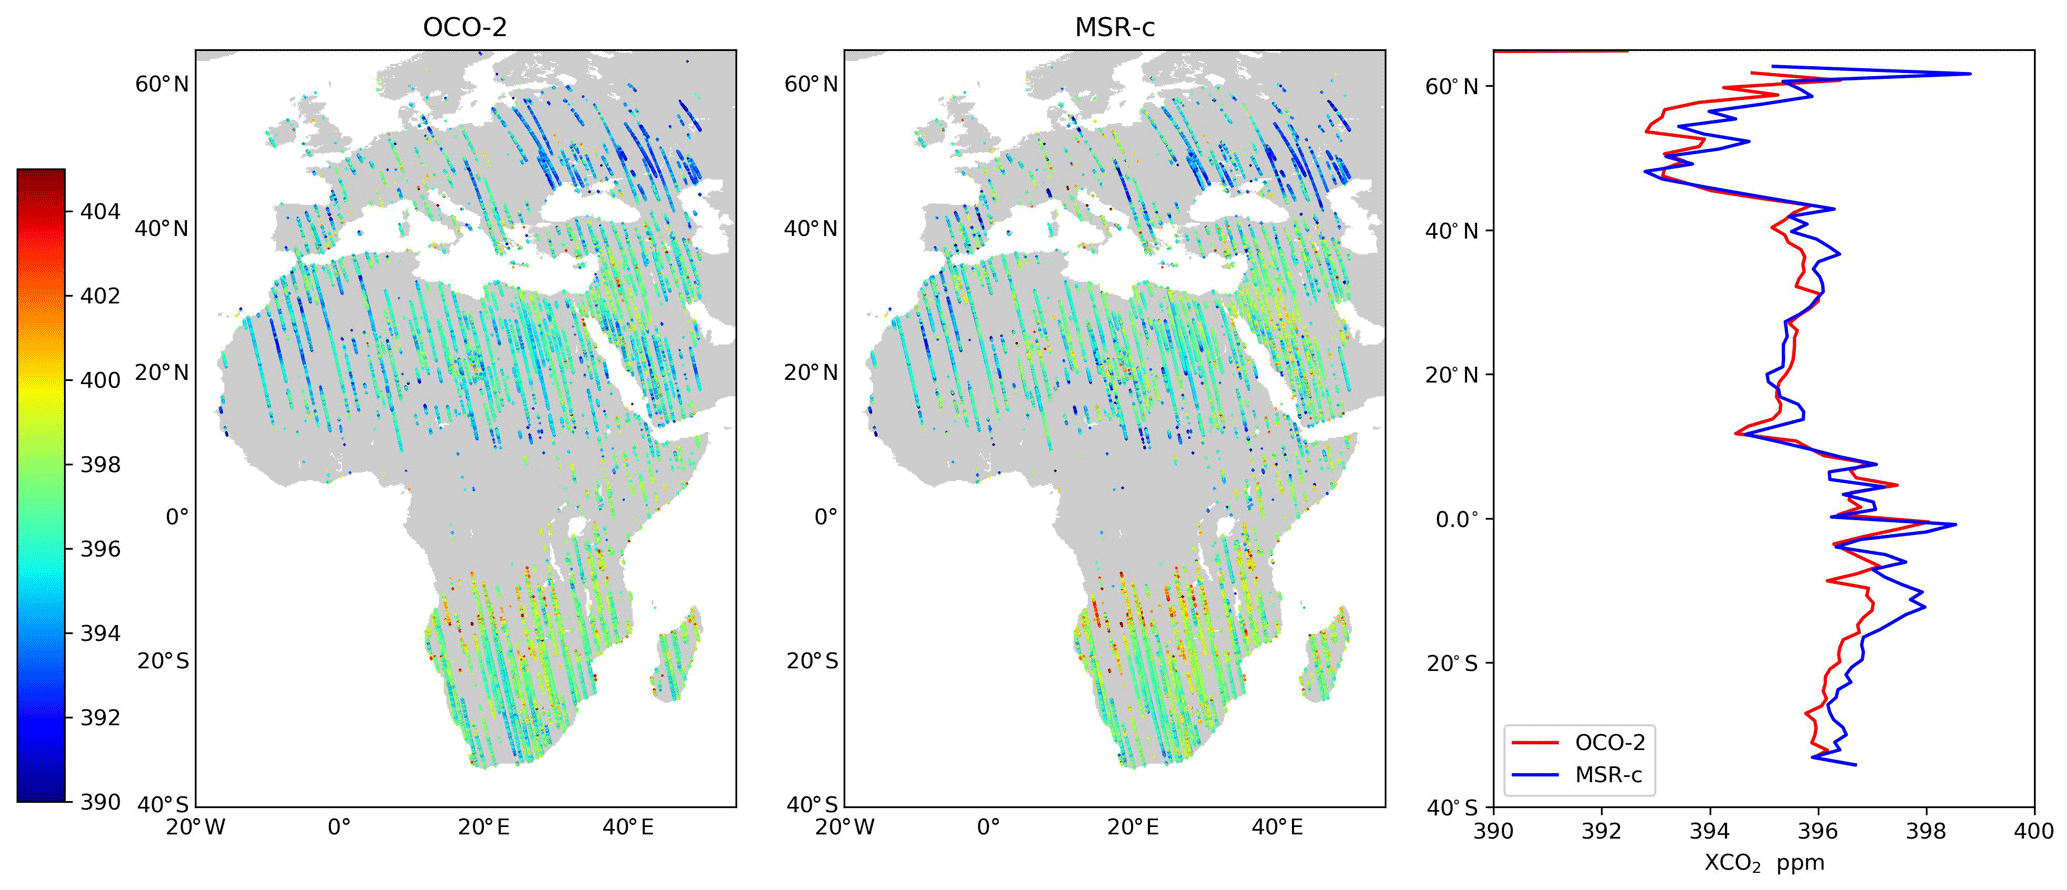
Figure 6XCO2 retrievals over Europe, the Middle East, and Africa using OCO-2 and MSR-c measurements. We processed all orbits obtained by OCO-2 between 8 September and 31 October 2014. For each type of retrieval, the corresponding mean bias in Table 5 is subtracted. In the right panel, we include latitude variation in XCO2 averaged over longitude.
Figure 6 shows the OCO-2 and MSR-c XCO2 products over the EMEA region, which include in total around 330 000 individual data points. Here, we corrected both data sets with the corresponding mean bias of −2.50 and −6.03 ppm from Table 5. The OCO-2 and MSR-c retrievals in this region are highly correlated with r=0.80, and the difference between corresponding cases has a standard deviation of 1.23 ppm. The two data sets have very similar XCO2 distributions and both can capture regional variations well. For example, the low values of XCO2 in eastern Europe of about 393 ppm and its increase in the Middle East to 396 ppm are clearly present in both data sets. Moreover, both XCO2 products show enhancements to about 398 ppm towards southern Africa due to seasonal biomass burning.
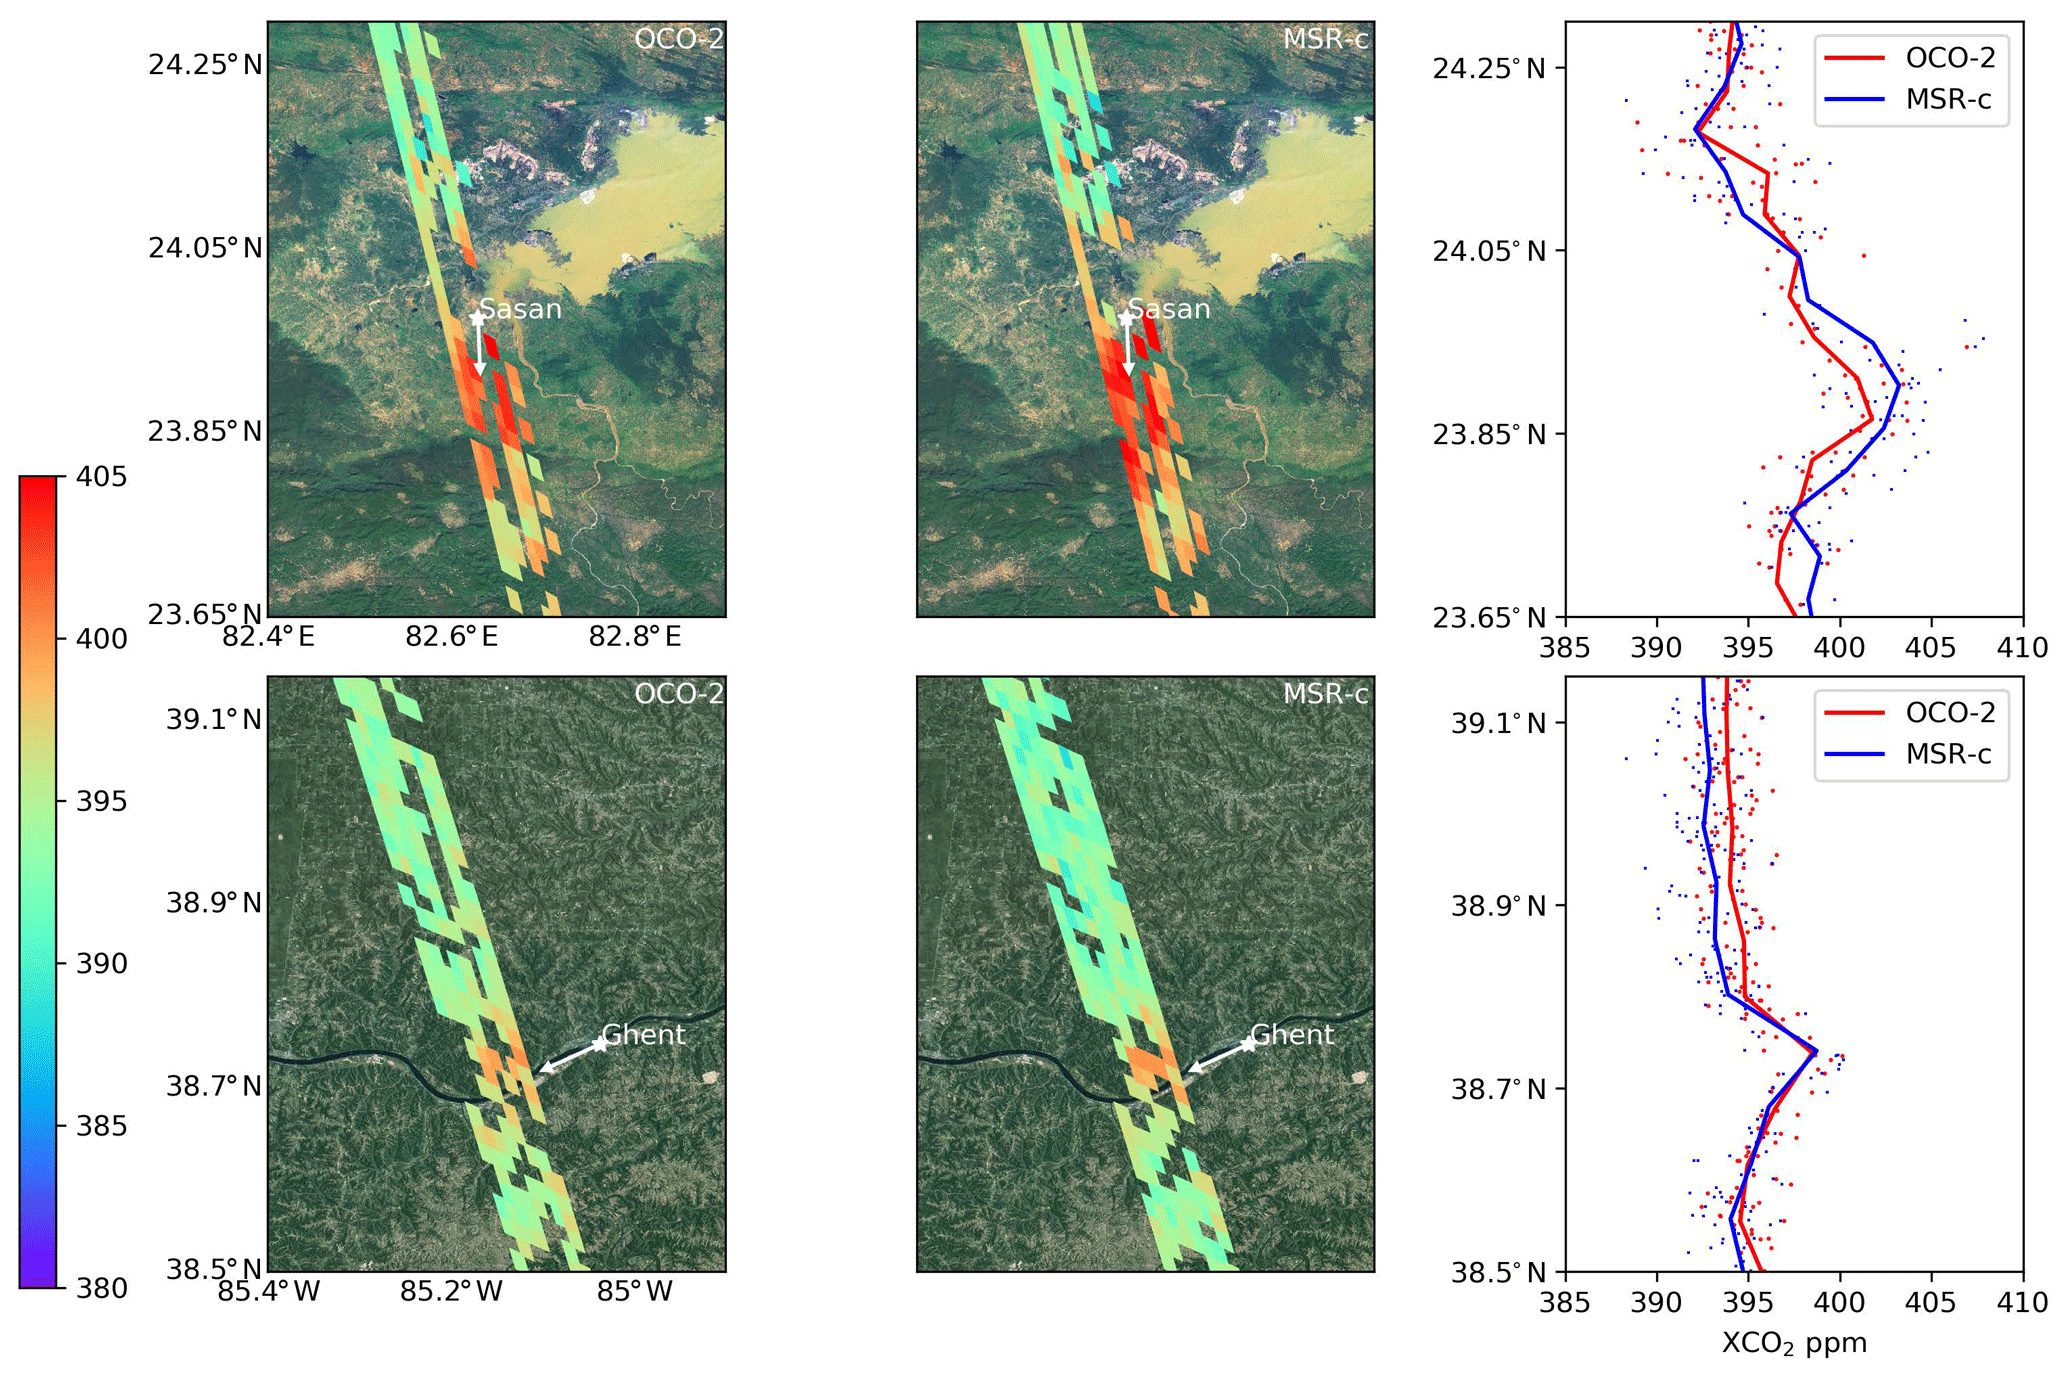
Figure 7XCO2 retrievals along orbits with hot spots as observed by OCO-2 and MSR-c instruments. Local potential sources (power plant) are marked by asterisks and the directions of the local wind are marked with arrows. For each hotspot overpass, XCO2 values (scatter dots) and median values (solid lines) along the orbit are shown in the right most panel. Here, OCO-2 passes by the Sasan and Ghent power plants on 23 October 2014 and 13 August 2015, respectively. Mean biases reported in Table 5 are removed from each orbit. Base map derived from Esri ArcGIS (2011).
Nassar et al. (2017) reported on the OCO-2 capability to detect local XCO2 emissions from coal power plants. Here we investigate to what extent this capability is affected by the spectral degradation of the MSR-c spectral sizing point. Figure 7 shows two orbits with XCO2 emission plumes from the Sasan power plant in India and Ghent Generating Station in Kentucky, USA, as captured by OCO-2 and MSR-c measurements. In both cases, the XCO2 enhancement around power plants can be well captured by both the original OCO-2 and the MSR-c spectral sizing. Plume emissions depend on the XCO2 enhancement with respect to background. In OCO-2 retrievals, the XCO2 enhancements are about 7 and 5 ppm around the Sasan and Ghent stations, respectively. Compared to OCO-2 retrievals, MSR-c retrievals indicate an increased XCO2 enhancement of about 1.5 ppm for both plume events. Since the estimated emission depends linearly on XCO2 enhancement, the estimate of the spectrally degraded measurements of the MSR-c concept is about 20 % to 30 % higher than that from OCO-2 retrievals.
An important property of satellite observations in the shortwave infrared spectral range is the sensitivity to the total amount of CO2 including the tropospheric boundary layer, which provides key information to characterize CO2 sources and sinks. The column averaging kernel describes this sensitivity showing the derivative of the retrieved XCO2 with respect to changes in the CO2 subcolumns as a function of height. It depends on the measurement error covariance, the regularization strength, and the Jacobian matrix and is discussed in more detail by Butz et al. (2012). Figure 8 compares the averaging kernels for the different instrument concepts and shows that for all resolutions the retrieved XCO2 product shows a stronger CO2 sensitivity in the troposphere than in the stratosphere. Here the MSR-c retrievals have an increasing sensitivity down to the surface but a reduced sensitivity to stratospheric CO2, while for OCO-2 the sensitivity stays more or less constant near the ground. This could be due to the fact that we have reduced sensitivity to pressure-dependent line-broadening effects under coarse spectral resolutions since we do not resolve individual CO2 lines.
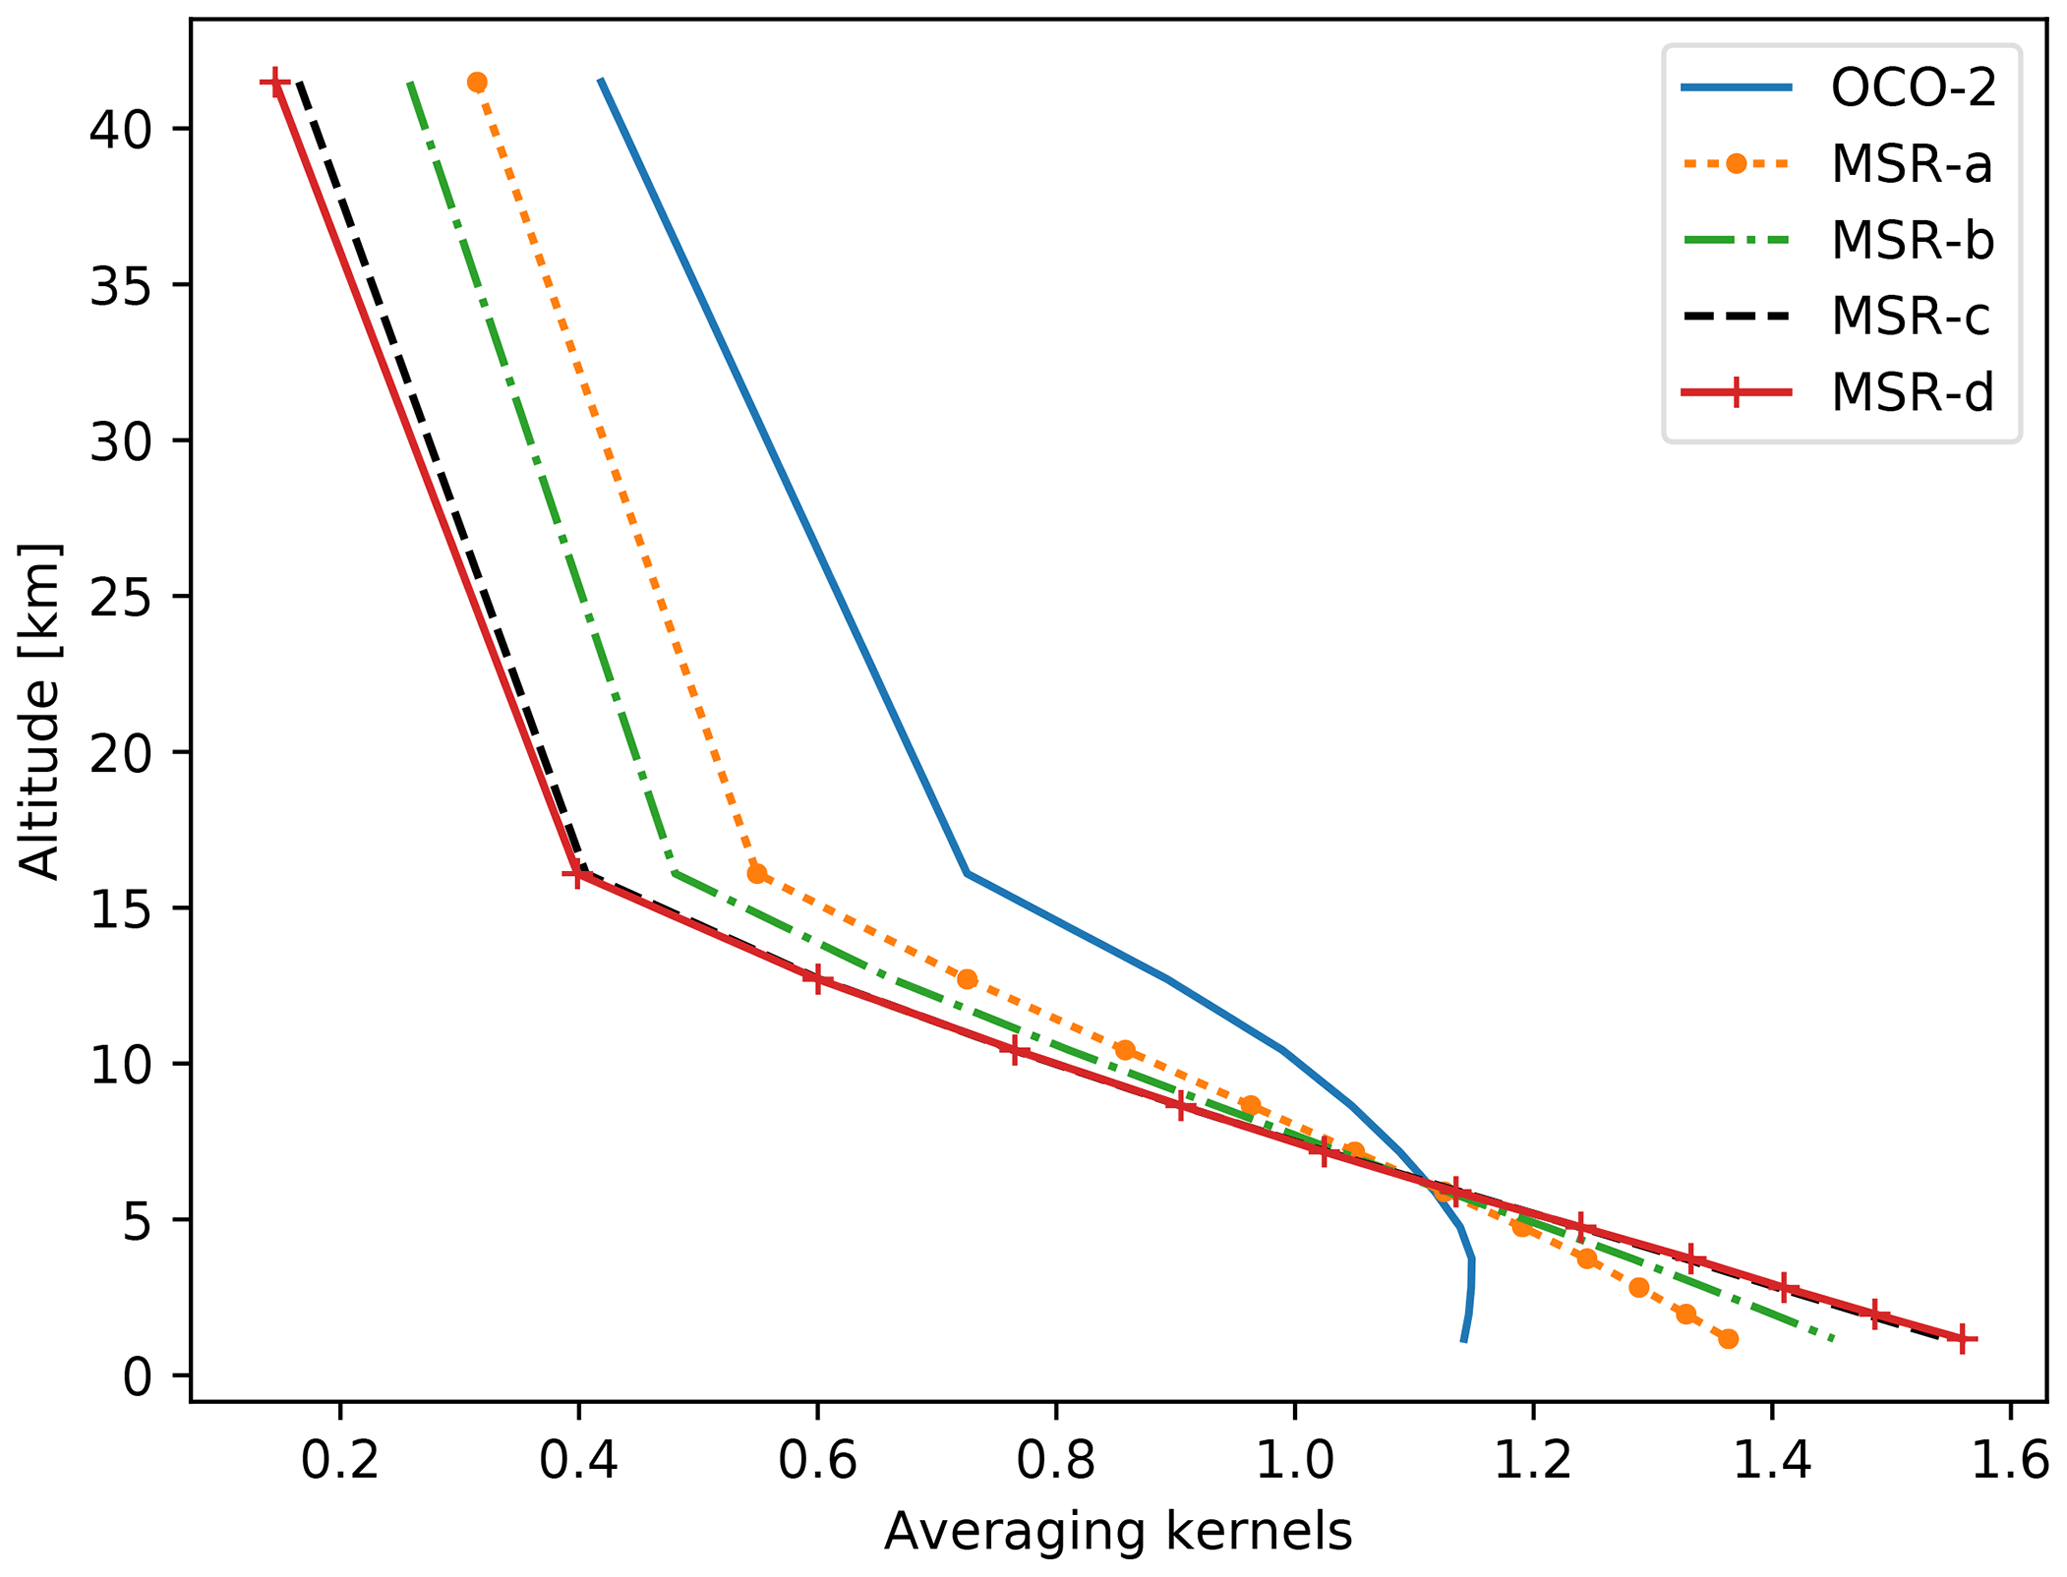
Figure 8Example of an averaging kernel of OCO-2 and MSR retrievals in RemoTeC. The observation is obtained close to the TCCON site Lamont under nadir mode with a solar zenith angle of 20.5∘. Averaging kernels are plotted as a function of central height of the CO2 atmosphere sub-column.
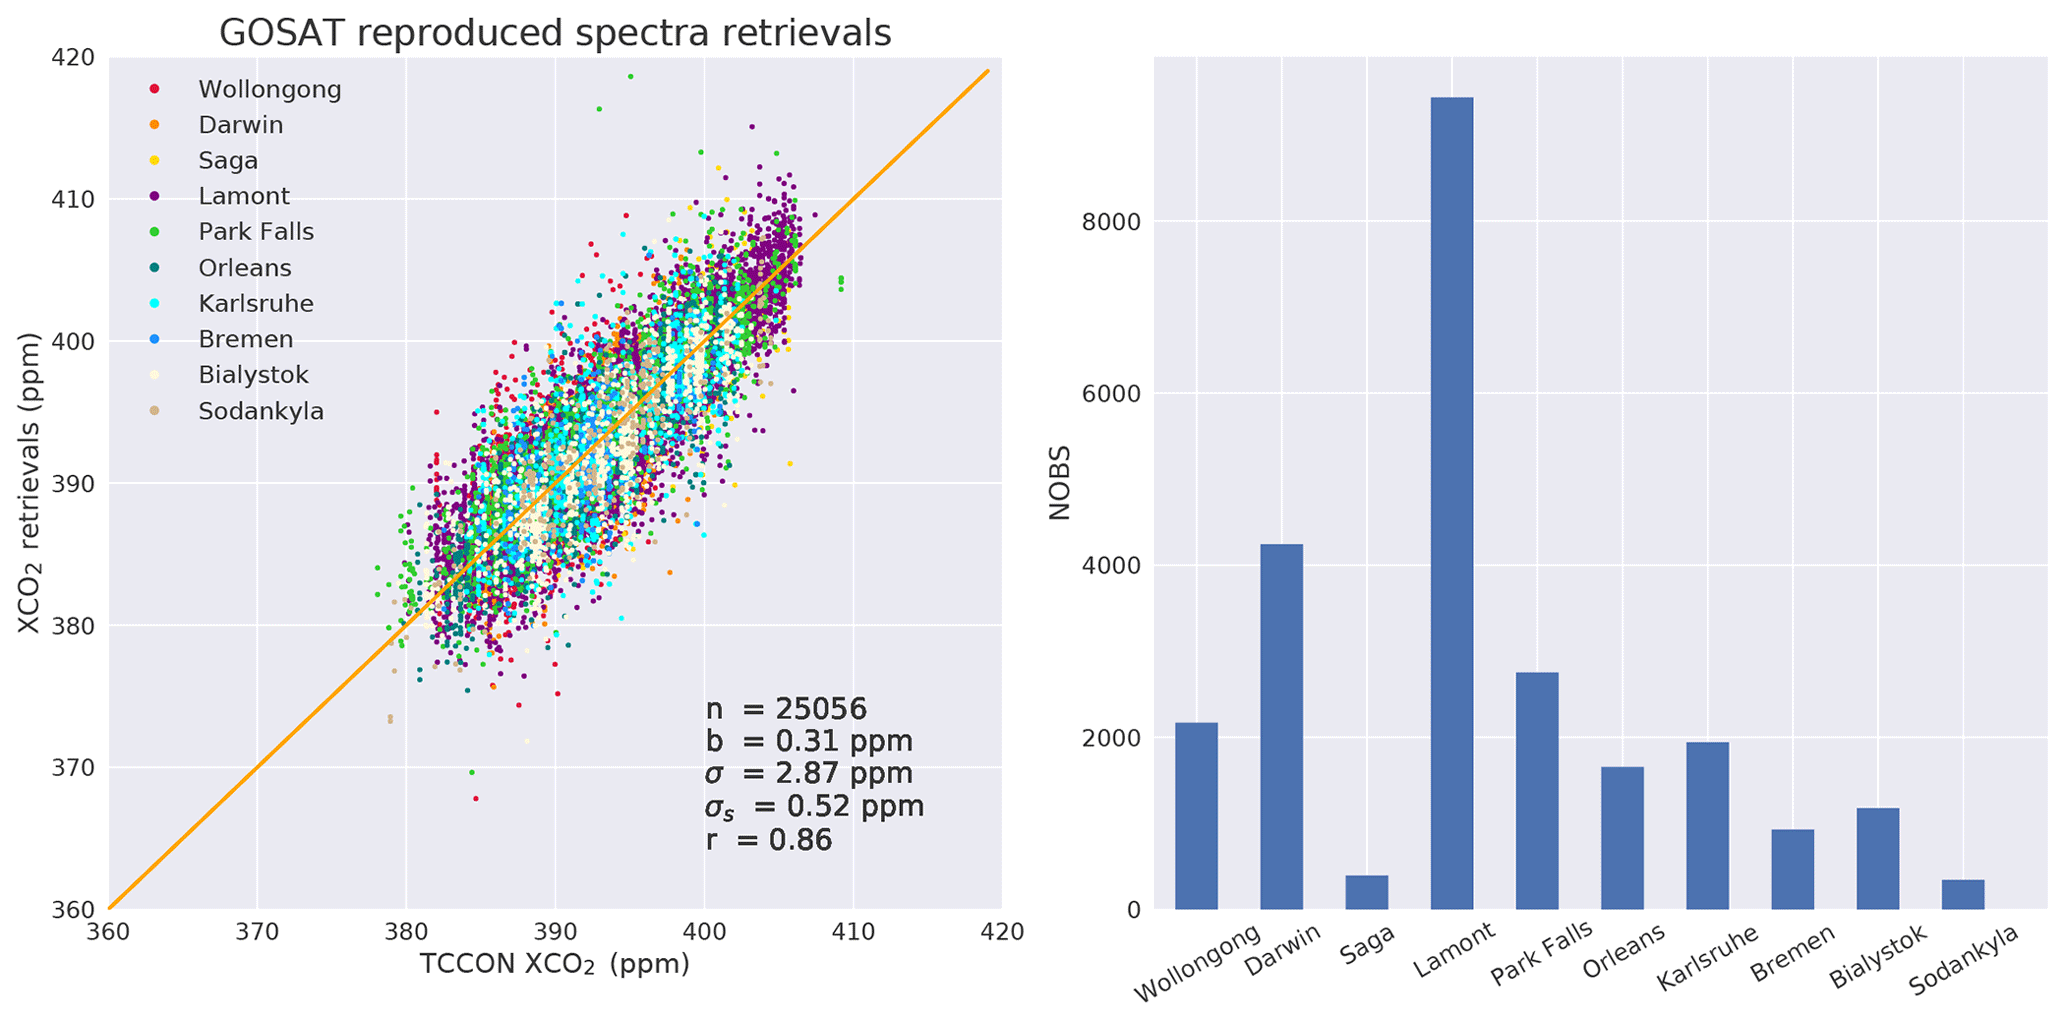
Figure 9XCO2 retrievals from MSR-d spectra reproduced from GOSAT measurements. As in Fig. 4, we included the statistical diagnostics of the study.
4.4 Study using GOSAT spectra
Finally, to compare our findings with independent GOSAT retrievals, we use, analogously to Galli et al. (2014), 270 000 GOSAT–TCCON collocations, where about 250 000 successful retrievals pass the a posteriori quality filtering and are classified as good-quality retrievals. Although methane columns are retrieved simultaneously as in previous studies, we will focus here on the XCO2 retrievals only. The difference with TCCON measurements at 10 sites shows an overall mean bias of ppm, a single-sounding accuracy of σa=2.01 ppm, a mean retrieval noise of 0.62 ppm, and a station-to-station variability of σs=0.42 ppm. Compared with OCO-2 retrievals, GOSAT retrievals have similar mean bias but increased scatter and retrieval noise which is probably due to a higher noise level.
Using the approach of Sect. 2.2, we convert GOSAT measurements to MSR-d measurements and repeat the full-physics retrieval and quality filtering. Figure 9 summarizes the MSR XCO2 retrieval quality and number of observations per station. Almost the same number of observations converge and pass the quality filtering as for the original GOSAT retrievals. Figure 10 shows the variation in the bias and standard deviation among all 10 TCCON stations. Compared to the GOSAT retrievals, the global bias of the MSR retrieval decreases by 0.31 ppm while the station-to-station variability values increase slightly by 0.10 ppm. The mean retrieval noise increased to 1.22 ppm, which is not shown in the figure. The reduced spectral resolution mainly affects the single-sounding precision of XCO2, which rises on average by 0.86 ppm and is exhibited at all TCCON stations. This is in agreement with the findings by Galli et al. (2014) and with the results from simulated measurements.
The increase in the scatter of the errors for low-resolution spectra was already found for the simulated measurement ensemble and is in agreement with the OCO-2 findings of Sect. 4.2. In contrast to the OCO-2 analysis, we see for GOSAT data that the lower resolution has only a minor impact on the global mean bias. In turn, this suggests that the origin of this bias is not due to the interference of molecular spectroscopy but is most likely due to an OCO-2-specific feature, which did not occur in the corresponding GOSAT analysis. This can be attributed to the fact that GOSAT spectra benefit from TANSO-FTS's distinguishing features such as common field stop for all spectral bands and thus can minimize stray-light influence (Kuze et al., 2009).
We investigated the impact of spectral resolution on XCO2 retrieval accuracy with current on-orbit satellite observations, and synthetic measurements. From the study with GOSAT, OCO-2 and synthetic measurements, we conclude that the lower resolution of 0.1, 0.3, and 0.3–0.55 nm in the 0.76, 1.61, and 2.06 µm spectral bands mainly induces a larger scatter in the XCO2 retrieval error, where the scatter gradually increases with lower spectral resolution. Part of the scatter error increase can be attributed to measurement noise, which can be reduced by MSR instruments with improved SNR. For both GOSAT and OCO-2 measurements, the station-to-station variability is largely insensitive to a coarser spectral resolution. For GOSAT, the global XCO2 bias differs little for the different spectral resolutions. This is not the case for OCO-2 measurements, which show a significant increase in the mean bias for decreasing spectral resolution. Most likely this increase is due to instrument-related errors such as a radiance offset in the different bands. The investigation using OCO-2 and GOSAT observations are limited by the spatial spareness of TCCON sites. Therefore, we also investigate the impact of spectral resolution with synthetic spectra of global ensembles. The synthetic study confirms that single-sounding precision decreases for low-resolution, and MSR retrievals have systematic errors similar to those of OCO-2 for global ensembles. Finally, it should be noted that a large part of uncertainty in XCO2 retrievals from OCO-2, GOSAT, or synthetic measurements still comes from pseudo-noise contribution of aerosols.
The XCO2 enhancements due to localized hot-spot emissions can be well captured by both spectral sizing concepts, the original OCO-2 measurements, and the spectrally degraded measurements with about 20 %–30 % difference in the estimated emission rate, as demonstrated for two XCO2 plume events. Moreover, we found that the regional variation in XCO2 in OCO-2 observations over Europe, the Middle East, and Africa is observed by both concepts with similar quality, where data of both retrievals were highly correlated with a correlation coefficient of 0.8 and a standard deviation of the differences of 1.23 ppm.
Currently, the European Commission (EC) and the European Space Agency (ESA) are considering a Copernicus CO2 monitoring system for monitoring anthropogenic CO2 emissions using a spectrometer with moderate spectral resolution similar to the assumptions made in this study (Sierk et al., 2018). Aided by a dedicated multi-angle polarimeter (MAP), the system aims at providing XCO2 products with a spatial resolution of 4 km2 (over a >200 km swath) with a single-sounding accuracy better than 0.7 ppm and a systematic error less than 0.5 ppm. From our study, we see that the reduced resolution of OCO-2 and GOSAT measurements mainly reduces XCO2 precision and has little effect on the station-to-station variability (the systematic error). Since a substantial contribution of the XCO2 error from OCO-2, GOSAT, and synthetic measurements comes from insufficient knowledge about the atmospheric light path, the XCO2 retrieval accuracy will benefit from the measurements of the MAP aerosol instrument, which will characterize aerosol contributions in the CO2 absorption bands well. The multi-angle polarimeter provides valuable information on aerosol microphysical properties and aerosol height which exceeds the aerosol information that can be retrieved from the three-band spectrometer such as GOSAT and OCO-2 (Mishchenko and Travis, 1997; Waquet et al., 2009; Dubovik et al., 2011; Hasekamp et al., 2011; Wu et al., 2016). Moreover, the increased scatter of the XCO2 data will be mitigated by the targeted higher SNR performance of the CO2 spectrometer.
This study is focused on the effect of a reduced spectral resolution on retrieval precision and accuracy using OCO-2 and GOSAT observation. It supports the spectral sizing of the future Copernicus mission but can not address the effects of enhanced SNR and broader spectral range in the 2.06 µm band, as targeted by the future CO2 monitoring system. This study focuses on the use of OCO-2 data with its specific radiometric performance, which thus do not fully cover the spectral range of the CO2M mission. SNR requirements for the Copernicus candidate mission have been derived to meet the targeted single-sounding precision, taking into account the selected spectral resolution (Sierk et al., 2018).
The OCO-2 L1b data (version 8) were provided by the OCO-2 project from the data archive at the NASA Goddard Earth Sciences Data and Information Services Center (https://doi.org/10.5067/1RJW1YMLW2F0, OCO-2 Science Team, 2017). TCCON data were obtained from the TCCON Data Archive (https://tccondata.org/, TCCON, 2019). The MSR retrieval results presented in this paper can be found at: ftp://ftp.sron.nl/open-access-data/ (last access: 11 February 2020).
LW, JB, YM, BS, OH, AB, and JL were involved in the research design. LW and JL wrote the paper and carried out the experiments. JB, YM, BS, and AB edited the paper.
The authors declare that there is no conflict of interest.
We wish to thank Dietrich G. Feist and the two anonymous referees for their interest and valuable comments, which helped to improve the manuscript. The views expressed in the paper can in no way be taken to reflect the official opinion of ESA.
This research has been supported by the European Space Agency (grant no. ESA-IPL-PEO-FF-gp-LE-2016-456).
This paper was edited by Alexander Kokhanovsky and reviewed by three anonymous referees.
ArcGIS, E.: Release 10, Redlands, CA: Environmental Systems Research Institute, 437, 438, available at: https://www.esri.com (last access: 11 February 2020), 2011. a
Boesch, H., Baker, D., Connor, B., Crisp, D., and Miller, C.: Global characterization of CO2 column retrievals from shortwave-infrared satellite observations of the Orbiting Carbon Observatory-2 mission, Remote Sens., 3, 270–304, 2011. a
Bovensmann, H., Buchwitz, M., Burrows, J. P., Reuter, M., Krings, T., Gerilowski, K., Schneising, O., Heymann, J., Tretner, A., and Erzinger, J.: A remote sensing technique for global monitoring of power plant CO2 emissions from space and related applications, Atmos. Meas. Tech., 3, 781–811, https://doi.org/10.5194/amt-3-781-2010, 2010. a
Buchwitz, M., de Beek, R., Burrows, J. P., Bovensmann, H., Warneke, T., Notholt, J., Meirink, J. F., Goede, A. P. H., Bergamaschi, P., Körner, S., Heimann, M., and Schulz, A.: Atmospheric methane and carbon dioxide from SCIAMACHY satellite data: initial comparison with chemistry and transport models, Atmos. Chem. Phys., 5, 941–962, https://doi.org/10.5194/acp-5-941-2005, 2005. a
Buchwitz, M., Reuter, M., Bovensmann, H., Pillai, D., Heymann, J., Schneising, O., Rozanov, V., Krings, T., Burrows, J. P., Boesch, H., Gerbig, C., Meijer, Y., and Löscher, A.: Carbon Monitoring Satellite (CarbonSat): assessment of atmospheric CO2 and CH4 retrieval errors by error parameterization, Atmos. Meas. Tech., 6, 3477–3500, https://doi.org/10.5194/amt-6-3477-2013, 2013. a
Buchwitz, M., Dils, B., Boesch, H., Brunner, D., Butz, A., Crevoisier, C., Detmers, R., Frankenberg, C., Hasekamp, O., Hewson, W., Laeng, A., Noël, S., Notholt, J., Parker, R., Reuter, M., Schneising, O., Somkuti, P., Sundström, A., and De Wachter, E.: ESA Climate Change Initiative (CCI) Product Validation and Intercomparison Report (PVIR) for the Essential Climate Variable (ECV) Greenhouse Gases (GHG) for data set Climate Research Data Package No. 4 (CRDP# 4), Technical Note, 4, 253, available at: http://www.esa-ghg-cci.org/?q=node/95 (last access: 28 May 2018), 2017. a
Butz, A., Hasekamp, O. P., Frankenberg, C., and Aben, I.: Retrievals of atmospheric CO2 from simulated space-borne measurements of backscattered near-infrared sunlight: accounting for aerosol effects, Appl. Optics, 48, 3322–3336, 2009. a, b, c, d
Butz, A., Guerlet, S., Hasekamp, O., Schepers, D., Galli, A., Aben, I., Frankenberg, C., Hartmann, J.-M., Tran, H., Kuze, A., Keppel-Aleks, G., Toon, G., Wunch, D., Wennberg, P., Deutscher, N., Griffith, D., Macatangay, R., Messerschmidt, J., Notholt, J., and Warneke, T.: Toward accurate CO2 and CH4 observations from GOSAT, Geophys. Res. Lett., 38, L14812, https://doi.org/10.1029/2011GL047888, 2011. a
Butz, A., Galli, A., Hasekamp, O., Landgraf, J., Tol, P., and Aben, I.: TROPOMI aboard Sentinel-5 Precursor: Prospective performance of CH4 retrievals for aerosol and cirrus loaded atmospheres, Remote Sensing Environ., 120, 267–276, 2012. a, b, c, d
Caldeira, K. and Wickett, M. E.: Oceanography: anthropogenic carbon and ocean pH, Nature, 425, 365–365, 2003. a
Ciais, P., Crisp, D., Van Der Gon, H. D., Engelen, R., Janssens-Maenhout, G., Heiman, M., Rayner, P., and Scholze, M.: Towards a European operational observing system to monitor fossil CO2 emissions, Final Report from the expert group, European Comission, JRC98161, Brussels B-1049, 2015. a
Cox, P. M., Betts, R. A., Jones, C. D., Spall, S. A., and Totterdell, I. J.: Acceleration of global warming due to carbon-cycle feedbacks in a coupled climate model, Nature, 408, 184–187, 2000. a
Crisp, D., Pollock, H. R., Rosenberg, R., Chapsky, L., Lee, R. A. M., Oyafuso, F. A., Frankenberg, C., O'Dell, C. W., Bruegge, C. J., Doran, G. B., Eldering, A., Fisher, B. M., Fu, D., Gunson, M. R., Mandrake, L., Osterman, G. B., Schwandner, F. M., Sun, K., Taylor, T. E., Wennberg, P. O., and Wunch, D.: The on-orbit performance of the Orbiting Carbon Observatory-2 (OCO-2) instrument and its radiometrically calibrated products, Atmos. Meas. Tech., 10, 59–81, https://doi.org/10.5194/amt-10-59-2017, 2017. a
Crisp, D., Meijer, Y., Munro, R., Bowman, K., Chatterjee, A., Baker, D., Chevallier, F., Nassar, R., Palmer, P. I., Agusti-Panareda, A., Al-Saadi, J., Ariel, Y., Basu, S., Bergamaschi, P., Boesch, H., Bousquet, P., Bovensmann, H., Bréon, F.-M., Brunner, D., Buchwitz, M., Buisson, F., Burrows, J. P., Butz, A., Ciais, P., Clerbaux, C., Counet, P., Crevoisier, C., Crowell, S., DeCola, P. L., Deniel, C., Dowell, M., Eckman, R., Edwards, D., Ehret, G., Eldering, A., Engelen, R., Fisher, B., Germain, S., Hakkarainen, J., Hilsenrath, E., Holmlund, K., Houweling, S., Hu, H., Jacob, D., Janssens-Maenhout, G., Jones, D., Jouglet, D., Kataoka, F., Kiel, M., Kulawik, S. S., Kuze, A., Lachance, R. L., Lang, R., Landgraf, J., Liu, J., Liu, Y., Maksyutov, S., Matsunaga, T., McKeever, J., Moore, B., Nakajima, M., Natraj, V., Nelson, R. R., Niwa, Y., Oda, T., O'Dell, C. W., Ott, L., Patra, P., Pawson, S., Payne, V., Pinty, B., Polavarapu, S. M., Retscher, C., Rosenberg, R., Schuh, A., Schwandner, F., Shiomi, K., Su, W., Tamminen, J., Taylor, T. E., Veefkind, P., Veihelmann, B., Wofsy, S., Worden, J., Wunch, D., Yang, D., Zhang, P., and Zehner, C.: A Constellation Architecture For Monitoring Carbon Dioxide And Methane From Space, technical note, p. 173, available at: http://ceos.org/ourwork/virtual-constellations/acc/, last access: 10 October 2018. a
Detmers, R. and Hasekamp, O.: Product User Guide (PUG) for the RemoTeC XCO2 Full Physics GOSAT Data Product, technical note, p. 14, available at: http://www.esa-ghg-cci.org/?q=webfm_send/292 (last access: 10 October 2018), 2015. a
Deutscher, N. M., Notholt, J., Messerschmidt, J., Weinzierl, C., Warneke, T., Petri, C., Grupe, P., and Katrynski, K.: TCCON data from Bialystok (PL), Release GGG2014.R1, TCCON Data Archive, hosted by CaltechDATA, https://doi.org/10.14291/tccon.ggg2014.bialystok01.R1/1183984, 2015. a
Dubovik, O., Herman, M., Holdak, A., Lapyonok, T., Tanré, D., Deuzé, J., Ducos, F., Sinyuk, A., and Lopatin, A.: Statistically optimized inversion algorithm for enhanced retrieval of aerosol properties from spectral multi-angle polarimetric satellite observations, Atmos. Meas. Tech., 4, 975–1018, https://doi.org/10.5194/amt-4-975-2011, 2011. a
Eldering, A., Taylor, T. E., O'Dell, C. W., and Pavlick, R.: The OCO-3 mission: measurement objectives and expected performance based on 1 year of simulated data, Atmos. Meas. Tech., 12, 2341–2370, https://doi.org/10.5194/amt-12-2341-2019, 2019. a
Farr, T. G., Rosen, P. A., Caro, E., Crippen, R., Duren, R., Hensley, S., Kobrick, M., Paller, M., Rodriguez, E., Roth, L., Seal, D., Shaffer, S., Shimada, J., Umland, J., Werner, M., Oskin, M., Burbank, D., and Alsdorf, D.: The Shuttle Radar Topography Mission, Rev. Geophys., 45, RG2004, https://doi.org/10.1029/2005RG000183, 2007. a
Galli, A., Guerlet, S., Butz, A., Aben, I., Suto, H., Kuze, A., Deutscher, N. M., Notholt, J., Wunch, D., Wennberg, P. O., Griffith, D. W. T., Hasekamp, O., and Landgraf, J.: The impact of spectral resolution on satellite retrieval accuracy of CO2 and CH4, Atmos. Meas. Tech., 7, 1105–1119, https://doi.org/10.5194/amt-7-1105-2014, 2014. a, b, c, d, e
Goo, T.-Y., Oh, Y.-S., and Velazco, V. A.: TCCON data from Anmeyondo (KR), Release GGG2014.R0, TCCON Data Archive, hosted by CaltechDATA, https://doi.org/10.14291/tccon.ggg2014.anmeyondo01.R0/1149284, 2014. a
Griffith, D. W. T., Deutscher, N. M., Velazco, V. A., Wennberg, P. O., Yavin, Y., Keppel-Aleks, G., Washenfelder, R., Toon, G. C., Blavier, J.-F., Paton-Walsh, C., Jones, N. B., Kettlewell, G. C., Connor, B., Macatangay, R. C., Roehl, C., Ryczek, M., Glowacki, J., Culgan, T., and Bryant, G.: TCCON data from Darwin (AU), Release GGG2014.R0, TCCON Data Archive, hosted by CaltechDATA, https://doi.org/10.14291/tccon.ggg2014.darwin01.R0/1149290, 2014a. a
Griffith, D. W. T., Velazco, V. A., Deutscher, N. M., Paton-Walsh, C., Jones, N. B., Wilson, S. R., Macatangay, R. C., Kettlewell, G. C., Buchholz, R. R., and Riggenbach, M.: TCCON data from Wollongong (AU), Release GGG2014.R0, TCCON Data Archive, hosted by CaltechDATA, https://doi.org/10.14291/tccon.ggg2014.wollongong01.R0/1149291, 2014b. a
Guerlet, S., Butz, A., Schepers, D., Basu, S., Hasekamp, O. P., Kuze, A., Yokota, T., Blavier, J.-F., Deutscher, N. M., Griffith, D. W., Hase, F., Kyro, E., Morino, I., Sherlock, V., Sussmann, R., Galli, A., and Aben, I.: Impact of aerosol and thin cirrus on retrieving and validating XCO2 from GOSAT shortwave infrared measurements, J. Geophys. Res.-Atmos., 118, 4887–4905, https://doi.org/10.1002/jgrd.50332, 2013. a, b
Hase, F., Blumenstock, T., Dohe, S., Gross, J., and Kiel, M.: TCCON data from Karlsruhe (DE), Release GGG2014.R1, TCCON Data Archive, hosted by CaltechDATA, https://doi.org/10.14291/tccon.ggg2014.karlsruhe01.R1/1182416, 2015. a
Hasekamp, O. P. and Butz, A.: Efficient calculation of intensity and polarization spectra in vertically inhomogeneous scattering and absorbing atmospheres, J. Geophys. Res.-Atmos., 113, D20309, https://doi.org/10.1029/2008JD010379, 2008. a, b
Hasekamp, O. P. and Landgraf, J.: Linearization of vector radiative transfer with respect to aerosol properties and its use in satellite remote sensing, J. Geophys. Res.-Atmos., 110, D04203, https://doi.org/10.1029/2004JD005260, 2005. a
Hasekamp, O. P., Litvinov, P., and Butz, A.: Aerosol properties over the ocean from PARASOL multiangle photopolarimetric measurements, J. Geophys. Res.-Atmos., 116, D14204, https://doi.org/10.1029/2010JD015469, 2011. a
Houweling, S., Krol, M., Bergamaschi, P., Frankenberg, C., Dlugokencky, E. J., Morino, I., Notholt, J., Sherlock, V., Wunch, D., Beck, V., Gerbig, C., Chen, H., Kort, E. A., Röckmann, T., and Aben, I.: A multi-year methane inversion using SCIAMACHY, accounting for systematic errors using TCCON measurements, Atmos. Chem. Phys., 14, 3991–4012, https://doi.org/10.5194/acp-14-3991-2014, 2014. a
Hu, H., Hasekamp, O., Butz, A., Galli, A., Landgraf, J., Aan de Brugh, J., Borsdorff, T., Scheepmaker, R., and Aben, I.: The operational methane retrieval algorithm for TROPOMI, Atmos. Meas. Tech., 9, 5423–5440, https://doi.org/10.5194/amt-9-5423-2016, 2016. a, b
Hu, H., Landgraf, J., Detmers, R., Borsdorff, T., Aan de Brugh, J., Aben, I., Butz, A., and Hasekamp, O.: Toward Global Mapping of Methane With TROPOMI: First Results and Intersatellite Comparison to GOSAT, Geophys. Res. Lett., 45, 3682–3689, https://doi.org/10.1002/2018GL077259, 2018. a
Iraci, L. T., Podolske, J., Hillyard, P. W., Roehl, C., Wennberg, P. O., Blavier, J.-F., Allen, N., Wunch, D., Osterman, G., and Albertson, R.: TCCON data from Edwards (US), Release GGG2014.R1, TCCON Data Archive, hosted by CaltechDATA, https://doi.org/10.14291/tccon.ggg2014.edwards01.R1/1255068, 2016. a
Kawakami, S., Ohyama, H., Arai, K., Okumura, H., Taura, C., Fukamachi, T., and Sakashita, M.: TCCON data from Saga (JP), Release GGG2014.R0, TCCON Data Archive, hosted by CaltechDATA, https://doi.org/10.14291/tccon.ggg2014.saga01.R0/1149283, 2014. a
Kivi, R., Heikkinen, P., and Kyrö, E.: TCCON data from Sodankylä (FI), Release GGG2014.R0, TCCON Data Archive, hosted by CaltechDATA, https://doi.org/10.14291/tccon.ggg2014.sodankyla01.R0/1149280, 2014. a
Kuze, A., Suto, H., Nakajima, M., and Hamazaki, T.: Thermal and near infrared sensor for carbon observation Fourier-transform spectrometer on the Greenhouse Gases Observing Satellite for greenhouse gases monitoring, Appl. Optics, 48, 6716–6733, https://doi.org/10.1364/AO.48.006716, 2009. a
Kuze, A., Suto, H., Shiomi, K., Kawakami, S., Tanaka, M., Ueda, Y., Deguchi, A., Yoshida, J., Yamamoto, Y., Kataoka, F., Taylor, T. E., and Buijs, H. L.: Update on GOSAT TANSO-FTS performance, operations, and data products after more than 6 years in space, Atmos. Meas. Tech., 9, 2445–2461, https://doi.org/10.5194/amt-9-2445-2016, 2016. a
Landgraf, J., Hasekamp, O. P., Box, M. A., and Trautmann, T.: A linearized radiative transfer model for ozone profile retrieval using the analytical forward-adjoint perturbation theory approach, J. Geophys. Res.-Atmos., 106, 27291–27305, https://doi.org/10.1029/2001JD000636, 2001. a
Mandrake, L., O'Dell, C., Wunch, D., Wennberg, P., Fisher, B., Osterman, G., and Eldering, A.: Orbiting Carbon Observatory-2 (OCO-2) Warn Level, Bias Correction, and Lite File Product Description, Tech. rep., Tech. rep., Jet Propulsion Laboratory, California Institute of Technology, Pasasdena, available at: http://disc.sci.gsfc.nasa.gov/OCO-2/documentation/oco-2-v7/OCO2_XCO2_Lite_Files_and_Bias_Correction_0915_sm.pdf, last access: 16 October 2015. a
Mishchenko, M. I. and Travis, L. D.: Satellite retrieval of aerosol properties over the ocean using polarization as well as intensity of reflected sunlight, J. Geophys. Res.-Atmos., 102, 16989–17013, 1997. a
Morino, I., Matsuzaki, T., and Horikawa, M.: TCCON data from Tsukuba (JP), 125HR, Release GGG2014.R1, TCCON Data Archive, hosted by CaltechDATA, https://doi.org/10.14291/tccon.ggg2014.tsukuba02.R1/1241486, 2016a. a
Morino, I., Yokozeki, N., Matsuzaki, T., and Horikawa, M.: TCCON data from Rikubetsu (JP), Release GGG2014.R1, TCCON Data Archive, hosted by CaltechDATA, https://doi.org/10.14291/tccon.ggg2014.rikubetsu01.R1/1242265, 2016b. a
Nassar, R., Hill, T. G., McLinden, C. A., Wunch, D., Jones, D. B. A., and Crisp, D.: Quantifying CO2 Emissions From Individual Power Plants From Space, Geophys. Res. Lett., 44, 10045–10053, https://doi.org/10.1002/2017GL074702, 2017. a, b, c
Notholt, J., Petri, C., Warneke, T., Deutscher, N. M., Buschmann, M., Weinzierl, C., Macatangay, R. C., and Grupe, P.: TCCON data from Bremen (DE), Release GGG2014.R0, TCCON Data Archive, hosted by CaltechDATA, https://doi.org/10.14291/tccon.ggg2014.bremen01.R0/1149275, 2014. a
OCO-2 Science Team: OCO-2 Level 1B calibrated, geolocated science spectra, Retrospective Processing V8r, Goddard Earth Sciences Data and Information Services Center (GES DISC), Greenbelt, MD, USA, https://doi.org/10.5067/1RJW1YMLW2F0, 2017. a
O'Dell, C. W., Connor, B., Bösch, H., O'Brien, D., Frankenberg, C., Castano, R., Christi, M., Eldering, D., Fisher, B., Gunson, M., McDuffie, J., Miller, C. E., Natraj, V., Oyafuso, F., Polonsky, I., Smyth, M., Taylor, T., Toon, G. C., Wennberg, P. O., and Wunch, D.: The ACOS CO2 retrieval algorithm – Part 1: Description and validation against synthetic observations, Atmos. Meas. Tech., 5, 99–121, https://doi.org/10.5194/amt-5-99-2012, 2012. a
Pascal, V., Buil, C., Loesel, J., Tauziede, L., Jouglet, D., and Buisson, F.: An improved microcarb dispersive instrumental concept for the measurement of greenhouse gases concentration in the atmosphere, International Conference on Space Optics – ICSO 2014, 10563, https://doi.org/10.1117/12.2304219, 2017. a
Peters, W., Jacobson, A. R., Sweeney, C., Andrews, A. E., Conway, T. J., Masarie, K., Miller, J. B., Bruhwiler, L. M. P., Pétron, G., Hirsch, A. I., Worthy, D. E. J., van der Werf, G. R., Randerson, J. T., Wennberg, P. O., Krol, M. C., and Tans, P. P.: An atmospheric perspective on North American carbon dioxide exchange: CarbonTracker, P. Natl. Acad. Sci. USA, 104, 18925–18930, https://doi.org/10.1073/pnas.0708986104, 2007. a
Schepers, D., Guerlet, S., Butz, A., Landgraf, J., Frankenberg, C., Hasekamp, O., Blavier, J., Deutscher, N. M., Griffith, D. W. T., Hase, F., Kyro, E., Morino, I., Sherlock, V., Sussmann, R., and Aben, I.: Methane retrievals from Greenhouse Gases Observing Satellite (GOSAT) shortwave infrared measurements: Performance comparison of proxy and physics retrieval algorithms, J. Geophys. Res.-Atmos., 117, D10307, https://doi.org/10.1029/2012JD017549, 2012. a, b, c
Schepers, D., aan de Brugh, J., Hahne, P., Butz, A., Hasekamp, O., and Landgraf, J.: LINTRAN v2. 0: A linearised vector radiative transfer model for efficient simulation of satellite-born nadir-viewing reflection measurements of cloudy atmospheres, J. Quant. Spectrosc. Ra., 149, 347–359, 2014. a
Sherlock, V., Connor, B., Robinson, J., Shiona, H., Smale, D., and Pollard, D.: TCCON data from Lauder (NZ), 125HR, Release GGG2014.R0, TCCON Data Archive, hosted by CaltechDATA, https://doi.org/10.14291/tccon.ggg2014.lauder02.R0/1149298, 2014. a
Sierk, B., Löscher, A., Caron, J., Beźy, J.-L., and Meijer, Y.: CarbonSat instrument pre- developments: Towards monitoring carbon dioxide and methane concentrations from space, International Conference on Space Optics, SPIE, 675–683, https://doi.org/10.1117/12.2296198, 2016. a
Sierk, B., Beźy, J.-L., Löscher, A., and Meijer, Y.: The European CO2 Monitoring Mission: Observing anthropogenic greenhouse gas emissions from space, International Conference on Space Optics, SPIE, 237–250, https://doi.org/10.1117/12.2535941, 2018. a, b, c
Taylor, T. E., O'Dell, C. W., Frankenberg, C., Partain, P. T., Cronk, H. Q., Savtchenko, A., Nelson, R. R., Rosenthal, E. J., Chang, A. Y., Fisher, B., Osterman, G. B., Pollock, R. H., Crisp, D., Eldering, A., and Gunson, M. R.: Orbiting Carbon Observatory-2 (OCO-2) cloud screening algorithms: validation against collocated MODIS and CALIOP data, Atmos. Meas. Tech., 9, 973–989, https://doi.org/10.5194/amt-9-973-2016, 2016. a
The Total Carbon Column Observing Network (TCCON): The Total Carbon Column Observing Network Data Archive California Institute of Technology, USA, available at: https://tccondata.org/, last access: 19 November 2019. a
Te, Y., Jeseck, P., and Janssen, C.: TCCON data from Paris (FR), Release GGG2014.R0, TCCON Data Archive, hosted by CaltechDATA, https://doi.org/10.14291/tccon.ggg2014.paris01.R0/1149279, 2014. a
Tran, H. and Hartmann, J.-M.: An improved O2 A band absorption model and its consequences for retrievals of photon paths and surface pressures, J. Geophys. Res.-Atmos., 113, D18104, https://doi.org/10.1029/2008JD010011, 2008. a
Waquet, F., Cairns, B., Knobelspiesse, K., Chowdhary, J., Travis, L. D., Schmid, B., and Mishchenko, M.: Polarimetric remote sensing of aerosols over land, J. Geophys. Res.-Atmos., 114, D01206, 2009. a
Warneke, T., Messerschmidt, J., Notholt, J., Weinzierl, C., Deutscher, N. M., Petri, C., Grupe, P., Vuillemin, C., Truong, F., Schmidt, M., Ramonet, M., and Parmentier, E.: TCCON data from Orléans (FR), Release GGG2014.R0, TCCON Data Archive, hosted by CaltechDATA, https://doi.org/10.14291/tccon.ggg2014.orleans01.R0/1149276, 2014. a
Wennberg, P. O., Roehl, C., Wunch, D., Toon, G. C., Blavier, J.-F., Washenfelder, R., Keppel-Aleks, G., Allen, N., and Ayers, J.: TCCON data from Park Falls (US), Release GGG2014.R0, TCCON Data Archive, hosted by CaltechDATA, https://doi.org/10.14291/tccon.ggg2014.parkfalls01.R0/1149161, 2014. a
Wennberg, P. O., Wunch, D., Roehl, C., Blavier, J.-F., Toon, G. C., and Allen, N.: TCCON data from Lamont (US), Release GGG2014.R1, TCCON Data Archive, hosted by CaltechDATA, https://doi.org/10.14291/tccon.ggg2014.lamont01.R1/1255070, 2016. a
Wu, L., Hasekamp, O., van Diedenhoven, B., Cairns, B., Yorks, J. E., and Chowdhary, J.: Passive remote sensing of aerosol layer height using near-UV multiangle polarization measurements, Geophys. Res. Lett., 43, 8783–8790, https://doi.org/10.1002/2016GL069848, 2016. a
Wu, L., Hasekamp, O., Hu, H., Landgraf, J., Butz, A., aan de Brugh, J., Aben, I., Pollard, D. F., Griffith, D. W. T., Feist, D. G., Koshelev, D., Hase, F., Toon, G. C., Ohyama, H., Morino, I., Notholt, J., Shiomi, K., Iraci, L., Schneider, M., de Mazière, M., Sussmann, R., Kivi, R., Warneke, T., Goo, T.-Y., and Té, Y.: Carbon dioxide retrieval from OCO-2 satellite observations using the RemoTeC algorithm and validation with TCCON measurements, Atmos. Meas. Tech., 11, 3111–3130, https://doi.org/10.5194/amt-11-3111-2018, 2018. a, b, c, d, e, f, g
Wunch, D., Wennberg, P. O., Toon, G. C., Connor, B. J., Fisher, B., Osterman, G. B., Frankenberg, C., Mandrake, L., O'Dell, C., Ahonen, P., Biraud, S. C., Castano, R., Cressie, N., Crisp, D., Deutscher, N. M., Eldering, A., Fisher, M. L., Griffith, D. W. T., Gunson, M., Heikkinen, P., Keppel-Aleks, G., Kyrö, E., Lindenmaier, R., Macatangay, R., Mendonca, J., Messerschmidt, J., Miller, C. E., Morino, I., Notholt, J., Oyafuso, F. A., Rettinger, M., Robinson, J., Roehl, C. M., Salawitch, R. J., Sherlock, V., Strong, K., Sussmann, R., Tanaka, T., Thompson, D. R., Uchino, O., Warneke, T., and Wofsy, S. C.: A method for evaluating bias in global measurements of CO2 total columns from space, Atmos. Chem. Phys., 11, 12317–12337, https://doi.org/10.5194/acp-11-12317-2011, 2011. a
Yokota, T., Yoshida, Y., Eguchi, N., Ota, Y., Tanaka, T., Watanabe, H., and Maksyutov, S.: Global concentrations of CO2 and CH4 retrieved from GOSAT: First preliminary results, Sola, 5, 160–163, 2009. a