the Creative Commons Attribution 4.0 License.
the Creative Commons Attribution 4.0 License.
 | 13 Feb 2020
Spectral sizing of a coarse-spectral-resolution satellite sensor for XCO2
Jonas Simon Wilzewski
Anke Roiger
Johan Strandgren
Jochen Landgraf
Dietrich G. Feist
Voltaire A. Velazco
Nicholas M. Deutscher
Isamu Morino
Hirofumi Ohyama
Rigel Kivi
Thorsten Warneke
Justus Notholt
Manvendra Dubey
Ralf Sussmann
Markus Rettinger
Frank Hase
Kei Shiomi
André Butz
Verifying anthropogenic carbon dioxide (CO2) emissions globally is essential to inform about the progress of institutional efforts to mitigate anthropogenic climate forcing. To monitor localized emission sources, spectroscopic satellite sensors have been proposed that operate on the CO2 absorption bands in the shortwave-infrared (SWIR) spectral range with ground resolution as fine as a few tens of meters to about a hundred meters. When designing such sensors, fine ground resolution requires a trade-off towards coarse spectral resolution in order to achieve sufficient noise performance. Since fine ground resolution also implies limited ground coverage, such sensors are envisioned to fly in fleets of satellites, requiring low-cost and simple design, e.g., by restricting the spectrometer to a single spectral band.
Here, we use measurements of the Greenhouse Gases Observing Satellite (GOSAT) to evaluate the spectral resolution and spectral band selection of a prospective satellite sensor with fine ground resolution. To this end, we degrade GOSAT SWIR spectra of the CO2 bands at 1.6 (SWIR-1) and 2.0 µm (SWIR-2) to coarse spectral resolution, without a further addition of noise, and we evaluate single-band retrievals of the column-averaged dry-air mole fractions of CO2 (XCO2) by comparison to ground truth provided by the Total Carbon Column Observing Network (TCCON) and by comparison to global “native” GOSAT retrievals with native spectral resolution and spectral band selection. Coarsening spectral resolution from GOSAT's native resolving power of >20 000 to the range of 700 to a few thousand makes the scatter of differences between the SWIR-1 and SWIR-2 retrievals and TCCON increase moderately. For resolving powers of 1200 (SWIR-1) and 1600 (SWIR-2), the scatter increases from 2.4 (native) to 3.0 ppm for SWIR-1 and 3.3 ppm for SWIR-2. Coarser spectral resolution yields only marginally worse performance than the native GOSAT configuration in terms of station-to-station variability and geophysical parameter correlations for the GOSAT–TCCON differences. Comparing the SWIR-1 and SWIR-2 configurations to native GOSAT retrievals on the global scale, however, reveals that the coarse-resolution SWIR-1 and SWIR-2 configurations suffer from some spurious correlations with geophysical parameters that characterize the light-scattering properties of the scene such as particle amount, size, height and surface albedo. Overall, the SWIR-1 and SWIR-2 configurations with resolving powers of 1200 and 1600 show promising performance for future sensor design in terms of random error sources while residual errors induced by light scattering along the light path need to be investigated further. Due to the stronger CO2 absorption bands in SWIR-2 than in SWIR-1, the former has the advantage that measurement noise propagates less into the retrieved XCO2 and that some retrieval information on particle scattering properties is accessible.
- Article
(4854 KB) - Full-text XML
-
Supplement
(96 KB) - BibTeX
- EndNote


Accurate and spatiotemporally densely resolved information on localized carbon dioxide (CO2) emission sources such as power plants is crucial to inform about CO2 emission reduction targets that national, regional and municipal administrations worldwide have committed to through their climate action plans. Satellite remote sensing of the column-averaged dry-air mole fractions of CO2 (XCO2) could contribute to providing such crucial information if satellite design succeeds in combining fine ground resolution with sufficient precision and if satellite concepts are simple enough to allow for a fleet of sensors enabling broad coverage of the globe.
Global XCO2 concentration measurements from space were pioneered by the SCanning Imaging Absorption SpectroMeter for Atmospheric CHartographY mission, SCIAMACHY (e.g., Burrows et al., 1995; Reuter et al., 2010; Schneising et al., 2013), with ground resolution of ∼60 km × 30 km (Bovensmann et al., 1999). Finer ground resolution (with sparse sampling, though) was subsequently achieved by the Greenhouse Gases Observing Satellite (GOSAT, 10.5 km diameter ground footprint) (Kuze et al., 2009, 2016) and the Orbiting Carbon Observatory (OCO-2, 1.3 km × 2.3 km ground footprint) (Crisp et al., 2008, 2017). The Chinese TanSat mission has also embarked on this strategy (Yang et al., 2018). GOSAT and OCO-2 offer insights into the natural processes of the carbon cycle (Guerlet et al., 2013a; Parazoo et al., 2013; Liu et al., 2017; Chatterjee et al., 2017) as well as into anthropogenic emission patterns (Hakkarainen et al., 2016). Urban carbon dioxide signals have been detected by these instruments, for example in the Los Angeles basin (Kort et al., 2012; Eldering et al., 2017; Schwandner et al., 2017). Nassar et al. (2017) have demonstrated the ability of OCO-2 to observe anthropogenic CO2 emissions from individual, coal-fired power plants, showcasing the added value of imaging information. A similar concept has been put forward by the CarbonSat mission (Bovensmann et al., 2010), which has evolved into a candidate for a future European carbon monitoring mission (e.g., Pillai et al., 2016; Broquet et al., 2018; Reuter et al., 2019). The CO2M mission currently under investigation at the European Space Agency aims at ground resolution of 4 km2 (Sierk et al., 2019; Wu et al., 2019a). All these satellite missions and concepts rely on a multi-band spectral configuration that covers the oxygen (O2) A-band at roughly 0.76 µm (NIR) and the CO2 bands at 1.6 (SWIR-1) and 2.0 µm (SWIR-2). The spectral resolution ranges from resolving powers (with λ the wavelength and Δλ the full width half maximum of the instrument spectral response function) for GOSAT, OCO-2, and TanSat to for CO2M's SWIR-2 band and for CarbonSat's SWIR-2 band. The typical XCO2 native GOSAT retrievals attempt to make use of these bands by retrieving XCO2 simultaneously with atmospheric scattering properties.
For methane (CH4), which poses similar remote sensing challenges as CO2, it has been demonstrated that a satellite spectrometer operating at coarse spectral resolution ( of a few hundred) on a single absorption band (around 2.35 µm) can achieve successful CH4 hot-spot detection with a ground resolution of 30 m (Thompson et al., 2016). Similar results for CH4 have been reported from aircraft sensors that reach ground pixel sizes on the order of 1–10 m (Dennison et al., 2013; Thorpe et al., 2016a, b; Krings et al., 2018). Dennison et al. (2013) suggested that measuring the 2.0 µm CO2 bands with a spectral resolution of 10 nm () enables a spaceborne spectrometer design that results in ground resolutions as fine as 60 m × 60 m. Thorpe et al. (2016a) have shown that their airborne AVIRIS-NG instrument exploiting the CO2 absorption bands at 2.0 µm at a spectral resolution of roughly 5 nm () enables quantitative retrievals of CO2 in localized emission plumes. Thorpe et al. (2016b) suggested that, for CH4, a spectrometer design with a spectral resolution of 1 nm () could provide an optimal trade-off that allows for accurate CH4 quantification while supporting small ground pixels.

Figure 1Schematic Gaussian plume of the XCO2 enhancement (ΔXCO2) originating from a power plant with a 12.3 Mt CO2 yr−1 emission rate (wind from left to right, Gifford–Pasquill stability class C; power plant at the origin; satellite assumed to move from bottom to top, sampling left to right) as seen (without noise) by hypothetical satellite spectrometers with 2 km × 2 km ground pixels (a) and with 50 m × 50 m ground pixels (b). Insets show ΔXCO2 measured by the sensors at 2 km (red) and 8 km (black) downwind of the source along the plume cross section (note different ΔXCO2 scales in insets).
This study is motivated by the margins that coarse spectral resolution offers with respect to improving ground resolution and that single-band configurations offer with respect to deploying a fleet of several low-cost satellites. Figure 1 schematically illustrates the key advantage of an assumed 50 m × 50 m ground resolution spectrometer over an instrument with kilometer-scale resolution for point-source observation. If the localized source plume does not fill the satellite's entire ground pixel, the XCO2 enhancement averages with the background concentration field over the satellite pixel. For the example in Fig. 1, this leads to a maximum of 3 ppm enhancement for a satellite sensor with 2 km × 2 km ground resolution. Shrinking the ground pixels leads to larger enhancements in the vicinity of the source, simply because the plume fills a larger portion of the (smaller) pixels. In Fig. 1, 50 m × 50 m ground resolution delivers 12 ppm enhancement at a 2 km downwind distance, plus a sampling of the plume cross section by more than 10 pixels. Further downwind, where the plume has laterally spread to the kilometer-scale, enhancements per pixel are similar for fine and coarse ground resolution, but the fine-ground-resolution sensor would still sample the plume by multiple ground pixels. Thus, a sensor with fine ground resolution allows for less stringent precision requirements (per ground pixel), and it could potentially resolve plume shapes at some detail. Since small ground pixels imply fewer backscattered photons, sensor design for fine ground resolution typically needs to compensate by enhancing light throughput of the spectrometer and by collecting more photons in the spectral domain, e.g., by coarsening spectral resolution. Since finer ground resolution implies narrower ground coverage for the same detector size, global monitoring with fine ground resolution almost certainly implies the need for a fleet of sensors which would be easier to realize if the sensors had a simple, single-band configuration instead of full spectral coverage from the NIR into SWIR-2.
Here, we aim at evaluating the performance of a hypothetical XCO2 sensor that has coarse spectral resolution in a single-band configuration. That is, we evaluate a sensor concept which measures the CO2 bands near either 1.6 (SWIR-1) or 2.0 µm (SWIR-2) with resolving power in the range of 700 to a few thousand, i.e., roughly between the AVIRIS-NG and CarbonSat concepts. Galli et al. (2014) conducted a related study where they spectrally degraded GOSAT soundings to resolutions ranging from native GOSAT resolution down to while leaving the multi-band configuration (NIR, SWIR-1, SWIR-2) of the XCO2 retrievals untouched. They found that coarser spectral resolution typically implies larger statistical and systematic XCO2 errors when compared to ground truth. Galli et al. (2014), however, did not address the range of resolving powers and the single-band selection covered here. Recently, Wu et al. (2019b) showed that at OCO's native resolving power of >20 000 a single-band retrieval configuration results in almost unchanged XCO2 retrieval accuracy and precision.
Section 2 explains our methodological approach that spectrally degrades GOSAT measurements of the SWIR-1 or SWIR-2 bands to coarser spectral resolution. In Sect. 3, we assess retrieval performance for the SWIR-1 and SWIR-2 configurations for various resolving powers by comparing our results to ground truth from the Total Carbon Column Observing Network (TCCON). Thereby, we derive a target spectral resolution for which we carry out a global evaluation with respect to native GOSAT measurements in Sect. 4. Section 5 discusses and concludes on the findings.
GOSAT measures spectra of backscattered solar radiation in three spectral bands centered on the O2 A-band (NIR), the relatively weak CO2 and CH4 bands in the vicinity of 1.6 µm (SWIR-1), and the strong CO2 and water vapor (H2O) bands around 2.0 µm (SWIR-2). GOSAT's thermal infrared band recording telluric emission spectra is not used here. We use the level 1B (L1B) data version 201.202, and we add the two measured polarization directions to represent the backscattered radiances. Due to computational costs, we restrict our analysis to cloud-free, quality-screened soundings over land as identified by the native GOSAT retrievals of the RemoTeC algorithm (Butz et al., 2011) within the Climate Change Initiative of the European Space Agency (ESA) (Buchwitz et al., 2017), available for download at: http://www.esa-ghg-cci.org (last access: 14 December 2018). In total, the set comprises 469 689 L1B spectra in the period from 1 April 2009 to 31 December 2016. A typical GOSAT spectrum together with the coarse-resolution variants discussed below are shown in Fig. 2.
A key advantage of GOSAT measurements over other CO2 missions, such as OCO-2, is the wide spectral coverage in SWIR-1 and SWIR-2. The broad spectral coverage allows for conveniently sizing the retrieval windows without being limited by the actual bandpass of the spectrometer. In particular, GOSAT's SWIR-1 and SWIR-2 bands cover, respectively, two and three rotational–vibrational absorption bands of CO2. In order to mimic a coarse-resolution sensor, we convolve the native GOSAT L1B spectra by a Gaussian function of selectable full width at half maximum (FWHM). Since we want to isolate the effects of spectral resolution and spectral band selection, we do not add extra noise to the convolved spectra; i.e., the level of noise is determined by the convolution of the noise of the native GOSAT spectra with the coarse-resolution Gaussian line shape function. One would expect extra noise when going to smaller ground pixels as we envision for a future sensor. Estimating the extra noise, however, would require a detailed instrument model which is not available here. Our approach essentially relates to conditions under which the detector noise is negligible as typical for GOSAT. Under such conditions, other sources of error can be addressed, for example, through evaluating geophysical parameter correlations (Sects. 3 and 4). A forthcoming study will discuss noise performance and retrieval simulations for a hypothetical instrument design. Figure 2 illustrates the spectral convolution approach for a hypothetical spectral resolving power of 1200 (blue line) and 1600 (red line) in SWIR-1 and SWIR-2, respectively, in comparison to native GOSAT spectra. We assume that the proposed sensor will have a detector with 256 spectral pixels.
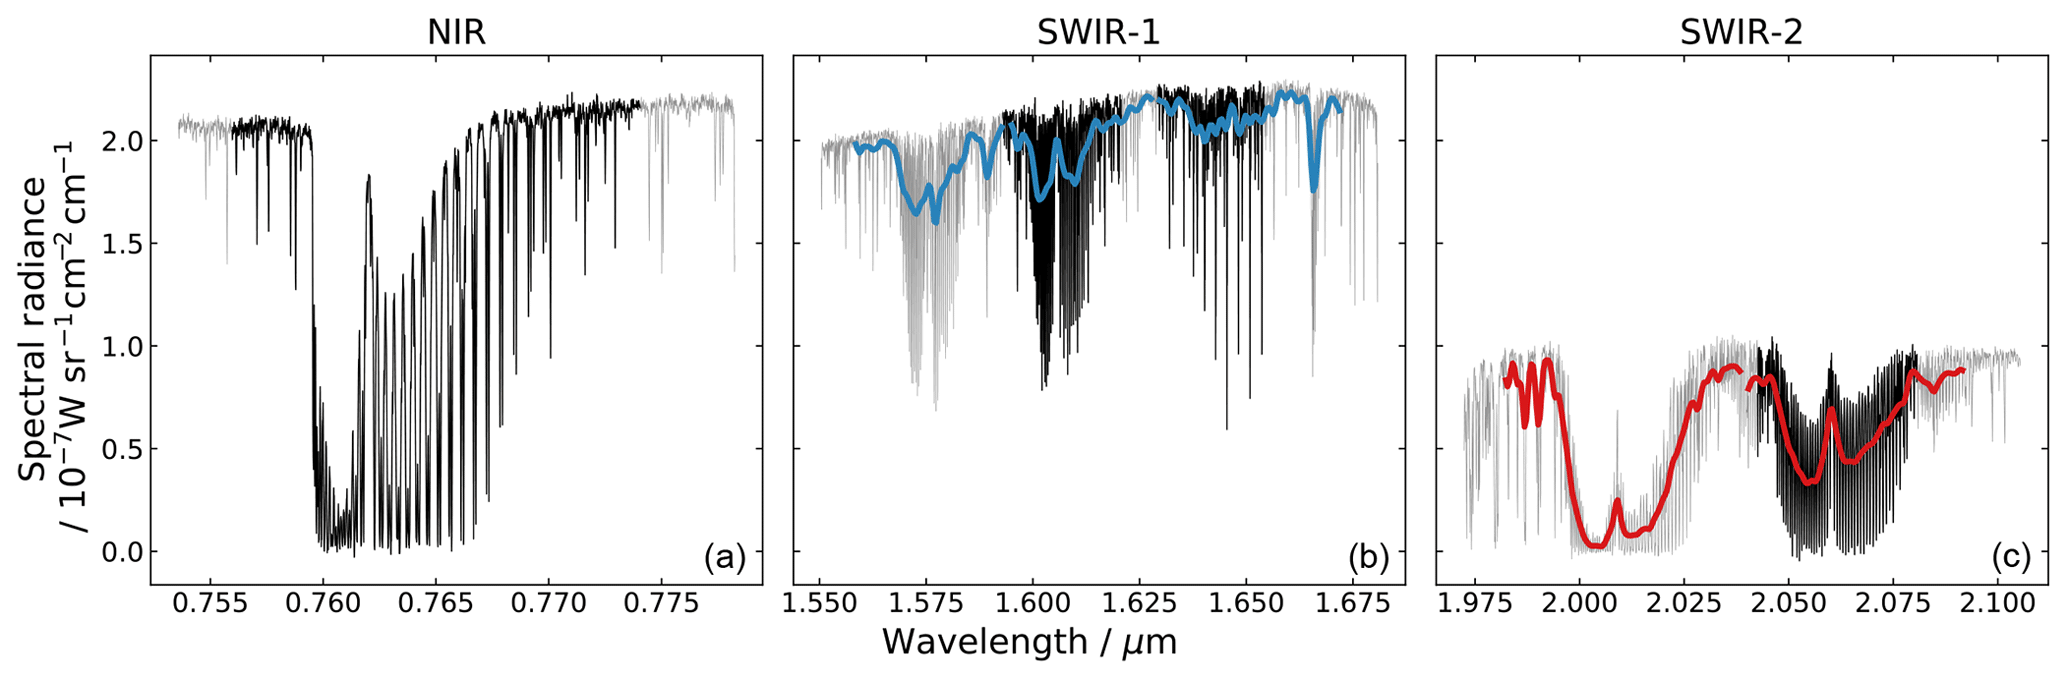
Figure 2Measured GOSAT spectrum of the backscattered radiance in the NIR, SWIR-1 and SWIR-2 (a–c) ranges shown in grey with respective GOSAT retrieval windows in bold black. The spectrally degraded measurements at resolving powers of ∼1200 (SWIR-1) and ∼1600 (SWIR-2) are shown in bold blue and bold red, respectively.
The native and degraded GOSAT measurements are submitted to the RemoTeC retrieval algorithm (Butz et al., 2009, 2011; Guerlet et al., 2013b), which is in routine use for retrieving XCO2 (and XCH4 – throughout this work Xmolecule refers to the column-averaged dry-air mole fraction of a molecule) from GOSAT (Buchwitz et al., 2017), XCO2 from OCO-2 (Wu et al., 2018) and XCH4 from Sentinel-5 Precursor TROPOMI (Hu et al., 2018). For GOSAT measurements with native spectral resolution, we deploy RemoTeC in its full-physics (native GOSAT) mode; i.e., RemoTeC uses four spectral windows within the NIR, SWIR-1 and SWIR-2 ranges (see Table 1 and Fig. 2) and retrieves XCO2, XCH4 together with three particle scattering parameters, and other parameters such as surface albedo and spectral shifts. The three particle parameters are the total column number density Npar, the center height zpar of a Gaussian height distribution and the power αpar of a power-law size distribution with particle radius r. The native GOSAT configuration is equivalent to the standard retrieval also in operation for ESA's climate change initiative (e.g., Buchwitz et al., 2017).
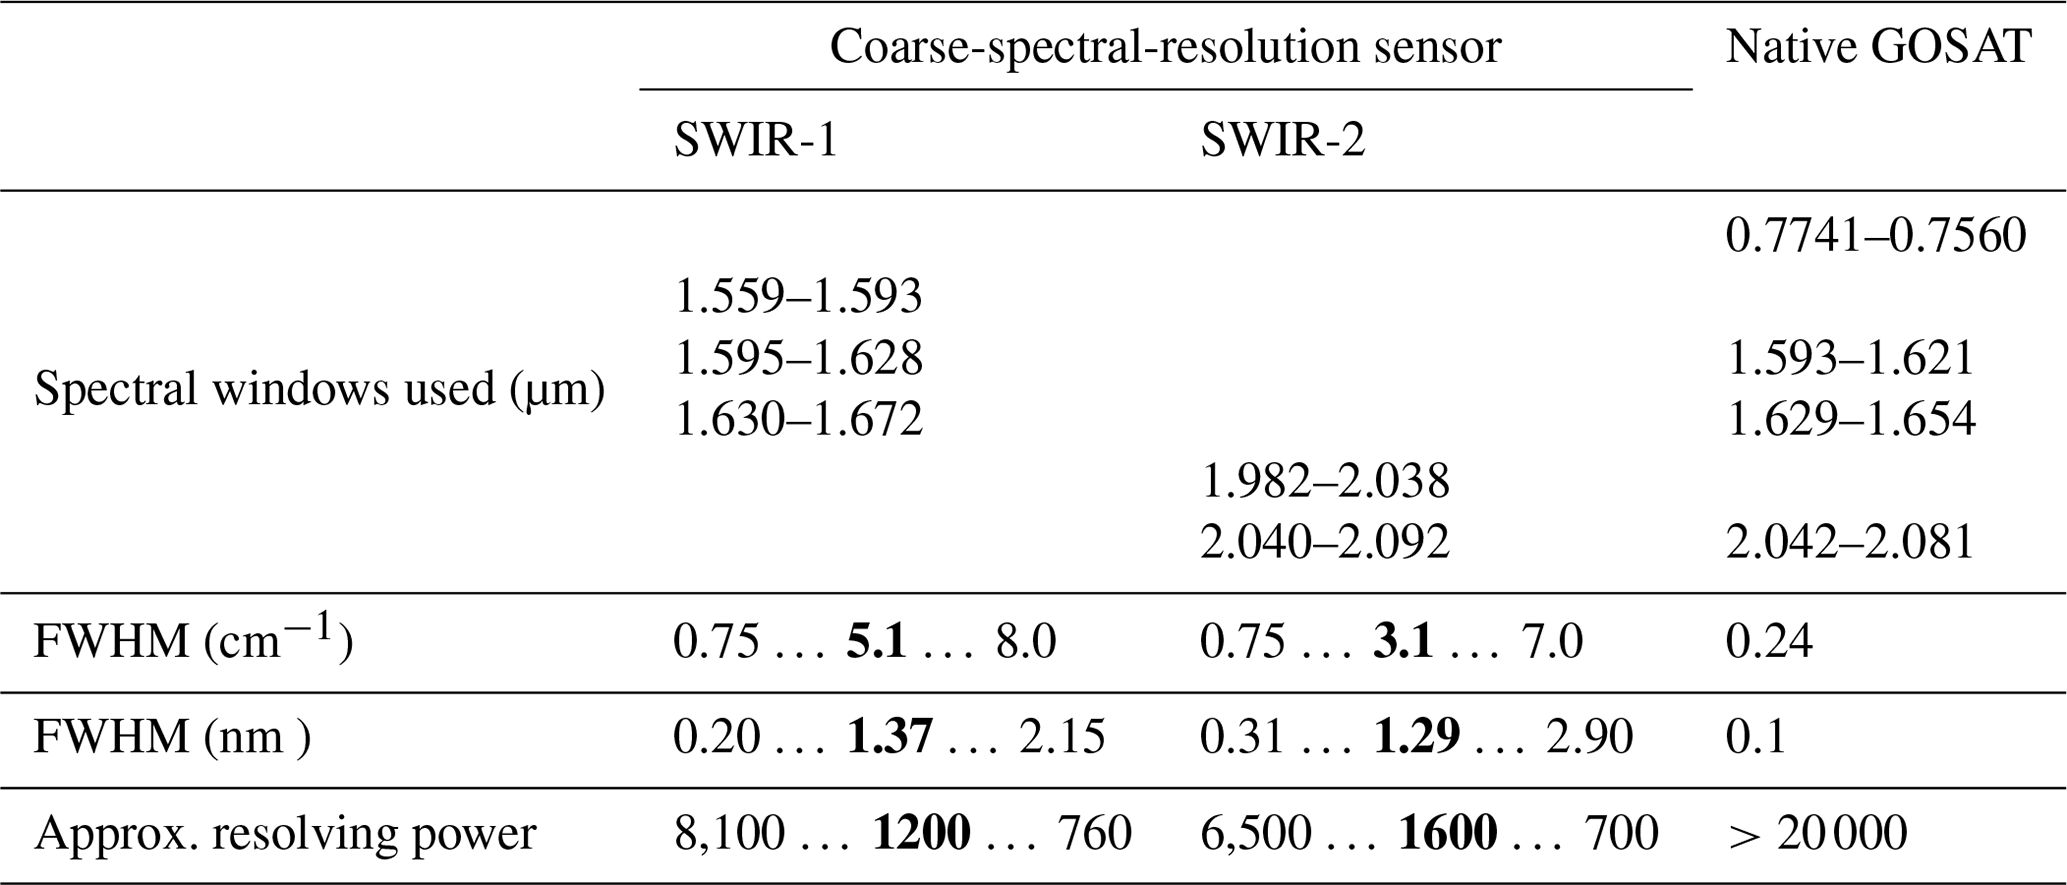
Table 1Spectral windows for the various retrieval configurations. Bold numbers indicate the spectral resolution that was chosen for subsequent analyses (see Sect. 3).
For degraded spectral resolution, we use either SWIR-1 or SWIR-2 alone (see Table 1), from which we retrieve XCO2 (as well as XCH4 in SWIR-1) and auxiliary surface albedo and spectral shift parameters. The spectral degradation of the modeled spectra to coarse resolution follows the same approach as for the measurements. First, RemoTeC calculates spectra for GOSAT's native spectral resolution; then the convolution with a Gaussian function simulates the hypothetical measurements at coarse spectral resolution. For degraded spectral resolution, the SWIR-1 retrievals also adjust XH2O and XCH4, but neglect scattering by particles (Rayleigh scattering is included) and thus no particle scattering parameters are retrieved. This approach, which is essentially a transmittance calculation along the geometric light path, is hereafter referred to as non-scattering retrieval. Sensitivity studies have shown that retrieving atmospheric scattering parameters from the individual CO2 bands at coarse spectral resolution in the SWIR-1 band suffers from low information content and results in worse XCO2 retrieval performance than under the non-scattering assumption. In the SWIR-2, we retrieve XH2O along with XCO2. Employing the standard RemoTeC Phillips–Tikhonov (e.g., Butz et al., 2012) regularization, we additionally retrieve our standard three particle parameters from SWIR-2. We found a regularization strength that allows for retrieving an average of 0.38 degrees of freedom (DFS) for particles (DFS ⪆1.5 are typically found in native GOSAT retrievals). Despite this low DFS, the performance of the retrieval was significantly improved in comparison to a non-scattering retrieval. As the spectral resolution coarsens, the average degrees of freedom for particles decrease from 0.45 (at 6500 resolving power) to 0.32 (at 700 resolving power). Although variations in DFS may lead to changes in the ability of the retrieval algorithm to converge towards the minimum of the cost function, more than 75 % of all retrievals converge at any given FWHM that we consider in this study. We note that while we divide the SWIR-1 and SWIR-2 retrievals into several sub-windows, the retrieved XCO2 is coupled among the sub-windows.
The actual spectral retrieval windows are defined in Table 1 and illustrated in Fig. 2. The spectral boundaries of the retrieval windows are identical at all selected FWHM values. For the coarse-spectral-resolution SWIR setups, we have chosen to cover two CO2 absorption bands each, while the native GOSAT retrievals cover only one of the bands in SWIR-1 and one of the bands in SWIR-2. Our choice of spectral retrieval windows maximizes the information on CO2 for the coarse-resolution retrievals. However, a fine-tuning of the spectral windows for the proposed sensor may be conducted in a future study with an instrument noise model at hand. For native GOSAT resolution, the two extra bands would provide mostly redundant information while adding significant computational cost. Further, the coarse-spectral-resolution configurations cover (almost) transparent ranges in the vicinity of the absorption bands in order to constrain surface albedo, even at coarse spectral resolution. If the spectral boundaries of the retrieval windows lie within the CO2 absorption bands, i.e., parts of the CO2 absorption bands are cut off, this loss of information generally leads to poorer retrieval performance with respect to TCCON (not shown here).
For both native GOSAT and degraded SWIR configurations, air mass information is derived from ECMWF surface pressure reanalyses (ERA-Interim) and topographic data from the Shuttle Radar Tomography Mission (SRTM). For each sounding, we use ECMWF and SRTM data to calculate the ground-pixel average surface pressure and the corresponding dry air mass. This is the standard operation procedure for RemoTeC trace gas retrievals from the GOSAT, OCO-2 and TROPOMI satellite instruments. Errors in the calculation of the air mass can be caused by erroneous satellite pointing; these errors are part of the overall errors reported for the TCCON validation sites (Sect. 3).
Butz et al. (2013) have shown that the CO2 absorption cross sections used in RemoTeC for the SWIR-1 bands and the CO2 band centered at 2.06 µm in SWIR-2 are consistent to within 0.16 %, while the band centered at 2.01 µm in SWIR-2 is inconsistent with its neighboring SWIR-2 band. Since Butz et al. (2013) used a shorter measurement period than here, we repeat that study for our period, and we determine a scaling factor for the absorption cross sections at 2.01 µm with respect to the 2.06 µm band. To this end, we select ocean-glint scenes that are confidently free of cloud and aerosol using the upper-edge method (Butz et al., 2013). Then, we run RemoTeC retrievals on the 2.01 and the 2.06 µm bands separately under the non-scattering assumption. The average ratio of the retrieved XCO2 is our scaling factor, which amounts to 0.981 at native GOSAT spectral resolution (i.e., cross sections of the 2.01 µm band need to be scaled by 0.981). The “upper-edge” method is also used to adjust the scaling factor at each spectral degradation to reflect the impact of the convolution procedure on the low-resolution spectra. The updated factors differ on the sub-per mill level from the correction at native spectral resolution.
As detailed in Sect. 2, we run XCO2 retrievals for the native GOSAT configuration, and for the coarse-spectral-resolution SWIR configurations on a global set of cloud-free GOSAT measurements. The SWIR-1 and SWIR-2 configurations are run for various spectral resolutions, i.e., for various values of the FWHM of the Gaussian function that convolves the native GOSAT spectra. The native GOSAT configuration serves as the reference run corresponding to state-of-the-art full-physics retrievals from a spectrometer with fine spectral resolution and wide spectral coverage (from NIR to SWIR-2). The SWIR-1 and SWIR-2 configurations represent our test cases for a potential future sensor with coarse spectral resolution and single-band spectral coverage. To evaluate our retrievals, we compare retrieved XCO2 with measurements by the ground-based TCCON (Wunch et al., 2011a, b; Messerschmidt et al., 2011; Kiel et al., 2019) (the stations we do not use could not be colocated with satellite measurements of our GOSAT dataset). We use data from 24 TCCON stations worldwide from the GGG2014 dataset (available at: https://tccondata.org, last access: 12 August 2018). GOSAT soundings are defined to be coincident with a TCCON station if the satellite sounding is located within 5∘ with respect to latitude–longitude of the respective ground station. The GOSAT XCO2 retrieval is then compared to the average of the TCCON XCO2 measurements within ±2 h of the GOSAT sounding time.
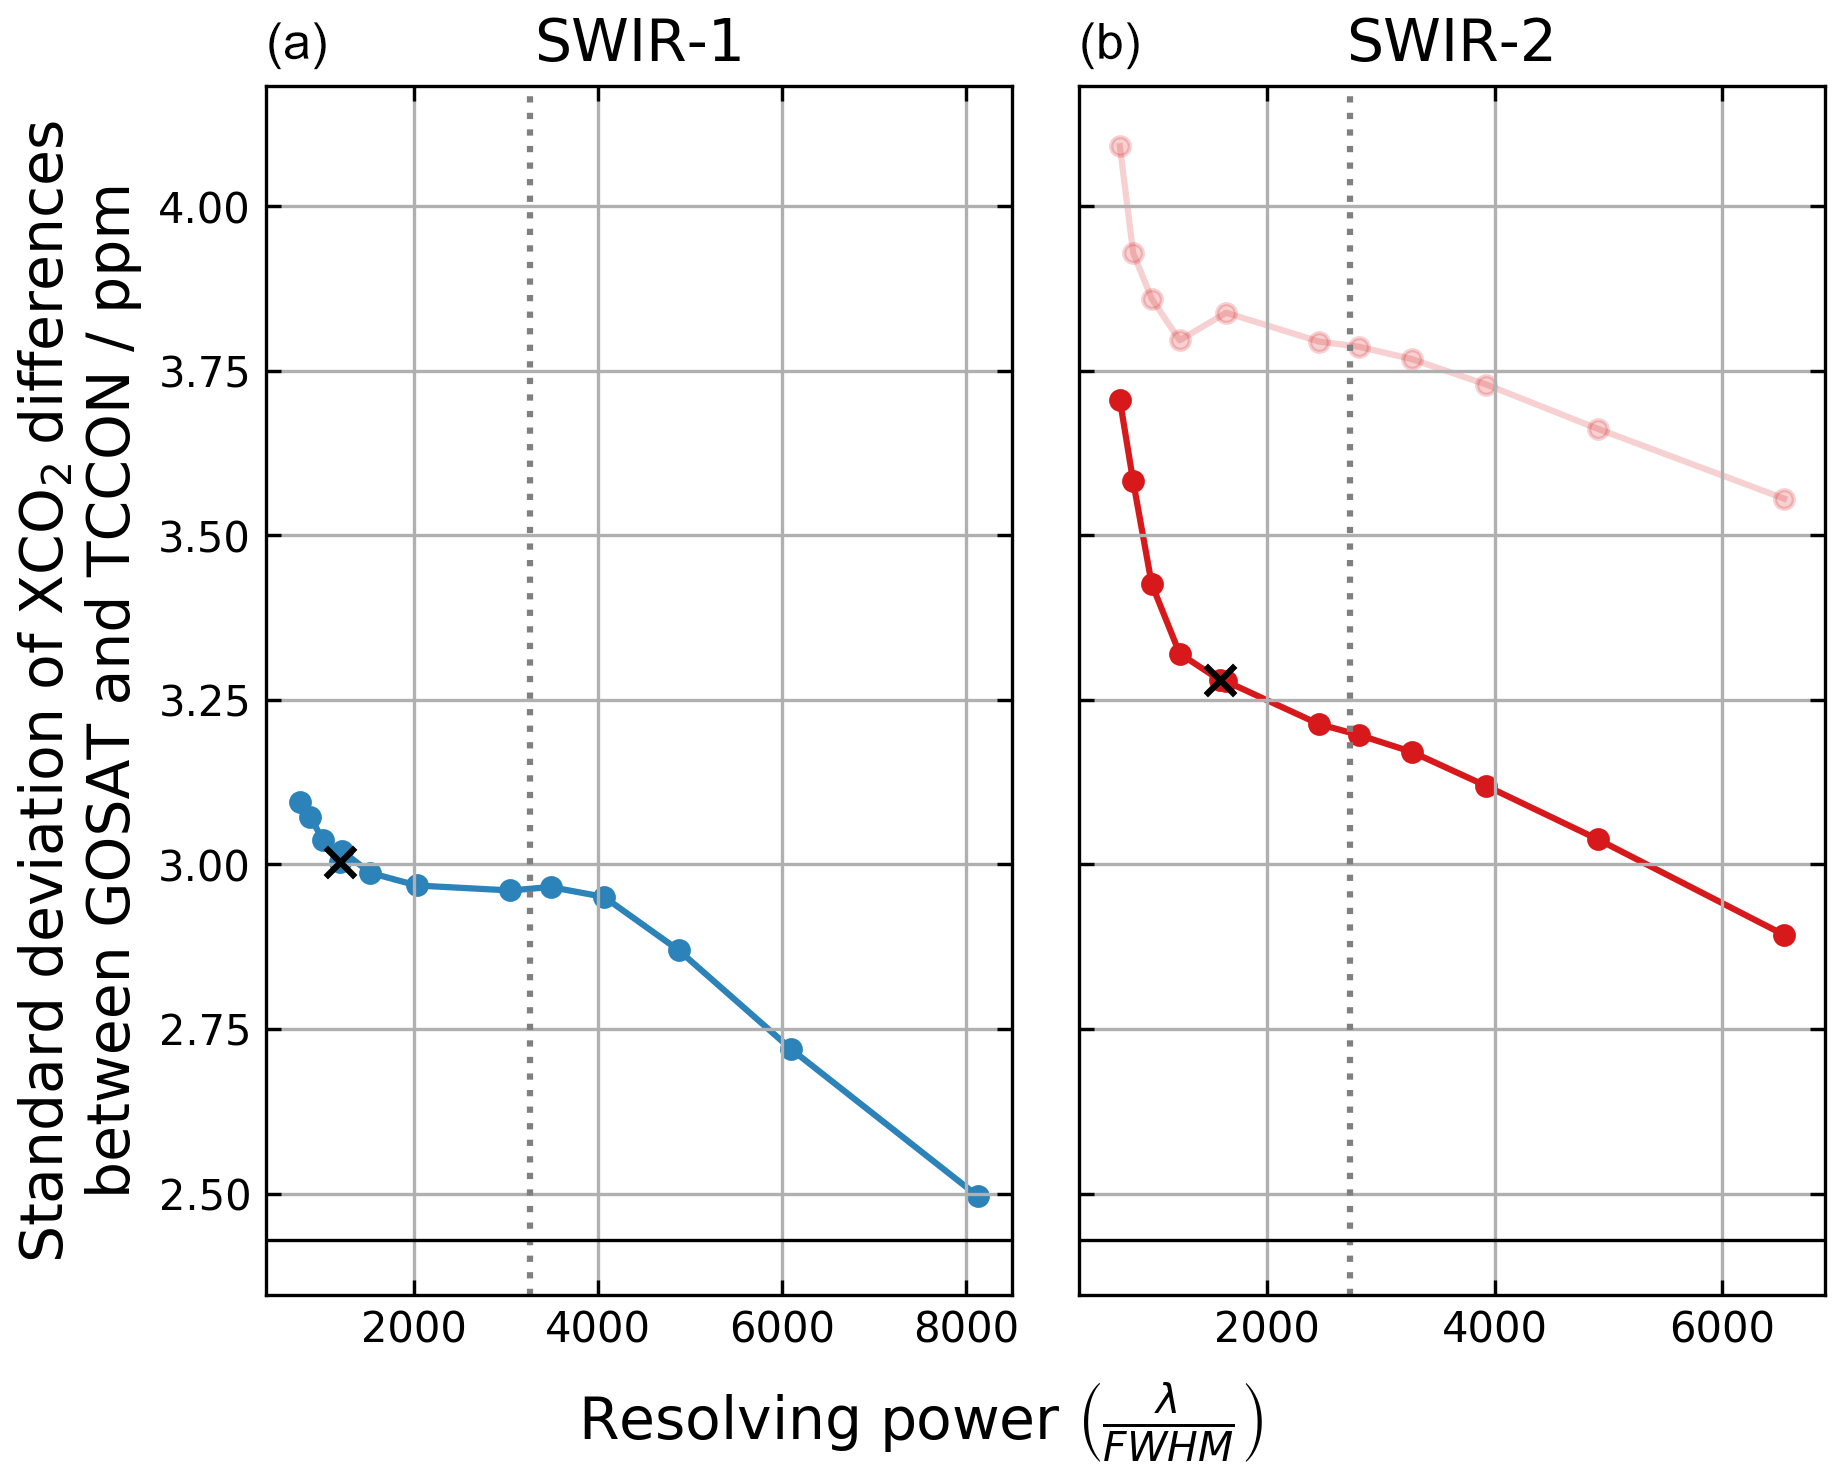
Figure 3Standard deviation of retrieved XCO2 values in SWIR-1 (a) and SWIR-2 (b) around TCCON measurements plotted as a function of resolving power. For SWIR-2, the faint line indicates scatter for a non-scattering retrieval. The dotted line marks the resolving power at which spectral lines become indistinguishable in the convolved spectra. The black horizontal line indicates the native GOSAT scatter around TCCON. The × marks the resolving power that we study in the rest of the article.
XCO2 precision is commonly quantified through the standard deviation of the differences (“scatter”) between GOSAT and TCCON. Figure 3 shows that, while coarser spectral resolution implies larger scatter overall, there is some margin for the choice of spectral resolution in the SWIR-1 band and the figure suggests that the scatter around TCCON exhibits a “plateau” in resolving power space just beyond the critical spectral resolution necessary to distinguish between two typical adjacent CO2 absorption lines in the SWIR-1 (the critical resolving powers are ∼3300 in SWIR-1 and ∼2700 in SWIR-2). This resolving power is marked by the dotted line in Fig. 3. As spectral lines are blended into a broader spectral shape by our convolution procedure, the non-scattering SWIR-1 retrieval retains a very similar scatter around TCCON for another 1000 resolving powers. This pattern is not observed for SWIR-2 scatter around TCCON, which gradually increases towards lower resolving powers (bold red line in Fig. 3). We also conducted a sensitivity study where we switched off the retrieval of particle scattering properties in SWIR-2, i.e., using the same non-scattering configuration in SWIR-2 as in SWIR-1. Then, the scatter of SWIR-2 with respect to around TCCON increases significantly (faint red line in Fig. 3), indicating that while DFS for the particle retrievals is small, XCO2 retrievals benefit. Our observation that spectral resolution degradation for the SWIR-1 and SWIR-2 configurations generally results in larger scatter (than for the native GOSAT retrievals) is in broad agreement with the tendency reported in both Galli et al. (2014) and Wu et al. (2019a), who, however, did not assess the resolution range reported here.
To constrain the resolving power of our future satellite sensor, the scatter around TCCON is the most crucial variable since the sensor will be built to study local-scale XCO2 enhancements. As a consequence, spectral resolving powers greater than the ones that lead to a steep increase in scatter around TCCON in Fig. 3 seem reasonable choices. A technical constraint for the spectral resolution for the envisioned satellite sensor is that the target spectral range ought to be imaged entirely onto the presumed 256 spectral pixels of the sensor's detector assuming a sampling ratio of 3. Thereby we define two target resolving powers of 1200 and 1600 in SWIR-1 and SWIR-2 (marked with a × in Fig. 3). For these choices, Fig. 4 shows the correlation of the SWIR-1, SWIR-2 and native GOSAT XCO2 retrievals with TCCON. The standard deviations around TCCON amount to 2.43 (native), 3.00 (SWIR-1) and 3.28 ppm (SWIR-2). Given that all retrievals here are without bias correction, the three configurations yield different mean differences (“biases”) with respect to TCCON. Generally, although spectral resolution degradation causes a change of the overall bias, an overall bias itself is irrelevant for emission estimates which rely on concentration gradients. Even if the satellite data are to be used in combination with other CO2 measurements, it is common practice to derive a scaling factor of the satellite retrievals with respect to ground truth.

Figure 4Correlation between XCO2 retrieved from GOSAT with TCCON. (a) Native GOSAT retrieval; (b) SWIR-1 retrieval at 1200 resolving power; (c) SWIR-2 retrieval at 1600 resolving power. The grey line indicates a 1:1 correlation line; the colored lines show linear fits to the respective dataset. Standard deviations around TCCON amount to 2.43 (native, compare, for example, Guerlet et al., 2013b), 3.00 (SWIR-1) and 3.28 ppm (SWIR-2).
Figure 5 resolves the biases per TCCON station for the resolving powers of 1200 and 1600 in SWIR-1 and SWIR-2, respectively. Typically, the standard deviation among these station-by-station biases (“bias variability”) is taken as a measure for regional systematic errors which cause regional-scale spurious gradients, and thus they are detrimental for regional assessment of sources and sinks. The present retrieval configurations lead to marginally increased TCCON bias variability from 0.94 ppm for native GOSAT up to 0.99 and 0.97 ppm in SWIR-1 and SWIR-2 retrievals, respectively. Figure 5 also shows XCO2 retrieval standard deviations per TCCON station. The corresponding data for retrieval performance at individual sites can be found in the Supplement. Regional-scale variability of our proposed retrievals is not of utmost importance as our goal is to make consistent measurements on a local scale. To this end, correlations of retrieval errors caused by parameters that vary on local scales are more informing.
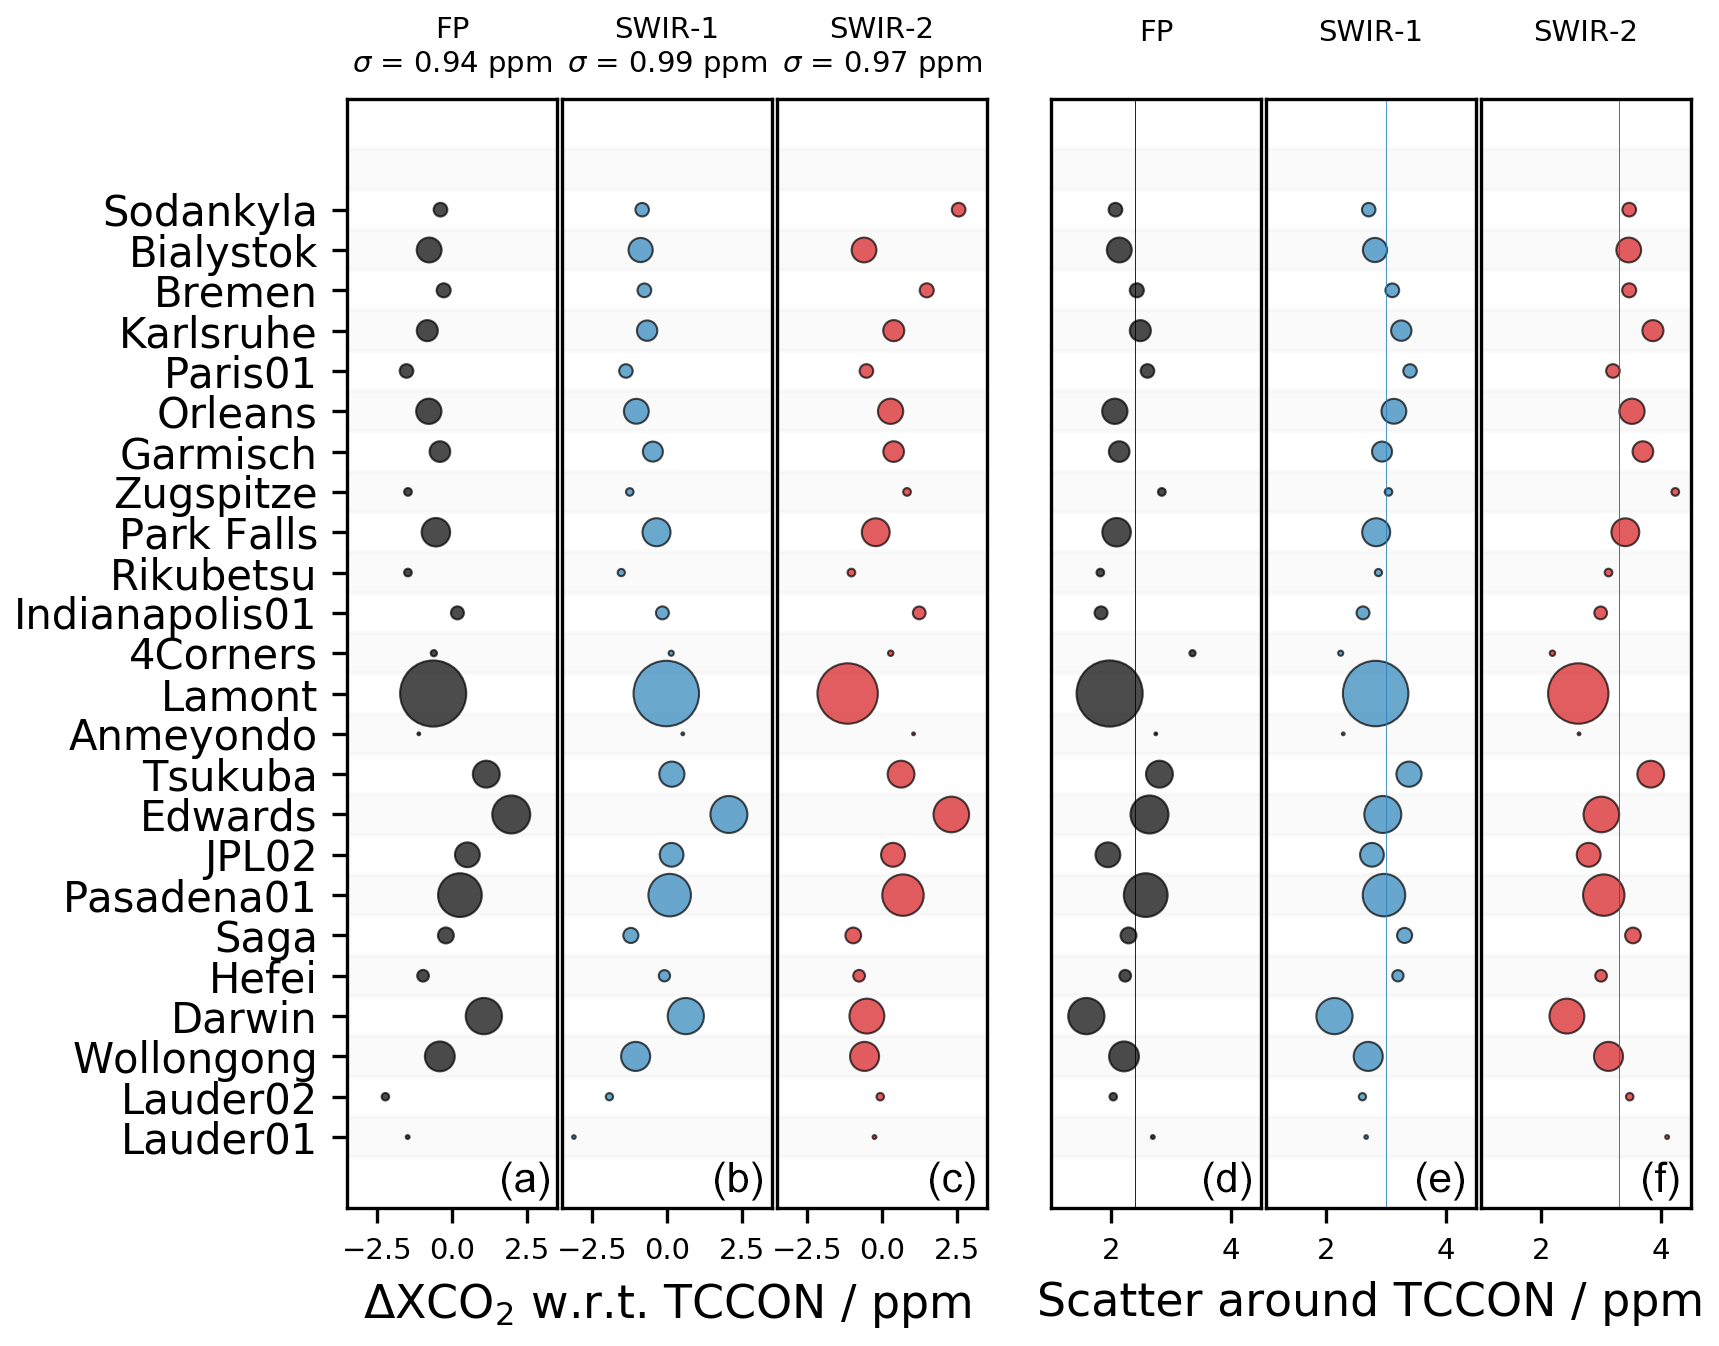
Figure 5Comparison of retrieval performances at individual TCCON stations sorted north to south. Marker size indicates number of colocated soundings at each station. (a, b, c) Station-by-station mean differences between TCCON and the native (black), SWIR-1 (blue) and SWIR-2 (red) retrievals from GOSAT. The standard deviation of mean differences among the stations, σ, amounts to 0.94 (native), 0.99 (SWIR-1) and 0.97 ppm (SWIR-2). (d, e, f) Scatter around TCCON per station for the native, SWIR-1 and SWIR-2 retrievals. Vertical lines mark the average standard deviations (native: 2.43; SWIR-1: 3.00; SWIR-2: 3.28 ppm).
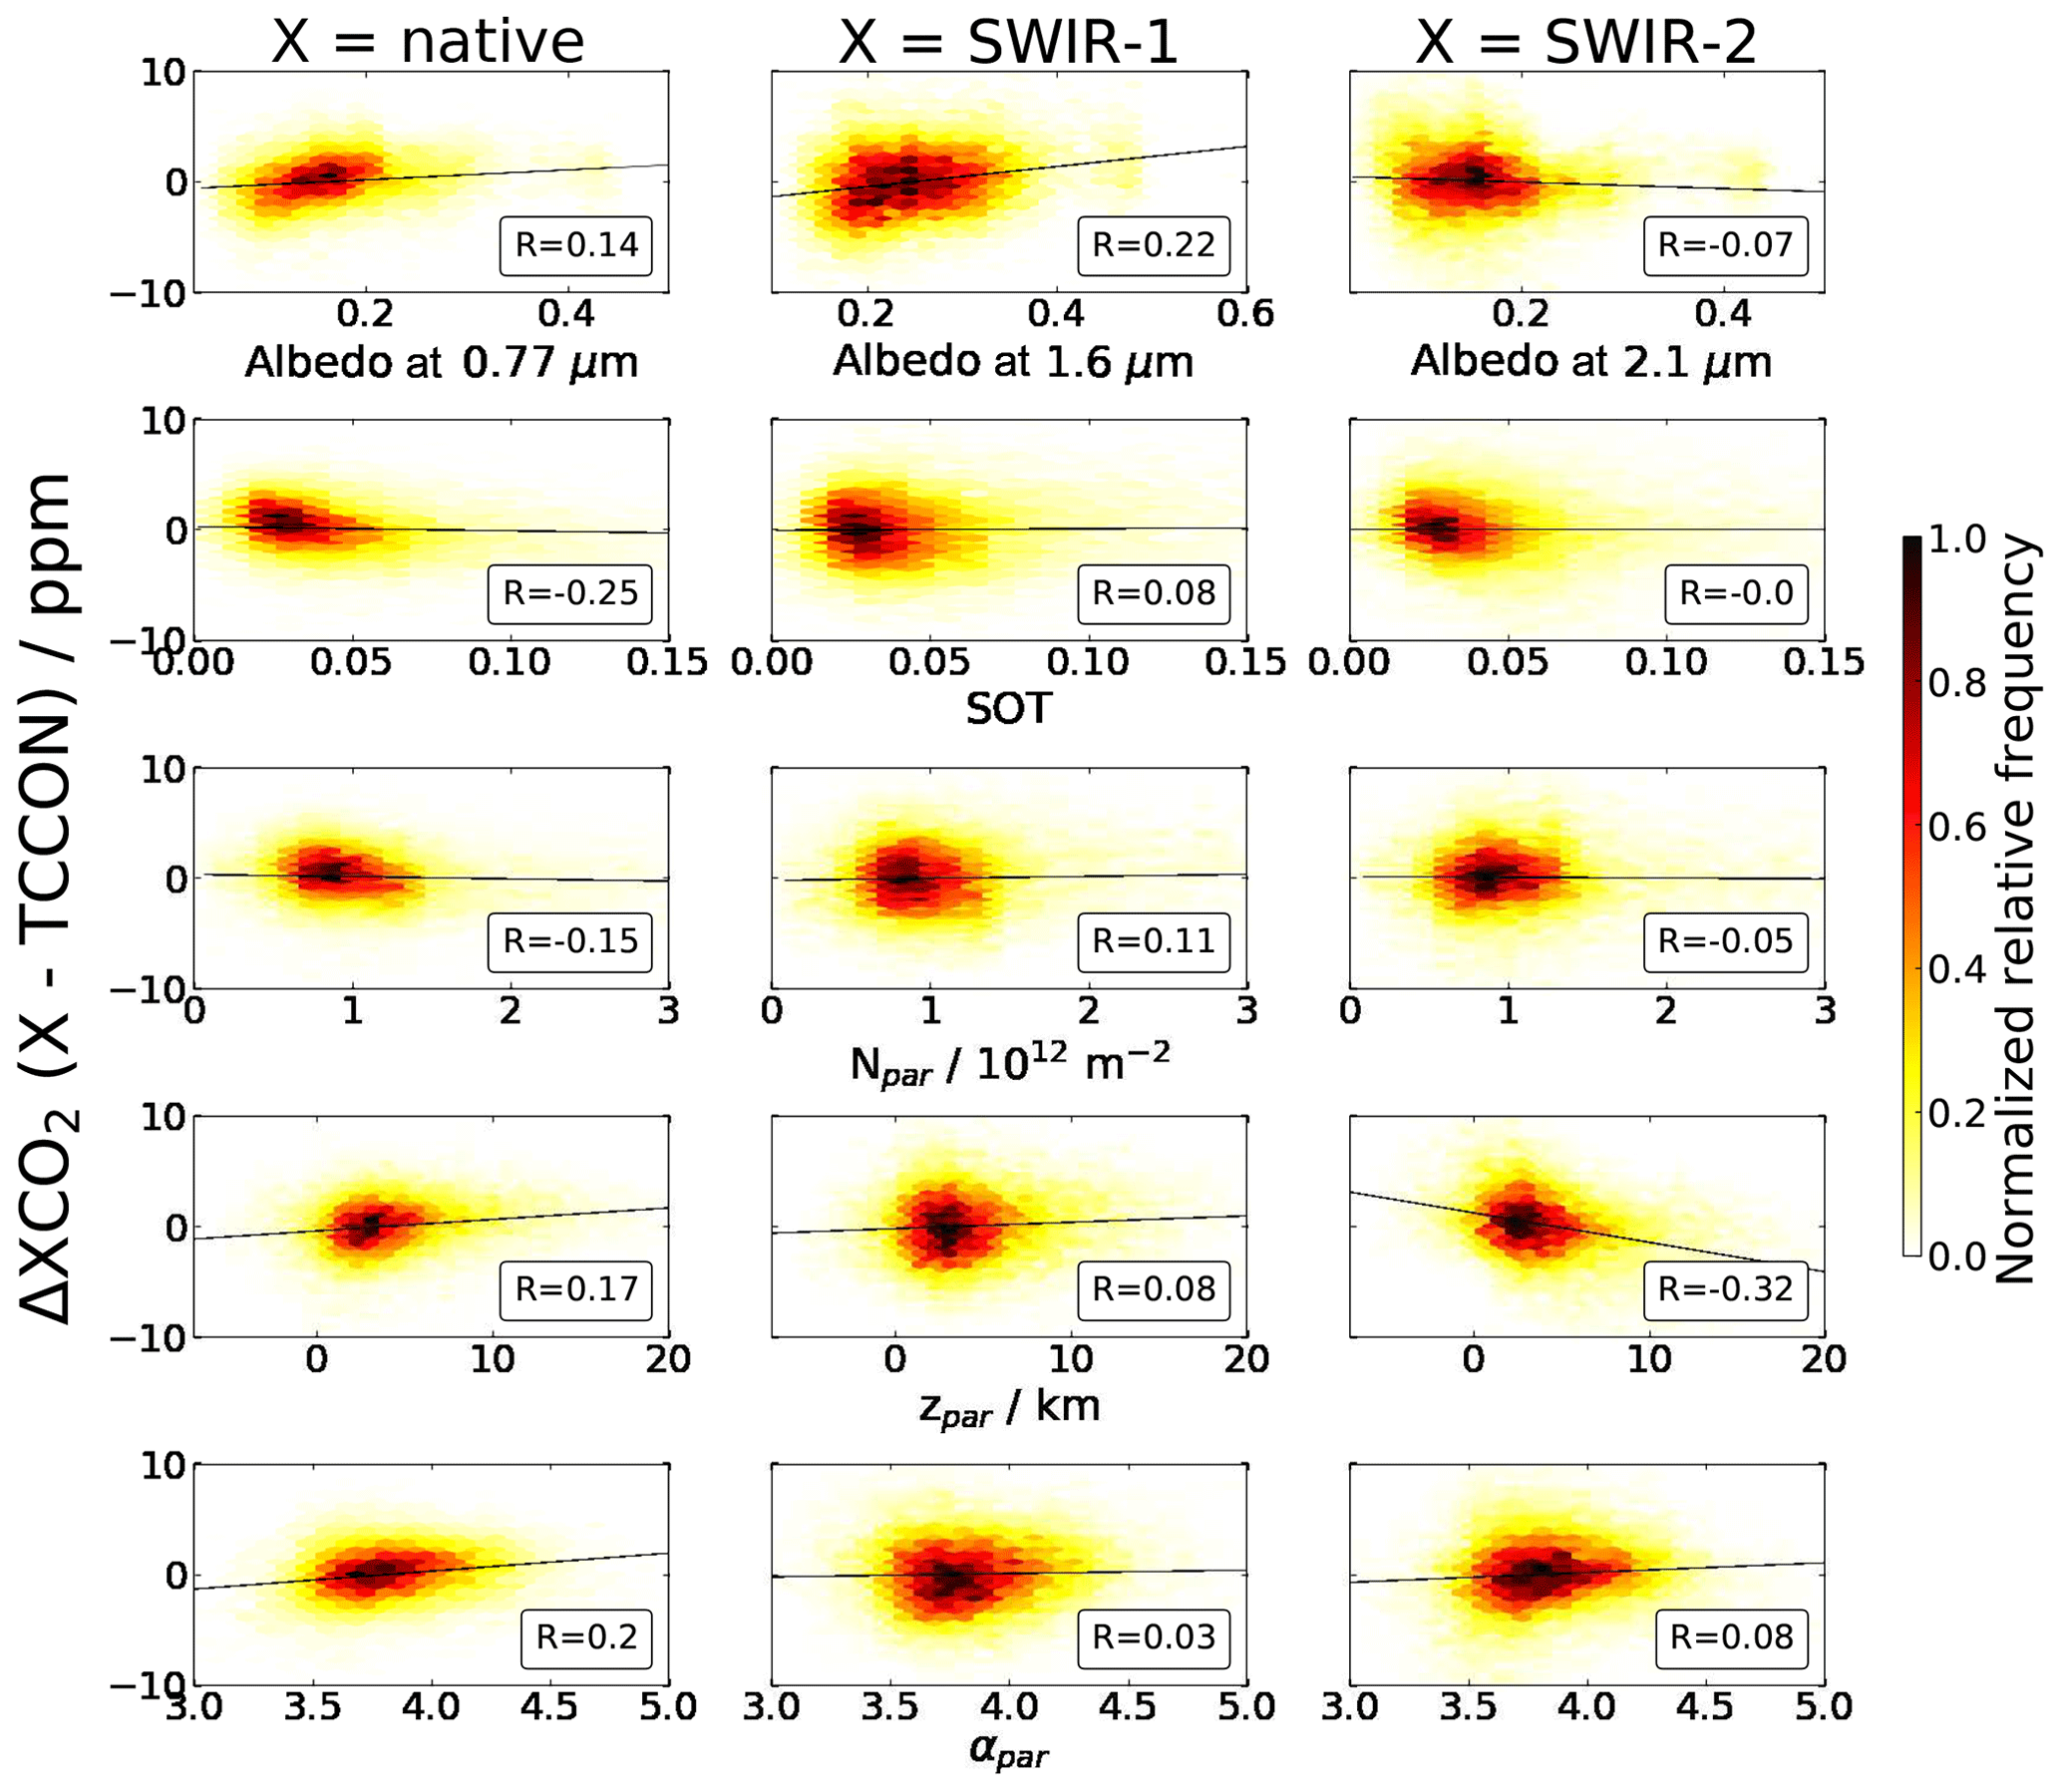
Figure 6Differences between TCCON and native GOSAT (left), SWIR-1 (middle) and SWIR-2 (right) for selected geophysical parameters. Pearson's correlation coefficient R is shown in the corner of each subplot. The solid line is a linear fit to the data. Color encodes relative occurrence of data points.
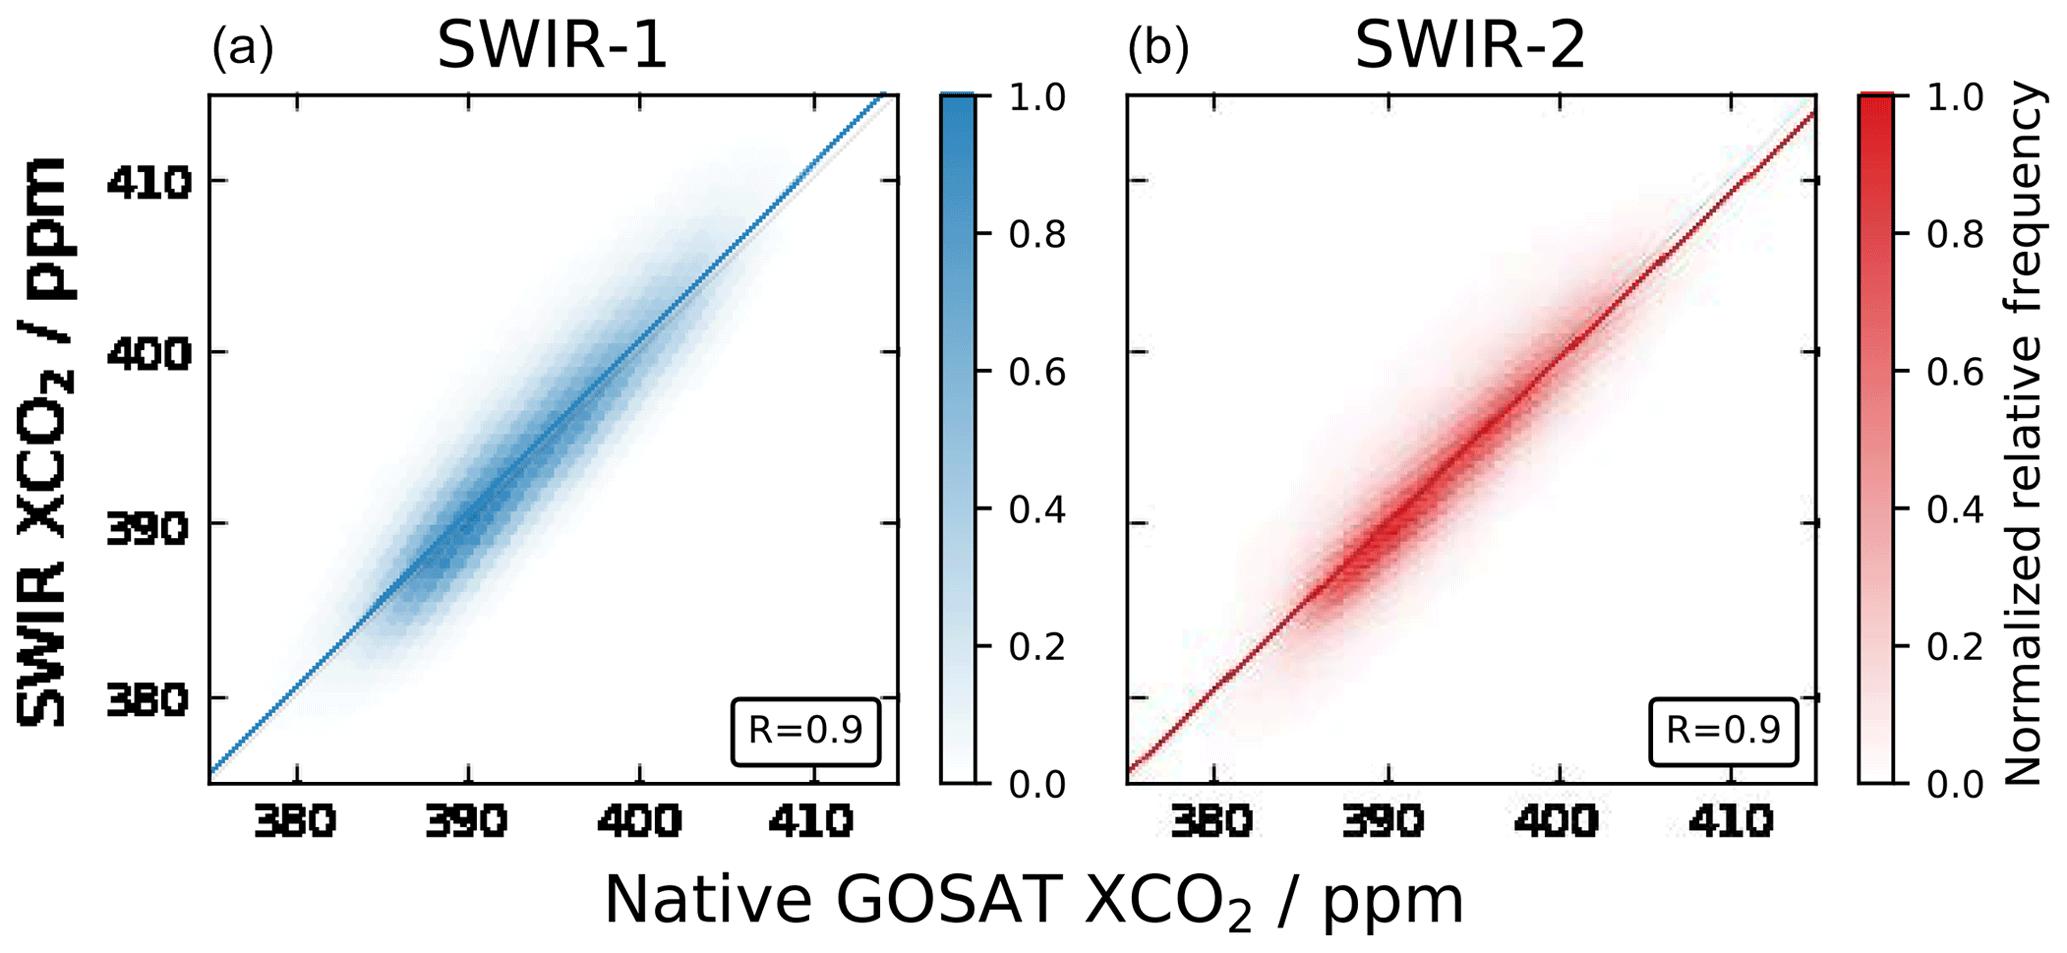
Figure 7Retrieved SWIR-1 (a) and SWIR-2 (b) XCO2 plotted versus the corresponding native GOSAT retrievals. The colored lines indicate linear fits to the data, and the grey line marks the 1:1 correlation. Scatter amounts to 2.85 and to 2.69 ppm in SWIR-1 and SWIR-2, respectively. Correlation coefficients are displayed in the lower right corners of the panels. Color shading encodes relative occurrence of data points.
For diagnosing spurious dependencies of the retrieved XCO2 on locally variable geophysical parameters, we examine parameter correlations of the GOSAT–TCCON differences. Figure 6 shows correlations of the native GOSAT, SWIR-1 (resolving power: 1200) and SWIR-2 (resolving power: 1600) retrievals for surface albedo (at 0.774 µm for native GOSAT, at 1.600 µm for SWIR-1, at 2.099 µm for SWIR-2), the scattering optical thickness (SOT) and the three particle parameters Npar, zpar and αpar characterizing particle number density, particle layer height and particle size. The particle parameters are taken from native GOSAT runs since SWIR-1 does not retrieve the parameters and SWIR-2 retrievals exhibit little DFS. The GOSAT–TCCON departures show a small correlation (R>0.1) with surface albedo for both SWIR-1 and native GOSAT configurations, while the SWIR-2 retrievals do not show any correlation. Since the SWIR-1 configuration neglects particle scattering, it appears reasonable that the GOSAT–TCCON departures correlate with albedo, which mediates the importance of scattering with respect to the direct light path. Yet, only small correlations are found for SWIR-1 errors with SOT, particle layer height and particle size (R<0.1). Minor SWIR-1 error correlations with respect to particle number density (R=0.11) are present around TCCON stations. For SWIR-2, the correlation with the particle layer height shows . Although we do account for scattering in the SWIR-2, the strong regularization of the retrieval leads to convergence close to the a priori (τ=0.1, zpar=3000 m, αpar=3.5) of the particle parameters. Therefore, it is not surprising that correlations still exist with particle scattering properties in SWIR-2. An investigation of the impact of the aerosol priors on retrieval performance showed that SWIR-2 XCO2 is only moderately sensitive to the aerosol priors. For instance, varying aerosol prior optical depth by a factor of 2 or 0.5 results in small changes in standard deviations around TCCON (+0.22 and −0.08 ppm, respectively). Changing scattering layer height priors to zpar=1000 m or zpar=5000 m increased scatter around TCCON by +0.04 and +0.43 ppm, respectively. Similarly, scatter around TCCON changes by +0.22 and −0.05 ppm if αpar is set to 3.0 and 5.0, respectively. SWIR-2 retrieval errors around TCCON sites do not significantly correlate with SOT, particle number density and the size parameter. Native GOSAT retrievals consistently show small correlations with all particle parameters. In addition (not shown), correlations with are observed for SWIR-1 (and not for SWIR-2) with other geophysical variables like slant air mass of the geometric light path () and water vapor column (R=0.21).
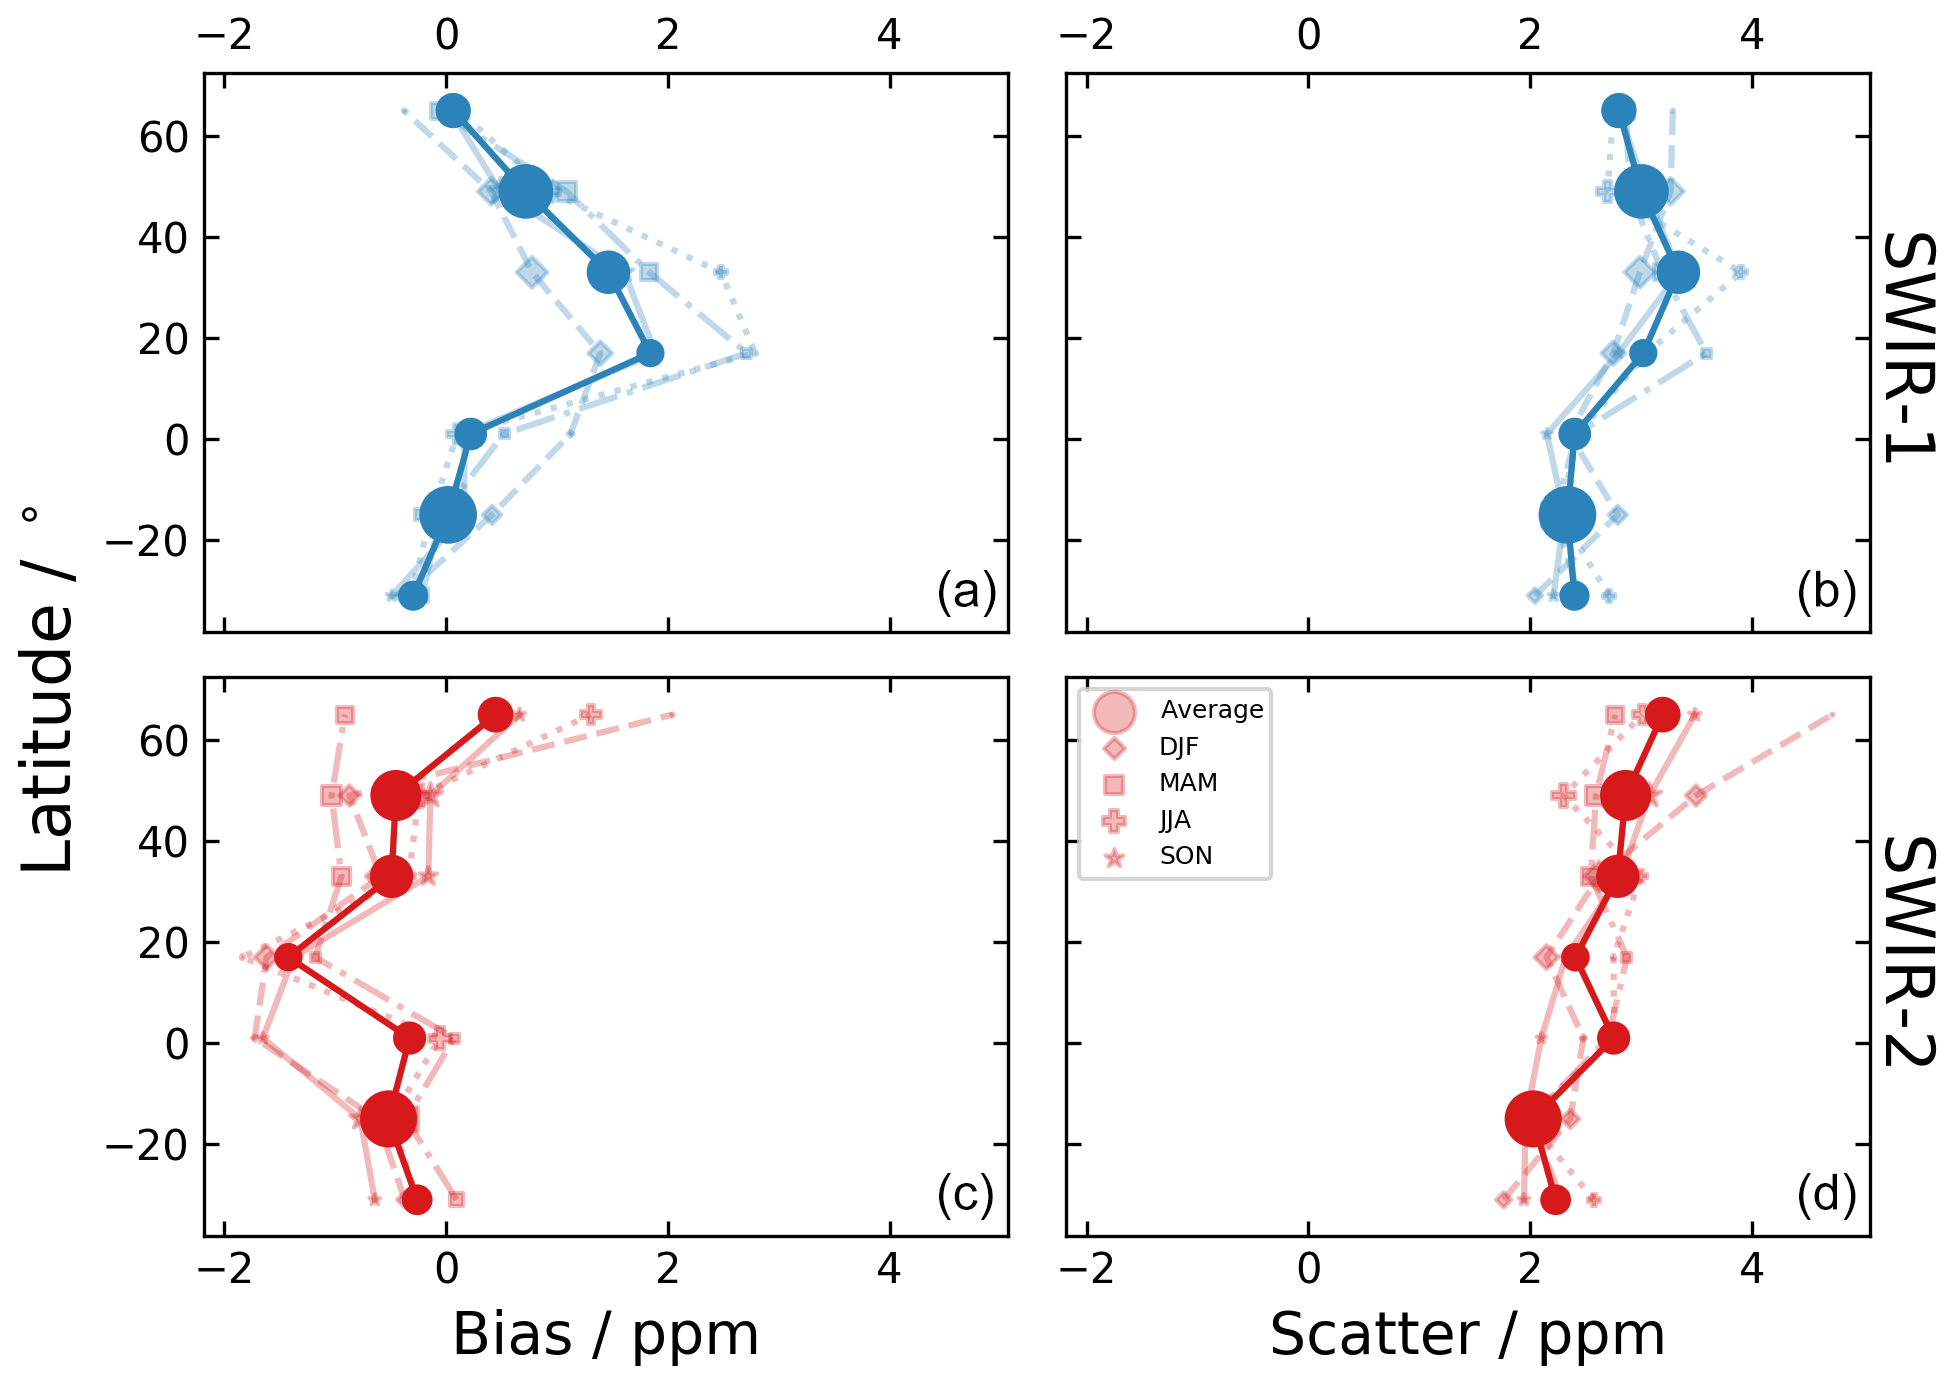
Figure 8Retrieval bias (a, c) and scatter (b, d) with respect to native GOSAT XCO2 over land as a function of latitude for the SWIR-1 (a, b) and SWIR-2 retrievals (c, d) in 16∘ bins. Bold circles indicate the average bias and scatter, while seasonal variations are shown for boreal winter (DJF, diamonds), spring (MAM, squares), summer (JJA, plus) and fall (SON, stars). Symbol size indicates the relative number of GOSAT observations over land in the respective latitudinal bin.
For evaluation on the global scale, we take XCO2 from native GOSAT retrievals as the reference. The SWIR-1 and SWIR-2 retrievals are discussed for resolving powers of 1200 and 1600, respectively. We subtract the overall biases found by the TCCON analysis from all XCO2 retrievals discussed here (−3.6, 2.49 and 1.04 ppm for the native, SWIR-1 and SWIR-2 configurations, respectively).
Figure 7 shows the correlations of the SWIR-1 and SWIR-2 configurations with the native GOSAT retrievals. The standard deviations of the differences to native GOSAT (scatter) amount to 2.85 and 2.69 ppm for SWIR-1 and SWIR-2, respectively, while correlation coefficients are 0.90 for both SWIR configurations. Although the overall biases with respect to TCCON have been subtracted, the global analysis (containing many more data than the TCCON analysis and even glint spectra) yields non-vanishing mean differences (bias) of 0.59 ppm for SWIR-1 and −0.29 ppm for SWIR-2 with respect to native GOSAT, presumably as a consequence of an uneven distribution of TCCON sites around the globe. Figure 8 resolves bias and scatter of the SWIR configurations in geographic latitude and season. Figure 8a, b illustrate that SWIR-1 bias and scatter are both enhanced in the Northern Hemisphere. Averaging all seasons, SWIR-1 bias and scatter peak at 1.93 and 3.34 ppm, respectively, between 20 and 30∘ N where the planet's large deserts are located. Deserts imply bright surfaces and desert dust aerosols which may impact the SWIR-1 retrievals configured under the non-scattering assumption. For the SWIR-2 configuration, Fig. 8c, d show a meridional gradient for scatter and an unclear pattern for bias. Average SWIR-2 scatter varies between 2.03 ppm (at 15∘ S) and 3.20 ppm (at 65∘ N). The bias seems to indicate that SWIR-2 retrievals underestimate native GOSAT over the desert latitudes (20∘ N) and overestimate in higher latitudes (60∘ N). Seasonal variations generally follow the annual average patterns, and no clear seasonal dependencies are detectable. Figures 9 and 10 show maps of the differences between the native GOSAT configuration and SWIR-1 and SWIR-2 averaged at 1∘ × 1∘ for the full record of 8 years of GOSAT observations (2009–2016). The global maps retrace the general observations of the zonal averages shown in Fig. 8. SWIR-1 overestimates native GOSAT retrievals throughout the high albedo regions of the Sahara, central Asia and tentatively in central Australia. SWIR-2 tends to overestimate native GOSAT in the high latitudes and in Amazonia. Over the deserts the patterns are mixed.
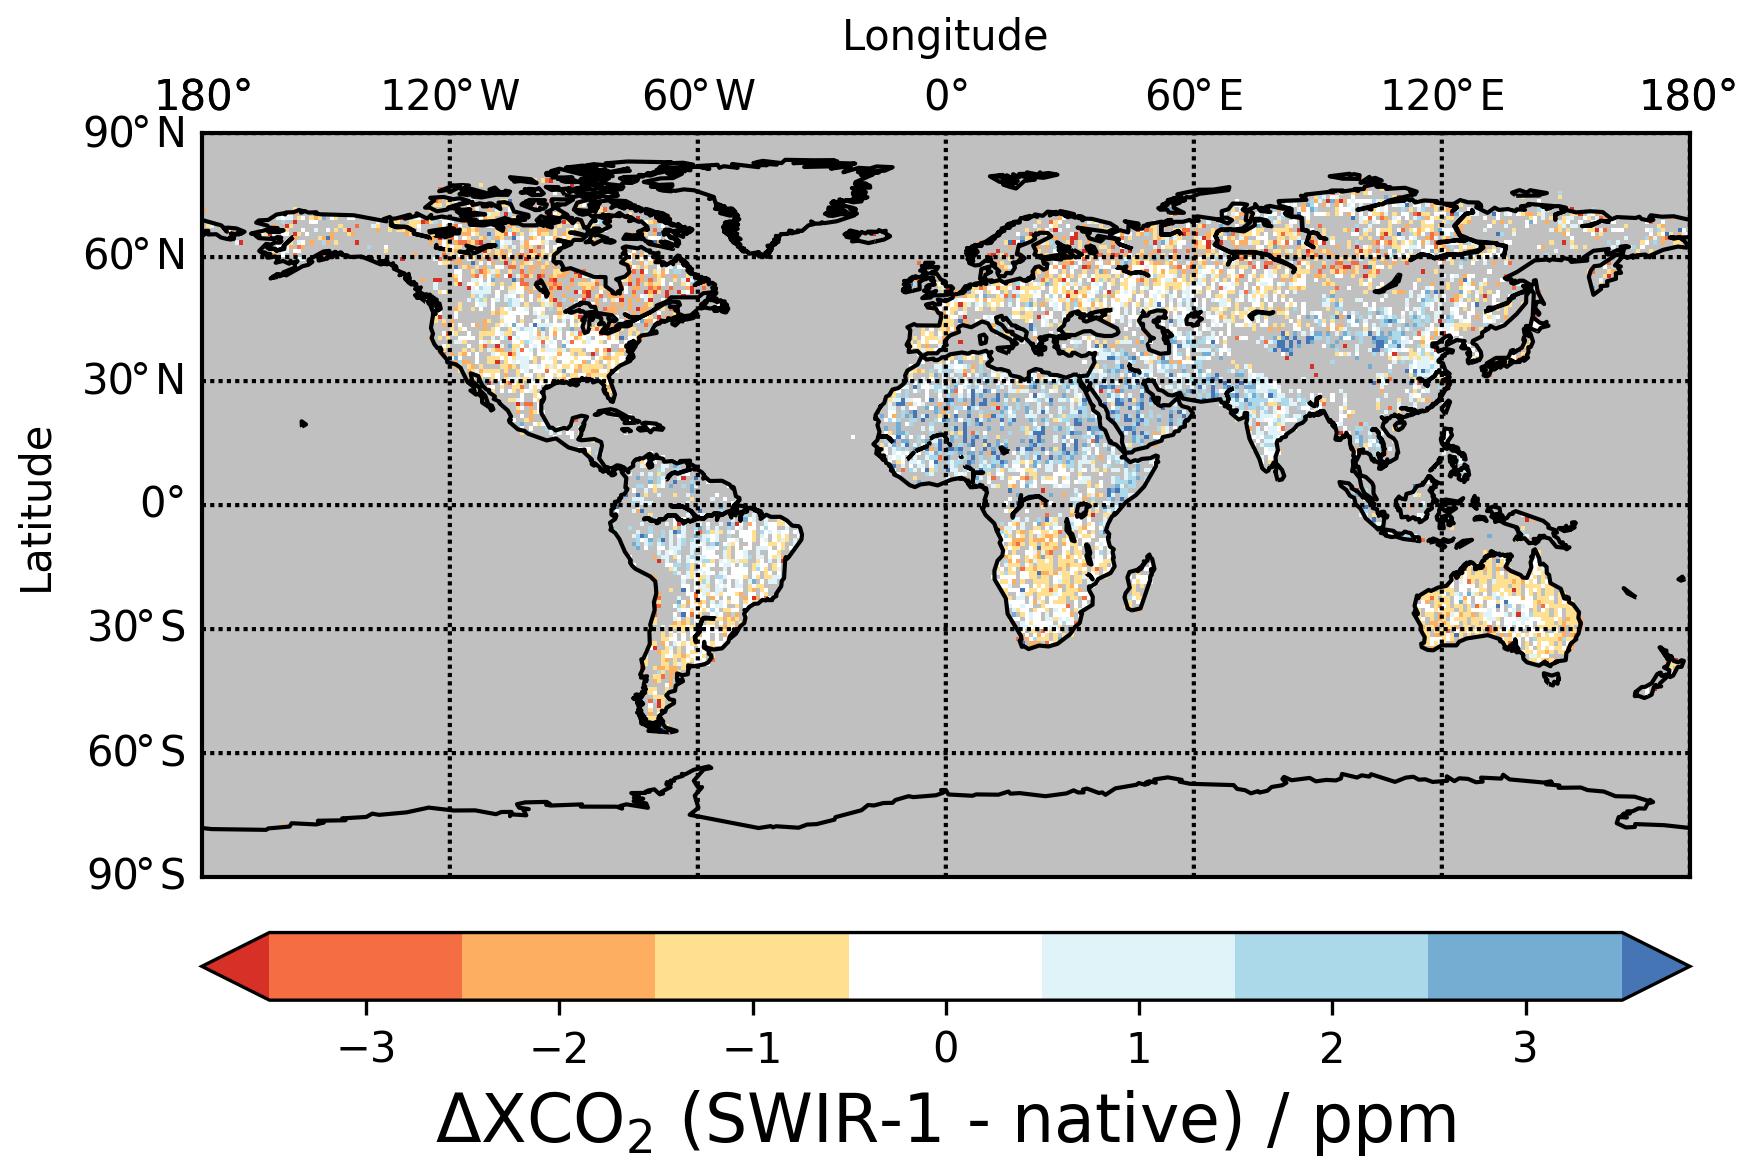
Figure 9Differences between native GOSAT and SWIR-1 retrievals averaged on 1∘ × 1∘ for 8 years of GOSAT observations. The global mean bias over land of 0.45 ppm was subtracted from the graph.
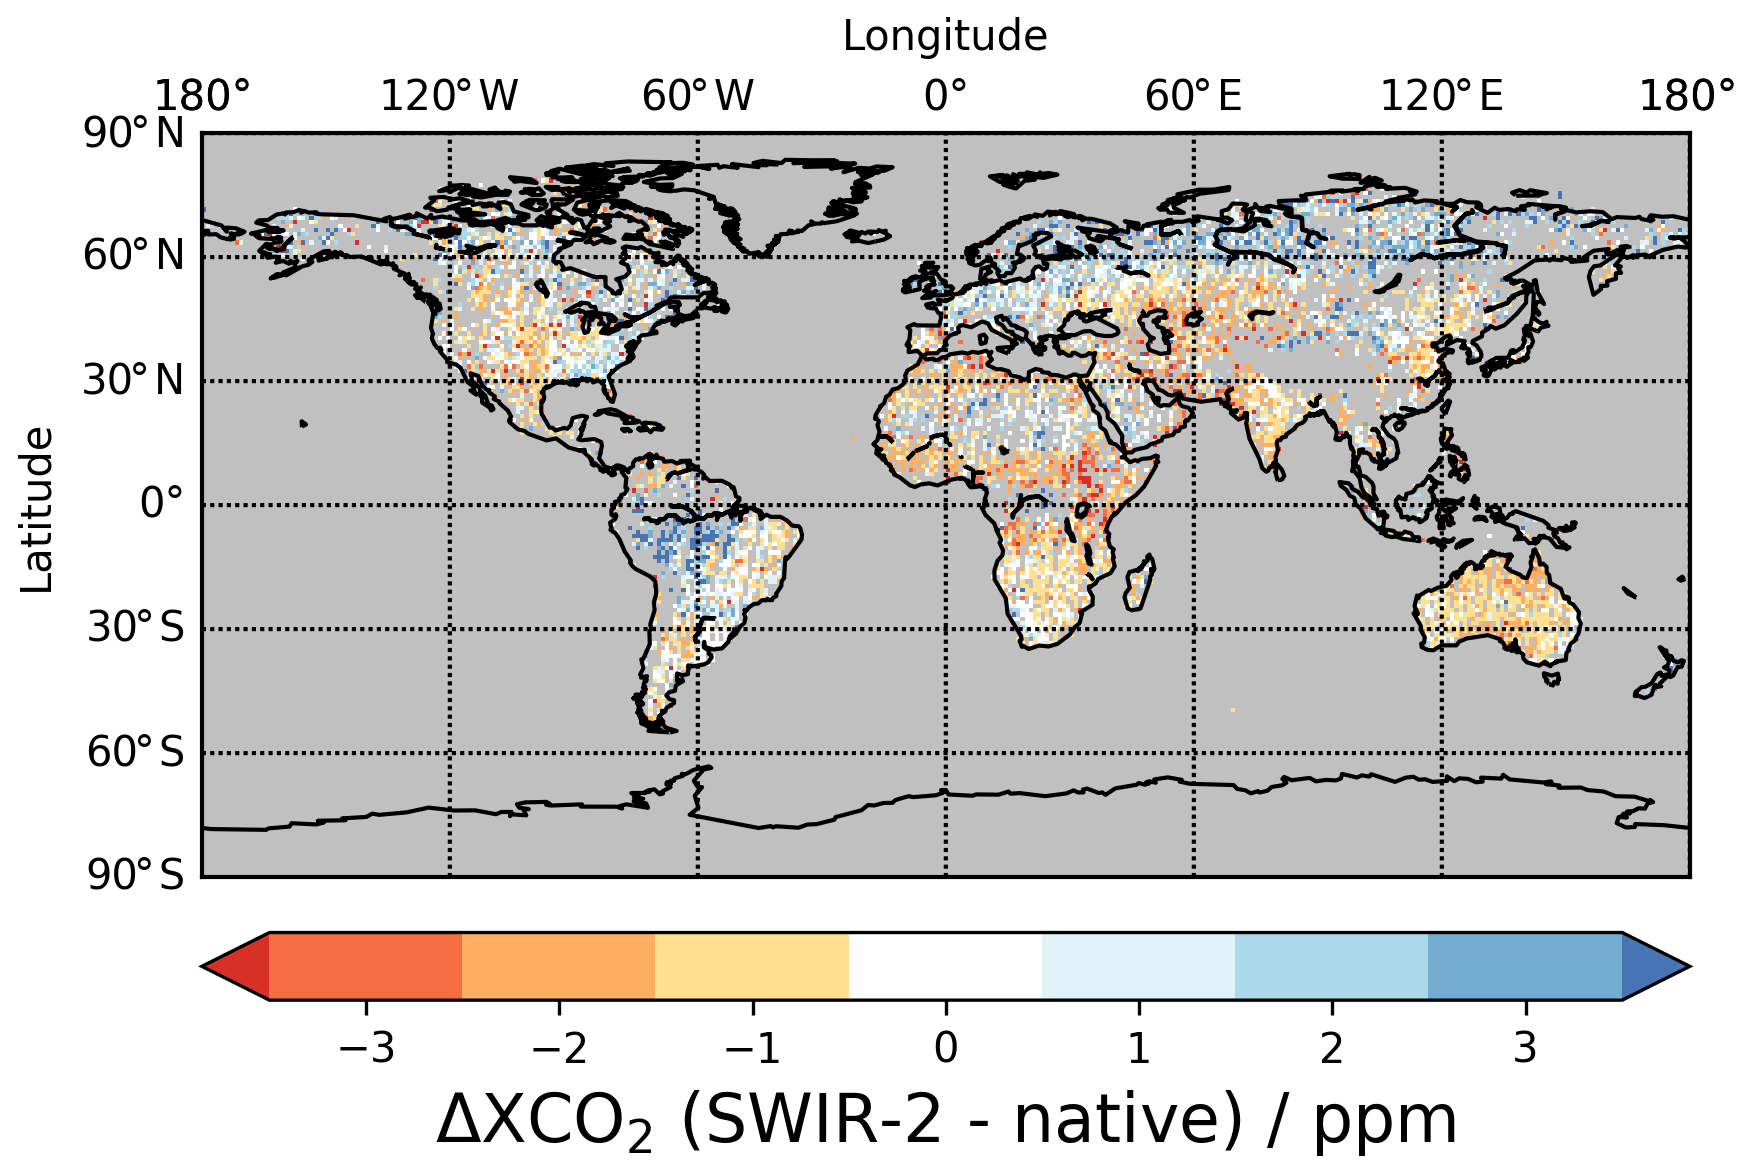
Figure 10Differences between native GOSAT and SWIR-2 retrievals averaged on 1∘ × 1∘ for 8 years of GOSAT observations. The global mean bias over land of 0.03 ppm was subtracted from the graph.
Figure 11 examines correlations of the retrieval differences with selected geophysical parameters similar to the analysis undertaken for TCCON (Sect. 3, Fig. 6). Among various parameters tested, most significant correlations are found for the geophysical parameters that control the scattering regime. These parameters are surface albedo, SOT, number density of scatterers (Npar), center height of the scattering layer (zpar) and the power-law parameter for the scattering particle size distribution (αpar). As in Fig. 6, particle scattering parameters are taken from the native GOSAT retrievals. Generally, the SWIR-1 and SWIR-2 retrievals show parameter correlations which are more significant on the global scale than what has been found for the TCCON evaluation. The correlation coefficients R are typically on the order of 0.2–0.3 and peak at 0.5 for the correlation of the SWIR-2 bias with the number density of scatterers Npar. This is true for the SWIR-2 retrievals, although the configuration allows for some freedom fitting the particle parameters (DFS =0.38 on average). We also tried a non-scattering variant for SWIR-2 (not shown) which yielded clearly inferior performance (see also Fig. 3) due to correlations with other parameters such as the water vapor column and the slant air mass.
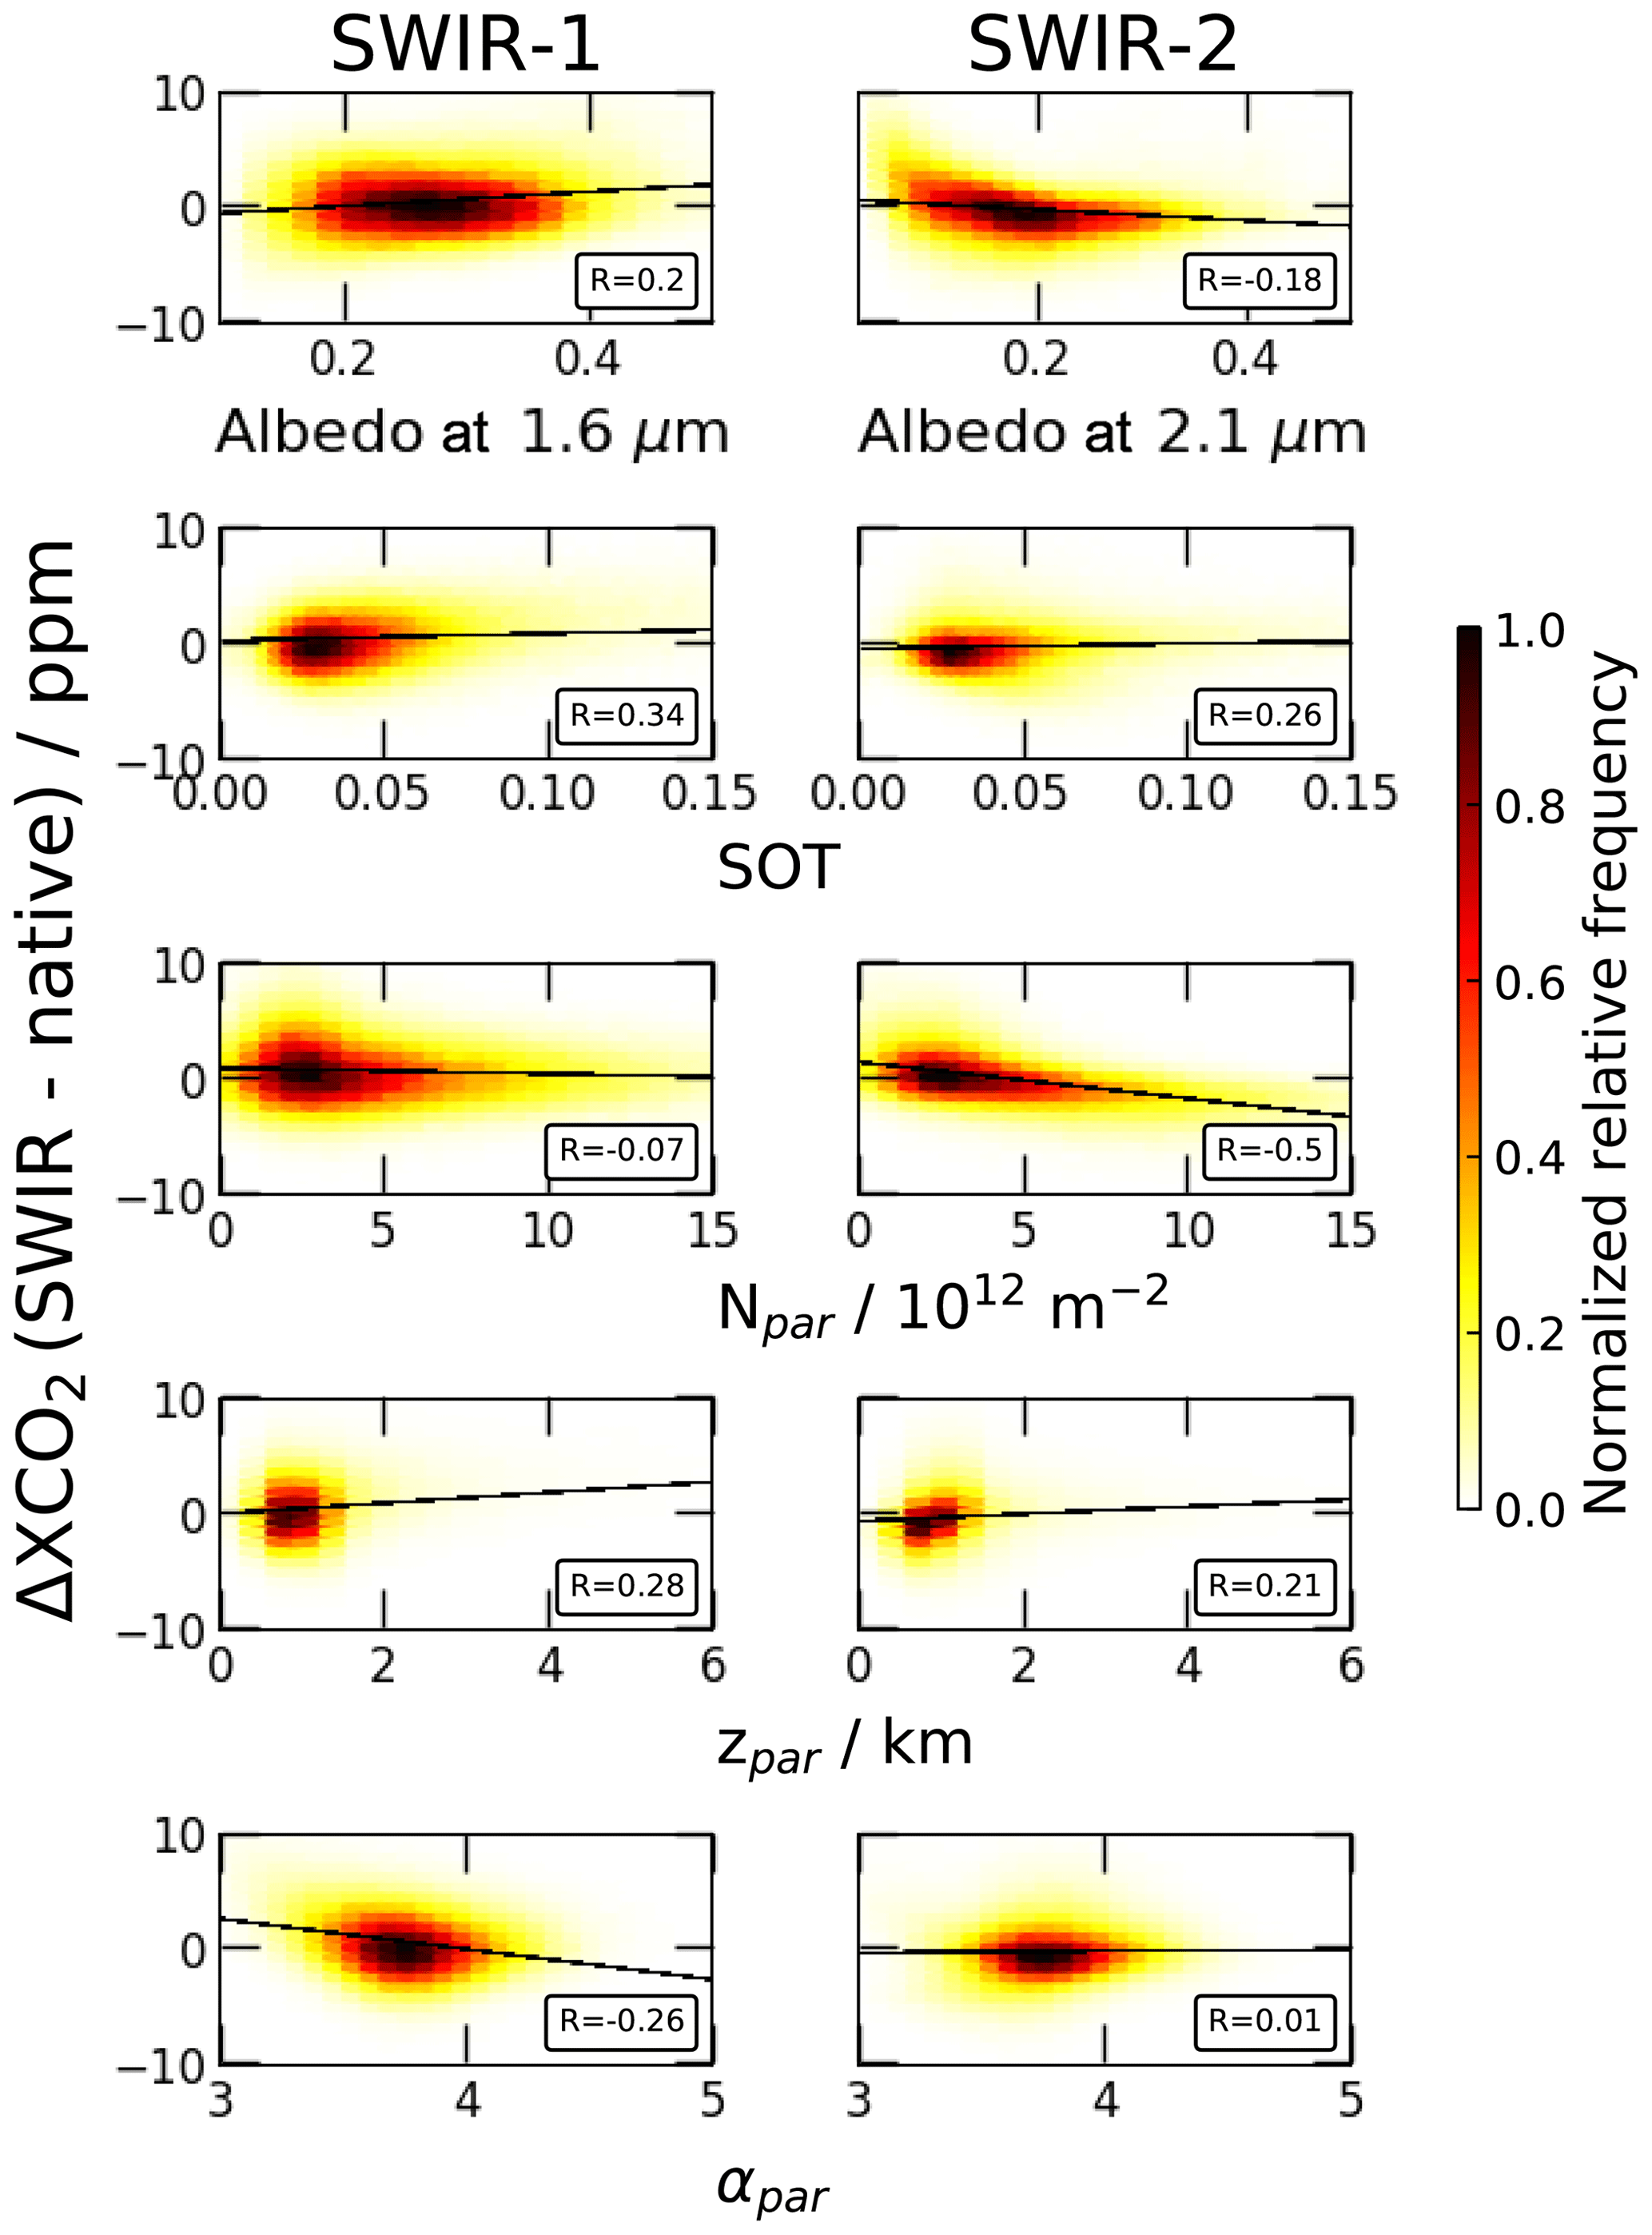
Figure 11Differences between native GOSAT and the SWIR-1 (left) and SWIR-2 (right) configurations for selected geophysical parameters. Pearson's correlation coefficient R is shown in the corner of each subplot. The solid line is a linear fit to the data. Color encodes relative occurrence of data points.
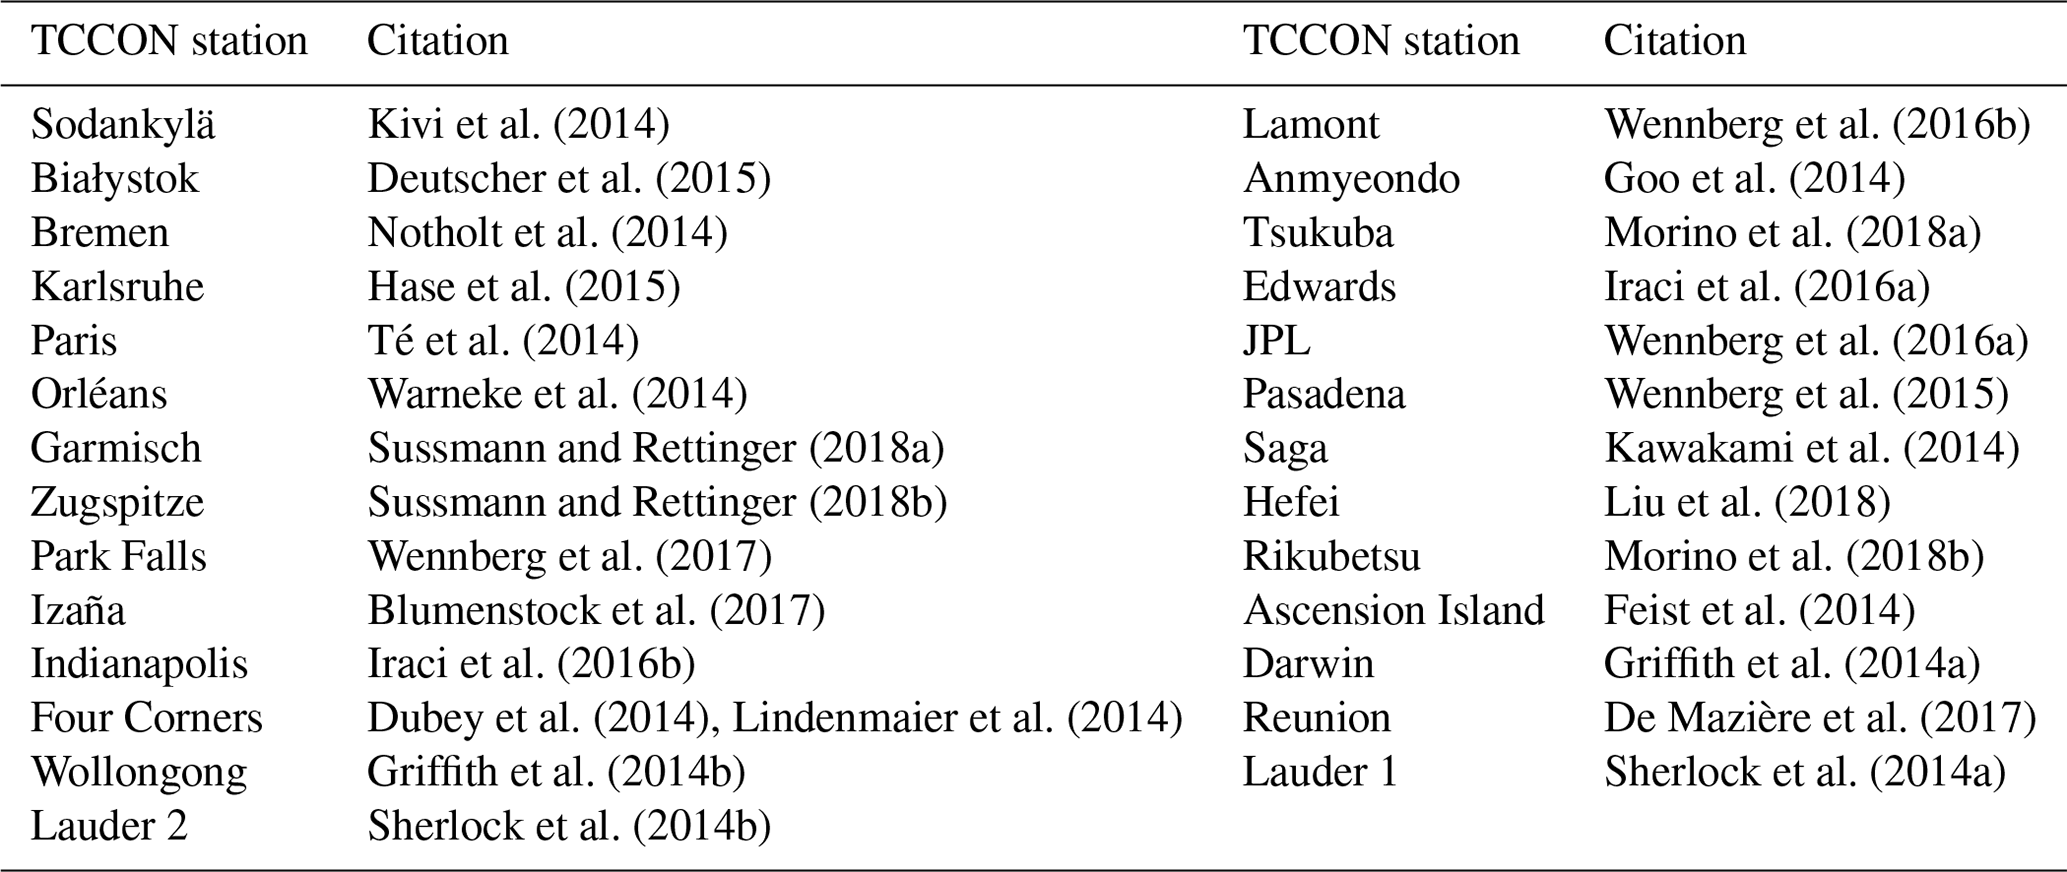
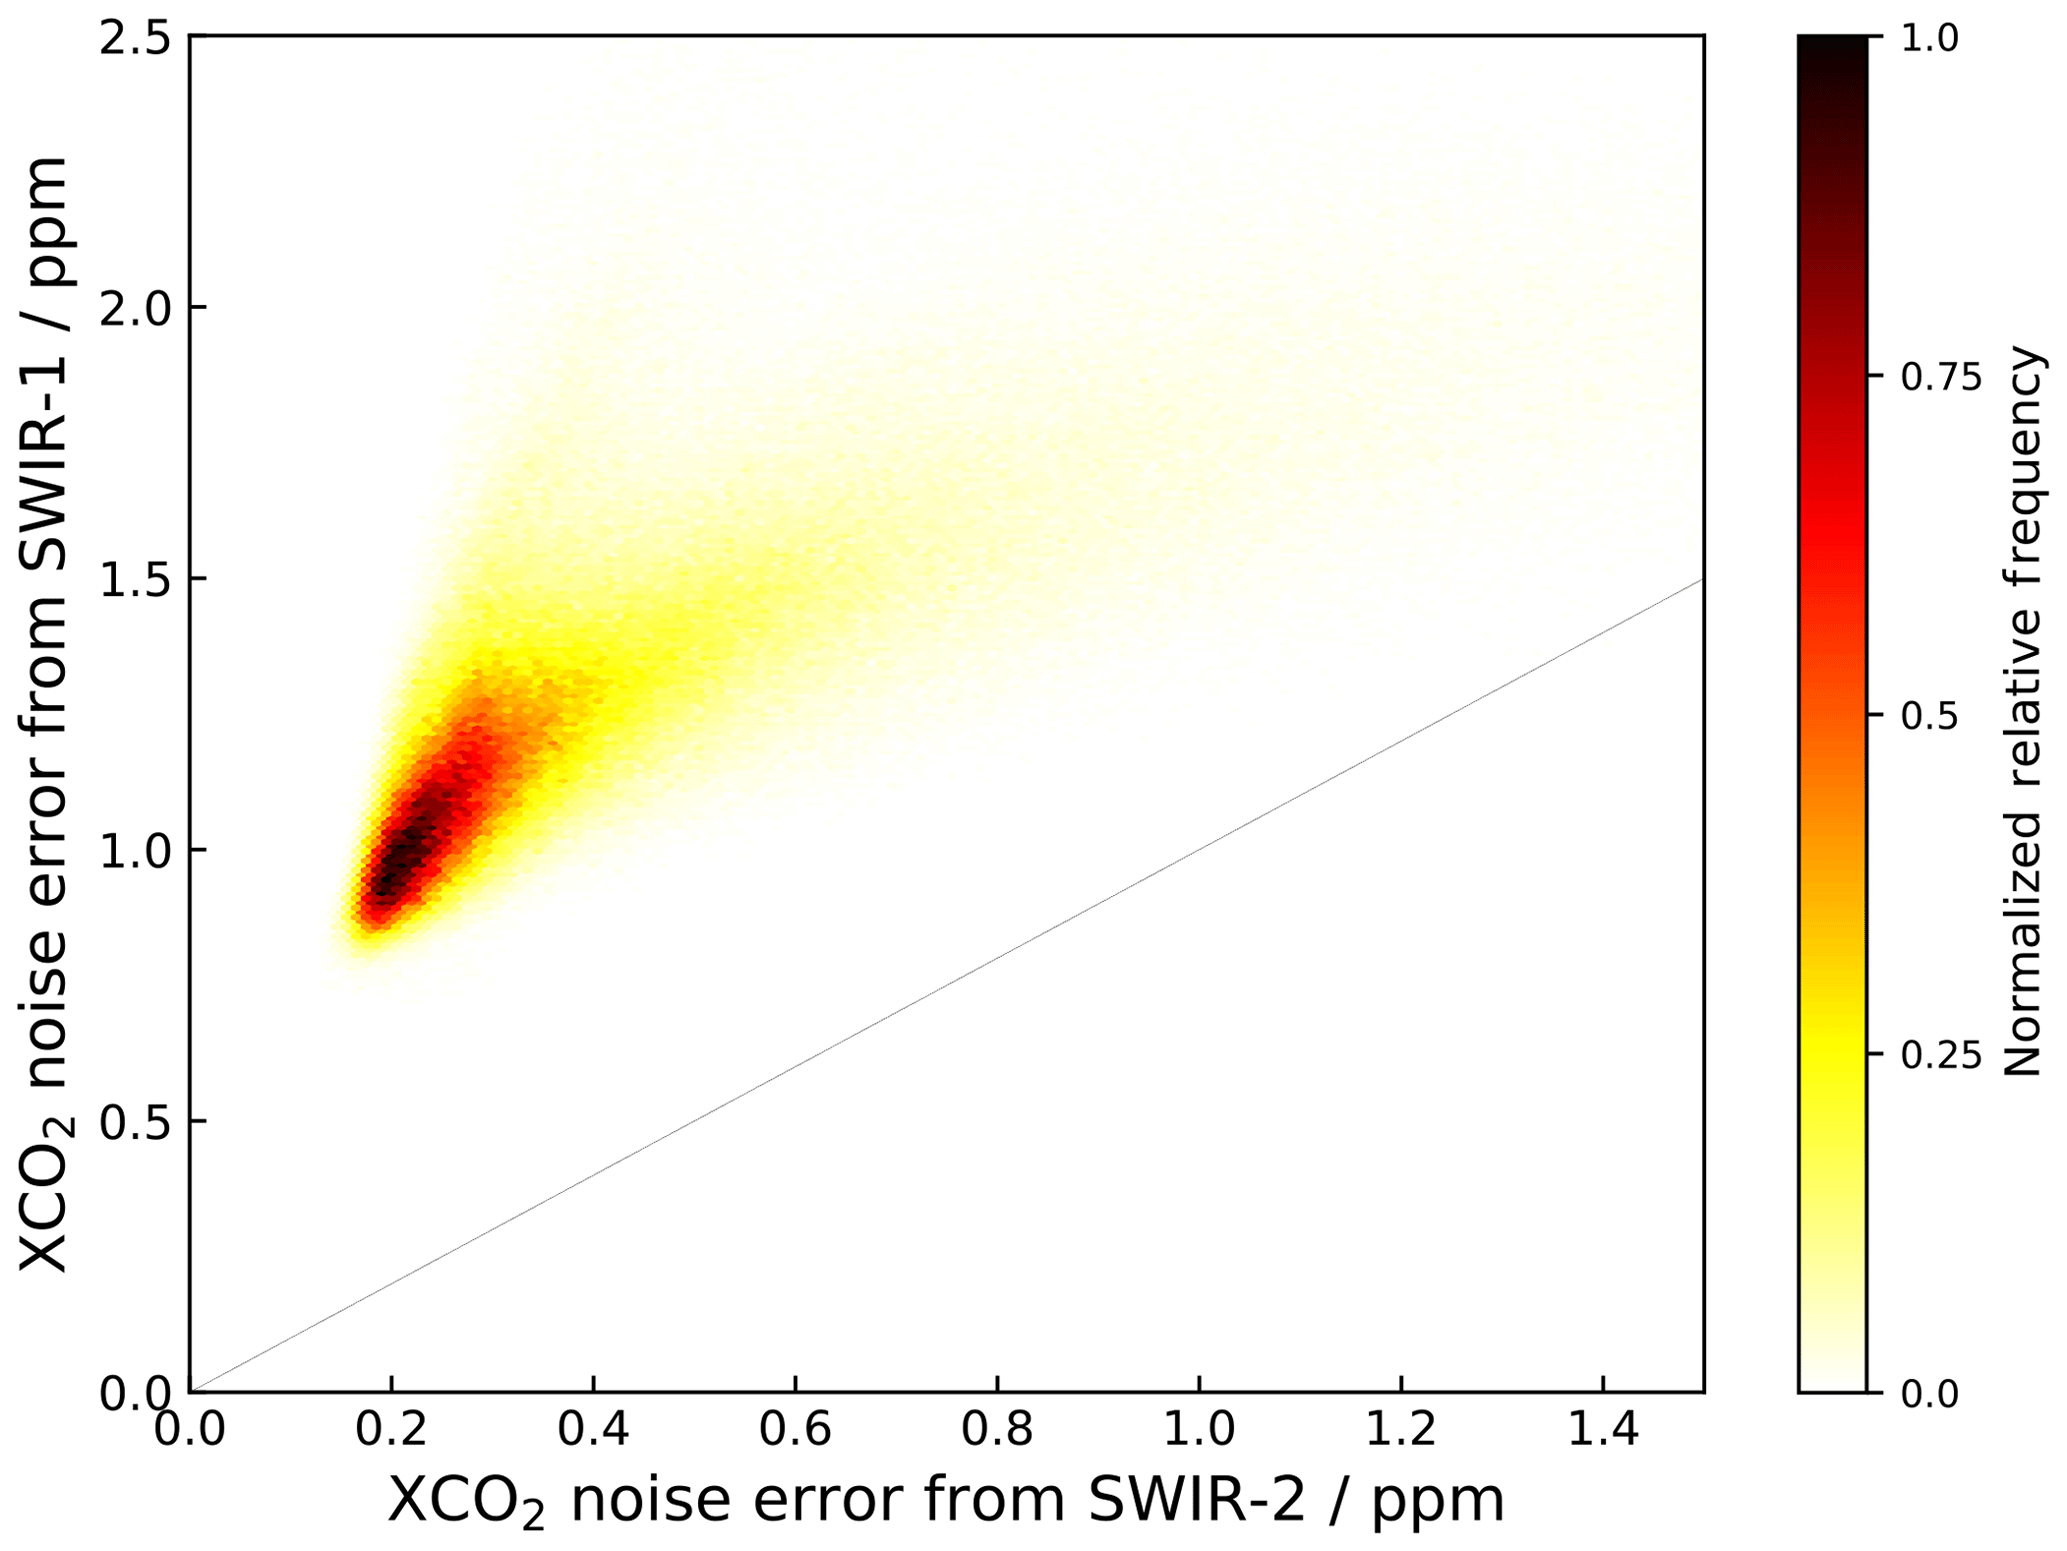
Figure 12XCO2 noise errors for SWIR-1 (ordinate) and SWIR-2 (abscissa). The grey line indicates the 1:1 correlation. Color shading encodes the relative occurrence of data points.
We have evaluated the performance of XCO2 retrievals from solar backscatter satellite observations for a hypothetical sensor that operates at moderate spectral resolution in either the SWIR-1 (around 1.6 µm) or the SWIR-2 band (around 2.0 µm). Both configurations, SWIR-1 and SWIR-2, cover tens of CO2 absorption lines, and the selected retrieval windows all cover transparent regions toward the shortwave and the longwave ends to constrain surface albedo and its spectral variation. The absorption optical depths in SWIR-1, however, are generally less than those in SWIR-2. SWIR-1, in addition to CO2, covers a CH4 absorption band; both configurations have interfering water vapor absorption. For SWIR-2, we implemented a retrieval variant of the RemoTeC algorithm that allows for estimating three parameters that characterize light scattering in terms of amount, size and height of the scattering particles. Yet, degrees of freedom for the particle retrieval amount to only 0.38 on average, which indicates that the information content on scattering effects is limited. Nevertheless, our evaluation shows that the highly constrained particle retrieval outperforms a non-scattering retrieval in SWIR-2. For SWIR-1, information content on particle scattering was found even less, and therefore the SWIR-1 configuration is based on the non-scattering assumption. Performance was evaluated by mimicking the SWIR-1 and SWIR-2 sensors using spectrally degraded GOSAT observations without further addition of noise to the spectra for the years 2009 to 2016, which allowed for comparisons with ground truth provided by TCCON and for comparisons with the native GOSAT retrievals (based on GOSAT's full spectral resolution and spectral band coverage).
Comparing the SWIR-1 and SWIR-2 retrievals to TCCON, we tried various resolving powers between 8100 and 760 for SWIR-1 and 6500 and 700 for SWIR-2, which is the range roughly in between the CarbonSat concept and hyperspectral imagers such as AVIRIS-NG. Generally, the scatter with respect to TCCON increases moderately with decreasing resolving power. For SWIR-2, we find a relatively sharp increase below a resolving power of 1000. The standard configurations that we have chosen for further analyses correspond to resolving powers of 1200 and 1600 for SWIR-1 and SWIR-2, respectively. The corresponding scatter around TCCON amounts to 3.00 and 3.28 ppm, respectively, while native GOSAT retrievals scatter by 2.43 ppm. These configurations fit on a detector with 256 spectral pixels assuming a sampling ratio of 3 per FWHM. Other evaluation metrics such as the overall global bias and the station-by-station biases do not show significantly worse performance than the native GOSAT configuration for the TCCON comparisons. Likewise, correlations with the scattering parameters are mostly small for the TCCON coincidences. The evaluation using the native GOSAT retrievals on the global scale shows differences in the range of 2 to 3 ppm, which, for SWIR-1, clearly correlate with desert areas. In contrast to the TCCON evaluation, the differences to native GOSAT for both SWIR-1 and SWIR-2 also correlate with particle scattering parameters (R typically in the range 0.2–0.3, up to 0.5). Thus, assuming that the native GOSAT retrievals are more accurate, we expect the SWIR-1 and SWIR-2 configurations to suffer from regionally correlated errors due to particle scattering. Possibly, an additional aerosol sensor, such as the one recently proposed by Hasekamp et al. (2019), may help to overcome challenges in scenes with difficult aerosol loads.
Our goal is to assess the suitability of the spectral sizing of the SWIR-1 and SWIR-2 configurations for a hypothetical sensor that maps localized CO2 sources with high spatial resolution. Our study indicates that limiting band coverage to a single SWIR band and operating at a spectral resolving power between 6000 and 1000 does not substantially degrade XCO2 retrieval performance in terms of errors that appear random in our comparisons to TCCON and to the native GOSAT retrievals. However, the SWIR-1 and SWIR-2 configurations are less capable of accounting for particle scattering effects than the configurations of the type of the native GOSAT design. The hypothetical sensor aims at discriminating plumes from background concentration fields on the scale of hundreds of meters to a few kilometers with a ground resolution on the order of 50 m × 50 m enabling enhanced contrast in the vicinity of the sources (Fig. 1). Thus, in terms of random errors, our findings are promising for using one of our SWIR-1 and SWIR-2 configurations. For the errors induced by particle scattering, the implications largely depend on whether the scattering regime can be assumed homogeneous on the respective scales of hundreds of meters to a few kilometers. Even if atmospheric scattering properties are homogeneous, ground albedo varies substantially on these scales. Surface reflectance has been shown to be a central driver in methane retrieval precision by Cusworth et al. (2019). However, ground albedo is presumably more temporally consistent than aerosols, for example, and so could be more easily defined by independent measurements.
Our study isolates the effects of spectral resolution and spectral band selection, but it postpones the assessment of whether a sufficient signal-to-noise ratio is achievable. While our evaluation reveals no clear preference for SWIR-1 or SWIR-2, we expect that the assessment of signal-to-noise ratio will favor the SWIR-2 configuration. Figure 12 shows the noise error of the XCO2 retrievals from SWIR-1 and SWIR-2. These errors are calculated by Gaussian error propagation of GOSAT's radiance noise through the RemoTeC algorithm. Propagated noise errors in SWIR-2 are on average a factor of 2.9 less than those in SWIR-1, which is largely due to SWIR-2 covering the stronger CO2 absorption bands. Thus, we expect that achieving the required signal-to-noise ratio is less demanding for SWIR-2 than for SWIR-1. Additionally, the SWIR-2 seems better suited for the construction of a cloud filter, because its CO2 bands have very different optical depths. Similar to the cloud filter currently in use for GOSAT measurements, one could retrieve XCO2 from the two SWIR-2 bands individually and filter for discrepancies. This scheme should be tested in the future. Overall, we recommend further studies to consolidate the SWIR-2 configuration in terms of instrument design and noise performance and to evaluate the relevance of scattering-induced errors for the targeted fine spatial resolution. A forthcoming study addressing these aspects of the proposed sensor is currently under preparation.
An overview of TCCON datasets used in this work is listed in Table 2.
The supplement related to this article is available online at: https://doi.org/10.5194/amt-13-731-2020-supplement.
AB and AR proposed the study and advised JW in carrying out the spectral sizing and data analysis. JW drafted the manuscript, which AB, AR and JS helped to refine. AB, AR, JS, JW and ND took part in proofreading and discussing the paper, as did JL. DF, VV, ND, IM, HO, YT, RK, TW, JN, MD, RS, MR, FH and KS provided TCCON data.
The authors declare that they have no conflict of interest.
Jonas Wilzewski's work was funded through the DLR VO-R young investigator research group “Greenhouse Gases”. We thank Luca Bugliaro for valuable feedback on our work. We also thank all TCCON members for making their data available on the TCCON data archive at: https://tccondata.org/ (last access: 12 August 2018). The Ascension Island TCCON station has been supported by the European Space Agency (ESA) under grant 3-14737 and by the German Bundesministerium für Wirtschaft und Energie (BMWi) under grant 50EE1711C. The TCCON projects for the Rikubetsu and Tsukuba sites are supported in part by the GOSAT series project. The Paris TCCON site has received funding from Sorbonne Université, the French research center CNRS, the French space agency CNES and Région Île-de-France. We acknowledge funding from ESA, DLR and the EC (projects RINGO and VERIFY) for the TCCON sites Bremen, Orléans and Białystok. Nicholas Deutscher is supported by an Australian Research Council Future Fellowship, FT180100327. KIT/IMK-ASF (Karlsruhe) and KIT/IMK-IFU (Garmisch-Partenkirchen, in cooperation with the University of Augsburg) acknowledge BMWi for funding data analysis and delivery through DLR projects (contracts 50EE1711A, B, C, D).
The article processing charges for this open-access publication were covered by a Research Centre of the Helmholtz Association.
This paper was edited by Michel Van Roozendael and reviewed by four anonymous referees.
Blumenstock, T., Hase, F., Schneider, M., García, O. E., and Sepúlveda, E.: TCCON data from Izana (ES), Release GGG2014.R1, https://doi.org/10.14291/tccon.ggg2014.izana01.r1, 2017. a
Bovensmann, H., Burrows, J. P., Buchwitz, M., Frerick, J., Noël, S., Rozanov, V. V., Chance, K. V., and Goede, A. P. H.: SCIAMACHY: Mission Objectives and Measurement Modes, J. Atmos. Sci., 56, 127–150, https://doi.org/10.1175/1520-0469(1999)056<0127:SMOAMM>2.0.CO;2, 1999. a
Bovensmann, H., Buchwitz, M., Burrows, J. P., Reuter, M., Krings, T., Gerilowski, K., Schneising, O., Heymann, J., Tretner, A., and Erzinger, J.: A remote sensing technique for global monitoring of power plant CO2 emissions from space and related applications, Atmos. Meas. Tech., 3, 781–811, https://doi.org/10.5194/amt-3-781-2010, 2010. a
Broquet, G., Bréon, F.-M., Renault, E., Buchwitz, M., Reuter, M., Bovensmann, H., Chevallier, F., Wu, L., and Ciais, P.: The potential of satellite spectro-imagery for monitoring CO2 emissions from large cities, Atmos. Meas. Tech., 11, 681–708, https://doi.org/10.5194/amt-11-681-2018, 2018. a
Buchwitz, M., Reuter, M., Schneising, O., Hewson, W., Detmers, R., Boesch, H., Hasekamp, O., Aben, I., Bovensmann, H., Burrows, J., Butz, A., Chevallier, F., Dils, B., Frankenberg, C., Heymann, J., Lichtenberg, G., Maziere, M. D., Notholt, J., Parker, R., Warneke, T., Zehner, C., Griffith, D., Deutscher, N., Kuze, A., Suto, H., and Wunch, D.: Global satellite observations of column-averaged carbon dioxide and methane: The GHG-CCI XCO2 and XCH4 CRDP3 data set, Remote Sens. Environ., 203, 276–295, https://doi.org/10.1016/j.rse.2016.12.027, 2017. a, b, c
Burrows, J. P., Hölzle, E., Goede, A. P., Visser, H., and Fricke, W.: SCIAMACHY-scanning imaging absorption spectrometer for atmospheric chartography, Acta Astronaut., 35, 445–451, https://doi.org/10.1016/0094-5765(94)00278-T, 1995. a
Butz, A., Hasekamp, O. P., and Aben, I.: Retrievals of atmospheric CO2 from simulated space-borne measurements of backscattered near-infrared sunlight: accounting for aerosol effects, Appl. Optics, 48, 3322–3336, https://doi.org/10.1364/AO.48.003322, 2009. a
Butz, A., Guerlet, S., Hasekamp, O., Schepers, D., Galli, A., Aben, I., Frankenberg, C., Hartmann, J.-M., Tran, H., Kuze, A., Keppel-Aleks, G., Toon, G., Wunch, D., Wennberg, P., Deutscher, N., Griffith, D., Macatangay, R., Messerschmidt, J., Notholt, J., and Warneke, T.: Toward accurate CO2 and CH4 observations from GOSAT, Geophys. Res. Lett., 38, L14812, https://doi.org/10.1029/2011GL047888, 2011. a, b
Butz, A., Galli, A., Hasekamp, O., Landgraf, J., Tol, P., and Aben, I.: TROPOMI aboard Sentinel-5 Precursor: Prospective performance of CH4 retrievals for aerosol and cirrus loaded atmospheres, Remote Sens. Environ., 120, 267–276, https://doi.org/10.1016/j.rse.2011.05.030, 2012. a
Butz, A., Guerlet, S., Hasekamp, O. P., Kuze, A., and Suto, H.: Using ocean-glint scattered sunlight as a diagnostic tool for satellite remote sensing of greenhouse gases, Atmos. Meas. Tech., 6, 2509–2520, https://doi.org/10.5194/amt-6-2509-2013, 2013. a, b, c
Chatterjee, A., Gierach, M. M., Sutton, A. J., Feely, R. A., Crisp, D., Eldering, A., Gunson, M. R., O'Dell, C. W., Stephens, B. B., and Schimel, D. S.: Influence of El Niño on atmospheric CO2 over the tropical Pacific Ocean: Findings from NASA's OCO-2 mission, Science, 358, eaam5776, https://doi.org/10.1126/science.aam5776, 2017. a
Crisp, D., Miller, C. E., and DeCola, P. L.: NASA Orbiting Carbon Observatory: measuring the column averaged carbon dioxide mole fraction from space, J. Appl. Remote Sens., 2, 23508, https://doi.org/10.1117/1.2898457, 2008. a
Crisp, D., Pollock, H. R., Rosenberg, R., Chapsky, L., Lee, R. A. M., Oyafuso, F. A., Frankenberg, C., O'Dell, C. W., Bruegge, C. J., Doran, G. B., Eldering, A., Fisher, B. M., Fu, D., Gunson, M. R., Mandrake, L., Osterman, G. B., Schwandner, F. M., Sun, K., Taylor, T. E., Wennberg, P. O., and Wunch, D.: The on-orbit performance of the Orbiting Carbon Observatory-2 (OCO-2) instrument and its radiometrically calibrated products, Atmos. Meas. Tech., 10, 59–81, https://doi.org/10.5194/amt-10-59-2017, 2017. a
Cusworth, D. H., Jacob, D. J., Varon, D. J., Chan Miller, C., Liu, X., Chance, K., Thorpe, A. K., Duren, R. M., Miller, C. E., Thompson, D. R., Frankenberg, C., Guanter, L., and Randles, C. A.: Potential of next-generation imaging spectrometers to detect and quantify methane point sources from space, Atmos. Meas. Tech., 12, 5655–5668, https://doi.org/10.5194/amt-12-5655-2019, 2019. a
De Mazière, M., Sha, M. K., Desmet, F., Hermans, C., Scolas, F., Kumps, N., Metzger, J.-M., Duflot, V., and Cammas, J.-P.: TCCON data from Réunion Island (RE), Release GGG2014.R1, https://doi.org/10.14291/tccon.ggg2014.reunion01.r1, 2017. a
Dennison, P. E., Thorpe, A. K., Pardyjak, E. R., Roberts, D. A., Qi, Y., Green, R. O., Bradley, E. S., and Funk, C. C.: High spatial resolution mapping of elevated atmospheric carbon dioxide using airborne imaging spectroscopy: Radiative transfer modeling and power plant plume detection, Remote Sens. Environ., 139, 116–129, https://doi.org/10.1016/j.rse.2013.08.001, 2013. a, b
Deutscher, N. M., Notholt, J., Messerschmidt, J., Weinzierl, C., Warneke, T., Petri, C., and Grupe, P.: TCCON data from Bialystok (PL), Release GGG2014.R1, https://doi.org/10.14291/tccon.ggg2014.bialystok01.r1/1183984, 2015. a
Dubey, M. K., Lindenmaier, R., Henderson, B. G., Green, D., Allen, N. T., Roehl, C. M., Blavier, J.-F., Butterfield, Z. T., Love, S., Hamelmann, J. D., and Wunch, D.: TCCON data from Four Corners (US), Release GGG2014.R0, https://doi.org/10.14291/tccon.ggg2014.fourcorners01.r0/1149272, 2014. a
Eldering, A., Wennberg, P. O., Crisp, D., Schimel, D. S., Gunson, M. R., Chatterjee, A., Liu, J., Schwandner, F. M., Sun, Y., O'Dell, C. W., Frankenberg, C., Taylor, T., Fisher, B., Osterman, G. B., Wunch, D., Hakkarainen, J., Tamminen, J., and Weir, B.: The Orbiting Carbon Observatory-2 early science investigations of regional carbon dioxide fluxes, Science, 358, eaam5745, https://doi.org/10.1126/science.aam5745, 2017. a
Feist, D. G., Arnold, S. G., John, N., and Geibel, M. C.: TCCON data from Ascension Island (SH), Release GGG2014.R0, https://doi.org/10.14291/tccon.ggg2014.ascension01.r0/1149285, 2014. a
Galli, A., Guerlet, S., Butz, A., Aben, I., Suto, H., Kuze, A., Deutscher, N. M., Notholt, J., Wunch, D., Wennberg, P. O., Griffith, D. W. T., Hasekamp, O., and Landgraf, J.: The impact of spectral resolution on satellite retrieval accuracy of CO2 and CH4, Atmos. Meas. Tech., 7, 1105–1119, https://doi.org/10.5194/amt-7-1105-2014, 2014. a, b, c
Goo, T.-Y., Oh, Y.-S., and Velazco, V. A.: TCCON data from Anmeyondo (KR), Release GGG2014.R0, https://doi.org/10.14291/tccon.ggg2014.anmeyondo01.r0/1149284, 2014. a
Griffith, D. W., Deutscher, N. M., Velazco, V. A., Wennberg, P. O., Yavin, Y., Keppel-Aleks, G., Washenfelder, R. A., Toon, G. C., Blavier, J.-F., Paton-Walsh, C., Jones, N. B., Kettlewell, G. C., Connor, B. J., Macatangay, R. C., Roehl, C., Ryczek, M., Glowacki, J., Culgan, T., and Bryant, G. W.: TCCON data from Darwin (AU), Release GGG2014.R0, https://doi.org/10.14291/tccon.ggg2014.darwin01.r0/1149290, 2014a. a
Griffith, D. W., Velazco, V. A., Deutscher, N. M., Paton-Walsh, C., Jones, N. B., Wilson, S. R., Macatangay, R. C., Kettlewell, G. C., Buchholz, R. R., and Riggenbach, M. O.: TCCON data from Wollongong (AU), Release GGG2014.R0, https://doi.org/10.14291/tccon.ggg2014.wollongong01.r0/1149291, 2014b. a
Guerlet, S., Basu, S., Butz, A., Krol, M., Hahne, P., Houweling, S., Hasekamp, O. P., and Aben, I.: Reduced carbon uptake during the 2010 Northern Hemisphere summer from GOSAT, Geophys. Res. Lett., 40, 2378–2383, https://doi.org/10.1002/grl.50402, 2013a. a
Guerlet, S., Butz, A., Schepers, D., Basu, S., Hasekamp, O. P., Kuze, A., Yokota, T., Blavier, J. F., Deutscher, N. M., Griffith, D. W., Hase, F., Kyro, E., Morino, I., Sherlock, V., Sussmann, R., Galli, A., and Aben, I.: Impact of aerosol and thin cirrus on retrieving and validating XCO2 from GOSAT shortwave infrared measurements, J. Geophys. Res.-Atmos., 118, 4887–4905, https://doi.org/10.1002/jgrd.50332, 2013b. a, b
Hakkarainen, J., Ialongo, I., and Tamminen, J.: Direct space-based observations of anthropogenic CO2 emission areas from OCO2, Geophys. Res. Lett., 43, 400–411, https://doi.org/10.1002/2016GL070885, 2016. a
Hase, F., Blumenstock, T., Dohe, S., Groß, J., and Kiel, M.: TCCON data from Karlsruhe (DE), Release GGG2014.R1, https://doi.org/10.14291/tccon.ggg2014.karlsruhe01.r1/1182416, 2015. a
Hasekamp, O. P., Fu, G., Rusli, S. P., Wu, L., Noia, A. D., aan de Brugh, J., Landgraf, J., Smit, J. M., Rietjens, J., and van Amerongen, A.: Aerosol measurements by SPEXone on the NASA PACE mission: expected retrieval capabilities, J. Quant. Spectrosc. Ra., 227, 170–184, https://doi.org/10.1016/j.jqsrt.2019.02.006, 2019. a
Hu, H., Landgraf, J., Detmers, R., Borsdorff, T., Aan de Brugh, J., Aben, I., Butz, A., and Hasekamp, O.: Toward Global Mapping of Methane With TROPOMI: First Results and Intersatellite Comparison to GOSAT, Geophys. Res. Lett., 45, 3682–3689, https://doi.org/10.1002/2018GL077259, 2018. a
Iraci, L. T., Podolske, J. R., Hillyard, P. W., Roehl, C., Wennberg, P. O., Blavier, J.-F., Landeros, J., Allen, N., Wunch, D., Zavaleta, J., Quigley, E., Osterman, G. B., Albertson, R., Dunwoody, K., and Boyden, H.: TCCON data from Edwards (US), Release GGG2014.R1, https://doi.org/10.14291/tccon.ggg2014.edwards01.r1/1255068, 2016a. a
Iraci, L. T., Podolske, J. R., Hillyard, P. W., Roehl, C., Wennberg, P. O., Blavier, J.-F., Landeros, J., Allen, N., Wunch, D., Zavaleta, J., Quigley, E., Osterman, G. B., Barrow, E., and Barney, J.: TCCON data from Indianapolis (US), Release GGG2014.R1, https://doi.org/10.14291/tccon.ggg2014.indianapolis01.r1/1330094, 2016b. a
Kawakami, S., Ohyama, H., Arai, K., Okumura, H., Taura, C., Fukamachi, T., and Sakashita, M.: TCCON data from Saga (JP), Release GGG2014.R0, https://doi.org/10.14291/tccon.ggg2014.saga01.r0/1149283, 2014. a
Kiel, M., O'Dell, C. W., Fisher, B., Eldering, A., Nassar, R., MacDonald, C. G., and Wennberg, P. O.: How bias correction goes wrong: measurement of XCO2 affected by erroneous surface pressure estimates, Atmos. Meas. Tech., 12, 2241–2259, https://doi.org/10.5194/amt-12-2241-2019, 2019. a
Kivi, R., Heikkinen, P., and Kyrö, E.: TCCON data from Sodankylä (FI), Release GGG2014.R0, https://doi.org/10.14291/tccon.ggg2014.sodankyla01.r0/1149280, 2014. a
Kort, E. A., Frankenberg, C., Miller, C. E., and Oda, T.: Space-based observations of megacity carbon dioxide, Geophys. Res. Lett., 39, L17806, https://doi.org/10.1029/2012GL052738, 2012. a
Krings, T., Neininger, B., Gerilowski, K., Krautwurst, S., Buchwitz, M., Burrows, J. P., Lindemann, C., Ruhtz, T., Schüttemeyer, D., and Bovensmann, H.: Airborne remote sensing and in situ measurements of atmospheric CO2 to quantify point source emissions, Atmos. Meas. Tech., 11, 721–739, https://doi.org/10.5194/amt-11-721-2018, 2018. a
Kuze, A., Suto, H., Nakajima, M., and Hamazaki, T.: Thermal and near infrared sensor for carbon observation Fourier-transform spectrometer on the Greenhouse Gases Observing Satellite for greenhouse gases monitoring, Appl. Optics, 48, 6716, https://doi.org/10.1364/AO.48.006716, 2009. a
Kuze, A., Suto, H., Shiomi, K., Kawakami, S., Tanaka, M., Ueda, Y., Deguchi, A., Yoshida, J., Yamamoto, Y., Kataoka, F., Taylor, T. E., and Buijs, H. L.: Update on GOSAT TANSO-FTS performance, operations, and data products after more than 6 years in space, Atmos. Meas. Tech., 9, 2445–2461, https://doi.org/10.5194/amt-9-2445-2016, 2016. a
Lindenmaier, R., Dubey, M. K., Henderson, B. G., Butterfield, Z. T., Herman, J. R., Rahn, T., and Lee, S.-H.: Multiscale observations of CO2, 13CO2, and pollutants at Four Corners for emission verification and attribution, P. Natl. Acad. Sci. USA, 111, 8386–8391, https://doi.org/10.1073/pnas.1321883111, 2014. a
Liu, C., Wang, W., and Sun, Y.: TCCON data from Hefei (PRC), Release GGG2014.R0, https://doi.org/10.14291/tccon.ggg2014.hefei01.r0, 2018. a
Liu, J., Bowman, K. W., Schimel, D. S., Parazoo, N. C., Jiang, Z., Lee, M., Bloom, A. A., Wunch, D., Frankenberg, C., Sun, Y., O'Dell, C. W., Gurney, K. R., Menemenlis, D., Gierach, M., Crisp, D., and Eldering, A.: Contrasting carbon cycle responses of the tropical continents to the 2015–2016 El Niño, Science, 358, eaam5690, https://doi.org/10.1126/science.aam5690, 2017. a
Messerschmidt, J., Geibel, M. C., Blumenstock, T., Chen, H., Deutscher, N. M., Engel, A., Feist, D. G., Gerbig, C., Gisi, M., Hase, F., Katrynski, K., Kolle, O., Lavrič, J. V., Notholt, J., Palm, M., Ramonet, M., Rettinger, M., Schmidt, M., Sussmann, R., Toon, G. C., Truong, F., Warneke, T., Wennberg, P. O., Wunch, D., and Xueref-Remy, I.: Calibration of TCCON column-averaged CO2: the first aircraft campaign over European TCCON sites, Atmos. Chem. Phys., 11, 10765–10777, https://doi.org/10.5194/acp-11-10765-2011, 2011. a
Morino, I., Matsuzaki, T., and Horikawa, M.: TCCON data from Tsukuba (JP), 125HR, Release GGG2014.R2, https://doi.org/10.14291/tccon.ggg2014.tsukuba02.r2, 2018a. a
Morino, I., Yokozeki, N., Matsuzaki, T., and Horikawa, M.: TCCON data from Rikubetsu (JP), Release GGG2014.R2, https://doi.org/10.14291/tccon.ggg2014.rikubetsu01.r2, 2018b. a
Nassar, R., Hill, T. G., McLinden, C. A., Wunch, D., Jones, D. B. A., and Crisp, D.: Quantifying CO2 emissions from individual power plants from space, Geophys. Res. Lett., 44, 10045–10053, https://doi.org/10.1002/2017GL074702, 2017. a
Notholt, J., Petri, C., Warneke, T., Deutscher, N. M., Palm, M., Buschmann, M., Weinzierl, C., Macatangay, R. C., and Grupe, P.: TCCON data from Bremen (DE), Release GGG2014.R0, https://doi.org/10.14291/tccon.ggg2014.bremen01.r0/1149275, 2014. a
Parazoo, N. C., Bowman, K., Frankenberg, C., Lee, J. E., Fisher, J. B., Worden, J., Jones, D. B., Berry, J., Collatz, G. J., Baker, I. T., Jung, M., Liu, J., Osterman, G., O'Dell, C., Sparks, A., Butz, A., Guerlet, S., Yoshida, Y., Chen, H., and Gerbig, C.: Interpreting seasonal changes in the carbon balance of southern Amazonia using measurements of XCO2 and chlorophyll fluorescence from GOSAT, Geophys. Res. Lett., 40, 2829–2833, https://doi.org/10.1002/grl.50452, 2013. a
Pillai, D., Buchwitz, M., Gerbig, C., Koch, T., Reuter, M., Bovensmann, H., Marshall, J., and Burrows, J. P.: Tracking city CO2 emissions from space using a high-resolution inverse modelling approach: a case study for Berlin, Germany, Atmos. Chem. Phys., 16, 9591–9610, https://doi.org/10.5194/acp-16-9591-2016, 2016. a
Reuter, M., Buchwitz, M., Schneising, O., Heymann, J., Bovensmann, H., and Burrows, J. P.: A method for improved SCIAMACHY CO2 retrieval in the presence of optically thin clouds, Atmos. Meas. Tech., 3, 209–232, https://doi.org/10.5194/amt-3-209-2010, 2010. a
Reuter, M., Buchwitz, M., Schneising, O., Krautwurst, S., O'Dell, C. W., Richter, A., Bovensmann, H., and Burrows, J. P.: Towards monitoring localized CO2 emissions from space: co-located regional CO2 and NO2 enhancements observed by the OCO-2 and S5P satellites, Atmos. Chem. Phys., 19, 9371–9383, https://doi.org/10.5194/acp-19-9371-2019, 2019. a
Schneising, O., Heymann, J., Buchwitz, M., Reuter, M., Bovensmann, H., and Burrows, J. P.: Anthropogenic carbon dioxide source areas observed from space: assessment of regional enhancements and trends, Atmos. Chem. Phys., 13, 2445–2454, https://doi.org/10.5194/acp-13-2445-2013, 2013. a
Schwandner, F. M., Gunson, M. R., Miller, C. E., Carn, S. A., Eldering, A., Krings, T., Verhulst, K. R., Schimel, D. S., Nguyen, H. M., Crisp, D., O'Dell, C. W., Osterman, G. B., Iraci, L. T., and Podolske, J. R.: Spaceborne detection of localized carbon dioxide sources, Science, 358, eaam5782, https://doi.org/10.1126/science.aam5782, 2017. a
Sherlock, V., Connor, B., Robinson, J., Shiona, H., Smale, D., and Pollard, D. F.: TCCON data from Lauder (NZ), 120HR, Release GGG2014.R0, https://doi.org/10.14291/tccon.ggg2014.lauder01.r0/1149293, 2014a. a
Sherlock, V., Connor, B., Robinson, J., Shiona, H., Smale, D., and Pollard, D. F.: TCCON data from Lauder (NZ), 125HR, Release GGG2014.R0, https://doi.org/10.14291/tccon.ggg2014.lauder02.r0/1149298, 2014b. a
Sierk, B., Bézy, J.-L., Löscher, A., and Meijer, Y.: The European CO2 Monitoring Mission: Observing anthropogenic greenhouse gas emissions from space, in: International Conference on Space Optics – ICSO 2018, edited by: Sodnik, Z., Karafolas, N., and Cugny, B., 11180, 237–250, International Society for Optics and Photonics, SPIE, https://doi.org/10.1117/12.2535941, 2019. a
Sussmann, R. and Rettinger, M.: TCCON data from Garmisch (DE), Release GGG2014.R2, https://doi.org/10.14291/tccon.ggg2014.garmisch01.r2, 2018a. a
Sussmann, R. and Rettinger, M.: TCCON data from Zugspitze (DE), Release GGG2014.R1, https://doi.org/10.14291/tccon.ggg2014.zugspitze01.r1, 2018b. a
Té, Y., Jeseck, P., and Janssen, C.: TCCON data from Paris (FR), Release GGG2014.R0, https://doi.org/10.14291/tccon.ggg2014.paris01.r0/1149279, 2014. a
Thompson, D. R., Thorpe, A. K., Frankenberg, C., Green, R. O., Duren, R., Guanter, L., Hollstein, A., Middleton, E., Ong, L., and Ungar, S.: Space-based remote imaging spectroscopy of the Aliso Canyon CH4 superemitter, Geophys. Res. Lett., 43, 6571–6578, https://doi.org/10.1002/2016GL069079, 2016. a
Thorpe, A. K., Frankenberg, C., Aubrey, A. D., Roberts, D. A., Nottrott, A. A., Rahn, T. A., Sauer, J. A., Dubey, M. K., Costigan, K. R., Arata, C., Steffke, A. M., Hills, S., Haselwimmer, C., Charlesworth, D., Funk, C. C., Green, R. O., Lundeen, S. R., Boardman, J. W., Eastwood, M. L., Sarture, C. M., Nolte, S. H., Mccubbin, I. B., Thompson, D. R., and McFadden, J. P.: Mapping methane concentrations from a controlled release experiment using the next generation airborne visible/infrared imaging spectrometer (AVIRIS-NG), Remote Sens. Environ., 179, 104–115, https://doi.org/10.1016/j.rse.2016.03.032, 2016a. a, b
Thorpe, A. K., Frankenberg, C., Green, R. O., Thompson, D. R., Aubrey, A. D., Mouroulis, P., Eastwood, M. L., and Matheou, G.: The Airborne Methane Plume Spectrometer (AMPS): Quantitative imaging of methane plumes in real time, in: IEEE Aerospace Conference Proceedings, vol. 2016, June, https://doi.org/10.1109/AERO.2016.7500756, 2016b. a, b
Warneke, T., Messerschmidt, J., Notholt, J., Weinzierl, C., Deutscher, N. M., Petri, C., and Grupe, P.: TCCON data from Orléans (FR), Release GGG2014.R0, https://doi.org/10.14291/tccon.ggg2014.orleans01.r0/1149276, 2014. a
Wennberg, P. O., Wunch, D., Roehl, C. M., Blavier, J.-F., Toon, G. C., and Allen, N. T.: TCCON data from Caltech (US), Release GGG2014.R1, https://doi.org/10.14291/tccon.ggg2014.pasadena01.r1/1182415, 2015. a
Wennberg, P. O., Roehl, C. M., Blavier, J.-F., Wunch, D., and Allen, N. T.: TCCON data from Jet Propulsion Laboratory (US), 2011, Release GGG2014.R1, https://doi.org/10.14291/tccon.ggg2014.jpl02.r1/1330096, 2016a. a
Wennberg, P. O., Wunch, D., Roehl, C. M., Blavier, J.-F., Toon, G. C., and Allen, N. T.: TCCON data from Lamont (US), Release GGG2014.R1, https://doi.org/10.14291/tccon.ggg2014.lamont01.r1/1255070, 2016b. a
Wennberg, P. O., Roehl, C. M., Wunch, D., Toon, G. C., Blavier, J.-F., Washenfelder, R., Keppel-Aleks, G., Allen, N. T., and Ayers, J.: TCCON data from Park Falls (US), Release GGG2014.R1, https://doi.org/10.14291/tccon.ggg2014.parkfalls01.r1, 2017. a
Wu, L., Hasekamp, O., Hu, H., Landgraf, J., Butz, A., aan de Brugh, J., Aben, I., Pollard, D. F., Griffith, D. W. T., Feist, D. G., Koshelev, D., Hase, F., Toon, G. C., Ohyama, H., Morino, I., Notholt, J., Shiomi, K., Iraci, L., Schneider, M., de Mazière, M., Sussmann, R., Kivi, R., Warneke, T., Goo, T.-Y., and Té, Y.: Carbon dioxide retrieval from OCO-2 satellite observations using the RemoTeC algorithm and validation with TCCON measurements, Atmos. Meas. Tech., 11, 3111–3130, https://doi.org/10.5194/amt-11-3111-2018, 2018. a
Wu, L., aan de Brugh, J., Meijer, Y., Sierk, B., Hasekamp, O., Butz, A., and Landgraf, J.: XCO2 observations using satellite measurements with moderate spectral resolution: Investigation using GOSAT and OCO-2 measurements, Atmos. Meas. Tech. Discuss., https://doi.org/10.5194/amt-2019-232, in review, 2019a. a, b
Wu, L., Hasekamp, O., Hu, H., aan de Brugh, J., Landgraf, J., Butz, A., and Aben, I.: Full-physics carbon dioxide retrievals from the Orbiting Carbon Observatory-2 (OCO-2) satellite by only using the 2.06 µm band, Atmos. Meas. Tech., 12, 6049–6058, https://doi.org/10.5194/amt-12-6049-2019, 2019b. a
Wunch, D., Toon, G. C., Blavier, J.-F. L., Washenfelder, R. A., Notholt, J., Connor, B. J., Griffith, D. W. T., Sherlock, V., and Wennberg, P. O.: The Total Carbon Column Observing Network, Philos. T. R. Soc. Lond., 369, 2087–2112, https://doi.org/10.1098/rsta.2010.0240, 2011a. a
Wunch, D., Wennberg, P. O., Toon, G. C., Connor, B. J., Fisher, B., Osterman, G. B., Frankenberg, C., Mandrake, L., O'Dell, C., Ahonen, P., Biraud, S. C., Castano, R., Cressie, N., Crisp, D., Deutscher, N. M., Eldering, A., Fisher, M. L., Griffith, D. W. T., Gunson, M., Heikkinen, P., Keppel-Aleks, G., Kyrö, E., Lindenmaier, R., Macatangay, R., Mendonca, J., Messerschmidt, J., Miller, C. E., Morino, I., Notholt, J., Oyafuso, F. A., Rettinger, M., Robinson, J., Roehl, C. M., Salawitch, R. J., Sherlock, V., Strong, K., Sussmann, R., Tanaka, T., Thompson, D. R., Uchino, O., Warneke, T., and Wofsy, S. C.: A method for evaluating bias in global measurements of CO2 total columns from space, Atmos. Chem. Phys., 11, 12317–12337, https://doi.org/10.5194/acp-11-12317-2011, 2011b. a
Yang, D., Liu, Y., Cai, Z., Chen, X., Yao, L., and Lu, D.: First Global Carbon Dioxide Maps Produced from TanSat Measurements, Adv. Atmos. Sci., 35, 621–623, https://doi.org/10.1007/s00376-018-7312-6, 2018. a