the Creative Commons Attribution 4.0 License.
the Creative Commons Attribution 4.0 License.
An improved air mass factor calculation for nitrogen dioxide measurements from the Global Ozone Monitoring Experiment-2 (GOME-2)
Song Liu
Pieter Valks
Gaia Pinardi
Athina Argyrouli
Ronny Lutz
L. Gijsbert Tilstra
Vincent Huijnen
François Hendrick
Michel Van Roozendael
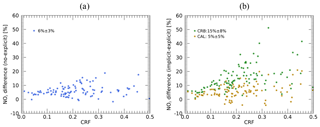
An improved tropospheric nitrogen dioxide (NO2) retrieval algorithm from the Global Ozone Monitoring Experiment-2 (GOME-2) instrument based on air mass factor (AMF) calculations performed with more realistic model parameters is presented. The viewing angle dependency of surface albedo is taken into account by improving the GOME-2 Lambertian-equivalent reflectivity (LER) climatology with a directionally dependent LER (DLER) dataset over land and an ocean surface albedo parameterisation over water. A priori NO2 profiles with higher spatial and temporal resolutions are obtained from the IFS (CB05BASCOE) chemistry transport model based on recent emission inventories. A more realistic cloud treatment is provided by a clouds-as-layers (CAL) approach, which treats the clouds as uniform layers of water droplets, instead of the current clouds-as-reflecting-boundaries (CRB) model, which assumes that the clouds are Lambertian reflectors. On average, improvements in the AMF calculation affect the tropospheric NO2 columns by ±15 % in winter and ±5 % in summer over largely polluted regions. In addition, the impact of aerosols on our tropospheric NO2 retrieval is investigated by comparing the concurrent retrievals based on ground-based aerosol measurements (explicit aerosol correction) and the aerosol-induced cloud parameters (implicit aerosol correction). Compared with the implicit aerosol correction utilising the CRB cloud parameters, the use of the CAL approach reduces the AMF errors by more than 10 %. Finally, to evaluate the improved GOME-2 tropospheric NO2 columns, a validation is performed using ground-based multi-axis differential optical absorption spectroscopy (MAXDOAS) measurements at different BIRA-IASB stations. At the suburban Xianghe station, the improved tropospheric NO2 dataset shows better agreement with coincident ground-based measurements with a correlation coefficient of 0.94.
- Article
(34694 KB) - Full-text XML
- Companion paper
- BibTeX
- EndNote
Tropospheric nitrogen dioxide (NO2) is an important air pollutant that harms the human respiratory system, even over short exposure periods (Gamble et al., 1987; Kampa and Castanas, 2008), and contributes to the formation of tropospheric ozone, urban haze, and acid rain (Charlson and Ahlquist, 1969; Crutzen, 1970; McCormick, 2013). Besides natural sources of nitrogen dioxide such as soil emissions and lightning, the combustion-related emission sources from anthropogenic activities like fossil fuel consumption, car traffic, and biomass burning produce substantial amounts of nitrogen oxides ().
Satellite measurements from the Global Ozone Monitoring Experiment (GOME) (Burrows et al., 1999), the SCanning Imaging Absorption SpectroMeter for Atmospheric CHartographY (SCIAMACHY) (Bovensmann et al., 1999), the Ozone Monitoring Instrument (OMI) (Levelt et al., 2006), and the Global Ozone Monitoring Experiment-2 (GOME-2) (Callies et al., 2000; Munro et al., 2016) have produced global NO2 measurements on long timescales. New-generation instruments like the TROPOspheric Monitoring Instrument (TROPOMI) (Veefkind et al., 2012) aboard the Sentinel-5 Precursor satellite and geostationary missions such as the Sentinel-4 (Ingmann et al., 2012) will continue this record and deliver NO2 datasets with a high spatial resolution and short revisit time.
The GOME-2 instrument, which is the main focus of this study, is included on a series of MetOp satellites as part of the EUMETSAT Polar System (EPS). The first GOME-2 was launched in October 2006 aboard the MetOp-A satellite, and a second GOME-2 was launched in September 2012 aboard MetOp-B. This dataset will be further extended by a third GOME-2 aboard the MetOp-C satellite, which was launched in December 2018. GOME-2 is a nadir-scanning UV–Vis spectrometer that measures the solar irradiance and Earth’s backscattered radiance with four main optical channels: this covers the spectral range between 240 and 790 nm with a spectral resolution between 0.26 and 0.51 nm. The default swath width of GOME-2 is 1920 km, enabling a global coverage in ∼1.5 d. The along-track dimension of the instantaneous field of view is ∼40 km, whereas the across-track dimension depends on the integration time used for each channel. For the 1920 km swath, the maximum ground pixel size is 80 km×40 km in the forward scan, which remains almost constant over the full swath width. In a tandem operation between MetOp-A and MetOp-B from July 2013 onwards, a decreased swath of 960 km and an increased spatial resolution of 40 km×40 km are employed by GOME-2/MetOp-A (Munro et al., 2016). GOME-2 provides morning observations of NO2 at about 09:30 LT (local time), which complements early afternoon measurements e.g. from OMI or TROPOMI. The GOME-2 NO2 measurements have been widely used in trend studies, satellite dataset intercomparisons, and NO2 emission estimations (e.g. Mijling et al., 2013; Hilboll et al., 2013, 2017; Krotkov et al., 2017; Irie et al., 2012; Gu et al., 2014; Miyazaki et al., 2017; Ding et al., 2017).
The NO2 retrieval algorithm for the GOME-2 instrument contains three steps: (1) the spectral fitting of the slant column (concentration along the effective light path) using the differential optical absorption spectroscopy (DOAS) method (Platt and Stutz, 2008) from the measured GOME-2 (ir)radiances, (2) the separation of stratospheric and tropospheric contributions using a modified reference sector method, (3) and the conversion of the tropospheric slant column to a vertical column using a tropospheric air mass factor (AMF) calculation. The quality of GOME-2 NO2 measurements is strongly related to the calculation of the AMF, which is determined by a radiative transfer model, depending on a set of model parameters, such as viewing geometry, surface albedo, vertical distribution of NO2, cloud, and aerosol. The model parameters, generally taken from external databases, contribute substantially to the overall AMF uncertainty, which is estimated to be in the range of 30 %–40 % (Lorente et al., 2017).
The surface is normally assumed to be Lambertian with an isotropic diffuse reflection independent of the viewing and illumination geometry in the NO2 retrieval (e.g. Boersma et al., 2011; van Geffen et al., 2019; Liu et al., 2019b). However, due to the occurrences of retroreflection and shading effects (mainly over rough surfaces such as vegetation) and specular reflection (mainly over smooth surfaces like water), the Lambertian assumption is not always fulfilled. To account for the geometry-dependent surface scattering characteristics, the surface bidirectional reflectance distribution function (BRDF) (Nicodemus et al., 1992) has been considered in previous studies (e.g. Zhou et al., 2010; Lin et al., 2014, 2015; Noguchi et al., 2014; Vasilkov et al., 2017; Lorente et al., 2018; Laughner et al., 2018; Qin et al., 2019), mainly based on measurements from the MODerate resolution Imaging Spectroradiometer (MODIS) over land. However, due to the use of different instruments, biases are possibly introduced in the NO2 retrieval. In addition, owing to the generally unavailable full surface BRDF under all conditions and the complexity of accounting for the BRDF, most of the current NO2 and cloud retrievals still rely on Lambertian surface reflection (e.g. Krotkov et al., 2017; Boersma et al., 2018; van Geffen et al., 2019; Loyola et al., 2018; Desmons et al., 2019).
To account for the varying sensitivity of the satellite to NO2 at different altitudes, a priori vertical profiles of NO2 are required, and they are generally prescribed using a chemistry transport model. The importance of the a priori NO2 profiles used in the retrieval has already been recognised and motivated the use of model data with a high spatial resolution and/or high temporal resolution (e.g. Valin et al., 2011; Heckel et al., 2011; Russell et al., 2011; McLinden et al., 2014; Yamaji et al., 2014; Kuhlmann et al., 2015; Lin et al., 2014; Boersma et al., 2016; Laughner et al., 2016). Within the Monitoring Atmospheric Composition and Climate (MACC) European project, a global data assimilation system for atmospheric composition forecasts and analyses has been developed and is running operationally in Copernicus Atmosphere Monitoring Service (CAMS, http://atmosphere.copernicus.eu, last access: 12 February 2020). The CAMS system relies on a combination of satellite observations with state-of-the-art atmospheric modelling (Flemming et al., 2017); therefore, the European Centre for Medium Range Weather Forecasts (ECMWF) numerical weather prediction Integrated Forecast System (IFS) was extended to include modules to describe the atmospheric composition (Flemming et al., 2015; Inness et al., 2015; Morcrette et al., 2009; Benedetti et al., 2009; Engelen et al., 2009; Agustí-Panareda et al., 2016). Profile forecasts from CAMS are planned to be applied in the operational NO2 retrieval algorithm for the Sentinel-4 (Sanders et al., 2018) and Sentinel-5 (van Geffen et al., 2018) missions and will provide the advantages of operational implementation and high resolution. Lately, an advanced IFS system, referred to as IFS (CB05BASCOE) (Huijnen et al., 2016, 2019) or IFS (CBA) for short, operates at improved horizontal, vertical, and temporal resolutions based on recent emission inventories, providing an improved profile “representativeness”.
Clouds influence the NO2 retrieval due to their increased reflectivity, their shielding effect on the NO2 column below the cloud, and multiple scattering that enhances absorption inside the cloud (Martin et al., 2002; Liu et al., 2004; Stammes et al., 2008; Kokhanovsky and Rozanov, 2008). The presence of clouds is taken into account in the NO2 AMF calculation using cloud parameters based on the Optical Cloud Recognition Algorithm (OCRA) and the Retrieval Of Cloud Information using Neural Networks (ROCINN) (Loyola et al., 2007, 2011). OCRA/ROCINN has been applied in the operational retrieval of trace gases from GOME (Van Roozendael et al., 2006), GOME-2 (Valks et al., 2011; Hao et al., 2014; Liu et al., 2019b), and TROPOMI (Heue et al., 2016; Theys et al., 2017; Loyola, 2020). The latest version of OCRA/ROCINN (Lutz et al., 2016; Loyola et al., 2018) provides two sets of cloud products: one treats clouds as ideal Lambertian reflectors in a “clouds-as-reflecting-boundaries” (CRB) model, and the second treats clouds as uniform layers of water droplets in a “clouds-as-layers” (CAL) model. The CAL model, which allows for the penetration of photons through the cloud, is more realistic than the CRB model, which screens the atmosphere below the cloud (Rozanov and Kokhanovsky, 2004; Richter et al., 2015).
Aerosol scattering and absorption influence the top-of-atmosphere radiances and the light path distribution. The radiative effect of scattering aerosols and clouds is comparable (i.e. the albedo effect, the shielding effect, and multiple scattering), whereas the presence of absorbing aerosols generally reduces the sensitivity to NO2 within and below the aerosol layer by decreasing the number of photons scattered back from this region to the satellite (Leitão et al., 2010). Because cloud retrieval does not distinguish between clouds and aerosols, the effect of aerosol on the AMF is normally corrected using an “implicit aerosol correction” by assuming that the effective clouds retrieved as Lambertian reflectors (i.e. using the CRB model); this accounts for the effect of aerosols on the light path (Boersma et al., 2004, 2011). Previous works have also applied an “explicit aerosol correction” for OMI pixels by considering additional aerosol parameters (e.g. Lin et al., 2014, 2015; Kuhlmann et al., 2015; Castellanos et al., 2015; Liu et al., 2019a; Chimot et al., 2019) and have reported large biases related to the implicit aerosol correction for polluted cases, which is likely due to the fact that the simple CRB model can not fully describe the effects inherent to aerosol particles (Chimot et al., 2019).
The operational GOME-2 NO2 products are generated using the GOME Data Processor (GDP) algorithm and are provided by DLR in the framework of EUMETSAT’s Satellite Application Facility on Atmospheric Composition Monitoring (AC-SAF). The retrieval algorithm of total and tropospheric NO2 from GOME-2 has been introduced by Valks et al. (2011, 2017) as implemented in the current operational GDP version 4.8. An updated slant column retrieval and stratosphere–troposphere separation have been presented by Liu et al. (2019b), and an improved AMF calculation is described in this paper, which will be implemented in the next version of GDP.
In the context of AC-SAF (Hassinen et al., 2016), the NO2 data derived from the GOME-2 GDP algorithm are being validated at BIRA-IASB by comparison with correlative observations from ground-based multi-axis differential optical absorption spectroscopy (MAXDOAS) (Pinardi et al., 2014, 2015; Pinardi, 2020). The MAXDOAS instrument collects scattered sky light in a series of line-of-sight angular directions extending from the horizon to the zenith. High sensitivity towards absorbers near the surface is obtained for the smallest elevation angles, whereas measurements at higher elevations provide information on the rest of the column. This technique allows for the determination of vertically resolved abundances of atmospheric trace species in the lowermost troposphere (Hönninger et al., 2004; Wagner et al., 2004; Wittrock et al., 2004; Heckel et al., 2005).
This work is organised as follows. In Sect. 2, we briefly introduce the reference retrieval algorithm for GOME-2 NO2 measurements, which was described in detail in Liu et al. (2019b). In Sect. 3, we improve the AMF calculation in the reference retrieval algorithm by accounting for the dependency of surface albedo on direction over land and over water, applying the advanced IFS (CBA) a priori NO2 profiles with higher model resolution, and implementing the more realistic CAL cloud model. We investigate the properties of the implicit aerosol correction for aerosol-dominated scenes by comparing it to the explicit aerosol correction in Sect. 4. Finally, we show a validation of the GOME-2 tropospheric NO2 columns using MAXDOAS datasets in Sect. 5.
As described in Liu et al. (2019b), the NO2 slant column retrieval applies an extended 425–497 nm wavelength fitting window (Richter et al., 2011) to include more NO2 structures and an improved slit function treatment to compensate for the long-term and in-orbit drifts of the GOME-2 slit function. The uncertainty in the NO2 slant columns is molec. cm−2 and is calculated from the average slant column error using a statistical method (Valks et al., 2011, see Sect. 6.1 therein). To determine the stratospheric NO2 components, the STRatospheric Estimation Algorithm from Mainz (STREAM) method (Beirle et al., 2016) with an improved treatment of polluted and cloudy pixels is adopted. The uncertainty in the GOME-2 stratospheric columns is ∼4–5×10¹⁴ molec cm−2 for polluted conditions based on the daily synthetic GOME-2 data and is ∼1–2×10¹⁴ molec cm−2 for monthly averages.
Mainly focusing on the third retrieval step, we apply the tropospheric AMF M conversion (Palmer et al., 2001; Boersma et al., 2004) to account for the average light path through the atmosphere:
where ml represents the box-air-mass factors (box-AMFs) in layer l, xl represents the partial columns from the a priori NO2 profiles, and cl is a correction coefficient to account for the temperature dependency of the NO2 cross section (Boersma et al., 2004; Nüß et al., 2006; Bucsela et al., 2013). The box-AMF ml values are derived using the multilayered multiple scattering LIDORT (Spurr et al., 2001) radiative transfer model and are stored in a look-up table (LUT) as a function of several model inputs (b), including GOME-2 viewing geometry, surface pressure, and surface albedo. Table 1 summarises the ancillary parameters used in the AMF calculation.
(Liu et al., 2019b)Table 1Ancillary parameters used to derive GOME-2 tropospheric NO2 columns. See Table 2 for details regarding the chemistry transport models used to obtain the a priori NO2 profiles.

The surface albedo is described by a monthly Lambertian-equivalent reflectivity (LER) database (Tilstra et al., 2017), derived from GOME-2 measurements for the years 2007–2013 with a spatial resolution of (latitude, longitude) for standard grid cells and for coastlines (Tilstra et al., 2019). The LER is retrieved by matching the simulated reflectances to the Earth reflectance measurements for cloud-free scenes found using a statistical method (Koelemeijer et al., 2003; Kleipool et al., 2008; Tilstra et al., 2017).
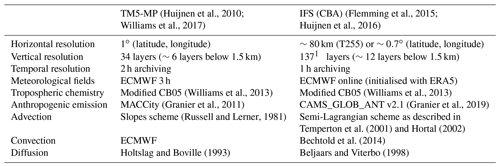
The daily a priori NO2 profiles are obtained from the TM5-MP three-dimensional chemistry transport model (Williams et al., 2017) with a horizontal resolution of for 34 vertical layers, as summarised in Table 2. The model is driven by ECMWF ERA-Interim meteorological reanalysis (Dee et al., 2011) and updated every 3 h with the interpolation of fields for the intermediate time periods. Compared with previous versions of the TM model (e.g. Williams et al., 2009; Huijnen et al., 2010), which have been commonly used in tropospheric NO2 retrieval studies (e.g. Boersma et al., 2011; Chimot et al., 2016; Lorente et al., 2017), the main advantages of TM5-MP are the better spatial resolution (), the updated NOx emissions (year-specific MACCity emission inventory, Granier et al., 2011), and the improved chemistry scheme (an expanded version of the modified CB05 chemistry scheme, Williams et al., 2013). The a priori profiles are determined for the GOME-2 overpass time (09:30 LT) and interpolated to the centre of the GOME-2 pixel based on four nearest-neighbour TM5-MP cell centres.
Huijnen et al., 2010Flemming et al., 2015Williams et al., 2017Huijnen et al., 2016(Williams et al., 2013)(Williams et al., 2013)(Granier et al., 2011)(Granier et al., 2019)(Russell and Lerner, 1981)Temperton et al. (2001)Hortal (2002)Bechtold et al. (2014)Holtslag and Boville (1993)Beljaars and Viterbo (1998)Table 2Summary of the chemistry transport model specifications.
1 A total of 69 layers are employed in this study.
In the presence of clouds, the AMF is derived based on the independent pixel approximation (Cahalan et al., 1994), which assumes that the AMF is a linear combination of a cloudy-sky AMF Mcl and a clear-sky AMF Mcr:
where ω is the cloud radiance fraction. Mcl is determined using Eq. (1) with the cloud surface regarded as a Lambertian reflector and with ml=0 for layers below the cloud top pressure cp. ω is derived from the GOME-2 cloud fraction cf as follows:
where Icr is the backscattered radiance for a clear scene derived using LIDORT, and Icl is for a cloudy scene. Note that the cloud fraction cf is a radiometric cloud fraction instead of a geometric one.
The GOME-2 cloud properties are derived by the OCRA and the ROCINN algorithms (Loyola et al., 2007, 2011, 2018; Lutz et al., 2016). As clouds generally have a higher reflectivity than the ground, OCRA calculates the radiometric cloud fractions by comparing the measured reflectances in three broadband wavelength regions across the UV–Vis–NIR region with corresponding cloud-free background composite maps using a RGB colour space approach. The monthly cloud-free background map is calculated from GOME-2/MetOp-A measurements for the years 2008–2013, accounting for instrumental degradation and dependencies on the viewing zenith angle (VZA), latitude, and season. With the radiometric cloud fractions from OCRA as inputs, ROCINN retrieves the cloud top pressures (cloud top heights) and cloud albedo (cloud optical depth) by comparing the simulated and measured satellite radiances in the O2 A-band around 760 nm using regularisation theory. Based on the independent pixel approximation and the CRB cloud model, the ROCINN algorithm treats the clouds as Lambertian surfaces.
The tropospheric NO2 column calculation is complicated in the case of cloudy conditions. For many measurements over cloudy scenes, the cloud top is well above the NO2 pollution in the boundary layer, and the enhanced tropospheric NO2 concentrations cannot be detected by GOME-2 if the clouds are optically thick. Therefore, the tropospheric NO2 column is only calculated for GOME-2 observations with a cloud radiance fraction ω less than 0.5. Note that the “below-cloud amount” (i.e. the amount of NO2 below the cloud top) for these partly cloudy conditions is implicitly accounted for via the cloudy-sky AMF Mcl (in which ml=0 for layers below the cloud top).
3.1 Surface albedo
The dependency of surface reflection on the incoming and outgoing directions is mathematically described by the BRDF (Nicodemus et al., 1992), which shows a “hot spot” of increased reflectivity in the backward scattering directions over rough surfaces like vegetation and a strong forward scattering peak near “sun glint” geometries over smooth surfaces such as water. In this study, we account for the direction dependency of surface albedo for the GOME-2 LER climatology by applying a directionally dependent LER (DLER) dataset over land surfaces (see Sect. 3.1.1) and by implementing an ocean surface albedo parameterisation over water surfaces (see Sect. 3.1.2).
3.1.1 Over land
To account for the surface BRDF in our NO2 AMF calculation over land, the surface reflectivity is described by a GOME-2 DLER dataset (Tilstra et al., 2019) that captures the VZA dependency. Compared with the traditional GOME-2 LER climatology (Tilstra et al., 2017), which is derived from a range of viewing angles ( for GOME-2 measurements covering the directions from east to west), the GOME-2 DLER dataset is derived by dividing the range of viewing angles into five segments and applying the same retrieval method as in the traditional GOME-2 LER determination for each segment with a parabolic fit to parameterise the VZA dependency. The main idea of this VZA-dependency parameterisation is to use the VZA as a proxy for observation geometry over land, as the solar zenith angle (SZA) and relative azimuth angle (RAA) are nearly constant at a given latitude and, thus, have been captured in the original GOME-2 LER dataset.
For each GOME-2 measurement, the surface DLER αDLER is calculated as follows:
where VZA θ is positive on the western side of the orbit swath and negative on the eastern side of the orbit swath. c0, c1, and c2 are parabolic fitting coefficients depending on latitude, longitude, month, and wavelength. The nondirectional LER αLER is taken from the traditional GOME-2 LER climatology. Note that no directionality is provided by the DLER dataset over water (without sea ice cover), which is mainly due to the dependency on parameters such as wind speed and chlorophyll concentration that can not be easily cast into climatology. Additionally, due to the strong solar and viewing angle dependency of specular reflection, changes in the solar position in the course of a month influence the albedo over water bodies much more than over land, and this influence is modelled and described in Sect. 3.1.2.
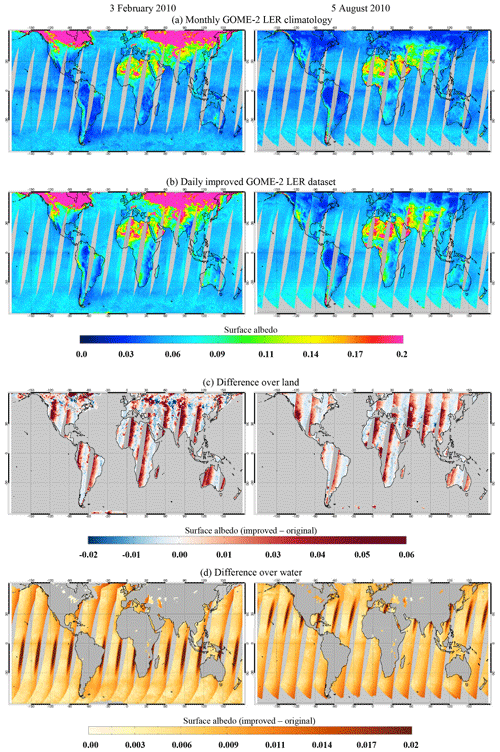
Figure 1Map of GOME-2 surface LER climatology (Tilstra et al., 2017) version 3.1 in February and August (a), improved GOME-2 surface LER data taking the direction dependency on 3 February and 5 August 2010 into account (b), and their differences over land (c) and over water (d). The improvements are described in Sect. 3.1.1 for land and in Sect. 3.1.2 for water.
Figure 1a–c show the traditional GOME-2 LER climatology, the GOME-2 DLER dataset over land, and their differences on 3 February and 5 August 2010. The DLER data show a stronger increase – by ∼0.02 – for the western viewing direction over vegetation, ∼0.05 over desert, and ∼0.2 over snow and ice, due to the increasing BRDF in the backward scattering direction. A slight change of up to 0.01 is found over vegetation and desert with an enhancement in the central part of the orbit swath and a reduction on the eastern side of the orbit swath. This effect is larger over snow and ice, due to the forward scattering peak or double scattering peak in the BRDF pattern for snow (Dumont et al., 2010). The difference in surface albedo is generally larger in winter due to the change in surface conditions and/or sun elevation, with the exception of desert areas.
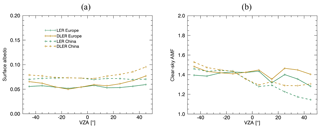
Figure 2Comparison of GOME-2 LER climatology (Tilstra et al., 2017) and GOME-2 DLER data (a) and the impact on the clear-sky AMFs (b) over western Europe (44–53∘ N, 0–7∘ E) and eastern China (21–41∘ N, 110–122∘ E) as a function of VZA in February 2010 (VZAs are negative for observations on the eastern side of the orbit swath).
Figure 2 compares the surface LER and DLER as a function of VZA and presents the impact on the clear-sky AMFs over western Europe (44–53∘ N, 0–7∘ E) and eastern China (21–41∘ N, 110–122∘ E) in February 2010. The surface albedo on the western side of the orbit swath (backward scattering direction) is higher by up to 0.024 for both regions, which increases the calculated clear-sky AMFs by 9 %–14 %. Smaller differences (by up to 0.006) are found for the central and eastern viewing directions for surface albedo and for clear-sky AMFs (by up to 4 %).
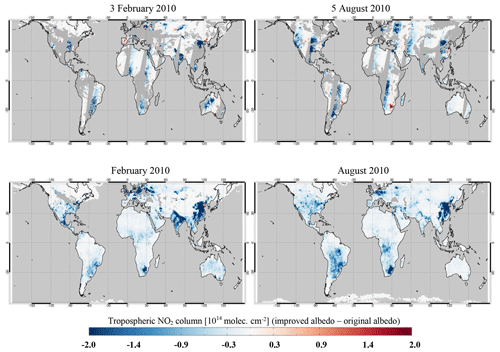
Figure 3Differences in the GOME-2 tropospheric NO2 columns retrieved using the GOME-2 LER and DLER datasets for a given day and for the monthly average in February and August 2010. Only measurements with a cloud radiance fraction less than 0.5 are included.
Figure 3 shows the differences in tropospheric NO2 columns retrieved using the surface LER and DLER datasets for a given day and for the monthly average in February and August 2010. The daily differences in the tropospheric NO2 columns are consistent with Fig. 1c, with a larger impact found over polluted regions. Taking Spain on 3 February 2010 as an example, the approximately 0.005 smaller surface DLER in the central part of the orbit swath results in a lower sensitivity to tropospheric NO2 columns in the AMF calculation; therefore, the AMF decreases and the tropospheric NO2 columns increases by molec. cm−2 (3 %). In contrast, the surface DLER is approximately 0.02 higher on the western side of the orbit swath over eastern China on the same day; thus, the tropospheric NO2 column is approximately 3×10¹⁵ molec. cm−2 (11 %) lower. The monthly differences in the tropospheric NO2 columns show a larger reduction in winter: by more than 5×10¹⁴ molec. cm−2 over regions such as central Europe, South Africa, India, and eastern China, and by molec. cm−2 over areas such as the eastern US, Southeast Asia, and Mexico.
Accounting for the BRDF effect, the surface DLER captures the cross-track dependency of surface albedo, such as the increased reflectivity in the backward scattering viewing geometries, which is in agreement with studies that have applied the BRDF product from MODIS to describe the dependency of land surface reflectance on illumination and viewing geometry (e.g. Zhou et al., 2010; Noguchi et al., 2014; Vasilkov et al., 2017; Lorente et al., 2018; Laughner et al., 2018; Qin et al., 2019). With a good agreement with the established MODIS BRDF product (Tilstra et al., 2019), both in the absolute sense and in the directional/angular dependency, the GOME-2 DLER dataset is derived from measurements of the instrument itself, which is consistent with the GOME-2 NO2 observations, considering the illumination conditions, observation geometry, and instrumental characteristics; therefore, the use of GOME-2 DLER introduces no additional bias caused by the instrumental differences.
3.1.2 Over water
The surface reflectivity over water is described with improved GOME-2 LER data using an ocean surface albedo parameterisation (Jin et al., 2004, 2011) to account for the direction dependency. Based on atmospheric radiation measurements and the Coupled Ocean and Atmosphere Radiative Transfer (COART) model (Jin et al., 2006), the parameterisation developed by Jin et al. (2011) derives the surface reflectivity for the direct (sun) and diffuse (sky) incident radiation separately and further divides each of them into contributions from surface and water respectively. This parameterisation has been used to derive ocean surface albedo (e.g. Séférian et al., 2018) and to generate satellite NO2 products (e.g. Laughner et al., 2018).
Following Jin et al. (2011), the ocean surface albedo αtotal is defined as follows:
where and are the respective direct and diffuse contribution of the surface reflection, and and are the respective direct and diffuse contribution of the volume scattering of water below the surface. The respective direct and diffuse fraction of downward surface flux, fdir and fdif (), are calculated using the online COART model (https://satcorps.larc.nasa.gov/jin/coart.html, last access: 12 February 2020). The direct surface albedo , which is one main component of the total ocean surface albedo, describes the contribution of Fresnel reflection depending on the incident angle, the refractive index of seawater (1.343 at 460 nm), and the slope distribution of the ocean surface (defined by Cox and Munk (1954) and related to a wind speed of 5 m s−1 from the climatological mean). The diffuse surface albedo is difficult to formulate analytically due to its variation with atmospheric conditions; thus, it is parameterised practically to be 0.06 for an assumed wind speed of 5 m s−1. The direct water volume albedo is considered for Case 1 waters (open ocean waters dominated by phytoplankton and associated products that comprise 99 % of the ocean) and is primarily affected by the chlorophyll concentration (0.2 mg m−3 from the global ocean average). The diffuse water volume albedo is defined by the at an effective incident direction, i.e. arccos(0.676), and is calculated to be 0.0145. The direct fraction of downward surface flux fdir is calculated using a radiative transfer simulation with a mid-latitude summer atmosphere, a marine aerosol optical depth of 1 (at 550 nm), and a 100 m ocean depth with the average Petzold phase function for ocean particle scattering.
Figure 4 shows the parameterised ocean surface albedo for a non-glint situation as well as its four albedo components as a function of incident angle. The overall shape of the total ocean surface albedo αtotal is dependent on the incident angle with a peak near 70∘, which is similar to Jin et al. (2004) and Laughner et al. (2018). The surface component () is larger than the water volume component (), particularly for larger incident angles. The direct component () increases with incident angle and has lower values than the diffuse component () for smaller incident angles (below 55∘) and higher values for larger incident angles. The relative contribution of the diffuse component to the total ocean surface albedo fdif increases from ∼0.65 to ∼1 with incident angle. It is worth noting that the four albedo components are independent of each other and are, thus, flexible to update or replace.
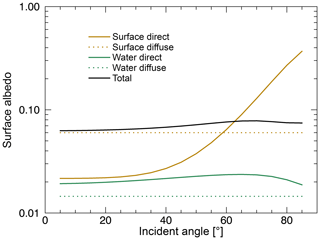
Figure 4Parameterised ocean surface albedo for a non-glint condition and its albedo components due to direct and diffuse surface reflection and direct and diffuse water volume scattering as a function of incident angle.
Based on measurements over a long period (2007–2018 for version 3.1), the GOME-2 LER climatology mainly provides the diffuse component () over water bodies with minimised impact of direct contribution. Therefore, we replace the simplified expression of in Jin et al. (2011) with values taken from the GOME-2 LER climatology. This scheme enables the consideration of the direction dependency for the GOME-2 LER climatology over water with minimal bias introduced. In addition, most of the ocean surface albedo studies (e.g. Ohlmann, 2003; Jin et al., 2004, 2011; Li et al., 2006; Laughner et al., 2018) employ a straightforward assumption that the SZA is the only directional parameter involved in the parameterisation, specifically the incident angle is assumed to be equivalent to the SZA in the Fresnel reflection calculation. In this work, we apply the full equation to derive the local incident angle that also considers the dependencies on VZA and RAA, and we additionally implement the Cox–Munk sun glitter model over glint-contaminated regions. See Cox and Munk (1954) and Gordon (1997) for more details on the configuration and derivation.
Figure 1b and d present the calculated ocean surface albedo and the differences with respect to values taken from GOME-2 LER climatology on 3 February and 5 August 2010. Consistent with Vasilkov et al. (2017), the improved ocean surface albedo shows up to 0.015 higher values at larger SZAs and VZAs, where the higher incident angles result in stronger Fresnel reflections, and up to 0.025 higher values over areas affected by sun glint, which is typically the eastern swath of GOME-2 orbits.
Figure 5 shows the impact of using updated ocean surface albedo on our GOME-2 NO2 retrieval for a given day and for the monthly average in February and August 2010. The tropospheric NO2 columns are mainly reduced over the polluted coastal regions that have large NO2 concentrations and for large SZAs and VZAs. For instance, the ocean surface albedo around Spain increases by ∼0.01 on 3 February 2010, leading to a decrease in the tropospheric NO2 columns by up to 8×10¹⁴ molec. cm−2 (9 %). The monthly average of the tropospheric NO2 columns decreases in winter by more than 3×10¹⁴ molec. cm−2 near the coastal area, e.g. around the US, eastern China, and Brazil, and by up to 1×10¹⁴ molec. cm−2 along the shipping lanes, e.g. in the Mediterranean Sea, the Red Sea, and maritime Southeast Asia.
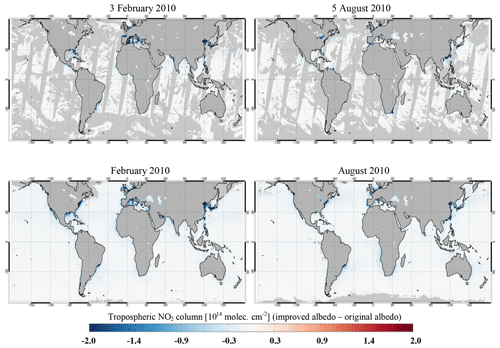
Figure 5Differences in the GOME-2 tropospheric NO2 columns retrieved using the original GOME-2 LER climatology and the GOME-2 LER data improved by the ocean surface albedo parameterisation for a given day and for the monthly average in February and August 2010. Only measurements with a cloud radiance fraction less than 0.5 are included.
3.2 A priori NO2 profile
In regions with strong gradients with respect to NOx emissions in space and time, the significant variation of surface NO2 can only be captured in a model with sufficient horizontal, vertical, and temporal resolution. The advanced IFS (CBA) (Huijnen et al., 2016, 2019) global chemistry forecast and analysis system combines the stratospheric chemistry scheme developed for the Belgian Assimilation System for Chemical ObsErvations (BASCOE, Skachko et al., 2016) and the modified CB05 tropospheric chemistry scheme (Williams et al., 2013). As summarised in Table 2, the spatial resolution of IFS (CBA) is a reduced Gaussian grid at a spectral truncation of T255, which is equivalent to a grid spacing of ∼80 km globally (). The model is run with the standard 137 hybrid sigma-pressure layers as also used operationally in the forecast and reanalysis model from the ECMWF. From this, we select a vertical discretisation based on 69 vertical levels up to 0.1 hPa with ∼12 layers in the boundary layer for further processing. An essential difference compared with TM5-MP is that the chemistry is an integral part of the meteorological forecast model in IFS (CBA). Here we use the forecast model from cycle 45r2, which is initialised daily using ERA5 meteorology. Additionally, anthropogenic emissions are based on the recently prepared CAMS_GLOB_ANT v2.1 emission inventory (Granier et al., 2019), as illustrated in Appendix A, and day-specific biomass burning emissions are taken from GFASv2.1 (Kaiser et al., 2012). The NO2 data are available on an hourly basis, with profiles at the satellite measurement time obtained by linear interpolation.
Figure 6 shows an intercomparison of area-averaged and monthly averaged profiles from TM5-MP and IFS (CBA) at the GOME-2 overpass time (09:30 LT) over western Europe (44–53∘ N, 0–7∘ E) and eastern China (21–41∘ N, 110–122∘ E) in February and August 2010. Generally, TM5-MP and IFS (CBA) show similar mean profile shapes over the two regions. In February, IFS (CBA) shows a larger boundary layer concentration and a sharper transition to the free troposphere over western Europe and larger NO2 gradients in the free troposphere over eastern China. In August, the NO2 concentrations in the free troposphere are lower than in February for both models due to the reduced emissions and the reduced lifetime of NO2, and a larger surface layer NO2 gradient is found for the IFS (CBA) model for both regions.
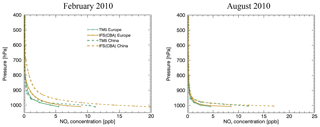
Figure 6Area-averaged and monthly averaged profiles from TM5-MP and IFS (CBA) at the GOME-2 overpass time (09:30 LT) over western Europe (44–53∘ N, 0–7∘ E) and eastern China (21–41∘ N, 110–122∘ E) in February and August 2010.
Figure 7 shows the daily TM5-MP and IFS (CBA) a priori NO2 profiles over the Netherlands (52.8∘ N, 4.7∘ E) and China (39.1∘ N, 118.0∘ E) on 3 February 2010 as examples. IFS (CBA) shows a higher surface layer NO2 concentration (a steeper profile shape) and yields a tropospheric AMF that is reduced by 0.21 over the Netherlands, which will enhance the retrieved tropospheric NO2 column. In contrast, the tropospheric AMF increases by 0.06 over China due to the larger NO2 gradients in the free troposphere (a less steep profile shape) modelled by IFS (CBA).
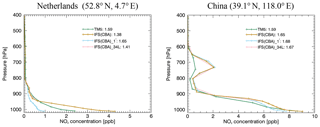
Figure 7A priori NO2 profiles from TM5-MP, IFS (CBA) (original resolution), and IFS (CBA) with different model resolutions over the Netherlands (52.8∘ N, 4.7∘ E) and China (39.1∘ N, 118.0∘ E) on 3 February 2010. The IFS (CBA) profiles for a 1∘ grid and for 34 layers are compared. The calculated clear-sky tropospheric AMF is given next to each label in the legends.
Figure 8 shows the differences in the tropospheric NO2 columns retrieved using TM5-MP and IFS (CBA) a priori NO2 profiles for a given day and for the monthly average in February and August 2010. The differences are consistent with the changes in the profile shapes in Figs. 6 and 7. The use of IFS (CBA) generally increases the tropospheric NO2 columns over polluted regions, e.g. over western Europe, the eastern US, and Argentina, by up to 2×10¹⁵ molec. cm−2 and decreases the values over areas such as central Africa, South Africa, and Brazil, by up to 1×10¹⁵ molec. cm−2. In February, however, a strong enhancement of molec. cm−2 is found over northern Germany and Poland, and a strong reduction of molec. cm−2 is found over the North China Plain. The differences in Fig. 8 are likely related to the different transport scheme and emission inventories employed by the model as well as the different model resolutions.
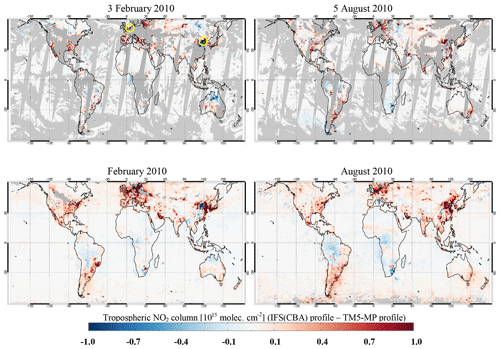
Figure 8Differences in tropospheric NO2 columns retrieved using TM5-MP and IFS (CBA) a priori NO2 profiles for a given day and for the monthly average in February and August 2010. Yellow circles in the top-left panel indicate the locations utilised in Fig. 7. Only measurements with a cloud radiance fraction less than 0.5 are included.
To quantify the effect of model resolution, a more detailed analysis was implemented for IFS (CBA) that used 1∘ grids for the horizontal resolution, 34 layers for the vertical resolution, and a 2 h time step for the temporal resolution. These values are of the same order of magnitude as the model resolution of TM5-MP and other chemistry transport models currently employed in the satellite retrieval of global NO2 (e.g. van Geffen et al., 2019; Lorente et al., 2017; Boersma et al., 2018; Liu et al., 2019b). Figure 7 compares the IFS (CBA) a priori NO2 profiles to original and different model resolutions over the Netherlands (52.8∘ N, 4.7∘ E) and China (39.1∘ N, 118.0∘ E) on 3 February 2010. Both examples are located in polluted coastal regions that typically have a large heterogeneity and variability in the NO2 distribution. The AMFs differ by more than 0.02 for both example locations due to differences in the horizontal and vertical resolutions. The current 2 h temporal sampling and subsequent linear interpolation between the sampling points is sufficient for the retrieval of tropospheric NO2 columns (not shown). When a coarser spatial resolution is used, the “domain-averaged” profiles generally show an increased surface NO2 concentration for the unpolluted domain and the opposite for the emission source. Consequently, the AMF is underestimated for unpolluted areas and overestimated for polluted areas. When the number of layers is reduced, the coarser sampling points can not accurately capture the large NO2 gradients at low altitudes, particularly for polluted regions where the measurement sensitivity of the satellite decreases significantly towards the surface.
Figure 9 shows the absolute and relative differences in tropospheric NO2 columns retrieved by altering the model resolutions for IFS (CBA) a priori NO2 profiles in February 2010. In Fig. 9a, the increase in the spatial resolution (1∘ vs. 0.7∘ grid) changes the tropospheric NO2 columns by up to 7×10¹⁴ molec. cm−2 or 20 % for polluted regions, confirming the importance of applying a priori NO2 profiles with better spatial resolution (Heckel et al., 2011; Lin et al., 2014; Kuhlmann et al., 2015). Larger relative differences are observed over cities surrounded by rural areas, coastal regions, isolated islands, and shipping lanes, where the use of high spatial resolutions more accurately captures the NO2 emissions and chemistry for a priori profiles. In Fig. 9b, the improvement in the vertical resolution (34 vs. 69 layers) enhances the tropospheric NO2 columns by up to 5×10¹⁴ molec. cm−2 or 15 %. Increasing the number of layers generally better resolves the NO2 vertical variation, especially for the lowest model layers where the box-AMF decreases significantly in the polluted cases. Consequently, the tropospheric AMFs are lower and the tropospheric NO2 columns are higher for polluted regions (Heckel et al., 2011; Russell et al., 2011; Valin et al., 2011). For unpolluted regions, the differences are generally small (within molec. cm−2 or ±3 %). In addition, the use of different temporal resolution (a 2 h vs. a 1 h time step) generally has a negligible impact on the tropospheric NO2 columns (less than 2×10¹⁴ molec. cm−2 or 3 %, not shown).
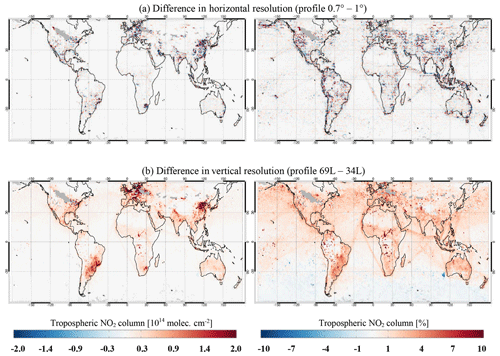
Figure 9Absolute and relative differences in the tropospheric NO2 columns retrieved by altering the model resolutions for IFS (CBA) a priori NO2 profiles in February 2010. The tropospheric NO2 columns are compared for a 1 and 0.7∘ grid (a) and for 34 and 69 layers (b). Only measurements with a cloud radiance fraction less than 0.5 are included.
3.3 Cloud correction
For cloudy scenarios, the retrieval of tropospheric NO2 is affected by the cloud parameters due to the variation in scene albedo and the photon path redistribution in the troposphere. As described in Sect. 2, the cloudy-sky AMFs are calculated by the independent pixel approximation using GOME-2 cloud parameters: radiometric cloud fraction from OCRA as well as cloud top pressure (cloud top height) and cloud albedo (cloud optical depth) from ROCINN. To improve the cloud correction in our NO2 retrieval, the CAL model from the ROCINN cloud algorithm (Loyola et al., 2018), where the clouds are treated as optically uniform layers of light-scattering water droplets, is applied. The CAL model is more representative of the real situation than the CRB model (where the clouds are idealised as Lambertian reflectors with zero transmittance), as it allows the penetration of photons through the cloud layer. This treatment takes the multiple scattering of light inside the cloud and the contribution of the atmospheric layer between the cloud bottom and the ground into account.
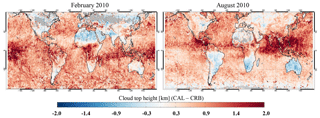
Figure 10Differences in cloud top heights retrieved using the ROCINN_CAL and ROCINN_CRB cloud models in February and August 2010. Only measurements with a cloud fraction less than 0.3 are included. Observations with a fitting rms greater than or a number of iterations greater than 20 are filtered out.
Figure 10 shows the differences in cloud top heights obtained with the CRB and CAL models from GOME-2 measurements in February and August 2010. Consistent with Loyola et al. (2018) (see Figs. 3 and 13 therein), the cloud top heights from CAL are generally higher by ∼0.9 km on average. Stronger increases (up to 2 km) are found over regions with thick and high clouds, such as the Intertropical Convergence Zone and the Western Hemisphere Warm Pool, which is very similar to the findings of Lelli et al. (2012; see Fig. 12 therein). In general, the CRB-based cloud retrieval underestimates the cloud top height due to the neglect of oxygen absorption throughout a cloud layer (Vasilkov et al., 2008) and, thus, the misinterpretation of the smaller top-of-atmosphere reflectance as a lower cloud layer (Saiedy et al., 1967). The retrieved cloud height is normally close to the middle, i.e. the optical centroid of clouds (Ferlay et al., 2010; Richter et al., 2015), which can be considered to be a reflectance-weighted height located inside a cloud. Additionally, as the enhanced multiple scattering is not fully taken into account in the CRB-based cloud retrieval, the retrieved cloud height is normally close to the altitude of the middle.
In Fig. 10, higher cloud top heights are mainly found over land surfaces characterised by the presence of a large amount of absorbing aerosols when using CRB, i.e. over regions with strong desert dust emissions, such as the Sahara, the Arabian Desert, and the deserts in Australia, as well as regions with strong biomass burning emissions, such as South America, South Africa, and Southeast Asia. Over these areas, ROCINN likely retrieves an effective aerosol height close to the top of aerosol layer, depending on the type of absorbing aerosols and on the aerosol optical depth. The presence of strongly absorbing aerosols, which typically have large aerosol optical depth and/or are located at high altitudes (up to ∼8 km), reduces the fraction of photons reaching the lowest part of the atmosphere. In order to approximate this shortened light path, the CRB-based cloud retrieval has to put the Lambertian reflector at a higher altitude (Wang et al., 2012; Chimot et al., 2016). This effect is larger for aerosol layers at higher altitudes and is also dependent on geometry parameters like SZA, on surface properties such as surface albedo, and on the accuracy of radiometric cloud fractions from OCRA. See Sect. 4 for further discussion on the CRB and CAL cloud models in the presence of aerosols.
To apply the CAL cloud model in our NO2 AMF calculation, a single scattering albedo of 1 and an asymmetry parameter of 0.85 for water clouds are assumed for the radiative transfer calculation; these values are consistent with those used in the cloud retrieval (Loyola et al., 2018). Cloud observations with a fitting root mean square (rms) greater than or a number of iterations greater than 20 are filtered out. The NO2 box-AMFs are derived through the pixel-specific radiative transfer calculation instead of the interpolation from a LUT with fixed reference points. This requires no projection from the layer coordinate of the NO2 profile to the coordinate assumed in the LUT and also requires no linear interpolation based on the model parameters.
Figure 11 shows an example of the box-AMFs derived for clear and cloudy sky using the CRB and CAL models over Italy (45.3∘ N, 11.2∘ E) on 1 February 2010. The cloud information and the calculated tropospheric AMFs are also reported. Compared with the clear-sky box-AMFs, the CAL-based cloudy-sky box-AMFs increase above the cloud layer (albedo effect) and decrease below the cloud layer (shielding effect). Compared with the CRB model, the use of the CAL model considers the sensitivities inside and below the cloud layer and increases the cloudy-sky AMF by 0.3, which consequently decreases the retrieved tropospheric NO2 column by 2.5×10¹⁵ molec. cm−2 (12 %), based on the polluted NO2 profile with most of the NO2 concentration located near the surface.
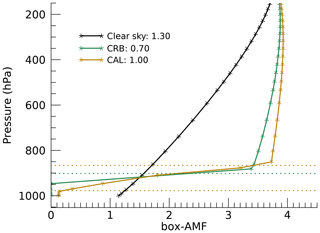
Figure 11The box-AMFs for clear and cloudy sky using the ROCINN_CAL and ROCINN_CRB cloud models over Italy (45.3∘ N, 11.2∘ E) on 1 February 2010. The tropospheric AMF is given next to each label. The ROCINN_CRB cloud top pressure is shown as a green horizontal dotted line, and the ROCINN_CAL cloud top and base pressures are shown as brown horizontal dotted lines. The cloud radiance fraction is 0.47, the cloud optical depth is 6.85, the SZA is 69∘, the VZA is 3∘, and the RAA is 42∘.
Figure 12 shows the differences in the tropospheric NO2 columns retrieved using the CRB and CAL models in February and August 2010. The use of the CAL model decreases the tropospheric NO2 columns by more than 1×10¹⁴ molec. cm−2 over polluted regions. Larger values are found in winter (up to 3×10¹⁵ molec. cm−2), when most of the NO2 concentrations are located at the surface and the cloud fractions are generally larger due to the seasonal variation of clouds.
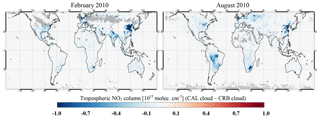
Figure 12Differences in the GOME-2 tropospheric NO2 columns retrieved using the ROCINN_CRB and ROCINN_CAL cloud models in February and August 2010. Only measurements with a cloud radiance fraction less than 0.5 are included. Cloud observations with a fitting rms greater than or a number of iterations greater than 20 are filtered out.
3.4 Combined impact
Figure 13 shows the tropospheric NO2 columns retrieved using the improved AMF calculation and the differences from the reference data in February and August 2010. Larger differences are found in winter over the polluted regions. For instance, the tropospheric NO2 columns are reduced by more than 1×10¹⁵ molec. cm−2 over China and India in February as well as Brazil and South Africa in August. Increased values are found over regions such as Mexico, Argentina, and Russia.
Table 3 summarises the individual changes and the combined effect of our improved AMF calculation on the retrieved tropospheric NO2 columns over western Europe, eastern China, the eastern US, and central Africa. Increases in the GOME-2 surface albedo reduce the tropospheric NO2 columns by 2 %–6 %. The use of IFS (CBA) a priori NO2 profiles affects (mostly increases) the tropospheric NO2 columns by up to 21 %, and the use of CAL cloud parameters decreases the values by up to 14 %. The combined effect of individual improvements yields to an average change in the tropospheric NO2 columns of within ±15 % in winter and ±5 % in summer over polluted regions.
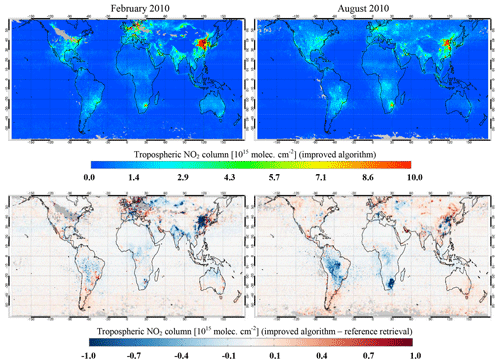
Figure 13GOME-2 tropospheric NO2 columns retrieved using the improved algorithm, and the differences from the reference data in February and August 2010. Only measurements with a cloud radiance fraction less than 0.5 are included. Cloud observations with a fitting rms greater than or a number of iterations greater than 20 are filtered out.
Table 3Individual changes and the combined effect of our improved AMF calculation on the tropospheric NO2 columns relative to the reference retrievals for western Europe (44–53∘ N, 0–7∘ E), eastern China (21–41∘ N, 110–122∘ E), the eastern US (30–45∘ N, 70–90∘ W), and central Africa (5–15∘ S, 10–30∘ E).

The uncertainty in the improved AMF calculation is likely reduced relative to the reference retrieval if the improved surface albedo dataset, a priori NO2 profiles, and cloud parameters are considered, as they are the main causes of AMF uncertainty (Lorente et al., 2017). The uncertainty in the AMF calculation for polluted conditions is estimated to have improved from 10 % to 45 % for the reference retrieval to between 10 % and 35 % in this work.
Aerosols can increase or decrease the sensitivity to tropospheric NO2, depending on the NO2 and aerosol vertical distribution as well as the optical and physical properties of the particles (Martin et al., 2003; Leitão et al., 2010). As the OCRA/ROCINN cloud retrieval does not distinguish between clouds and aerosols, the aerosol effect is assumed to be corrected implicitly in the AMF calculation via the effective cloud parameters (i.e. aerosols are treated as clouds).
Figures 14 and 15 show the land surface RGB image with active fire locations from the Moderate Resolution Imaging Spectroradiometer (MODIS) on board the Terra (10:30 LT) and the OCRA/ROCINN cloud products measured by GOME-2 (09:30 LT) over eastern China and central Africa on a given day respectively. The MODIS dataset (https://worldview.earthdata.nasa.gov/, last access: 12 February 2020) describes the cloud or aerosol amount and fire locations (for central Africa). For both regions, large aerosol loads are found in the RGB image for cloud-free areas, such as the Beijing–Tianjin–Hebei economic region in eastern China and burning regions across central Africa, where the aerosol loads are identified as thin clouds (a cloud optical depth of ∼5) near the surface (a cloud top height of ∼3 km) with cloud fractions of up to 0.18.
Therefore, we assume that the thin clouds near the surface in the OCRA/ROCINN cloud products are attributed to aerosol loads for measurements with a cloud radiance fraction less than 0.5 or a cloud fraction less than 0.2, and we evaluate the accuracy of the implicit aerosol correction by comparing it with the explicit aerosol correction. For this purpose, the explicit correction for aerosols is implemented using ground-based aerosol observations at Xianghe (39.75∘ N, 116.96∘ E), which is a suburban site surrounded by heavily industrialised areas in northeastern China (Clémer et al., 2010; Hendrick et al., 2014; Vlemmix et al., 2015), and at Bujumbura (3.38∘ S, 29.38∘ E), which is located in the central African country of Burundi and surrounded by intensive biomass burning activities (Gielen et al., 2017), as indicated in Figs. 14 and 15 respectively. Our analysis is further limited to satellite measurements with a cloud optical depth less than 5 and a cloud top height less than 3 km to reduce the cloud contamination. With this selection, the aerosol concentrations are generally low or moderate (an aerosol optical depth less than 1).
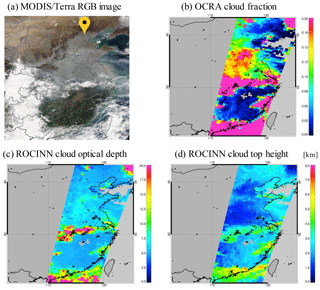
Figure 14A MODIS/Terra RGB image (a), GOME-2 OCRA cloud fraction (b), GOME-2 ROCINN_CAL cloud optical depth (c), and GOME-2 ROCINN_CAL cloud top height (d) over eastern China on 21 November 2013. Cloud observations with a fitting rms greater than or a number of iterations greater than 20 are filtered out. The yellow location symbol in the MODIS image indicates Xianghe station (39.75∘ N, 116.96∘ E).
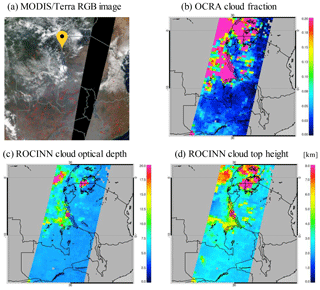
Figure 15Similar to Fig. 14 but for central Africa on 9 September 2015. The yellow location symbol in MODIS image indicates Bujumbura station (3.38∘ S, 29.38∘ E).
The explicit modelling of aerosol scattering and absorption for the AMF calculation is implemented by introducing the aerosol optical properties (i.e. single scattering albedo and phase function) and vertical distributions (i.e. extinction vertical profiles) into the radiative transfer calculation. The single scattering albedo describes the fraction of the aerosol light scattering over the extinction, and the phase function describes the angular distribution of the scattered light intensity. In this study, we apply the Henyey–Greenstein phase function with an asymmetry parameter (the first moment of phase function) describing the asymmetry between forward and backward scattering. The long-term statistics of the single scattering albedo and the asymmetry parameter at 440 nm are derived for Xianghe and Bujumbura using the Version 3 Level 2.0 inversion products from the sun photometer radiance measurements from AERONET (Holben et al., 1998; Giles et al., 2019) (http://aeronet.gsfc.nasa.gov/, last access: 12 February 2020). Monthly mean parameters are calculated based on up to 7 years of observations (2010–2016 for Xianghe and 2013–2016 for Bujumbura) that are available within ±1 h of the GOME-2 overpass time (09:30 LT) for each month.
Xianghe is located ∼60 km southeast of Beijing and belongs to the highly urbanised Beijing–Tianjin–Hebei economic region on the North China Plain; this area experiences heavy anthropogenic aerosol emissions, especially in winter due to enhanced domestic heating. Mixtures of desert dust and urban–industrial aerosols mainly affect the region in spring (March–May). Based on the monthly climatology of AERONET measurements, the single scattering albedo at Xianghe is 0.91 on average with a maximum in July (0.96) and low values in winter (∼0.87), which are mostly related to the black carbon emissions (Yang et al., 2011). The asymmetry parameter ranges between 0.7 and 0.75, which is consistent with values from the urban aerosol models in East Asia (Lee and Kim, 2010).
Bujumbura is located in tropical Africa; this is an area that is typically affected by biomass burning emissions (mainly during the local dry seasons – June to August and January to February) and, to a lesser extent, by anthropogenic emissions (throughout the year with negligible seasonal variations). The single scattering albedo at Bujumbura is higher between March and May (∼0.9), which is related to the major wet season, and lower between July and August and between December and January (0.83–0.87), which coincides with intensive agricultural activities and the transport of forest fire emissions in the surrounding regions (Gielen et al., 2017). The asymmetry parameter is 0.69 on average, which is in agreement with values in biomass burning aerosol models (Torres et al., 2013).
The colocated aerosol extinction vertical profiles at 477 nm are taken from the MAXDOAS measurements at Xianghe from March 2010 to December 2016 (Clémer et al., 2010) and at Bujumbura from December 2013 to December 2015 (Gielen et al., 2017). The MAXDOAS data are used to derive aerosol information based on the oxygen collision complexes (O4) absorption, as the O4 vertical profile is generally constant and, thus, capable of describing the influence of aerosol scattering and absorption on the photon path (Wagner et al., 2004; Frieß et al., 2006). The MAXDOAS technique can reliably determine the aerosol extinction profiles in the lower troposphere (Frieß et al., 2016), where most aerosols are located over Xianghe and Bujumbura. We colocate the space- and ground-based measurements by selecting GOME-2 pixels within 50 km of the stations and averaging the MAXDOAS aerosol profiles within ±1 h of the GOME-2 overpass time (09:30 LT).
Figure 16 shows typical NO2 box-AMFs, the simulated TM5-MP NO2 profile, and the MAXDOAS aerosol extinction profile for Xianghe on 21 November 2013. The MAXDOAS aerosol profile follows an exponentially decreasing shape with a peak of aerosol loads close to the ground (950 hPa or 0.4 km). The NO2 follows the same profile shape and is well mixed with aerosol. Depending on the seasonal variation, local emissions, and transport process, aerosol profiles with a peak at elevated heights (up to 900 hPa or 1 km) are also observed (not shown) due to a long residence time. The discontinuity of box-AMFs corrected using the CRB cloud model is introduced by the effective clouds (see Eq. 2), below which the cloudy box-AMFs are zero. Due to the overestimated cloud altitudes from the CRB-based cloud retrieval (see Sect. 3.3), the CRB-based implicit aerosol correction underestimates the tropospheric AMF by 14 %; this bias is largely reduced by applying the CAL cloud model (6 %), which causes a gradual reduction in box-AMFs towards the surface and shows better agreement with the shape from the explicit aerosol correction. Figure 17 shows the same data as Fig. 16 but for Bujumbura on 9 September 2015. Compared with the data at Xianghe, the aerosol profile at Bujumbura shows a lower aerosol amount but an uplifted layer of aerosol loads (820 hPa or 1.8 km), whereas NO2 continues to peak at the surface. The difference in AMF between the implicit and explicit aerosol corrections decreases from 15 % using CRB to 5 % using CAL.
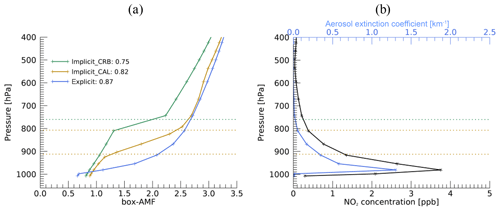
Figure 16The NO2 box-AMFs from the explicit aerosol correction and the implicit correction using the ROCINN_CRB and ROCINN_CAL cloud models (a), and the TM5-MP NO2 profiles and the MAXDOAS aerosol extinction profiles utilised in the retrievals (b) at Xianghe station on 21 November 2013. The tropospheric AMF is given next to each label in the legend. The ROCINN_CRB cloud top pressure is shown as a green horizontal dotted line, and the ROCINN_CAL cloud top and base pressures are shown as brown horizontal dotted lines. The cloud radiance fraction is 0.28, the cloud optical depth is 4.96, the aerosol optical depth is 0.66, the SZA is 66∘, the VZA is 17∘, and the RAA is 133∘.
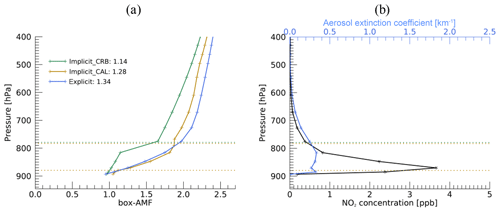
Figure 17Similar to Fig. 16 but for Bujumbura station on 9 September 2015. The cloud radiance fraction is 0.18, the cloud optical depth is 4.83, the aerosol optical depth is 0.58, the SZA is 40∘, the VZA is 14∘, and the RAA is 155∘.
Figure 18 presents the relative biases in the tropospheric NO2 columns retrieved assuming no aerosol correction (i.e. applying the clear-sky AMFs) and assuming implicit aerosol correction via the CRB and CAL cloud models for Xianghe from March 2010 to December 2016. Only measurements with a cloud radiance fraction less than 0.5, a cloud optical depth less than 5, and a cloud top height less than 3 km are included. The relative biases introduced by assuming no aerosol correction vary between −30 % and 31 % with an average of 7 % for GOME-2 pixels, which is in agreement with previous studies focusing on the industrialised part of eastern China (Ma et al., 2013; Lin et al., 2014, 2015; Kuhlmann et al., 2015; Chimot et al., 2016; Wang et al., 2017). Due to the overestimated shielding effect, the tropospheric NO2 columns retrieved using the CRB-based implicit aerosol correction are 33 % larger on average than those retrieved using the explicit aerosol correction, and the differences are largely reduced by applying the CAL cloud model (9 %). Enhanced differences are found for larger cloud radiance fraction values, which is probably due to the increased pollution level (NO2 columns) compared with clear sky conditions (Richter et al., 2017), as the cloud (radiance) fraction is highly correlated with the MAXDOAS aerosol optical depth (correlation coefficient of 0.7 and regression slope of 0.17, not shown). Figure 19 shows the same data but for Bujumbura from December 2013 to December 2015. The explicit aerosol correction yields tropospheric NO2 columns that are 6 % smaller than the clear-sky tropospheric NO2 columns on average, which is consistent with Martin et al. (2003) and Castellanos et al. (2015). The average difference between the tropospheric NO2 columns from the implicit and explicit aerosol corrections decreases from 15 % using the CRB model to 5 % using the CAL model.
In Figs. 18 and 19, the relative biases introduced by the CAL-based implicit aerosol correction are close to the values assuming no aerosol correction, addressing the complexities related to the tropospheric NO2 measurements in the presence of aerosols. In combination with the cloud model error, errors related to the implicit aerosol correlation can result from the different radiative effects of scattering clouds and absorbing aerosols as well as the different characteristic sizes and phase functions of clouds and aerosols in general. The errors may be additionally enhanced in the presence of actual clouds. Therefore, future works include the further quantitative interpretation of OCRA/ROCINN cloud parameters for aerosol-dominated scenes and the impact on the NO2 retrieval algorithm.
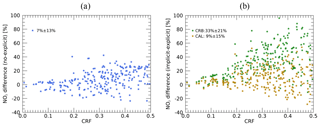
Figure 18Scatter plot of the relative biases in the GOME-2 tropospheric NO2 columns assuming no aerosol correction (a) and assuming an implicit aerosol correction using the ROCINN_CRB and ROCINN_CAL cloud models (b) with respect to the cloud radiance fraction at Xianghe station from March 2010 to December 2016. Only measurements with a cloud radiance fraction less than 0.5, a cloud optical depth less than 5, and a cloud top height less than 3 km are included. Cloud observations with a fitting rms greater than or a number of iterations greater than 20 are filtered out. The mean value and standard deviation are given next to each label in the legend.
A validation of our improved GOME-2 tropospheric NO2 columns is based on BIRA-IASB ground-based MAXDOAS measurements at the Xianghe, Uccle, Bujumbura, and Observatoire de Haute Provence (OHP) stations, as introduced in Appendix B. Xianghe station, owing to its polluted suburban nature, is the best site for validation (Liu et al., 2019b). The satellite-based NO2 data are commonly underestimated for urban polluted stations like Uccle, due to the averaging of a local source over a pixel size (80 km×40 km/40 km×40 km for GOME-2) larger than the horizontal sensitivity of the ground-based measurements which is approximately a few kilometres to tens of kilometres (Irie et al., 2011; Wagner et al., 2011; Ortega et al., 2015). Difficulties may arise when small local sources are present in remote locations, such as the Bujumbura (urban station in Burundi) or OHP (background station in southern France) sites (Pinardi et al., 2015; Gielen et al., 2017). For the validation of GOME-2 measurements, the satellite data are filtered for clouds (a cloud radiance fraction less than 0.5), and the closest valid pixel within 50 km of the stations is compared to the ground-based MAXDOAS data, which are linearly interpolated to the GOME-2 overpass time (09:30 LT), if original data exist within ±1 h.
Figure 20 shows the time series and scatter plot of the comparison of the daily and monthly means between the improved GOME-2 tropospheric NO2 columns and the ground-based MAXDOAS measurements at Xianghe, including the statistical information on the correlation coefficient, slope, and intercept of orthogonal regression analysis. The monthly mean values from the GOME-2 and MAXDOAS measurements indicate good agreement with similar seasonal variations in the tropospheric NO2 column. A correlation coefficient of 0.94, a regression slope of 0.69, and an intercept of 0.41×10¹⁵ molec. cm−2 are derived when comparing the monthly mean values. These results are qualitatively similar to previous validation exercises at other sites, from other satellites, and using other NO2 products (Celarier et al., 2008; Kramer et al., 2008; Chen et al., 2009; Irie et al., 2012; Ma et al., 2013; Wu et al., 2013; Kanaya et al., 2014; Lamsal et al., 2014; Wang et al., 2017; Drosoglou et al., 2017, 2018). Similar figures for previous GDP products can be found in Liu et al. (2019b) and on the AC-SAF validation website (http://cdop.aeronomie.be/validation/valid-results, last access: 12 February 2020).
Figure 21 presents the daily and monthly mean absolute and relative differences of GOME-2 and MAXDOAS measurements at Xianghe. The differences are within molec. cm−2 on average with a mean difference of molec. cm−2. The NO2 levels are underestimated by 9.9 % by GOME-2 with a standard deviation of ±21 %, which is mostly explained by the relatively low sensitivity of spaceborne measurements near the surface, the gradient-smoothing effect, and the aerosol shielding effect. These effects are often inherent to the different measurement types or the specific conditions of the validation sites and also to the remaining impact of structural uncertainties (Boersma et al., 2016), such as the impact of the choice of the a priori NO2 profiles and/or the albedo database assumed for the satellite AMF calculations.
Table 4The mean difference (MD) and median difference (AD) (SAT-GB in 1015 molec. cm−2), standard deviation (SD, in 1015 molec. cm−2), standard error of the mean (SE, in 1015 molec. cm−2), and correlation coefficient R, slope S, and intercept I (in 1015 molec. cm−2) of the orthogonal regression for the daily GOME-2 tropospheric NO2 product compared to MAXDOAS data at Xianghe. Intermediate results for different surface albedo and a priori NO2 profiles are reported for completely clear-sky conditions (a cloud radiance fraction of 0) for a total of 73 GOME-2 pixels.
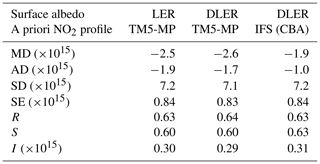
Table 5Similar to Table 4 but for different aerosol corrections for aerosol-dominated conditions (a cloud radiance fraction less than 0.5, a cloud optical depth less than 5, and a cloud top height of less than 3 km) for a total of 146 GOME-2 pixels. Results are calculated using DLER surface albedo and IFS (CBA) a priori profiles.
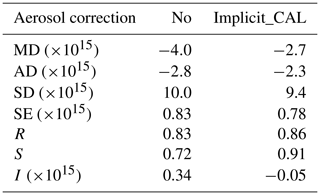
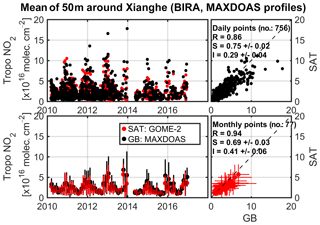
Figure 20Daily and monthly mean time series and scatter plot of GOME-2 (upper row) and MAXDOAS tropospheric NO2 columns (mean value of all the pixels within 50 km of Xianghe).
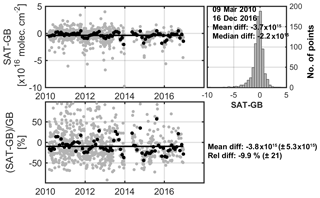
Figure 21Daily (grey dots) and monthly mean (black dots) absolute and relative GOME-2 (SAT) and MAXDOAS (GB) time series differences for Xianghe station. The histogram of the daily differences is also given, showing the mean and median difference. The total time series of absolute and relative monthly differences are given in the bottom-right panel.
Similar figures to Figs. 20 and 21 for the reference retrieval can be found in Liu et al. (2019b), and figures for previous GDP products can be found on the AC-SAF validation website (http://cdop.aeronomie.be/validation/valid-results, last access: 12 February 2020). Tables B1–B4 in Appendix B summarise the statistics for the improved retrieval, the reference retrieval, and the operational GDP 4.8 product at Xianghe, Uccle, Bujumbura, and OHP respectively. As discussed in Pinardi et al. (2015), for remote (Bujumbura) and background (OHP) stations, the mean bias is considered to be the best indicator of the validation results due to the relatively small variability in the measured NO2. In urban (Uccle) and suburban (Xianghe) situations, the NO2 variability is large enough, and the correlation coefficient provides a good indication of the coherence of the satellite and ground-based datasets, although larger differences in terms of slope and mean bias can be expected for the urban case because satellite measurements smooth out the local NO2 hot spots. Compared with the reference retrieval, the improvement of the algorithm leads to an increase in the correlation coefficient from 0.9 to 0.94 under suburban (Xianghe) conditions and a decrease in the mean relative bias from −43 % to −37 % under urban (Uccle) conditions; small impacts on the mean bias are found for Bujumbura and OHP. Compared with the operational GDP 4.8 product, however, both the reference retrieval and the improved retrieval show a significant improvement for all stations.
As Xianghe is located in a highly polluted region, the presence of large aerosol loads increases the uncertainty on the tropospheric NO2 columns for both the satellite and MAXDOAS retrievals (Richter et al., 2017) and increases the complexity of validation. As the cloud retrieval can hardly distinguish between clouds and aerosols (see Sect. 4), the “typical” validation results in Table B1 (a cloud radiance fraction less than 0.5) do not show improvements e.g. in the mean bias and the slope of the regression line when compared to the reference retrieval. To separate this effect, the validation at Xianghe is differentiated under completely clear-sky conditions in Table 4 (a cloud radiance fraction of 0) and aerosol-dominated cases in Table 5 (a cloud radiance fraction less than 0.5, a cloud optical depth less than 5, and a cloud top height less than 3 km).
To summarise the improvements of each of the changes discussed in previous sections, Table 4 reports the statistical results including the biases and regression analyses for the use of different surface albedo and a priori NO2 profiles at Xianghe station for completely clear-sky conditions (a cloud radiance fraction of 0). Compared with the reference retrieval (based on GOME-2 surface LER climatology and the TM5-MP a priori profile), better results are obtained with the improved algorithm (based on the surface DLER dataset and the IFS (CBA) a priori profile) with a median difference of molec. cm−2, which will be used to further test for aerosol correction type below.
Table 5 presents the statistical results for the retrievals with no aerosol correction and the CAL-based implicit aerosol correction at Xianghe station for aerosol-dominated cases (a cloud radiance fraction less than 0.5, a cloud optical depth less than 5, and a cloud top height less than 3 km). Consistent with Fig. 18, the GOME-2 NO2 columns retrieved using the CAL-based implicit aerosol correction are higher than the results assuming no aerosol correction, which improve the biases relative to the MAXDOAS measurements (e.g. median difference from molec. cm−2 to molec. cm−2), as well as the standard deviation, correlation coefficient, and regression parameters.
The operational GOME-2 NO2 dataset, generated using the GDP algorithm at DLR, was introduced in detail by Valks et al. (2011, 2017) and has been successfully applied in many studies. An improved AMF calculation with a more accurate knowledge of surface albedo, the a priori NO2 profile, as well as cloud and aerosol correction is described in this paper and is expected to be implemented in an upcoming version of GDP in combination with Liu et al. (2019b).
The viewing angle dependency of surface albedo is taken into account by improving the currently used GOME-2 surface LER climatology (Tilstra et al., 2017). Over land, the surface albedo is described by a GOME-2 DLER dataset (Tilstra et al., 2019), which is determined by dividing the GOME-2 orbit swath into five segments and retrieving the traditional surface LER for each segment based on the data from the respective part of orbit swath. Compared with the nondirectional GOME-2 LER climatology, the use of the DLER dataset improves the underestimation of the surface albedo on the western side of the GOME-2 orbit (backscattering geometry) and increases the AMFs by up to 15 % for polluted regions. Over water, the surface albedo is improved with an ocean surface albedo parameterisation (Jin et al., 2011), in which the albedo is parameterised for the direct and diffuse incident radiation separately. We update the simplified expression of the diffuse contribution with more realistic values taken from the GOME-2 LER data, and we improve the description of the dependency on the viewing direction for the parameterisation. The resulting surface albedo increases over sun glint areas and polluted coastal regions with large SZAs and VZAs, for which the tropospheric NO2 columns are reduced by up to 10 %.
Higher-resolution a priori profiles, obtained from the IFS (CBA) chemistry transport model with recent emission inventories, provide a better description of the spatial and temporal variability in the NO2 fields. Compared with the currently used TM5-MP profiles, the application of IFS (CBA) profiles affects the tropospheric NO2 columns by up to 7×10¹⁵ molec. cm−2 for polluted regions, which is mainly due to the differences in the model specifications and model resolutions. To quantify the influence of model resolutions, we implement an analysis in which we alter the horizontal, vertical, and temporal resolutions for IFS (CBA). Changing the horizontal resolution from 1 to 0.7∘ affects the tropospheric NO2 columns by up to 20 %, with enhanced values for emission sources and the opposite for their unpolluted surroundings. When the vertical resolution changes from 34 to 69 layers, the tropospheric NO2 columns increase by up to 15 % due to the capture of small box-AMFs at low altitudes. Small differences (<3 %) are found for a temporal resolution (time step) of 1 or 2 h.
The CAL model from the ROCINN cloud algorithm, which treats clouds as uniform layers of water droplets, allows for the penetration of photons through the clouds and provides more realistic cloud parameters than the current CRB model, which treats the clouds as idealised Lambertian reflectors. The application of CAL cloud parameters in the AMF calculation considers the sensitivities inside and below the cloud layers and reduces the tropospheric NO2 columns by up to 3×10¹⁵ molec. cm−2 for polluted regions.
As the cloud retrieval does not distinguish between clouds and aerosols, the aerosol correction is implicitly implemented in the AMF calculation using the cloud parameters. To evaluate the accuracy of the implicit aerosol correction through a cloud model, we explicitly account for the aerosol effect using ground-based aerosol measurements for aerosol-dominated conditions. For Xianghe, a suburban site in China with primarily anthropogenic aerosol emissions, and Bujumbura, a remote site in tropical Africa that is typically affected by biomass burning aerosols, aerosol optical properties from AERONET measurements and extinction vertical profiles from correlative MAXDOAS measurements are applied. Assuming the explicit aerosol correction as a reference, the use of an implicit aerosol correction via the CAL cloud model yields a bias that is 24 % smaller than the CRB cloud model for Xianghe and 10 % smaller for Bujumbura. A validation of the improved NO2 measurements is performed by comparing the GOME-2 tropospheric NO2 dataset with BIRA-IASB ground-based MAXDOAS measurements. At the suburban Xianghe station, the GOME-2 NO2 measurements show similar seasonal variation to the MAXDOAS dataset with a monthly averaged difference of −9.9 % ( molec. cm−2 in absolute) and a correlation coefficient of 0.94, which indicates good agreement. The application of the new surface albedo, the a priori NO2 profile, and the cloud correction in the AMF calculation improves the biases, the correlation coefficients, and the regression parameters for Xianghe.
In the future, further studies focusing on the cloud correction will be implemented due to its importance in the AMF calculation. The BRDF effect on cloud parameters will be considered by implementing the GOME-2 DLER dataset in the cloud retrieval from ROCINN, providing a consistent treatment of surface albedo for both NO2 and cloud retrieval. Note that the BRDF effect is not discussed for OCRA, because no surface albedo climatology is directly needed, and the correction for VZA dependency has been applied in the cloud fraction retrieval as a proxy for BRDF constellation (see Lutz et al., 2016, Sect. 2.2.2 therein). In addition, the interpretation of the OCRA/ROCINN cloud product for aerosol-dominated scenes and the impact on the NO2 retrieval algorithm will be further investigated in future studies. Furthermore, the NO2 algorithm will be adapted to measurements from the TROPOMI instrument with a spatial resolution as high as 7 km×3.5 km (5.5 km×3.5 km from August 2019 onwards).
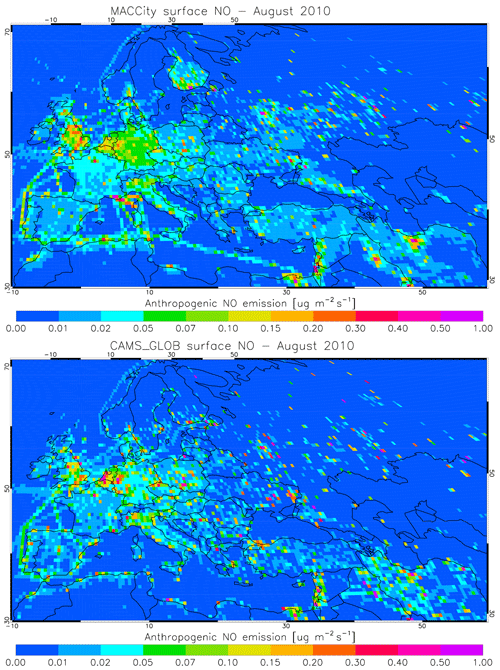
Figure A1 shows the emission maps of the MACCity (Granier et al., 2011) and CAMS_GLOB_ANT v2.1 (Granier et al., 2019) inventories for Europe in August 2010. The annual total anthropogenic emissions are 70.8 Tg NO yr−1 for MACCity and 73.7 Tg NO yr−1 for CAMS_GLOB_ANT v2.1. Significant changes in local emission patterns are clear in Fig. A1.
The validation of our improved GOME-2 tropospheric NO2 columns is based on ground-based MAXDOAS NO2 measurements at Xianghe station (39.75∘ N, 116.96∘ E) from March 2010 to December 2016, Uccle station (51∘ N, 4.36∘ E) from April 2011 to March 2016, Bujumbura station (3.38∘ S, 29.38∘ E) from December 2013 to October 2016, and OHP station (43.94∘ N, 5.71∘ E) from March 2007 to December 2016 respectively. Tables B1–B4 summarise the validation of the improved retrieval, the reference retrieval, and the current operational GDP 4.8 product using MAXDOAS measurements at the four BIRA-IASB stations. Xianghe is a typical suburban station in northeastern China, Uccle is an urban station in Belgium, Bujumbura is a small city in a remote region in tropical Africa, and OHP (southern France) is largely rural but occasionally influenced by polluted air masses transported from neighbouring cities.
Table B1Mean difference (MD, SAT-GB in 1015 molec. cm−2), standard deviation (SD, in 1015 molec. cm−2), standard error of the mean (SE, in 1015 molec. cm−2), relative difference (RD, (SAT-GB)/GB in percent), and correlation coefficient R, slope S, and intercept I (in 1015 molec. cm−2) of the orthogonal regression for the monthly mean GOME-2 tropospheric NO2 product when compared to MAXDOAS data at the suburban Xianghe station. Values for the improved retrieval (this study) are given, and values for the reference retrieval and the current operational GDP 4.8 product are reported. Results are reported for a cloud radiance fraction less than 0.5 for a total of 77 GOME-2 monthly points.
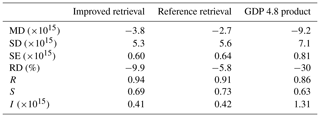
Table B2Similar to Table B1 but for the urban Uccle station for a total of 57 monthly points.
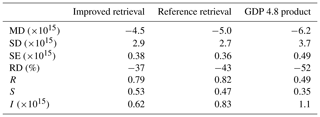
Table B3Similar to Table B1 but for the remote Bujumbura station for a total of 36 monthly points. n/a – not applicable.
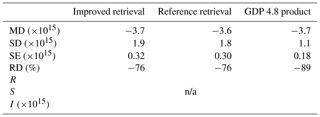
Table B4Similar to Table B1 but for the background OHP station for a total of 106 monthly points.
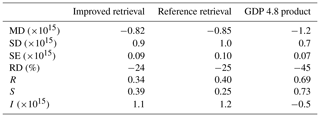
The current operational GDP version 4.8 NO2 data from GOME-2 (Valks et al., 2011, 2017) can be ordered via the FTP server and the EUMETSAT Data Centre (https://acsaf.org/, last access: 12 February 2020). The improved dataset is currently available upon request.
SL and PV developed the retrieval framework. SL processed the data, analysed the results, and contributed to the MAXDOAS validation. GP analysed the MAXDOAS validation results. JX processed the cloud data and provided expertise regarding the aerosol correction. AA and RL provided expertise regarding the OCRA/ROCINN-based cloud correction. LGT provided the GOME-2 surface albedo dataset and expertise regarding the surface albedo. VH provided the IFS (CB05BASCOE) model data and expertise regarding the a priori profiles. FH provided the MAXDOAS measurements. MVR contributed to the MAXDOAS validation. SL, PV, and GP wrote the paper with comments from all authors.
The authors declare that they have no conflict of interest.
This work is funded by the DLR-DAAD Research Fellowships 2015 programme (grant no. 57186656; reference no. 91585186) and is undertaken in the framework of the EUMETSAT AC-SAF project. We acknowledge the Belgian Science Policy Office (BELSPO) for supporting part of this work through the PRODEX programme B-ACSAF project. We thank EUMETSAT for the GOME-2 ground segment interfacing work and for the provision of GOME-2 Level 1 products. We thank the UPAS team for the developmental work on the “Universal Processor for UV/Vis Atmospheric Spectrometers” (UPAS) system at DLR. We are thankful to Henk Eskes (KNMI) for creating the TM5-MP a priori NO2 profiles. We acknowledge the free use of the GOME-2 surface LER database that is created by KNMI and provided through the AC-SAF of EUMETSAT. We also acknowledge the free use of the online COART radiative transfer model established at the NASA Langley Research Center. We are grateful for the use of imagery from the NASA Worldview application (https://worldview.earthdata.nasa.gov/, last access: 12 February 2020) as part of the NASA Earth Observing System Data and Information System (EOSDIS). We are also grateful to the PIs of the AERONET sites used in this study for maintaining their instruments and providing their data to the community.
This research has been supported by the DLR-DAAD Research Fellowships 2015 programme organised by the German Academic Exchange Service (DAAD) and the German Aerospace Center (DLR).
The article processing charges for this open-access
publication were covered by a Research
Centre of the Helmholtz Association.
This paper was edited by Lok Lamsal and reviewed by two anonymous referees.
Agustí-Panareda, A., Massart, S., Chevallier, F., Balsamo, G., Boussetta, S., Dutra, E., and Beljaars, A.: A biogenic CO2 flux adjustment scheme for the mitigation of large-scale biases in global atmospheric CO2 analyses and forecasts, Atmos. Chem. Phys., 16, 10399–10418, https://doi.org/10.5194/acp-16-10399-2016, 2016. a
Bechtold, P., Semane, N., Lopez, P., Chaboureau, J.-P., Beljaars, A., and Bormann, N.: Representing equilibrium and nonequilibrium convection in large-scale models, J. Atmos. Sci., 71, 734–753, 2014. a
Beirle, S., Hörmann, C., Jöckel, P., Liu, S., Penning de Vries, M., Pozzer, A., Sihler, H., Valks, P., and Wagner, T.: The STRatospheric Estimation Algorithm from Mainz (STREAM): estimating stratospheric NO2 from nadir-viewing satellites by weighted convolution, Atmos. Meas. Tech., 9, 2753–2779, https://doi.org/10.5194/amt-9-2753-2016, 2016. a
Beljaars, A. and Viterbo, P.: Role of the boundary layer in a numerical weather prediction model, Clear and cloudy boundary layers, 287–304, 1998. a
Benedetti, A., Morcrette, J.-J., Boucher, O., Dethof, A., Engelen, R. J., Fisher, M., Flentje, H., Huneeus, N., Jones, L., Kaiser, J. W., Kinne, S., Mangold, A., Razinger, M., Simmons, A. J., and Suttie, M.: Aerosol analysis and forecast in the European centre for medium-range weather forecasts integrated forecast system: 2. Data assimilation, J. Geophys. Res.-Atmos., 114, D13205, https://doi.org/10.1029/2008JD011115, 2009. a
Boersma, K., Eskes, H., and Brinksma, E.: Error analysis for tropospheric NO2 retrieval from space, J. Geophys. Res.-Atmos., 109, D04311, https://doi.org/10.1029/2003JD00396, 2004. a, b, c
Boersma, K. F., Eskes, H. J., Dirksen, R. J., van der A, R. J., Veefkind, J. P., Stammes, P., Huijnen, V., Kleipool, Q. L., Sneep, M., Claas, J., Leitão, J., Richter, A., Zhou, Y., and Brunner, D.: An improved tropospheric NO2 column retrieval algorithm for the Ozone Monitoring Instrument, Atmos. Meas. Tech., 4, 1905–1928, https://doi.org/10.5194/amt-4-1905-2011, 2011. a, b, c
Boersma, K. F., Vinken, G. C. M., and Eskes, H. J.: Representativeness errors in comparing chemistry transport and chemistry climate models with satellite UV–Vis tropospheric column retrievals, Geosci. Model Dev., 9, 875–898, https://doi.org/10.5194/gmd-9-875-2016, 2016. a, b
Boersma, K. F., Eskes, H. J., Richter, A., De Smedt, I., Lorente, A., Beirle, S., van Geffen, J. H. G. M., Zara, M., Peters, E., Van Roozendael, M., Wagner, T., Maasakkers, J. D., van der A, R. J., Nightingale, J., De Rudder, A., Irie, H., Pinardi, G., Lambert, J.-C., and Compernolle, S. C.: Improving algorithms and uncertainty estimates for satellite NO2 retrievals: results from the quality assurance for the essential climate variables (QA4ECV) project, Atmos. Meas. Tech., 11, 6651–6678, https://doi.org/10.5194/amt-11-6651-2018, 2018. a, b
Bovensmann, H., Burrows, J., Buchwitz, M., Frerick, J., Rozanov, V., Chance, K., and Goede, A.: SCIAMACHY: Mission objectives and measurement modes, J. Atmos. Sci., 56, 127–150, https://doi.org/10.1175/1520-0469(1999)056<0127:SMOAMM>2.0.CO;2, 1999. a
Bucsela, E. J., Krotkov, N. A., Celarier, E. A., Lamsal, L. N., Swartz, W. H., Bhartia, P. K., Boersma, K. F., Veefkind, J. P., Gleason, J. F., and Pickering, K. E.: A new stratospheric and tropospheric NO2 retrieval algorithm for nadir-viewing satellite instruments: applications to OMI, Atmos. Meas. Tech., 6, 2607–2626, https://doi.org/10.5194/amt-6-2607-2013, 2013. a
Burrows, J. P., Weber, M., Buchwitz, M., Rozanov, V., Ladstätter-Weißenmayer, A., Richter, A., DeBeek, R., Hoogen, R., Bramstedt, K., Eichmann, K.-U., Eisinger, M., and Perner, D.: The global ozone monitoring experiment (GOME): Mission concept and first scientific results, J. Atmos. Sci., 56, 151–175, 1999. a
Cahalan, R. F., Ridgway, W., Wiscombe, W. J., Bell, T. L., and Snider, J. B.: The albedo of fractal stratocumulus clouds, J. Atmos. Sci., 51, 2434–2455, 1994. a
Callies, J., Corpaccioli, E., Eisinger, M., Hahne, A., and Lefebvre, A.: GOME-2-Metop's second-generation sensor for operational ozone monitoring, ESA Bulletin, 102, 28–36, 2000. a
Castellanos, P., Boersma, K. F., Torres, O., and de Haan, J. F.: OMI tropospheric NO2 air mass factors over South America: effects of biomass burning aerosols, Atmos. Meas. Tech., 8, 3831–3849, https://doi.org/10.5194/amt-8-3831-2015, 2015. a, b
Celarier, E. A., Brinksma, E. J., Gleason, J. F., Veefkind, J. P., Cede, A., Herman, J. R., Ionov, D., Goutail, F., Pommereau, J.-P., Lambert, J.-C., van Roozendael, M., Pinardi, G., Wittrock, F., Schönhardt, A., Richter, A., Ibrahim, O. W., Wagner, T., Bojkov, B., Mount, G., Spinei, E., Chen, C. M., Pongetti, T. J., Sander, S. P., Bucsela, E. J., Wenig, M. O., Swart, D. P. J., Volten, H., Kroon, M., and Levelt, P. F.: Validation of Ozone Monitoring Instrument nitrogen dioxide columns, J. Geophys. Res.-Atmos., 113, D15S15, https://doi.org/10.1029/2007JD008908, 2008. a
Charlson, R. and Ahlquist, N.: Brown haze: NO2 or aerosol?, Atmos. Environ., 3, 653–656, 1969. a
Chen, D., Zhou, B., Beirle, S., Chen, L. M., and Wagner, T.: Tropospheric NO2 column densities deduced from zenith-sky DOAS measurements in Shanghai, China, and their application to satellite validation, Atmos. Chem. Phys., 9, 3641–3662, https://doi.org/10.5194/acp-9-3641-2009, 2009. a
Chimot, J., Vlemmix, T., Veefkind, J., de Haan, J., and Levelt, P.: Impact of Chimot, J., Vlemmix, T., Veefkind, J. P., de Haan, J. F., and Levelt, P. F.: Impact of aerosols on the OMI tropospheric NO2 retrievals over industrialized regions: how accurate is the aerosol correction of cloud-free scenes via a simple cloud model?, Atmos. Meas. Tech., 9, 359–382, https://doi.org/10.5194/amt-9-359-2016, 2016. a, b, c
Chimot, J., Veefkind, J. P., de Haan, J. F., Stammes, P., and Levelt, P. F.: Minimizing aerosol effects on the OMI tropospheric NO2 retrieval – An improved use of the 477 nm O2 − O2 band and an estimation of the aerosol correction uncertainty, Atmos. Meas. Tech., 12, 491–516, https://doi.org/10.5194/amt-12-491-2019, 2019. a, b
Clémer, K., Van Roozendael, M., Fayt, C., Hendrick, F., Hermans, C., Pinardi, G., Spurr, R., Wang, P., and De Mazière, M.: Multiple wavelength retrieval of tropospheric aerosol optical properties from MAXDOAS measurements in Beijing, Atmos. Meas. Tech., 3, 863–878, https://doi.org/10.5194/amt-3-863-2010, 2010. a, b
Cox, C. and Munk, W.: Measurement of the roughness of the sea surface from photographs of the sun’s glitter, Josa, 44, 838–850, 1954. a, b
Crutzen, P. J.: The influence of nitrogen oxides on the atmospheric ozone content, Q. J. Roy. Meteor. Soc., 96, 320–325, 1970. a
Dee, D. P., Uppala, S. M., Simmons, A. J., Berrisford, P., Poli, P., Kobayashi, S., Andrae, U., Balmaseda, M. A., Balsamo, G., Bauer, P., Bechtold, P., Beljaars, A. C. M., van de Berg, L., Bidlot, J., Bormann, N., Delsol, C., Dragani, R., Fuentes, M., Geer, A. J., Haimberger, L., Healy, S. B., Hersbach, H., Hólm, E. V., Isaksen, L., Kållberg, P., Köhler, M., Matricardi, M., McNally, A. P., Monge-Sanz, B. M., Morcrette, J.-J., Park, B.-K., Peubey, C., de Rosnay, P., Tavolato, C., Thépaut, J.-N., and Vitart, F.: The ERA-Interim reanalysis: Configuration and performance of the data assimilation system, Q. J. Roy. Meteor. Soc., 137, 553–597, 2011. a
Desmons, M., Wang, P., Stammes, P., and Tilstra, L. G.: FRESCO-B: a fast cloud retrieval algorithm using oxygen B-band measurements from GOME-2, Atmos. Meas. Tech., 12, 2485–2498, https://doi.org/10.5194/amt-12-2485-2019, 2019. a
Ding, J., Miyazaki, K., van der A, R. J., Mijling, B., Kurokawa, J.-I., Cho, S., Janssens-Maenhout, G., Zhang, Q., Liu, F., and Levelt, P. F.: Intercomparison of NOx emission inventories over East Asia, Atmos. Chem. Phys., 17, 10125–10141, https://doi.org/10.5194/acp-17-10125-2017, 2017. a
Drosoglou, T., Bais, A. F., Zyrichidou, I., Kouremeti, N., Poupkou, A., Liora, N., Giannaros, C., Koukouli, M. E., Balis, D., and Melas, D.: Comparisons of ground-based tropospheric NO2 MAX-DOAS measurements to satellite observations with the aid of an air quality model over the Thessaloniki area, Greece, Atmos. Chem. Phys., 17, 5829–5849, https://doi.org/10.5194/acp-17-5829-2017, 2017. a
Drosoglou, T., Koukouli, M. E., Kouremeti, N., Bais, A. F., Zyrichidou, I., Balis, D., van der A, R. J., Xu, J., and Li, A.: MAX-DOAS NO2 observations over Guangzhou, China; ground-based and satellite comparisons, Atmos. Meas. Tech., 11, 2239–2255, https://doi.org/10.5194/amt-11-2239-2018, 2018. a
Dumont, M., Brissaud, O., Picard, G., Schmitt, B., Gallet, J.-C., and Arnaud, Y.: High-accuracy measurements of snow Bidirectional Reflectance Distribution Function at visible and NIR wavelengths – comparison with modelling results, Atmos. Chem. Phys., 10, 2507–2520, https://doi.org/10.5194/acp-10-2507-2010, 2010. a
Engelen, R. J., Serrar, S., and Chevallier, F.: Four-dimensional data assimilation of atmospheric CO2 using AIRS observations, J. Geophys. Res.-Atmos., 114, D03303, https://doi.org/10.1029/2008JD010739, 2009. a
Ferlay, N., Thieuleux, F., Cornet, C., Davis, A. B., Dubuisson, P., Ducos, F., Parol, F., Riédi, J., and Vanbauce, C.: Toward new inferences about cloud structures from multidirectional measurements in the oxygen A band: Middle-of-cloud pressure and cloud geometrical thickness from POLDER-3/PARASOL, J. Appl. Meteorol. Clim., 49, 2492–2507, 2010. a
Flemming, J., Huijnen, V., Arteta, J., Bechtold, P., Beljaars, A., Blechschmidt, A.-M., Diamantakis, M., Engelen, R. J., Gaudel, A., Inness, A., Jones, L., Josse, B., Katragkou, E., Marecal, V., Peuch, V.-H., Richter, A., Schultz, M. G., Stein, O., and Tsikerdekis, A.: Tropospheric chemistry in the Integrated Forecasting System of ECMWF, Geosci. Model Dev., 8, 975–1003, https://doi.org/10.5194/gmd-8-975-2015, 2015. a, b
Flemming, J., Benedetti, A., Inness, A., Engelen, R. J., Jones, L., Huijnen, V., Remy, S., Parrington, M., Suttie, M., Bozzo, A., Peuch, V.-H., Akritidis, D., and Katragkou, E.: The CAMS interim Reanalysis of Carbon Monoxide, Ozone and Aerosol for 2003–2015, Atmos. Chem. Phys., 17, 1945–1983, https://doi.org/10.5194/acp-17-1945-2017, 2017. a
Frieß, U., Monks, P., Remedios, J., Rozanov, A., Sinreich, R., Wagner, T., and Platt, U.: MAX-DOAS O4 measurements: A new technique to derive information on atmospheric aerosols: 2. Modeling studies, J. Geophys. Res.-Atmos., 111, D14203, https://doi.org/10.1029/2005JD006618, 2006. a
Frieß, U., Klein Baltink, H., Beirle, S., Clémer, K., Hendrick, F., Henzing, B., Irie, H., de Leeuw, G., Li, A., Moerman, M. M., van Roozendael, M., Shaiganfar, R., Wagner, T., Wang, Y., Xie, P., Yilmaz, S., and Zieger, P.: Intercomparison of aerosol extinction profiles retrieved from MAX-DOAS measurements, Atmos. Meas. Tech., 9, 3205–3222, https://doi.org/10.5194/amt-9-3205-2016, 2016. a
Gamble, J., Jones, W., and Minshall, S.: Epidemiological-environmental study of diesel bus garage workers: acute effects of NO2 and respirable particulate on the respiratory system, Environ. Res., 42, 201–214, 1987. a
Gielen, C., Hendrick, F., Pinardi, G., De Smedt, I., Fayt, C., Hermans, C., Stavrakou, T., Bauwens, M., Müller, J.-F., Ndenzako, E., Nzohabonayo, P., Akimana, R., Niyonzima, S., Van Roozendael, M., and De Mazière, M.: Characterisation of Central-African aerosol and trace-gas emissions based on MAX-DOAS measurements and model simulations over Bujumbura, Burundi, Atmos. Chem. Phys. Discuss., https://doi.org/10.5194/acp-2016-1104, in review, 2017. a, b, c, d
Giles, D. M., Sinyuk, A., Sorokin, M. G., Schafer, J. S., Smirnov, A., Slutsker, I., Eck, T. F., Holben, B. N., Lewis, J. R., Campbell, J. R., Welton, E. J., Korkin, S. V., and Lyapustin, A. I.: Advancements in the Aerosol Robotic Network (AERONET) Version 3 database – automated near-real-time quality control algorithm with improved cloud screening for Sun photometer aerosol optical depth (AOD) measurements, Atmos. Meas. Tech., 12, 169–209, https://doi.org/10.5194/amt-12-169-2019, 2019. a
Gordon, H. R.: Atmospheric correction of ocean color imagery in the Earth Observing System era, J. Geophys. Res.-Atmos., 102, 17081–17106, 1997. a
Granier, C., Bessagnet, B., Bond, T., D’Angiola, A., van Der Gon, H. D., Frost, G. J., Heil, A., Kaiser, J. W., Kinne, S., Klimont, Z., Kloster, S., Lamarque, J.-F., Liousse, C., Masui, T., Meleux, F., Mieville, A., Ohara, T., Raut, J.-C., Riahi, K., Schultz, M. G., Smith, S. J., Thompson, A., van Aardenne, J., van der Werf, G. R., and van Vuuren, D. P.: Evolution of anthropogenic and biomass burning emissions of air pollutants at global and regional scales during the 1980–2010 period, Climatic Change, 109, 163–190, https://doi.org/10.1007/s10584-011-0154-1, 2011. a, b, c
Granier, C., Darras, S., Denier van der Gon, H., Doubalova, J., Elguindi, N., Galle, B., Gauss, M., Guevara, M., Jalkanen, J.-P., Kuenen, J., Liousse, C., Quack, B., Simpson, D., and Sindelarova, K.: The Copernicus Atmosphere Monitoring Service global and regional emissions (April 2019 version), Tech. rep., Copernicus Atmosphere Monitoring Service (CAMS) report, 2019. a, b, c
Gu, D., Wang, Y., Smeltzer, C., and Boersma, K. F.: Anthropogenic emissions of NOx over China: Reconciling the difference of inverse modeling results using GOME-2 and OMI measurements, J. Geophys. Res.-Atmos., 119, 7732–7740, 2014. a
Hao, N., Koukouli, M. E., Inness, A., Valks, P., Loyola, D. G., Zimmer, W., Balis, D. S., Zyrichidou, I., Van Roozendael, M., Lerot, C., and Spurr, R. J. D.: GOME-2 total ozone columns from MetOp-A/MetOp-B and assimilation in the MACC system, Atmos. Meas. Tech., 7, 2937–2951, https://doi.org/10.5194/amt-7-2937-2014, 2014. a
Hassinen, S., Balis, D., Bauer, H., Begoin, M., Delcloo, A., Eleftheratos, K., Gimeno Garcia, S., Granville, J., Grossi, M., Hao, N., Hedelt, P., Hendrick, F., Hess, M., Heue, K.-P., Hovila, J., Jønch-Sørensen, H., Kalakoski, N., Kauppi, A., Kiemle, S., Kins, L., Koukouli, M. E., Kujanpää, J., Lambert, J.-C., Lang, R., Lerot, C., Loyola, D., Pedergnana, M., Pinardi, G., Romahn, F., van Roozendael, M., Lutz, R., De Smedt, I., Stammes, P., Steinbrecht, W., Tamminen, J., Theys, N., Tilstra, L. G., Tuinder, O. N. E., Valks, P., Zerefos, C., Zimmer, W., and Zyrichidou, I.: Overview of the O3M SAF GOME-2 operational atmospheric composition and UV radiation data products and data availability, Atmos. Meas. Tech., 9, 383–407, https://doi.org/10.5194/amt-9-383-2016, 2016. a
Heckel, A., Richter, A., Tarsu, T., Wittrock, F., Hak, C., Pundt, I., Junkermann, W., and Burrows, J. P.: MAX-DOAS measurements of formaldehyde in the Po-Valley, Atmos. Chem. Phys., 5, 909–918, https://doi.org/10.5194/acp-5-909-2005, 2005. a
Heckel, A., Kim, S.-W., Frost, G. J., Richter, A., Trainer, M., and Burrows, J. P.: Influence of low spatial resolution a priori data on tropospheric NO2 satellite retrievals, Atmos. Meas. Tech., 4, 1805–1820, https://doi.org/10.5194/amt-4-1805-2011, 2011. a, b, c
Hendrick, F., Müller, J.-F., Clémer, K., Wang, P., De Mazière, M., Fayt, C., Gielen, C., Hermans, C., Ma, J. Z., Pinardi, G., Stavrakou, T., Vlemmix, T., and Van Roozendael, M.: Four years of ground-based MAX-DOAS observations of HONO and NO2 in the Beijing area, Atmos. Chem. Phys., 14, 765–781, https://doi.org/10.5194/acp-14-765-2014, 2014. a
Heue, K.-P., Coldewey-Egbers, M., Delcloo, A., Lerot, C., Loyola, D., Valks, P., and van Roozendael, M.: Trends of tropical tropospheric ozone from 20 years of European satellite measurements and perspectives for the Sentinel-5 Precursor, Atmos. Meas. Tech., 9, 5037–5051, https://doi.org/10.5194/amt-9-5037-2016, 2016. a
Hilboll, A., Richter, A., and Burrows, J. P.: Long-term changes of tropospheric NO2 over megacities derived from multiple satellite instruments, Atmos. Chem. Phys., 13, 4145–4169, https://doi.org/10.5194/acp-13-4145-2013, 2013. a
Hilboll, A., Richter, A., and Burrows, J. P.: NO2 pollution over India observed from space – the impact of rapid economic growth, and a recent decline, Atmos. Chem. Phys. Discuss., https://doi.org/10.5194/acp-2017-101, in review, 2017. a
Holben, B. N., Eck, T. F., Slutsker, I., Tanre, D., Buis, J. P., Setzer, A., Vermote, E., Reagan, J. A., Kaufman, Y. J., Nakajima, T., Lavenu, F., Jankowiak, I., and Smirnov, A.: AERONET—A federated instrument network and data archive for aerosol characterization, Remote Sens. Environ., 66, 1–16, 1998. a
Holtslag, A. and Boville, B.: Local versus nonlocal boundary-layer diffusion in a global climate model, J. Climate, 6, 1825–1842, 1993. a
Hönninger, G., von Friedeburg, C., and Platt, U.: Multi axis differential optical absorption spectroscopy (MAX-DOAS), Atmos. Chem. Phys., 4, 231–254, https://doi.org/10.5194/acp-4-231-2004, 2004. a
Hortal, M.: The development and testing of a new two-time-level semi-Lagrangian scheme (SETTLS) in the ECMWF forecast model, Q. J. Roy. Meteor. Soc., 128, 1671–1687, 2002. a
Huijnen, V., Williams, J., van Weele, M., van Noije, T., Krol, M., Dentener, F., Segers, A., Houweling, S., Peters, W., de Laat, J., Boersma, F., Bergamaschi, P., van Velthoven, P., Le Sager, P., Eskes, H., Alkemade, F., Scheele, R., Nédélec, P., and Pätz, H.-W.: The global chemistry transport model TM5: description and evaluation of the tropospheric chemistry version 3.0, Geosci. Model Dev., 3, 445–473, https://doi.org/10.5194/gmd-3-445-2010, 2010. a, b
Huijnen, V., Flemming, J., Chabrillat, S., Errera, Q., Christophe, Y., Blechschmidt, A.-M., Richter, A., and Eskes, H.: C-IFS-CB05-BASCOE: stratospheric chemistry in the Integrated Forecasting System of ECMWF, Geosci. Model Dev., 9, 3071–3091, https://doi.org/10.5194/gmd-9-3071-2016, 2016. a, b, c
Huijnen, V., Pozzer, A., Arteta, J., Brasseur, G., Bouarar, I., Chabrillat, S., Christophe, Y., Doumbia, T., Flemming, J., Guth, J., Josse, B., Karydis, V. A., Marécal, V., and Pelletier, S.: Quantifying uncertainties due to chemistry modelling – evaluation of tropospheric composition simulations in the CAMS model (cycle 43R1), Geosci. Model Dev., 12, 1725–1752, https://doi.org/10.5194/gmd-12-1725-2019, 2019. a, b
Ingmann, P., Veihelmann, B., Langen, J., Lamarre, D., Stark, H., and Courrèges-Lacoste, G. B.: Requirements for the GMES Atmosphere Service and ESA's implementation concept: Sentinels-4/-5 and-5p, Remote Sens. Environ., 120, 58–69, 2012. a
Inness, A., Blechschmidt, A.-M., Bouarar, I., Chabrillat, S., Crepulja, M., Engelen, R. J., Eskes, H., Flemming, J., Gaudel, A., Hendrick, F., Huijnen, V., Jones, L., Kapsomenakis, J., Katragkou, E., Keppens, A., Langerock, B., de Mazière, M., Melas, D., Parrington, M., Peuch, V. H., Razinger, M., Richter, A., Schultz, M. G., Suttie, M., Thouret, V., Vrekoussis, M., Wagner, A., and Zerefos, C.: Data assimilation of satellite-retrieved ozone, carbon monoxide and nitrogen dioxide with ECMWF's Composition-IFS, Atmos. Chem. Phys., 15, 5275–5303, https://doi.org/10.5194/acp-15-5275-2015, 2015. a
Irie, H., Takashima, H., Kanaya, Y., Boersma, K. F., Gast, L., Wittrock, F., Brunner, D., Zhou, Y., and Van Roozendael, M.: Eight-component retrievals from ground-based MAX-DOAS observations, Atmos. Meas. Tech., 4, 1027–1044, https://doi.org/10.5194/amt-4-1027-2011, 2011. a
Irie, H., Boersma, K. F., Kanaya, Y., Takashima, H., Pan, X., and Wang, Z. F.: Quantitative bias estimates for tropospheric NO2 columns retrieved from SCIAMACHY, OMI, and GOME-2 using a common standard for East Asia, Atmos. Meas. Tech., 5, 2403–2411, https://doi.org/10.5194/amt-5-2403-2012, 2012. a, b
Jin, Z., Charlock, T. P., Smith Jr, W. L., and Rutledge, K.: A parameterization of ocean surface albedo, Geophys. Res. Lett., 31, L22301, https://doi.org/10.1029/2004GL021180, 2004. a, b, c
Jin, Z., Charlock, T. P., Rutledge, K., Stamnes, K., and Wang, Y.: Analytical solution of radiative transfer in the coupled atmosphere-ocean system with a rough surface, Appl. Optics, 45, 7443–7455, 2006. a
Jin, Z., Qiao, Y., Wang, Y., Fang, Y., and Yi, W.: A new parameterization of spectral and broadband ocean surface albedo, Opt. Express, 19, 26429–26443, 2011. a, b, c, d, e, f
Kaiser, J. W., Heil, A., Andreae, M. O., Benedetti, A., Chubarova, N., Jones, L., Morcrette, J.-J., Razinger, M., Schultz, M. G., Suttie, M., and van der Werf, G. R.: Biomass burning emissions estimated with a global fire assimilation system based on observed fire radiative power, Biogeosciences, 9, 527–554, https://doi.org/10.5194/bg-9-527-2012, 2012. a
Kampa, M. and Castanas, E.: Human health effects of air pollution, Environ. Pollut. 151, 362–367, 2008. a
Kanaya, Y., Irie, H., Takashima, H., Iwabuchi, H., Akimoto, H., Sudo, K., Gu, M., Chong, J., Kim, Y. J., Lee, H., Li, A., Si, F., Xu, J., Xie, P.-H., Liu, W.-Q., Dzhola, A., Postylyakov, O., Ivanov, V., Grechko, E., Terpugova, S., and Panchenko, M.: Long-term MAX-DOAS network observations of NO2 in Russia and Asia (MADRAS) during the period 2007–2012: instrumentation, elucidation of climatology, and comparisons with OMI satellite observations and global model simulations, Atmos. Chem. Phys., 14, 7909–7927, https://doi.org/10.5194/acp-14-7909-2014, 2014. a
Kleipool, Q., Dobber, M., de Haan, J., and Levelt, P.: Earth surface reflectance climatology from 3 years of OMI data, J. Geophys. Res.-Atmos., 113, D18308, https://doi.org/10.1029/2008JD010290, 2008. a
Koelemeijer, R., De Haan, J., and Stammes, P.: A database of spectral surface reflectivity in the range 335–772 nm derived from 5.5 years of GOME observations, J. Geophys. Res.-Atmos., 108, 4070, https://doi.org/10.1029/2002JD002429, 2003. a
Kokhanovsky, A. and Rozanov, V.: The uncertainties of satellite DOAS total ozone retrieval for a cloudy sky, Atmos. Environ., 87, 27–36, 2008. a
Kramer, L. J., Leigh, R. J., Remedios, J. J., and Monks, P. S.: Comparison of OMI and ground-based in situ and MAX-DOAS measurements of tropospheric nitrogen dioxide in an urban area, J. Geophys. Res.-Atmos., 113, D16S39, https://doi.org/10.1029/2007JD009168, 2008. a
Krotkov, N. A., Lamsal, L. N., Celarier, E. A., Swartz, W. H., Marchenko, S. V., Bucsela, E. J., Chan, K. L., Wenig, M., and Zara, M.: The version 3 OMI NO2 standard product, Atmos. Meas. Tech., 10, 3133–3149, https://doi.org/10.5194/amt-10-3133-2017, 2017. a, b
Kuhlmann, G., Lam, Y. F., Cheung, H. M., Hartl, A., Fung, J. C. H., Chan, P. W., and Wenig, M. O.: Development of a custom OMI NO2 data product for evaluating biases in a regional chemistry transport model, Atmos. Chem. Phys., 15, 5627–5644, https://doi.org/10.5194/acp-15-5627-2015, 2015. a, b, c, d
Lamsal, L. N., Krotkov, N. A., Celarier, E. A., Swartz, W. H., Pickering, K. E., Bucsela, E. J., Gleason, J. F., Martin, R. V., Philip, S., Irie, H., Cede, A., Herman, J., Weinheimer, A., Szykman, J. J., and Knepp, T. N.: Evaluation of OMI operational standard NO2 column retrievals using in situ and surface-based NO2 observations, Atmos. Chem. Phys., 14, 11587–11609, https://doi.org/10.5194/acp-14-11587-2014, 2014. a
Laughner, J. L., Zare, A., and Cohen, R. C.: Effects of daily meteorology on the interpretation of space-based remote sensing of NO2, Atmos. Chem. Phys., 16, 15247–15264, https://doi.org/10.5194/acp-16-15247-2016, 2016. a
Laughner, J. L., Zhu, Q., and Cohen, R. C.: The Berkeley High Resolution Tropospheric NO2 product, Earth Syst. Sci. Data, 10, 2069–2095, https://doi.org/10.5194/essd-10-2069-2018, 2018. a, b, c, d, e
Lee, K. H. and Kim, Y. J.: Satellite remote sensing of Asian aerosols: a case study of clean, polluted, and Asian dust storm days, Atmos. Meas. Tech., 3, 1771–1784, https://doi.org/10.5194/amt-3-1771-2010, 2010. a
Leitão, J., Richter, A., Vrekoussis, M., Kokhanovsky, A., Zhang, Q. J., Beekmann, M., and Burrows, J. P.: On the improvement of NO2 satellite retrievals – aerosol impact on the airmass factors, Atmos. Meas. Tech., 3, 475–493, https://doi.org/10.5194/amt-3-475-2010, 2010. a, b
Lelli, L., Kokhanovsky, A. A., Rozanov, V. V., Vountas, M., Sayer, A. M., and Burrows, J. P.: Seven years of global retrieval of cloud properties using space-borne data of GOME, Atmos. Meas. Tech., 5, 1551–1570, https://doi.org/10.5194/amt-5-1551-2012, 2012. a
Levelt, P., Van den Oord, G., Dobber, M., Malkki, A., Visser, H., de Vries, J., Stammes, P., Lundell, J., and Saari, H.: The Ozone Monitoring Instrument, IEEE T. Geosci. Remote, 44, 1093–1101, 2006. a
Li, J., Scinocca, J., Lazare, M., McFarlane, N., Von Salzen, K., and Solheim, L.: Ocean surface albedo and its impact on radiation balance in climate models, J. Climate, 19, 6314–6333, 2006. a
Lin, J.-T., Martin, R. V., Boersma, K. F., Sneep, M., Stammes, P., Spurr, R., Wang, P., Van Roozendael, M., Clémer, K., and Irie, H.: Retrieving tropospheric nitrogen dioxide from the Ozone Monitoring Instrument: effects of aerosols, surface reflectance anisotropy, and vertical profile of nitrogen dioxide, Atmos. Chem. Phys., 14, 1441–1461, https://doi.org/10.5194/acp-14-1441-2014, 2014. a, b, c, d, e
Lin, J.-T., Liu, M.-Y., Xin, J.-Y., Boersma, K. F., Spurr, R., Martin, R., and Zhang, Q.: Influence of aerosols and surface reflectance on satellite NO2 retrieval: seasonal and spatial characteristics and implications for NOx emission constraints, Atmos. Chem. Phys., 15, 11217–11241, https://doi.org/10.5194/acp-15-11217-2015, 2015. a, b, c
Liu, M., Lin, J., Boersma, K. F., Pinardi, G., Wang, Y., Chimot, J., Wagner, T., Xie, P., Eskes, H., Van Roozendael, M., Hendrick, F., Wang, P., Wang, T., Yan, Y., Chen, L., and Ni, R.: Improved aerosol correction for OMI tropospheric NO2 retrieval over East Asia: constraint from CALIOP aerosol vertical profile, Atmos. Meas. Tech., 12, 1–21, https://doi.org/10.5194/amt-12-1-2019, 2019a. a
Liu, S., Valks, P., Pinardi, G., De Smedt, I., Yu, H., Beirle, S., and Richter, A.: An improved total and tropospheric NO2 column retrieval for GOME-2, Atmos. Meas. Tech., 12, 1029–1057, https://doi.org/10.5194/amt-12-1029-2019, 2019b. a, b, c, d, e, f, g, h, i, j, k
Liu, X., Newchurch, M., Loughman, R., and Bhartia, P.: Errors resulting from assuming opaque Lambertian clouds in TOMS ozone retrieval, J. Quant. Spectrosc. Ra., 85, 337–365, 2004. a
Lorente, A., Folkert Boersma, K., Yu, H., Dörner, S., Hilboll, A., Richter, A., Liu, M., Lamsal, L. N., Barkley, M., De Smedt, I., Van Roozendael, M., Wang, Y., Wagner, T., Beirle, S., Lin, J.-T., Krotkov, N., Stammes, P., Wang, P., Eskes, H. J., and Krol, M.: Structural uncertainty in air mass factor calculation for NO2 and HCHO satellite retrievals, Atmos. Meas. Tech., 10, 759–782, https://doi.org/10.5194/amt-10-759-2017, 2017. a, b, c, d
Lorente, A., Boersma, K. F., Stammes, P., Tilstra, L. G., Richter, A., Yu, H., Kharbouche, S., and Muller, J.-P.: The importance of surface reflectance anisotropy for cloud and NO2 retrievals from GOME-2 and OMI, Atmos. Meas. Tech., 11, 4509–4529, https://doi.org/10.5194/amt-11-4509-2018, 2018. a, b
Loyola, D. G.: The near-real-time total ozone retrieval algorithm from TROPOMI onboard Sentinel-5 Precursor, in preparation, 2020. a
Loyola, D., Thomas, W., Livschitz, Y., Ruppert, T., Albert, P., and Hollmann, R.: Cloud properties derived from GOME/ERS-2 backscatter data for trace gas retrieval, IEEE T. Geosci. Remote, 45, 2747–2758, 2007. a, b
Loyola, D. G., Koukouli, M. E., Valks, P., Balis, D. S., Hao, N., Van Roozendael, M., Spurr, R. J. D., Zimmer, W., Kiemle, S., Lerot, C., and Lambert, J.-C.: The GOME-2 total column ozone product: Retrieval algorithm and ground-based validation, J. Geophys. Res.-Atmos., 116, D07302, https://doi.org/10.1029/2010JD014675, 2011. a, b
Loyola, D. G., Gimeno García, S., Lutz, R., Argyrouli, A., Romahn, F., Spurr, R. J. D., Pedergnana, M., Doicu, A., Molina García, V., and Schüssler, O.: The operational cloud retrieval algorithms from TROPOMI on board Sentinel-5 Precursor, Atmos. Meas. Tech., 11, 409–427, https://doi.org/10.5194/amt-11-409-2018, 2018. a, b, c, d, e, f
Lutz, R., Loyola, D., Gimeno García, S., and Romahn, F.: OCRA radiometric cloud fractions for GOME-2 on MetOp-A/B, Atmos. Meas. Tech., 9, 2357–2379, https://doi.org/10.5194/amt-9-2357-2016, 2016. a, b, c
Ma, J. Z., Beirle, S., Jin, J. L., Shaiganfar, R., Yan, P., and Wagner, T.: Tropospheric NO2 vertical column densities over Beijing: results of the first three years of ground-based MAX-DOAS measurements (2008–2011) and satellite validation, Atmos. Chem. Phys., 13, 1547–1567, https://doi.org/10.5194/acp-13-1547-2013, 201 a, b
Martin, R. V., Chance, K., Jacob, D. J., Kurosu, T. P., Spurr, R. J., Bucsela, E., Gleason, J. F., Palmer, P. I., Bey, I., Fiore, A. M., Li, Q.,Yantosca, R. M., and Koelemeijer, R. B. A.: An improved retrieval of tropospheric nitrogen dioxide from GOME, J. Geophys. Res.-Atmos., 107, 4437, https://doi.org/10.1029/2001JD001027, 2002. a
Martin, R. V., Jacob, D. J., Chance, K., Kurosu, T. P., Palmer, P. I., and Evans, M. J.: Global inventory of nitrogen oxide emissions constrained by space-based observations of NO2 columns, J. Geophys. Res.-Atmos., 108, 4537, https://doi.org/10.1029/2003JD003453, 2003. a, b
McCormick, J.: Acid Earth: the global threat of acid pollution, Routledge, 2013. a
McLinden, C. A., Fioletov, V., Boersma, K. F., Kharol, S. K., Krotkov, N., Lamsal, L., Makar, P. A., Martin, R. V., Veefkind, J. P., and Yang, K.: Improved satellite retrievals of NO2 and SO2 over the Canadian oil sands and comparisons with surface measurements, Atmos. Chem. Phys., 14, 3637–3656, https://doi.org/10.5194/acp-14-3637-2014, 2014. a
Mijling, B., van der A, R. J., and Zhang, Q.: Regional nitrogen oxides emission trends in East Asia observed from space, Atmos. Chem. Phys., 13, 12003–12012, https://doi.org/10.5194/acp-13-12003-2013, 2013. a
Miyazaki, K., Eskes, H., Sudo, K., Boersma, K. F., Bowman, K., and Kanaya, Y.: Decadal changes in global surface NOx emissions from multi-constituent satellite data assimilation, Atmos. Chem. Phys., 17, 807–837, https://doi.org/10.5194/acp-17-807-2017, 2017. a
Morcrette, J.-J., Boucher, O., Jones, L., Salmond, D., Bechtold, P., Beljaars, A., Benedetti, A., Bonet, A., Kaiser, J. W., Razinger, M., Schulz, M., Serrar, S., Simmons, A. J., Sofiev, M., Suttie, M., Tompkins, A. M., and Untch, A.: Aerosol analysis and forecast in the European Centre for medium-range weather forecasts integrated forecast system: Forward modeling, J. Geophys. Res.-Atmos., 114, D06206, https://doi.org/10.1029/2008JD011235, 2009. a
Munro, R., Lang, R., Klaes, D., Poli, G., Retscher, C., Lindstrot, R., Huckle, R., Lacan, A., Grzegorski, M., Holdak, A., Kokhanovsky, A., Livschitz, J., and Eisinger, M.: The GOME-2 instrument on the Metop series of satellites: instrument design, calibration, and level 1 data processing – an overview, Atmos. Meas. Tech., 9, 1279–1301, https://doi.org/10.5194/amt-9-1279-2016, 2016. a, b
Nicodemus, F. E., Richmond, J., Hsia, J., Ginsberg, I., and Limperis, T.: Geometrical considerations and nomenclature for reflectance, in: Radiometry, Jones and Bartlett Publishers, Inc., 94–145, 1992. a, b
Noguchi, K., Richter, A., Rozanov, V., Rozanov, A., Burrows, J. P., Irie, H., and Kita, K.: Effect of surface BRDF of various land cover types on geostationary observations of tropospheric NO2, Atmos. Meas. Tech., 7, 3497–3508, https://doi.org/10.5194/amt-7-3497-2014, 2014. a, b
Nüß, H., Richter, A., Valks, P., and Burrows, J.: Improvement of the NO2 total column retrieval for GOME-2, O3M SAF Visiting Scientist Activity, Final Report, IUP University of Bremen, 2006. a
Ohlmann, J. C.: Ocean radiant heating in climate models, J. Climate, 16, 1337–1351, 2003. a
Ortega, I., Koenig, T., Sinreich, R., Thomson, D., and Volkamer, R.: The CU 2-D-MAX-DOAS instrument – Part 1: Retrieval of 3-D distributions of NO2 and azimuth-dependent OVOC ratios, Atmos. Meas. Tech., 8, 2371–2395, https://doi.org/10.5194/amt-8-2371-2015, 2015. a
Palmer, P. I., Jacob, D. J., Chance, K., Martin, R. V., Spurr, R. J., Kurosu, T. P., Bey, I., Yantosca, R., Fiore, A., and Li, Q.: Air mass factor formulation for spectroscopic measurements from satellites: Application to formaldehyde retrievals from the Global Ozone Monitoring Experiment, J. Geophys. Res.-Atmos., 106, 14539–14550, 2001. a
Pinardi, G.: Validation of tropospheric NO2 columns measurements from GOME-2 and OMI using MAX-DOAS and direct sun network observations, in preparation, 2020. a
Pinardi, G., Van Roozendael, M., Lambert, J.-C., Granville, J., Hendrick, F., Tack, F., Yu, H., Cede, A., Kanaya, Y., Irie, I., Goutail, F., Pommereau, J.-P., Pazmino, A., Wittrock, F., Richter, A., Wagner, T., Gu, M., Remmers, J., Friess, U., Vlemmix, T., Piters, A., Hao, N., Tiefengraber, M., Herman, J., Abuhassan, N., Bais, A., Kouremeti, N., Hovila, J., Holla, R., Chong, J., Postylyakov, O., and Ma, J.: GOME-2 total and tropospheric NO2 validation based on zenith-sky, direct-sun and multi-axis DOAS network observations, in: Proc. of the 2014 EUMETSAT Meteorological Satellite Conference, Geneva, Swizerland, EUMETSAT, 2014. a
Pinardi, G., Lambert, J.-C., Granville, J., Yu, H., De Smedt, I., van Roozendael, M., and Valks, P.: O3M-SAF validation report, Tech. rep., SAF/O3M/IASB/VR/NO2/TN-IASB-GOME2-O3MSAF-NO2-2015, Issue 1/1, 2015. a, b, c
Platt, U. and Stutz, J.: Differential Optical Absorption Spectroscopy, Springer, 2008. a
Qin, W., Fasnacht, Z., Haffner, D., Vasilkov, A., Joiner, J., Krotkov, N., Fisher, B., and Spurr, R.: A geometry-dependent surface Lambertian-equivalent reflectivity product for UV–Vis retrievals – Part 1: Evaluation over land surfaces using measurements from OMI at 466 nm, Atmos. Meas. Tech., 12, 3997–4017, https://doi.org/10.5194/amt-12-3997-2019, 2019. a, b
Richter, A., Begoin, M., Hilboll, A., and Burrows, J. P.: An improved NO2 retrieval for the GOME-2 satellite instrument, Atmos. Meas. Tech., 4, 1147–1159, https://doi.org/10.5194/amt-4-1147-2011, 2011. a
Richter, A. et al.: S5P/TROPOMI Science Verification Report, Tech. rep., S5P-IUP-L2-ScVR-RP issue 2.1, 2015. a, b
Richter, A., Behrens, L. K., Hilboll, A., Munassar, S., , Burrows, J. P., Pinardi, G., and Van Roozendael, M.: cloud effects on satellite retrievals of tropospheric NO2 over China, in: 8th International DOAS Workshop, Yokohama, Japan, 2017. a, b
Rozanov, V. V. and Kokhanovsky, A. A.: Semianalytical cloud retrieval algorithm as applied to the cloud top altitude and the cloud geometrical thickness determination from top-of-atmosphere reflectance measurements in the oxygen A band, J. Geophys. Res.-Atmos., 109, D05202, https://doi.org/10.1029/2003JD004104, 2004. a
Russell, A. R., Perring, A. E., Valin, L. C., Bucsela, E. J., Browne, E. C., Wooldridge, P. J., and Cohen, R. C.: A high spatial resolution retrieval of NO2 column densities from OMI: method and evaluation, Atmos. Chem. Phys., 11, 8543–8554, https://doi.org/10.5194/acp-11-8543-2011, 2011. a, b
Russell, G. L. and Lerner, J. A.: A new finite-differencing scheme for the tracer transport equation, J. Appl. Meteorol., 20, 1483–1498, 1981. a
Saiedy, F., Jacobowitz, H., and Wark, D.: On cloud-top determination from Gemini-5, J. Atmos. Sci., 24, 63–69, 1967. a
Sanders, A., Richter, A., and Eskes, H.: Sentinel-4 Level-2 ATBD Total and Tropospheric NO2, Tech. rep., S4-L2-IUP_KNMI-ATBD-2004 issue 2.0, 2018. a
Séférian, R., Baek, S., Boucher, O., Dufresne, J.-L., Decharme, B., Saint-Martin, D., and Roehrig, R.: An interactive ocean surface albedo scheme (OSAv1.0): formulation and evaluation in ARPEGE-Climat (V6.1) and LMDZ (V5A), Geosci. Model Dev., 11, 321–338, https://doi.org/10.5194/gmd-11-321-2018, 2018. a
Skachko, S., Ménard, R., Errera, Q., Christophe, Y., and Chabrillat, S.: EnKF and 4D-Var data assimilation with chemical transport model BASCOE (version 05.06), Geosci. Model Dev., 9, 2893–2908, https://doi.org/10.5194/gmd-9-2893-2016, 2016. a
Spurr, R., Kurosu, T., and Chance, K.: A linearized discrete ordinate radiative transfer model for atmospheric remote-sensing retrieval, J. Quant. Spectrosc. Ra., 68, 689–735, 2001. a
Stammes, P., Sneep, M., De Haan, J., Veefkind, J., Wang, P., and Levelt, P.: Effective cloud fractions from the Ozone Monitoring Instrument: Theoretical framework and validation, J. Geophys. Res.-Atmos., 113, D16S38, https://doi.org/10.1029/2007JD008820, 2008. a
Temperton, C., Hortal, M., and Simmons, A.: A two-time-level semi-Lagrangian global spectral model, Q. J. Roy. Meteor. Soc., 127, 111–127, 2001. a
Theys, N., De Smedt, I., Yu, H., Danckaert, T., van Gent, J., Hörmann, C., Wagner, T., Hedelt, P., Bauer, H., Romahn, F., Pedergnana, M., Loyola, D., and Van Roozendael, M.: Sulfur dioxide retrievals from TROPOMI onboard Sentinel-5 Precursor: algorithm theoretical basis, Atmos. Meas. Tech., 10, 119–153, https://doi.org/10.5194/amt-10-119-2017, 2017. a
Tilstra, L., Tuinder, O., Wang, P., and Stammes, P.: Surface reflectivity climatologies from UV to NIR determined from Earth observations by GOME-2 and SCIAMACHY, J. Geophys. Res.-Atmos., 122, 4084–4111, 2017. a, b, c, d, e, f
Tilstra, L., Tuinder, O., and Stammes, P.: GOME-2 surface LER product – Algorithm Theoretical Basis Document, Tech. rep., KNMI Report SAF/AC/KNMI/ATBD/003, Issue 3.1, 2019. a, b, c, d
Torres, O., Ahn, C., and Chen, Z.: Improvements to the OMI near-UV aerosol algorithm using A-train CALIOP and AIRS observations, Atmos. Meas. Tech., 6, 3257–3270, https://doi.org/10.5194/amt-6-3257-2013, 2013. a
Valin, L. C., Russell, A. R., Hudman, R. C., and Cohen, R. C.: Effects of model resolution on the interpretation of satellite NO2 observations, Atmos. Chem. Phys., 11, 11647–11655, https://doi.org/10.5194/acp-11-11647-2011, 2011. a, b
Valks, P., Pinardi, G., Richter, A., Lambert, J.-C., Hao, N., Loyola, D., Van Roozendael, M., and Emmadi, S.: Operational total and tropospheric NO2 column retrieval for GOME-2, Atmos. Meas. Tech., 4, 1491–1514, https://doi.org/10.5194/amt-4-1491-2011, 2011. a, b, c, d
Valks, P., Loyola, D., Hao, N., Hedelt, P., Slijkhuis, S., Grossi, M., Begoin, M., Gimeno Garcia, S., and Lutz, R.: Algorithm Theoretical Basis Document for GOME-2 Total Column Products of Ozone, NO2, BrO, SO2, H2O, HCHO and Cloud Properties (GDP 4.8 for AC SAF OTO and NTO), Tech. rep., SAF/AC/DLR/ATBD/01, Iss./Rev.: 3/A/2, 2017. a, b
van Geffen, J., Boersma, K., Eskes, H., Maasakkers, J., and Veefkind, J.: TROPOMI ATBD of the total and tropospheric NO2 data products, Tech. rep., S5P-KNMI-L2-0005-RP issue 1.4.0., 2019. a, b, c
van Geffen, J. H. G. M., Eskes, H. J., Boersma, K. F., and Veefkind, J. P.: ATBD for NO2 in Sentinel-5 L2 Prototype Processors, Tech. rep., KNMI-ESA-S5L2PP-ATBD-001 version 3.0., 2018. a
Van Roozendael, M., Spurr, R., Loyola, D., Lerot, C., Balis, D., Lambert, J.-C., Zimmer, W., van Gent, J., van Geffen, J., Koukouli, M., Granville, J., Doicu, A., Fayt, C., and Zehner, C.: Ten years of GOME/ERS-2 total ozone data–The new GOME data processor (GDP) version 4: 1. Algorithm description, J. Geophys. Res.-Atmos., 111, D14311, https://doi.org/10.1029/2005JD006375, 2006. a
Vasilkov, A., Joiner, J., Spurr, R., Bhartia, P. K., Levelt, P., and Stephens, G.: Evaluation of the OMI cloud pressures derived from rotational Raman scattering by comparisons with other satellite data and radiative transfer simulations, J. Geophys. Res.-Atmos., 113, D15S19, https://doi.org/10.1029/2007JD008689, 2008. a
Vasilkov, A., Qin, W., Krotkov, N., Lamsal, L., Spurr, R., Haffner, D., Joiner, J., Yang, E.-S., and Marchenko, S.: Accounting for the effects of surface BRDF on satellite cloud and trace-gas retrievals: a new approach based on geometry-dependent Lambertian equivalent reflectivity applied to OMI algorithms, Atmos. Meas. Tech., 10, 333–349, https://doi.org/10.5194/amt-10-333-2017, 2017. a, b, c
Veefkind, J., Aben, I., McMullan, K., Förster, H., De Vries, J., Otter, G., Claas, J., Eskes, H., De Haan, J., Kleipool, Q., van Weele, M., Hasekamp, O., Hoogeveen, R., Landgraf, J., Snel, R., Tol, P., Ingmann, P., Voors, R., Kruizinga, B., Vink, R., Visser, H., and Levelt, P.: TROPOMI on the ESA Sentinel-5 Precursor: A GMES mission for global observations of the atmospheric composition for climate, air quality and ozone layer applications, Remote Sens. Environ., 120, 70–83, 2012. a
Vlemmix, T., Hendrick, F., Pinardi, G., De Smedt, I., Fayt, C., Hermans, C., Piters, A., Wang, P., Levelt, P., and Van Roozendael, M.: MAX-DOAS observations of aerosols, formaldehyde and nitrogen dioxide in the Beijing area: comparison of two profile retrieval approaches, Atmos. Meas. Tech., 8, 941–963, https://doi.org/10.5194/amt-8-941-2015, 2015. a
Wagner, T., Dix, B. v., Friedeburg, C. v., Frieß, U., Sanghavi, S., Sinreich, R., and Platt, U.: MAX-DOAS O4 measurements: A new technique to derive information on atmospheric aerosols–Principles and information content, J. Geophys. Res.-Atmos., 109, D22205, https://doi.org/10.1029/2004JD004904, 2004. a, b
Wagner, T., Beirle, S., Brauers, T., Deutschmann, T., Frieß, U., Hak, C., Halla, J. D., Heue, K. P., Junkermann, W., Li, X., Platt, U., and Pundt-Gruber, I.: Inversion of tropospheric profiles of aerosol extinction and HCHO and NO2 mixing ratios from MAX-DOAS observations in Milano during the summer of 2003 and comparison with independent data sets, Atmos. Meas. Tech., 4, 2685–2715, https://doi.org/10.5194/amt-4-2685-2011, 2011. a
Wang, P., Tuinder, O. N. E., Tilstra, L. G., de Graaf, M., and Stammes, P.: Interpretation of FRESCO cloud retrievals in case of absorbing aerosol events, Atmos. Chem. Phys., 12, 9057–9077, https://doi.org/10.5194/acp-12-9057-2012, 2012. a
Wang, Y., Beirle, S., Lampel, J., Koukouli, M., De Smedt, I., Theys, N., Li, A., Wu, D., Xie, P., Liu, C., Van Roozendael, M., Stavrakou, T., Müller, J.-F., and Wagner, T.: Validation of OMI, GOME-2A and GOME-2B tropospheric NO2, SO2 and HCHO products using MAX-DOAS observations from 2011 to 2014 in Wuxi, China: investigation of the effects of priori profiles and aerosols on the satellite products, Atmos. Chem. Phys., 17, 5007–5033, https://doi.org/10.5194/acp-17-5007-2017, 2017. a, b
Williams, J. E., Scheele, M. P., van Velthoven, P. F. J., Cammas, J.-P., Thouret, V., Galy-Lacaux, C., and Volz-Thomas, A.: The influence of biogenic emissions from Africa on tropical tropospheric ozone during 2006: a global modeling study, Atmos. Chem. Phys., 9, 5729–5749, https://doi.org/10.5194/acp-9-5729-2009, 2009. a
Williams, J. E., van Velthoven, P. F. J., and Brenninkmeijer, C. A. M.: Quantifying the uncertainty in simulating global tropospheric composition due to the variability in global emission estimates of Biogenic Volatile Organic Compounds, Atmos. Chem. Phys., 13, 2857–2891, https://doi.org/10.5194/acp-13-2857-2013, 2013. a, b, c, d
Williams, J. E., Boersma, K. F., Le Sager, P., and Verstraeten, W. W.: The high-resolution version of TM5-MP for optimized satellite retrievals: description and validation, Geosci. Model Dev., 10, 721–750, https://doi.org/10.5194/gmd-10-721-2017, 2017. a, b
Wittrock, F., Oetjen, H., Richter, A., Fietkau, S., Medeke, T., Rozanov, A., and Burrows, J. P.: MAX-DOAS measurements of atmospheric trace gases in Ny-Ålesund – Radiative transfer studies and their application, Atmos. Chem. Phys., 4, 955–966, https://doi.org/10.5194/acp-4-955-2004, 2004. a
Wu, F. C., Xie, P. H., Li, A., Chan, K. L., Hartl, A., Wang, Y., Si, F. Q., Zeng, Y., Qin, M., Xu, J., Liu, J. G., Liu, W. Q., and Wenig, M.: Observations of SO2 and NO2 by mobile DOAS in the Guangzhou eastern area during the Asian Games 2010, Atmos. Meas. Tech., 6, 2277–2292, https://doi.org/10.5194/amt-6-2277-2013, 2013. a
Yamaji, K., Ikeda, K., Irie, H., Kurokawa, J.-I., and Ohara, T.: Influence of model grid resolution on NO2 vertical column densities over East Asia, J. Air Waste Manage., 64, 436–444, 2014. a
Yang, F., Tan, J., Zhao, Q., Du, Z., He, K., Ma, Y., Duan, F., Chen, G., and Zhao, Q.: Characteristics of PM2.5 speciation in representative megacities and across China, Atmos. Chem. Phys., 11, 5207–5219, https://doi.org/10.5194/acp-11-5207-2011, 2011. a
Zhou, Y., Brunner, D., Spurr, R. J. D., Boersma, K. F., Sneep, M., Popp, C., and Buchmann, B.: Accounting for surface reflectance anisotropy in satellite retrievals of tropospheric NO2, Atmos. Meas. Tech., 3, 1185–1203, https://doi.org/10.5194/amt-3-1185-2010, 2010. a, b
- Abstract
- Introduction
- Reference retrieval for GOME-2 NO2 measurements
- Improved AMF calculation
- Implicit aerosol correction
- Tropospheric NO2 validation
- Conclusions
- Appendix A: Comparison of anthropogenic NOx emissions
- Appendix B: Validation for different MAXDOAS stations
- Data availability
- Author contributions
- Competing interests
- Acknowledgements
- Financial support
- Review statement
- References


