the Creative Commons Attribution 4.0 License.
the Creative Commons Attribution 4.0 License.
 | 01 Mar 2021
Laboratory validation of a compact single-scattering albedo (SSA) monitor
Julia Perim de Faria
Andrew Freedman
Timothy B. Onasch
Andreas Petzold
An evaluation of the performance and relative accuracy of a Cavity Attenuated Phase-Shift Single Scattering Albedo Monitor (CAPS PMSSA; Aerodyne Research, Inc.) was conducted in an optical-closure study with proven technologies: Cavity Attenuated Phase-Shift Particle Extinction Monitor (CAPS PMex; Aerodyne Research, Inc.), three-wavelength integrating nephelometer (TSI Model 3563) and three-wavelength filter-based Particle Soot Absorption Photometer (PSAP; Radiance Research Inc.). The evaluation was conducted by connecting the instruments to a controlled aerosol generation system and comparing the measured scattering, extinction and absorption coefficients measured by the CAPS PMSSA with the independent measurements. Three different particle types were used to generate aerosol samples with single-scattering albedos (SSAs) ranging from 0.4 to 1.0 at 630 nm wavelength. The CAPS PMSSA measurements compared well with the proven technologies. Extinction measurement comparisons exhibited a slope of the linear regression line for the full dataset between 1.05 and 1.01, an intercept below m−1 (±1.5 Mm−1), and a regression coefficient R2>0.99, whereas scattering measurements had a slope between 0.90 and 1.04, an intercept of less than m−1 (2.0 Mm−1), and a coefficient R2>0.96. The derived CAPS PMSSA absorption compared well to the PSAP measurements for the small particle sizes and modest (0.4 to 0.6) SSA values tested, with a linear regression slope between 0.90 and 1.07, an intercept of m−1 (3.0 Mm−1), and a coefficient R2>0.99. For the SSA measurements, agreement was highest (regression slopes within 1 %) for SSA =1.0 particles at extinction levels of per tens of inverse megameters and above; however, as extinctions approach 0, small uncertainties in the baseline can introduce larger errors. SSA measurements for absorbing particles exhibited absolute differences up to 18 %, though it is not clear which measurement had the best relative accuracy. For a given particle type, the CAPS PMSSA instrument exhibited the lowest scatter around the average. This study demonstrates that the CAPS PMSSA is a robust and reliable instrument for the direct measurement of the scattering and extinction coefficients and thus SSA. This conclusion also holds for the indirect measurement of the absorption coefficient with the constraint that the relative accuracy of this particular determination degrades as the SSA and particle size increases.
- Article
(4630 KB) - Full-text XML
- BibTeX
- EndNote


Airborne aerosols impact climate directly though the interaction with incident solar light by scattering, generating a cooling effect, or by absorbing it and reemitting infrared radiation, having a heating effect. According to Haywood and Shine (1995), the effect of aerosols on the atmospheric radiation budget in the visible spectral range depends on the aerosol optical depth (AOD), the single-scattering albedo (SSA) and the backscattered fraction (BF). The radiative forcing efficiency (RFE) describes the resulting aerosol direct forcing per unit AOD (Andrews et al., 2011; Sheridan et al., 2012; Haywood and Shine, 1995) and is widely used to describe the radiative impact of a given aerosol type. As an aerosol-intensive parameter, the RFE value depends only on SSA and BF. As is stated in the latest Intergovernmental Panel on Climate Change (IPCC) report (Boucher et al., 2013), uncertainties in SSA and the vertical distribution of aerosol contribute significantly to the overall uncertainties in the direct aerosol radiative forcing, while AOD and aerosol size distribution are relatively well constrained.
The measurement of SSA requires the simultaneous but independent observation of two parameters since, by definition, the SSA is the ratio of the scattering (σsp) to the extinction (σep) coefficient (where extinction is the sum of the scattering and absorption (σap) coefficient – see Eqs. (1) and (2); the index p refers to the contribution of aerosol particles to overall light extinction, which also has a contribution by gas molecules, identified by the index g, which is not shown in the equation).
Measuring all three aerosol optical coefficients independently allows for the closure of optical properties and thus the determination of the relative uncertainties in the involved instruments.
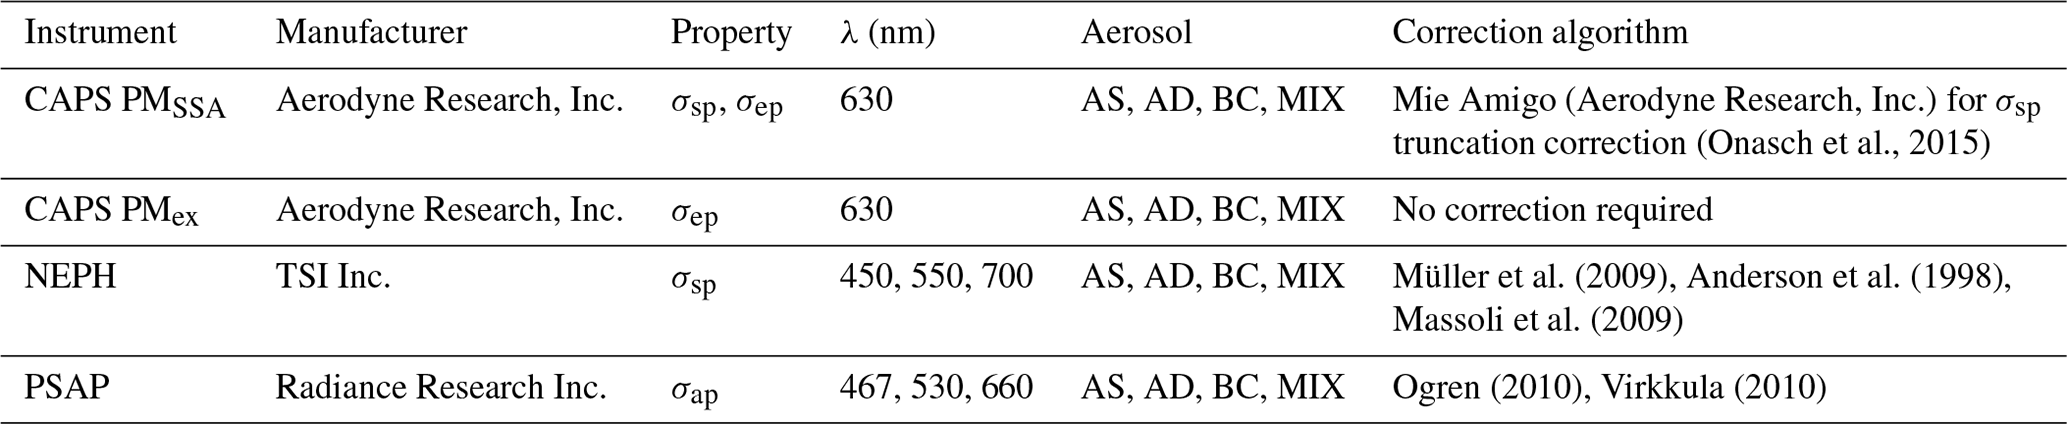
The aerosol optical parameters are typically measured in situ by instruments such as integrating nephelometers (NEPHs) for σsp (Heintzenberg and Charlson, 1996); photoacoustic (see e.g., Lack et al., 2006; Arnott et al., 2006) and filter-based methods such as the Particle Soot Absorption Photometer (PSAP; Bond et al., 1999), the Multi Angle Absorption Photometer (MAAP; Petzold and Schönlinner, 2004) and more recently the Tricolor Absorption Photometer (TAP/CLAP; Ogren et al., 2017) for the absorption coefficient; and for σep, cavity ring down (CRD) technology (Moosmüller et al., 2005) or, since 2007, the Cavity Attenuated Phase-Shift Particle Extinction Monitor (CAPS PMex) (Massoli et al., 2010). Determining the SSA using the optical-closure approach involves separate instruments with different principles and uncertainties, leading to potential sources of significant errors and biases.
A novel instrument based on cavity-attenuated phase-shift technology and incorporating an integrating sphere was recently developed by Aerodyne Research, Inc. This novel instrument represents a major step forward in the observation of aerosol optical properties since it simultaneously measures two of the three aerosol optical parameters from the same air sample, reducing the potential sources of sampling biases (Onasch et al., 2015). The two main applications of the Cavity Attenuated Phase-Shift Single Scattering Albedo Monitor (CAPS PMSSA) instrument, apart from the direct measurement of scattering and extinction coefficients, are the indirect measurement of the aerosol absorption coefficient and of the single-scattering albedo. A few recent in situ application studies of the CAPS PMSSA instrument are already available (Han et al., 2017; Corbin et al., 2018). The present optical-closure study intends to quantify relative uncertainties in the measurement of the primary aerosol optical properties and the resulting SSA by the CAPS PMSSA for several types of laboratory aerosol by applying a full set of established instrumentation for measuring the extinction (CAPS PMex), absorption (PSAP) and scattering (integrating nephelometer, TSI Model 3563) coefficients at multiple wavelengths.
2.1 Instrumental setup
The laboratory study was conceived to evaluate the operational principle of the CAPS PMSSA and its performance and relative accuracy when compared to proven technologies. The instrumental setup used is shown in Fig. 1.
In this study, similar to previous work (Massoli et al., 2010; Petzold et al., 2013; Massoli et al., 2010), two collision-type aerosol generators (TSI Model 3076) were used: one containing a solution of deionized water and purely scattering material (ammonium sulfate, AS) and a second containing absorbing material, water-soluble colloidal graphite (Aquadag – AD – from Agar Scientific) or black carbon (REGAL 400R Pigment Black – BC – from Cabot Corporation). The SSA of the dispersed aerosol ranged from approximately 0.4 (pure AD or BC) to 1.0 (pure AS), with the modal value of the particle size distribution being below 100 nm in all cases. A drying tube filled with silica gel was positioned after each particle generator in order to reduce the relative humidity to below 30 %. Once the samples were passed through the dryer, they entered a mixing chamber, where effective ensemble particle SSA values of could be produced by mixing aerosol flows containing both absorbing and scattering aerosols. The aerosol generation setup specifications are shown in Table 1, whereas Table 2 compiles the information about the applied instruments and correction schemes. The SSA of the mixture containing AS and AD was controlled by the online-measured SSA measured by the CAPS PMSSA.
Five mass flow controllers (MFCs), two at each generator's head and a third after the mixing chamber, supplied particle-free compressed air to the sample both to reach the desired humidity and particle number concentration and to make-up the flow required by the instruments. The particle number concentration was measured by a condensation particle counter (CPC).
Table 1Type of generated aerosol, targeted SSA (630 nm) and targeted max. aerosol extinction values.
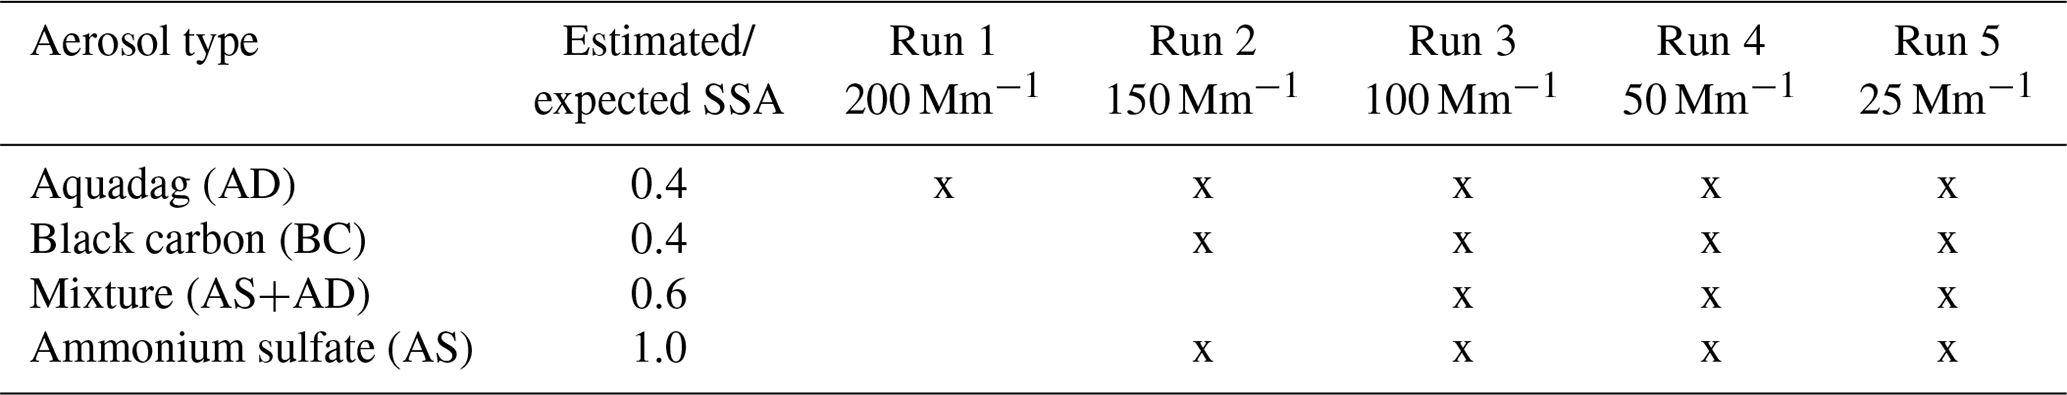
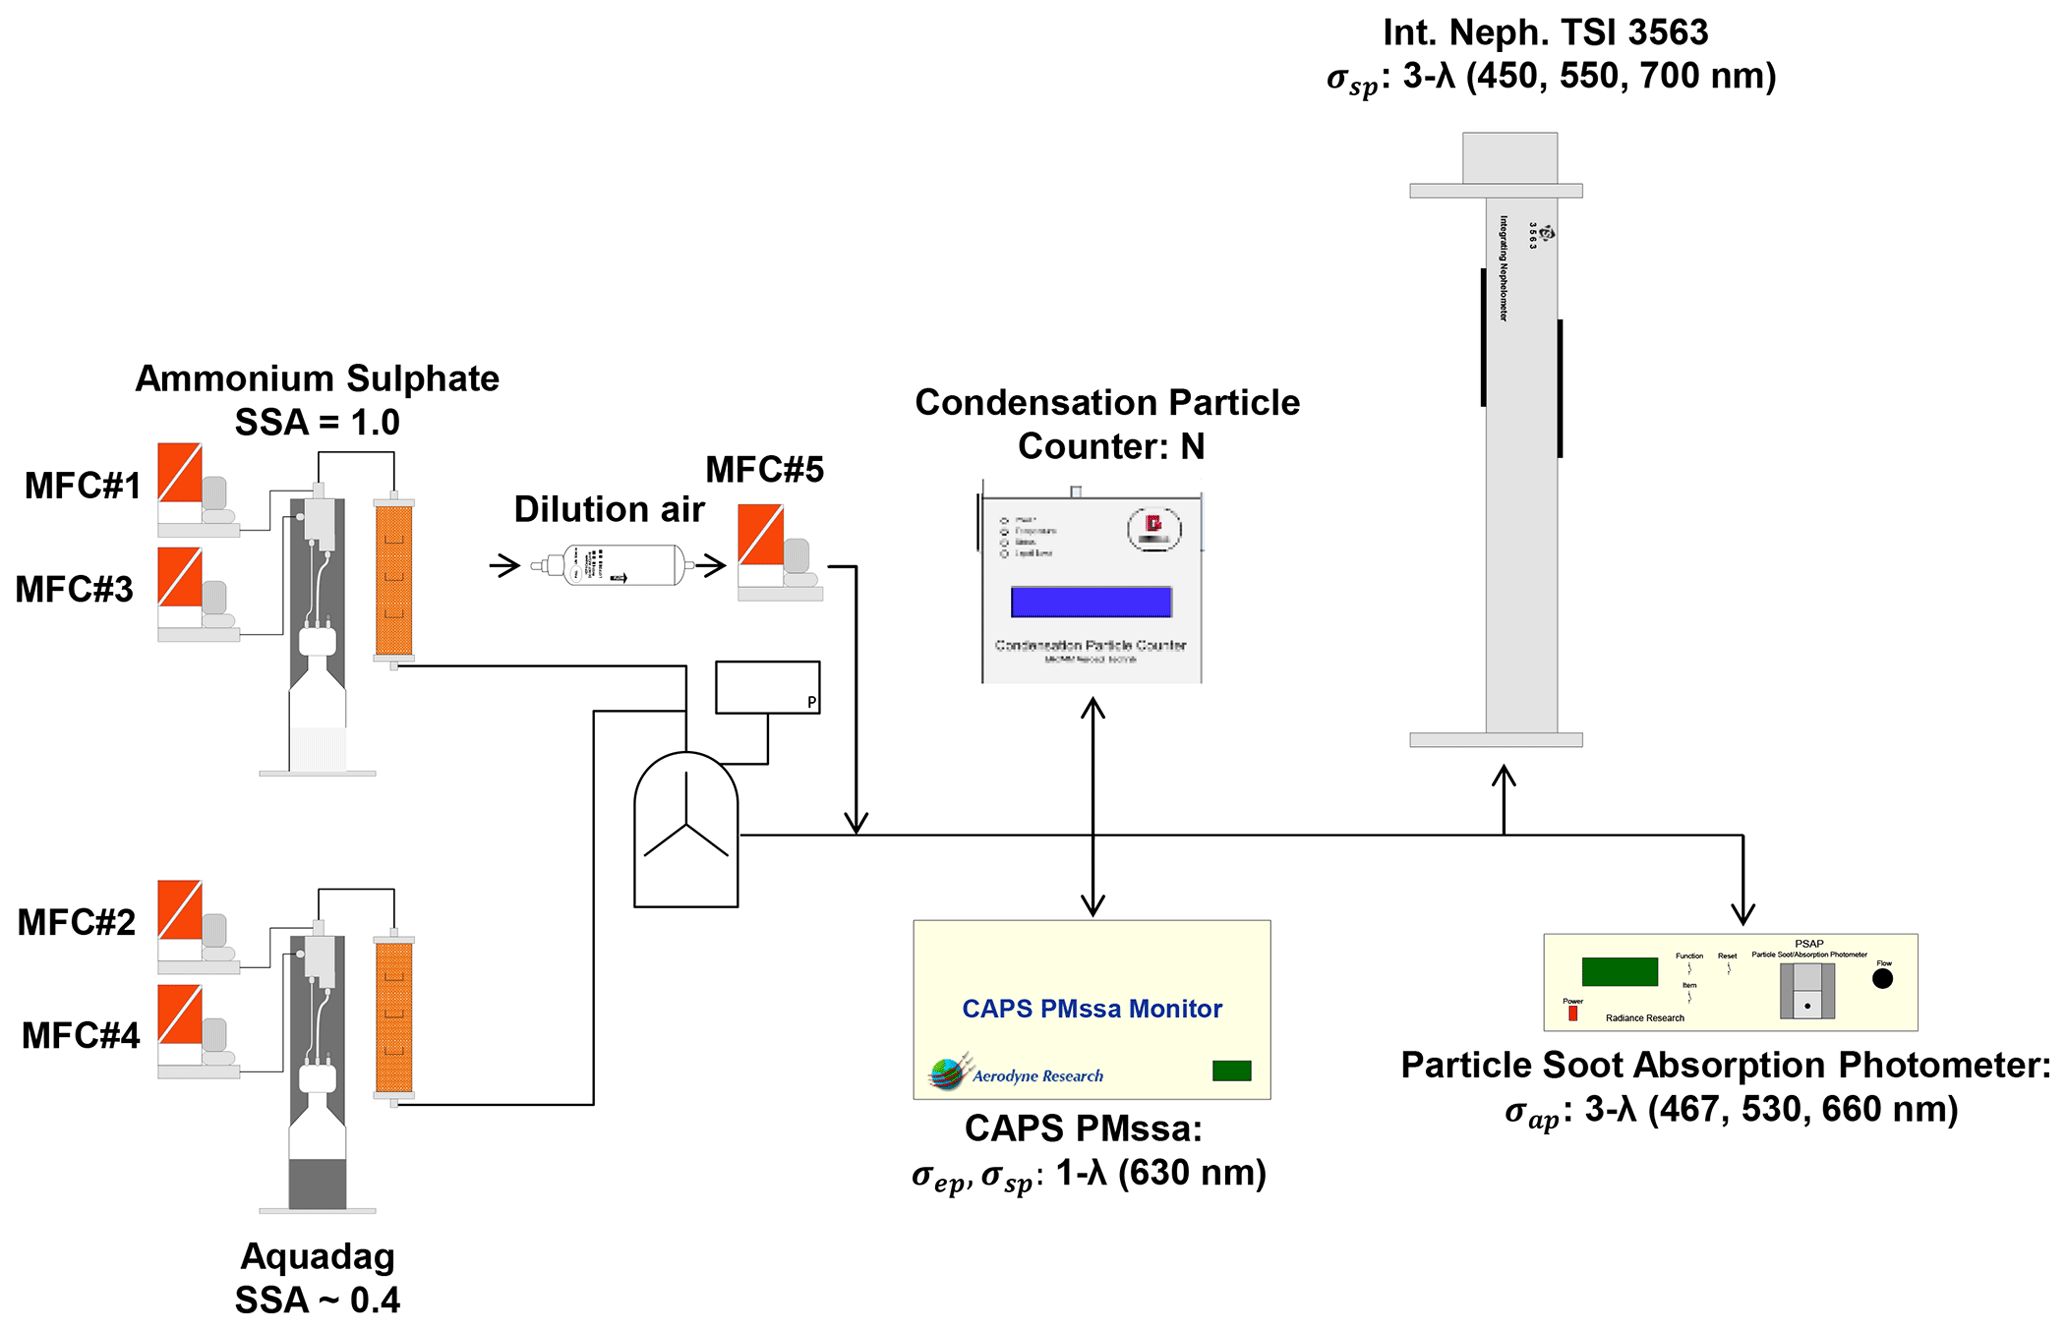
Table 2List and specifications of optical instrumentation and applied correction algorithms.
The samples were produced at up to five nominal concentration levels, as shown in Table 1, defined by the aerosol extinction. This was achieved by holding the aerosol generation system constant (MFC 1–MFC 4) and regulating the diluting air (MFC 5). Extinction coefficient levels were varied from ∼10 up to 200 Mm−1. For each level, a sampling time of at least 5 min was sustained.
To ensure an isoaxial, isokinetic sampling by all instruments, special sampling tips made of stainless steel were designed such that the sample air extraction tips were each concentrically placed along the center line of the sample tube of 1 in. inner diameter. The inlet nozzle diameters are dimensioned such that the flow velocities in the sample tube and inside extraction tip nozzles match. Distances between the extraction points for the different instruments were 20 cm.
The nephelometer was calibrated using CO2 (high-span gas) and particle-free air (low-span gas) before starting the experiments. The calibration procedure also includes, as recommended by the manufacturers, the calibration of the scattering channel of the CAPS PMSSA against the extinction channel of the instrument. For the filter-based absorption instruments, no calibration is necessary since they both operate with a blank filter in parallel as reference (see description in the subsections below).
The optical instruments were placed downstream from the generation system, measuring simultaneously, as shown, and are described in more detail in the following subsections.
2.1.1 Integrating nephelometer
In this optical-closure study, an integrating nephelometer (NEPH) of the type TSI Model 3563 was used. The NEPH collects scattering measurements both in the forward and backscatter directions at three wavelengths: 450, 550 and 700 nm (Heintzenberg et al., 2006).
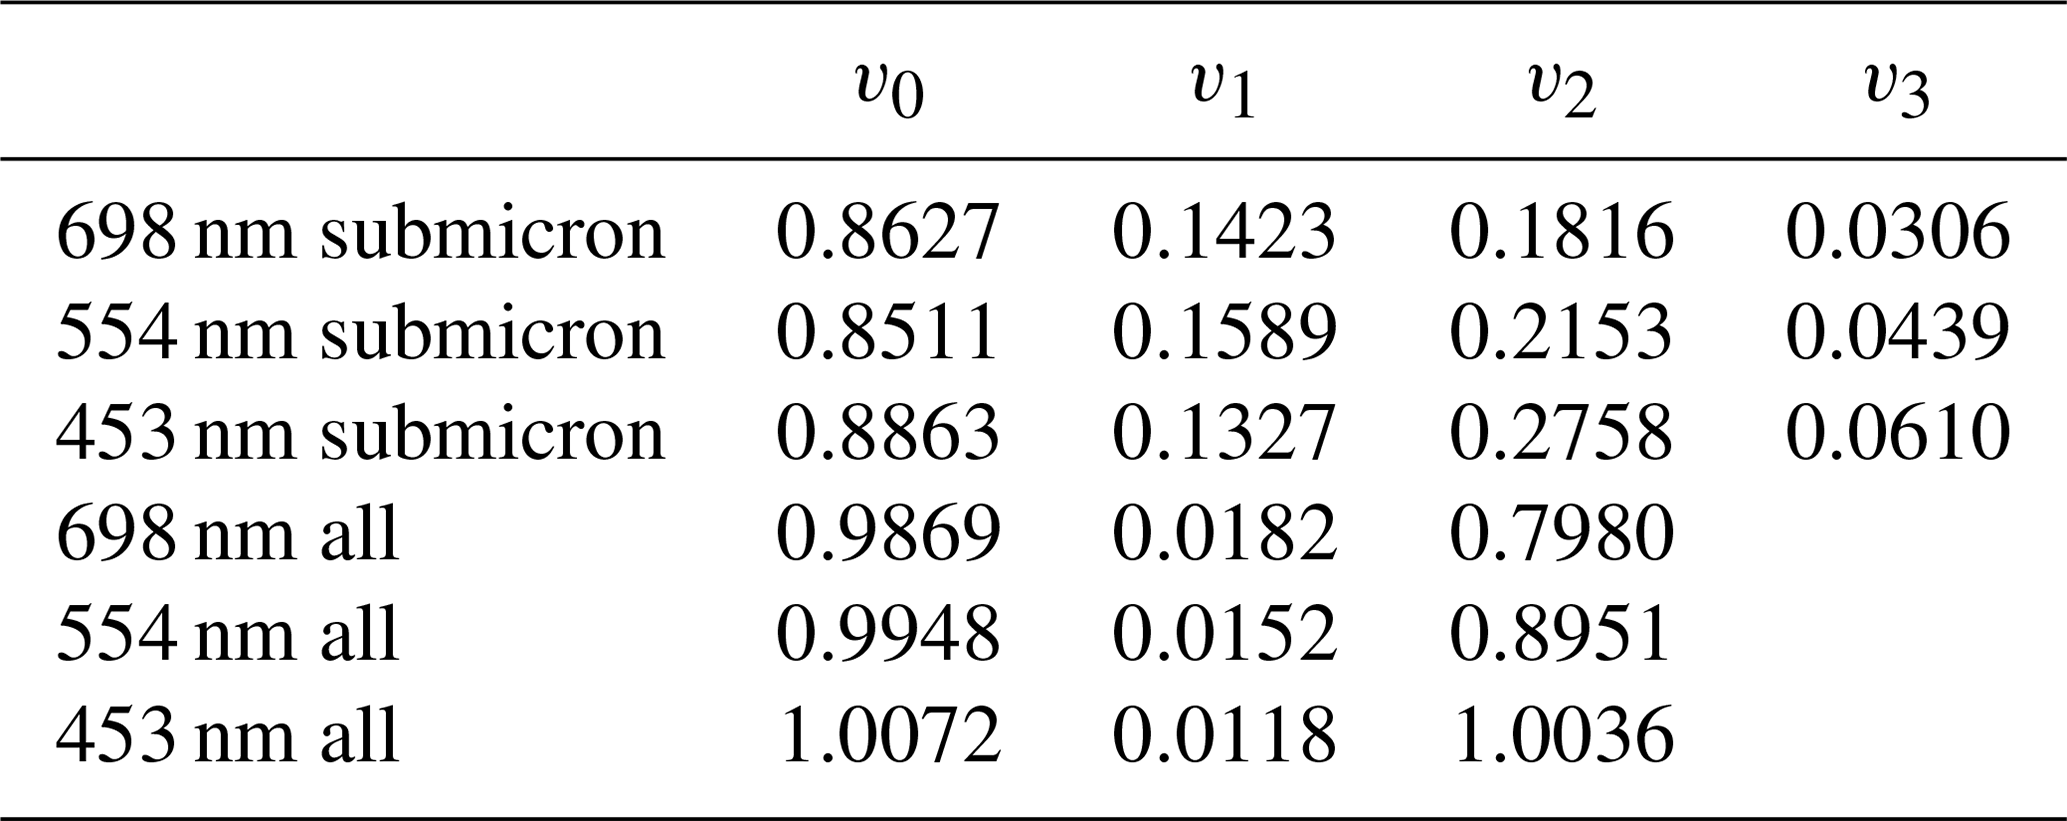
The NEPH data were corrected for truncation angle effects using the approach proposed by Massoli et al. (2009) for strongly light-absorbing aerosols (Eqs. 3 and 4 and Table 3).
where å is the Ångström exponent (for definition see Eq. 8 later in the text), and C(n) is an optional correction for submicron distributions. C(n) is equal to 0 for å≥2.8 and to
and v0, v1, v2 and v3 are given in Table 3, and n is the real part of the refractive indices.
Table 3Coefficient values for v0, v1, v2, and v3 for Eqs. (3) and (4) (Massoli et al., 2009).
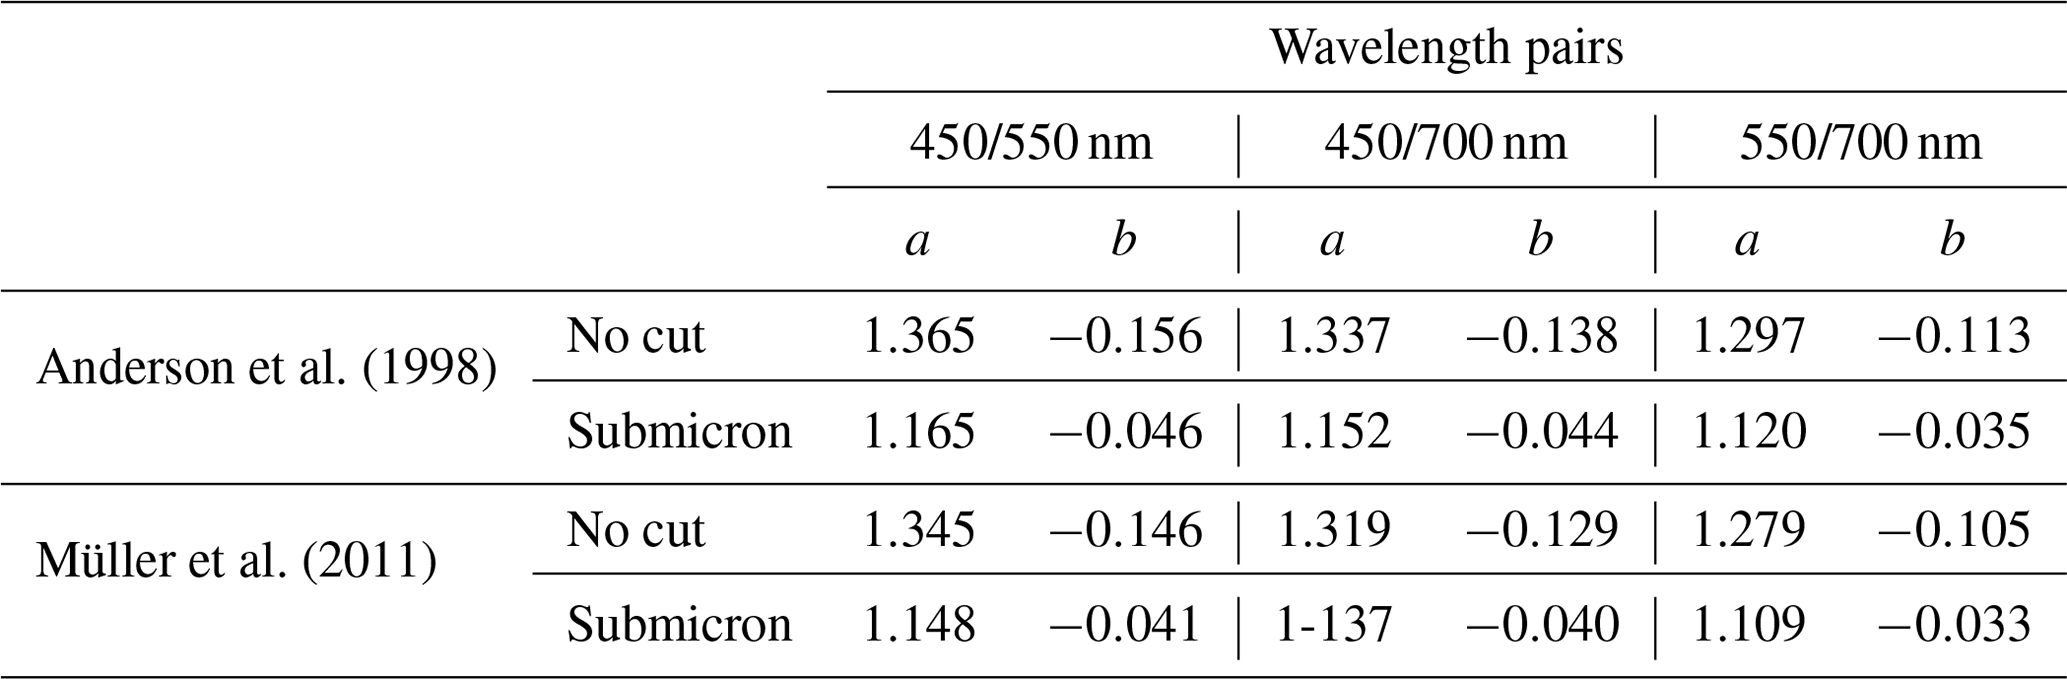
For predominantly light-scattering aerosols, the approaches proposed by Anderson et al. (1996) and Müller et al. (2009) were used (Eq. 5 and Table 4).
Table 4Values for a and b for Eq. (5) for Anderson and Ogren (1998) and Müller et al. (2011).
2.1.2 Particle Soot Absorption Photometer
The PSAP is a filter-based three-wavelength (467, 530, 660 nm) instrument, manufactured by Radiance Research Inc., that provides continuous measurement of the light absorption coefficient. The instrument uses two spots on a quartz fiber filter; one receives the particle-containing sample and the second clean air. The instrument measures the difference in the transmission of light between a loaded and a blank filter spot (Bond et al., 1999). Two absorption coefficient data corrections were used and evaluated: Ogren (2010) and Virkkula (2010). The best-fitting correction is the one shown in each result subsection.
In his approach, Ogren (2010) furthers the corrections from Bond et al. (1999), considering the filter area correction and wavelength adjustment, as shown in Eq. (6), for the complete absorption coefficient measurement.
where σap is the absorption coefficient of the desired wavelength, QPSAP is the flow recorded by the instrument, Qmeas is the measured flow, Ameas is the real area of the filter, APSAP is the manufacturer-supplied area of the filter, σPSAP is the measured absorption coefficient at a certain wavelength (λ), K1 and K2 are constants given (0.02±0.02 and 1.22±0.20, respectively), and σsp is measured at the same wavelength as σPSAP.
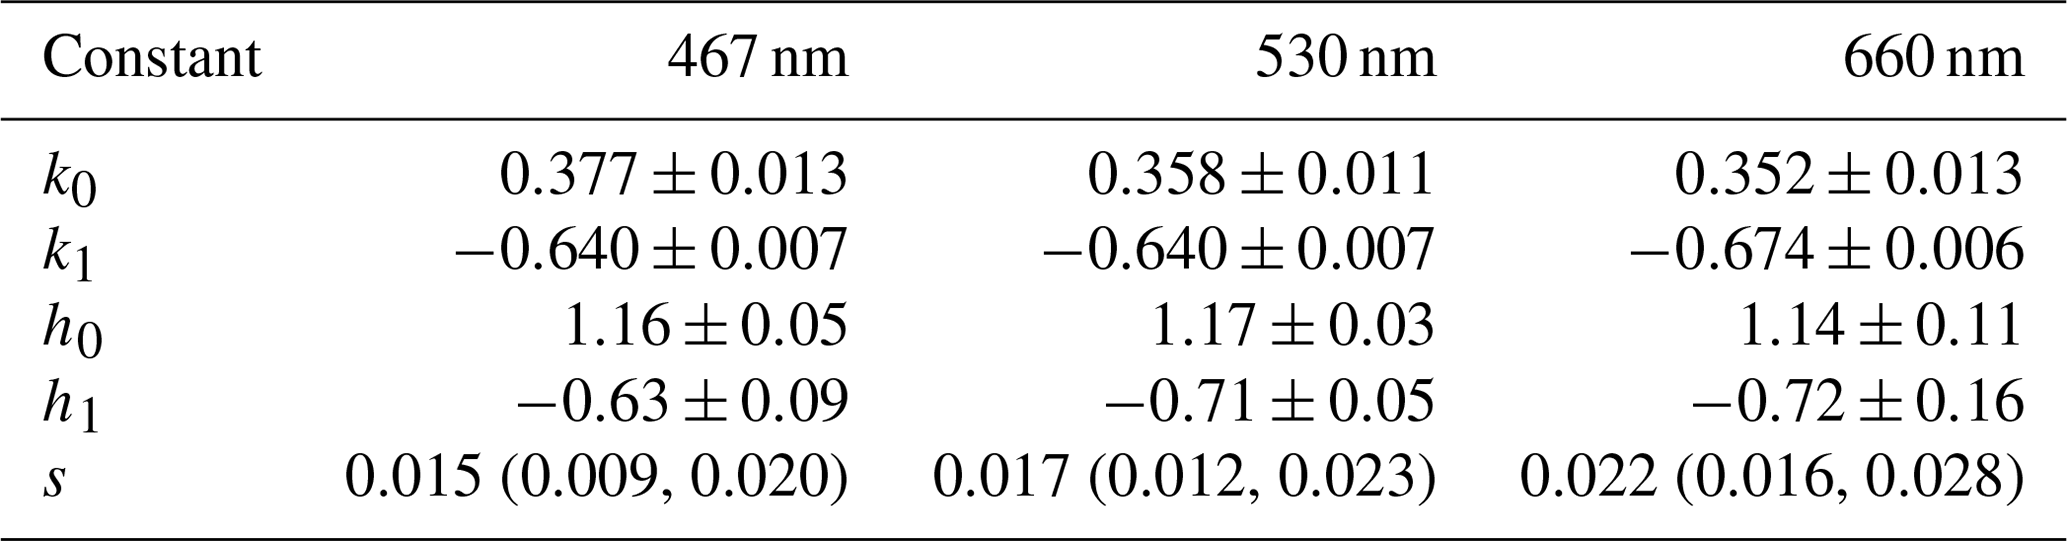
Virkkula (2010) derives a new correction from a field campaign, including as a function factor the single-scattering albedo, as shown in Eq. (7).
where σap is the absorption coefficient of the desired wavelength; k0, k1, h0, h1 and s are constants given (Table 5); ω0 is the single-scattering albedo; and Tr is the measured transmission measured at the same wavelength as σPSAP.
Table 5Constant values given by Virkkula (2010) for Eq. (7). For parameter s min. and max. values are reported in parentheses.
2.1.3 The CAPS PMex
The CAPS PMex system, described in detail and assessed in several studies, such as Massoli et al. (2010), Petzold et al. (2013) and Perim de Faria et al. (2017), measures light extinction by determining the change in signal phase shift caused by the introduction of particles into an optical cavity relative to the particle-free baseline measurement. The use of high-reflectivity mirrors (approximately 99.99 % reflectivity) in the optical cavity creates the long measurement path of approximately 2 km required to measure very low values of light extinction (limit of detection of 1–2 Mm−1 in 1 s sample period).

Figure 2Overview of the main components and operation principle of the CAPS PMex instrument (Massoli et al., 2010).
2.1.4 The CAPS PMSSA
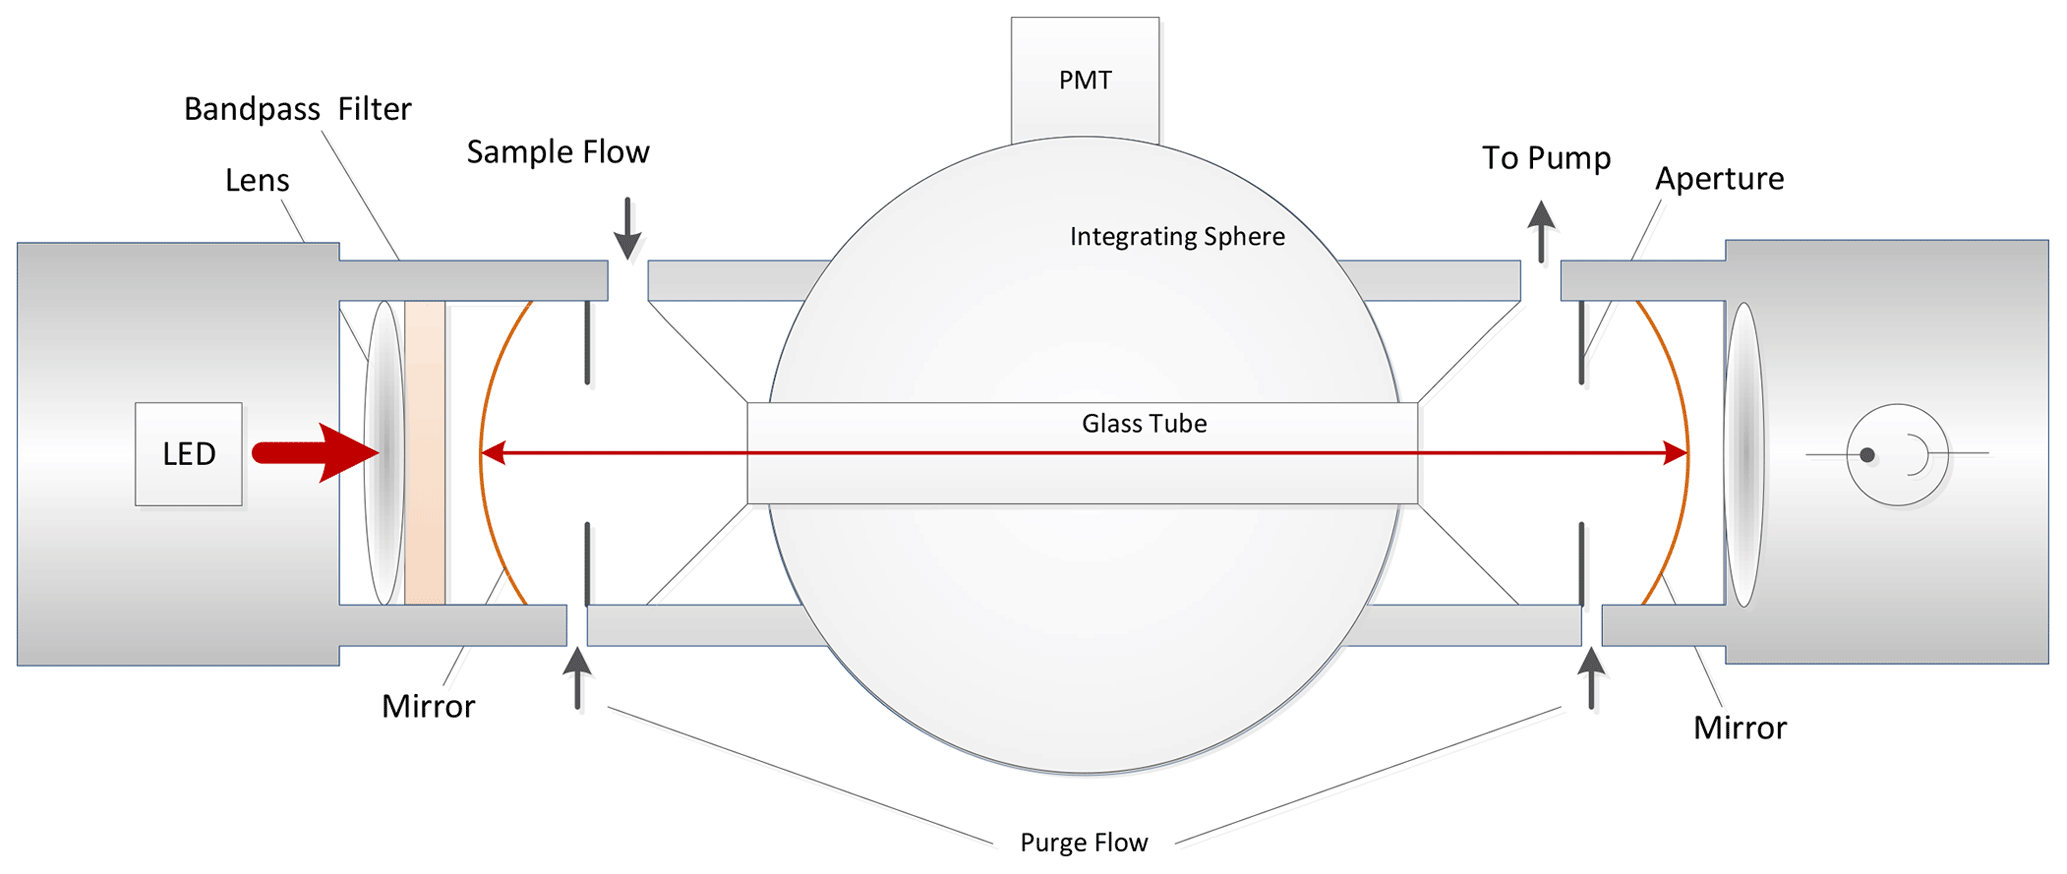
The CAPS PMSSA (Onasch et al., 2015) uses the same principle to measure light extinction as the CAPS PMex, but it also contains, located at the center of the measurement cell, a 10 cm diameter integrating sphere capable of measuring light scattering on the same aerosol sample, as shown in Fig. 3. The integrating sphere acts as an integrating nephelometer, which measures the scattering of light by particles at all angles, only excluding the near 0 and near 180∘ angles since the opening of the extinction chamber is located in these directions, allowing the sample and light beam to pass through. The sphere shows 98 %–99 % Lambertian reflectance efficiency due to its high-reflectivity coating (Avian D from Avian Technologies). The usage of an integrating sphere increases the collection of scattered light at the photomultiplier compared to a traditional cosine-corrected detector arrangement.
The scattering channel is calibrated against the extinction channel using either small particles (<250 nm) that have SSA =1.0 or CO2 and set equal to the extinction measurement. This calibration procedure also allows the user to prove monitor linearity over a wide range of optical extinctions without the limitation of using individual gases normally used for nephelometer calibrations. Checking the calibration by using CO2, we observed neglectable differences to the expected literature value for CO2.
The sample flow in the instrument is set to 0.85 L min−1 and is controlled by a critical orifice. The measurement sample enters the chamber at one end and exits through an opening located at the other end flowing through a glass tube inside the integrating sphere (Fig. 3). The mirrors are kept particle-free by a continuously flowing purge flow (25 cm3 min−1). Petzold at al. (2013) showed that this purge flow shortens the measurement path and dilutes the sample and requires a correction factor. As done for the CAPS PMex, a new correction factor was developed by using monodisperse polystyrene latex spheres (PSLs) of known size for the CAPS PMSSA. Due to the cell geometry, the new correction factor was slightly larger than the one found for the extinction monitor: 1.37 and 1.27, respectively (Onasch et al., 2015). The noise of the instrument, truncation angle and instrument uncertainty have also been studied by Onasch et al. (2015). The noise levels were <1 Mm−1 (1σ, 1 s) for all wavelengths. For the case of this particular instrument (630 nm), the truncation correction was determined to be <4 % for typical ambient conditions. The uncertainty was estimated at ±0.03 for SSA equal to 1 (PSL and ammonium sulfate) and decreases to ±0.01 as the SSA goes down.
The baseline determination system is identical to the one used in the CAPS PMex, in which filtered and thus particle-free sample air fills the measurement chamber, and is used to quantify contributions of gas molecules to the instrument response by Rayleigh scattering and potential absorption of light as well as to determine interferences of system components. Both the CAPS PMex and CAPS PMSSA used in this study operate at a wavelength of 630 nm and thus show minimal interference from absorption by ambient gaseous species like NO2 and H2O.
2.2 Data treatment
All multi-wavelength instruments were adjusted to match the other instruments' wavelengths for the intercomparison by using the Ångström exponent approach (see Eqs. 8 and 9):
where å is the Ångström exponent, σ is the optical property measured (extinction, scattering or absorption coefficient), x and y are the operating wavelengths of the instrument, and w refers to the wavelength to which the property should be adjusted. For a better understanding of the wavelength adjustment, the complete description is given in Fig. 3 from Petzold et al. (2013).
All instruments provide 1 s resolution data. Data were collected over 5 min for each experimental point to remove any effect of differences in response times and fluctuations in the aerosol generation system. In Fig. 5 the data were averaged for each extinction, scattering and absorption level, and the standard deviation was calculated from the mean.
Standard linear-regression analysis was performed for the 10 s average of the dataset.
2.3 Measurement uncertainties
This paper does not address in any explicit way, nor was it designed to address, the question of the absolute uncertainties in the different measurement techniques. It was designed to address the question of whether the instrument combinations agree within uncertainties for a range of laboratory aerosols. Thus, the results are given in correlation coefficients (slope and intercept) and their statistical uncertainties.
For this reason, this section compiles the reported relative uncertainties in the accuracy by the relevant instrument papers.
Table 6Measurement relative uncertainties in the accuracy for the different instruments as reported by the relevant instrument papers.
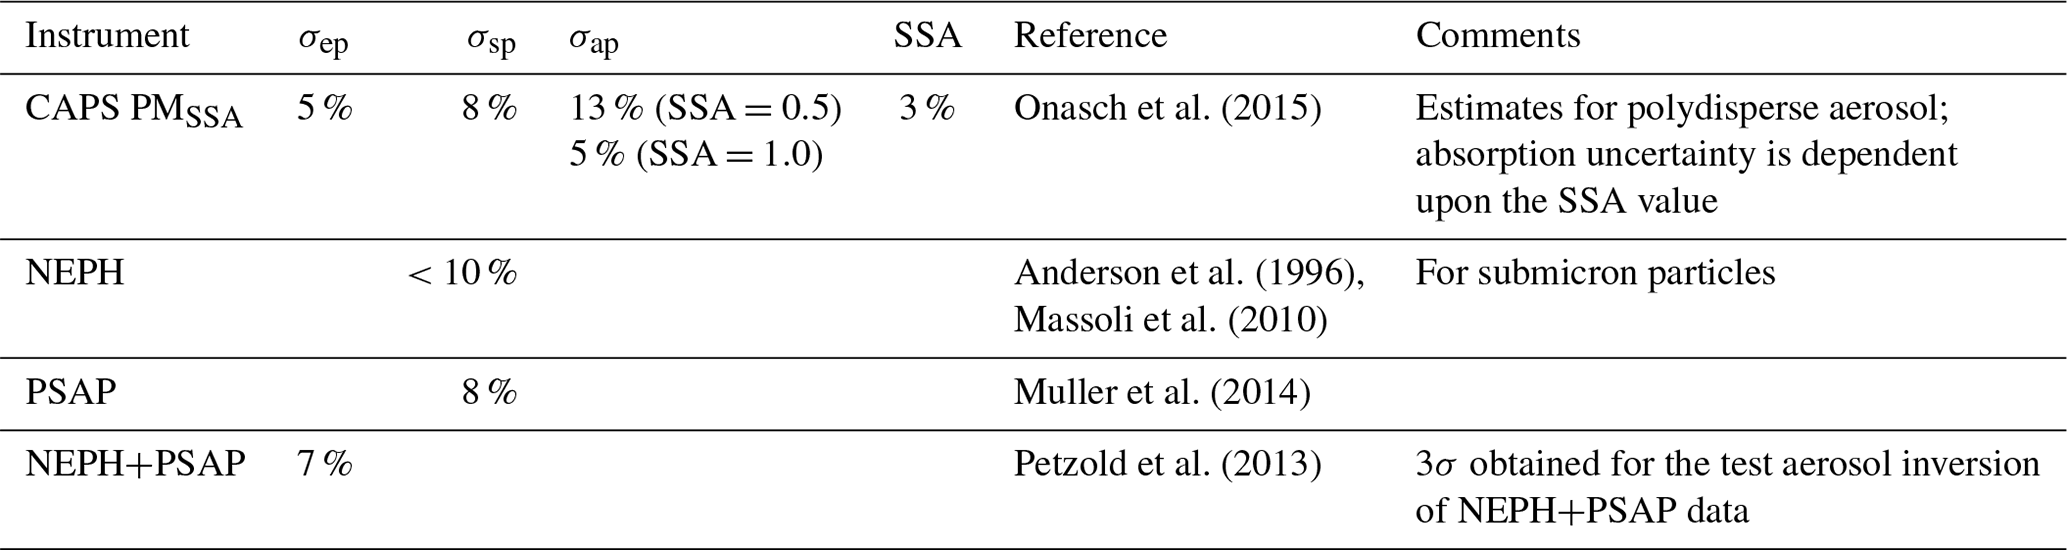
Using the reported relative uncertainties in the accuracy in Table 6, we calculated the derived uncertainties using Gaussian error propagation for SSA and the absorption coefficient for all instrument combinations. The formulas are derived in Appendix A, and the associated graphs Fig. 13 until Fig. 15 are shown. They are summarized as follows: for the CAPS PMSSA monitor the relative error (as defined by rel_err for the observable ) depends on the SSA and on the aerosol load of the test aerosol as stated by Onasch et al. (2015). This dependency is best visible during transitions of the aerosol production system, where the SSA varies with time and where the particle load is poorly correlated with σsps of about 10 Mm−1. Here the relative error ranges within 6 %–13 % for 1 Hz data (2 %–4 % for 10 s averaged data). For high aerosol loads the relative error ranges within 8 %–10 % for 1 Hz data (2.5 %–3 % for 10 s averaged data). For the absorption coefficient derived from the CAPS SSA monitor the relative uncertainty rises with higher SSA values from 8 % (SSA =0.25) up to 25 % (SSA =0.65) for 1 Hz data (2.5 %–8 % for 10 s averaged data, respectively).
The relative-error analysis of the SSA shows that the CAPS PMSSA instrument is less sensitive to the aerosol load (8 % for 1Hz data and 2.5 % for 10 s averaged data) compared to the proven PSAP+NEPH instrument combination, which shows a pronounced dependence but is in principle more robust towards low aerosol load.
In this section, we present the results and relevant discussion of findings for the optical-closure study. All the measurements presented here were corrected to the CAPS PMSSA operational wavelength of 630 nm.
3.1 Extinction coefficient
The extinction coefficient measured by the CAPS PMSSA was analyzed in comparison with proven technologies. On the direct measurement of σep, we compared the two CAPS systems for AS and AD (Petzold et al., 2013). The direct measurement of σep from the CAPS PMSSA was also compared with the indirect measurement given by the sum of the absorption coefficient measured by the PSAP, with σsp measured by the NEPH for BC, AD and MIX (as defined in Table 1) – shown as PSAP+NEPH. For AS with the measured SSA value of 1.0, extinction coefficients provided by the CAPS extinction channels and scattering coefficients provided by the CAPS scattering channel and the NEPH instrument are used for the evaluation of the light-scattering measurements in the next subsection. The time series for the extinction channels are shown in Fig. 4, and the averages and standard deviations for each test point are shown in Table A1. The higher variability observed in the last plot of the figure is due to particle load fluctuations from the generation system when operating at very high loads.
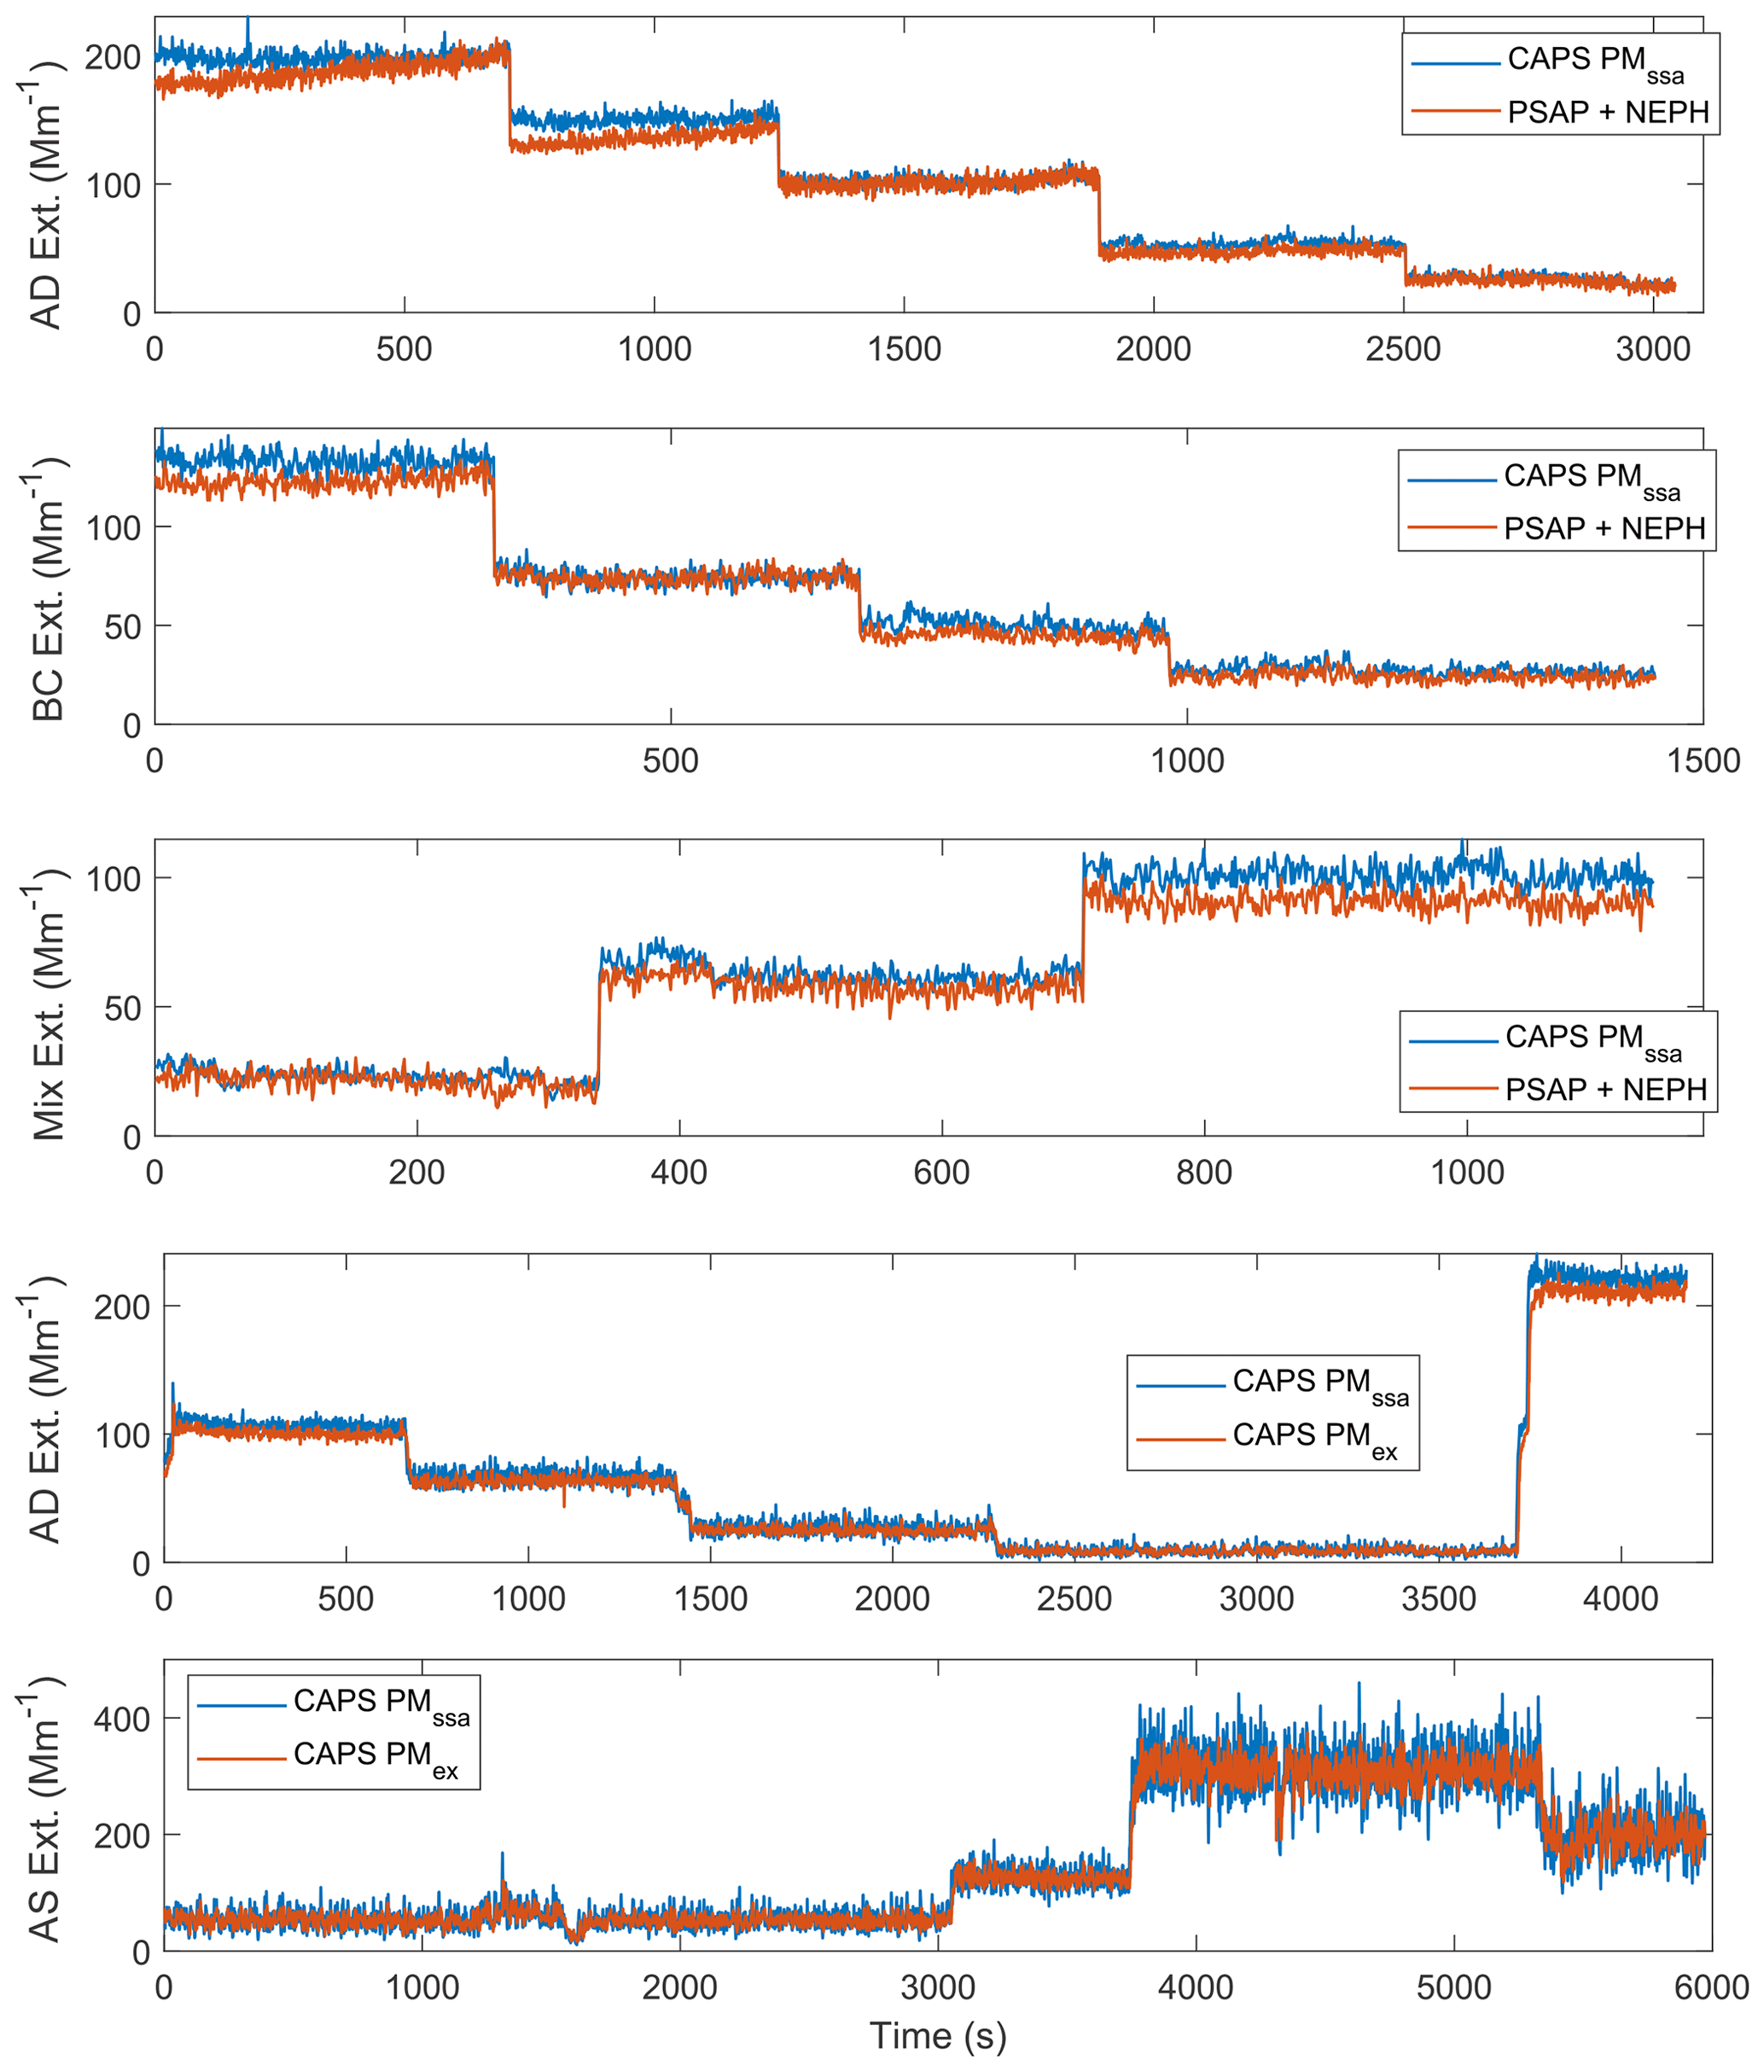
Figure 4Time series (1 Hz) of the simultaneously measured extinction coefficients by the different instruments. Instruments used: CAPS PMex, CAPS PMSSA and the sum of absorption and scattering coefficients measured by PSAP and NEPH as noted in the legend for the individual subplots. The test aerosols used are noted in the caption of the y axis of the individual subplots.
Figure 5 shows the scatterplot of the average value and standard deviation for each level of measured extinction coefficient for the two CAPS systems for AD and AS and the comparison with the sum of the NEPH and PSAP for AD and BC. The best results for the AD and BC were found when applying the Massoli et al. (2009) correction – with the assumption that no particle size cut has been used for the inlet system (no-cut approach) – to the NEPH data, and when applying Virkkula (2010) for strongly light-absorbing aerosols AD and BC to the PSAP data. For the mixture, the applied corrections were Anderson and Ogren (1998) for the NEPH data and Ogren (2010) for the PSAP data. The extinction channels from the two CAPS and the sum of the NEPH and PSAP (PSAP+NEPH) signals show a good agreement for all aerosol types, with linear regression (10 s average data) slopes (m) between 1.01 and 1.06, offsets (b) <1.1 Mm−1, and correlation coefficients above 0.99. The slopes of the regression analysis of the 10 s averaged data (see Fig. 6 as an example) and their standard deviation are shown in Table 7 as a function of the sampled aerosol type and associated single-scattering (SSA) albedo. As can be seen there is no systematic difference in the slope with increase or decrease in the aerosol SSA. These differences are within the combined uncertainties in measurements.
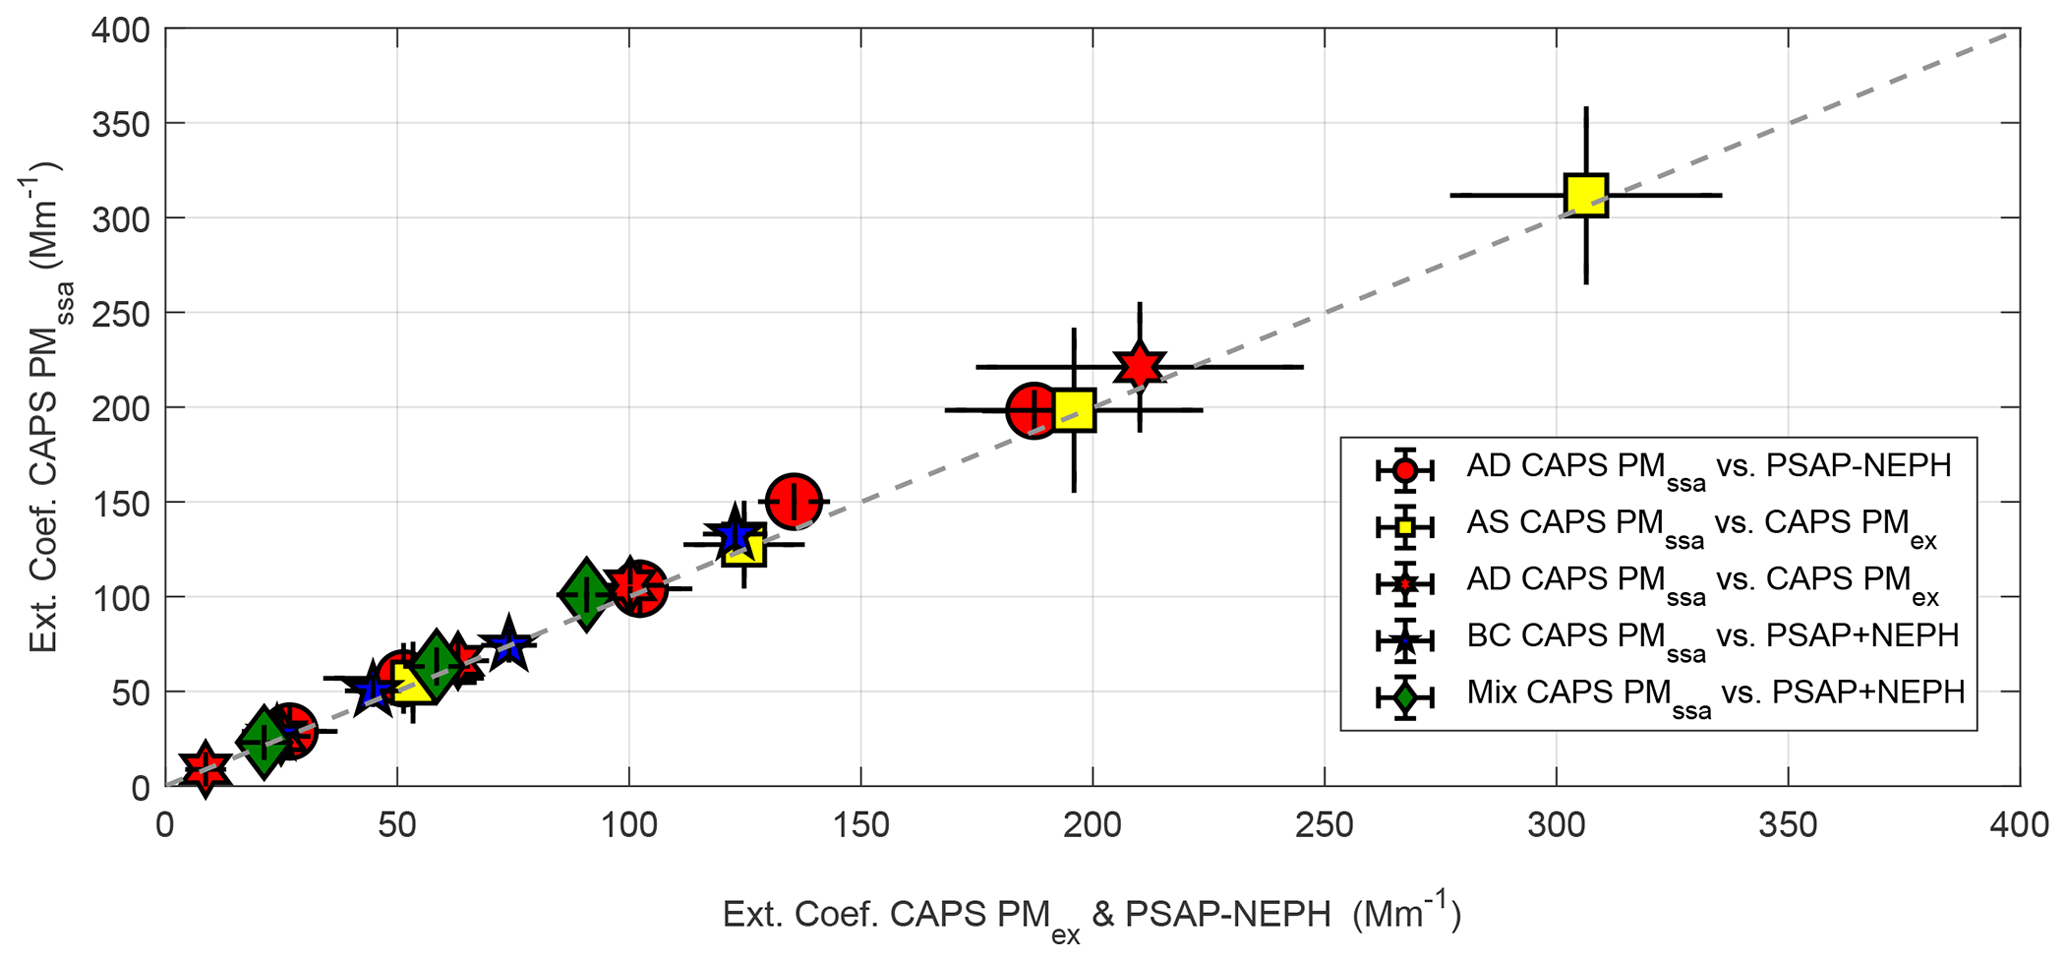
Figure 5Comparison result (mean value and standard deviation for each level) of the extinction channel of the CAPS PMSSA with the CAPS PMex and the combination PSAP+NEPH for the different aerosol types (dashed line is the identity line, i.e., 1:1 line).
Table 7Linear-regression parameters obtained by fitting 10 s averaged data including the slope (M), standard deviation of the slope (SD m), intercept (B), standard deviation of intercept (SD b) and linear-regression coefficient (R2) for the comparison of the CAPS PMSSA extinction channel with proven technologies.

n/a: not available.
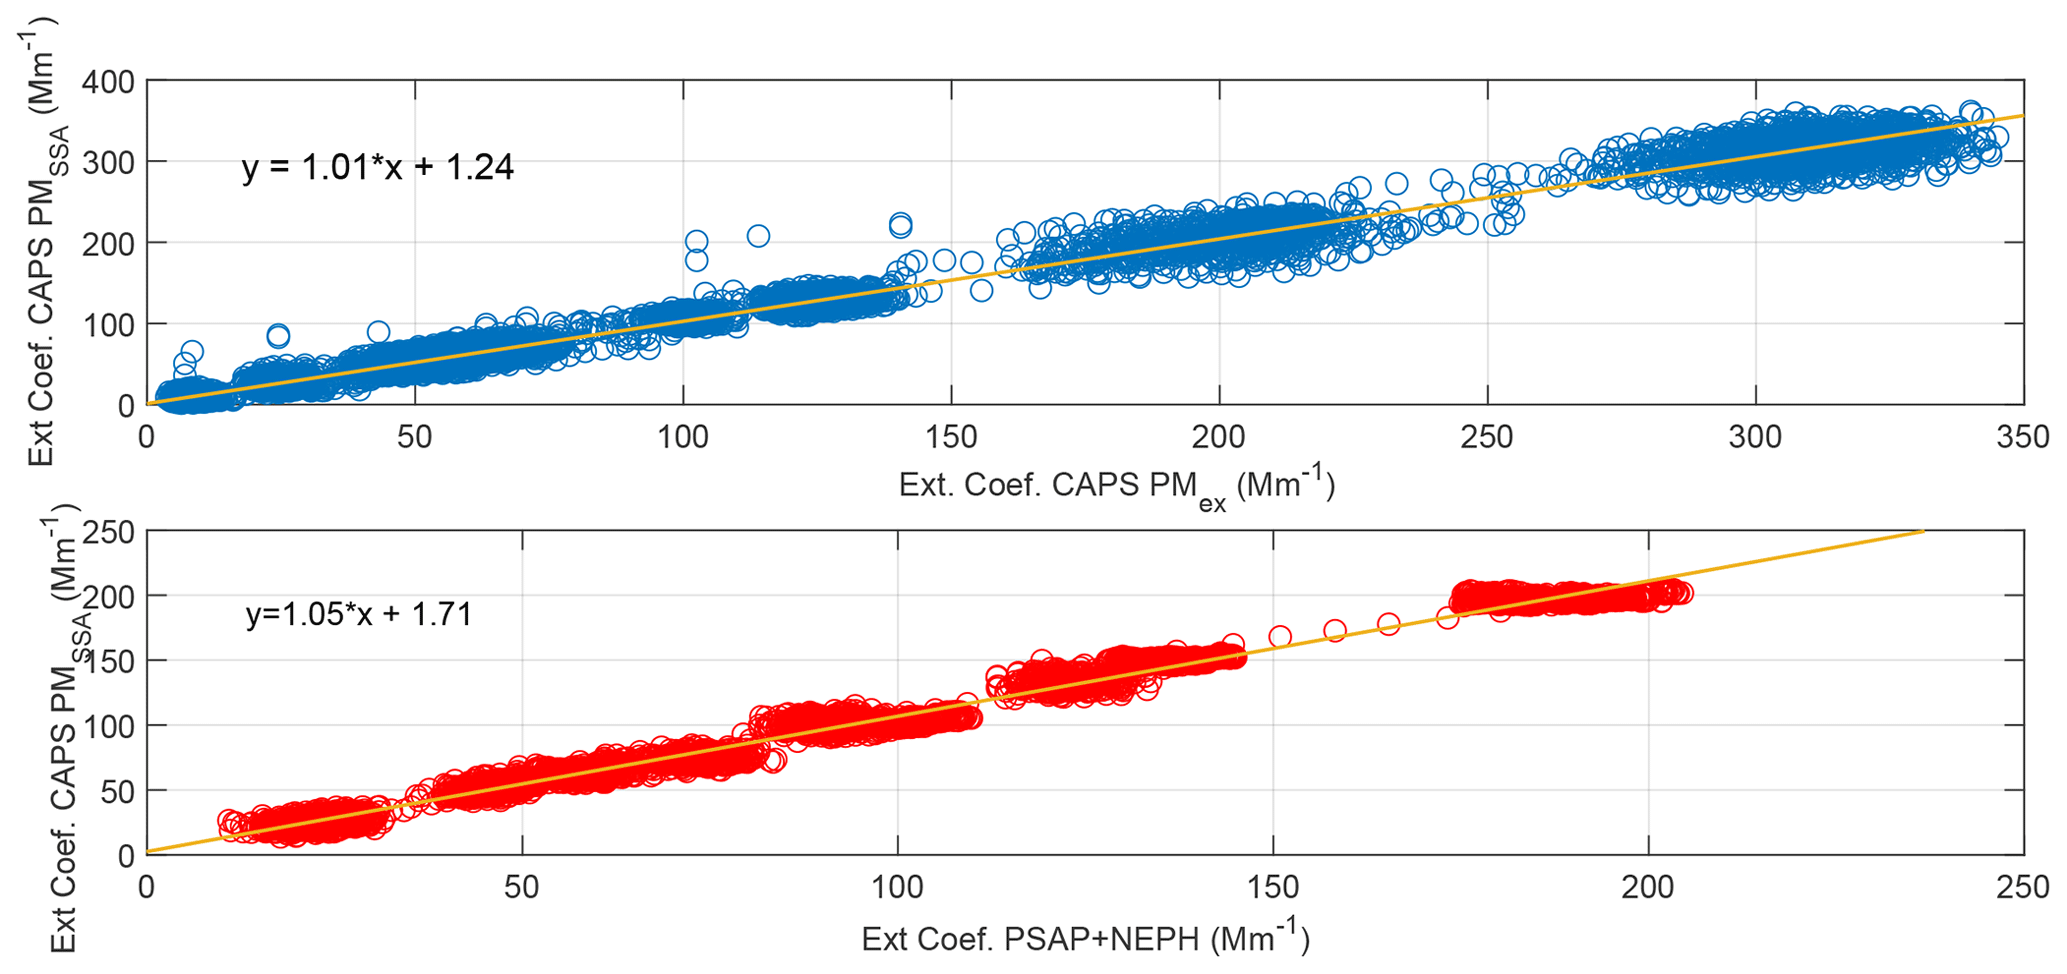
Figure 6Scatterplot and regression line and equation of σep measured by the CAPS PMSSA and by proven technologies for all tested aerosols for the 10 s average data.
It is worth noting that for the particular instruments used in our study, the standard deviation for the extinction data of the CAPS PMSSA is larger than for the extinction data provided by the CAPS PMex (horizontal error bars in Fig. 5). This finding is shown in the histogram of the extinction channel from one measurement level (in this case the used dataset refers to the 25 Mm−1 target level for AD aerosol) for both pieces of equipment (Fig. 7). Thus, the precision of this particular CAPS PMSSA is lower than the precision of the CAPS PMex. Regarding the precision of the CAPS PMSSA in comparison with proven technologies, the standard deviations found in this study for both cases are comparable. The precision in the CAPS PMex and PSAP+NEPH extinction measurements found in this study is very similar to that found by Petzold et al. (2013), in which an excellent correlation (slope of 0.99) was found for the laboratory comparison between the same instruments using highly absorbing aerosol, purely scattering aerosol and mixtures of both.
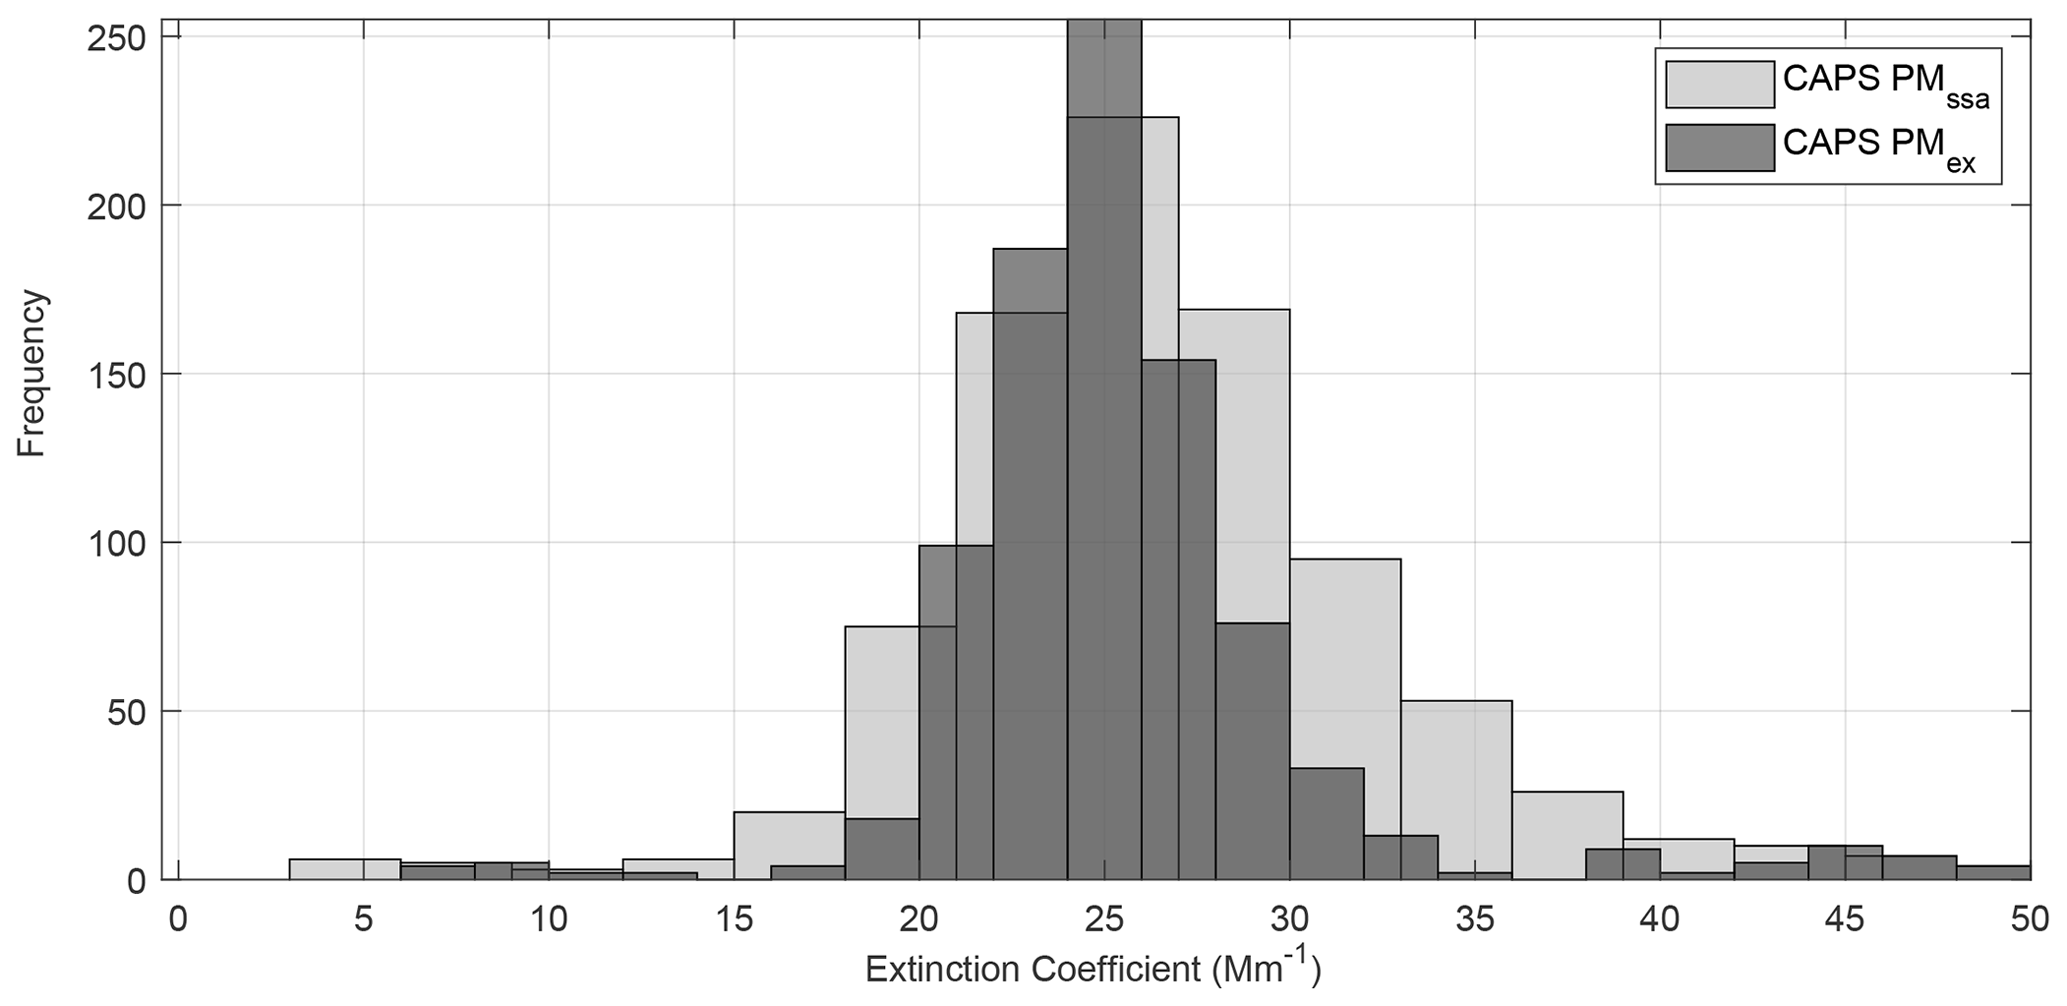
Figure 7Frequency of extinction coefficient measurement for the CAPS PMSSA and PMex systems at the nominal 25 Mm−1 (level 5) test point for AD.
3.2 Scattering coefficient
The scattering channel of the CAPS PMSSA was evaluated in comparison to the NEPH measurements for AD, BC, AS and MIX (Table 1). The time series of scattering coefficient data for the various aerosol runs is shown in Fig. 8. Appendix Table A2 shows the average and 1σ for the targeted scattering coefficient levels. Within the reported error margins of the two instruments, we could observe a systematic deviation neither in the average nor in the standard deviation of the measured values. The precision of both instruments for the measurement of scattering coefficient is very similar.
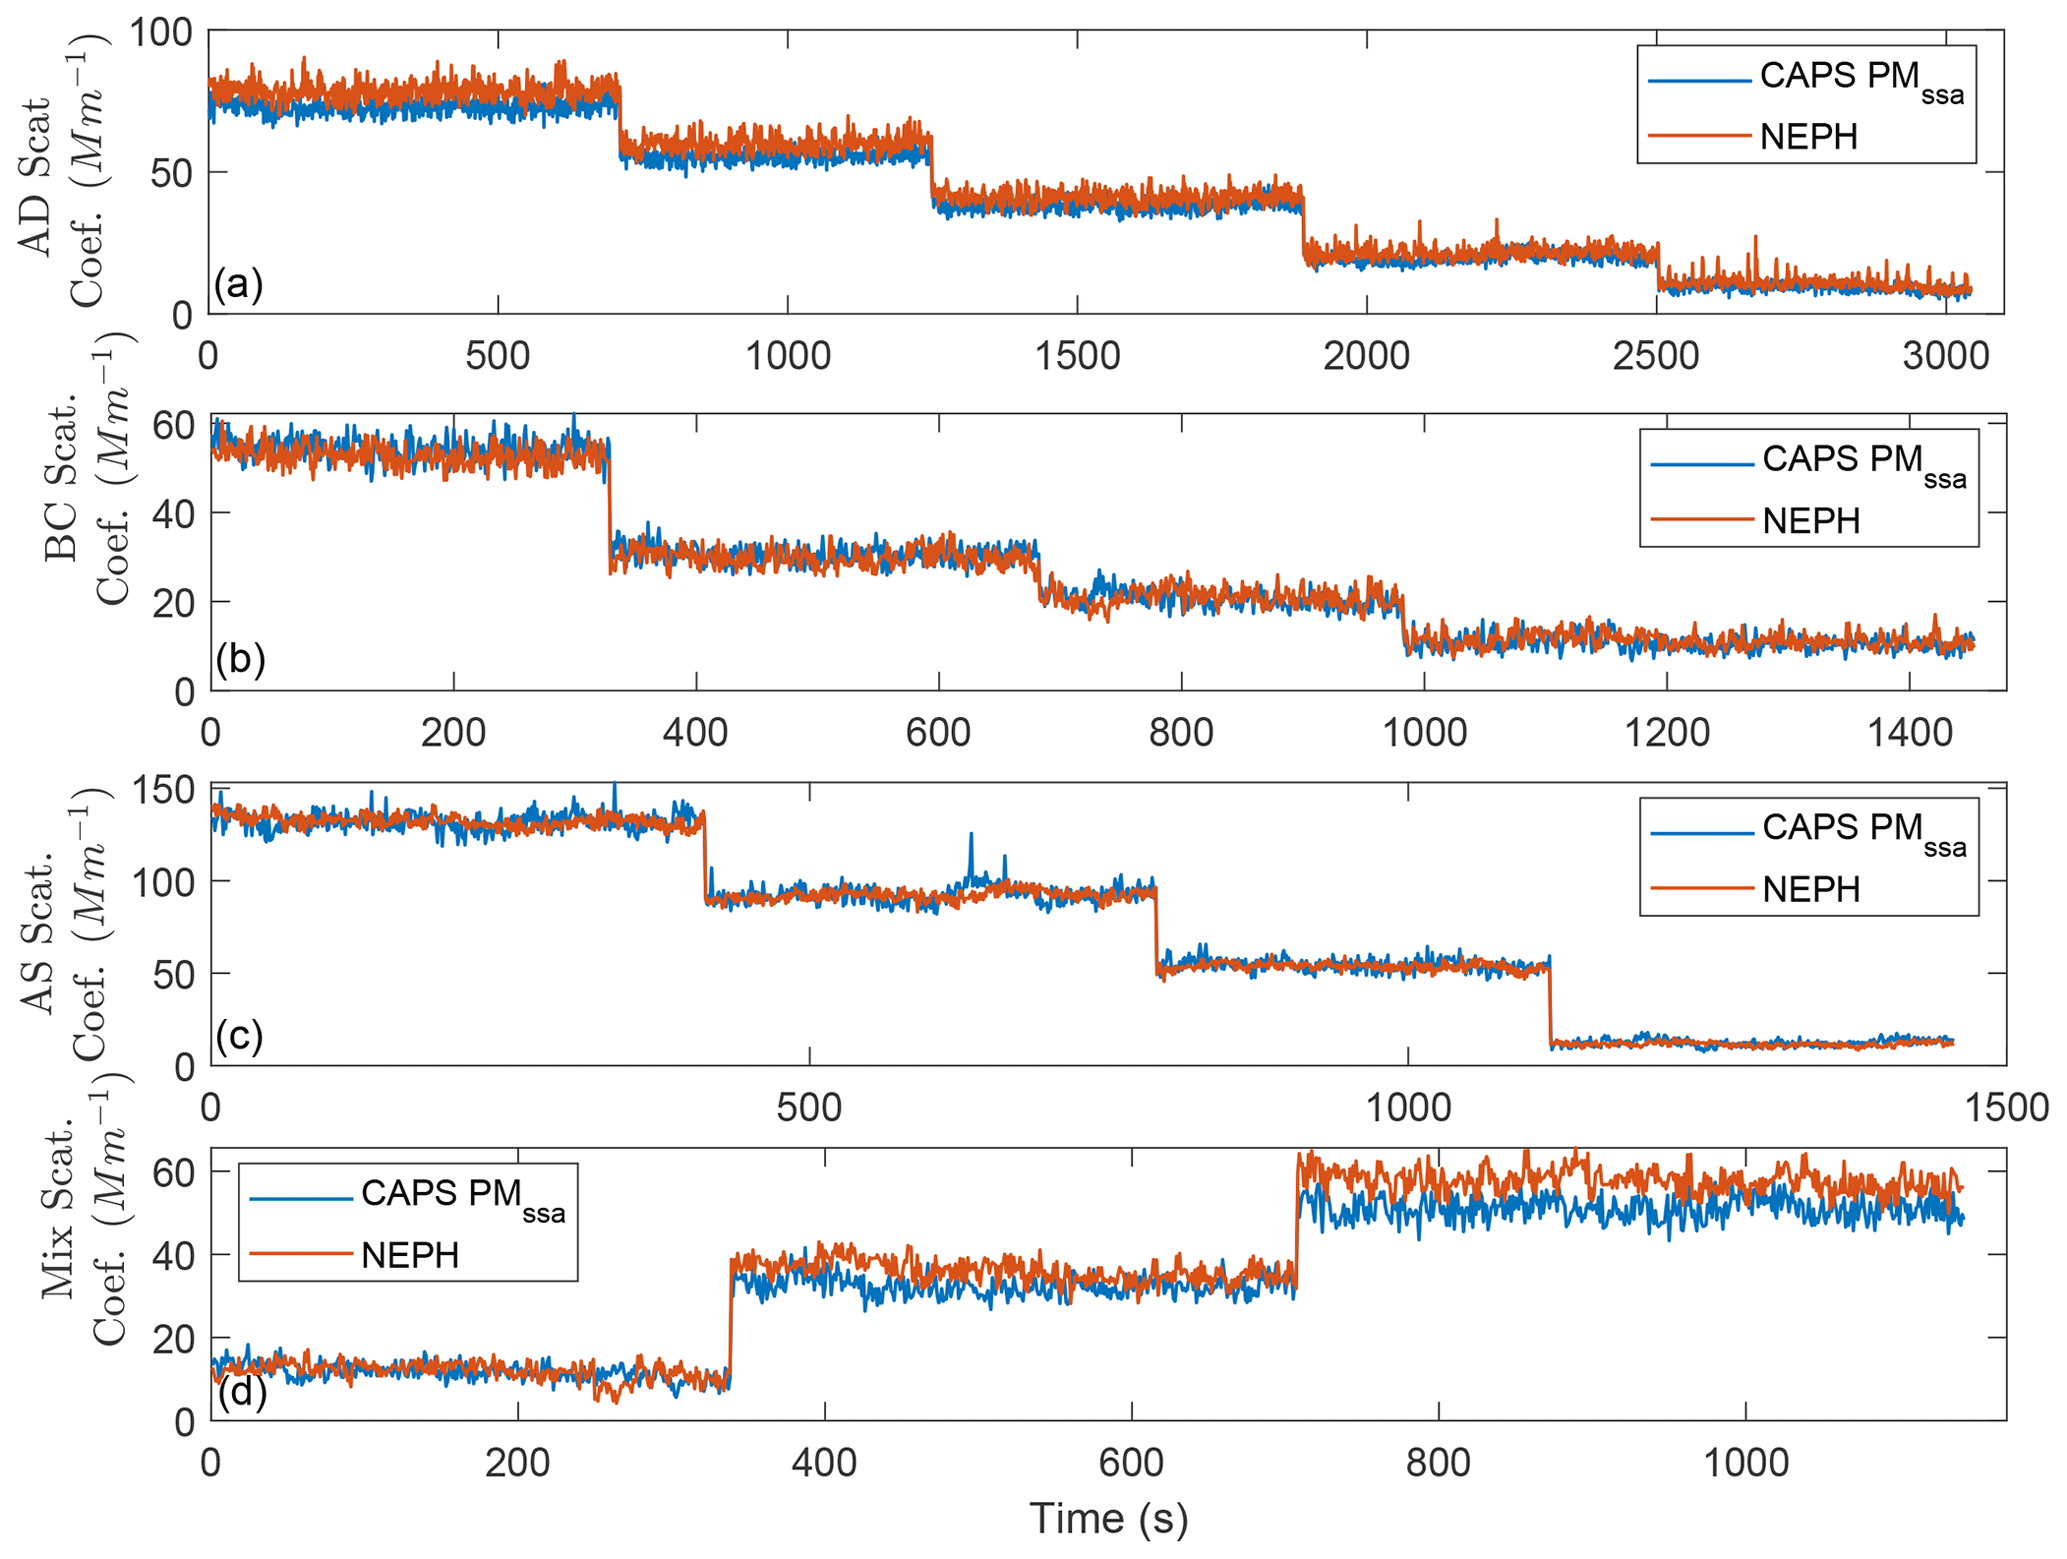
Figure 8Time series (1 Hz) of σsp simultaneously measured by the different instruments: CAPS PMSSA and NEPH for the different aerosol types (a AD, b BC, c AS and d mix).
Figure 9 shows the scatterplot of the average and standard deviation for each level of the CAPS PMSSA against NEPH. As can be seen from Fig. 9 and the data compiled in Table 8 (regression line values for the 10 s average data), the agreement with the NEPH measurements is good, with less than 10 % difference in the slope, offset smaller than 1.6 Mm−1 and correlation coefficient of minimum 0.97 for all aerosol types. For the AD, BC and mixed cases, the NEPH data were corrected with the Massoli et al. (2009) approach. For the AS case both the Anderson and Ogren (1998) and Müller et al. (2011) approaches were applied, and the results given were practically the same: less than 2 % in the slope and less than 1.00 Mm−1 difference in the offset.
Table 8Linear-regression parameters obtained by fitting 10 s averaged data including the slope (M), standard deviation of the slope (SD m), intercept (B), standard deviation of intercept (SD b) and linear-regression coefficient (R2) for the comparison of the CAPS PMSSA scattering channel with NEPH.
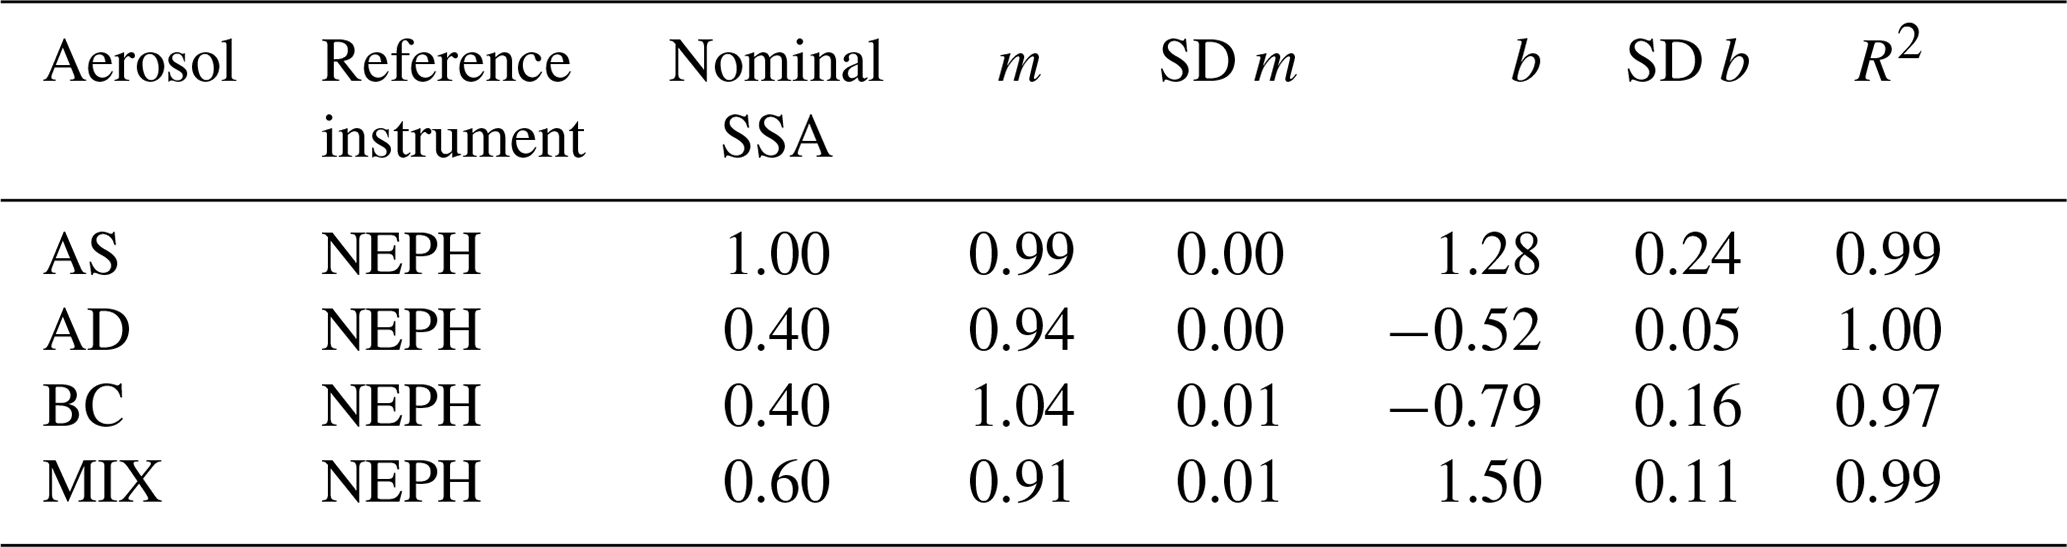
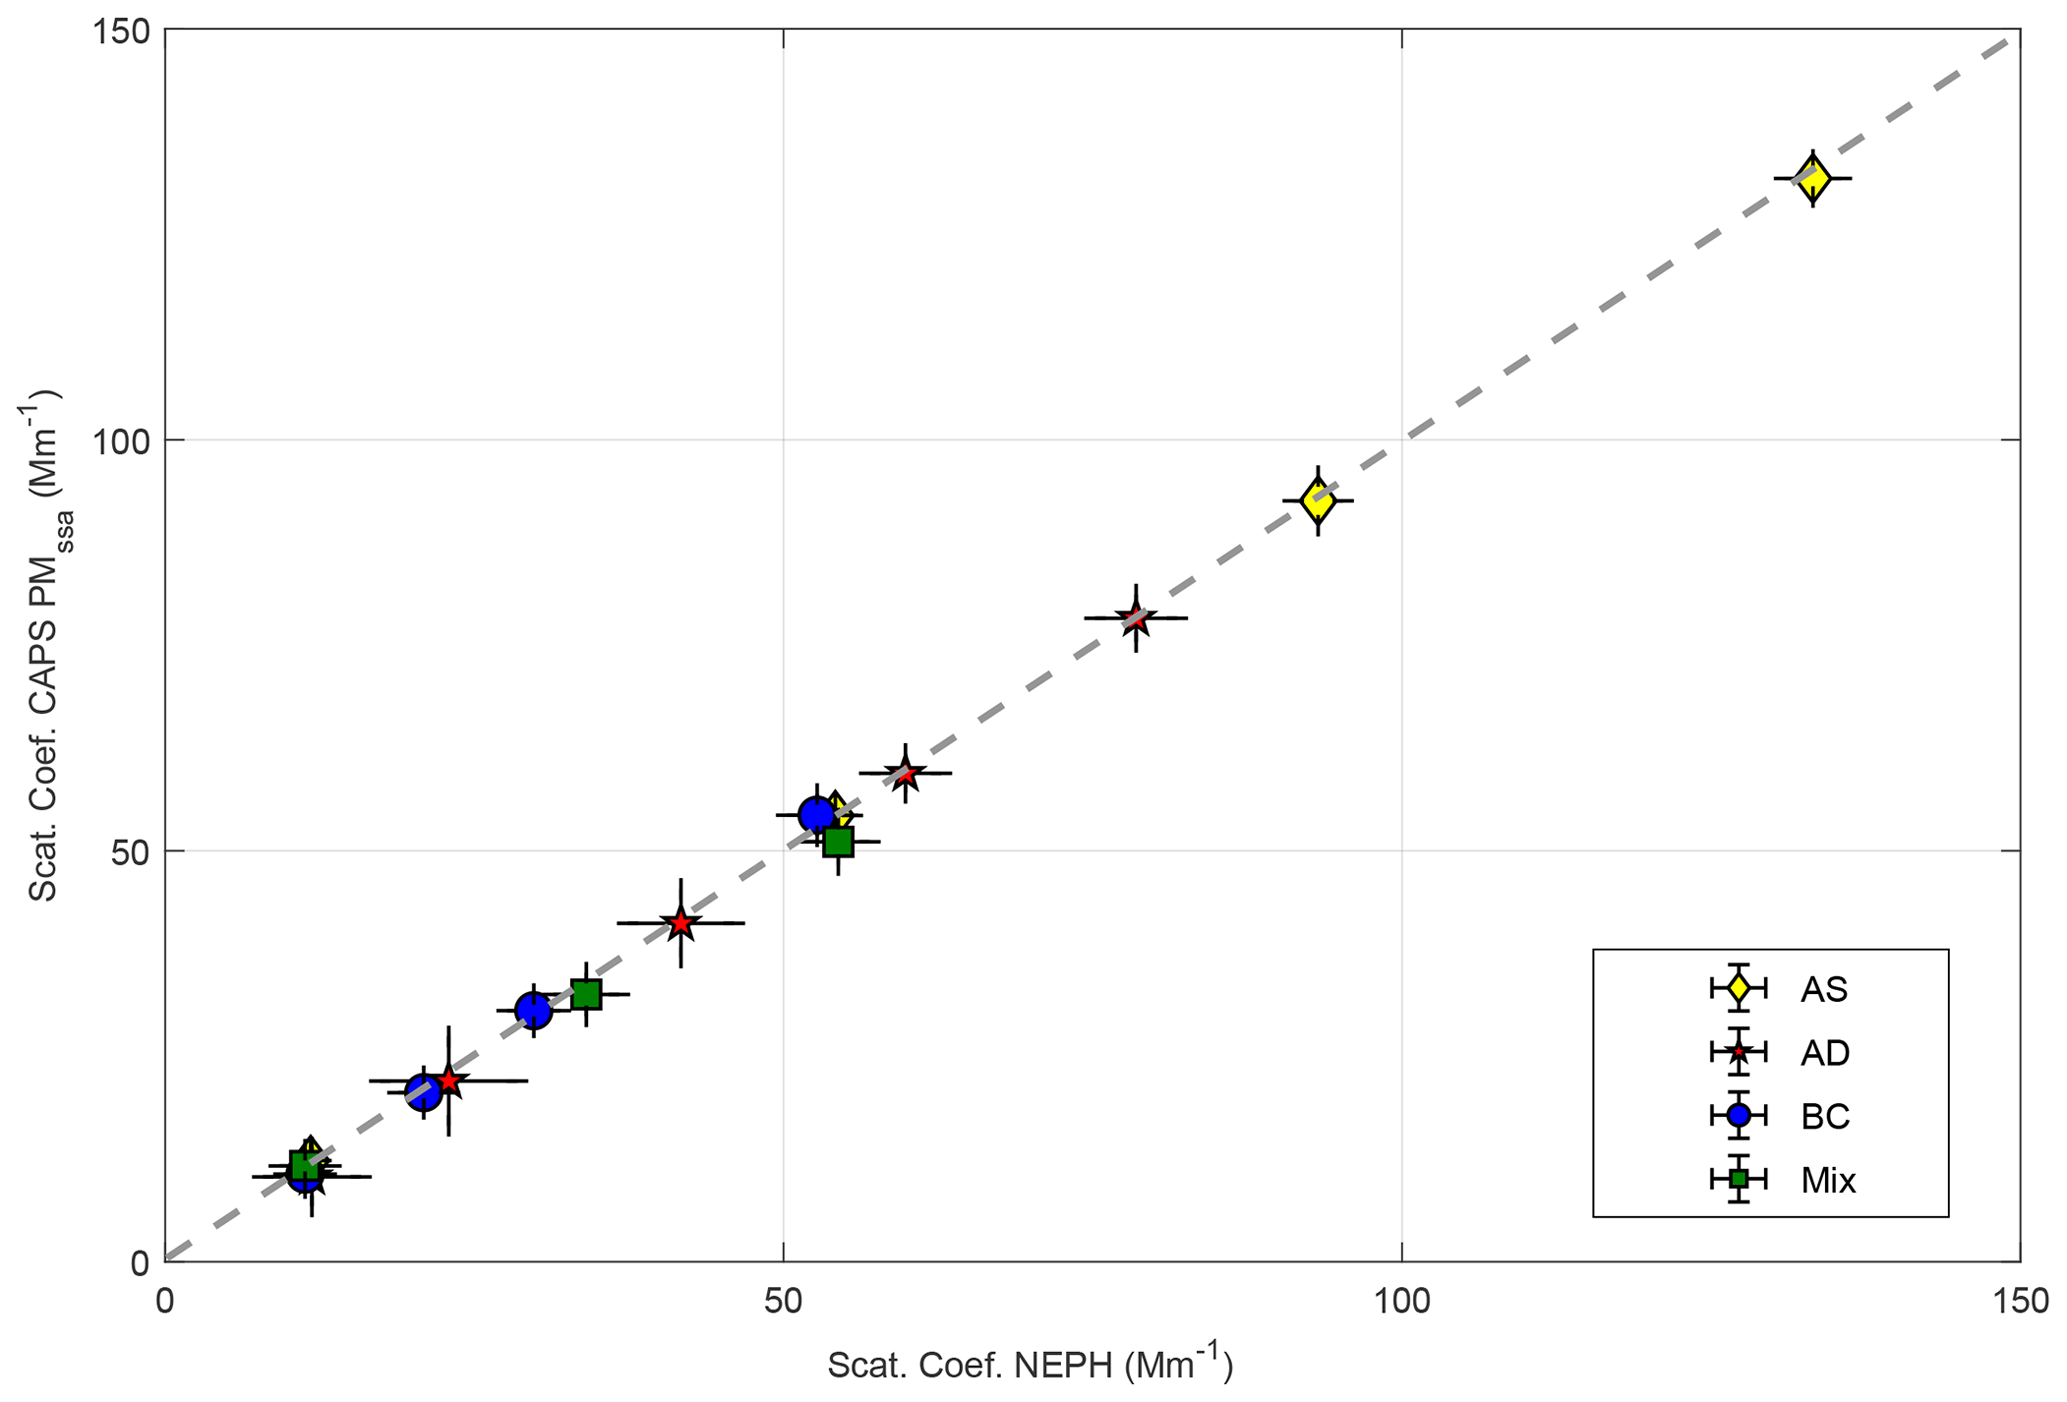
Figure 9Comparison result (mean value and standard deviation for each level) of the scattering channel of the CAPS PMSSA with the measurements from the NEPH for the different aerosol types (dashed line is the identity line, i.e., 1:1 line).
3.3 Absorption coefficient
In spite of the fact that the CAPS PMSSA is not capable of directly measuring the absorption coefficient, the values can be derived as the difference in the extinction and σsp; see Eq. (1). From the difference in the two CAPS PMSSA channels, the calculated absorption coefficients were compared to the direct measurement by the PSAP. In this analysis, when operating with a mixture of AS and AD, the PSAP data were treated using the correction from Ogren (2010). The time series for the measurement of the different aerosols are shown in Fig. 10, whereas Table A3 shows the average and 1σ obtained for the targeted absorption coefficient levels.
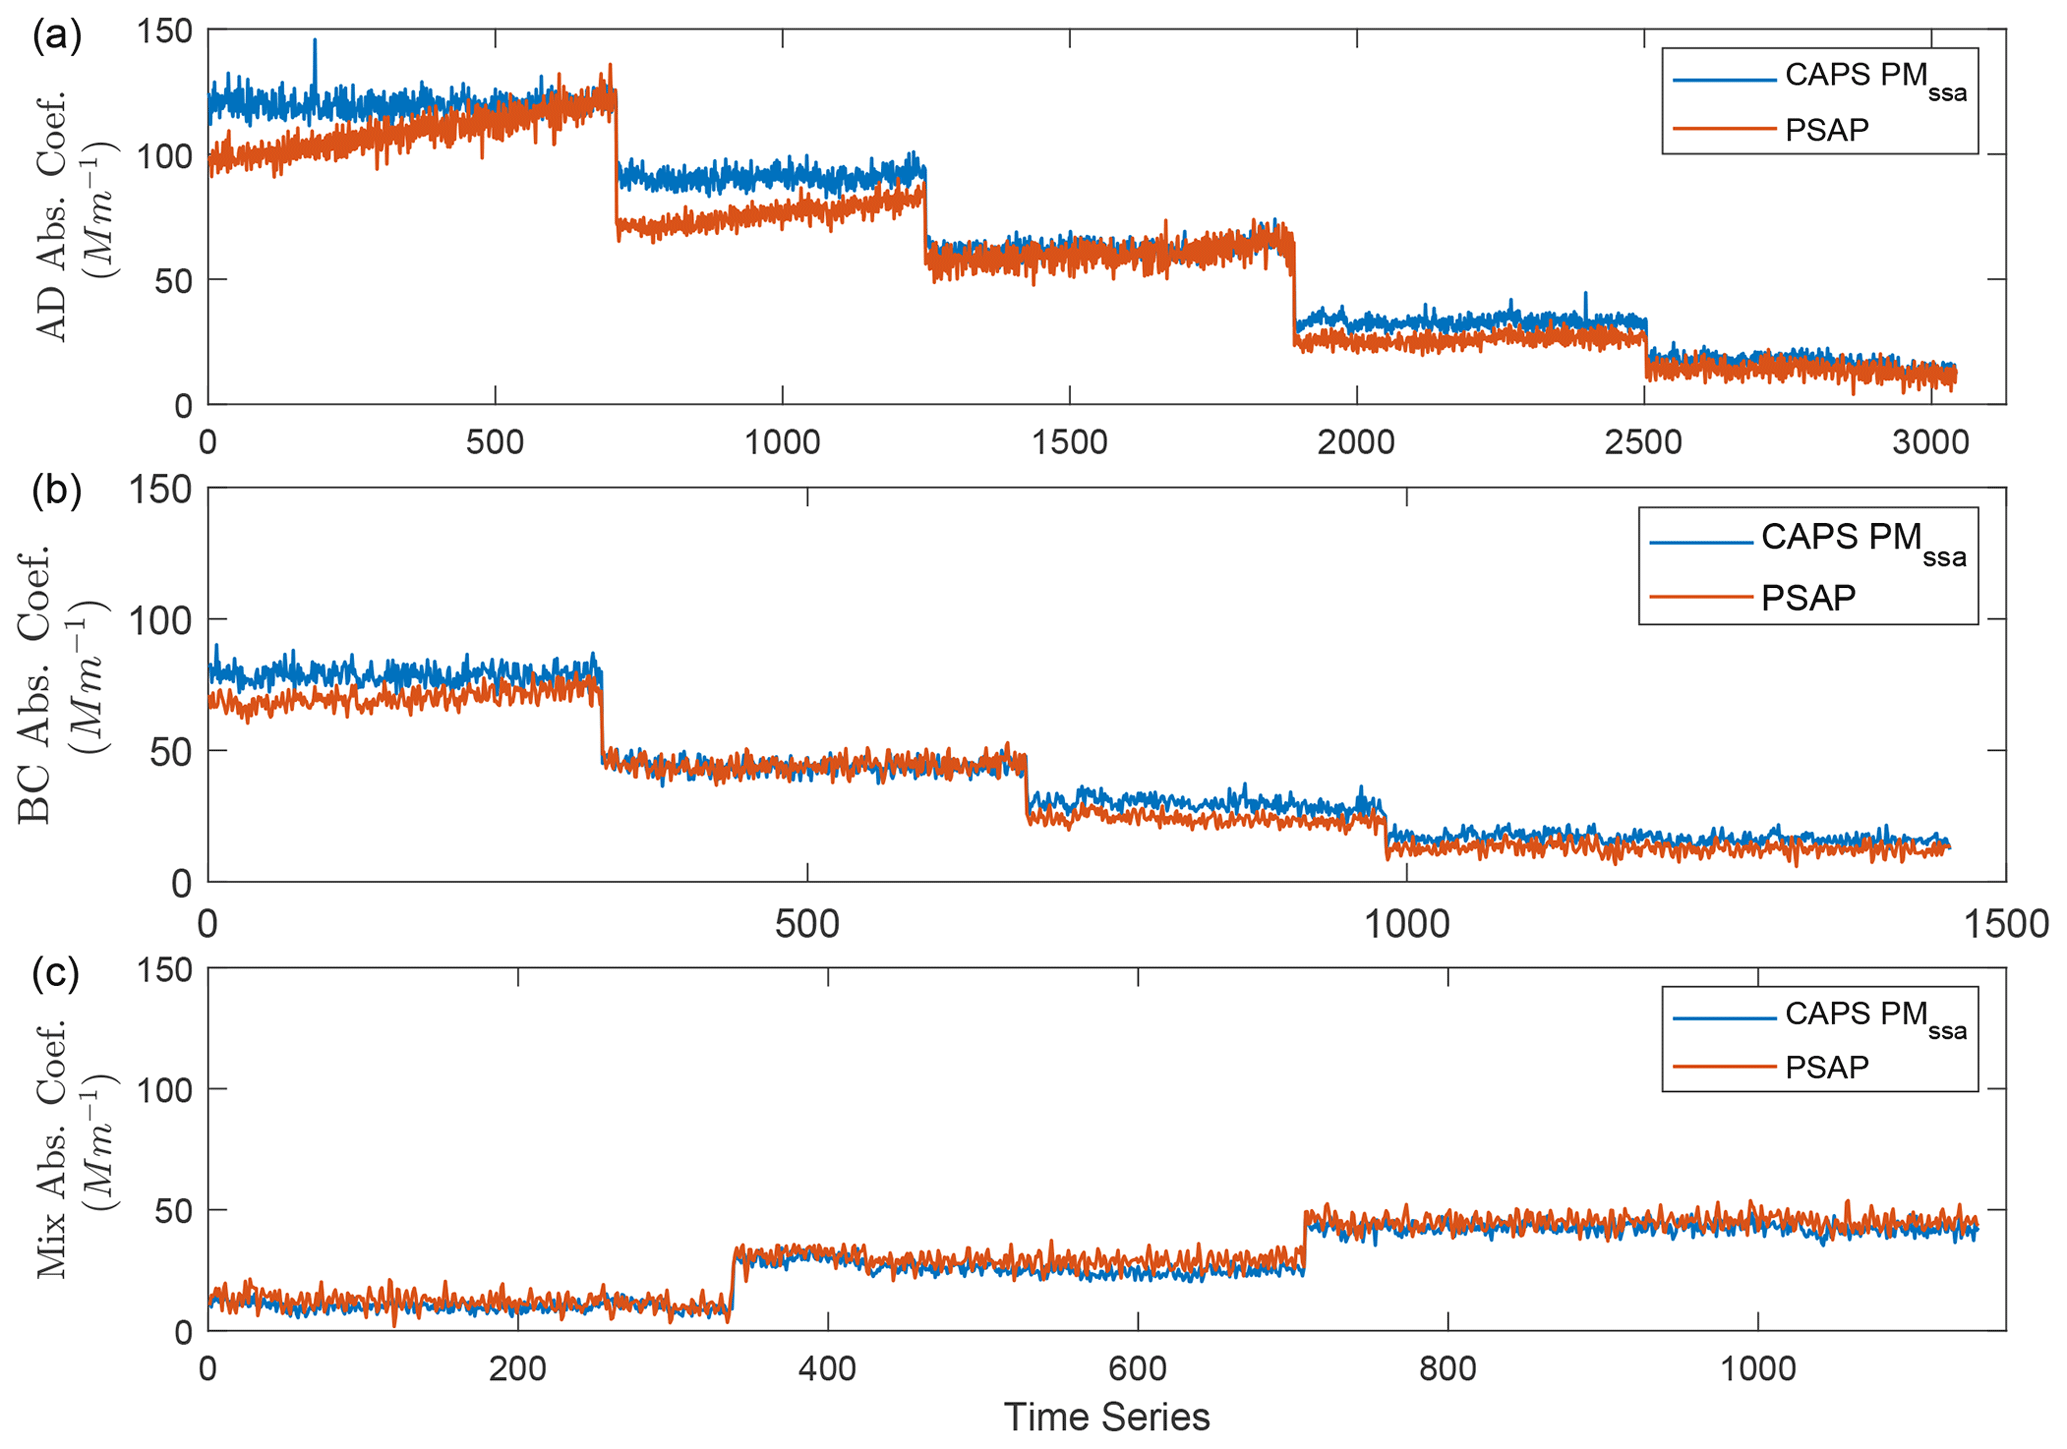
Figure 10Time series (1 Hz) (in seconds; 1 s resolution) of the simultaneously measurements of the absorption coefficient for the different test aerosols (a Aquadag AD, b BC, c mix) by the PSAP and the CAPS PMSSA (as a result of the subtraction of σsp from the extinction coefficient).
The scatterplot for the average measured values from both methods for all levels is shown in Fig. 11, whereas the results of the linear-regression analysis of the 10 s averaged values are compiled in Table 9. The agreement between the methods is reasonable, with deviations <17 % in the slope and offsets less than 3.0 Mm−1. The correlation coefficient is above 0.98 for all cases. Figure 11 demonstrates that for higher absorption coefficients, the two methods deviate more strongly than for lower absorption coefficients. This is mainly caused by the correction algorithm applied to the PSAP data (also seen in Fig. 10); filter-loading corrections are significantly larger for higher absorption coefficient levels than for lower absorption coefficient levels. The increase in the absorption coefficient observed in Fig. 10 for the higher levels of AD and BC is related to the transmission decay of the filter in the PSAP and the correction algorithm chosen for this study. This finding proves that, although the CAPS PMSSA cannot directly measure aerosol light absorption, it provides a rather reliable measurement of the absorption coefficient of the sampled aerosol, comparable to that of the PSAP at least for the small particle sizes and intermediate SSA values sampled in this study. The relative accuracy of absorption measurements by the two channels of the CAPS PMSSA may be significantly reduced for weakly absorbing but large-sized and irregularly shaped mineral dust particles.
Table 9Linear-regression parameters obtained by fitting 10 s averaged data including the slope (M), standard deviation of the slope (SD m), intercept (B), standard deviation of intercept (SD b) and linear-regression coefficient (R2) for the comparison of the CAPS PMSSA and the PSAP instruments.
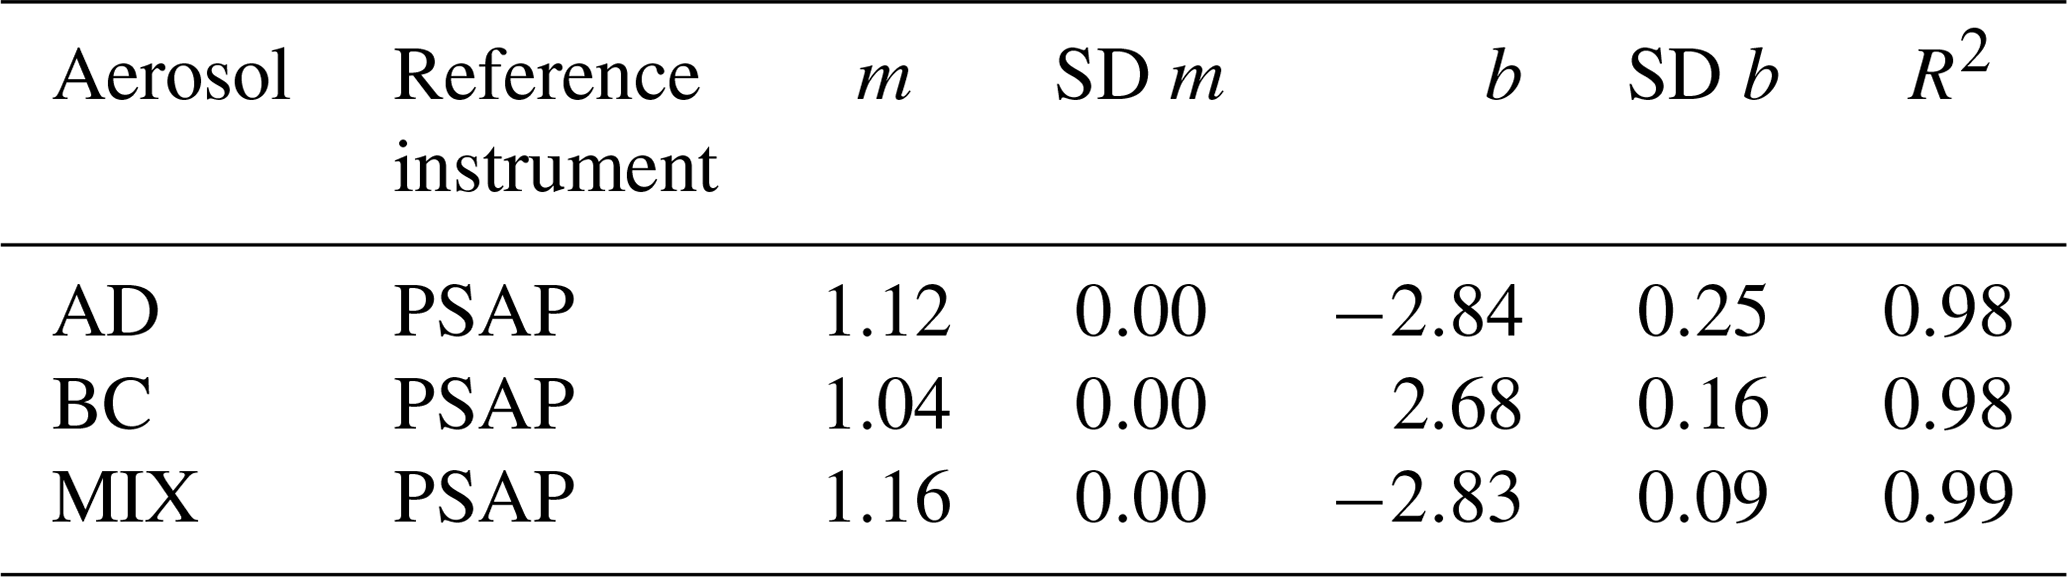
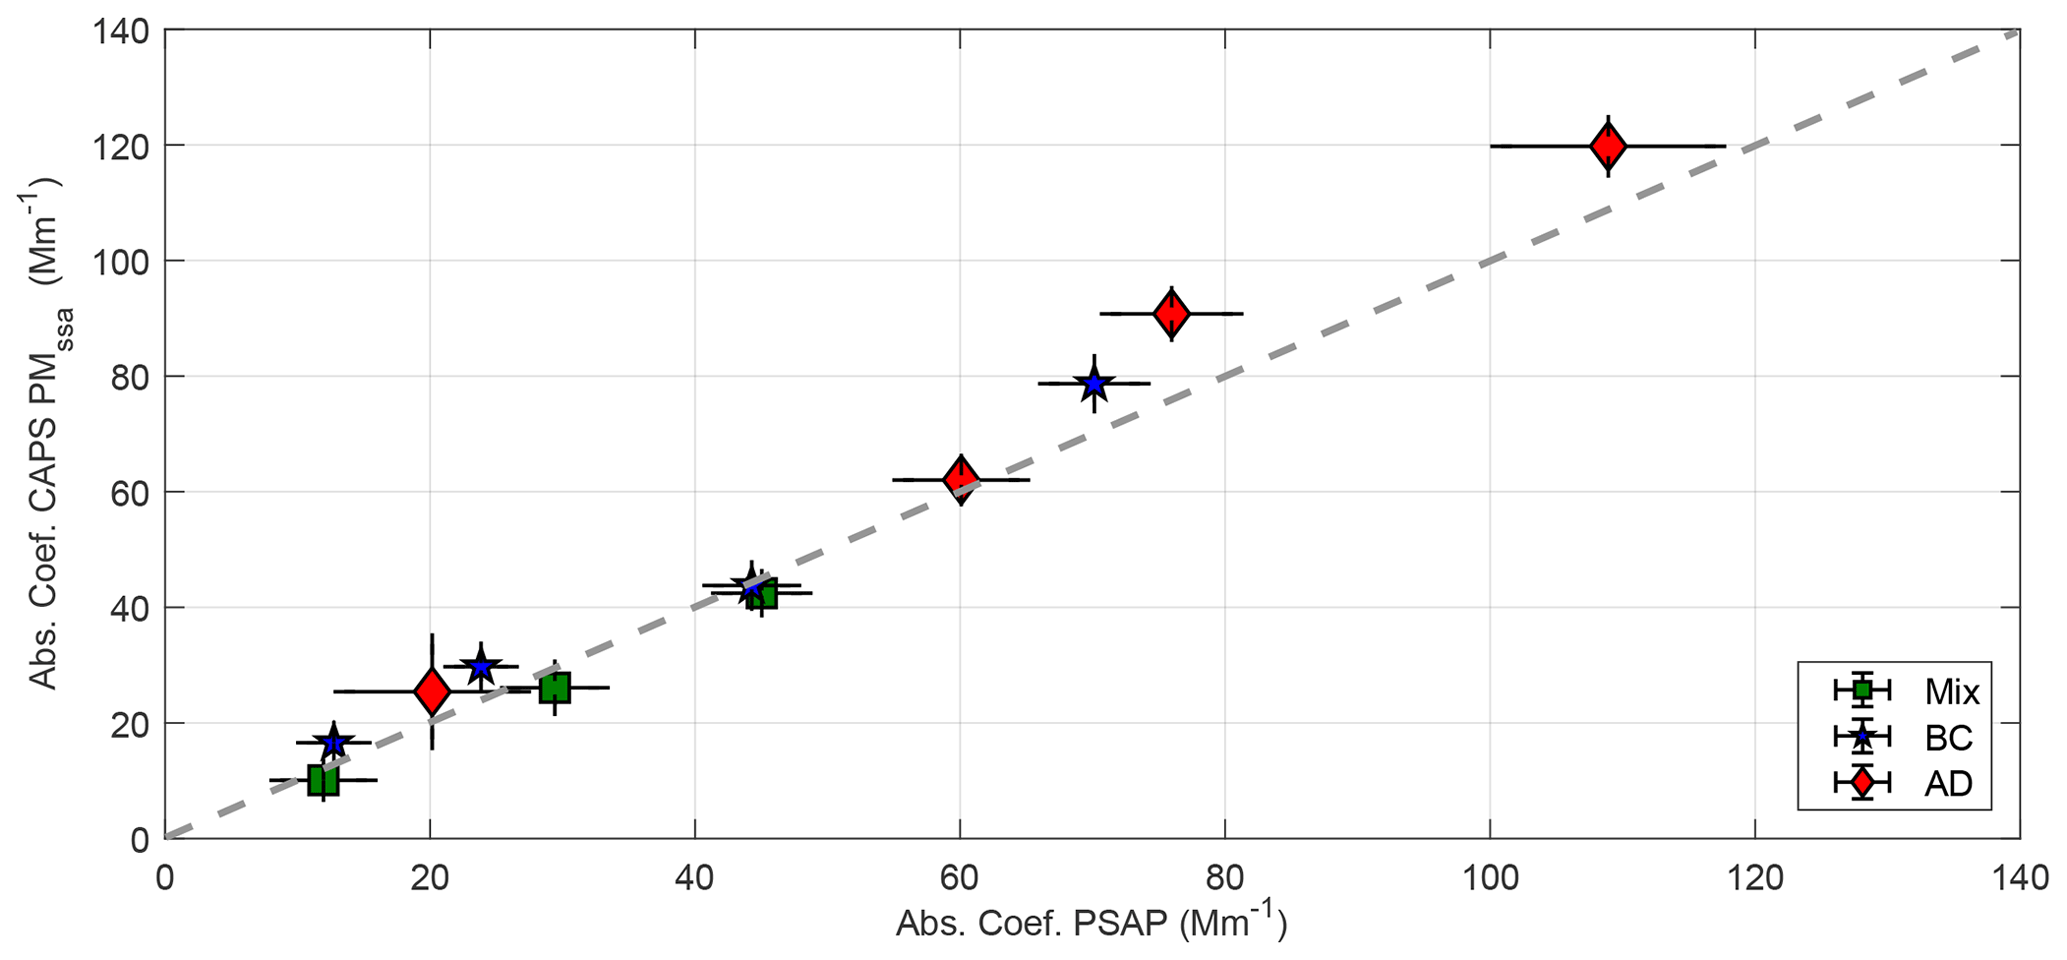
Figure 11Comparison result (mean value and standard deviation for each level) of the absorption indirect measurement by the CAPS PMSSA with the measurements from the PSAP for AD, BC and mixture (dashed line is the identity line; i.e., 1:1 line).
3.4 Single-scattering albedo measurement
The ultimate property targeted by the CAPS PMSSA is the aerosol single-scattering albedo. Figure 12 shows the average and standard deviation of the SSA measured by the CAPS PMSSA and the applied proven technologies for each aerosol type containing a light-absorbing fraction at the different extinction coefficient levels. The values for each level are also compiled in Table A4.
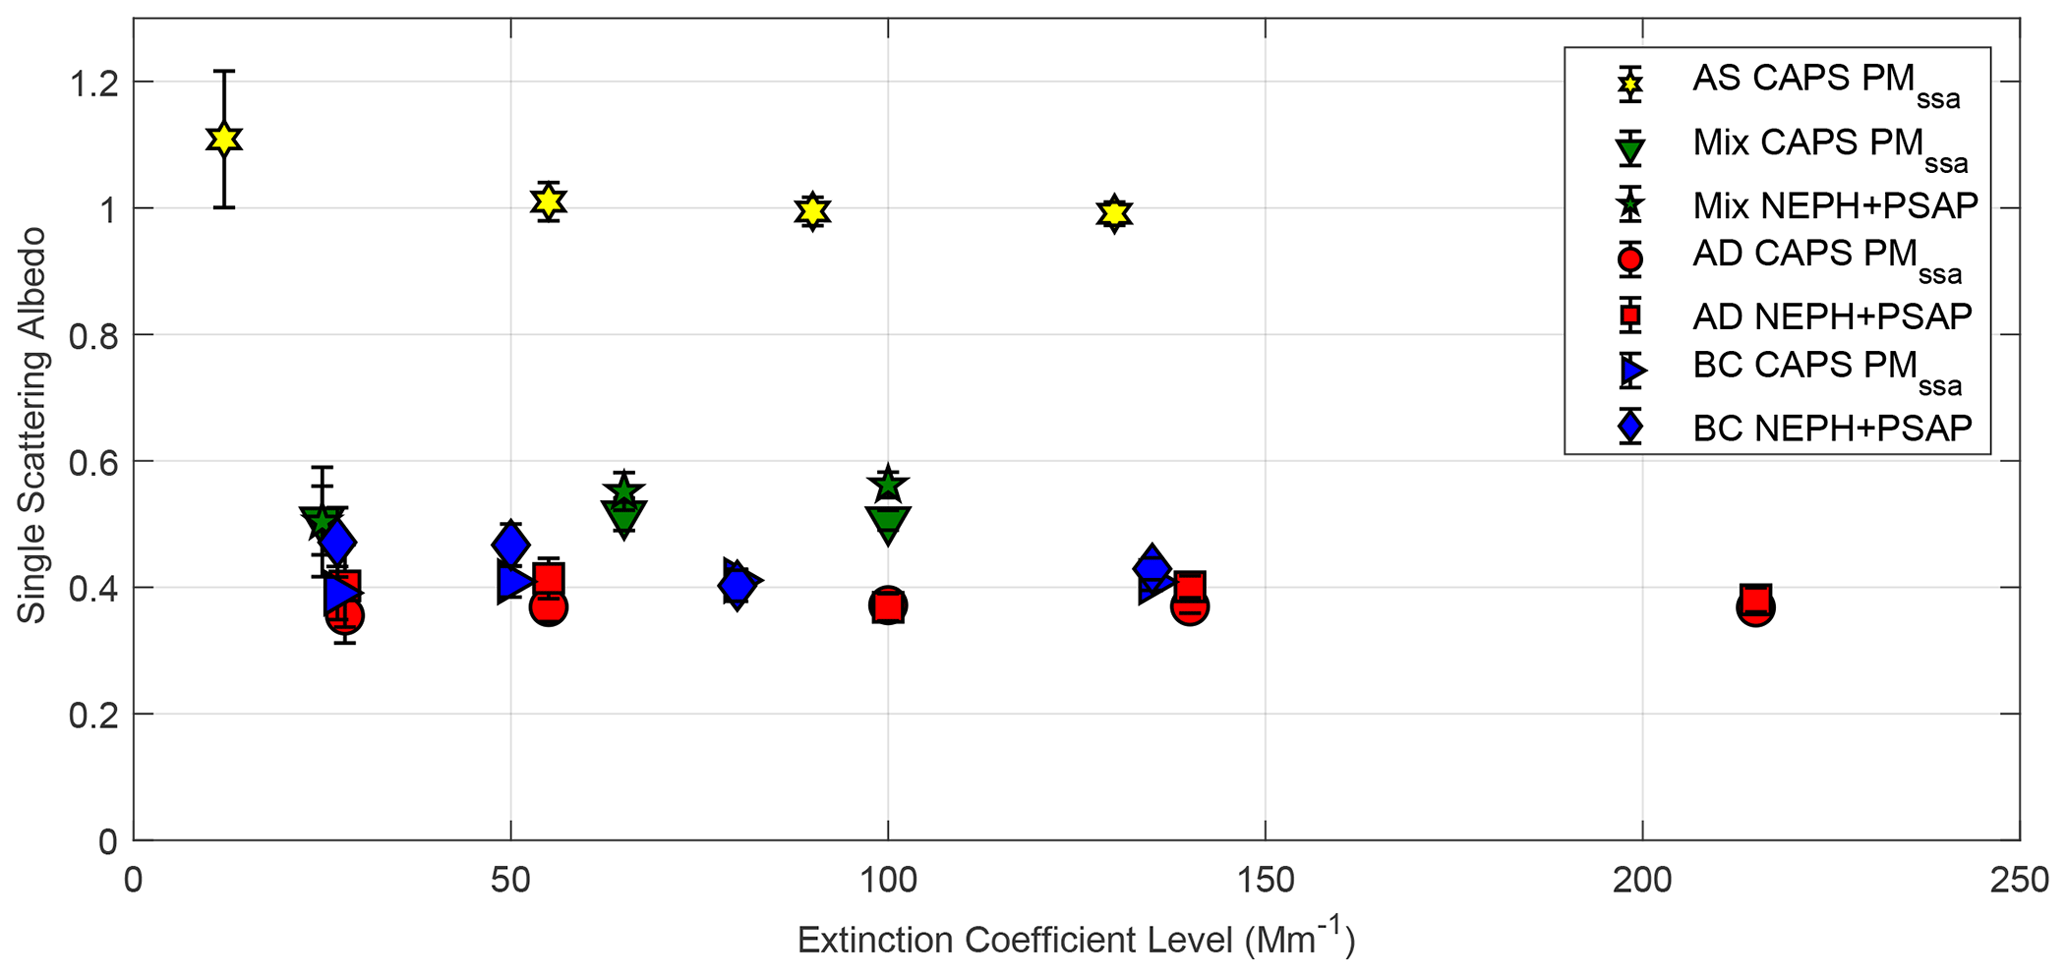
Figure 12Average and standard deviation of the measured single-scattering albedo as a function of extinction coefficient level for the different aerosols and technologies.
For the absorbing aerosols, we found maximum deviations between the different SSA values of 0.08, or 17 %, with the residuals being randomly distributed around 0. For a single aerosol type, the SSA provided by the CAPS PMSSA shows less scatter around the average value compared to the values derived from PSAP and NEPH data. The measurements by the CAPS PMSSA are more robust in terms of stability in comparison with the values measured by the PSAP+NEPH combination, with an average of the standard deviation for the different aerosol types of 0.025 for the CAPS PMSSA and 0.035 for the PSAP–NEPH combination. It is worth noting that even though there are differences found in the measurements, all measured SSA values fall within the range of values expected for each aerosol type (as measured and detailed in Sect. 3.2, Table 8).
An optical-closure study has been performed using different types of aerosols (pure scattering, strongly absorbing and mixture) to evaluate the performance and relative accuracy of the recently launched Cavity Attenuated Phase-Shift Single Scattering Albedo Monitor.
The results from the instrument intercomparison with proven technologies (CAPS PMex, NEPH and PSAP) show a very good agreement for all aerosol types, with relative accuracy of minimum 90 % for all aerosol types. The small deviation observed in the extinction channel between the CAPS PMSSA and PSAP–NEPH combination originates from the applied correction algorithm to the PSAP data since it is a logarithmic function of the filter transmission leading to deviations in the dataset. For the evaluation of the performance for each aerosol individually, the extinction channel shows relative accuracy between 94 % and 99 % and the scattering channel between 91 % and 99 %. These values are very similar to those found by Petzold et al. (2013) for the CAPS PMex.
Regarding the application of the CAPS PMSSA for the measurement of the absorption coefficient and single-scattering albedo, the instrument has shown good performance for the SSA measurement but only reasonable performance for the absorption. The relative accuracy of the absorption coefficient measurement by the CAPS PMSSA in comparison with the PSAP is between 84 % and 96 %, as obtained for the linear-regression analysis for all investigated aerosol types and aerosol loadings. The large difference observed here comes from the correction scheme applied to the PSAP data at high loadings, as stated earlier. It is possible to observe that the higher deviations occur at high absorption coefficients also where the transmission of the filter has a steeper decrease. For the measurement of SSA, the CAPS PMSSA showed a very good stability for all measured σep levels, better than the PSAP–NEPH combination. The measured values are within what is expected for the different types of aerosols (0.4 for strongly absorbing aerosols and 1.0 for purely scattering aerosols).
The results reported from our study demonstrate that the CAPS PMSSA is a very robust and reliable instrument for the direct measurement of σsp and σep as well as for the indirect measurement of the absorption coefficient and single-scattering albedo within the expected limits reported by the error propagation analysis.
A1 Error propagation for the single-scattering albedo using scattering and absorption
Error propagation for the single-scattering albedo ω using independent scattering (σsc) and absorption coefficient (σa) measurements is given by
Using
we end up with
A2 Error propagation for the single-scattering albedo using scattering and extinction
Error propagation for the calculated single-scattering albedo using CAPS_SSA measurements of scattering (σsc) and extinction coefficients (σe) is derived as follows:
The error propagation of the calculated absorption coefficient using CAPS_SSA measurement (independent scattering and extinction measurements) is given by
General remark
The error in a mean value using n values of x is given by
In the following graphs, relative errors are reported defined by
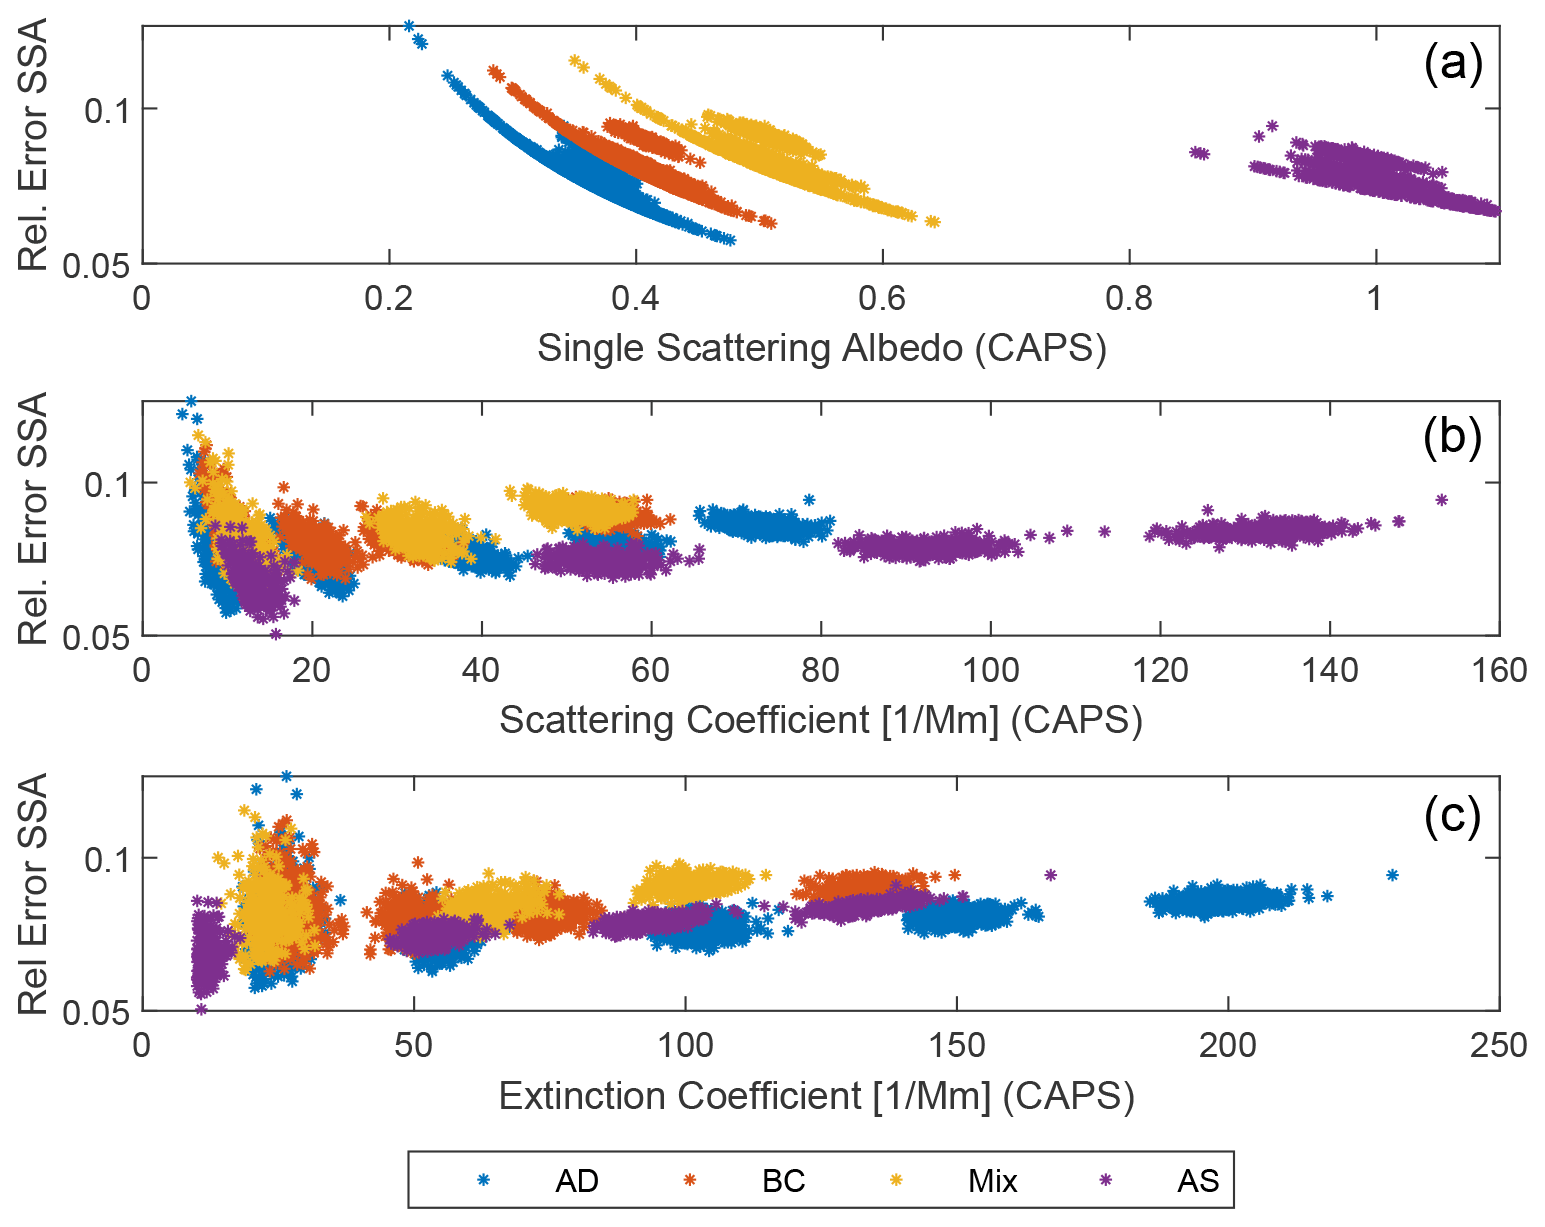
Figure A1Relative error in the single-scattering albedo (SSA) derived from CAPS measurements as a function of the derived SSA (a), σsp (b) and the extinction coefficient (c).
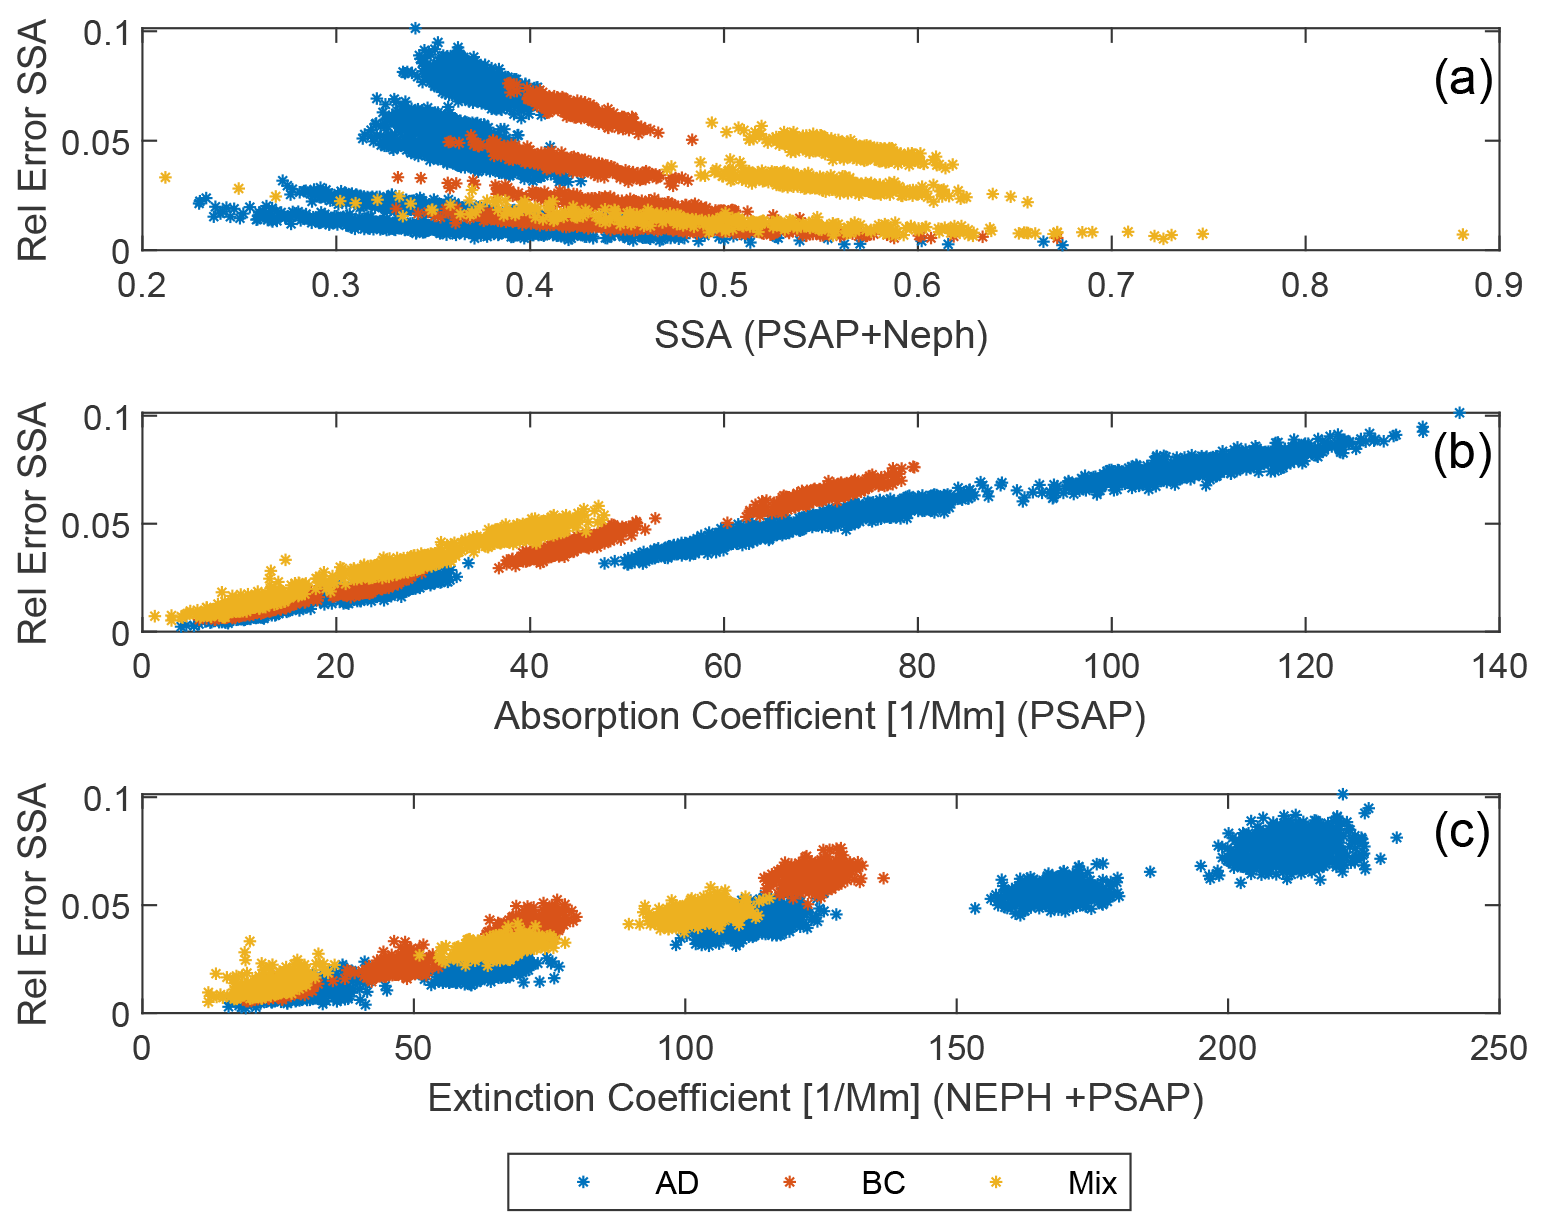
Figure A2Relative error in the single-scattering albedo derived from PSAP and TSI nephelometer data as a function of the SSA (a), absorption coefficient (b) and extinction coefficient (c).
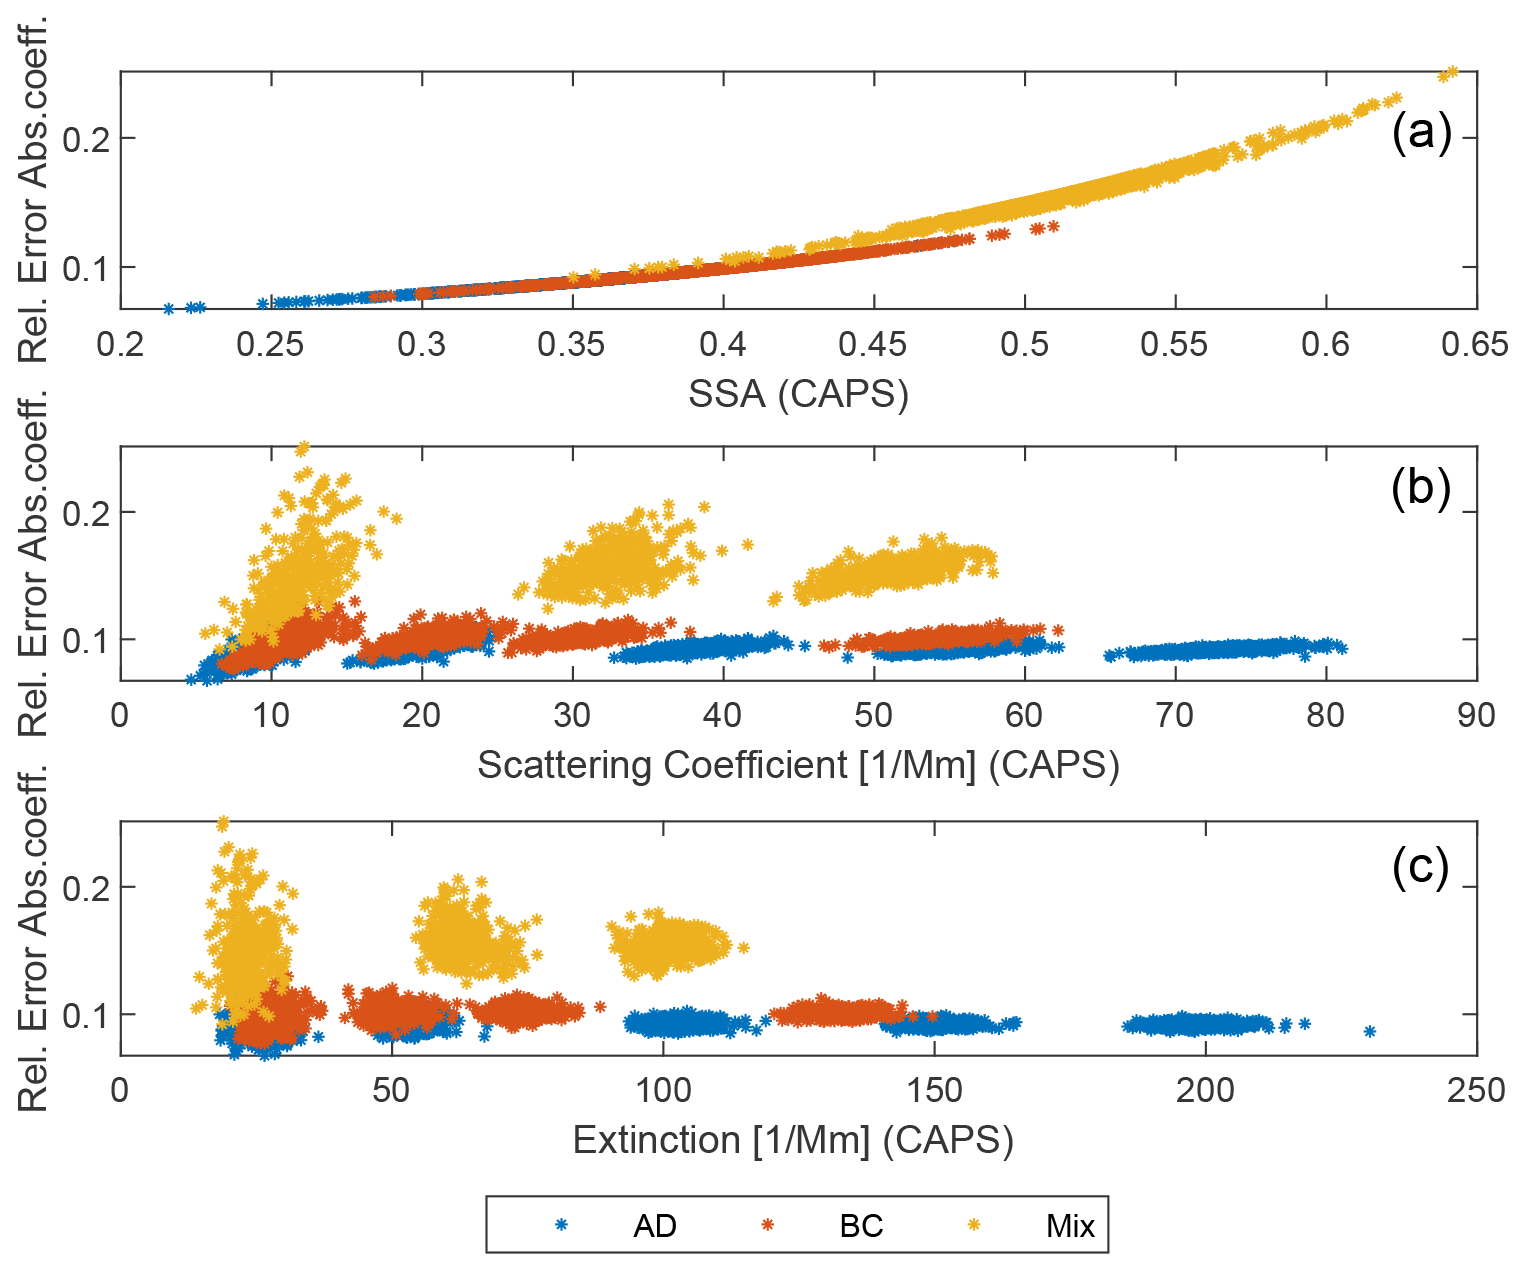
Figure A3Relative error in the absorption coefficients using CAPS measurements as a function of SSA (a), scattering coefficient (b) and extinction coefficient (c).
Table A1Extinction coefficient mean and 1σ of the mean measured by the CAPS PMSSA extinction channel and proven technologies.
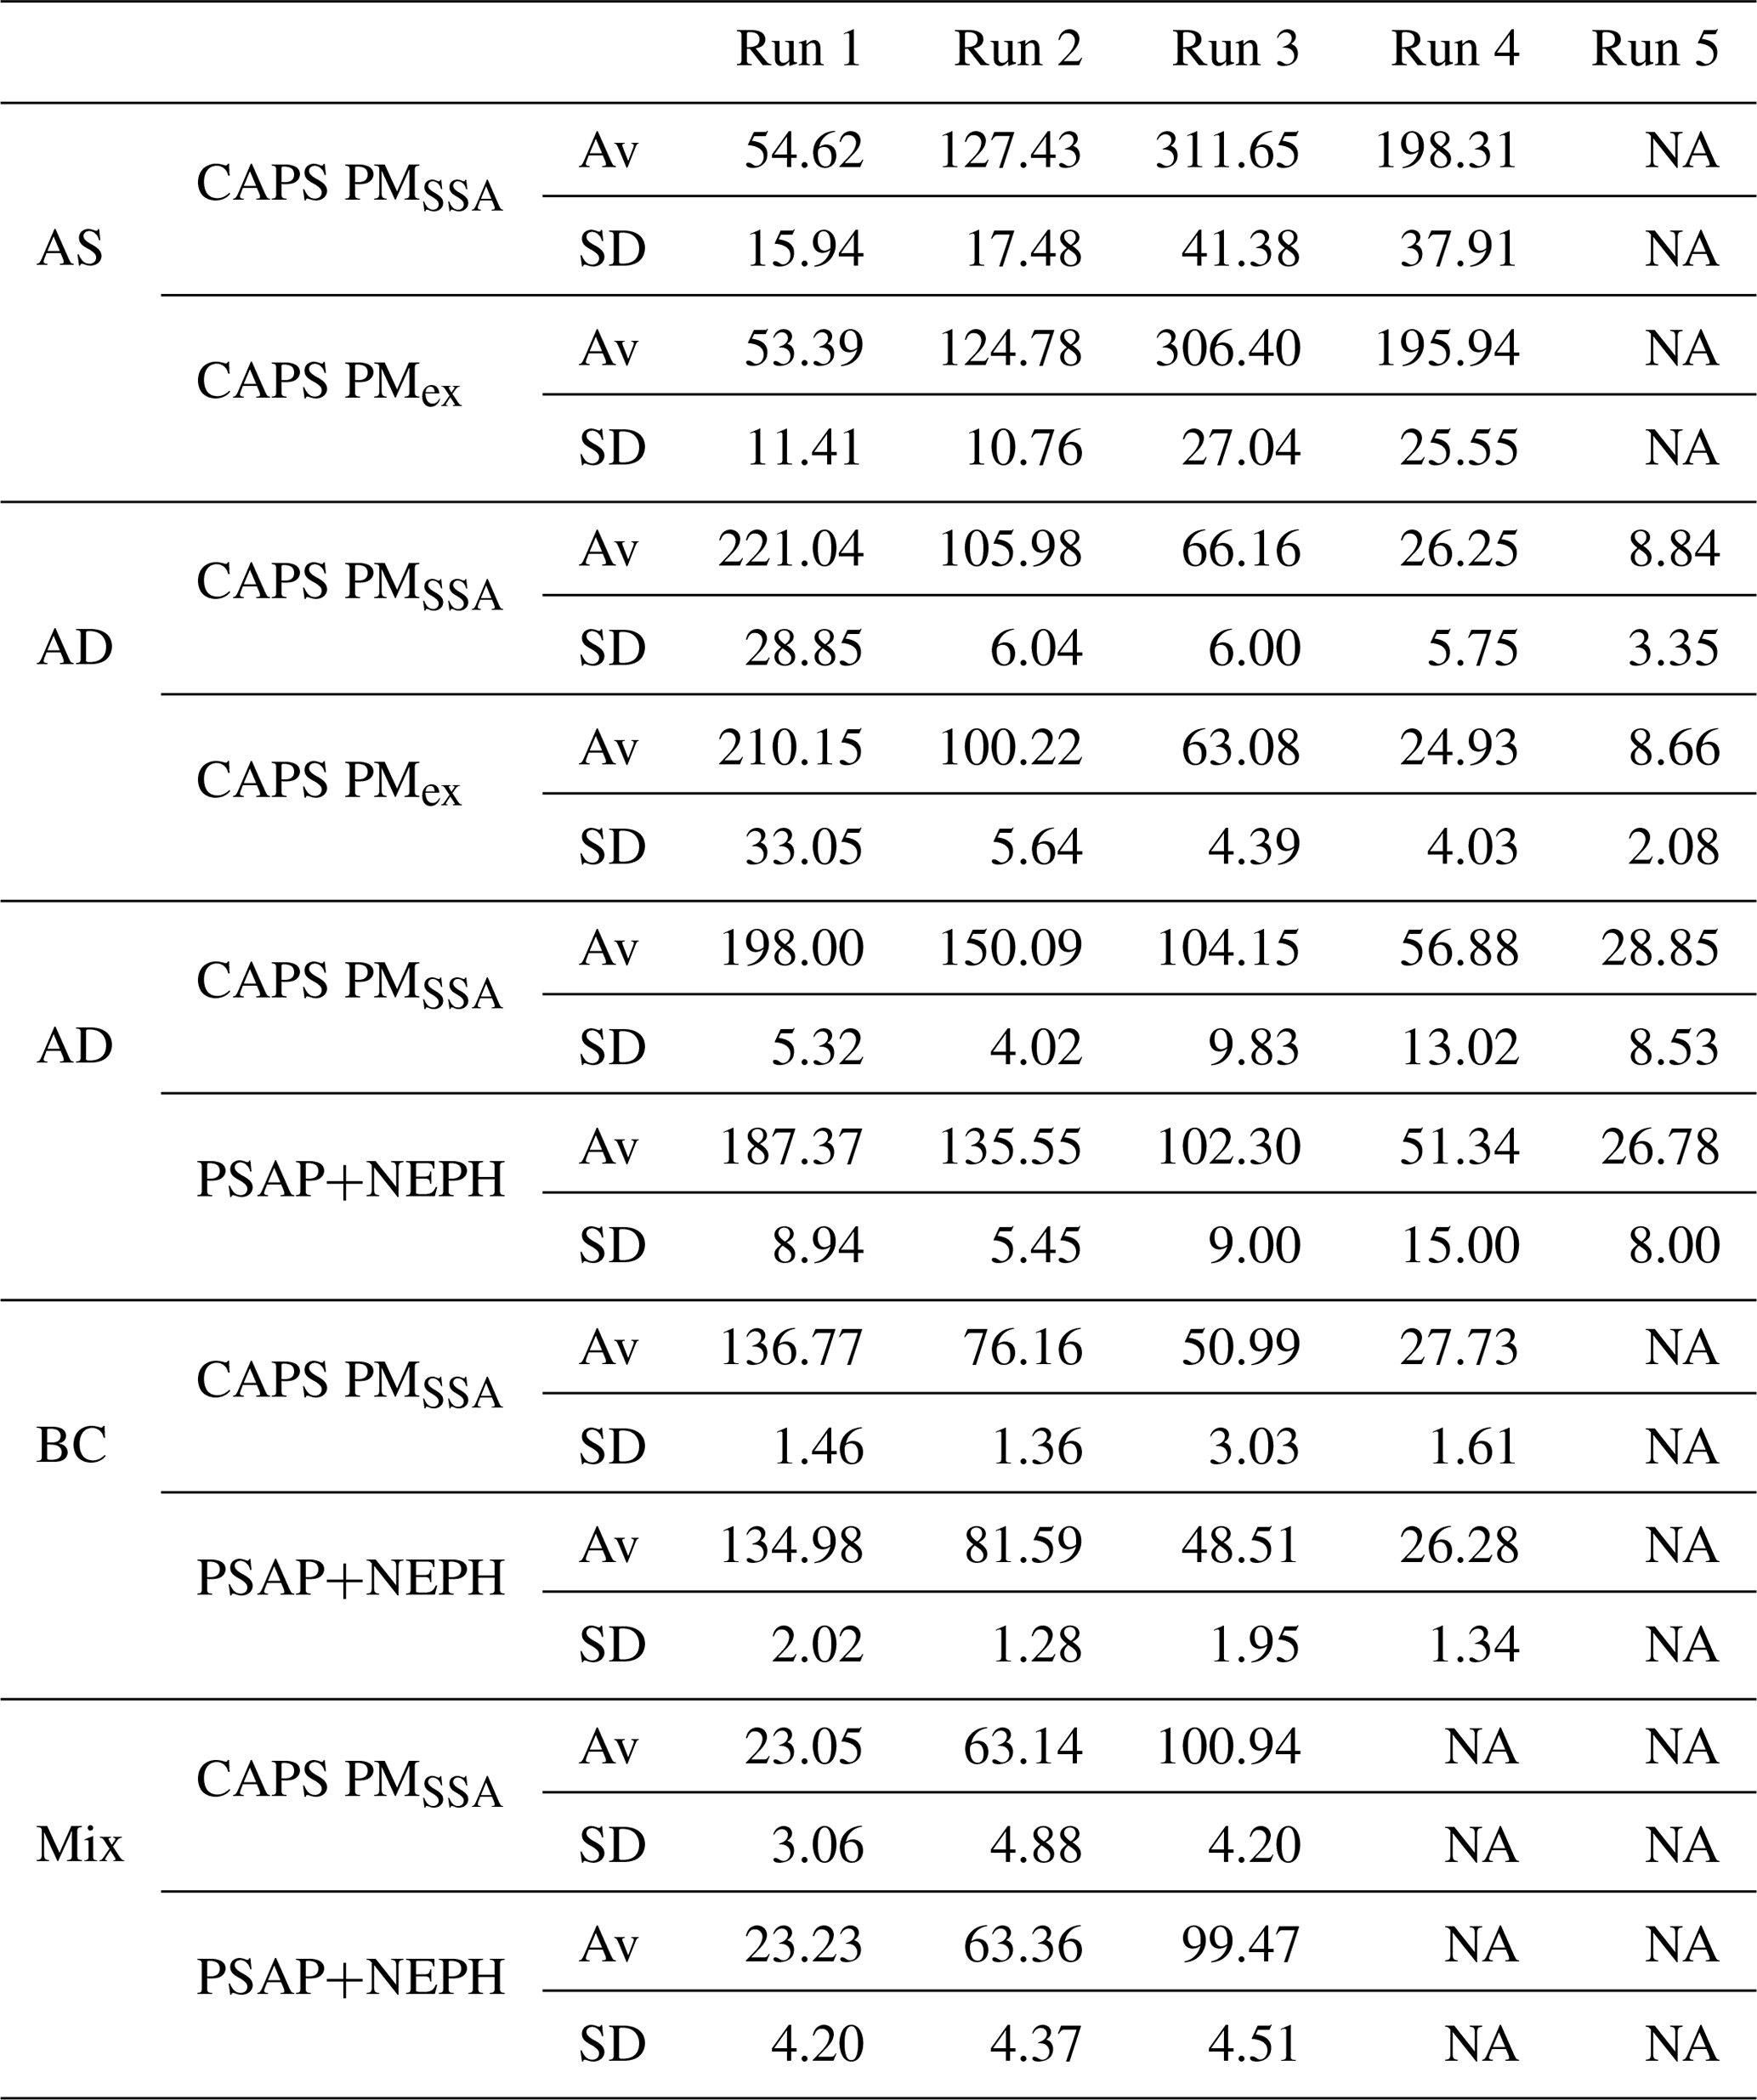
NA: not available. Av: average (mean).
Table A2Scattering coefficient mean and 1σ of the mean measured by the CAPS PMSSA and NEPH.

NA: not available. Av: average (mean).
Table A3Absorption coefficient mean and standard deviation of the mean measured by the CAPS PMSSA (extinction minus scattering) and PSAP.
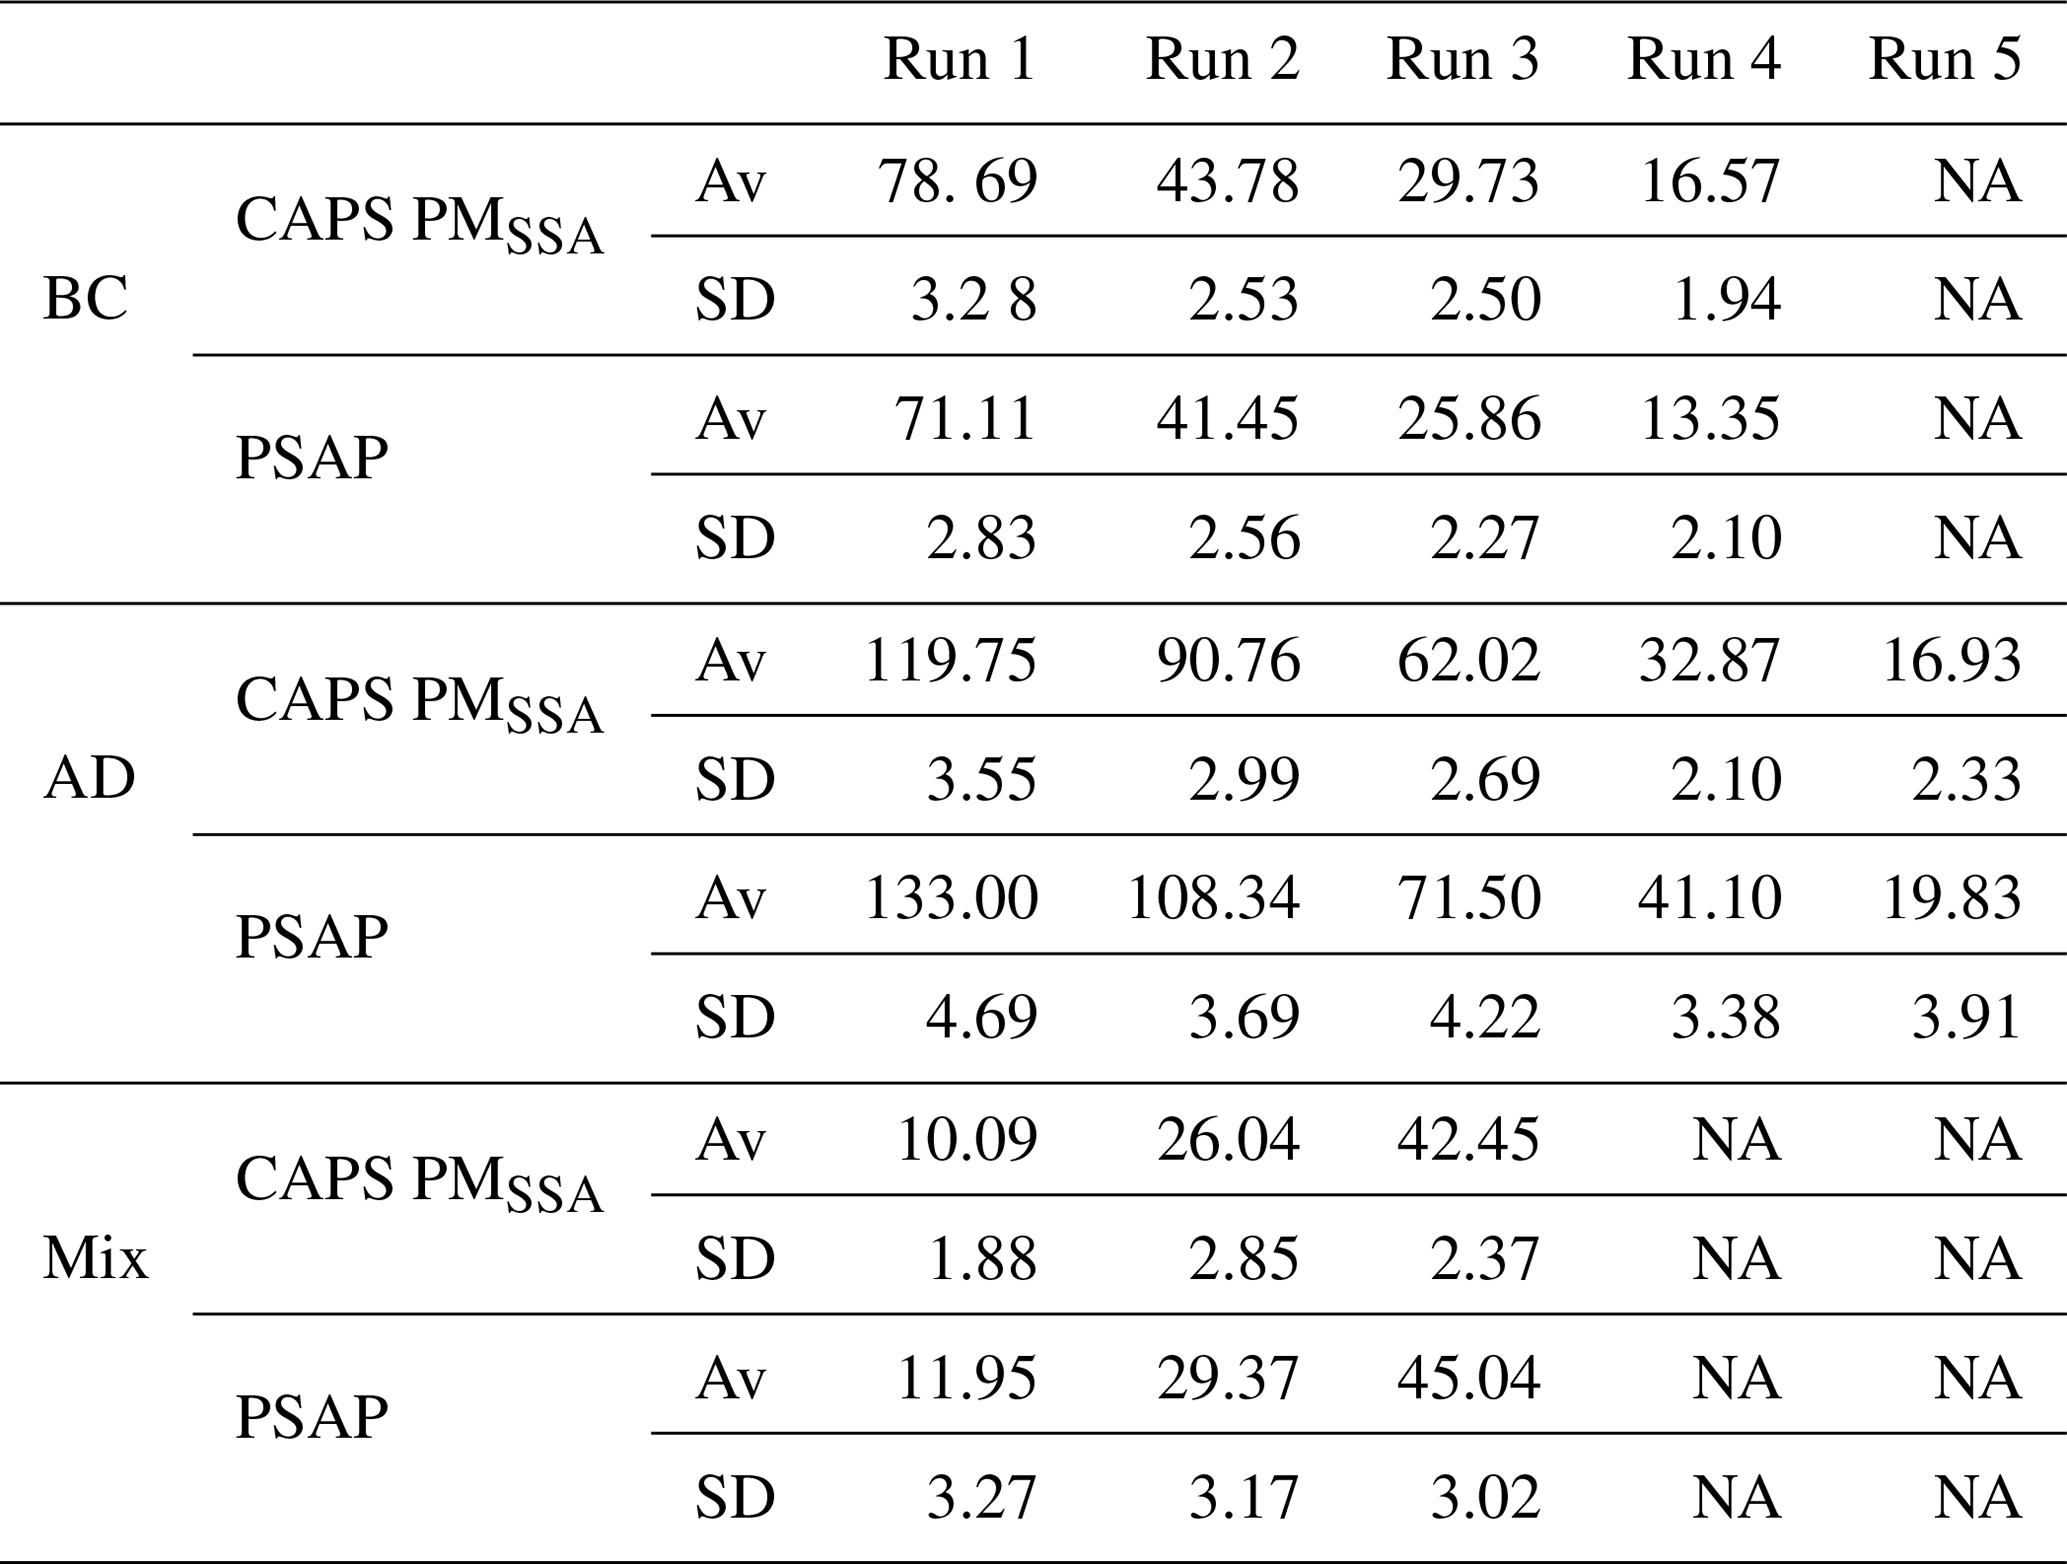
NA: not available. Av: average (mean).
Table A4Single-scattering albedo average value and standard deviation for CAPS PMSSA and proven technologies.
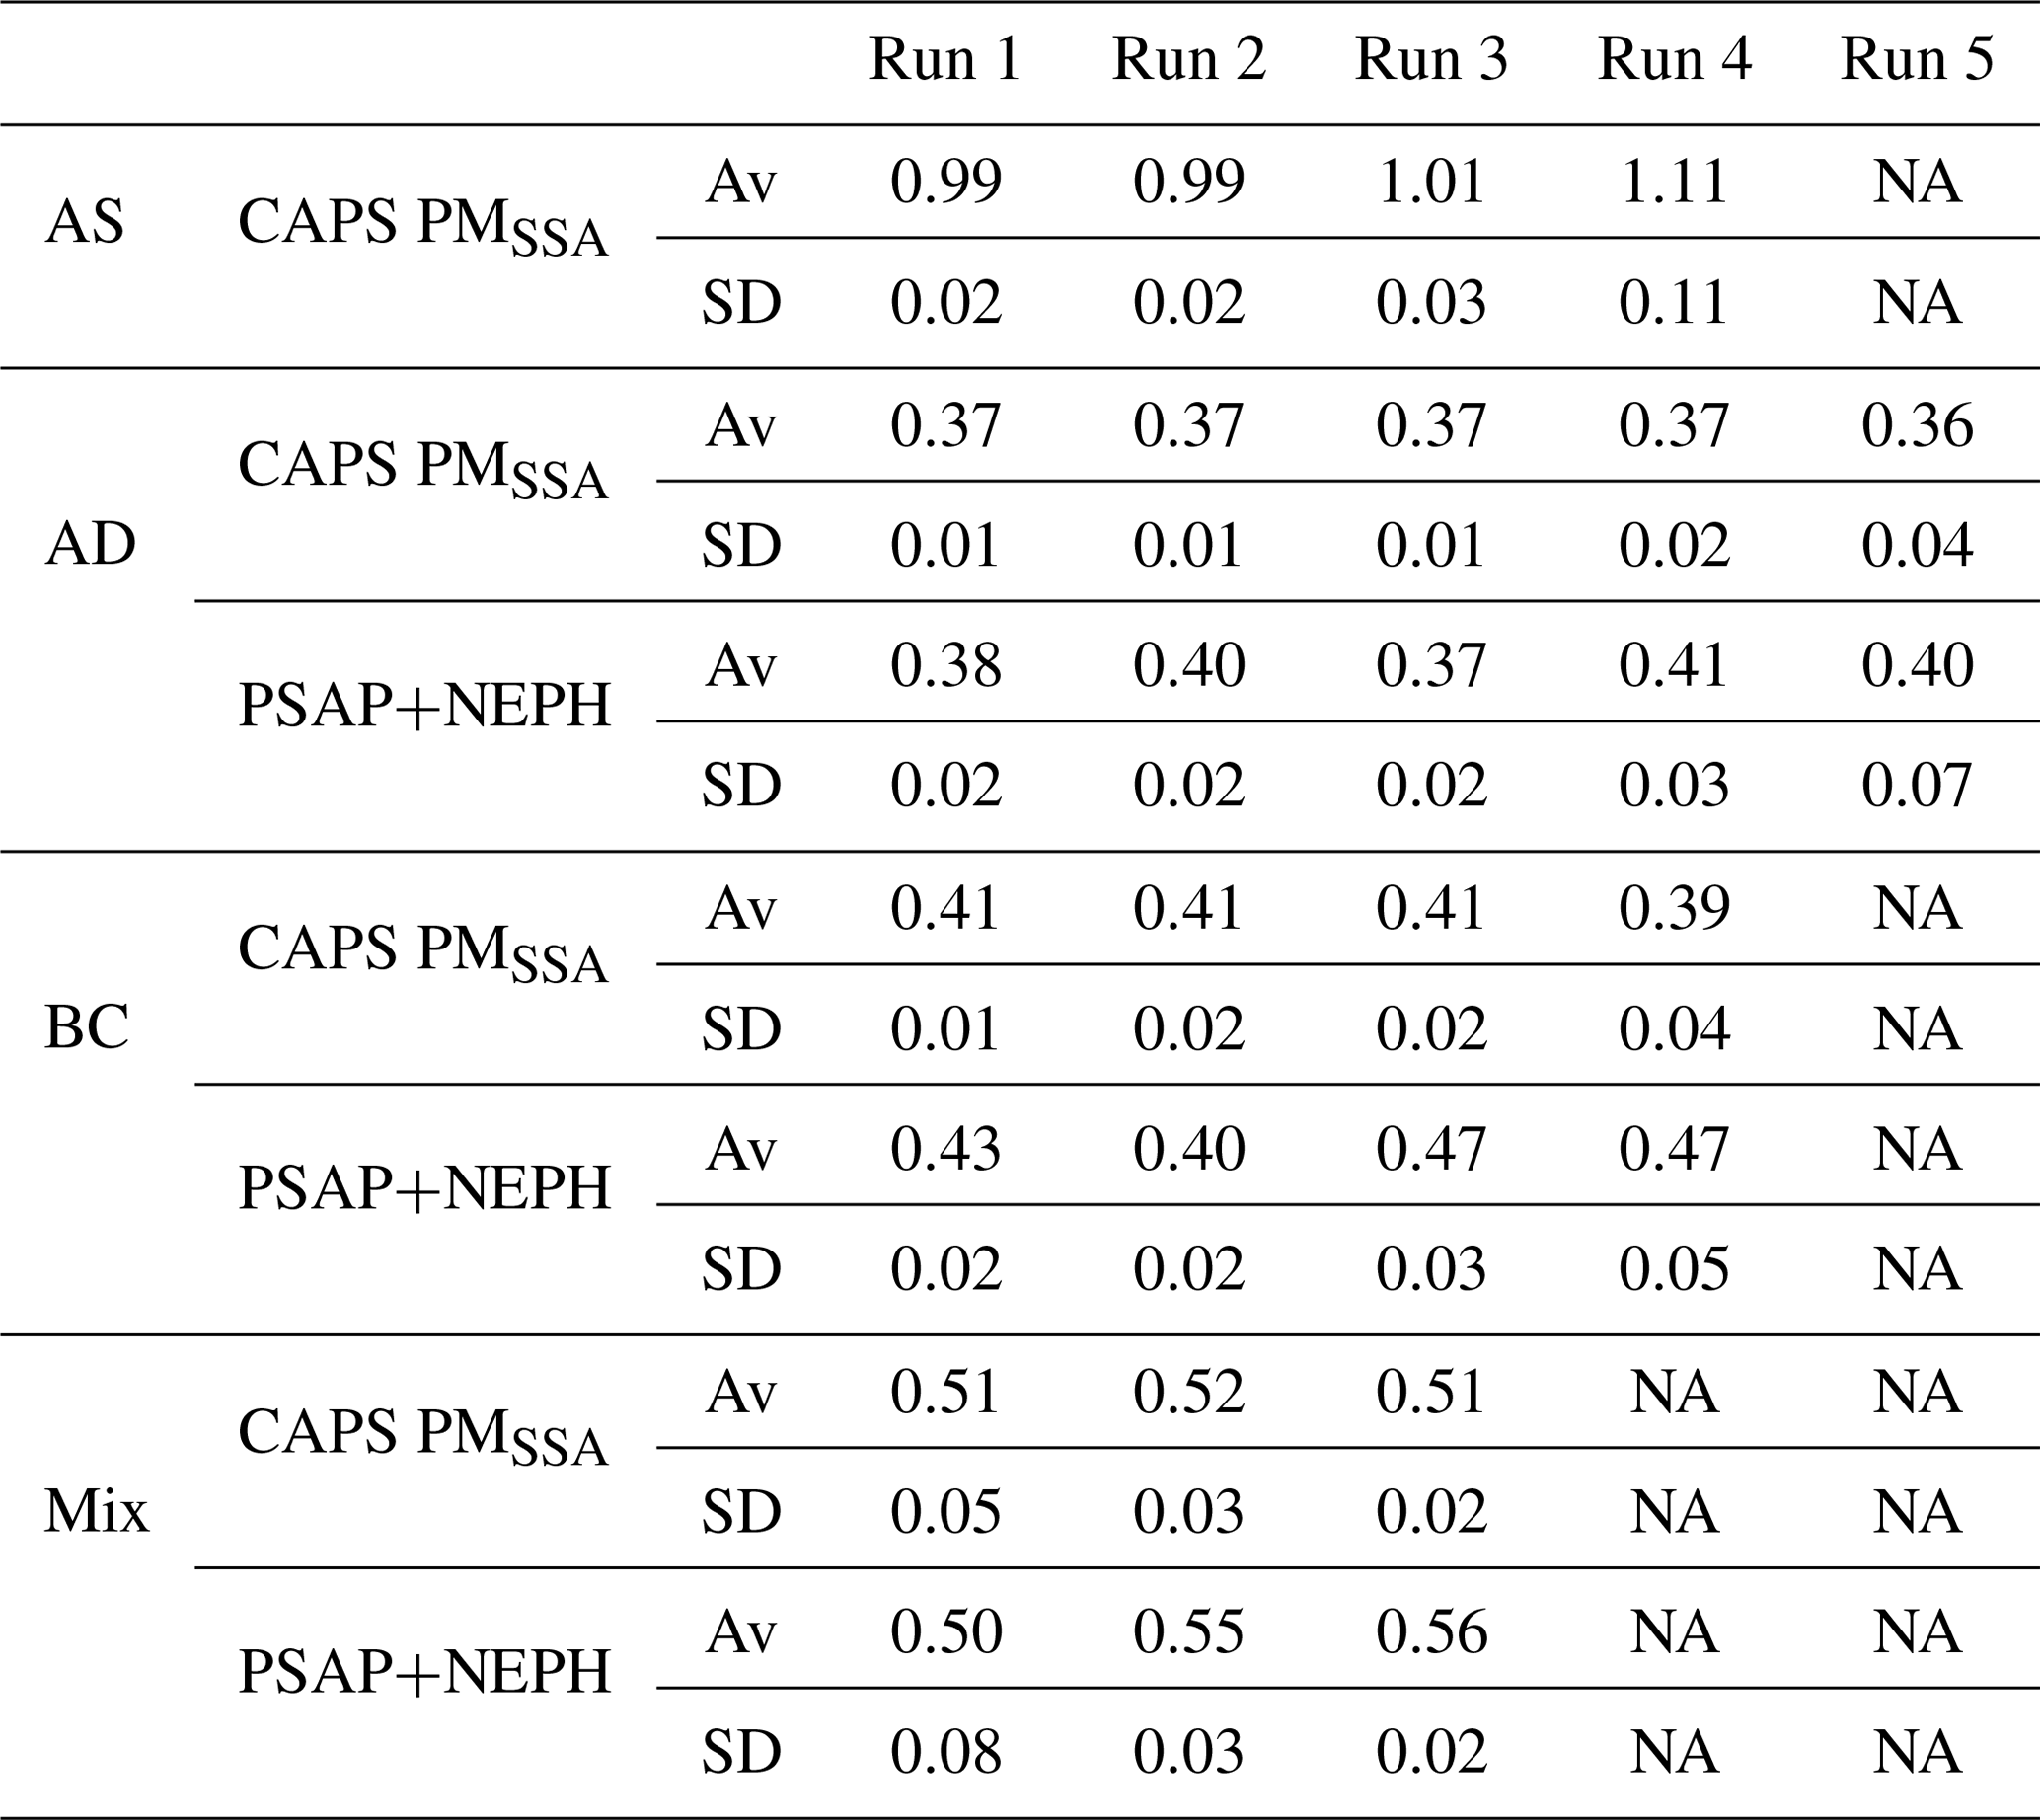
NA: not available. Av: average (mean).
Essential experimental data used in this work are included in Tables A1, A2, A3 and A4.
JPdF, UB and AP designed the study and prepared the manuscript with contributions from all co-authors. AF and TBO provided technical details of the instrumentation and contributed to the interpretation of the study results.
The authors declare that they have no conflict of interest.
Parts of this work were funded by the European Commission, Seventh Framework Programme and H2020 Research Infrastructures; the Federal Ministry of Education and Research, Germany; and HITEC Graduate School for Energy and Climate.
This research has been supported by the European Commission, Seventh Framework Programme (IAGOS-ERI (grant agreement no. 212128) and IGAS (grant agreement no. 312311)), H2020 Research Infrastructures (ENVRI PLUS (grant agreement no. 654182)); and the Federal Ministry of Education and Research, Germany (grant no. 01LK1301A).
The article processing charges for this open-access
publication were covered by a Research
Centre of the Helmholtz Association.
This paper was edited by Andrew Sayer and reviewed by two anonymous referees.
Anderson, T. L., Covert, D. S., Marshall, S. F., Laucks, M. L., Charlson, R. J., Waggoner, A. P., Ogren, J. A., Caldow, R., Holm, R. L., Quant, F. R., Sem, G. J., Wiedensohler, A., Ahlquist, N. A., and Bates, T. S.: Performance characteristics of a high-sensitivity, three-wavelength, total scatter/backscatter nephelometer, J. Atmos. Ocean. Technol., 13, 967–986, https://doi.org/10.1175/1520-0426(1996)013<0967:pcoahs>2.0.co;2, 1996.
Anderson, T. L. and Ogren, J. A.: Determining aerosol radiative properties using the TSI 3563 integrating nephelometer, Aerosol Sci. Technol., 29, 57–69, https://doi.org/10.1080/02786829808965551, 1998.
Andrews, E., Ogren, J. A., Bonasoni, P., Marinoni, A., Cuevas, E., Rodriguez, S., Sun, J. Y., Jaffe, D. A., Fischer, E. V., Baltensperger, U., Weingartner, E., Coen, M. C., Sharma, S., Macdonald, A. M., Leaitch, W. R., Lin, N. H., Laj, P., Arsov, T., Kalapov, I., Jefferson, A., and Sheridan, P.: Climatology of aerosol radiative properties in the free troposphere, Atmos. Res., 102, 365–393, https://doi.org/10.1016/j.atmosres.2011.08.017, 2011.
Arnott, W. P., Walker, J. W., Moosmuller, H., Elleman, R. A., Jonsson, H. H., Buzorius, G., Conant, W. C., Flagan, R. C., and Seinfeld, J. H.: Photoacoustic insight for aerosol light absorption aloft from meteorological aircraft and comparison with particle soot absorption photometer measurements: DOE Southern Great Plains climate research facility and the coastal stratocumulus imposed perturbation experiments, J. Geophys. Res.-Atmos., 111, D05s02, https://doi.org/10.1029/2005jd005964, 2006.
Bond, T. C., Anderson, T. L., and Campbell, D.: Calibration and intercomparison of filter-based measurements of visible light absorption by aerosols, Aerosol. Sci. Tech., 30, 582–600, 1999.
Boucher, O., Randall, D., Artaxo, P., Bretherton, C., Feingold, G., Forster, P., Kerminen, V.-M., Kondo, Y., Liao, H., Lohmann, U., Rasch, P., Satheesh, S. K., Sherwood, S., Stevens, B., and Zhang, X. Y.: Clouds and Aerosols, in: Climate Change 2013: The Physical Science Basis. Contribution of Working Group I to the Fifth Assessment Report of the Intergovernmental Panel on Climate Change, edited by: Stocker, T. F., Qin, D., Plattner, G.-K., Tignor, M., Allen, S. K., Boschung, J., Nauels, A., Xia, Y., Bex, V., and Midgley, P. M., Cambridge University Press, Cambridge, United Kingdom and New York, NY, USA, 571–658, 2013.
Corbin, J. C., Pieber, S. M., Czech, H., Zanatta, M., Jakobi, G., Massabo, D., Orasche, J., El Haddad, I., Mensah, A. A., Stengel, B., Drinovec, L., Mocnik, G., Zimmermann, R., Prevot, A. S. H., and Gysel, M.: Brown and black carbon emitted by a marine engine operated on heavy fuel oil and distillate fuels: optical properties, size distributions, and emission factors, J. Geophys. Res.-Atmos., 123, 6175-6195, D027818, https://doi.org/10.1029/2017jd027818, 2018.
Han, T. T., Xu, W. Q., Li, J., Freedman, A., Zhao, J., Wang, Q. Q., Chen, C., Zhang, Y. J., Wang, Z. F., Fu, P. Q., Liu, X. G., and Sun, Y. L.: Aerosol optical properties measurements by a CAPS single scattering albedo monitor: Comparisons between summer and winter in Beijing, China, J. Geophys. Res.-Atmos., 122, 2513–2526, https://doi.org/10.1002/2016jd025762, 2017.
Haywood, J. M. and Shine, K. P.: The effect of anthropogenic sulfate and soot aerosol on the clear-sky planetary radiation budget, Geophys. Res. Lett., 22, 603–606, https://doi.org/10.1029/95gl00075, 1995.
Heintzenberg, J. and Charlson, R. J.: Design and applications of the integrating nephelometer: A review, J. Atmos. Ocean. Technol., 13, 987–1000, https://doi.org/10.1175/1520-0426(1996)013<0987:daaoti> 2.0.co;2, 1996.
Heintzenberg, J., Wiedensohler, A., Tuch, T. M., Covert, D. S., Sheridan, P., Ogren, J. A., Gras, J., Nessler, R., Kleefeld, C., Kalivitis, N., Aaltonen, V., Wilhelm, R. T., and Havlicek, M.: Intercomparisons and aerosol calibrations of 12 commercial integrating nephelometers of three manufacturers, J. Atmos. Ocean. Technol., 23, 902–914, https://doi.org/10.1175/jtech1892.1, 2006.
Lack, D. A., Lovejoy, E. R., Baynard, T., Pettersson, A., and Ravishankara, A. R.: Aerosol absorption measurement using photoacoustic spectroscopy: Sensitivity, calibration, and uncertainty developments, Aerosol. Sci. Tech., 40, 697–708, https://doi.org/10.1080/02786820600803917, 2006.
Massoli, P., Murphy, D. M., Lack, D. A., Baynard, T., Brock, C. A., and Lovejoy, E. R.: Uncertainty in Light Scattering Measurements by TSI Nephelometer: Results from Laboratory Studies and Implications for Ambient Measurements, Aerosol. Sci. Tech., 42, 1064–1074, https://doi.org/10.1080/02786820903156542, 2009.
Massoli, P., Kebabian, P. L., Onasch, T. B., Hills, F. B., and Freedman, A.: Aerosol Light Extinction Measurements by Cavity Attenuated Phase Shift (CAPS) Spectroscopy: Laboratory Validation and Field Deployment of a Compact Aerosol Particle Extinction Monitor, Aerosol. Sci. Tech., 44, 428–435, https://doi.org/10.1080/02786821003716599, 2010.
Moosmüller, H., Varma, R., and Arnott, W. P.: Cavity ring-down and cavity-enhanced detection techniques for the measurement of aerosol extinction, Aerosol. Sci. Tech., 39, 30–39, https://doi.org/10.1080/027868290903880, 2005.
Müller, T., Nowak, A., Wiedensohler, A., Sheridan, P., Laborde, M., Covert, D. S., Marinoni, A., Imre, K., Henzing, B., Roger, J.-C., dos Santos, S. M., Wilhelm, R., Wang, Y.-Q., and de Leeuw, G.: Angular Illumination and Truncation of Three Different Integrating Nephelometers: Implications for Empirical, Size-Based Corrections, Aerosol. Sci. Tech., 43, 581–586, https://doi.org/10.1080/02786820902798484, 2009.
Müller, T., Henzing, J. S., de Leeuw, G., Wiedensohler, A., Alastuey, A., Angelov, H., Bizjak, M., Collaud Coen, M., Engström, J. E., Gruening, C., Hillamo, R., Hoffer, A., Imre, K., Ivanow, P., Jennings, G., Sun, J. Y., Kalivitis, N., Karlsson, H., Komppula, M., Laj, P., Li, S.-M., Lunder, C., Marinoni, A., Martins dos Santos, S., Moerman, M., Nowak, A., Ogren, J. A., Petzold, A., Pichon, J. M., Rodriquez, S., Sharma, S., Sheridan, P. J., Teinilä, K., Tuch, T., Viana, M., Virkkula, A., Weingartner, E., Wilhelm, R., and Wang, Y. Q.: Characterization and intercomparison of aerosol absorption photometers: result of two intercomparison workshops, Atmos. Meas. Tech., 4, 245–268, https://doi.org/10.5194/amt-4-245-2011, 2011.
Müller, T., Virkkula, A., and Ogren, J. A.: Constrained two-stream algorithm for calculating aerosol light absorption coefficient from the Particle Soot Absorption Photometer, Atmos. Meas. Tech., 7, 4049–4070, https://doi.org/10.5194/amt-7-4049-2014, 2014.
Ogren, J. A.: Comment on Calibration and Intercomparison of Filter-Based Measurements of Visible Light Absorption by Aerosolso, Aerosol. Sci. Tech., 44, 589–591, https://doi.org/10.1080/02786826.2010.482111, 2010.
Ogren, J. A., Wendell, J., Andrews, E., and Sheridan, P. J.: Continuous light absorption photometer for long-term studies, Atmos. Meas. Tech., 10, 4805–4818, https://doi.org/10.5194/amt-10-4805-2017, 2017.
Onasch, T. B., Massoli, P., Kebabian, P. L., Hills, F. B., Bacon, F. W., and Freedman, A.: Single Scattering Albedo Monitor for Airborne Particulates, Aerosol. Sci. Tech., 49, 267–279, https://doi.org/10.1080/02786826.2015.1022248, 2015.
Perim de Faria, J., Bundke, U., Berg, M., Freedman, A., Onasch, T. B., and Petzold, A.: Airborne and laboratory studies of an IAGOS instrumentation package containing a modified CAPS particle extinction monitor, Aerosol. Sci. Tech., 51, 1–14, https://doi.org/10.1080/02786826.2017.1355547, 2017.
Petzold, A. and Schönlinner, M.: Multi-angle absorption photometry – a new method for the measurement of aerosol light absorption and atmospheric black carbon, J. Aerosol Sci., 35, 421–441, https://doi.org/10.1016/j.jaerosci.2003.09.005, 2004.
Petzold, A., Onasch, T., Kebabian, P., and Freedman, A.: Intercomparison of a Cavity Attenuated Phase Shift-based extinction monitor (CAPS PMex) with an integrating nephelometer and a filter-based absorption monitor, Atmos. Meas. Tech., 6, 1141–1151, https://doi.org/10.5194/amt-6-1141-2013, 2013.
Sheridan, P. J., Andrews, E., Ogren, J. A., Tackett, J. L., and Winker, D. M.: Vertical profiles of aerosol optical properties over central Illinois and comparison with surface and satellite measurements, Atmos. Chem. Phys., 12, 11695–11721, https://doi.org/10.5194/acp-12-11695-2012, 2012.
Virkkula, A.: Correction of the Calibration of the 3-wavelength Particle Soot Absorption Photometer (3 PSAP), Aerosol. Sci. Tech., 44, 706–712, https://doi.org/10.1080/02786826.2010.482110, 2010.