the Creative Commons Attribution 4.0 License.
the Creative Commons Attribution 4.0 License.
 | 01 Mar 2021
Retrieval of aerosol fine-mode fraction over China from satellite multiangle polarized observations: validation and comparison
Yang Zhang
Zhengqiang Li
Zhihong Liu
Yongqian Wang
Lili Qie
Yisong Xie
Weizhen Hou
Lu Leng
The aerosol fine-mode fraction (FMF) is an important optical parameter of aerosols, and the FMF is difficult to accurately retrieve by traditional satellite remote sensing methods. In this study, FMF retrieval was carried out based on the multiangle polarization data of Polarization and Anisotropy of Reflectances for Atmospheric Science coupled with Observations from Lidar (PARASOL), which overcame the shortcomings of the FMF retrieval algorithm in our previous research. In this research, FMF retrieval was carried out in China and compared with the AErosol RObotic NETwork (AERONET) ground-based observation results, Moderate Resolution Imaging Spectroradiometer (MODIS) FMF products, and Generalized Retrieval of Aerosol and Surface Properties (GRASP) FMF results. In addition, the FMF retrieval algorithm was applied, a new FMF dataset was produced, and the annual and quarterly average FMF results from 2006 to 2013 were obtained for all of China. The research results show that the FMF retrieval results of this study are comparable with the AERONET ground-based observation results in China and the correlation coefficient (r), mean absolute error (MAE), root mean square error (RMSE), and the proportion of results that fall within the expected error (Within EE) are 0.770, 0.143, 0.170, and 65.01 %, respectively. Compared with the MODIS FMF products, the FMF results of this study are closer to the AERONET ground-based observations. Compared with the FMF results of GRASP, the FMF results of this study are closer to the spatial variation in the ratio of PM2.5 to PM10 near the ground.
Please read the corrigendum first before continuing.
-
Notice on corrigendum
The requested paper has a corresponding corrigendum published. Please read the corrigendum first before downloading the article.
-
Article
(12740 KB)
-
The requested paper has a corresponding corrigendum published. Please read the corrigendum first before downloading the article.
- Article
(12740 KB) - Full-text XML
- Corrigendum
- BibTeX
- EndNote


Aerosols have a great impact on human production, life, and climate change (Kaufman et al., 2002; Huang et al., 2014; Shi et al., 2018). Aerosols have become a research hotspot for scientists from various fields. There are many methods for monitoring aerosols, among which the large-scale coverage of remote sensing technology makes it an effective method for monitoring aerosols. Aerosols produce strong scattering effects in the visible light band (Kokhanovsky et al., 2015). Therefore, in current satellite remote sensing, visible light channels are generally used to observe aerosols and aerosol information can be obtained on a global scale. At present, in the field of atmospheric environmental research, aerosol optical depth (AOD) products produced by traditional satellite remote sensing platforms, such as the Moderate Resolution Imaging Spectroradiometer (MODIS), are the most commonly used (Bellouin et al., 2005; Lee et al., 2011; Xie et al., 2015; Zhao et al., 2017; Zhang et al., 2020). Related scholars have carried out many AOD retrieval studies on traditional scalar observation platforms, which can achieve high-precision retrievals and the retrieval of AOD (Li et al., 2013; Kim et al., 2014; Zhang et al., 2014; Zhong et al., 2017; Ge et al., 2019). However, other new aerosol optical parameters, such as the fine-mode fraction (FMF), are quite different in definition from the ground-based observations (Remer et al., 2005; Levy et al., 2010), which makes them incomparable. The FMF is a parameter that can reflect the content of human-made aerosols (Bellouin et al., 2005; Kaufman et al., 2005) and application requirements have been put forward in many studies. For example, in the PM2.5 remote sensing (PMRS) model based on the purely physical approach proposed by Zhang and Li (2015) and Li et al. (2016), the FMF is one of the core input parameters that determines the final particle concentration retrieval accuracy (Zhang and Li, 2015; Li et al., 2016). However, the existing publicly released satellite FMF products have poor accuracy, which severely limits the retrieval accuracy of the model.
Multiangle polarization observations are a frontier research direction in the field of aerosol remote sensing. These observations have unique advantages in the retrieval of aerosol parameters. Related information analysis work shows that polarization observations can obtain more aerosol information than scalar observations (Chen et al., 2017a, b; Hou et al., 2018). Therefore, the accurate acquisition of more new aerosol parameters based on multiangle polarization observations is of great significance for both atmospheric environmental research and the development of aerosol basic retrieval algorithms. Although official institutions and some scholars have carried out retrieval studies of aerosol parameters based on multiangle polarization observation platforms, such as POLarization and Directionality of the Earth's Reflectances (POLDER), these studies have their own limitations. For example, the French Laboratoire d'Optique Atmospherique (LOA) only provided the fine-mode aerosol optical depth (AODf) datasets in its operational products over land (Deuzé et al., 2001; Tanré et al., 2011); the total aerosol optical depth (AODt) was not provided (Chen et al., 2020). Dubovik et al. (2011) proposed an optimized retrieval method for polarization observation platforms that can obtain high-precision aerosol optical parameters. Recently, an operational aerosol product of Generalized Retrieval of Aerosol and Surface Properties (GRASP) based on POLDER data was released (Dubovik et al., 2014) and relevant validation studies show that the product has high retrieval accuracy (Tan et al., 2019; Wei et al., 2020). However, with regard to this method, its computational convergence speed is slow, computational resources are consumed, and a large amount of mathematical statistics is involved. Compared with the traditional lookup table (LUT) method, this method is more difficult to implement. Although other scholars are conducting related research (Chen et al., 2018; Frouin et al., 2019; Schuster et al., 2019; Li et al., 2020), it is still seldom used in actual engineering applications. The research of other scholars on the retrieval of new aerosol parameters based on the LUT method, although the results produced by the algorithm have high retrieval accuracy, generally only focus on a specific area, and the spatial scale is not large (Cheng et al., 2012; Xie et al., 2013; Wang et al., 2015; Qie et al., 2015; Wang et al., 2018). There are also fewer studies on the production of long-term aerosol optical parameter datasets. In 2016, we proposed a method for retrieving the FMF based on satellite multiangle scalar and polarization observations (Zhang et al., 2016), mainly based on multiangle scalar observations to obtain AODt and multiangle polarization observations to obtain AODf. The ratio of the two is the FMF. Compared with the existing MOIDS FMF products, the accuracy of the FMF results obtained by this method is significantly improved, which shows the feasibility of the method. However, there are still some problems that need to be solved if this method is to be applied in large spaces. For example, the empirical parameters of surface reflectance estimation during scalar retrieval vary greatly with region and high-precision AODt retrieval results can only be obtained in specific regions. In polarization retrieval, the problem of a low AODf retrieval value for high aerosol loading exists (Chen et al., 2015; Zhang et al., 2018). In response to these problems, we have also carried out follow-up research, made certain improvements to the above problems, and have achieved more accurate AODt and AODf in a large space (Zhang et al., 2017, 2018). Then, in theory, it is possible to achieve the goal of FMF in a large space. Although Yan et al. (2017, 2019) achieved high-precision FMF retrieval based on the LUT-SDA method, their method is mainly oriented to traditional multispectral scalar sensors. To apply this method to multiangle polarization sensors, it is necessary to perform a series of algorithm adjustments. In previous research, we have achieved high-precision retrieval of AODt and AODf in a large space. The retrieval method and results can be directly used to obtain the FMF without additional algorithmic adjustments.
This paper is mainly based on the POLDER-3 multiangle polarization sensor on the Polarization and Anisotropy of Reflectances for Atmospheric Science coupled with Observations from a Lidar (PARASOL) satellite and the existing research foundation, and it carried out the retrieval and validation of the FMF in the land area of China. The second section of the study briefly introduces the FMF retrieval algorithm based on multiangle polarization observation, AErosol RObotic NETwork (AERONET) data, and the data validation method. The third section mainly compares the retrieval results based on the AERONET ground-based observation data. At the same time, it was also compared with the operational aerosol products of MODIS and GRASP. Section 4 summarizes the full text and proposes future work prospects.
2.1 Introduction to the FMF retrieval method
The technical framework of FMF retrieval in this research is shown in Fig. 1. Overall, the FMF retrieval in this study consists of two parts: using the multiangle scalar and polarization data of POLDER-3 to obtain AODt and AODf, and the final ratio of the two is FMF. This method is the same as the retrieval method proposed in our 2016 study (Zhang et al., 2016). However, our previous method is limited by semiempirical parameters on the surface and can only obtain better FMF results on the urban scale. To obtain stable and accurate results in a large space, we have made major changes to the retrieval methods of AODt and AODf. For the specific retrieval method, please refer to the research we published in 2017 and 2018; here, only a brief introduction is given.
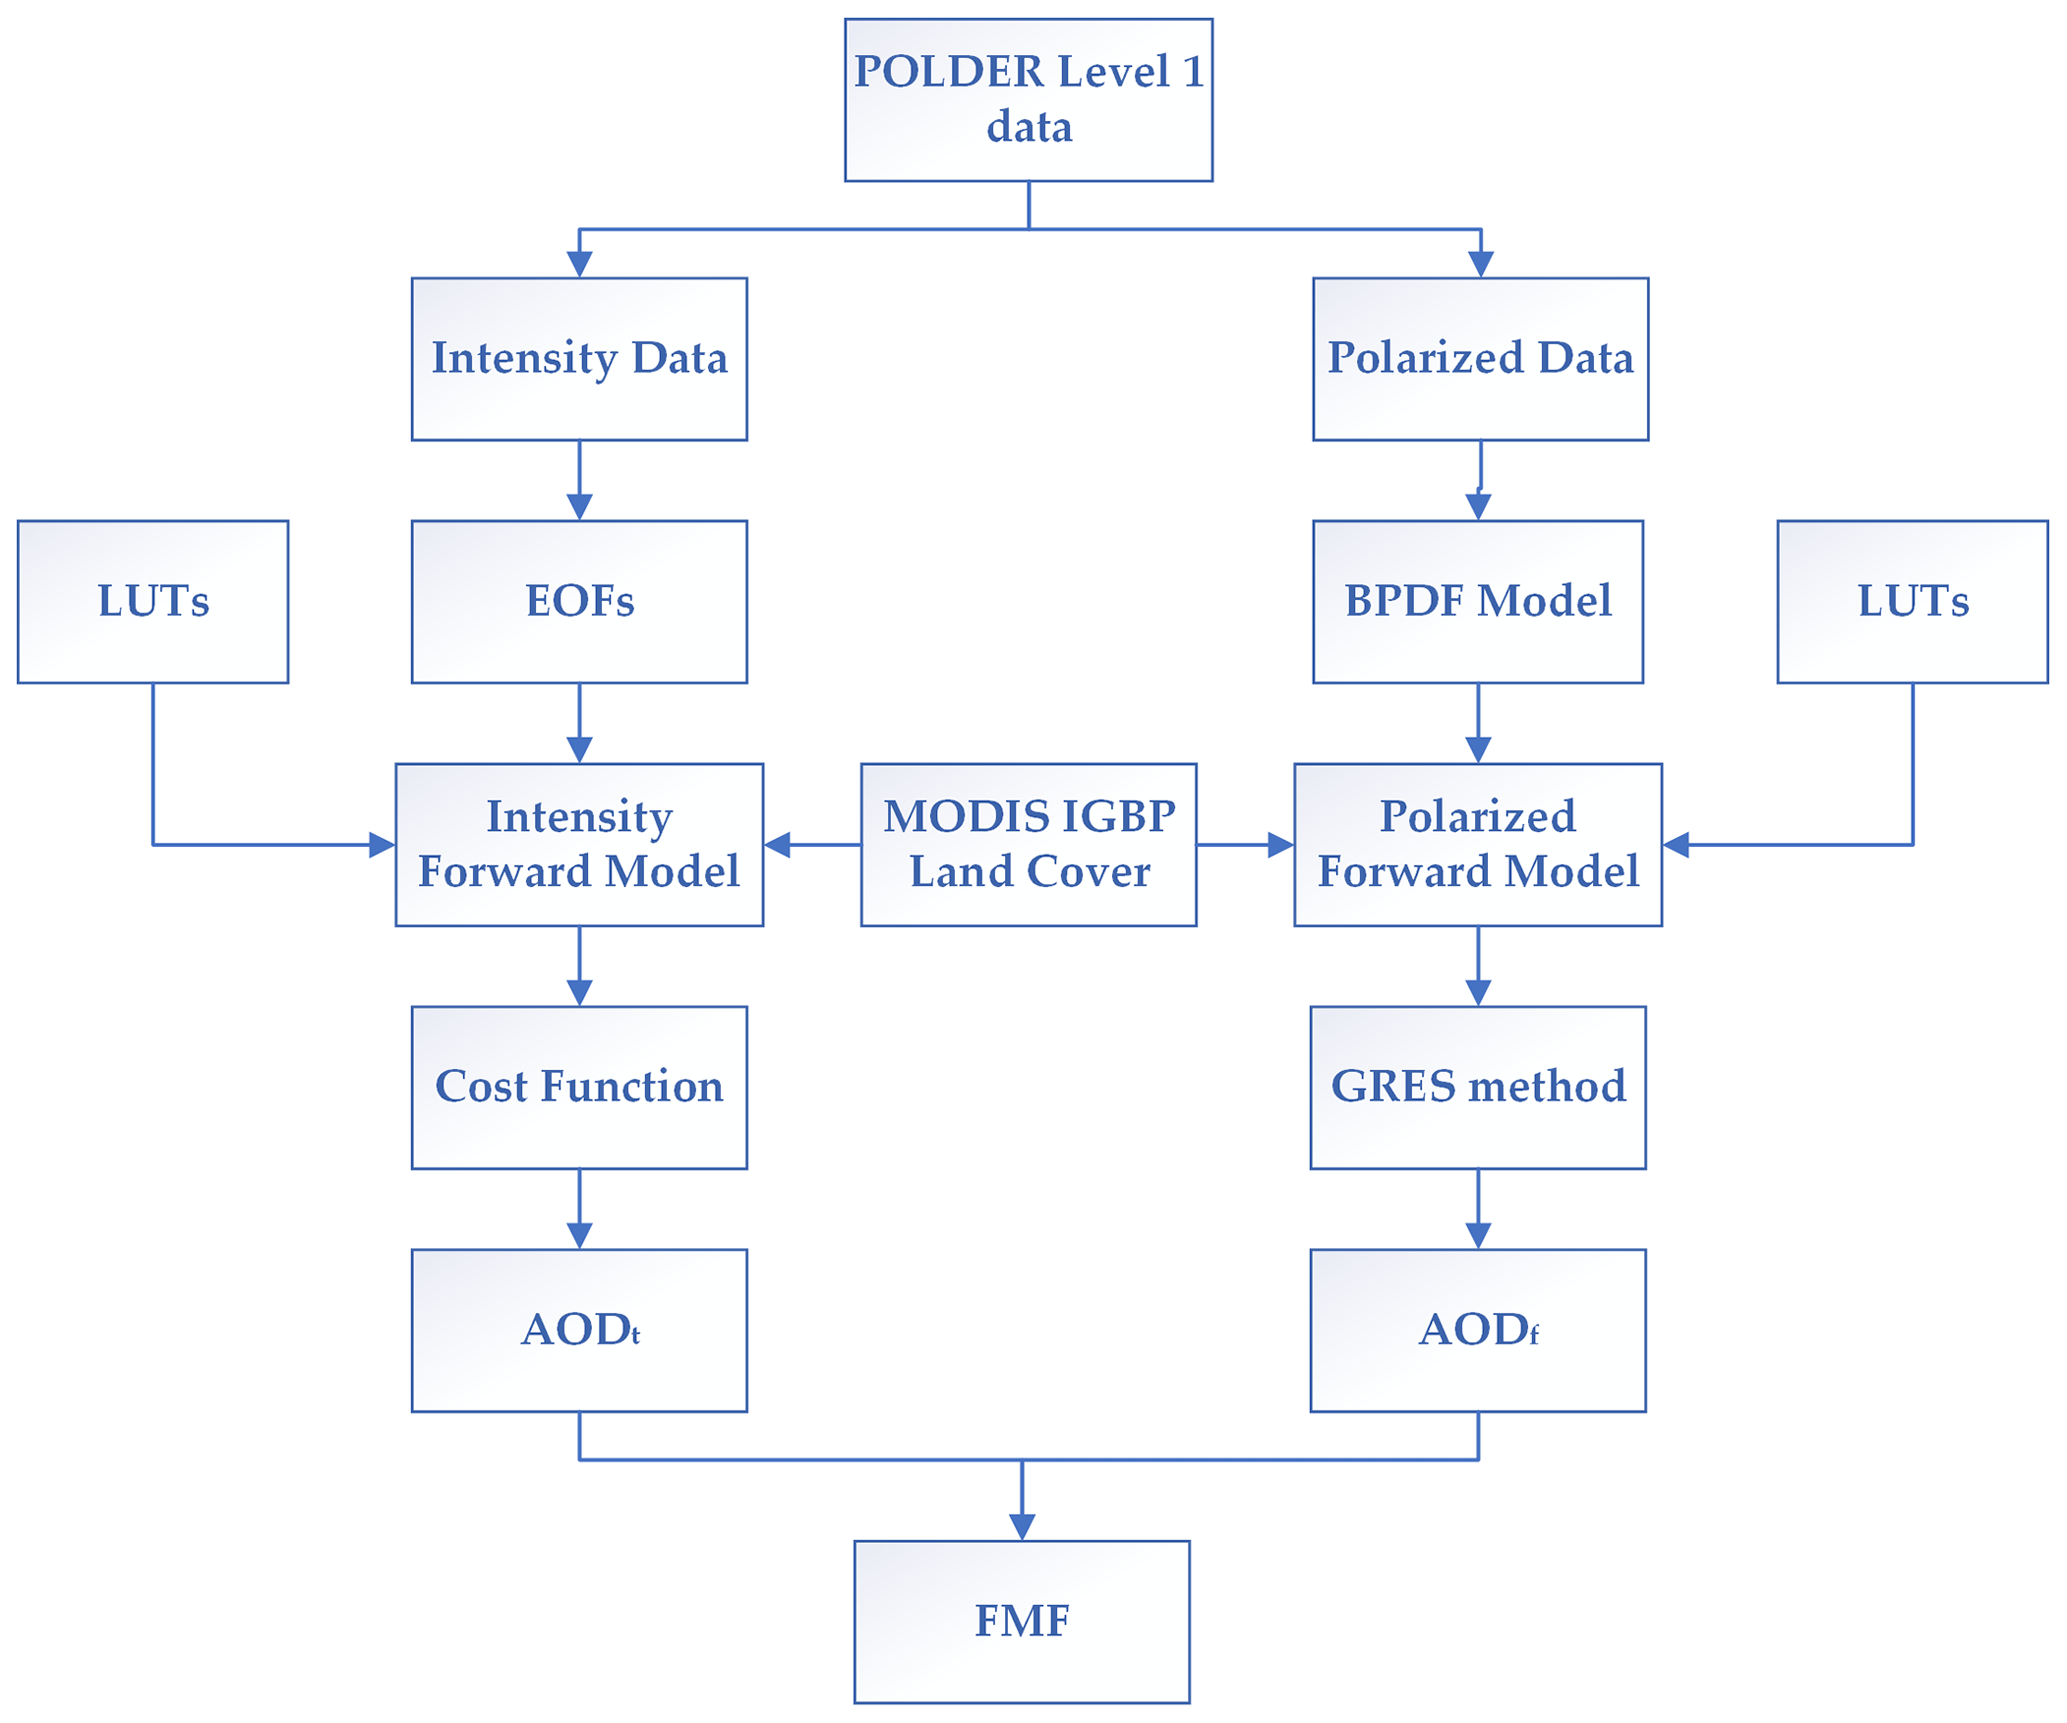
For the retrieval of AODt, we introduced the empirical orthogonal function (EOF) to estimate the surface reflection contribution under multiangle observations to solve the regional limitation of the semiempirical parameters of the surface in the original method. Subsequently, this is combined with the retrieval lookup table and substituted into the forward model for simulation calculation and, finally, AODt can be obtained through the cost function. The correlation coefficient (r) and root mean square error (RMSE) between the obtained AODt and AERONET ground-based observations are 0.891 and 0.097, respectively. The EOF method has previously been used for the retrieval of land aerosols on Multi-angle Imaging SpectroRadiometer (MISR); we transplanted this method into POLDER based on the MISR approach. For more details, please refer to our 2017 study (Zhang et al., 2017).
For the retrieval of AODf, our research and that of other scholars has shown that the AODf results obtained by using the operational LOA algorithm have a certain deviation compared with ground-based observations. To improve the retrieval accuracy of AODf, we proposed the grouped residual error sorting (GRES) method in 2018 to solve the problem of an inaccurate evaluation function caused by error accumulation under multiangle observation. Based on this method, combined with a bidirectional polarization distribution function (BPDF) model to estimate the polarized surface reflectance (Nadal and Bréon, 1999), we have obtained higher-precision AODf results in eastern China, and the r and RMSE between the results and the AERONET ground-based observations are 0.931 and 0.042, respectively. More method details can be found in our research published in 2018 (Zhang et al., 2018).
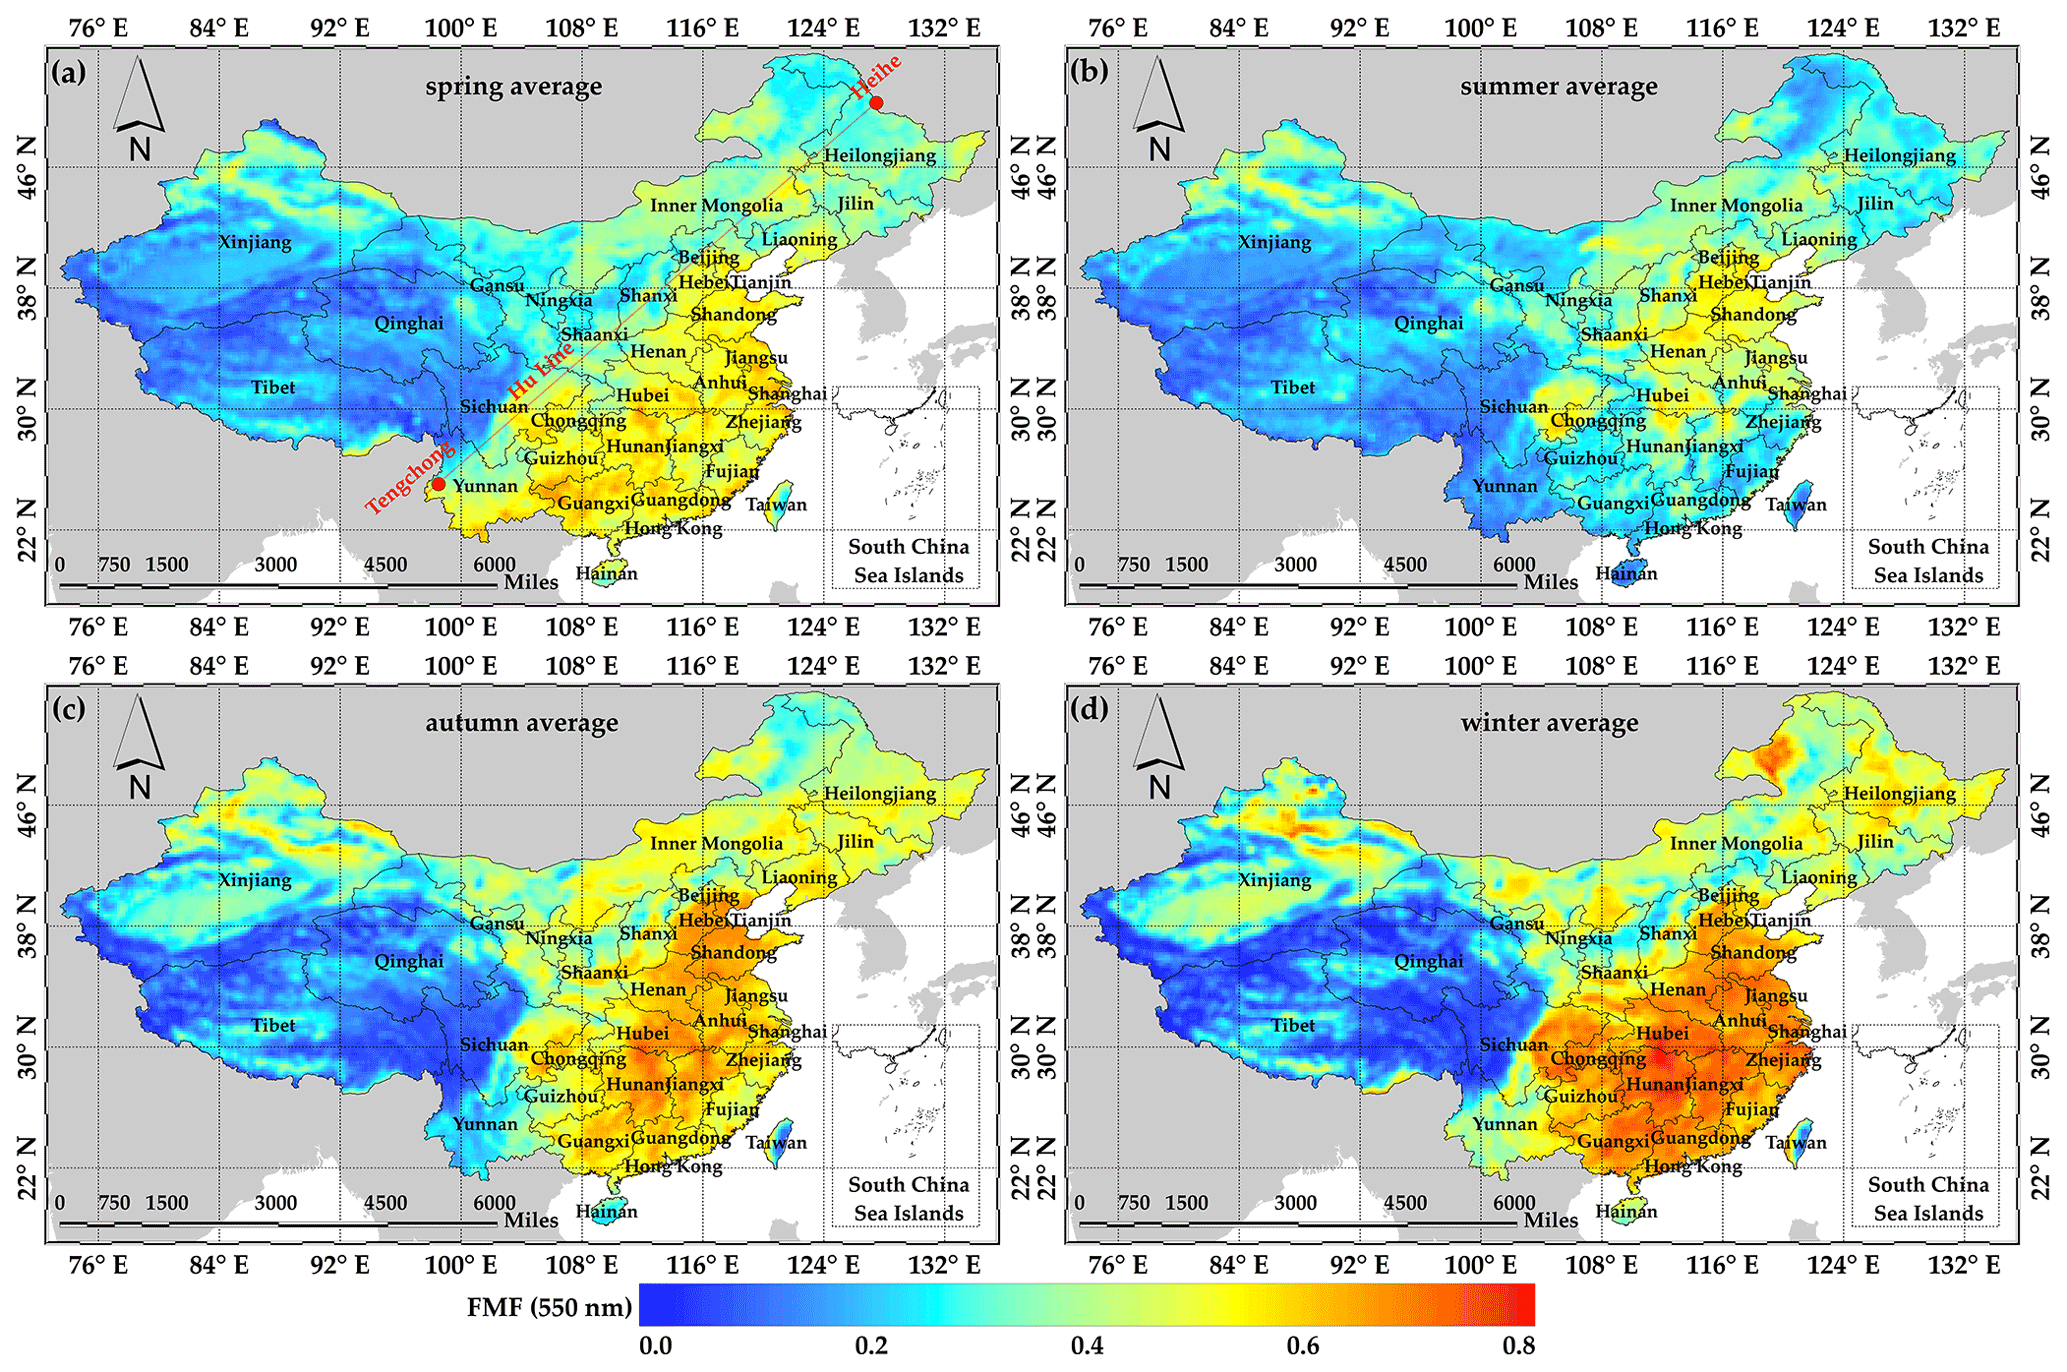
Figure 2Results of the FMF seasonal average spatial distribution of China. Panels (a)–(d) are the results of spring, summer, autumn, and winter, respectively, from 2006 to 2013.
Based on the new retrieval method, we have obtained higher-precision AODt and AODf retrieval results on a large spatial scale, which also provides the possibility of obtaining accurate FMF results on a large spatial scale. Figure 2 shows the seasonal average spatial distribution results of the FMF in China from 2006 to 2013 obtained in this study. In the figure, spring is from March to May, summer is from June to August, autumn is from September to November, and winter is from December to February. As seen in the figure, for the eastern area of the “Hu Line”, the overall FMF reached its highest value in winter, mainly concentrated in the range of 0.7–0.8. The FMF of southern China still has a relatively high value in the spring, and the overall value is approximately 0.6, while in northern China, the plain area is lower, generally between 0.4–0.5. The North China Plain in summer is similar to that in spring, but there is a significant decline in southern China, where the value is generally between 0.3–0.5. In autumn, the overall value begins to rise, with a value of approximately 0.6. The Sichuan–Chongqing economic zone maintains a relatively high value in all four seasons and the value in some areas in winter is close to 0.8, while the three northeastern provinces also have high values in winter, with an overall value between 0.4–0.7. For the area west of the “Hu line”, the northern Xinjiang area is higher in autumn and winter; it can reach 0.7 in some areas in winter. The southern Xinjiang area also shows a significant increase in winter, with some high values close to 0.6, whereas the Qinghai–Tibet Plateau maintains a low value in all seasons, and the value is mainly concentrated between 0.1–0.3.
Next, we will validate the FMF retrieval results based on the AERONET ground-based observation results. Note that since the EOFs during the AODt retrieval need to be constructed with the observation results of the POLDER 3 × 3 window, the resolution of the final FMF retrieval result is also the size of the POLDER 3 × 3 window (approximately 18 km).
2.2 AERONET data
At present, aerosol ground-based products of AERONET have been developed to version V3 and the data of version V2 are no longer available for download. Among these products, there are two products that can be used to validate the results of satellite FMF retrieval: one is the FMF product based on the spectral deconvolution (SDA) method (O'Neill et al., 2001a, b, 2003) and the other is based on the size distribution (SD) retrieval product (Dubovik and King, 2000). Generally, SDA products can provide more FMF ground-based results. At present, most ground-based stations in China provide SDA products with level 2.0 data quality. Therefore, SDA products are the first choice for the FMF comparison in this study. However, it is worth pointing out that the Beijing site lacks the SDA product with level 2.0 data quality, so we used the SD product instead. Finally, this study selected the level 2.0 products of 16 AERONET sites in China during 2006–2013 (POLDER on-orbit time) to validate the FMF retrieval results of this study. The specific spatial locations of AERONET sites are shown in Fig. 3, and the specific site information is shown in Table 1. However, note that not all AERONET sites have long-term observational data. The sites with long-term observational data are the Beijing, Xianghe, Taihu, and Hong_Kong_PolyU sites.
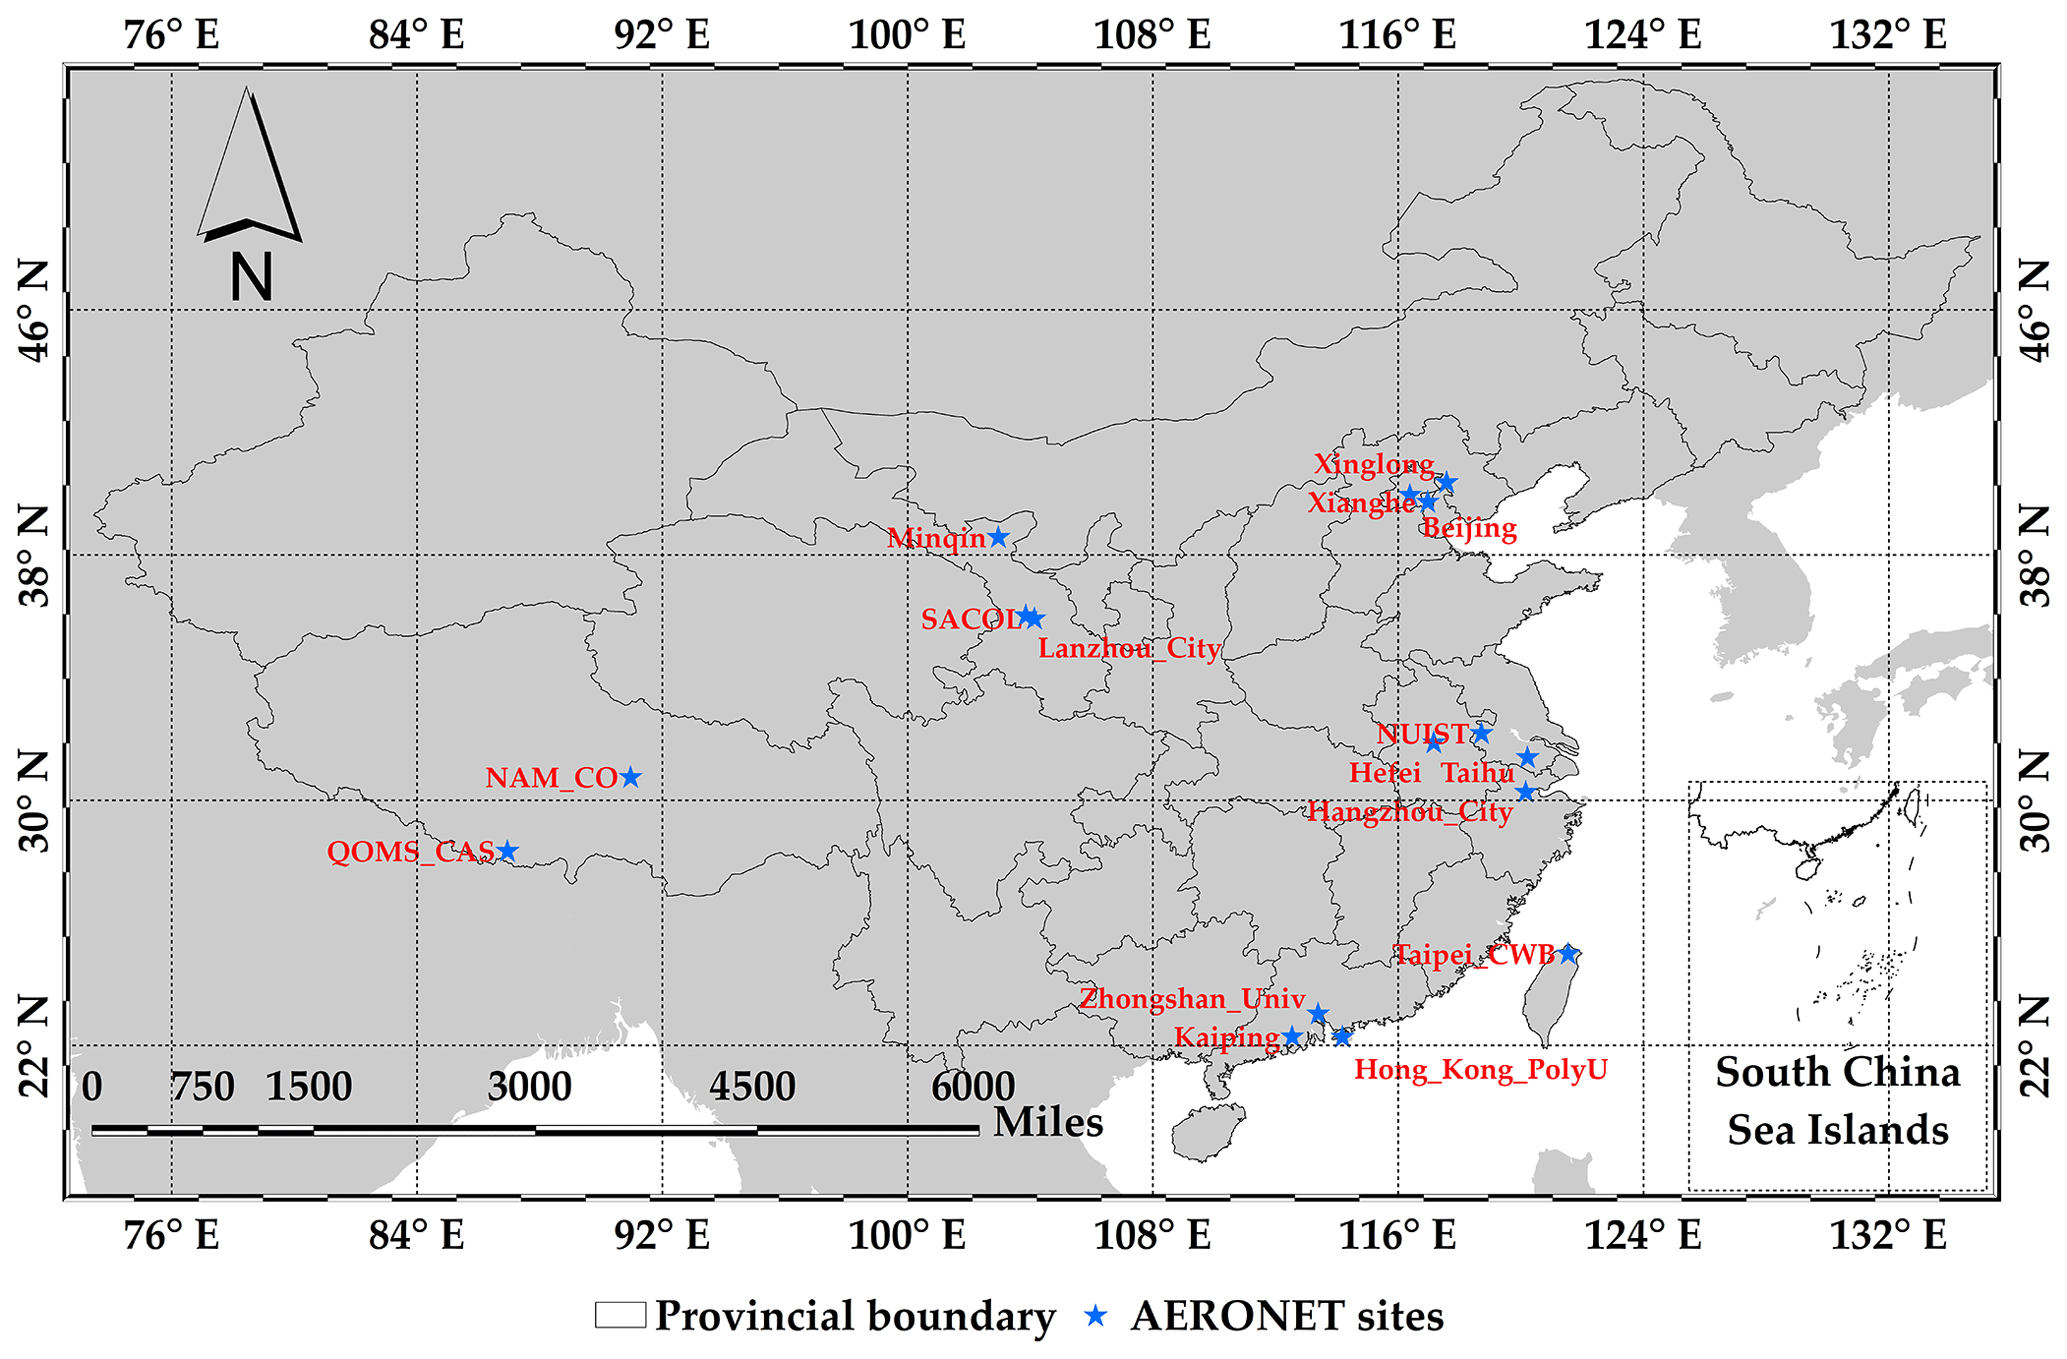
Figure 3The spatial distribution of AERONET sites selected in this study.
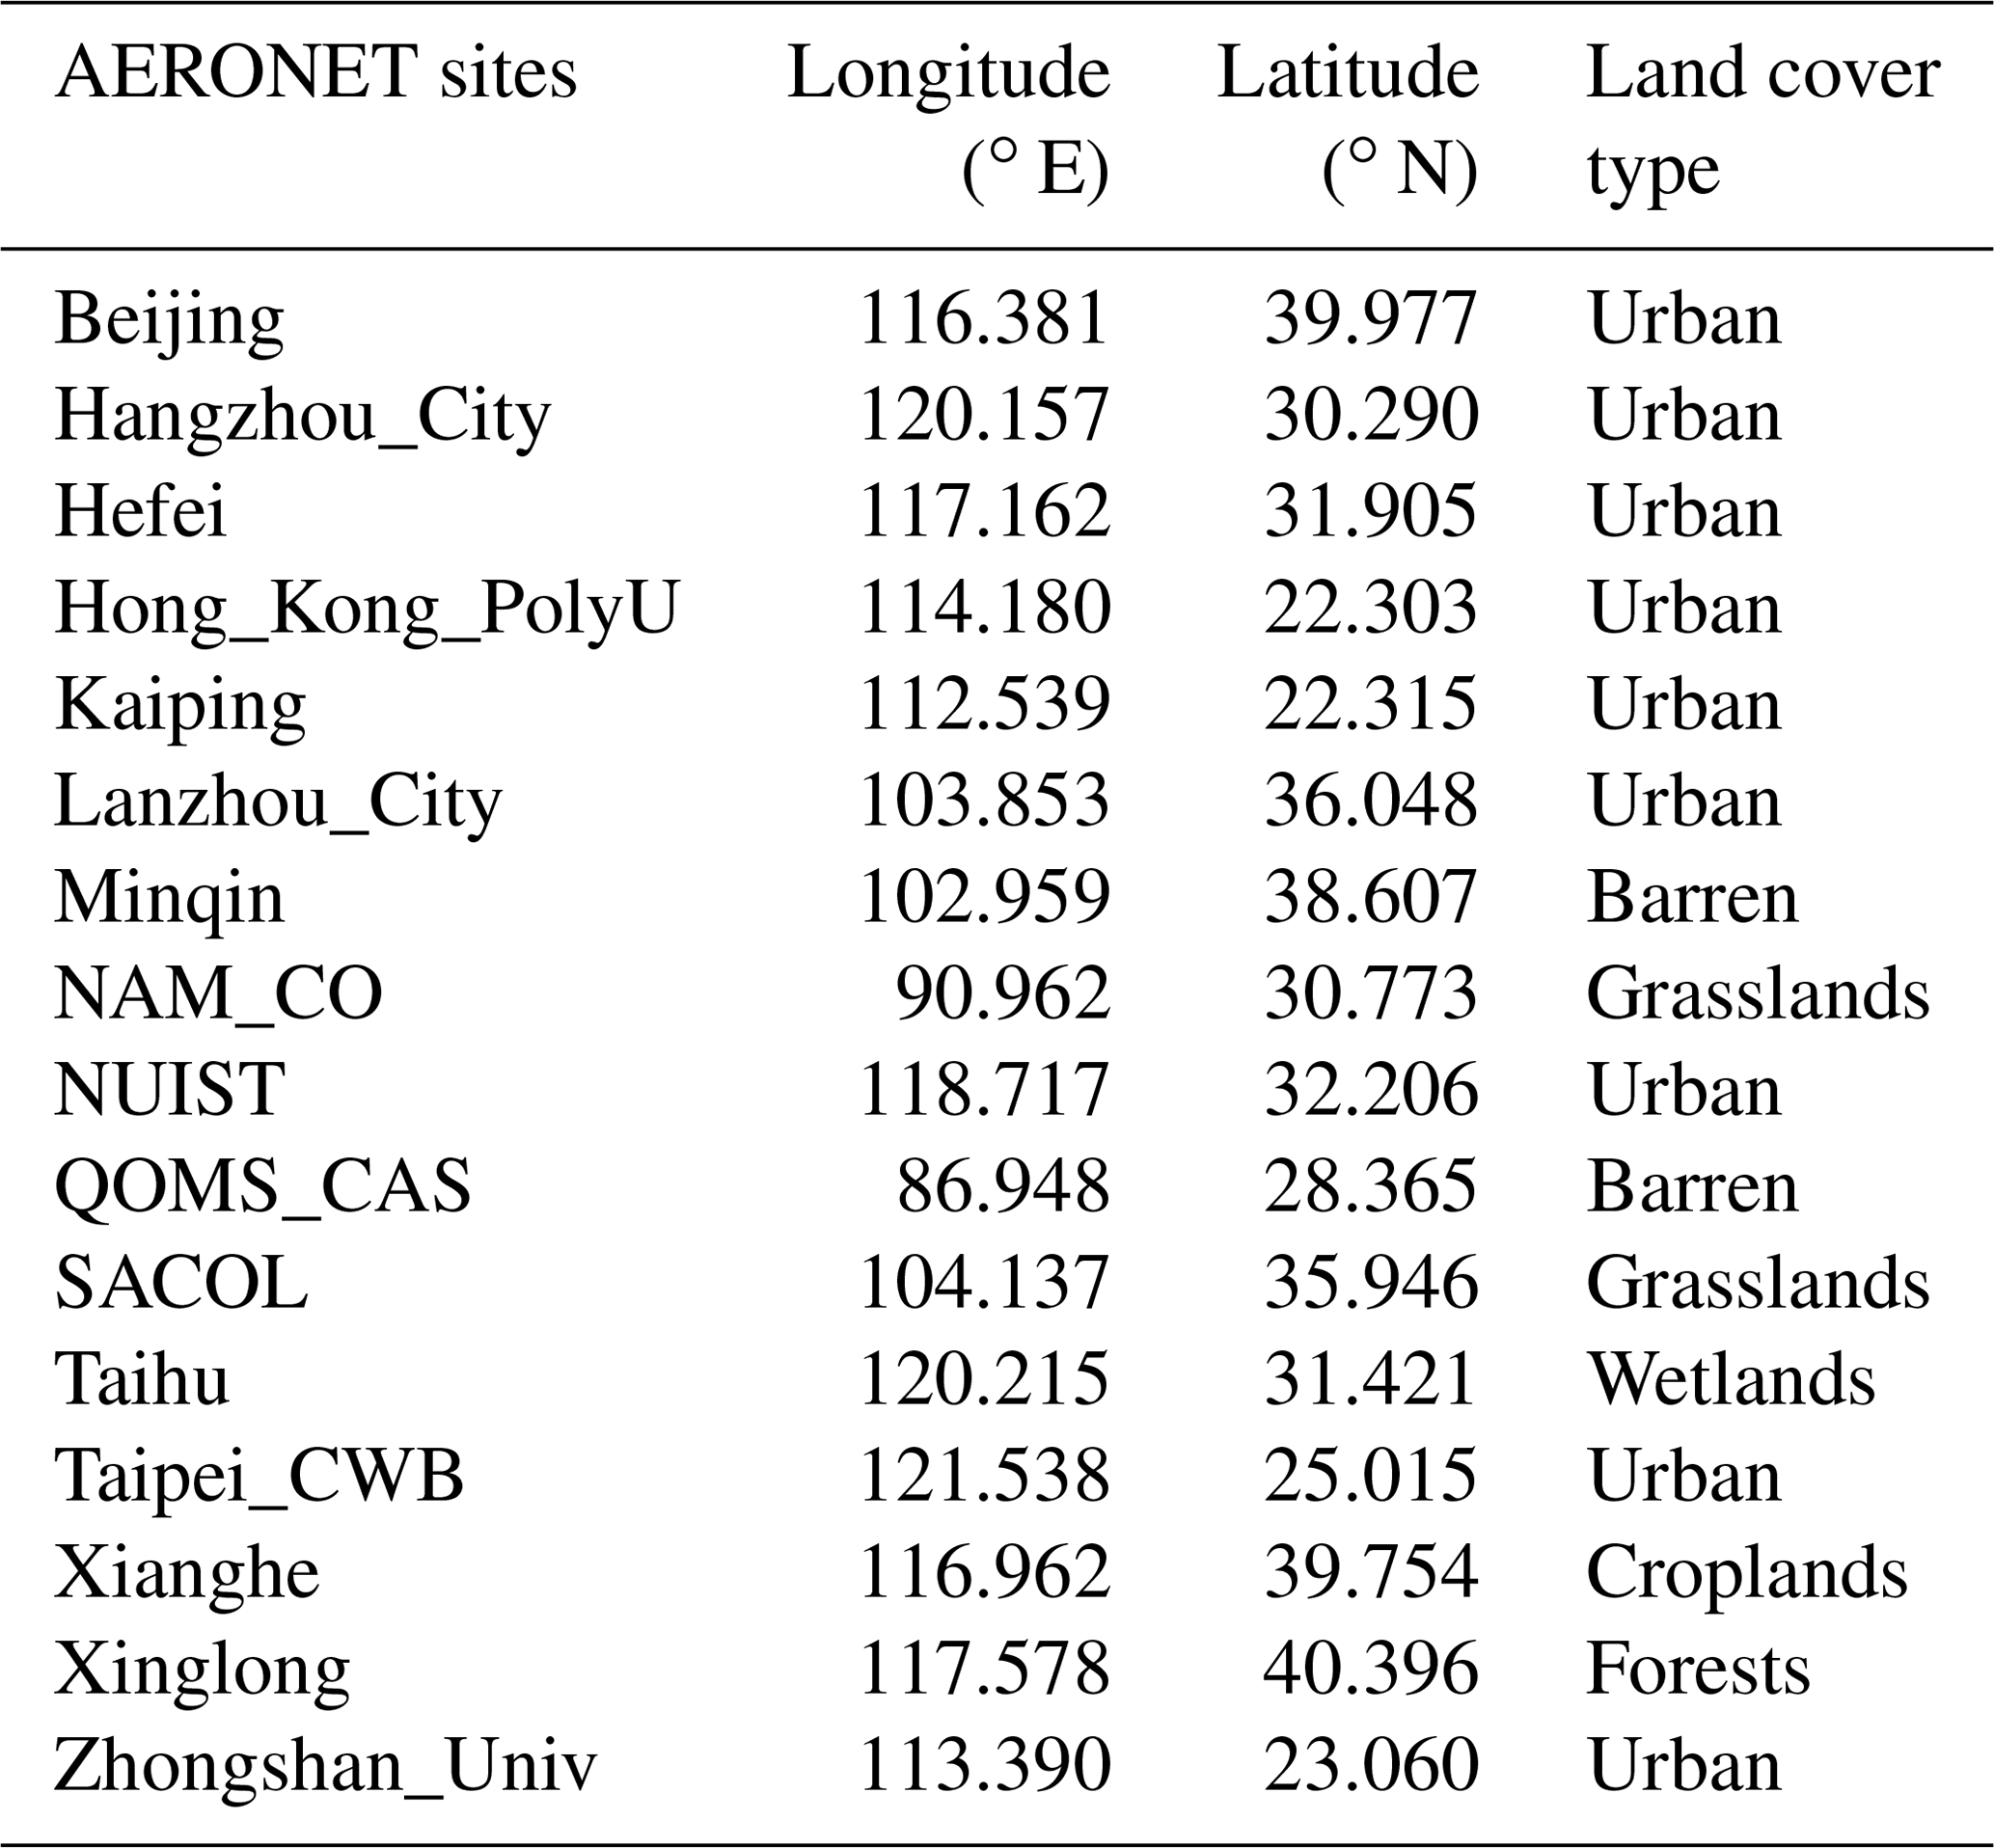
Table 1AERONET site information employed in this study. The land cover types are from the MODIS MCD12 land cover product.
The FMF retrieved in this study is the FMF at 550 nm. Neither the SDA product nor the SD product directly provides the FMF result at this wavelength. Therefore, the AERONET FMF needs to be wavelength converted. For SDA products, the products include AODt and AODf at 500 nm and the corresponding Ångström exponent (AE) so the FMF of SDA products can be converted to 550 nm by Eq. (1):
where FMF550,SDA is the FMF of the SDA product at 550 nm after conversion, is the AODf at 500 nm, is the AODt at 500 nm, αf is the fine-mode AE, and αt is the coarse and fine-mode AE.
The SD products provide AODt and AODf at 440 and 675 nm, respectively. Equations (2)–(4) can be used to obtain FMF results at 550 nm:
where FMF550,SD is the SD product FMF at 550 nm after conversion, is AODf at 675 nm, is AODt at 675 nm, is AODf at 675 nm, and is AODt at 675 nm.
2.3 Validation method
In this study, the average value of ground-based observation results within ±30 min of the satellite's transit was used for comparison with the satellite retrieval results. The satellite retrieval result used for comparison is the effective retrieval result centred on the location of the AERONET site within the closest distance in the 3 × 3 window (about 54 km). Note that when the retrieved AODf is greater than the retrieved AODt, we consider this situation as a failure of the FMF retrieval and the results of this part were not involved in the comparison. These results account for about 10 %.
The statistical indicators used in the validation include the correlation coefficient (r), mean absolute error (MAE), bias, RMSE, and expected error (EE). The specific statistical evaluation index definitions are shown in Eqs. (5)–(10):
where Cov represents the covariance, D represents the variance, FMFretrieval represents the FMF retrieval value, FMFAERONET represents the value of AERONET FMF, AODAERONET represents the value of AERONET AOD, i is the matched data points, and n is the number of validation points.
3.1 Validation against AERONET ground-based data
Figure 4 is a scatter plot of the comparison between the retrieved and AERONET ground-based FMFs. Figure 4a–n lists the verification results at the corresponding sites where the number of matching results is greater than 2. The figure shows that the FMF results obtained in this study have an overall high correlation with the AERONET ground-based observations. Among the 14 AERONET sites, r is between 0.508 (Taihu site) and 0.902 (Lanzhou City site). The ranges of MAE and RMSE are 0.096 (Hangzhou_City site) to 0.160 (QOMS_CAS site) and 0.095 (Hangzhou_City site) to 0.184 (QOMS_CAS site). Except for the QOMS_CAS site, the proportion of results that fell within the EE accounted for approximately 65 %. The statistical indicators of the QOMS_CAS site are all poor. The specific reason is that the site is located at the southern edge of the Qinghai–Tibet Plateau. It is a high-altitude site and has very little aerosol content. In the AERONET SDA products of 2009–2013, the 5-year average values of AODt and AODf (500 nm) are only 0.052 and 0.038, respectively. Under the combined influence of the aerosol model and the surface reflectance estimation error in the retrieval process, it is difficult to accurately retrieve a low AOD value for satellite observations, resulting in a large deviation of the FMF at this site.
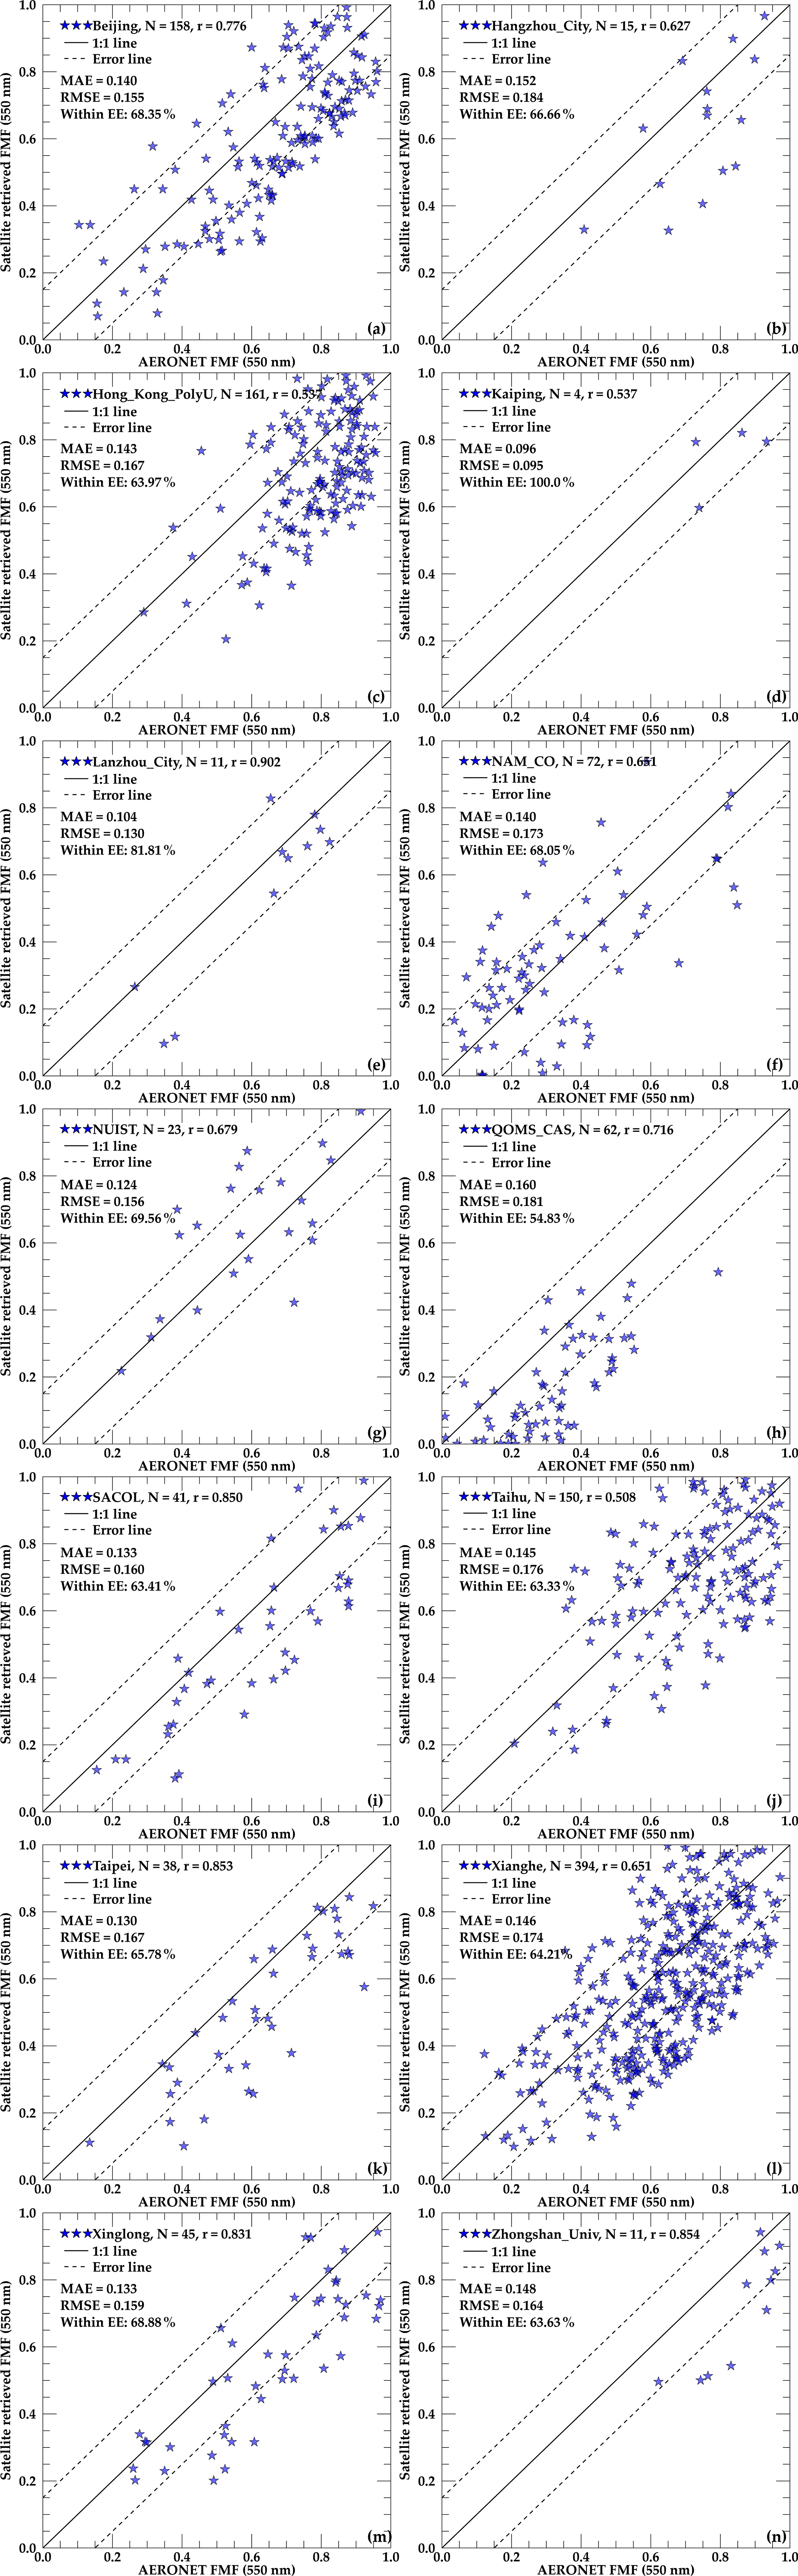
Figure 4FMF results comparison at 14 AERONET sites. Panels (a)–(n) are the validation results for the Beijing, Hangzhou_city, Hongkong_PolyU, Kaiping, Lanzhou_city, NAM_CO, NUIST, QOMS_CAS, SACOL, Taihu, Taipei, Xianghe, Xinglong, Zhongshan_Univ sites, respectively.
We have counted the FMF validation results for different surface types and the specific information is shown in Table 2. The r, MAE, and RMSE at all sites in this study are 0.770, 0.143, and 0.170, respectively; Within EE is 65.01 %, again indicating that the FMF satellite retrieval results of this study are comparable with the ground-based observation results. All the validation results of this study cover six surface types: urban, barren, grasslands, wetlands, croplands, and forests. Overall, since the validation data for the barren type mainly come from the QOMS_CAS site, the validation results for this surface type are poor. Although the r for the other five surface types has a certain change, 0.508 (barren) and 0.831 (forests), in terms of the three indicators of MAE, RMSE, and Within EE, the differences in the five surface types are relatively small, especially Within EE, which is concentrated at approximately 65 % and similar to the site-by-site results. The uncertainty of the FMF retrieval results in this study are relatively stable for these five surface types.
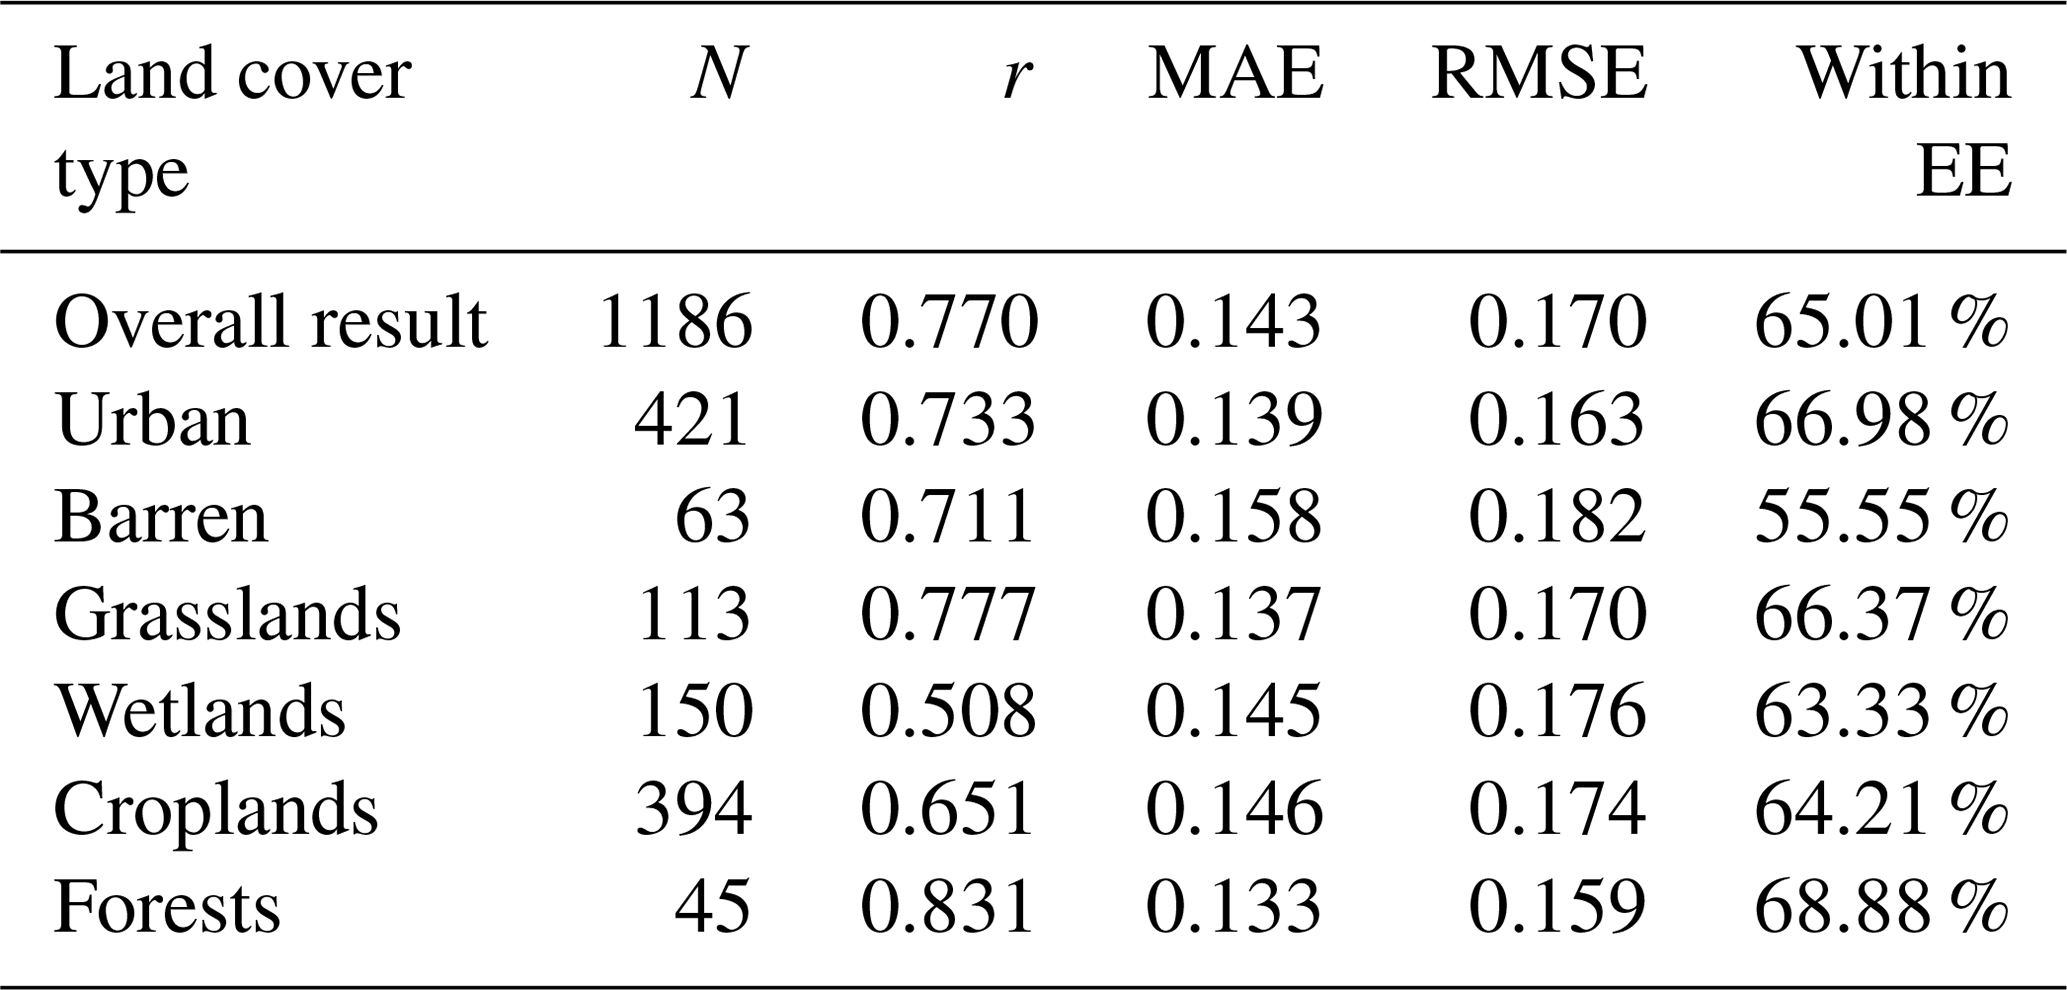
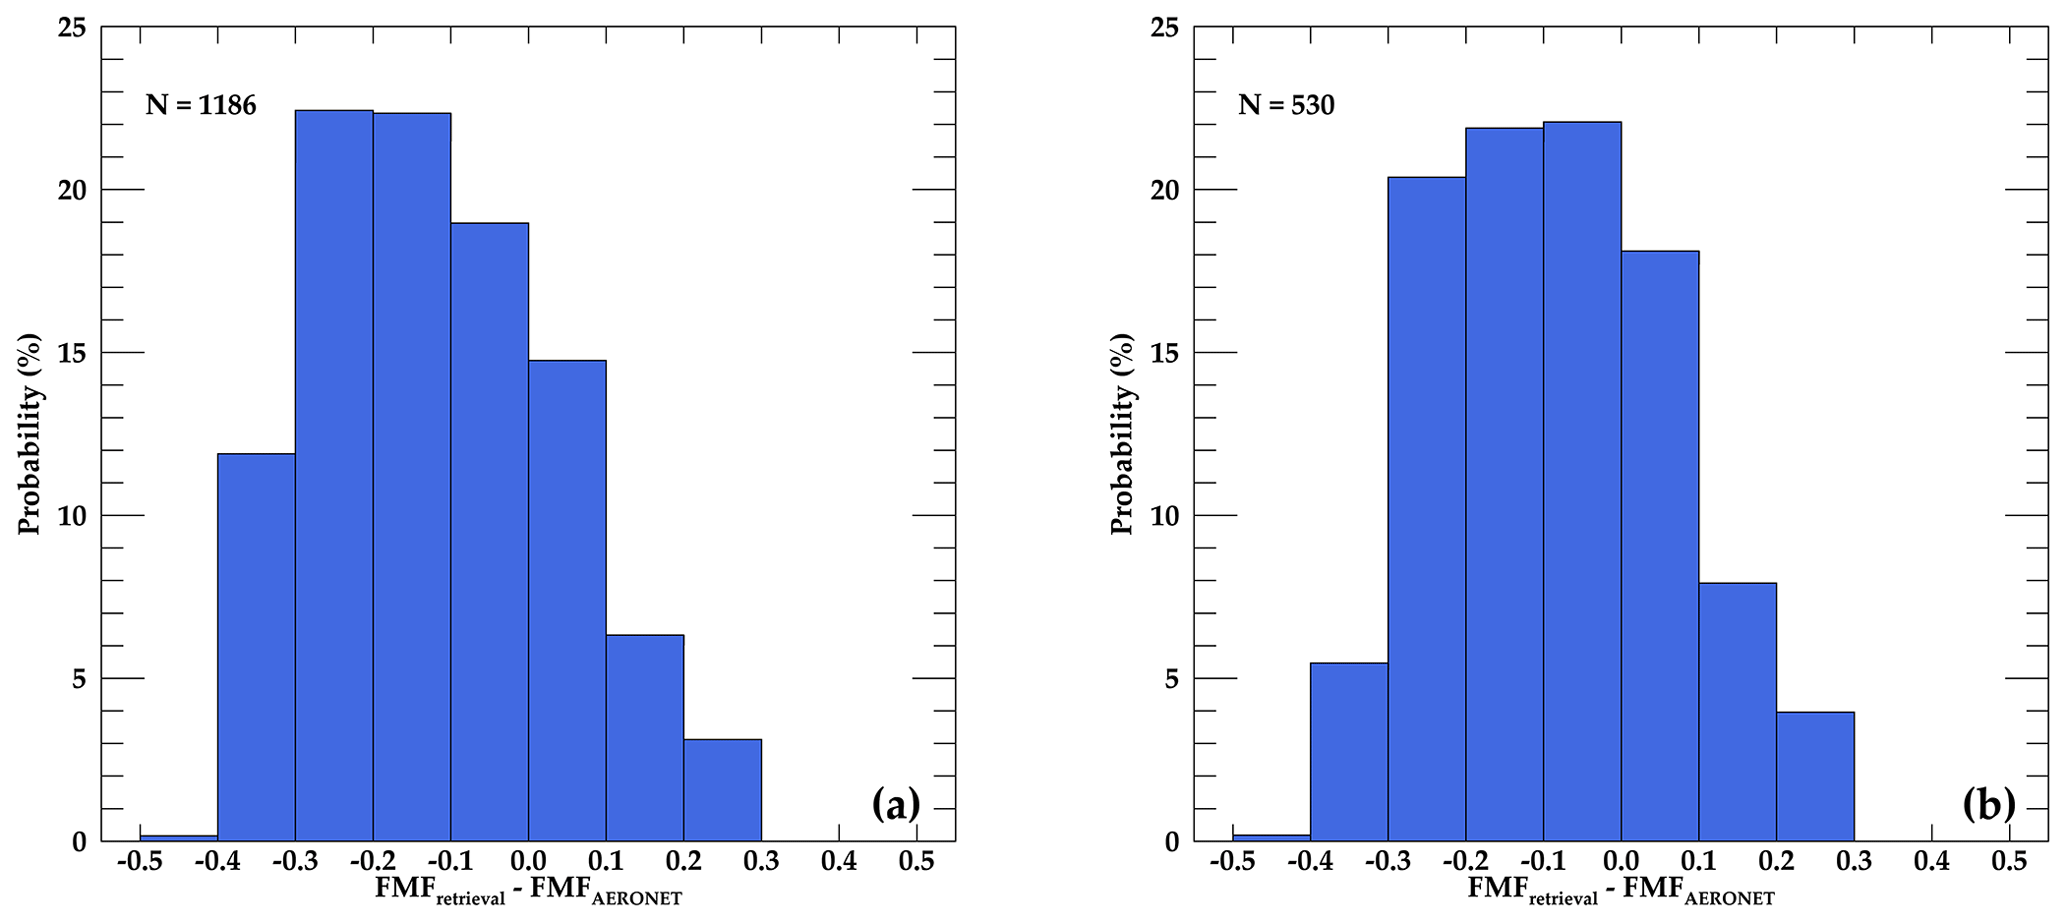
Figure 5FMF retrieval error distribution results. Panel (a) is for all results and panel (b) is for the results with AODf greater than 0.2.
We further counted the error distribution of the FMF retrieval results, and the statistical results are shown in Fig. 5a. The figure shows that the FMF error of this research is mainly distributed between −0.3 and 0.3. This part of the data accounts for approximately 86 %, but the part less than the AERONET ground-based FMF observation value accounts for approximately 75 %, indicating that the retrieval result of this study is lower than that of the ground-based observations. We further screened out the points with AODf greater than 0.2, and the corresponding FMF error distribution results are shown in Fig. 5b. Comparing the two figures, it can be found that after screening the proportion of FMF error ranging from −0.4 to −0.3 decreased by approximately 7 % and the proportion of FMF error ranging from −0.1 to 0.1 increased by approximately 6 %, which shows that when the AOD is higher, our FMF retrieval method is more sensitive.
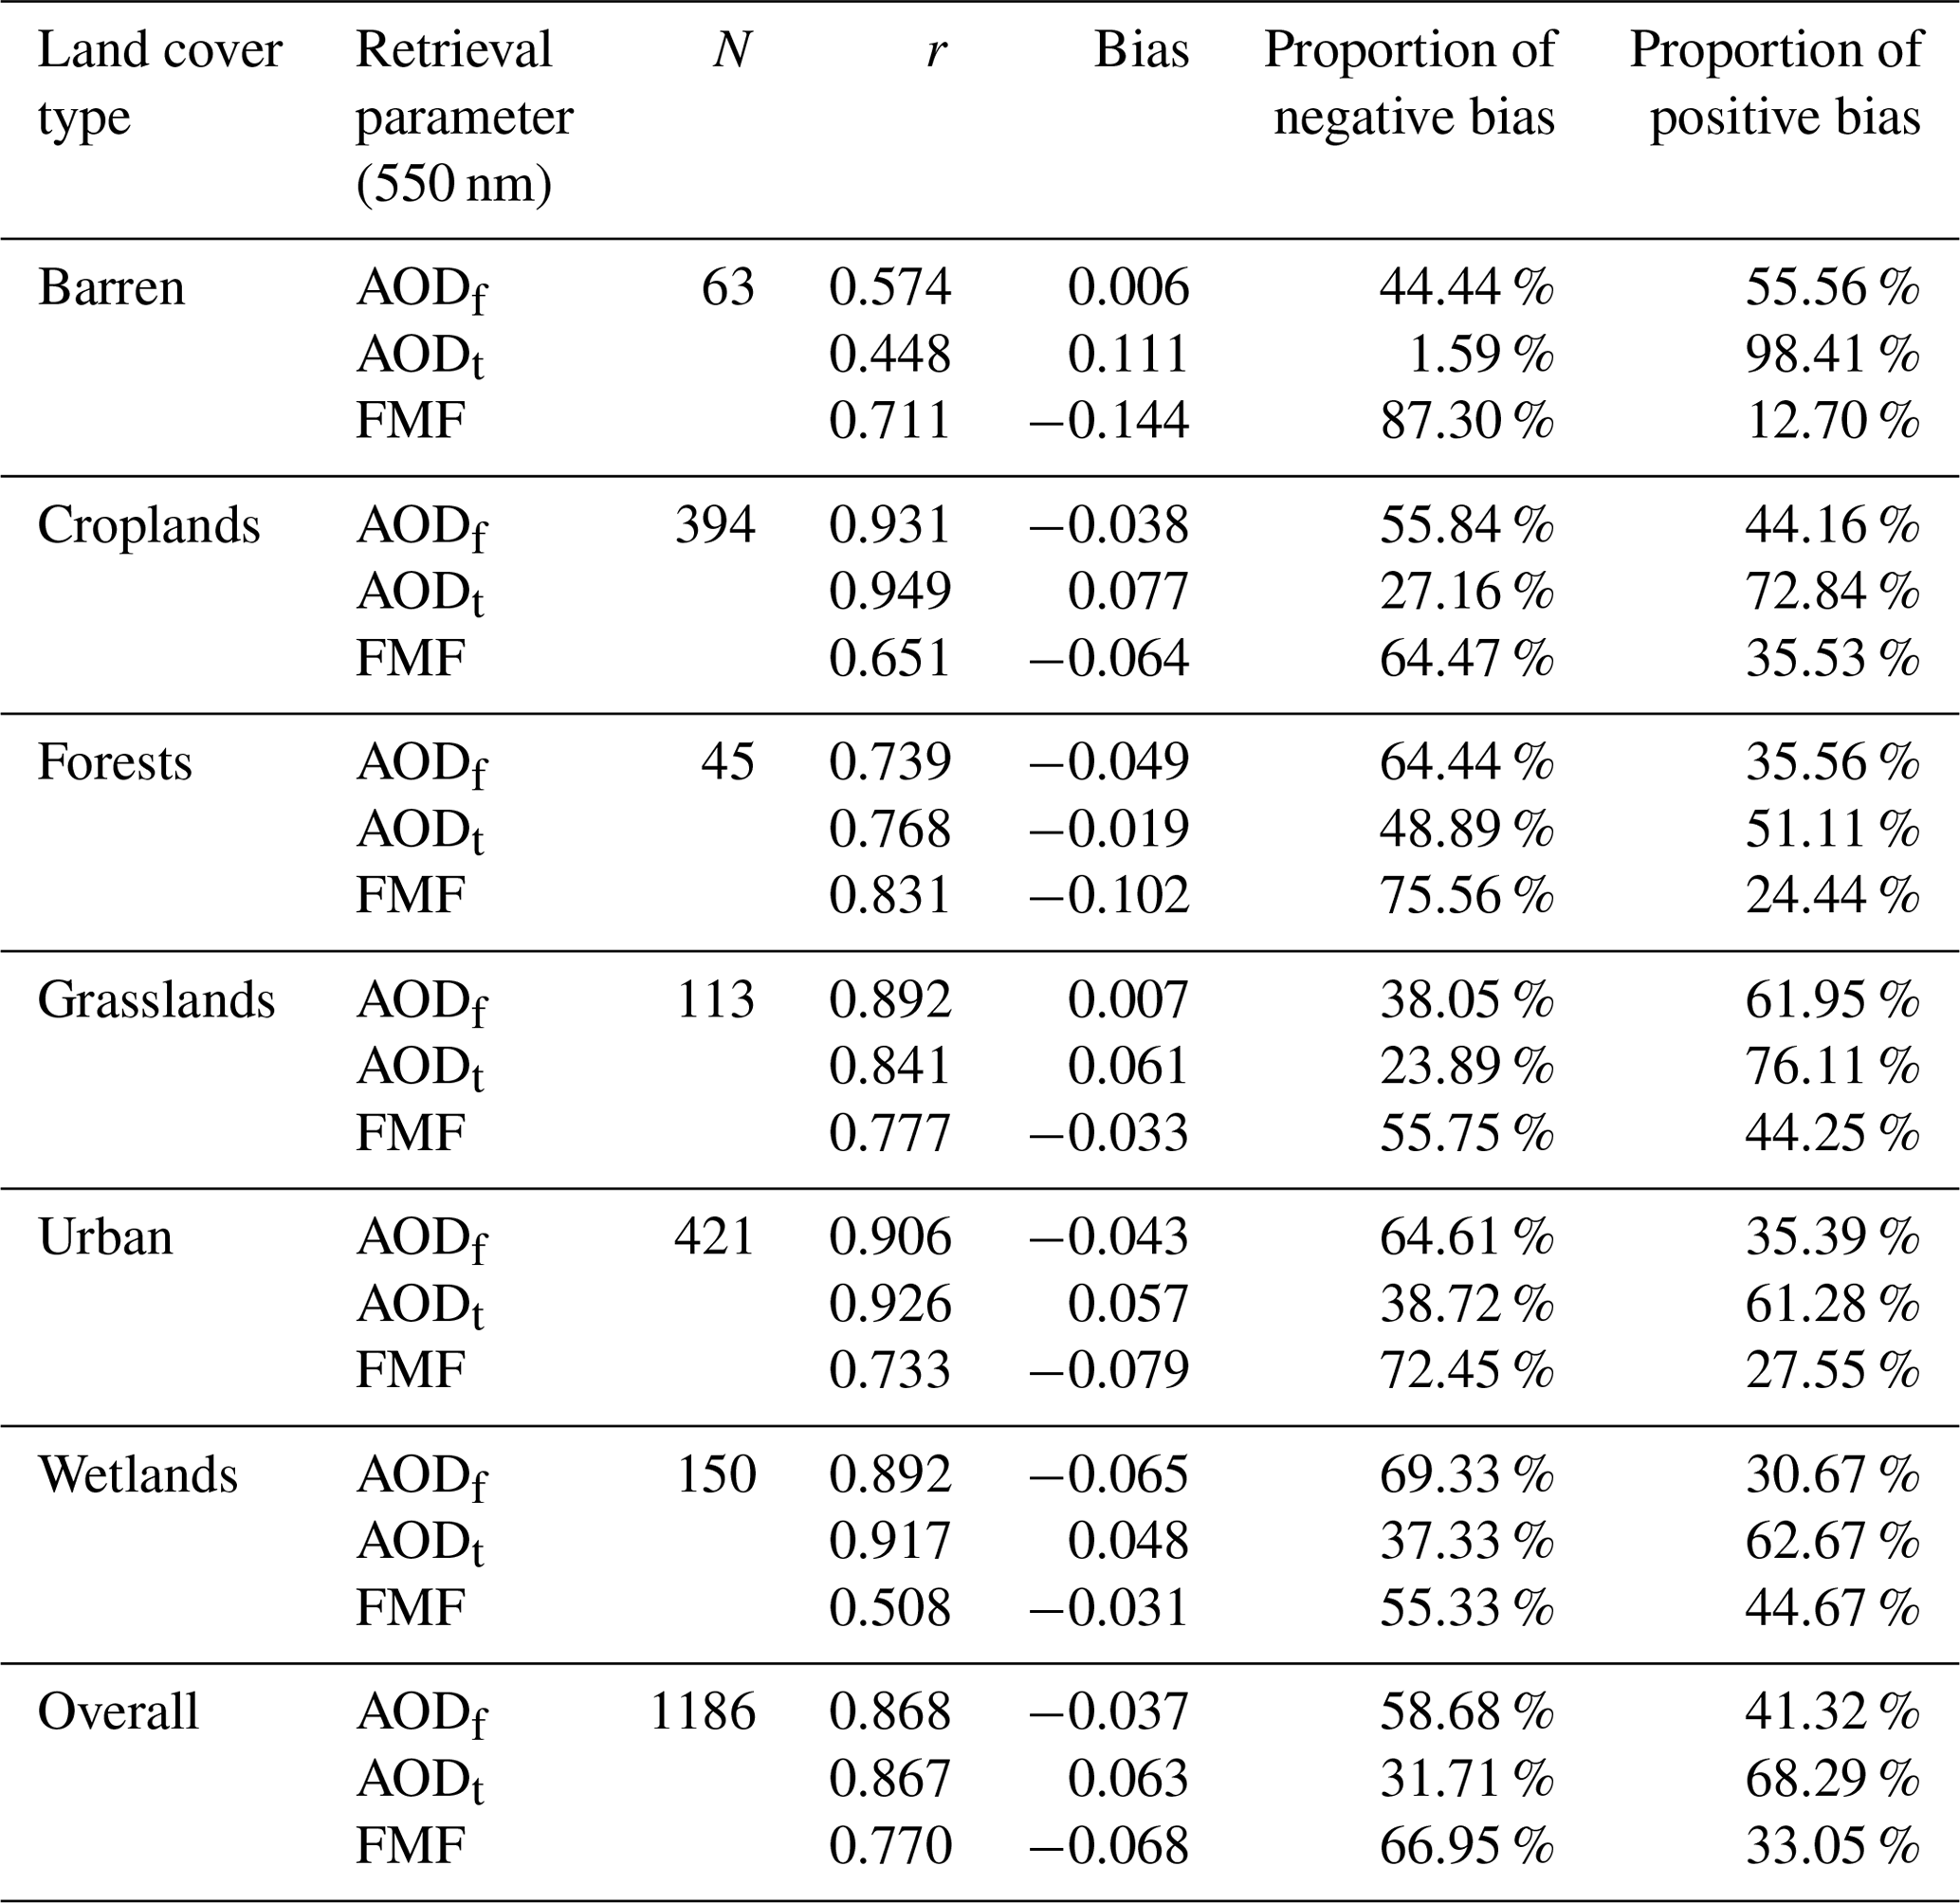
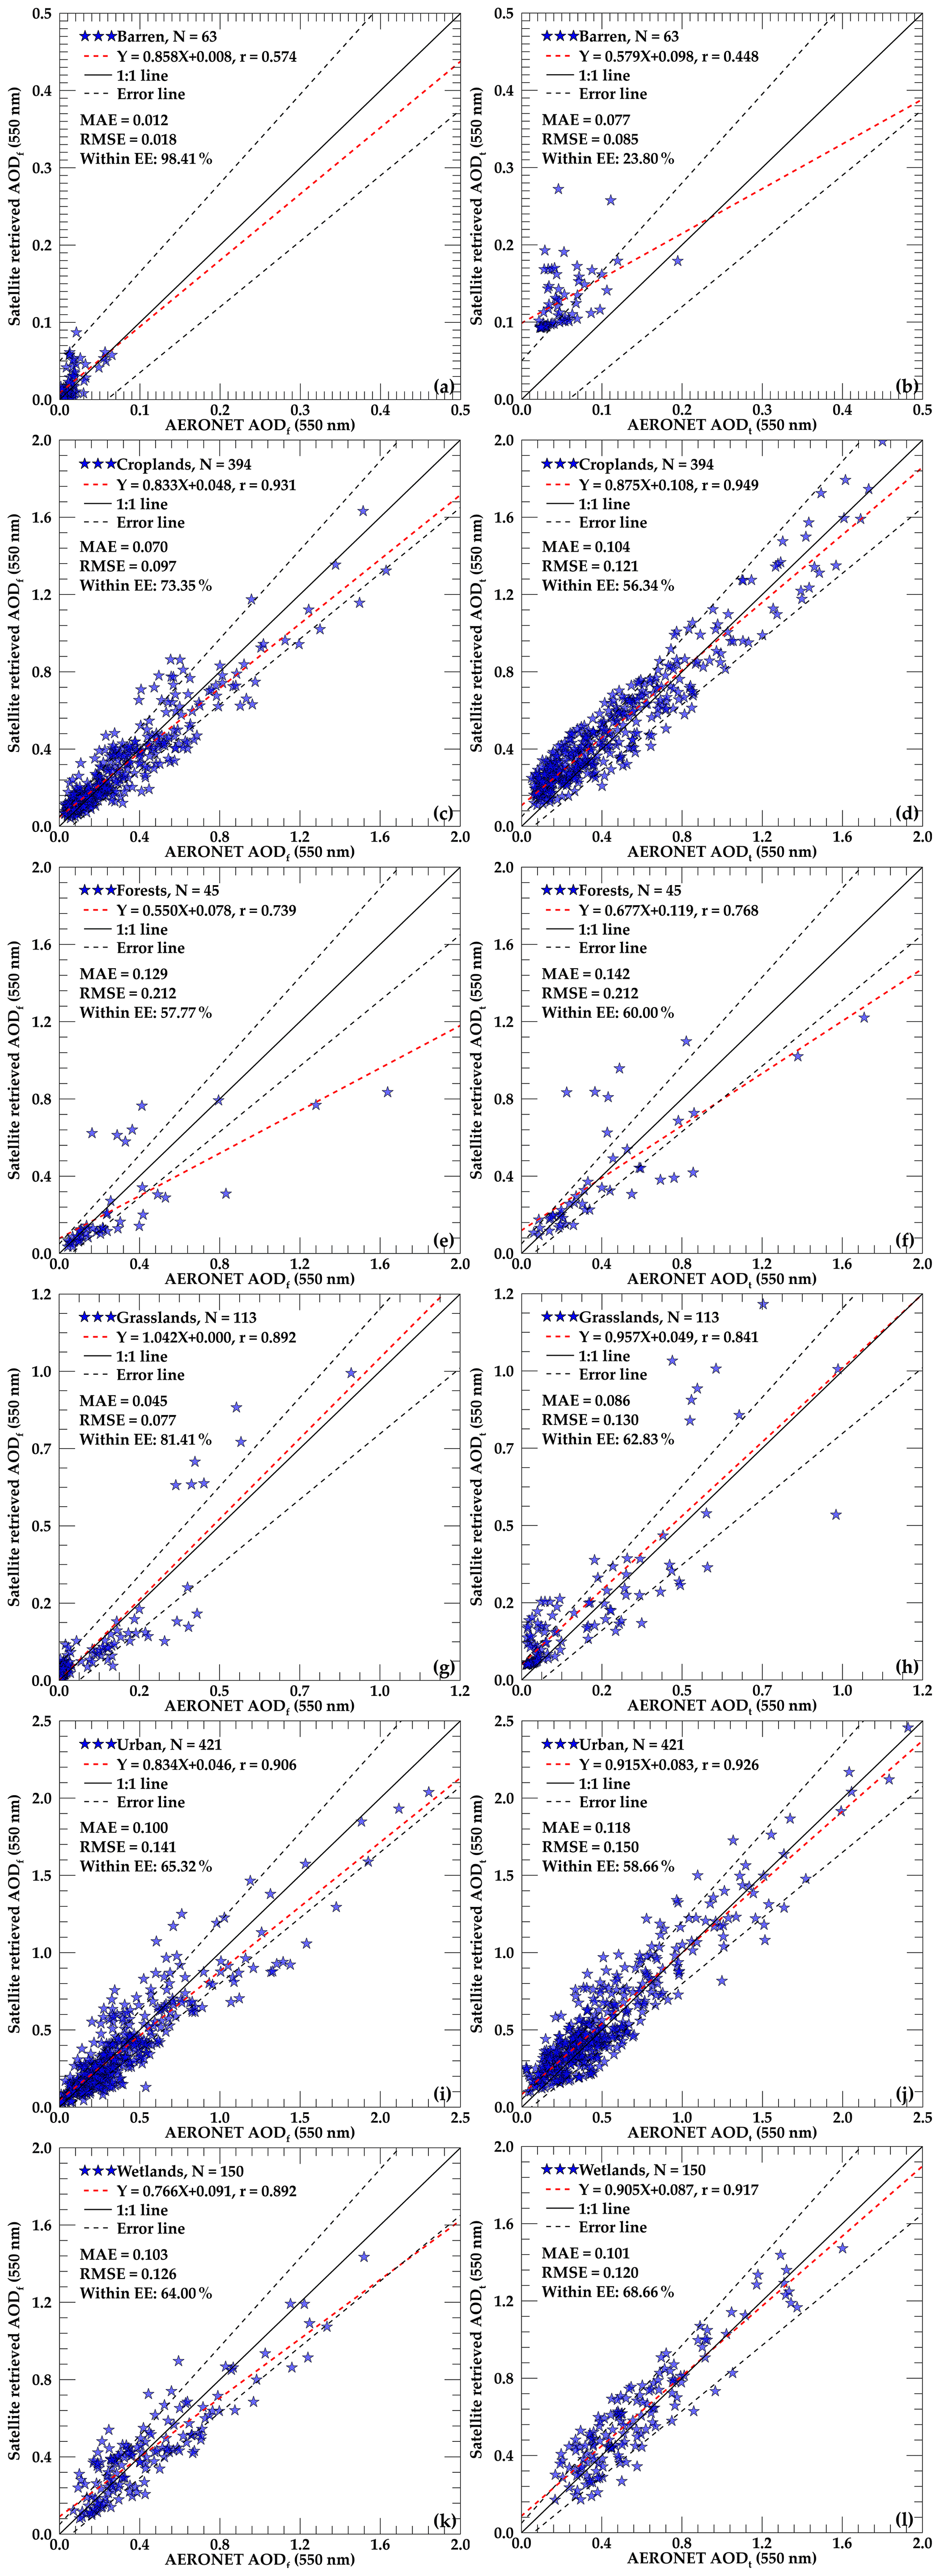
Figure 6AOD results comparison for six surface types. Panels (a), (c), (e), (g), (i), and (k) are the AODt validation results for the barren, croplands, forests, grasslands, urban, and wetlands types, respectively. Panels (b), (d), (f), (h), (j), and (l) are the AODf validation results for the barren, croplands, forests, grasslands, urban, and wetlands types, respectively.
Since our FMF is obtained from the ratio of AODf and AODt retrieval results, and the retrieval accuracy of the two parameters directly determines the retrieval accuracy of the FMF, we further compared the retrieved AODs for the six different surface types with those of the ground-based data from 2006 to 2013, and the statistical results are shown in Fig. 6 and Table 3. It can be seen from Fig. 6 that for the comparison results of AODf, except for the barren type, the AODf for all surface types are in good agreement with the ground-based observation results and the r is greater than 0.7. Because the data for the barren type mainly come from the QOMS_CAS site, the AODf value at this site is low and the r is not suitable for evaluating the retrieval performance. Most of the retrieval results for the barren type fall within the EE, which can indicate that the retrieval results for this type have a good accuracy. For the comparison results of AODt, the retrieval results for the barren type are obviously positively shifted. This is due to the low aerosol loading at the QOMS_CAS site; the inaccurate estimation of the surface reflectance can easily magnify the errors in the retrieval results. It indicates that the EOF method used to retrieve AODt in this study still needs further improvement. However, it is difficult to analyse the reasons for the negative bias of most FMF retrieval results from the scatter plot, so we further counted the biases of AODt and AODf. Table 3 shows that the bias of the retrieved AODf and AODt for the six different surface types. It can be seen from Table 3 that the proportion of positive bias is greater than the proportion of negative offset for most AODt retrieval results, while AODf is the opposite. For the overall result, the bias of AODf is −0.037, where the proportion of negative bias is 58.68 % and the bias of AODt is 0.063, where the proportion of positive bias is 68.29 %, indicating that the AODf retrieval result has a negative bias and the AODt retrieval result has a positive bias; that is, the numerator is small and the denominator is large, eventually leading to a negative bias of the FMF.
3.2 Comparison with MODIS products
MODIS aerosol products also include FMF datasets, but this FMF has a different definition. In fact, the FMF of MODIS refers to the “fine-model fraction”, which is the proportion of the bimodal fine-dominated aerosol model, but not the pure fine mode (Levy et al., 2007). Because the FMF results obtained by MODIS are different in definition from the ground-based results (Levy et al., 2009), the retrieval results are quite different from the ground-based observation results, which limits the research that depends on the FMF parameter. We compared the retrieved and MODIS FMF with the AERONET ground-based observations to further evaluate the significance of our results. The MODIS FMF results were derived from the MYD04 product of collection 6.1. Figure 7 shows the comparison between the two results and the AERONET ground-based observation results from 2011 to 2013, which are the results where both MODIS and POLDER match the ground-based observations. As seen from the figure, compared with ground-based observations, the r of the FMF obtained in this study is 0.812, while that of MODIS is 0.302. The correlation coefficient of the results obtained in this study is much higher than that of MODIS. At the same time, notice that there are many 0 values in the MODIS results. These 0 values are not meaningless but correspond to the situation where there is no fine-dominated aerosol model.
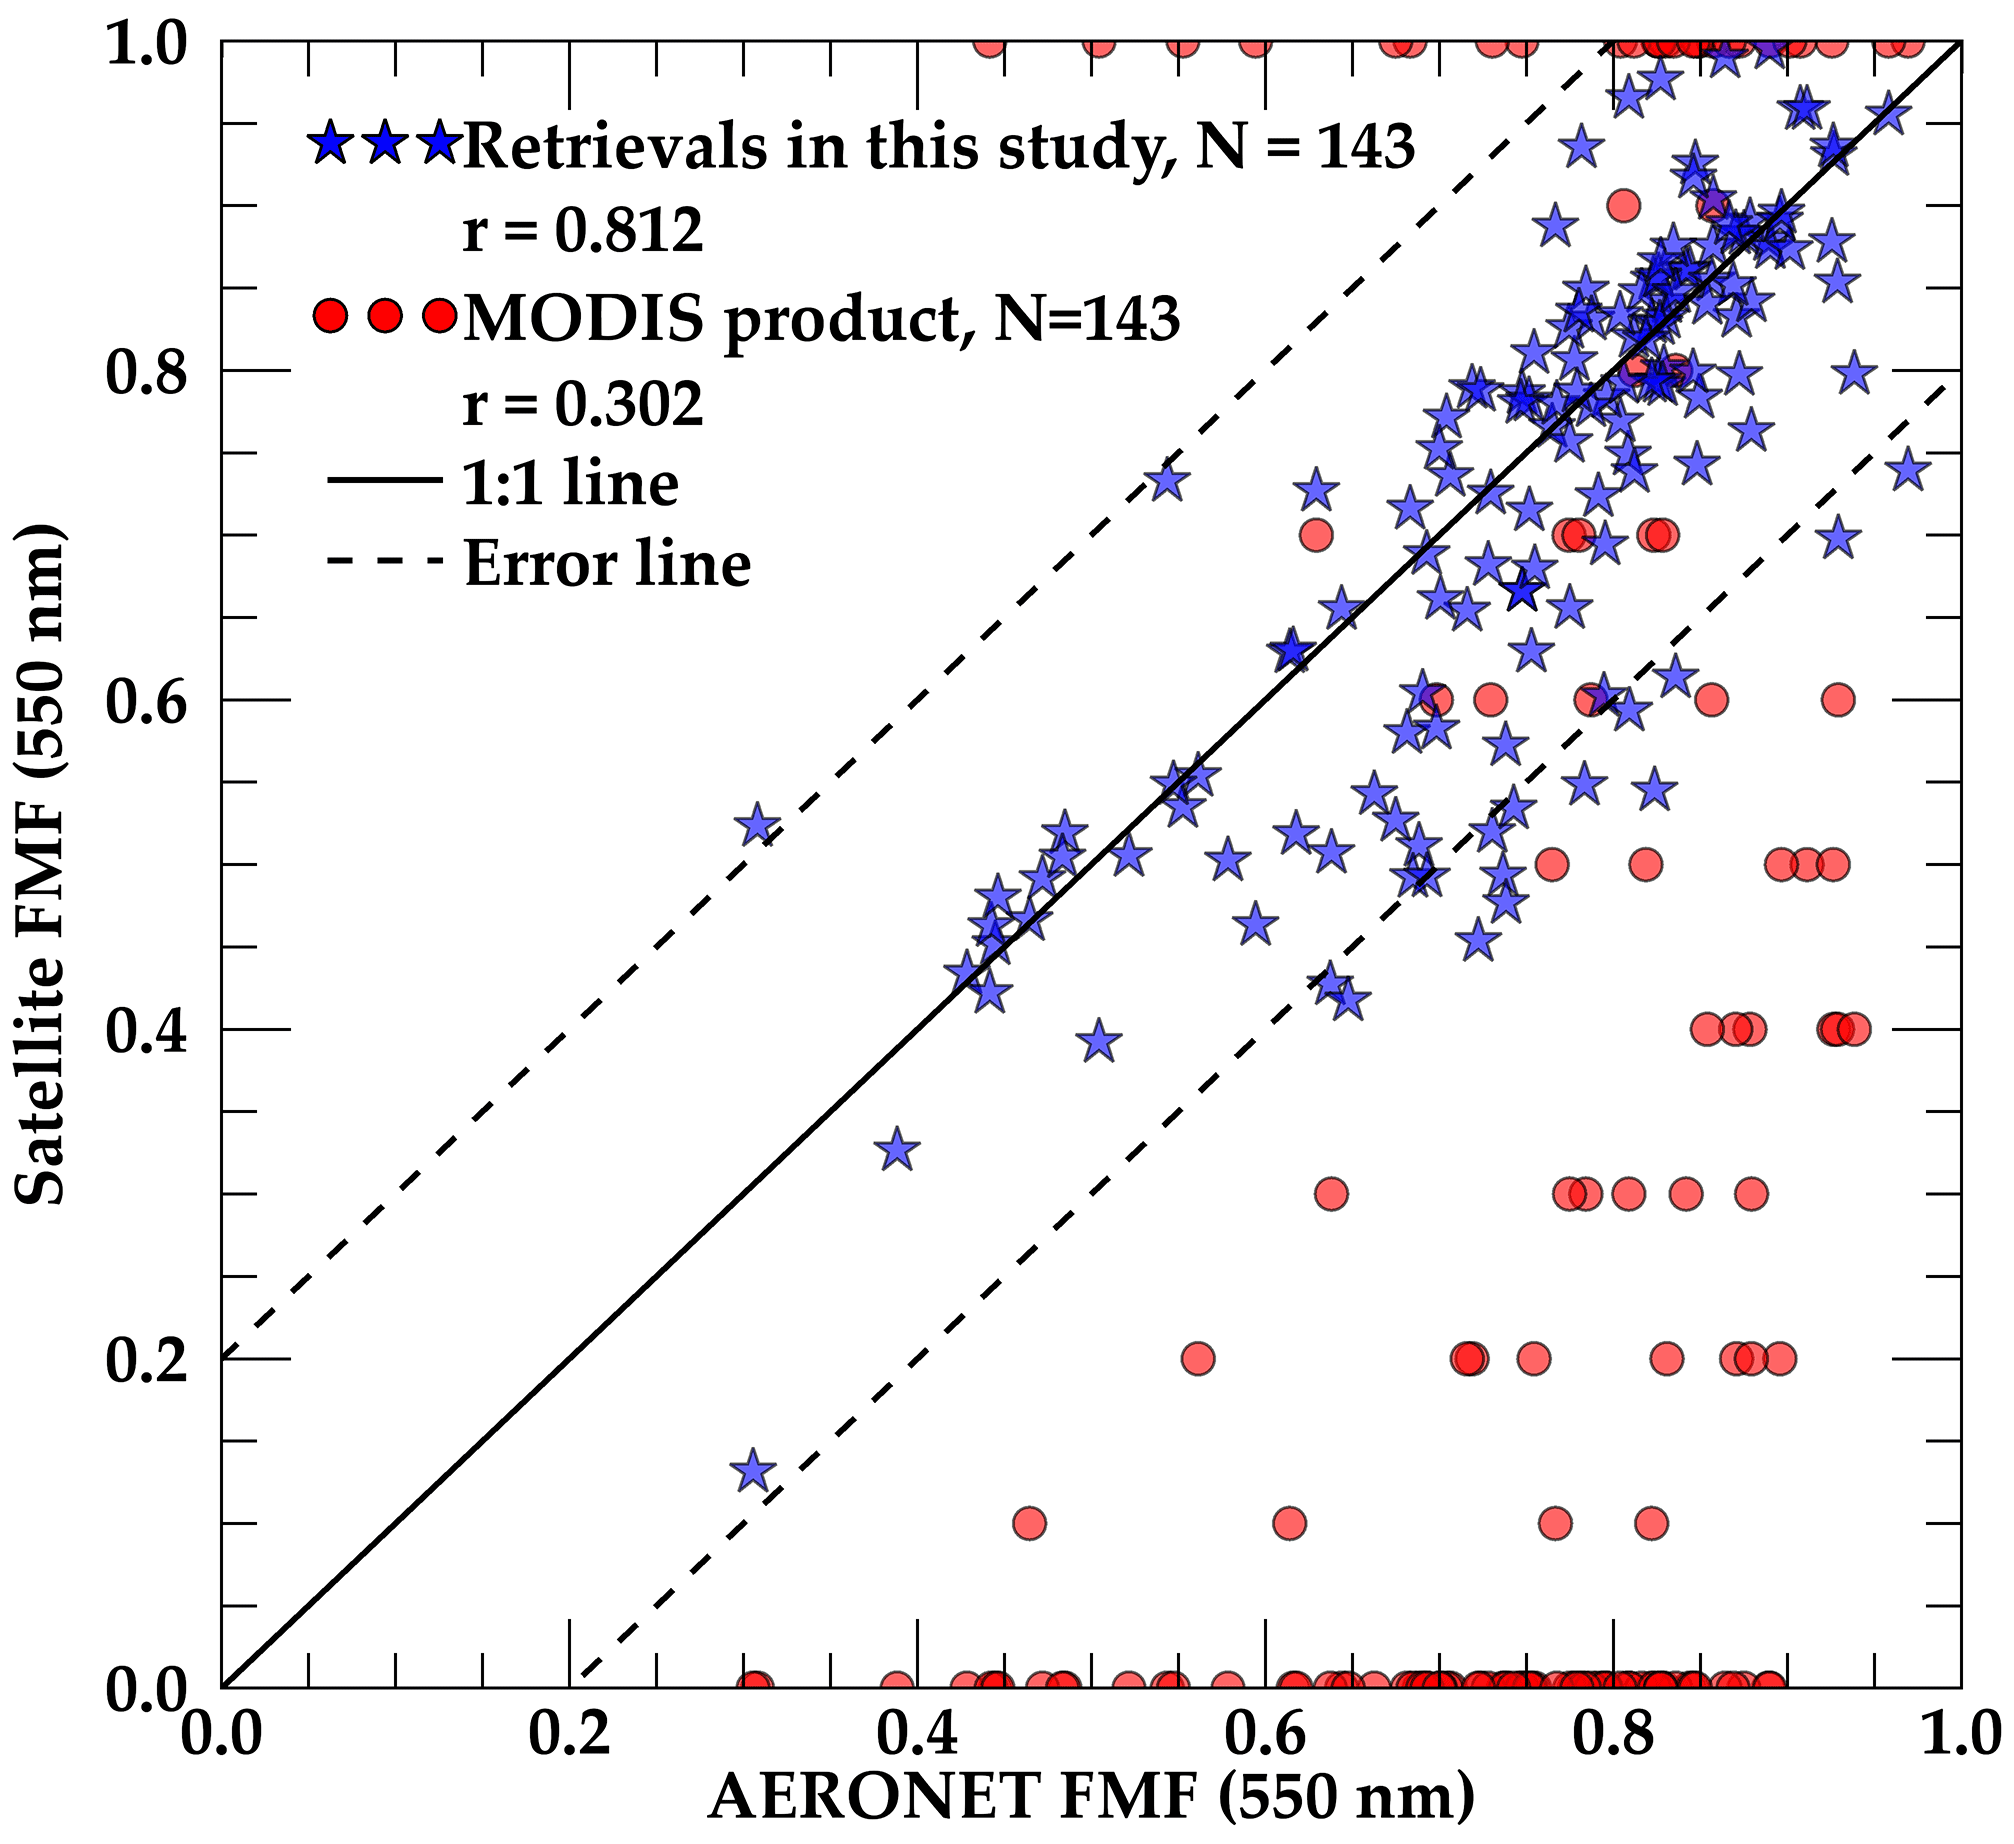
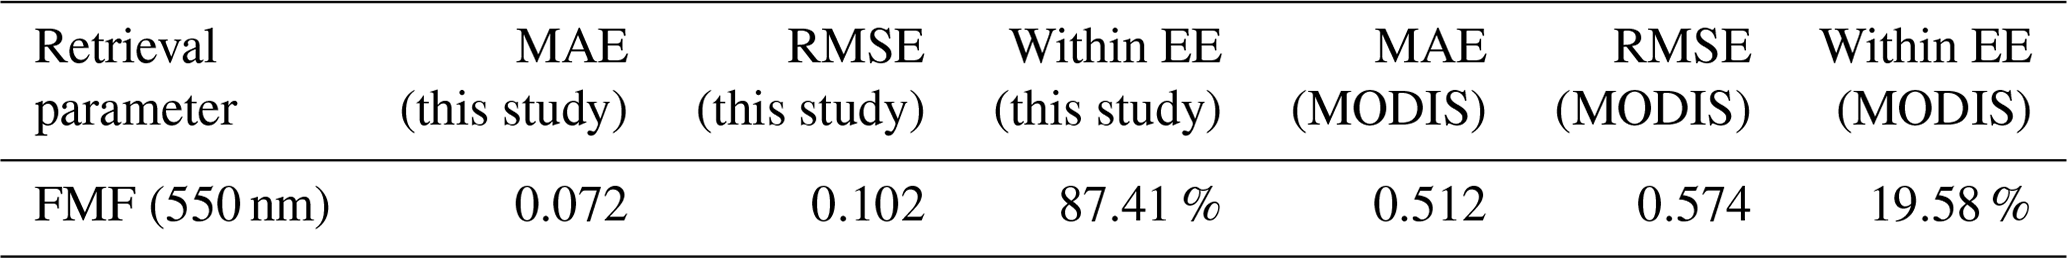
More statistical results of the two are shown in Table 4. The table shows that the FMF results obtained in this study have an MAE of 0.072, an RMSE of 0.102, and a Within EE of 87.41 %, whereas results of MODIS have an MAE of 0.512, RMSE of 0.574, and Within EE of 19.58 %. The statistical indicators of the FMF results obtained by our study are closer to the ground-based observations than the MODIS results. Nevertheless, note that this does not mean that the FMF of MODIS has a large deviation. As mentioned above, there is a difference in definition between the FMF of MODIS and the ground-based observations; consequently, it is difficult to obtain the true deviation of MODIS FMF based on ground-based observations.
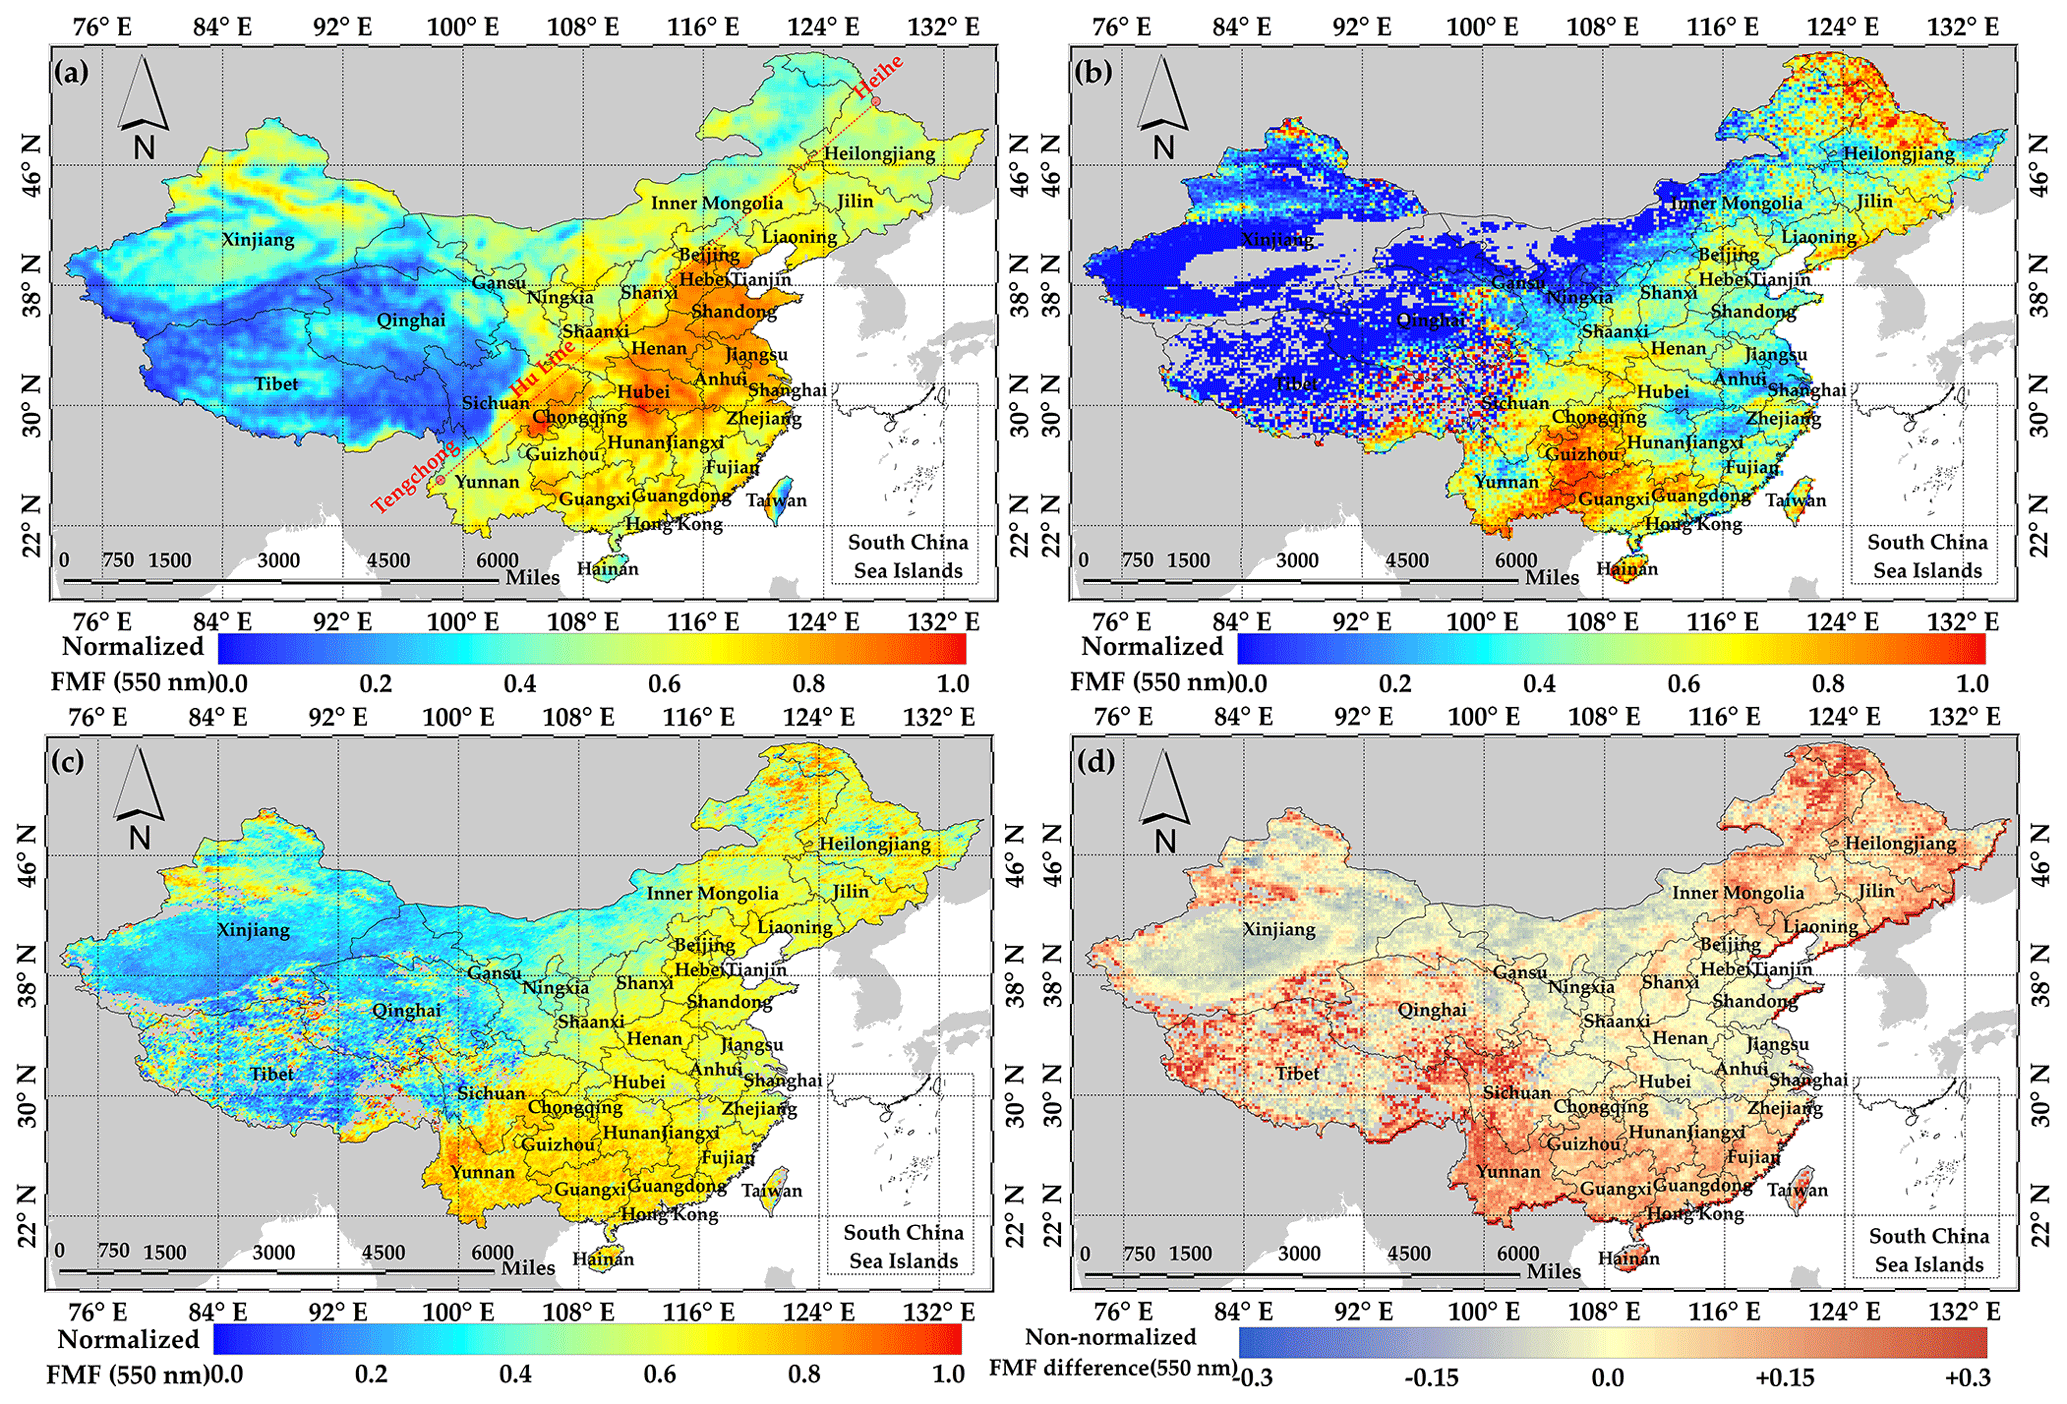
Figure 8Distribution of FMF for China in 2013 from different sources. Panel (a) is the normalized results of this study (18 km resolution), panel (b) is the normalized results of MODIS (10 km resolution), panel (c) is the normalized results of GRASP (6 km resolution), and panel (d) is the GRASP results minus the retrieved results (non-normalized, 18 km resolution).
Figure 8a and b shows the spatial distribution map of the average annual FMF (550 nm) of China in 2013 obtained by this study and the MODIS product. To facilitate the comparison of the differences in the spatial distribution trends of the two, the results are normalized, meaning that they are divided by the maximum value in the respective FMF image. The figures show that the results obtained in this study can better reflect the differences in the level of urbanization in China and are more in line with the “Hu Line”, reflecting China's population density. That is, in the area to the east of the “Hu Line” the value of the FMF is higher; the North China Plain, Sichuan–Chongqing Economic Zone, Pearl River Delta, and Yangtze River Delta are extremely high value areas. In the area to the west of the “Hu Line”, the FMF value is small; the high-value area is mainly in the northern Xinjiang region, while the value in the Qinghai–Tibet Plateau is generally low. The results of MODIS are quite different from the results of this study. The MODIS results show that the regions with the highest FMF are Guizhou, Guangxi, Yunnan, and Hainan. The Three Northeast Provinces and the central mountainous areas of Taiwan also have high values. For the North China Plain, Sichuan–Chongqing Economic Zone, and Pearl River Delta, the results are somewhat similar to this study, while the Yangtze River Delta is a low-value area.
3.3 Comparison with GRASP products
In our previous research, the accuracy of FMFs calculated from the GRASP “high-precision” product was validated (Wei et al., 2020). The results of the comparison with eight SONET (Sun-sky radiometer Observation NETwork) sites show that the r between GRASP FMFs and ground-based observations is 0.77 and Within EE is 62.35 %, which is similar to the results of this study discussed in Sect. 3.1. However, by comparing the spatial distribution results of the two, we found some differences. The GRASP product version we processed is V2.06, which is the latest version that can be obtained from AERIS/ICARE Data and Services Center (http://www.icare.univ-lille.fr, last access: 27 December 2020). Figure 8c shows the annual averaged FMF spatial distribution of GRASP in 2013 (also normalized). Compared with Fig. 8a, we can see certain differences. The relatively high-value area of GRASP results is mainly in southern China. We subtracted the results of this study from the average GRASP FMF results and obtained the non-normalized numerical difference between the two, as shown in Fig. 8d. The figure shows that the difference between the two in the North China Plain and the southern Xinjiang region is relatively small. The largest differences are mainly concentrated in southern and northeastern China and the Qinghai–Tibet Plateau regions. The GRASP results in these areas are greater than our results and a small number of pixels can be larger than 0.3. However, these areas lacked publicly available sunphotometer observations for 2013 or earlier. The PARASOL ended its exploration mission in October 2013 and it is impossible to compare the subsequent time periods, so it is difficult to directly compare with ground-based observations to illustrate the correctness of the spatial distribution of the two.
GRASP products provide AODf and AODt datasets, but do not directly provide FMF datasets. In this study, the ratio of the two was used to obtain the GRASP FMF. However, it should be noted that the definition of GRASP AODf is somewhat different from the AODf in our research, which may eventually lead to a difference in the definition of FMF. The AODf in our study is similar to the definition in the ground-based SDA algorithm; there is no clear cut-off particle size, that is, its definition is indefinite. This is different from the AODf obtained by calculating and integrating the size distribution in GRASP. So, the difference in the spatial distribution results of the two may be caused by the definition rather than a problem in the retrieval algorithm. In the comparison with AERONET observations by Chen et al. (2020), the r of AODf is between 0.868 (models approach) and 0.924 (high-precision approach), which is similar to the r (0.868) of AODf in this study, but their bias is only −0.02 (models approach) and 0.01 (high-precision approach), which is different from the bias (−0.037) of AODf in this study. This indicates that the definition of AODf in GRASP and our study may be different.
To show that the spatial distribution of the FMF in this study is reasonable, the ground PM2.5 and PM10 in situ results were compared with the ground-based FMF results. It is expected that the ratio of PM2.5 to PM10 can be used to analyse the correctness of this study as well as the GRASP FMF results in the spatial distribution trend. We selected the 2015 Beijing Olympic Sports Center monitoring site (116.407∘ E, 40.003∘ N, straight-line distance of less than 4 km), which was the closest to the AERONET Beijing site, and compared the hourly averaged results of the ratio of PM2.5 to PM10 with the FMF results. Although the definitions of the two are quite different, the ratio of PM2.5 to PM10 is actually a parameter of particulate matter near the ground, while the FMF is actually a parameter of the atmospheric column of aerosols, but the comparison results of the two (Fig. 9) show that there is a correlation between the ratio of PM2.5 to PM10 and FMF and the r is 0.709. This result may be because aerosols are mainly distributed near the ground and PM2.5 and PM10 can represent different particle modes. Ultimately, the actual difference between the two parameters is smaller. Since the ratio of PM2.5 to PM10 is comparable to the ground-based FMF results, if there were more in situ data it could indirectly verify the spatial distribution trend of this study and the GRASP results.
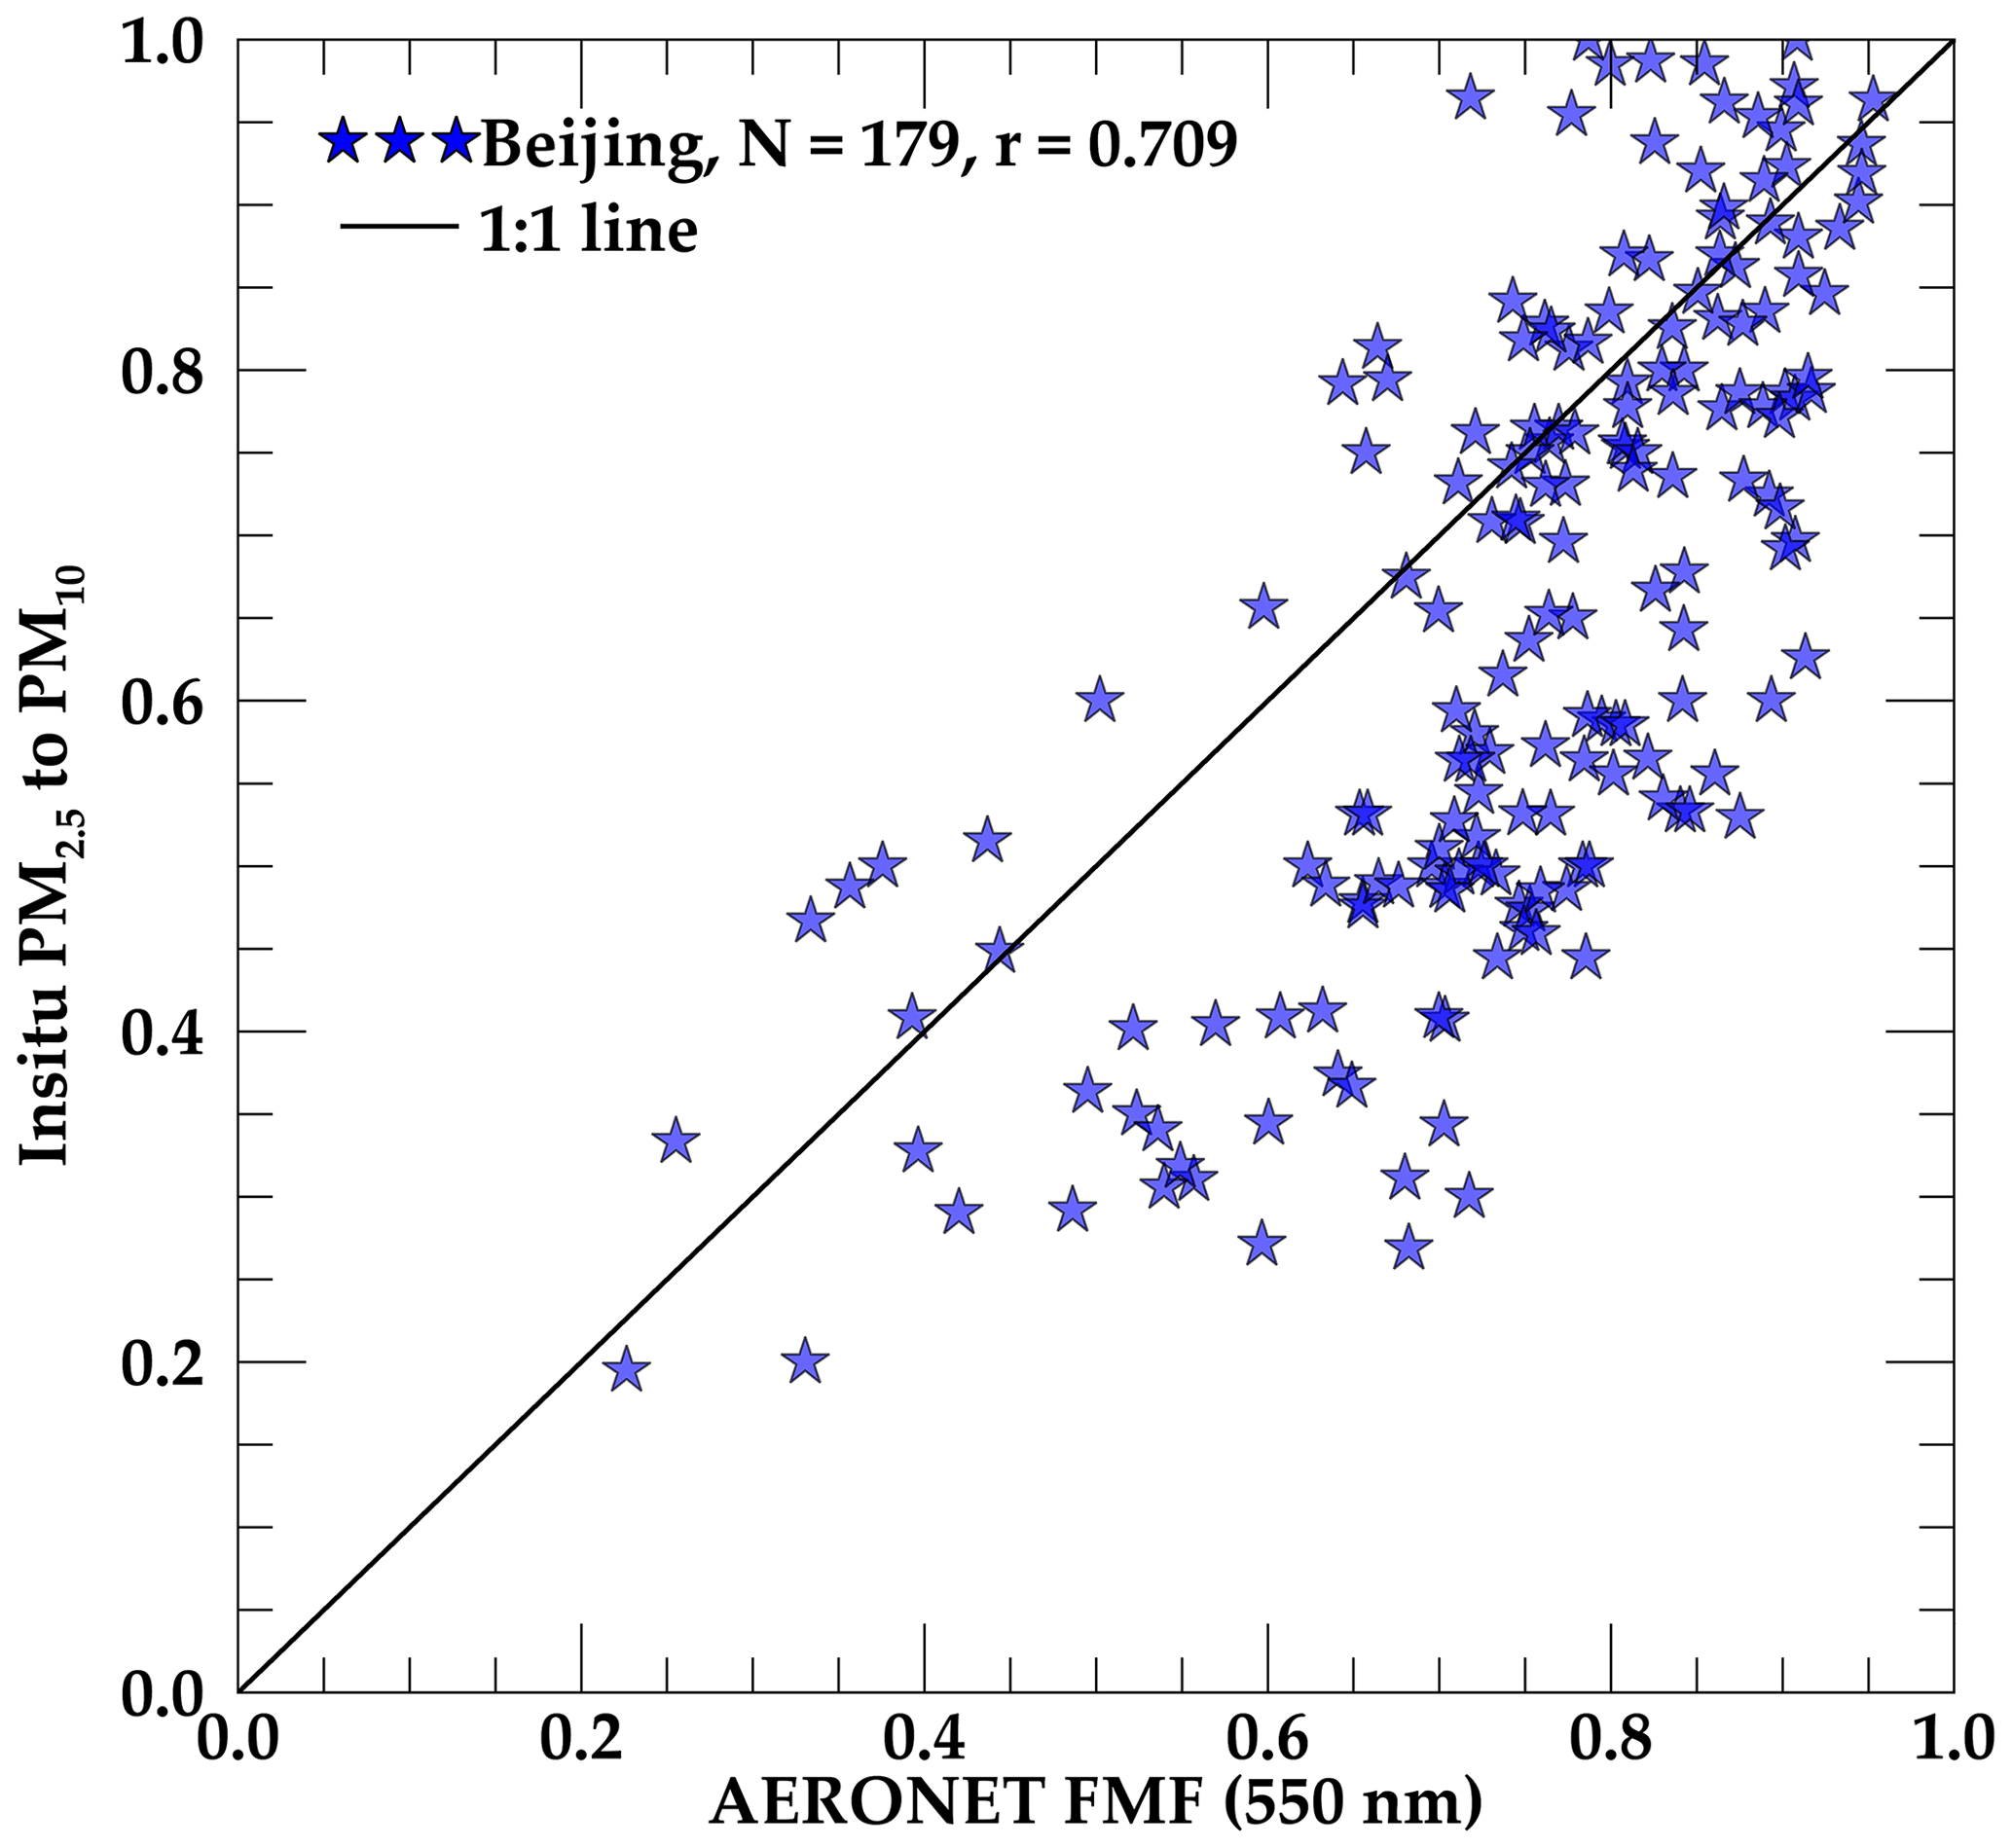

Figure 10Forty-seven urban administrative regions in China used to compare the annual average FMF.
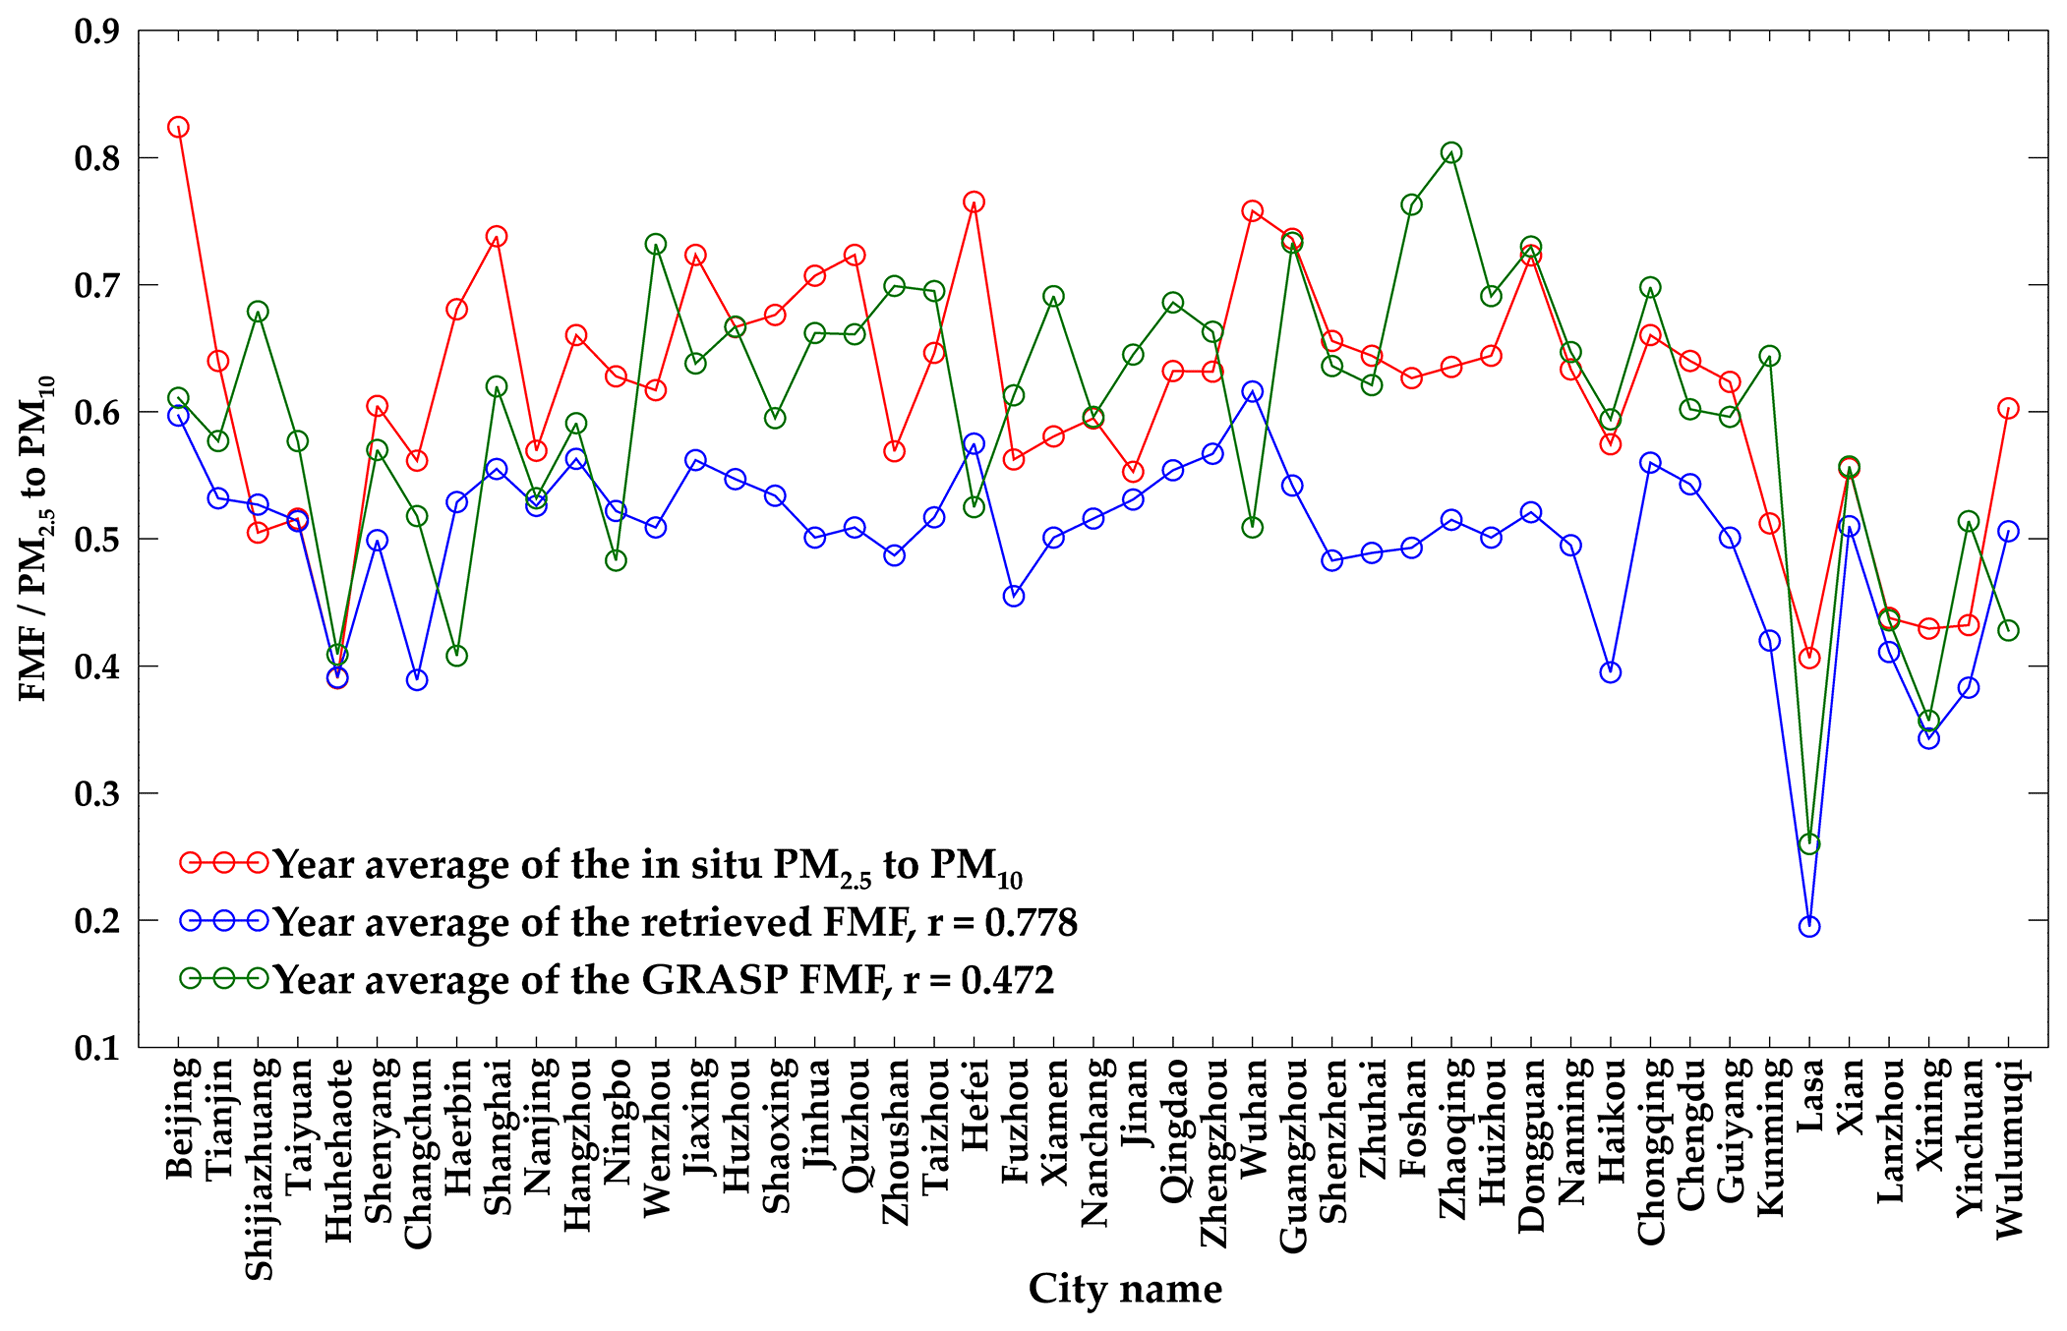
Figure 11Comparison of the results of the retrieved and GRASP FMF with the urban average of the ratio of PM2.5 to PM10 (2013).
Due to the lack of in situ data for particulate matter in China in 2013, this study can only be based on the 2013 environmental protection key city air in the China Statistical Yearbook (http://www.stats.gov.cn/tjsj/ndsj/, last access: 26 February 2021). The annual average value of air quality is used for limited analysis. We extracted the FMF retrieval results and GRASP results of the corresponding 47 cities in the statistical yearbook and calculated the annual average FMF of each city for comparison with the ratio of the annual average PM2.5 to PM10 of each city. The spatial distribution of the administrative regions of these 47 cities is shown in Fig. 10. These cities cover most of China's provinces and have a wider spatial distribution range than the AERONET sites in Fig. 1. The comparison results in Fig. 11 show that although the annual average FMF results of this study in each city are lower than the annual average results of the ratio of PM2.5 to PM10, the change trend of the FMF results of this study is better than the results of GRASP FMF. The r between the FMF of this study and the ratio of PM2.5 to PM10 is 0.778, while GRASP is 0.472, which can provide evidence for the correctness of the FMF results of this study in the spatial distribution. The low FMF results in this study are related to the calculation methods of the annual average values of PM2.5 and PM10 in each city. Generally, most of the in situ monitoring sites for particulate matter in each city are distributed in urban areas and the number of sites distributed in rural areas is small (for example, nine of the 12 state-controlled sites in Beijing are in urban areas). When calculating the average FMF of a city, one pixel may contain the results of multiple monitoring stations in place, which makes it difficult to achieve accurate spatial location matching. To facilitate data processing, all pixels within the urban administrative boundary are directly used to calculate the average value, and the large number of FMFs in rural areas is generally lower than that in cities, which ultimately leads to a lower FMF average result.
Based on the validation and comparison results in Sect. 3.1 to 3.3, this research has obtained FMF satellite retrieval results in China with good accuracy, which proves the reliability and stability of the retrieval method. Compared with the MODIS FMF products, the r, MAE, RMSE, and Within EE of the results of this study are all higher than the results of MODIS. Compared with the GRASP FMF, the results of this study are closer to the results of the ratio of PM2.5 to PM10 in terms of the spatial distribution of the entire region of China. The above results all illustrate the effectiveness and advantages of the FMF retrieval method used in this study. Compared with our original FMF retrieval method, which can only be used on the urban area scale, this research has achieved FMF retrieval in a large space.
In this study, the multiangle polarization data of PARASOL were used to perform FMF retrieval and the retrieval results were compared with the AERONET ground-based observations, MODIS results, and GRASP results. Based on the above work, the conclusions of this research are described as follows:
-
There is good agreement between the FMF results obtained in this study and the AERONET ground-based observation results. The overall r, MAE, RMSE, and Within EE between the two are 0.770, 0.143, 0.170, and 65.01 %, respectively.
-
The FMF results obtained in this study were more practical than the MODIS FMF products. The r, MAE, RMSE, and Within EE between the FMF results and the ground-based observations are 0.812 versus 0.302, 0.072 versus 0.512, 0.102 versus 0.574, and 87.41 % versus 19.58 %, respectively.
-
Compared with the GRASP FMF, the FMF results obtained in this study are closer to the ratio of PM2.5 to PM10 in terms of the spatial distribution trend. Compared with the annual average ratio of PM2.5 to PM10 in 47 Chinese cities in 2013, the r of this study is 0.778, and GRASP is 0.472.
The FMF retrieval method in this study has significance for the development of aerosol polarization satellite remote sensing algorithms, and the FMF results obtained in China also have good practical value for application research in the field of atmospheric environments. China has launched the Gaofen-5 (GF-5) satellite equipped with a new multiangle polarization sensor. With the release of GF-5 satellite data in the future, the results of this study can also provide algorithmic support for the application of its multiangle polarization sensor in the field of atmospheric environmental monitoring and are expected to produce subsequent FMF datasets. However, there are some shortcomings in this research. For example, the retrieval of the FMF still depends on the accuracy of the two parameters AODf and AODt. In our previous research, although higher-precision results of AODf and AODt have been obtained, the FMF error is related to the error of the two retrieval parameters. The transmission of the error will eventually amplify the retrieval error of the FMF. Compared with the individual retrieval of AODf and AODt, the retrieval of the FMF is still difficult. In the future, it is still necessary to further improve the retrieval accuracy of AODf and AODt to obtain more accurate FMF results. In this way, some applications that rely on FMF (such as using the PMRS model to estimate PM2.5 concentration) can perform better. In addition, due to the limitation of the validation data, we are temporarily unable to further discuss the correctness of the spatial distribution trend of the FMF in this study and GRASP, and only the results of the ratio of PM2.5 to PM10 were used for indirect comparison. In the future, we can try to perform FMF retrieval in other regions with many ground-based observations around the world to further compare the findings of the two results.
The FMF datasets produced in this study can be requested from the corresponding author (lizq@radi.ac.cn).
ZheL conceived and designed the study. YZ and LQ collected and processed the remote sensing data. YZ and YW performed the FMF retrievals. YZ and YX compared the retrieval results with the AERONET, MODIS, and GRASP products. WH and LL analysed the spatio-temporal trends of FMF in China. ZhiL and YW collected and processed the in situ data. YZ and ZheL prepared the paper with contributions from all coauthors.
The authors declare that they have no conflict of interest.
This article is part of the special issue “Satellite and ground-based remote sensing of aerosol optical, physical, and chemical properties over China”. It is not associated with a conference.
This work was supported by the National Natural Science Fund of China (41901294, 41771535), the National Natural Science Foundation of Chongqing, China (cstc2019jcyj-msxm0726), the Scientific Research Foundation of CUIT (KYTZ201909), the Science and Technology Department of Sichuan Province Foundation (2019YFS0470), and the Chengdu Science and technology project (2018-ZM01-00037-SN).
This research has been supported by the National Natural Science Foundation of China (grant no. 41901294 and 41771535), the National Natural Science Foundation of Chongqing, China (grant no. cstc2019jcyj-msxm0726), the Scientific Research Foundation of CUIT (grant no. KYTZ201909), the Science and Technology Department of Sichuan Province Foundation (grant no. 2019YFS0470), and the Chengdu Science and technology project (grant no. 2018-ZM01-00037-SN).
This paper was edited by Linlu Mei and reviewed by two anonymous referees.
Bellouin, N., Boucher, O., Haywood, J., and Reddy, M. S.: Global estimate of aerosol direct radiative forcing from satellite measurements, Nature, 438, 1138–1141, https://doi.org/10.1038/nature04348, 2005.
Chen, C., Dubovik, O., Henze, D. K., Lapyonak, T., Chin, M., Ducos, F., Litvinov, P., Huang, X., and Li, L.: Retrieval of desert dust and carbonaceous aerosol emissions over Africa from POLDER/PARASOL products generated by the GRASP algorithm, Atmos. Chem. Phys., 18, 12551–12580, https://doi.org/10.5194/acp-18-12551-2018, 2018.
Chen, C., Dubovik, O., Fuertes, D., Litvinov, P., Lapyonok, T., Lopatin, A., Ducos, F., Derimian, Y., Herman, M., Tanré, D., Remer, L. A., Lyapustin, A., Sayer, A. M., Levy, R. C., Hsu, N. C., Descloitres, J., Li, L., Torres, B., Karol, Y., Herrera, M., Herreras, M., Aspetsberger, M., Wanzenboeck, M., Bindreiter, L., Marth, D., Hangler, A., and Federspiel, C.: Validation of GRASP algorithm product from POLDER/PARASOL data and assessment of multi-angular polarimetry potential for aerosol monitoring, Earth Syst. Sci. Data, 12, 3573–3620, https://doi.org/10.5194/essd-12-3573-2020, 2020.
Chen, H., Cheng, T., Gu, X., Li, Z., and Wu, Y.: Evaluation of Polarized Remote Sensing of Aerosol Optical Thickness Retrieval over China, Remote Sens.-Basel, 7, 13711–13728, https://doi.org/10.3390/rs71013711, 2015.
Chen, X., Wang, J., Liu, Y., Xu, X. G., Cai, Z. N., Yang, D. X., Yan, C. X., and Feng, L.: Angular dependence of aerosol information content in CAPI/TanSat observation over land: Effect of polarization and synergy with A-train satellites, Remote Sens. Environ., 196, 163–177, https://doi.org/10.1016/j.rse.2017.05.007, 2017a.
Chen, X., Yang, D. X., Cai, Z. N., Liu, Y., and Spurr, R. J. D.: Aerosol Retrieval Sensitivity and Error Analysis for the Cloud and Aerosol Polarimetric Imager on Board TanSat: The Effect of Multi-Angle Measurement, Remote Sens.-Basel, 9, 183, https://doi.org/10.3390/rs9020183, 2017b.
Cheng, T., Gu, X., Xie, D., Li, Z., Yu, T., and Chen, H.: Aerosol optical depth and fine-mode fraction retrieval over East Asia using multi-angular total and polarized remote sensing, Atmos. Meas. Tech., 5, 501–516, https://doi.org/10.5194/amt-5-501-2012, 2012.
Deuzé, J. L., Bréon, F. M., Devaux, C., Goloub, P., Herman, M., Lafrance, B., Maignan, F., Marchand, A., Nadal, F., Perry, G., and Tanré, D.: Remote sensing of aerosols over land surfaces from POLDER-ADEOS-1 polarized measurements, J. Geophys. Res., 106, 4913–4926, https://doi.org/10.1029/2000jd900364, 2001.
Dubovik, O. and King, M. D.: A flexible inversion algorithm for retrieval of aerosol optical properties from Sun and sky radiance measurements, J. Geophys. Res., 105, 673–620, 2000.
Dubovik, O., Herman, M., Holdak, A., Lapyonok, T., Tanré, D., Deuzé, J. L., Ducos, F., Sinyuk, A., and Lopatin, A.: Statistically optimized inversion algorithm for enhanced retrieval of aerosol properties from spectral multi-angle polarimetric satellite observations, Atmos. Meas. Tech., 4, 975–1018, https://doi.org/10.5194/amt-4-975-2011, 2011.
Dubovik, O., Lapyonok, T., Litvinov, P., Herman, M., Fuertes, D., Ducos, F., Torres, B., Derimian, Y., Huang, X., and Lopatin, A.: GRASP: a versatile algorithm for characterizing the atmosphere, SPIE Newsroom, 25, 2.1201408, https://doi.org/10.1117/2.1201408.005558, 2014.
Frouin, R. J., Franz, B. A., Ibrahim, A., Knobelspiesse, K., Ahmad, Z., Cairns, B., Chowdhary, J., Dierssen, H. M., Tan, J., Dubovik, O., Huang, X., Davis, A. B., Kalashnikova, O., Thompson, D. R., Remer, L. A., Boss, E., Coddington, O., Deschamps, P.-Y., Gao, B.-C., Gross, L., Hasekamp, O., Omar, A., Pelletier, B., Ramon, D., Steinmetz, F., and Zhai, P.-W.: Atmospheric Correction of Satellite Ocean-Color Imagery During the PACE Era, Front. Earth Sci., 7, 145, https://doi.org/10.3389/feart.2019.00145, 2019.
Ge, B., Li, Z., Liu, L., Yang, L., Chen, X., Hou, W., Zhang, Y., Li, D., Li, L., and Qie, L.: A Dark Target Method for Himawari-8/AHI Aerosol Retrieval: Application and Validation, IEEE T. Geosci. Remote, 57, 381–394, https://doi.org/10.1109/TGRS.2018.2854743, 2019.
Hou, W., Li, Z., Wang, J., Xu, X., Goloub, P., and Qie, L.: Improving Remote Sensing of Aerosol Microphysical Properties by Near-Infrared Polarimetric Measurements Over Vegetated Land: Information Content Analysis, J. Geophys. Res.-Atmos., 123, 2215–2243, https://doi.org/10.1002/2017JD027388, 2018.
Huang, R.-J., Zhang, Y., Bozzetti, C., Ho, K.-F., Cao, J.-J., Han, Y., Daellenbach, K. R., Slowik, J. G., Platt, S. M., Canonaco, F., Zotter, P., Wolf, R., Pieber, S. M., Bruns, E. A., Crippa, M., Ciarelli, G., Piazzalunga, A., Schwikowski, M., Abbaszade, G., Schnelle-Kreis, J., Zimmermann, R., An, Z., Szidat, S., Baltensperger, U., Haddad, I. E., and Prévôt, A. S. H.: High secondary aerosol contribution to particulate pollution during haze events in China, Nature, 514, 218–222, https://doi.org/10.1038/nature13774, 2014.
Kaufman, Y. J., Tanre, D., and Boucher, O.: A satellite view of aerosols in the climate system, Nature, 419, 215–223, 2002.
Kaufman, Y. J., Boucher, O., Tanré, D., Chin, M., Remer, L. A., and Takemura, T.: Aerosol anthropogenic component estimated from satellite data, Geophys. Res. Lett., 32, 317–330, 2005.
Kim, M., Kim, J., Wong, M. S., Yoon, J., Lee, J., Wu, D., Chan, P. W., Nichol, J. E., Chung, C.-Y., and Ou, M.-L.: Improvement of aerosol optical depth retrieval over Hong Kong from a geostationary meteorological satellite using critical reflectance with background optical depth correction, Remote Sens. Environ., 142, 176–187, https://doi.org/10.1016/j.rse.2013.12.003, 2014.
Kokhanovsky, A. A., Davis, A. B., Cairns, B., Dubovik, O., Hasekamp, O. P., Sano, I., Mukai, S., Rozanov, V. V., Litvinov, P., Lapyonok, T., Kolomiets, I. S., Oberemok, Y. A., Savenkov, S., Martin, W., Wasilewski, A., Di Noia, A., Stap, F. A., Rietjens, J., Xu, F., Natraj, V., Duan, M., Cheng, T., and Munro, R.: Space-based remote sensing of atmospheric aerosols: The multi-angle spectro-polarimetric frontier, Earth-Sci. Rev., 145, 85–116, https://doi.org/10.1016/j.earscirev.2015.01.012, 2015.
Lee, H. J., Liu, Y., Coull, B. A., Schwartz, J., and Koutrakis, P.: A novel calibration approach of MODIS AOD data to predict PM2.5 concentrations, Atmos. Chem. Phys., 11, 7991–8002, https://doi.org/10.5194/acp-11-7991-2011, 2011.
Levy, R. C., Remer, L. A., and Dubovik, O.: Global aerosol optical properties and application to Moderate Resolution Imaging Spectroradiometer aerosol retrieval over land, J. Geophys. Res.-Atmos., 112, D13210, https://doi.org/10.1029/2006JD007815, 2007.
Levy, R. C., Remer, L. A., Tanré, D., Mattoo, S., Vermote, E. F., and Kaufman, Y. J.: Algorithm for Remote Sensing of Tropospheric Aerosol over Dark Targets from MODIS: Collections 005 and 051: Revision 2, available at: https://atmosphere-imager.gsfc.nasa.gov/sites/default/files/ModAtmo/ATBD_MOD04_C005_rev2_0.pdf (last access: 26 February 2021), 2009.
Levy, R. C., Remer, L. A., Kleidman, R. G., Mattoo, S., Ichoku, C., Kahn, R., and Eck, T. F.: Global evaluation of the Collection 5 MODIS dark-target aerosol products over land, Atmos. Chem. Phys., 10, 10399–10420, https://doi.org/10.5194/acp-10-10399-2010, 2010.
Li, L., Che, H., Derimian, Y., Dubovik, O., Schuster, G. L., Chen, C., Li, Q., Wang, Y., Guo, B., and Zhang, X.: Retrievals of fine mode light-absorbing carbonaceous aerosols from POLDER/PARASOL observations over East and South Asia, Remote Sens. Environ., 247, 111913, https://doi.org/10.1016/j.rse.2020.111913, 2020.
Li, Y., Xue, Y., de Leeuw, G., Li, C., Yang, L., Hou, T., and Marir, F.: Retrieval of aerosol optical depth and surface reflectance over land from NOAA AVHRR data, Remote Sens. Environ., 133, 1–20, https://doi.org/10.1016/j.rse.2013.01.020, 2013.
Li, Z., Zhang, Y., Shao, J., Li, B., Hong, J., Liu, D., Li, D., Wei, P., Li, W., Li, L., Zhang, F., Guo, J., Deng, Q., Wang, B., Cui, C., Zhang, W., Wang, Z., Lv, Y., Xu, H., Chen, X., Li, L., and Qie, L.: Remote sensing of atmospheric particulate mass of dry PM2.5 near the ground: Method validation using ground-based measurements, Remote Sens. Environ., 173, 59–68, https://doi.org/10.1016/j.rse.2015.11.019, 2016.
Nadal, F. and Bréon, F. M.: Parameterization of surface polarized reflectance derived from POLDER spaceborne measurements, IEEE T. Geosci. Remote, 37, 1709–1718, https://doi.org/10.1109/36.763292, 1999.
O'Neill, N. T., Dubovik, O., and Eck, T. F.: Modified angström exponent for the characterization of submicrometer aerosols, Appl. Optics, 40, 2368–2375, 2001a.
O'Neill, N. T., Eck, T. F., Holben, B. N., Smirnov, A., Dubovik, O., and Royer, A.: Bimodal size distribution influences on the variation of Angstrom derivatives in spectral and optical depth space, J. Geophys. Res.-Atmos., 106, 9787–9806, 2001b.
O'Neill, N. T., Eck, T. F., Smirnov, A., Holben, B. N., and Thulasiraman, S.: Spectral discrimination of coarse and fine mode optical depth, J. Geophys. Res., 108, 4559, https://doi.org/10.1029/2002jd002975, 2003.
Qie, L., Li, Z., Sun, X., Sun, B., Li, D., Liu, Z., Huang, W., Wang, H., Chen, X., Hou, W., and Qiao, Y.: Improving Remote Sensing of Aerosol Optical Depth over Land by Polarimetric Measurements at 1640 nm: Airborne Test in North China, Remote Sens.-Basel, 7, 6240–6256, https://doi.org/10.3390/rs70506240, 2015.
Remer, L. A., Kaufman, Y. J., Tanré, D., Mattoo, S., Chu, D. A., Martins, J. V., Li, R. R., Ichoku, C., Levy, R. C., and Kleidman, R. G.: The MODIS Aerosol Algorithm, Products, and Validation, J. Atmos. Sci., 62, 947–973, 2005.
Schuster, G. L., Espinosa, W. R., Ziemba, L. D., Beyersdorf, A. J., Rocha-Lima, A., Anderson, B. E., Martins, J. V., Dubovik, O., Ducos, F., and Fuertes, D.: A Laboratory Experiment for the Statistical Evaluation of Aerosol Retrieval (STEAR) Algorithms, Remote Sens.-Basel, 11, 498, https://doi.org/10.3390/rs11050498, 2019.
Shi, Y., Matsunaga, T., Yamaguchi, Y., Zhao, A., Li, Z., and Gu, X.: Long-term trends and spatial patterns of PM2.5-induced premature mortality in South and Southeast Asia from 1999 to 2014, Sci. Total Environ., 631, 1504–1514, 2018.
Tan, Y., Li, E., Zhang, Z., Lin, X., and Wang, Q.: Validation of POLDER-3/GRASP aerosol products using AERONET measurements over China, Atmos. Environ., 215, 116893, https://doi.org/10.1016/j.atmosenv.2019.116893, 2019.
Tanré, D., Bréon, F. M., Deuzé, J. L., Dubovik, O., Ducos, F., François, P., Goloub, P., Herman, M., Lifermann, A., and Waquet, F.: Remote sensing of aerosols by using polarized, directional and spectral measurements within the A-Train: the PARASOL mission, Atmos. Meas. Tech., 4, 1383–1395, https://doi.org/10.5194/amt-4-1383-2011, 2011.
Wang, H., Sun, X., Yang, L., Zhao, M., Lui, P., and Du, W.: Aerosol retrieval algorithm based on adaptive land–atmospheric decoupling for polarized remote sensing over land surfaces, J. Quant. Spectrosc. Ra., 219, 74–84, 2018.
Wang, S., Fang, L., Zhang, X., and Wang, W.: Retrieval of Aerosol Properties for Fine/Coarse Mode Aerosol Mixtures over Beijing from PARASOL Measurements, Remote Sens.-Basel, 7, 9311–9324, https://doi.org/10.3390/rs70709311, 2015.
Wei, Y., Li, Z., Zhang, Y., Chen, C., Dubovik, O., Zhang, Y., Xu, H., Li, K., Chen, J., Wang, H., Ge, B., and Fan, C.: Validation of POLDER GRASP aerosol optical retrieval over China using SONET observations, J. Quant. Spectrosc. Ra., 246, 106931, https://doi.org/10.1016/j.jqsrt.2020.106931, 2020.
Xie, D., Cheng, T., Zhang, W., Yu, J., Li, X., and Gong, H.: Aerosol type over east Asian retrieval using total and polarized remote Sensing, J. Quant. Spectrosc. Ra., 129, 15–30, https://doi.org/10.1016/j.jqsrt.2013.05.028, 2013.
Xie, Y., Wang, Y., Zhang, K., Dong, W., Lv, B., and Bai, Y.: Daily estimation of ground-level PM2.5 concentrations over Beijing using 3 km resolution MODIS AOD, Environ. Sci. Technol., 49, 12280–12288, https://doi.org/10.1021/acs.est.5b01413, 2015.
Yan, X., Li, Z., Shi, W., Luo, N., Wu, T., and Zhao, W.: An improved algorithm for retrieving the fine-mode fraction of aerosol optical thickness, Part I: Algorithm development, Remote Sens. Environ., 192, 87–97, https://doi.org/10.1016/j.rse.2017.02.005, 2017.
Yan, X., Li, Z., Luo, N., Shi, W., Zhao, W., Yang, X., Liang, C., Zhang, F., and Cribb, M.: An improved algorithm for retrieving the fine-mode fraction of aerosol optical thickness, Part II: Application and validation in Asia, Remote Sens. Environ., 222, 90–103, https://doi.org/10.1016/j.rse.2018.12.012, 2019.
Zhang, Y. and Li, Z.: Remote sensing of atmospheric fine particulate matter (PM2.5) mass concentration near the ground from satellite observation, Remote Sens. Environ., 160, 252–262, https://doi.org/10.1016/j.rse.2015.02.005, 2015.
Zhang, Y., Liu, Z., Wang, Y., Ye, Z., and Leng, L.: Inversion of Aerosol Optical Depth Based on the CCD and IRS Sensors on the HJ-1 Satellites, Remote Sens.-Basel, 6, 8760–8778, https://doi.org/10.3390/rs6098760, 2014.
Zhang, Y., Li, Z., Qie, L., Zhang, Y., Liu, Z., Chen, X., Hou, W., Li, K., Li, D., and Xu, H.: Retrieval of Aerosol Fine-Mode Fraction from Intensity and Polarization Measurements by PARASOL over East Asia, Remote Sens.-Basel, 8, 417, https://doi.org/10.3390/rs8050417, 2016.
Zhang, Y., Li, Z., Qie, L., Hou, W., Liu, Z., Zhang, Y., Xie, Y., Chen, X., and Xu, H.: Retrieval of Aerosol Optical Depth Using the Empirical Orthogonal Functions (EOFs) Based on PARASOL Multi-Angle Intensity Data, Remote Sens.-Basel, 9, 578, https://doi.org/10.3390/rs9060578, 2017.
Zhang, Y., Li, Z., Liu, Z., Zhang, J., Qie, L., Xie, Y., Hou, W., Wang, Y., and Ye, Z.: Retrieval of the Fine-Mode Aerosol Optical Depth over East China Using a Grouped Residual Error Sorting (GRES) Method from Multi-Angle and Polarized Satellite Data, Remote Sens.-Basel, 10, 1838, https://doi.org/10.3390/rs10111838, 2018.
Zhang, Y., Li, Z., Chang, W., Zhang, Y., de Leeuw, G., and Schauer, J. J.: Satellite Observations of PM2.5 Changes and Driving Factors Based Forecasting Over China 2000–2025, Remote Sens.-Basel, 12, 2518, https://doi.org/10.3390/rs12162518, 2020.
Zhao, A., Li, Z., Zhang, Y., Zhang, Y., and Li, D.: Merging MODIS and Ground-Based Fine Mode Fraction of Aerosols Based on the Geostatistical Data Fusion Method, Atmosphere, 8, 117, https://doi.org/10.3390/atmos8070117, 2017.
Zhong, G. S., Wang, X. F., Guo, M., Tani, H., Chittenden, A. R., Yin, S., Sun, Z. Y., and Matsumura, S.: A Dark Target Algorithm for the GOSAT TANSO-CAI Sensor in Aerosol Optical Depth Retrieval over Land, Remote Sens.-Basel, 9, 524, https://doi.org/10.3390/rs9060524, 2017.
The requested paper has a corresponding corrigendum published. Please read the corrigendum first before downloading the article.
- Article
(12740 KB) - Full-text XML