the Creative Commons Attribution 4.0 License.
the Creative Commons Attribution 4.0 License.
 | 26 Mar 2021
Dynamic infrared gas analysis from longleaf pine fuel beds burned in a wind tunnel: observation of phenol in pyrolysis and combustion phases
Catherine A. Banach
Ashley M. Bradley
Russell G. Tonkyn
Olivia N. Williams
Joey Chong
David R. Weise
Tanya L. Myers
Timothy J. Johnson
Pyrolysis is the first step in a series of chemical and physical processes that produce flammable organic gases from wildland fuels that can result in a wildland fire. We report results using a new time-resolved Fourier transform infrared (FTIR) method that correlates the measured FTIR spectrum with an infrared thermal image sequence, enabling the identification and quantification of gases within different phases of the fire process. The flame from burning fuel beds composed of pine needles (Pinus palustris) and mixtures of sparkleberry, fetterbush, and inkberry plants was the natural heat source for pyrolysis. Extractive gas samples were analyzed and identified in both static and dynamic modes synchronized to thermal infrared imaging: a total of 29 gases were identified including small alkanes, alkenes, aldehydes, nitrogen compounds, and aromatics, most previously measured by FTIR in wildland fires. This study presents one of the first identifications of phenol associated with both pre-combustion and combustion phases using ca. 1 Hz temporal resolution. Preliminary results indicate greater phenol emissions from sparkleberry and inkberry compared to fetterbush, with differing temporal profiles.
- Article
(9116 KB) - Full-text XML
- BibTeX
- EndNote


Wildland fire is an important component of many ecosystems and has been used by humans for several thousand years (Crutzen and Goldammer, 1993; Pyne, 1997; Scott et al., 2014). Many North American ecosystems have evolved as a result of persistent fire (Barbour and Billings, 2000). The importance of fire in pine forests worldwide including the southern US is well-known (Agee, 2000; Christensen, 2000). In the US, prescribed burning is used on approximately 8 million ha annually to accomplish a variety of forestry and agricultural objectives (Melvin, 2015); the impact of smoke from these fires has been studied for over 50 years (Chi et al., 1979; Biswell, 1989; Ward and Hardy, 1991; Hardy et al., 2001). In the southern US, forest management objectives include hazardous fuel reduction, site preparation, improved wildlife habitat, insect and disease control, enhanced appearance, and perpetuation of fire-dependent species and natural communities (Carter and Foster, 2004; Waldrop and Goodrick, 2012). The US Department of Defense (DoD) uses prescribed burning on approximately 243 000 ha annually for many of these objectives in addition to the maintenance of critical training areas (Cohen et al., 2014). Many land managers rely on fire behavior models to calculate fire movement on the landscape, energy release, smoke plume development, dispersion, and content (Bytnerowicz et al., 2009, Paton-Walsh et al., 2014). However, few fire behavior models account for the plethora of chemical reactions involved in the fire. The heat transfer processes that take place in the fire environment are also only coarsely described. In order to improve the use of prescribed burning to accomplish refined objectives, more detailed descriptions and modeling of the physical and chemical processes in fire are needed (Cohen et al., 2014).
The chemical phases of wildland fire, described as preheating, flaming, smoldering, and glowing (Ward, 2001), are understood in a chemical sense but only to varying degrees: while the chemical effluents of the flaming and smoldering phases have been characterized for many ecosystems and fuel types at different scales (Ward and Radke, 1993), the physics and chemistry of the preheating (pyrolysis) phase have fewer studies beyond the bench scale (e.g., Depew et al., 1972; Dimitrakopoulos, 2001; Susott, 1982; Tihay and Gillard, 2010). To improve fire application models, accomplish the desired fire effects, and limit potential fugitive emissions, improved understanding is thus needed for many fundamental processes, particularly for pyrolysis and ignition in heterogeneous fuel beds of live and dead fuels that reflect the diversity of vegetation found worldwide (Guérette et al., 2018).
Prior to oxidative combustion, biomass thermally decomposes in a heated environment. To study this decomposition, thermogravimetric analysis has been applied to a small set of plant species deemed to represent major wildland fuel types (e.g., Burgan and Susott, 1991; Susott, 1982). Others have determined the caloric content of southern fuels, which is related to the composition of pyrolysis products (Hough, 1969; Behm et al., 2004). However, most such prior work used dried, ground fuel samples in either an inert or oxidizing environment subject to uniform heating and heat transfer, (Kibet et al., 2012) thereby eliminating the effects of moisture and heat transfer, which are key fire behavior variables. While pyrolysis and combustion of wildland fuels are known to be complex processes (Zhou and Mahalingam, 2001), they are often modeled using simple approximations in the relevant computer codes using the dominant gases of H2, CO, CO2, and CH4. Heat transfer in a wildland setting is less efficient than in thermogravimetric analysis: the amount and composition of pyrolyzed species produced strongly depend on heating rate and temperature, and they typically consist of oxidized small-molecule gases such as CO, CO2, or H2O, as well as non-oxidized or partially oxidized species such as H2, CH4, CxHy, CxHyOz, and tars. The products of primary pyrolysis may react in the gas phase at elevated temperatures (i.e., secondary pyrolysis), which may affect the amount of tar remaining.
This work is part of a larger project to measure and model pyrolysis gases from common wildland fuels found on DoD installations in the southern United States (Weise et al., 2018). The project includes bench-level, laboratory-scale, and field plot burns; integrating the results of the field and laboratory measurements with the modeling results to identify potential improvements can enhance understanding of pyrolysis and ignition in wildland fuels. During the course of the project, Fourier transform infrared (FTIR) methods were used on several occasions to non-intrusively measure the composition and concentration of the pyrolysis gases including the gases liberated by (i) heating single leaf samples from several common southern fuels using different heating modes in a pyrolyzer and in a simple flat-flame burner system (Amini et al., 2019; Safdari et al., 2020), (ii) heating shrubs in prescribed burns at Ft. Jackson, South Carolina (Scharko et al., 2019a, b), and (iii) heating nursery plants with flames from longleaf pine needle fuel beds inside a wind tunnel (Aminfar et al., 2019). In order to achieve the goal that the results be applicable to prescribed burns, a key focus has been linking the bench-scale, wind tunnel, and field data to the models using realistic values and identities for the pyrolysis gases. Chemical analysis of the foliage and results of the bench-scale tests so far suggest that describing wood pyrolysis may not be suitable for foliage fuels (live and dead; Jolly et al., 2012, 2016; Matt et al., 2020). To date, pyrolysis and ignition of wildland fuels have typically been based on results for only cellulose or wood (e.g., Varhegyi et al., 1994; Di Blasi, 2008). In this paper a small wind tunnel was used to bridge the bench-scale studies to the field-scale pyrolysis measurements using a subset of the plant species from the bench-scale tests. The wind tunnel measurements were set to emulate the larger-scale FTIR experiments using canister samples in 0.1 ha prescribed burns at Ft. Jackson in May 2018. The specific goal is to provide better temporal and flame-phase resolution than provided by larger field studies such as the Ft. Jackson burns or from large chamber facilities such as the Fire Sciences Laboratory (FSL) in Montana (Yokelson et al., 1996, Burling et al., 2010); the FSL has a long-path optical cell coupled to an FTIR in addition to many other powerful analytical methods, such as proton-transfer mass spectrometry (Christian et al., 2004; Warneke et al., 2011; Yokelson et al., 2013). The FSL has made first detections for dozens of chemical species and has pioneered the science of biomass burning in many ways. But because the sampling platform is 4 m above the floor, there is mixing of gases from different phases such as volatilization and pyrolysis. The combustion and smoldering phases are typically easier to differentiate, primarily via the intrinsic diagnostic of the modified combustion efficiency (Ward and Hao, 1991), a measure that is not independent of the composition of smoke (Weise et al., 2020). Similar ambiguities as to the nature of the phase of the fire also apply to extractive methods whereby a sampling device attempts to capture pre-combustion-phase gases. Such sampling systems, typically connected to a field canister, are effective but are subject to the vagaries of sniffer gas inlet placement, i.e., proximity to the pyrolyzing plant (Scharko et al., 2019a, b). Here we describe the use of an FTIR with a probe to temporally isolate, identify, and quantify some of the early-stage and pyrolysis gases from burns at a mid-scale laboratory facility. Experiments were conducted at the Riverside Fire Lab (RFL) in a wind tunnel using fuel beds composed of longleaf pine needles and the live plants fetterbush, inkberry, sparkleberry, and blueberry. Multiple methods were used such as quantum-cascade lasers (Phillips et al., 2020), gas chromatography–mass spectrometry, and FTIR with the overall objectives of the following: (i) using careful chemometric extraction from the acquired data to see what pyrolysis species can be identified by the techniques; (ii) using the various methods to determine the degree of oxidation or combustion, i.e., pyrolysis characterization; (iii) making first attempts to quantify the rates of evolution of pyrolysis products for certain plant species; and ideally (iv) determining if differences exist between the pyrolysis emissions and temporal profiles for different plant species. We take advantage of the high-resolution and time-resolved capabilities offered by IR spectroscopy and couple these to the flame and solid fuel temperature diagnostics of an IR camera to analyze the emissions from a series of RFL burns.
2.1 Wind tunnel and experimental configuration
As part of the project a total of 88 laboratory-scale burns were conducted at the USDA Forest Service Pacific Southwest Research Station in Riverside, California; this paper reports on the 21 burns from November 2018. The Riverside laboratory includes a wind tunnel ca. 3 m long and 1 m wide, which was set up to simulate a forest floor of litter and live plants. Fuel beds composed of 1 kg of dry longleaf pine needles and various combinations of inkberry (Ilex glabra (L.) A. Gray), fetterbush (Lyonia lucida (Lam.) K. Koch), sparkleberry (Vaccinium arboreum L.), and blueberry (V. darrowii Camp) were burned under either “no wind” or 1 m s−1 wind conditions. Fuel moisture content and mass loading, ambient temperature, and relative humidity in the tunnel were varied between experiments; fuel beds were ignited with a line fire that propagated the length of the fuel bed as seen in Fig. 1b. Multiple techniques were used to study the fire characteristics and the gas effluents: thermocouples, a Schmidt–Boelter heat flux sensor, a nadir thermal IR camera, and background-oriented Schlieren photography (Aminfar et al., 2019) to estimate heat transfer and airflow around the plants, canister samples analyzed by GC–FID, quantum-cascade (QC) infrared laser spectroscopy (Phillips et al., 2020), and broadband Fourier transform infrared (FTIR) spectroscopy. A schematic overview of the experimental setup is seen in Fig. 1c.
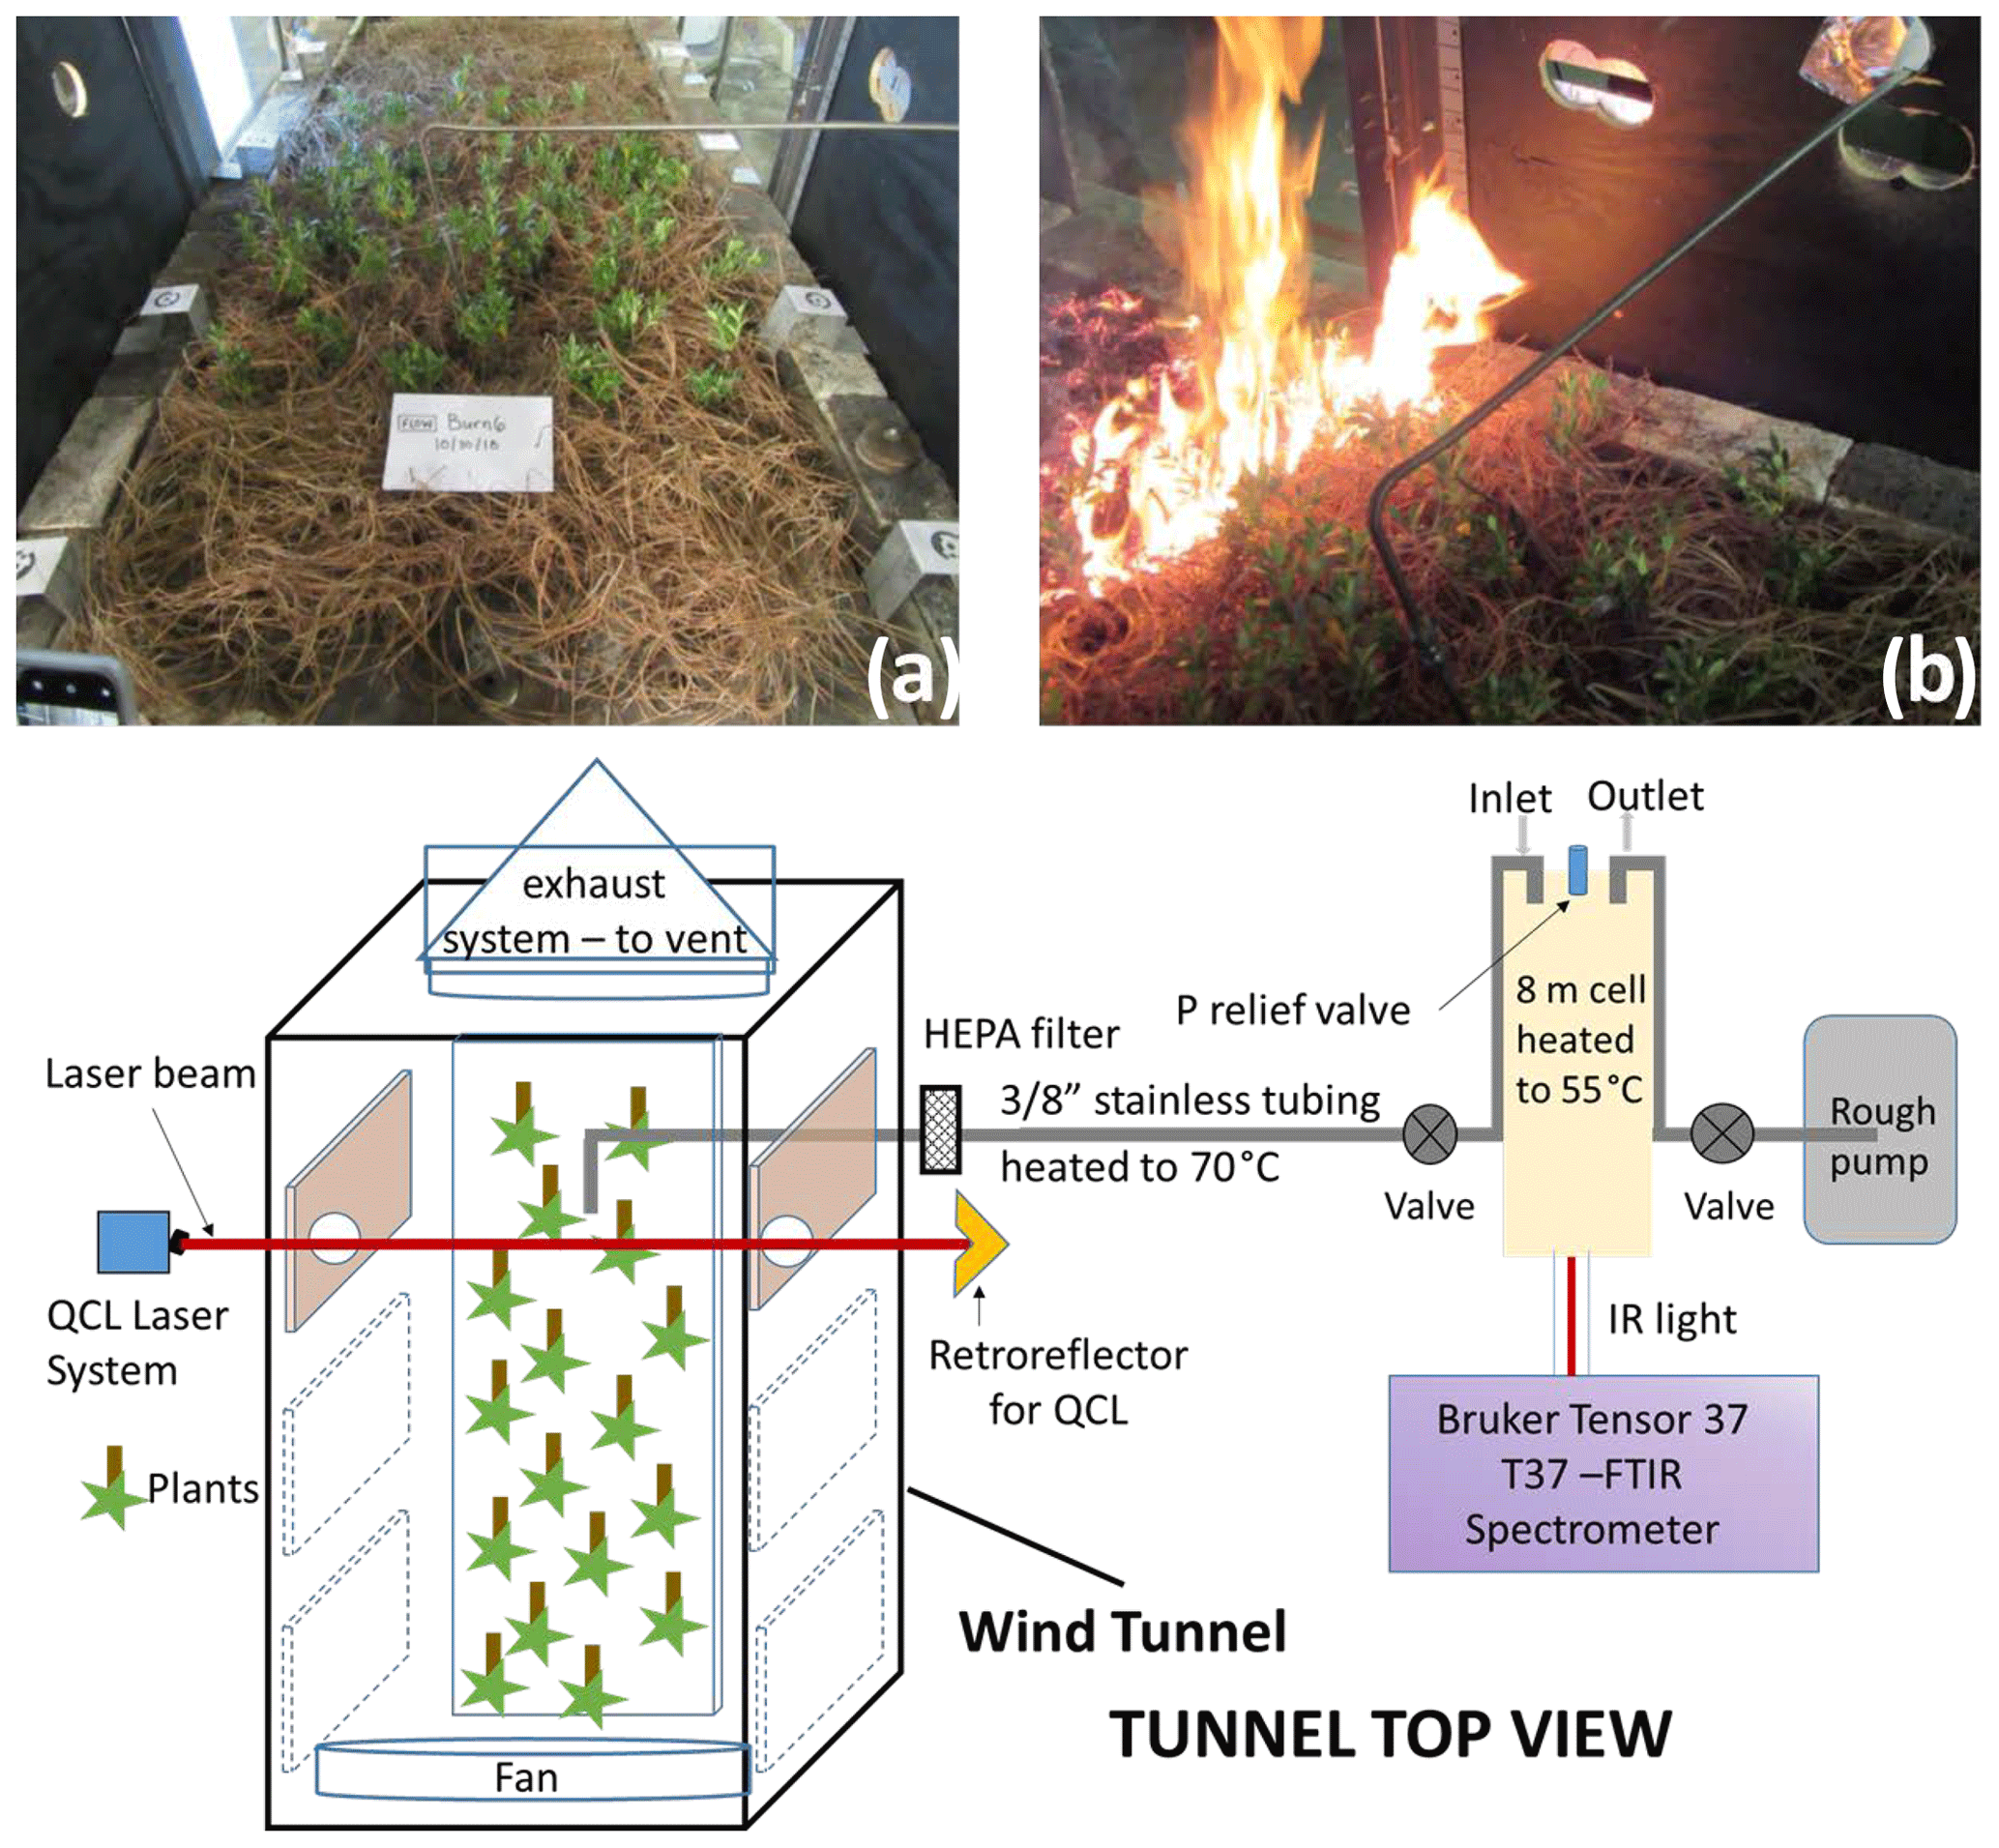
Figure 1(a) Overhead view of the wind tunnel down its length with longleaf pine needles and interspersed inkberry plants; (b) flame front progressing down the wind tunnel with FTIR extraction tube visible; (c) cartoon (top view) of experimental layout with laser and FTIR systems.
Table 1Summary of burn schedule for November 2018 studies including burn number, date and time, fuel description, acquisition method, and spectral resolution used for wind tunnel experiments under 1 m s−1 of imposed airflow. The harmonic mean flame spread rate is 0.01 m s−1. The FTIR acquisition methods are described in the text.
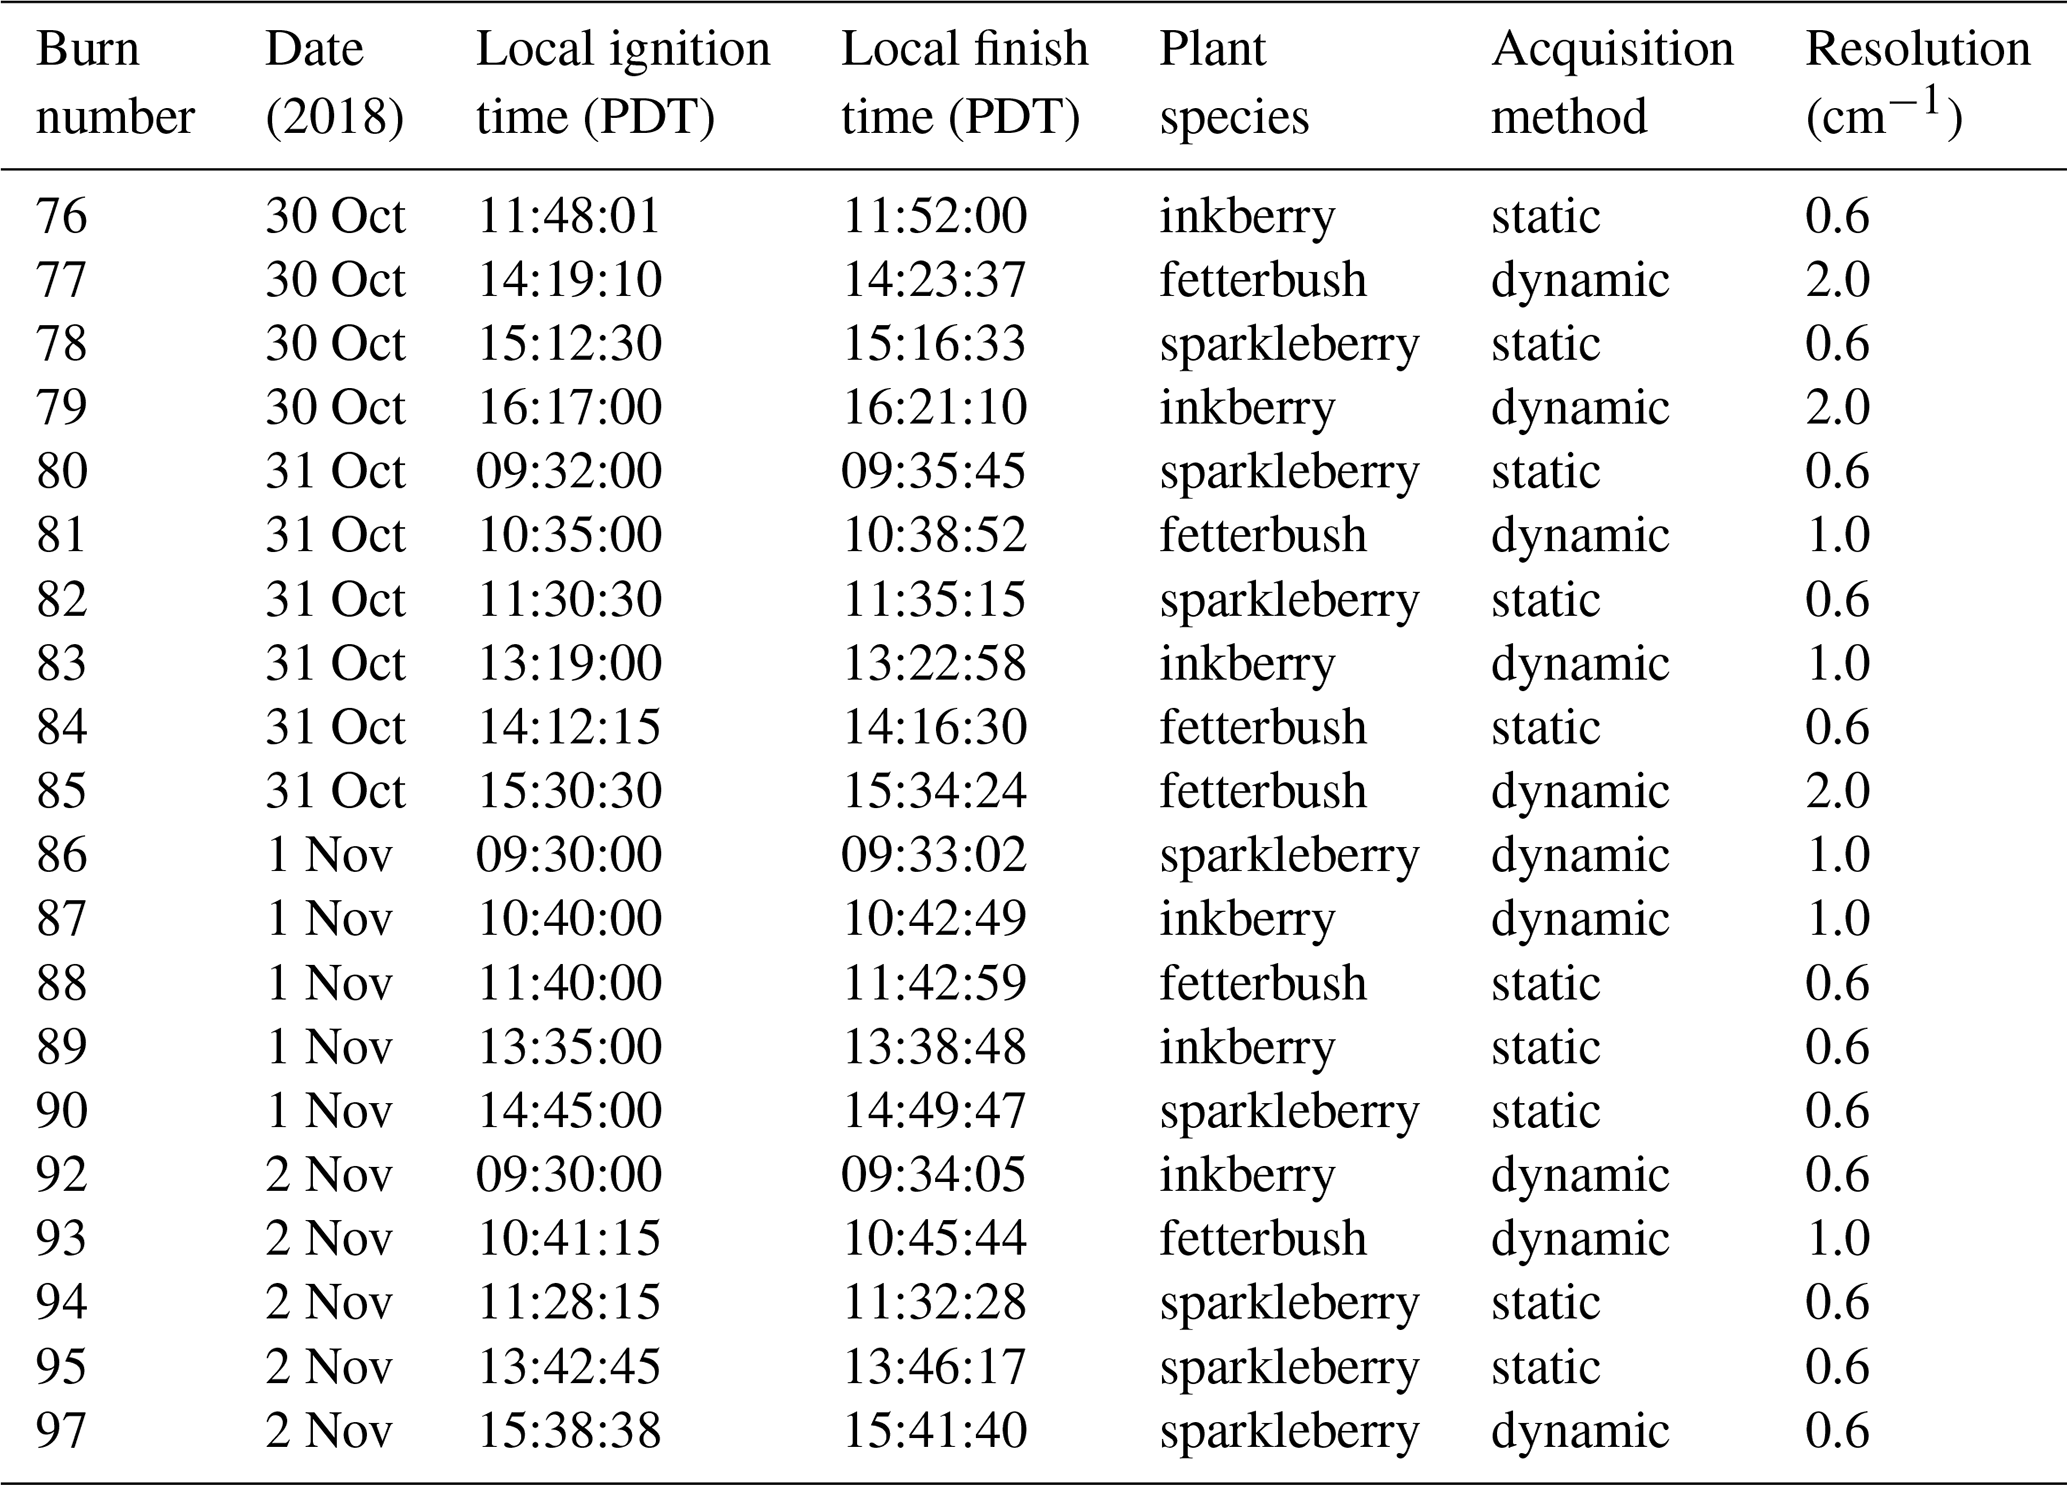
Because the probe was inserted directly above the plants (Fig. 1b) and because Teflon melts at ca. 327 ∘C, the gas samples were pumped into the cell and FTIR instrument via a stainless-steel tube that was heated for those sections outside the wind tunnel. This has proven effective at preventing adhesion for nearly all gases except amines (Scharko et al., 2019a). Gas from further probes was pumped into canisters for offline analysis using gas chromatography. A total of 66 or 74 live plants were distributed within the longleaf pine needles in ceramic holders. Figure 1a shows the configuration of the fuel bed with instrumentation for in situ analysis. Plant species were prepared on site, and samples of dry and live fuel were clipped to determine fuel moisture content prior to each burn set. The experiments were set under varying fuel bed and environmental conditions, as summarized in Table 1 for the 21 experiments presented in this paper.
2.2 Instrumentation
Gases were extracted from the burns via stainless-steel tubing, HEPA-filtered to eliminate tar and char contamination, and pumped into an 8 m White cell (Bruker A136, 2.2 L volume)1 housed inside a Bruker Tensor 37 spectrometer (Fig. 1c). The extractive probe was placed directly above a plant as close as possible to the foliage. To prevent analyte and tar condensation, both the transfer tubing and the gas cell were heated to ∼55 ∘C using heating tape (and a voltage regulator) and a cell heating shroud, respectively. A thermocouple was suspended into the White cell to record the gas temperature for subsequent spectral analysis, with a pressure gauge mounted atop the cell. Prior to data collection, the White cell was aligned using the FTIR's Ge CaF2 beamsplitter and tungsten lamp source. Once aligned, these were replaced with a Ge KBr beamsplitter and mid-IR globar source, along with a mercury cadmium telluride detector, thereby configuring the Tensor 37 to record spectral data from 7500 to 500 cm−1.
The FTIR system was tested for leaks, followed by a gas cell path length calibration using purified isopropyl alcohol (IPA – Sigma Aldrich 99.5 %). A total of 10 spectra with IPA pressures between 0.6 and 10.5 Torr (0.8–14.0 hPa) were recorded to 0.1 Torr accuracy using an MKS KF15 pressure transducer. The integrated area of the 3515–3290 cm−1 spectral domain (Bruker OPUS 5.5 software), along with recorded temperatures and pressures, was used to create a Beer–Lambert plot (Scharko et al., 2019a). Using the integrals from the 10 recorded spectra, the cell path length was determined to be 6.5±0.2 m. Prior to spectral analysis (Sect. 2.4), the infrared spectra were calibrated on the wavelength axis using a series of 30 water rotational–vibrational lines from the PNNL gas-phase database (Sharpe et al., 2002; Williams et al., 2013). FTIR interferograms were acquired using double-sided, forward–backward acquisition; these were apodized using a Blackman–Harris three-term function phase-corrected with Mertz's method prior to Fourier transformation. For both acquisition modes (static and dynamic), a single Io reference spectrum at the appropriate resolution was collected by flowing ambient gas into the cell at the start of each day to form the single (static) or multiple (dynamic) decadic absorbance spectra using Beer's law: . Acquiring such a blank or zero Io spectrum effectively accounts for any trace volatile organic compound (VOC) emissions from the White cell, wind tunnel, and/or tubing.
2.3 Infrared spectral acquisition
Two data acquisition modes were used to analyze the burn gases: an extractive (or static) mode and a dynamic mode. In the extractive mode the gas flowing through the White cell was isolated for analysis; the inlet–outlet valves were simultaneously closed such that the emitted gases were isolated in the cell at a desired pressure of ca. 740–700 Torr (990–930 hPa) for high pressures and 430–400 Torr (570–530 hPa) for lower pressure measurements. The valves were closed just prior to the flame front reaching the probe in an attempt to capture pre-combustion phases including evaporation and pyrolysis. The goal of the extractive mode was to obtain a higher-fidelity “snapshot” for a given point in time of the burn; data were averaged longer at higher spectral resolution, allowing for detection of more gaseous species with higher sensitivity (Scharko et al., 2019a). The dynamic-mode measurements recorded fewer scans at lower resolution to capture changing chemical identities and compositions corresponding to different fire phases (pyrolysis, flaming combustion, smoldering combustion), achieving temporal resolutions of ca. 1 Hz.
Of the 21 burns, 10 were recorded using the static method (Table 1). The static experiment spectra were recorded using the spectrometer's 0.6 cm−1 full resolution with an optical aperture of 2 mm. Interferograms were double-sided with forward–backward acquisition. Due to the higher resolution and lower light throughput, multiple scans were averaged for a 30 min acquisition time, resulting in vastly improved signal-to-noise ratios (SNRs). For analysis of such complicated gas-phase mixtures, infrared spectral resolutions of 1 cm−1 or better have been demonstrated to be advantageous (Burling et al., 2010; Akagi et al., 2014; Scharko et al., 2019a). While one goal was to isolate gases to include only the pyrolysis and pre-combustion phases, one vagary of the technique involved the timed closing of the valves relative to arrival of the flame front approaching the inlet. If the valves were shut too early, the captured emissions would consist of only (warmed) ambient gas before the onset of thermal degradation of the solid fuel as opposed to the desired pyrolysis phase. Conversely, if shut too late, flaming or possibly even smoldering conditions would be sampled.
The second method was the dynamic mode whereby the OPUS software was used to continuously collect interferograms throughout the duration of the burn, capturing the chemical compositions associated with different phases, e.g., volatilization, heating, pyrolysis, flaming or smoldering combustion. Fourier transformation of the interferograms occurred after the burns to yield faster acquisition times. The dynamic acquisition mode was used in combination with thermal IR video imaging recorded from above the flame bed to help synchronize spectral acquisition to the various burn phases for a total of 11 burns. Instead of averaging for 30 min, the dynamic method allowed for 40–80 continuous interferometer scans (differing on the duration of the burn) and yielded a spectrum every 1.5 s for data taken at 1.0 cm−1 resolution, every 0.79 s for data at 2.0 cm−1 resolution, and every 2.5 s for 0.6 cm−1 resolution spectra. Data acquisition began as the flame front encroached upon the extractive probe and continued until the flame had passed. Due to the faster acquisition rate these spectra are significantly noisier than the data collected using the extractive method. To compare results from the static and dynamic modes, fires 87 and 89 will be presented. The 2 m length fuel beds for both experiments 87 and 89 consisted of 1 kg of longleaf pine needles with interspersed inkberry plants.
For time synchronization, it was necessary to quantify the time lag from the time the emissions entered the extractive probe to the midpoint in their flow through the White cell. A flow rate test was thus conducted using freon gas, CFC-11 (trichlorofluoromethane), which is comparable in molecular weight to the heavier gases detected by the FTIR. Figure 2 shows such a test with CFC-11 being introduced and spectra recorded every 0.79 s using 2.0 cm−1 resolution. The time from the introduction of the freon at the extractive probe (t=0, scan 0) to the first appearance in scan 4 (maroon trace) was 3.2 s. The freon spectra had maximized at scan 6 (red trace) for a total Δt=4.8 s lag from the probe to the instrument. With this information, FTIR time-stamped data were then adjusted to reflect the 4.8 s delay, which was used when correlating the spectral data with the visual and thermal IR video images.
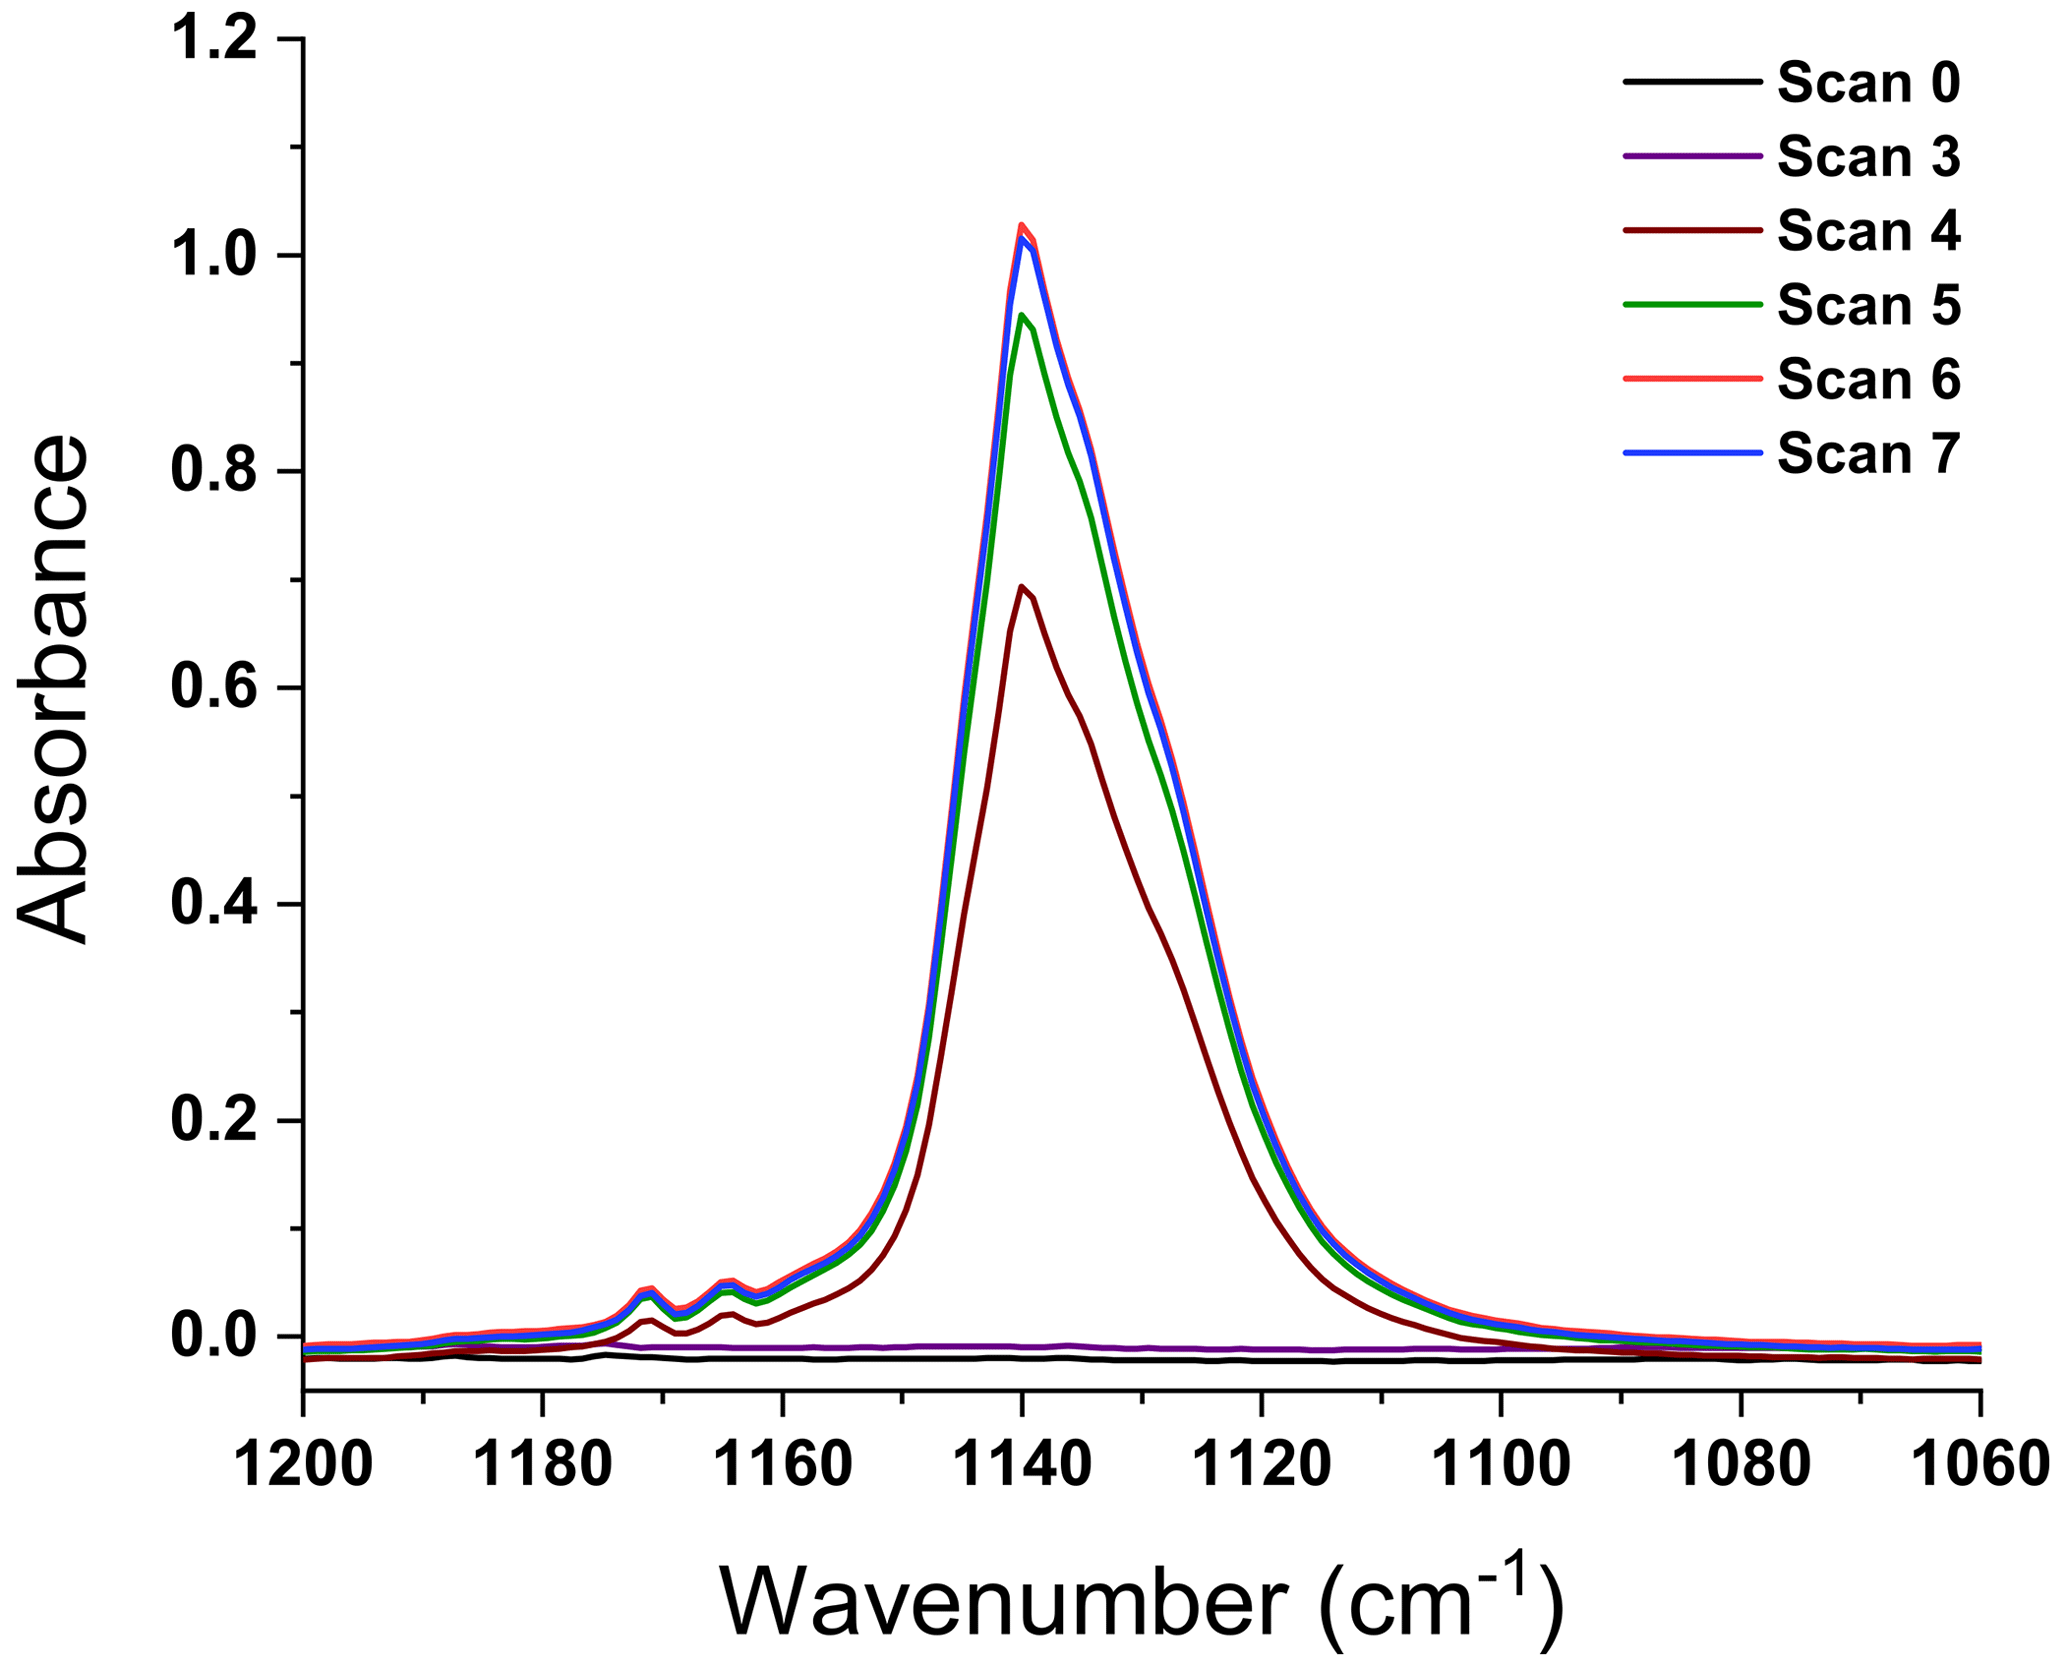
Figure 2Dynamic spectra recording the introduction of CFC-11 from the extractive probe to the gas cell. Scan 0 represents the start of spectral acquisition and freon release near the probe. Spectra were produced every 0.79 s. The first freon observation occurs with scan 4; maximal absorbance of CFC-11 and stabilization occur at scan 6.
2.4 Spectral analysis
A combination of software was used for the post-acquisition spectral analysis and confirmation of the species observed during the campaign. The MALT5 software (Griffith, 2016), utilizing both HITRAN line-by-line data (Gordon et al., 2017) and the PNNL 50 ∘C gas-phase reference spectra (Kochanov et al., 2019; Johnson et al., 2006, 2010) as input libraries, was used to identify and quantify vapor-phase chemicals in the spectra. Spectra were compiled into parameter files and analyzed by the MALT5 software using parameters including pressure, temperature, path length, resolution, and estimated initial values for chemical mixing ratios. The software generates a spectrum to simulate the measured spectrum by adjusting mixing ratios until the residual between the simulated and measured spectra is minimized. To confirm the species were actually present, each spectrum generated by MALT5 was input to OPUS and subtracted from the measured spectrum; the target compound was purposefully omitted from the subtraction process to visually inspect if the omitted compound was in fact present (see, e.g., Fig. 5).
3.1 Analysis of static spectra
A total of 10 spectra were recorded from different burns using the static mode with the gas cell valves closed simultaneously; gases were sampled prior to arrival of the flame front. A total of 29 compounds were detected and confirmed using MALT5 and OPUS 5.5. Along with CO, CO2, and nitrogen compounds, the gas-phase species are largely lightweight hydrocarbons (HCs), volatile organic compounds (VOCs), and oxygenated volatile organic compounds (OVOCs). Table 2 provides a summary of all compounds observed during the static measurements and is broken down into subcategories of chemical classes by rows labeled a–e, with ambient gases such as CO and CO2 in group a, alkanes and alkenes in group b, alcohols, aldehydes, and carboxylic acids in group c, aromatic species in group d, and N-bearing compounds in group e. The benefits of the in situ laboratory static measurements were controlled gas sample collection with FTIR analysis and longer scan times for increased SNRs at higher spectral resolution. Valves were shut before the flame front arrived, allowing for minimal mixing of air and flame gases near the extractive probe. In this manner the targeted pyrolysis phase was likely to be sampled with a greater mole fraction than that of the combustion phase. The gases listed in Table 2 have previously been observed in smoke in either field or laboratory settings, and some of them have been linked to pyrolysis (Scharko et al., 2019a, b; Burling et al., 2010, 2011; Christian et al., 2004; Gilman et al., 2015; Goode et al., 1999, 2000; Hatch et al., 2017; Selimovic et al., 2018; Stockwell et al., 2014; Yokelson et al., 1996, 1997; Akagi et al., 2013, 2014; Alves et al., 2010; Hurst et al., 1994a, b; Karl et al., 2007; Paton-Walsh et al., 2010). Compounds associated with the pyrolysis phase and observed in several of the static measurements include acetic acid, ethene (C2H4), allene, 1,3-butadiene, acetaldehyde, formic acid, formaldehyde, acrolein, benzene, furan, furaldehyde, naphthalene, and phenol.
Table 2Mixing ratio of chemicals from spectra collected using the static acquisition method. Burns are labeled by number and plant species. Mixing ratios are reported in parts per million (ppm) (with the exception of H2O and CO2 reported as percents) and categorized by (a) background ambient compounds, (b) simple hydrocarbons, (c) oxygenated organic compounds, (d) aromatics and furans, and (e) N-bearing species.
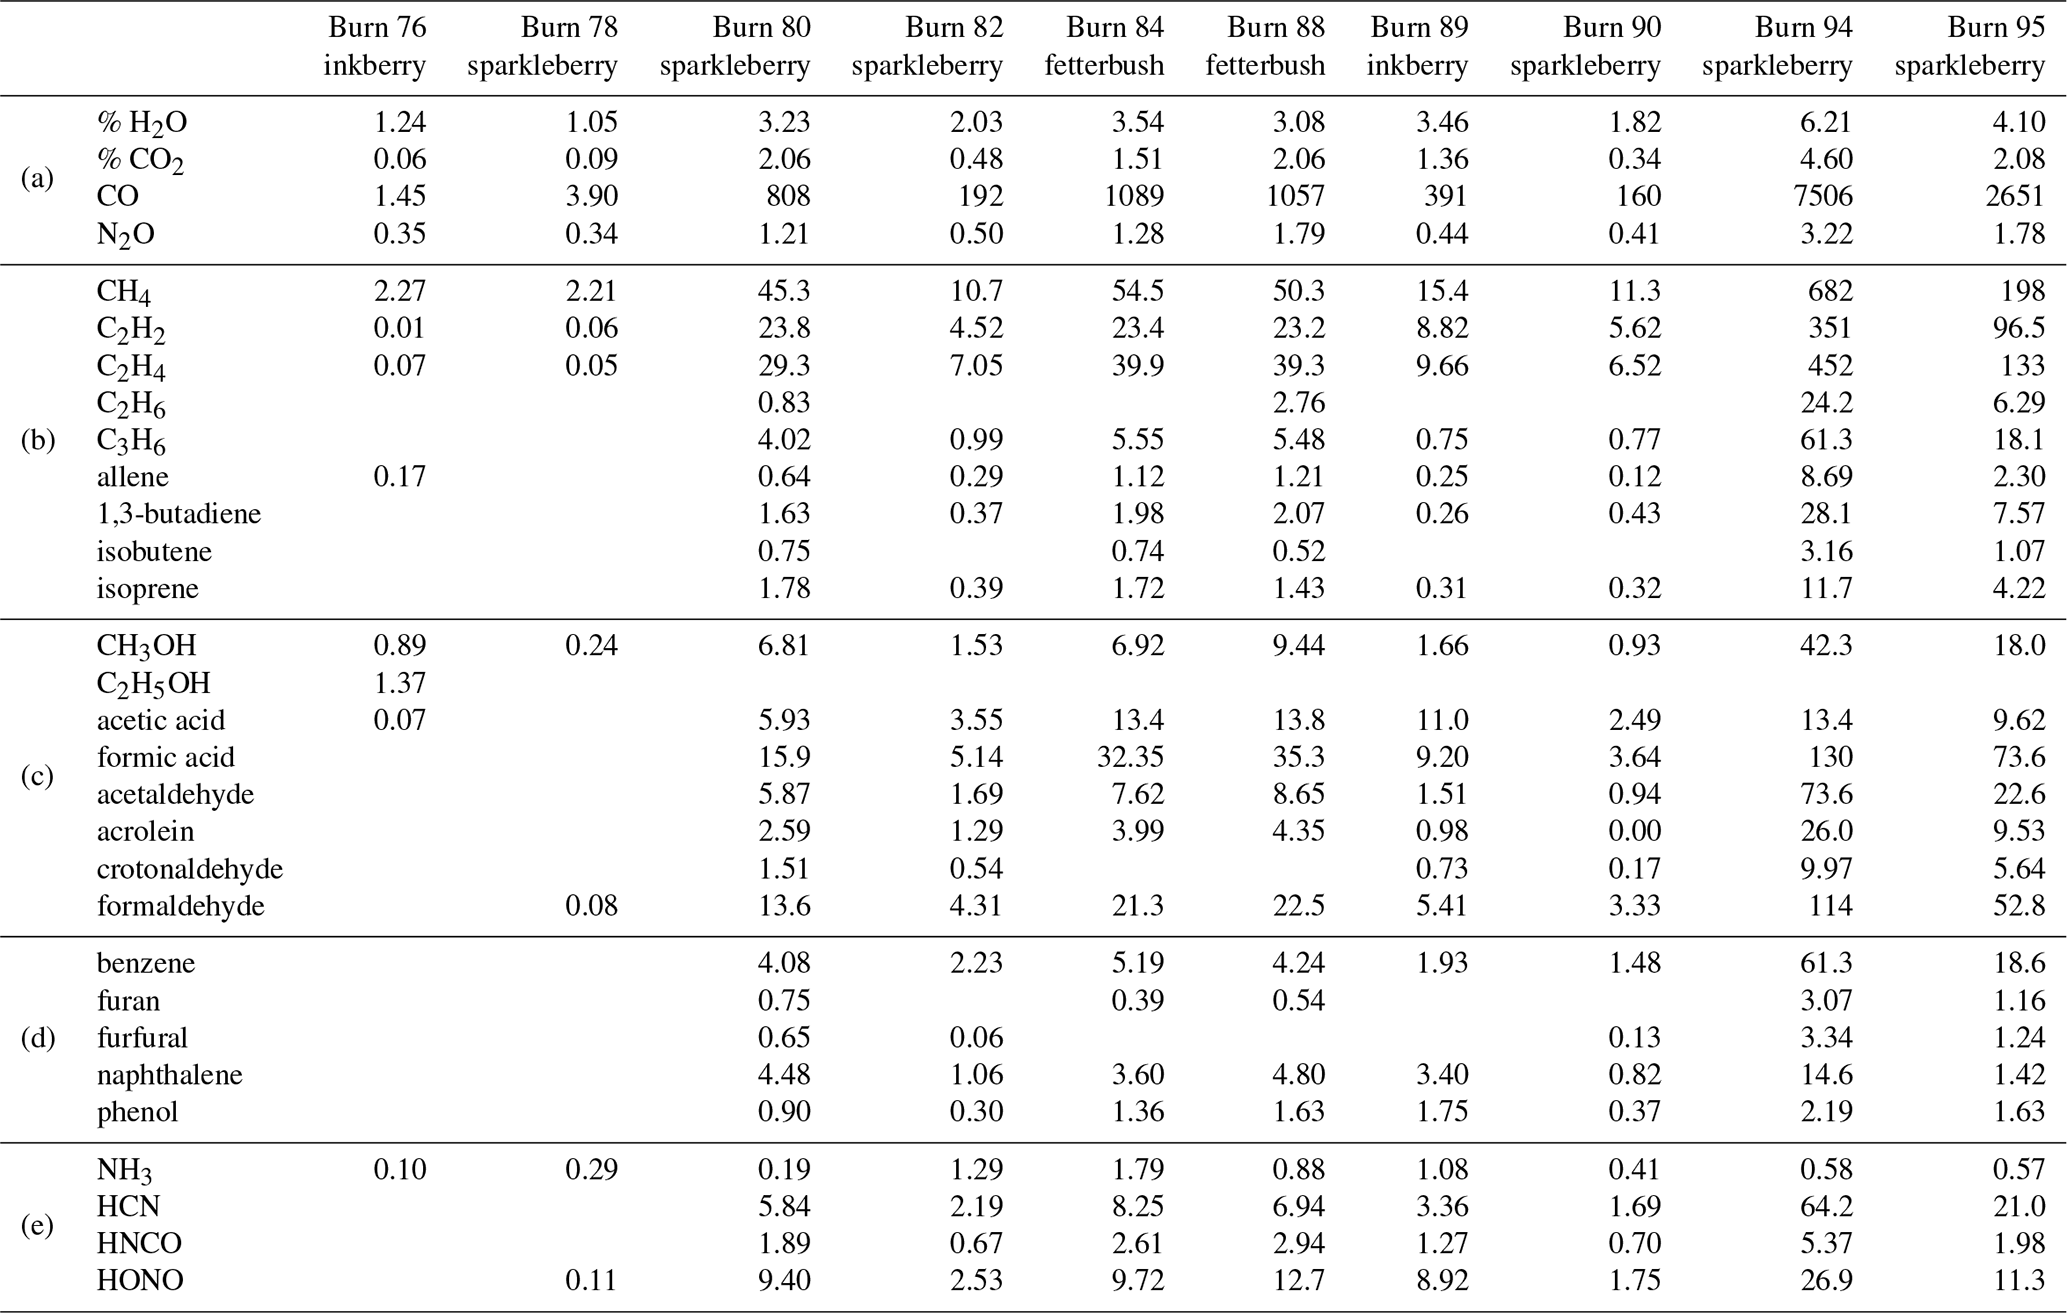
As seen in Table 2, ammonia gas (NH3) was also detected at fairly low mixing ratios in the laboratory-scale experiments, which had previously not been detected in the Ft. Jackson field study: the lack of NH3 detection in those studies was ascribed to the known adsorptivity of the compound as it may have adhered to either the transfer canister walls, the extractive probe, or the White cell, all at ambient temperatures as used in those studies (Scharko et al., 2019a; Roscioli et al., 2015; Stockwell et al., 2014; Yokelson et al., 2003; Neuman et al., 1999). Adhesion losses were minimized in the present experiments by (a) measuring the gas parcel directly without storage and (b) heating transfer lines and the gas cell to ∼55 ∘C.
When comparing the RFL laboratory-scale experiments to the 2018 Ft. Jackson field-scale experiments (Table 3), it is evident that field-scale values via the static mode are greater than those in the laboratory, even though the laboratory experiment attempted to replicate Ft. Jackson fuel beds and scenarios. In most cases, a comparison of compounds found in the RFL laboratory burns and the Ft. Jackson 2018 field burns finds Ft. Jackson mixing ratios approximately 4 to 10 times greater than those of the RFL 2018 tunnel data. Field-scale measurements typically yield more emissions than experiments conducted in the laboratory due to larger fuel quantities (Yokelson et al., 2013; Scharko et al., 2019b; Weise et al., 2015). However, while the mixing ratios may differ, the information describing the composition of the mixture is relative in nature and is contained in the log ratios of the various gases. Analysis of the data as compositional data (Aitchison, 1986), however, is beyond the scope of the present paper. Table 3 displays the minimum and maximum mixing ratio values in parts per million (ppm) for five compounds from the Ft. Jackson studies presented in Scharko et al. (2019a) versus the present RFL laboratory results. Of the five species compared, acetaldehyde, acrolein, and allene all follow the trend of having Ft. Jackson results being significantly higher than the RFL studies by a factor of ∼4. Naphthalene, a polycyclic aromatic hydrocarbon (PAH), was the only exception to this trend, having comparable mixing ratio values in the two studies. This anomaly could be attributed to one of naphthalene's pyrolysis formation routes as suggested by Fairburn et al., whereby a single ringed aromatic compound undergoes a Diels–Alder reaction of an alkene (Fairburn et al., 1990; Liu et al., 2017). Of the four compounds compared, naphthalene is the only one to be derived from a secondary reaction, whereas acetaldehyde and acrolein are derived directly from the pyrolysis of cellulose (Stein et al., 1983), and allene is a compound known to be a precursor of aromatic compounds and soot (Frenklach et al., 1983, 1988). As noted, most compounds detected in the RFL laboratory studies yielded mixing ratios ∼4 to 10 times lower compared to the field-scale studies at Ft. Jackson. Along with naphthalene, however, acetic acid, formaldehyde, isoprene, and isobutene were also found to have mixing ratios comparable to those reported in the Ft. Jackson studies. This could be due to the four compounds being products of secondary reactions or fragmentation of species such as lignin, xylan, and glucomannan (Collard and Blin, 2014). It should be noted that of the five novel compounds detected in Scharko et al. (2019b), only four were detected in these laboratory-scale experiments. Methyl nitrite was not observed (Table 3). This is attributed to the field experiment being on the Ft. Jackson base, where there is known to be unexploded ordinance (Scharko et al., 2019b), or possibly due to lower concentration levels that are below the detection limits of the present laboratory-scale experiment.
Table 3Calculated minimum and maximum mixing ratios (ppm) for the 10 canister measurements taken at Ft. Jackson (Scharko et al., 2019b), along with the minimum and maximum mixing ratios (ppm) for the 10 static measurements during the RFL laboratory experiment with acetaldehyde, acrolein, allene, methyl nitrite, and naphthalene.

It is clear that the static method as deployed was not perfect at either strictly isolating the pyrolysis-phase gases or capturing extremely high fractions of combustion gases. The method relied heavily on valves being closed prior to the flame front, typically using visual cues as opposed to using other techniques, e.g., thermal IR detection. While not readily visible to the human eye, radiant and convective heating (as determined by background-oriented Schlieren measurements – Aminfar et al., 2019) occurred well in advance of the flame front, suggesting this as a possible alternate visualization of pyrolysis gas release (Aminfar, 2019). In any case, there is a narrow temporal window for the pre-combustion phase, making the valve-close time extremely important. For example, spectra from Burns 76 and 78 largely show the detection of only ambient air compounds, indicating the valves were closed too early. Conversely, in other samples there is clearly some mixing of both upstream and downstream air before the gas enters the extractive probe. Despite the shortcomings of the static method, most of the attempts to obtain pre-combustion gases were successful as evidenced in part by the chemical composition of the isolated gases.
3.2 Spectral–thermal correlation to isolate pyrolysis phase
Dynamic IR data and visual image acquisition proved advantageous to resolve the different phases of the experiments (e.g., pyrolysis, flaming combustion, smoldering combustion). This was important since the modified combustion efficiency (MCE) is a function of the gas composition and is not unique to phase; i.e., the same value of MCE results if the same relative amounts of CO and CO2 are observed whether in the pyrolysis, flaming, or smoldering combustion phases. MCE, defined as , has been used many times to distinguish phases of combustion, namely flaming vs. smoldering, although Ward and Radke (1993) recommended combustion efficiency as the preferred descriptor of the combustion system. MCE has not been used to identify pyrolysis nor should it be for the non-uniqueness described previously. Recent studies have introduced more sophisticated techniques to analyze smoke emissions data with compositional data methods (Weise et al., 2020). However, since primary and secondary pyrolysis occurs both prior to and after the onset of combustion or oxidation, methods such as the MCE are not appropriate. We were not able to use the metric suggested by Sekimoto et al. (2018), namely high-temperature vs. low-temperature pyrolysis as determined from the acetylene-to-furan ratio, owing to weak furan signals in the present study due to shortened scan times. The analysis difficulty was further exacerbated because furan's strongest vibrational band, the ν19 vibrational band near 745 cm−1 corresponding to the C−H out-of-plane bend (Shimanouchi, 1972), was obscured by saturated carbon dioxide lines, and thus MALT was not able to generate a satisfactory fit for this microwindow.

Figure 3Burn 87 with inkberry on a longleaf pine needle fuel bed, with FLIR thermal imaging for burn progression. (a) Frame corresponding to FTIR scan 5 signaling the pre-combustion phase, (b) frame corresponding to FTIR scan 16 with the flame front nearing the sample probe, (c) frame corresponding to FTIR scan 21 with inkberry bush consumed by flame, and (d) frame corresponding to FTIR scan 44 in which the flame front has passed the probe. Dark circles are ceramic plant holders. The temperature scale is seen on the right axis.
The pre-flame arrival gases were identified by one of two methods: the first method involved a simple time subtraction of 4.8 s from the recording of the infrared spectrum time stamp and associating that time with the corresponding visual and thermal infrared video images (Fig. 3). This provided a relatively accurate verification that the gases being investigated were emitted prior to the onset of combustion as seen in Table 4. The second method used the FTIR spectra directly: demarcations for the flame front were denoted by the maximal value obtained for both CO and CO2 concentrations, i.e., the greatest fraction of gas from the combustion phase. From this value the FTIR scans were selected for pyrolysis corresponding to the ∼10 s before arrival (∼0.1 m distance) of the flame front.
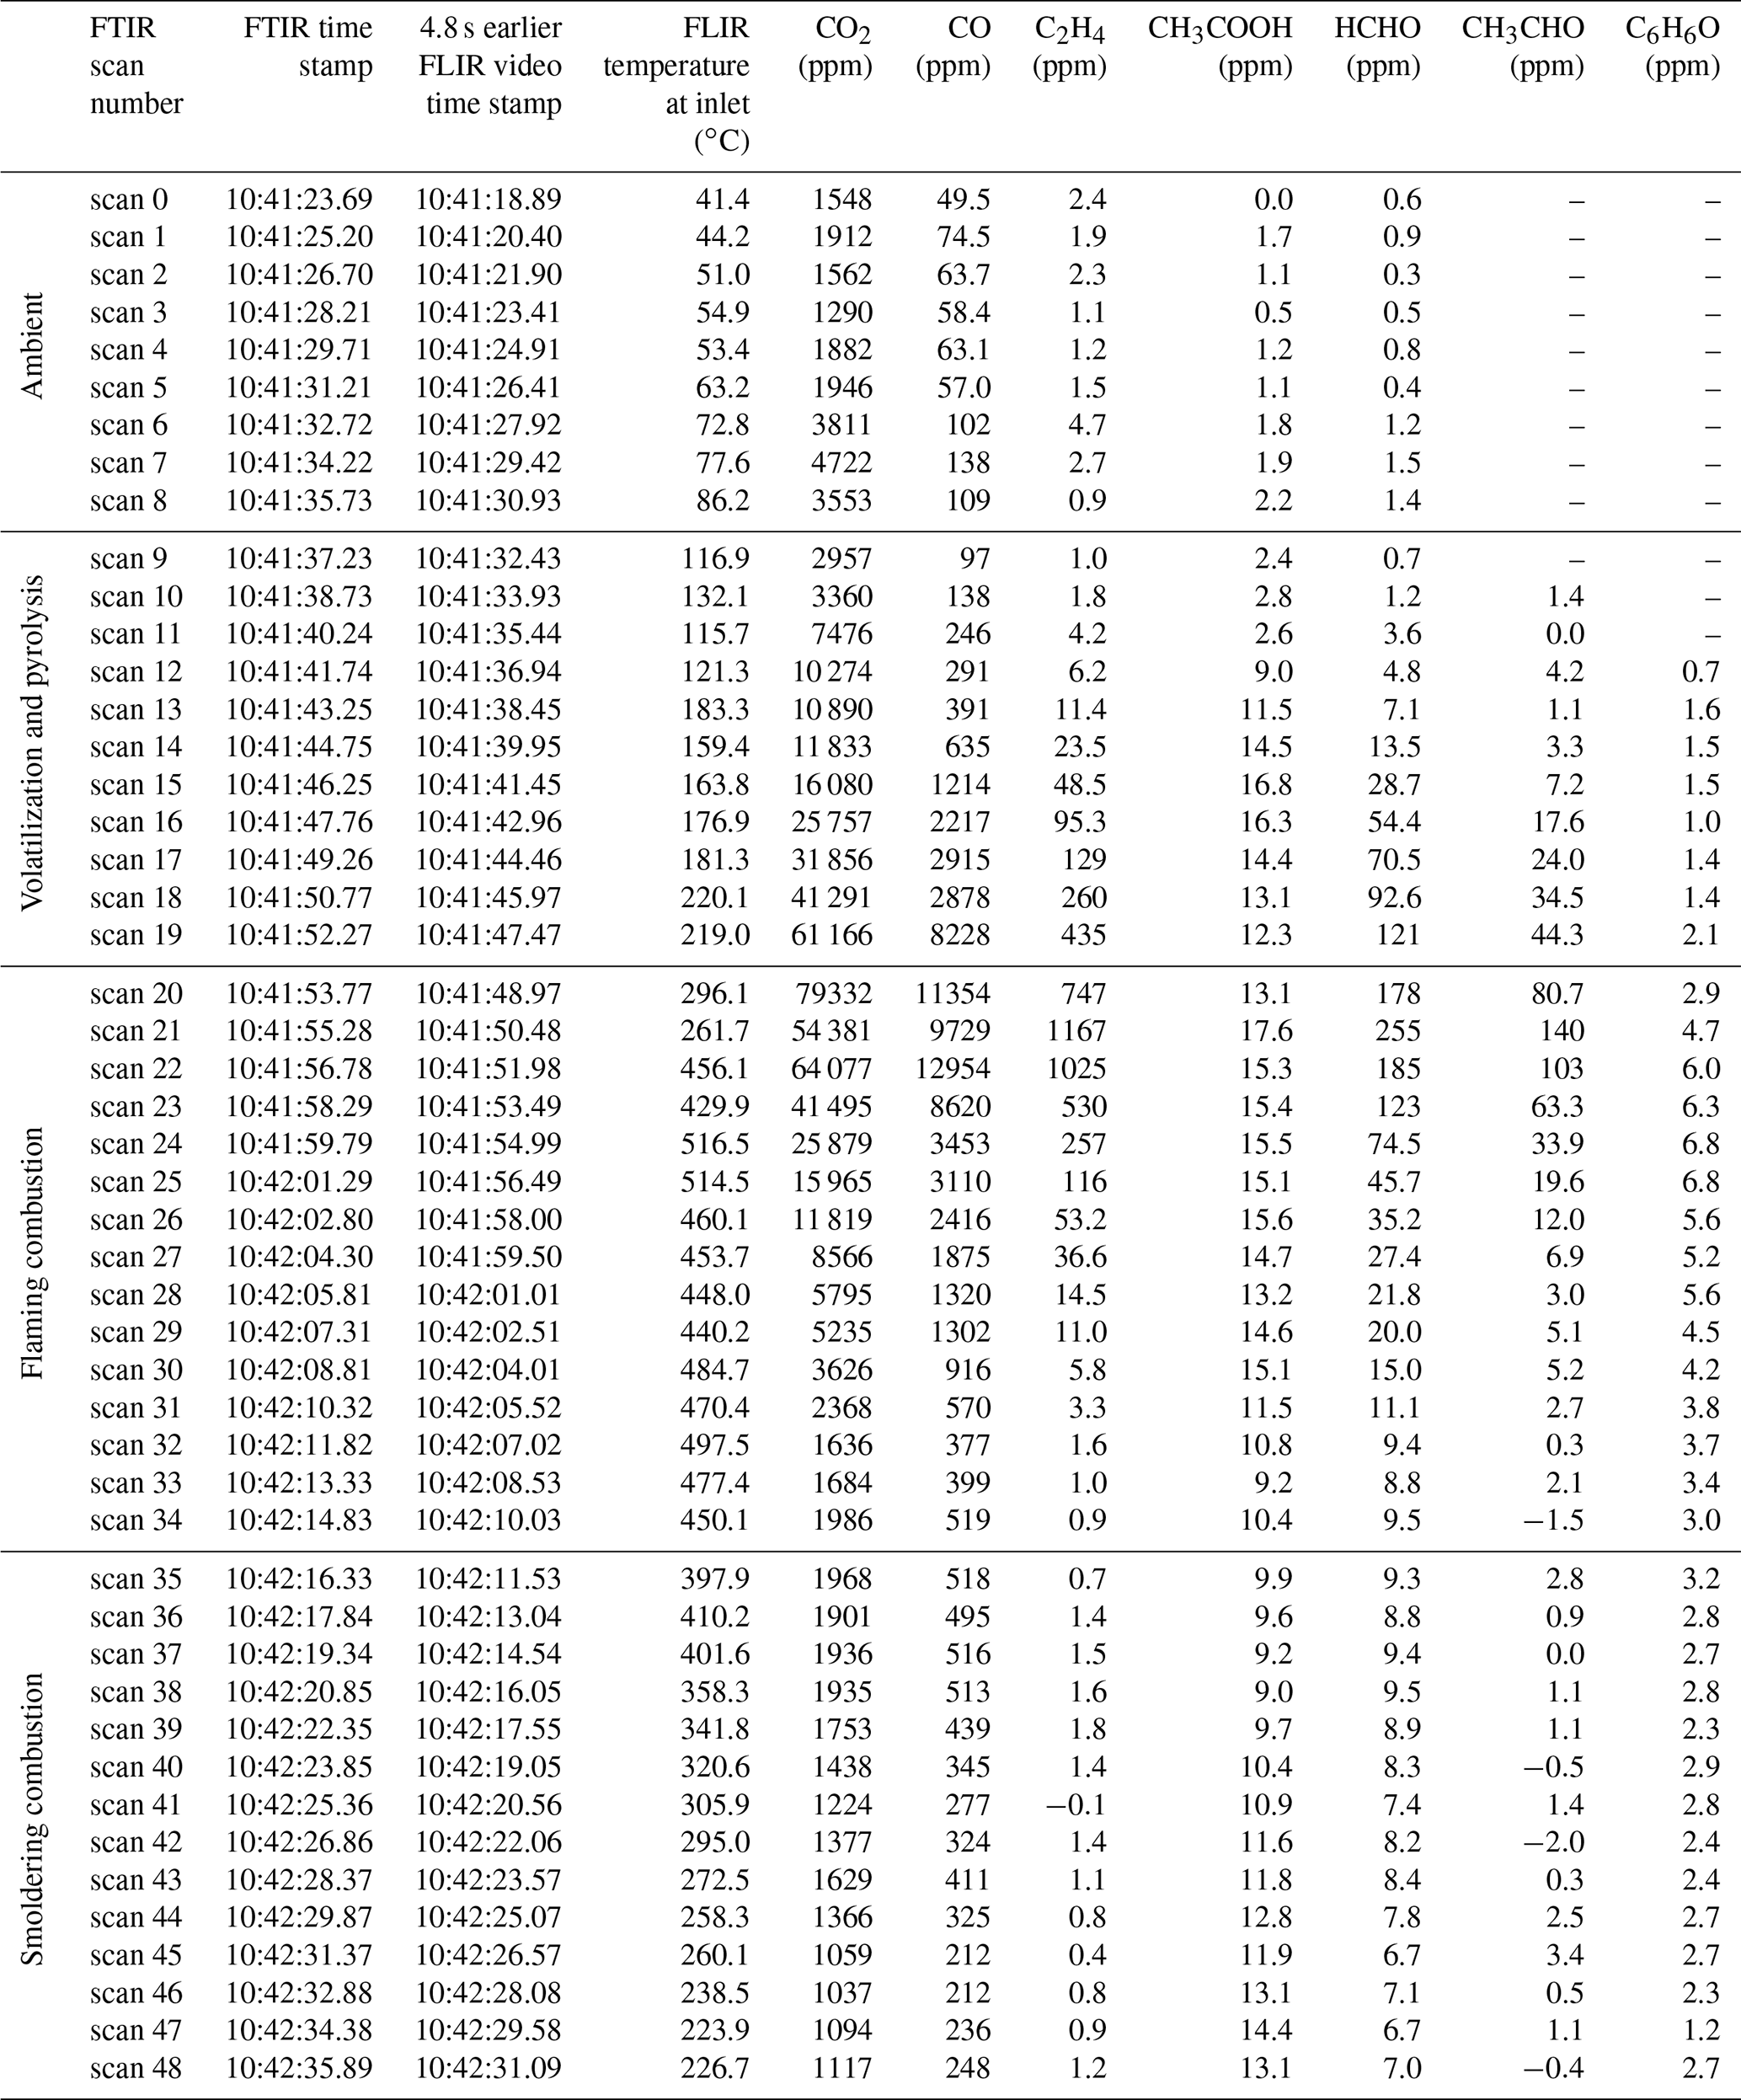
The FTIR time-resolved scans (including derived chemical mixing ratios) synchronized to the RFL time-stamped thermal IR temperature images provide insight into the chemical composition of each burn. As an example, Table 4 pairs data from the two systems for Burn 87. The FTIR scan number, FTIR time stamp, RFL forward-looking infrared (FLIR) recorded temperature near the extractive probe, and a selection of chemical concentrations are shown. The table demonstrates that spectral data for FTIR scans 0–8 saw no significant detections above ambient levels, as corroborated by the FLIR images displaying temperatures ranging from 40 to 80 ∘C (see Table 4 and Fig. 3a); the extractive probe is still in the low-temperature region. The gradual increase in mixing ratios for most compounds (excluding ammonia, which is primarily a smoldering gas) begins after FTIR scan 9. The magenta- and orange-colored domains seen in Fig. 3b indicate the encroaching flame front and a rise in thermal temperatures. The frames corresponding to FTIR scans 16–19 display IR temperatures between 175 and 220 ∘C. In this temperature range compounds associated with the pyrolysis phase such as acetaldehyde, acetic acid, and allene (shown in Table 4) are not only manifest in the IR spectra, but their mixing ratios also rise rapidly. Shortly thereafter the greatest mixing ratios of CO2 occur at scans 20 through 22, indicating the flaming stage; this is corroborated by thermal IR video of the inkberry plant beginning to be fully consumed in flames (Fig. 3c). As the flame front progressed down the tunnel, temperatures near the plant holder began to drop with the onset of the smoldering phase as indicated by lower mixing ratios and the thermal IR visual, as seen in Fig. 3d. (We note in Fig. 3 that the temperature directly near and/or above the holders is much cooler due to minimal pine needle cover and the plants being green.) The video stopped recording at scan 48, when the flame reached the end of the fuel bed, although the FTIR continued to collect interferograms to monitor smoldering from the fire.
Table 4Burn 87 with inkberry amongst a pine needle fuel bed FTIR scan summary synchronized to FLIR temperature data. Scan number, FTIR time stamp, and FLIR video emission temperature at the extractive probe accounting for time delays and mixing ratios from carbon dioxide (CO2), carbon monoxide (CO), ethene (C2H4), acetic acid (CH3COOH), formaldehyde (HCHO), acetaldehyde (CH3CHO), and phenol (C6H6O).
As stated, a second method was also used to analyze and/or corroborate the different stages of the burn, whereby mixing ratios of CO2, CO, and C2H4 were analyzed to find their burn maxima (Viatte et al., 2015). The CO2 elevated mixing ratios (esp. relative to CO) are associated with the hottest, flaming stage of biomass burns (Yokelson et al., 1996). To temporally isolate the flaming stage, the MCE criteria were employed, and values of 88 %–95 %, indicative of flaming, were found for the region. Having identified the flaming stage, the pyrolysis stage was estimated by subtracting 6–8 s from that spectrum with maximal CO/CO2 emissions, corresponding to approximately four FTIR scans (at 1 cm−1 resolution). The agreement between the two methods was quite good and helped to demarcate the stages as seen in Table 4.

Figure 4Burn 87 with inkberry and longleaf pine needles: (a) CO and CO2 spectral profile from 2250–2000 cm−1. Purple traces indicate the ambient stage, green and orange traces indicate the pre-combustion and pyrolysis stage, red spectral traces indicate the flaming stage, and blue traces indicate smoldering. (b) Largely C2H4 spectral waterfall plot from 1000–900 cm−1 with accompanying C2H4 reference spectrum as a black trace.
Figure 4 displays the infrared spectral progression of Burn 87 in longleaf pine needles with inkberry at 1.0 cm−1 resolution looking at two different spectral regions. The CO (and CO2) profiles are seen in Fig. 4a. Noted on the z axis is scan 22; scans 20–22 are the time frames wherein maximal CO2 and CO emissions were observed. The region is also denoted by red spectral traces. Once the flaming stage had been identified, the pyrolysis phase was then demarcated. In the pyrolysis phase CO was evident (partially from upwind mixing) and was beginning to significantly increase; the stage is indicated by orange traces (scans 16–19) in Fig. 4. Other stages assigned were noted as the pre-flame stage wherein ΔCO and ΔCO2 were near zero in the FTIR data and are seen as scans 0–8 with purple traces. Blue traces correspond to the smoldering phase of combustion, wherein CO2 mixing ratios decreased, the flame front had passed the extractive probe, and MCE values were on the order of 85 %–75 %. The spectral profile and mixing ratios of ethene (C2H4) were also used to evaluate the time-resolved FTIR data (Johnson et al., 1993). This lightweight hydrocarbon is a product of primary pyrolysis and, if detected, can be used to determine certain stages of the burn (e.g., Yang et al., 2007). Figure 4b primarily displays the ν7 band of ethene at 949.4 cm−1 (Shimanouchi, 1972). Ethene reached its maximal mixing ratio at scan 22 (red traces) before it quickly disappeared, being a pyrolysis gas that was oxidized by the flame. It was first seen to appear as early as scan 13 (green traces) but became clearly evident in scan 16 (orange traces, pyrolysis phase) and continued to grow. The rapid disappearance of C2H4 upon combustion is similar to that of formaldehyde and acetaldehyde (Table 4), whose concentrations also dropped after scan 23, but the disappearance is juxtaposed with acetic acid, whose values remained approximately constant throughout the flaming and smoldering phases. As seen in the IR data, the C2H4 gas signal corroborated that ethene is a key product of the primary pyrolysis phase. Other compounds showing significant signals in this time domain and described as pyrolysis gases include acrolein and allene (Scharko et al., 2019a; Akagi et al., 2013; Frenklach et al., 1983, 1988; Stein et al., 1983; Koss et al., 2018; Brilli et al., 2014).
The two methods to determine the pyrolysis, flaming combustion, and smoldering phases yielded congruent results: the isolated burn stages determined from method one, in which FTIR gas-phase data were synchronized to the FLIR thermal imaging, and from method two, using the FTIR time-resolved data only, were found to be virtually identical. This is evidenced by linking the scans determined to be in the pyrolysis phase (scans 16–19) using method two as seen in Fig. 4, with the temperature data recorded by the FLIR using method one and seen in Table 4. For these scans, the temperature profile ranges from 175–220 ∘C, corresponding to temperatures associated with the first stages of pyrolysis.
For most analyte biomass burning gas mixing ratios, the concentration values observed at the peak of the dynamic measurement values were significantly greater than for the concentrations recorded in the static measurements. The dynamic experiments were of course carried out for the duration of the burn, whereas the static burns (in an effort to characterize pre-combustion phases) attempted to isolate a specific time when the pyrolyzate concentrations were maximized. Analyzing the data using the dynamic technique allowed for confirmation of certain compounds such as naphthalene, allene, acetaldehyde, and acrolein as compounds that appeared during the pyrolysis phase. These compounds, which have been previously detected as pyrolysis gases using FTIR for field plot burns (Scharko et al., 2019b), were again observed during these laboratory-scale tests and in almost all cases appeared before the flame front encroached on the sampling probe.
3.3 Dynamic detection of phenol in pre-combustion through smoldering stages
In the present study phenol (C6H6O) was detected during several burns; its origin is ascribed to the pyrolysis of lignin(s) (Kibet et al., 2012; Hawthorne et al., 1989), and it has mostly been observed using other techniques such as gas chromatography mass spectrometry (GC-MS; Saiz-Jimenez and de Leeuw, 1986). Phenol and phenolic compounds are also known to contribute to the formation of secondary organic aerosols (Yee et al., 2013). Phenol has been observed in simple pyrolysis experiments emanating from both pine and spruce species (e.g., Saiz-Jimenez and de Leeuw, 1986; Ingemarsson et al., 1998). In addition to simply pyrolytic emissions, phenol has also been identified as a common component of tar as a pyrolysis product. In biomass burning, phenol has been observed using both FTIR and other methods, (Gilman et al., 2015; Yokelson et al., 2013), e.g., proton-transfer mass spectrometry (PTR-MS) and GC-MS. In 2013 phenol was detected in a closed-cell, airborne FTIR field experiment but not in an open-path FTIR lab experiment (Yokelson et al., 2013). The absence of C6H6O in the lab experiment was attributed to the lack of consumption of rotten wood as fuel. In those studies, airborne phenol emissions measured in the field with closed-cell FTIR were also noted as being 2 to 4 times greater than the phenol emissions captured by PTR-MS in the laboratory.
Compositional analysis of inkberry, fetterbush, and longleaf pine needles used in the present study showed that the fuels contained 23 % to 30 % structural lignin in the foliage and 3 % to 9 % phenols (Matt et al., 2020). Note that none of the fuels in the wind tunnel experiments or the bench-scale experiments contained rotten wood. In the present experiments, phenol was detected in 8 of the 10 static measurements (recall that two of the static measurements only showed ambient gases due to early closure of the valves). Figure 5 demonstrates the static spectrum from Burn 89, corresponding to the burning of longleaf pine with inkberry. Seen in Fig. 5 are the experimental spectrum (blue trace) and also the reference spectrum of acetic acid (green trace). After subtraction of the CH3COOH vapor spectrum, the residual contained two small peaks that were readily identified as phenol vapor via the ν15 vibrational band near 1176.2 cm−1 and the ν16 band at 1150.2 cm−1 (Keresztury et al., 1998). The phenol reference spectrum from the PNNL spectral library (red trace) was then subtracted from that residual (purple trace) with an overall residual that is mostly noise (black trace). For the dynamic spectra the process is repeated for each of the individual spectral time slices, represented by the scan number, using the concentration of phenol determined by the MALT program. To confirm the spectral analysis, in each case the mixing ratio calculated by MALT was converted to a spectrum by multiplying by the appropriate concentration path length factor; the predicted spectrum was visually compared to the actual data.

Figure 5Static spectrum obtained from Burn 89 (1 kg of longleaf pine needles with inkberry). The blue trace is the FTIR experimental spectrum, the green trace the reference spectrum of acetic acid, the purple trace the residual after acetic acid subtraction, the red trace the reference spectrum of phenol, and the black trace the residual after both acetic acid and phenol subtraction.
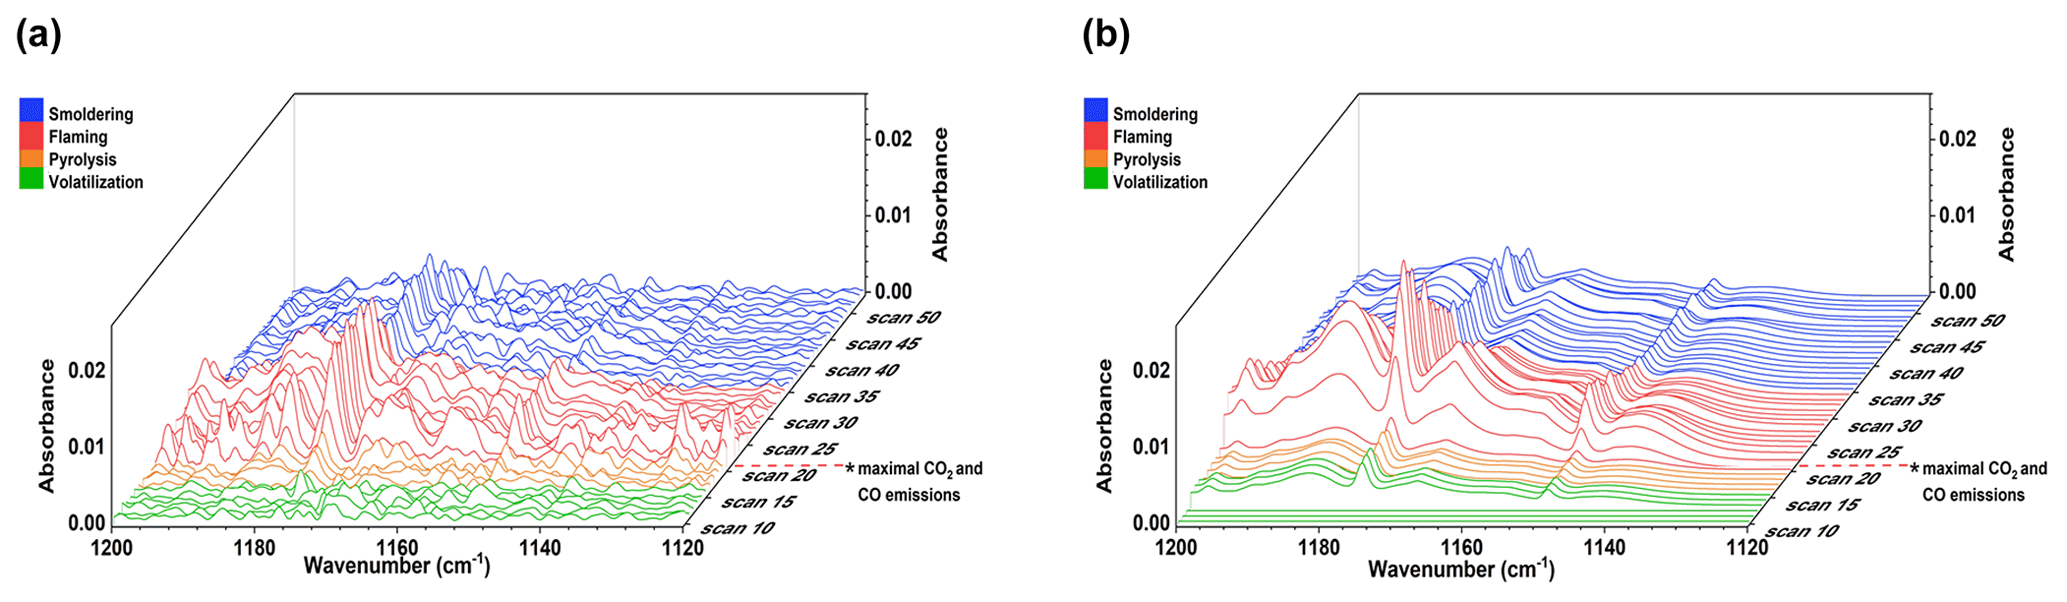
Figure 6Burn 87 – longleaf pine needles with an inkberry fuel bed during the dynamic mode. Measured and scaled burn spectra showing the progression of phenol during the time-resolved study. Acetic acid and water spectral features have been removed in (a), with the phenol-only derived mixing ratio spectra in (b).
Phenol was also detected using the dynamic method, and Fig. 6 displays a series of dynamic spectra recorded for Burn 87. The spectra in the left frame (a) are individual spectra after the acetic acid (CH3COOH) spectral component has been subtracted from the spectrum for each time slice, all recorded at 1.0 cm−1 resolution with 54 total measurements recorded at Δt=1.5 s. While the spectral noise is still significant, the presence of phenol peaks, particularly the ν16 Q-branch at 1176.5 cm−1 and the ν15 peak at 1150.2 cm−1, is evident. Optimization for the phenol mixing ratio in each spectrum allowed for its calculation in individual time slices, and the derived phenol-only spectra are presented as a waterfall plot in the right frame (b). The first clear evidence of phenol is seen in scans 14 to 18, before reaching a maximum concentration of 6.9 ppm in scan 24; this is observed in the right frame of Fig. 6, approximately coinciding with the maximal CO2 concentration (scan 22), indicating the greatest ratio of smoke to ambient air in the gas cell.
Figure 6 displays the rapid increase in phenol vapor due to the approaching flame front from scan 14 (t=22.5 s) to its maximal mixing ratio in scan 24 (t=36 s), followed by a longer gradual phenol decay with time. This can be juxtaposed with the ethene mixing ratios (seen in Fig. 4) that fall to nearly zero with the onset of combustion; the ethene is consumed by the flame propagation. Prior to scan 14 in Fig. 6b, minimal phenol is observed relative to the noise level and is thus fit as zero concentration. Phenol contributions for scans 16–19 can be associated with the pyrolysis phase of the burn and not combustion. Phenol is one of the major products of 1,2-benzenediol pyrolysis, with a maximum yield reported at 800 ∘C (Ledesma et al., 2002; Thomas et al., 2007). It is important to note that both temperature and the rate of heating influence the composition and yield of pyrolysis products. As is evident in Fig. 3, the thermal imaging associated with FTIR scan 17 shows a temperature of ∼200 ∘C, which is indicated in Kibet et al. (2012) to be within the temperature range of pyrolysis of lignin: 200 to 400 ∘C. Shortly thereafter, phenol mixing ratios rapidly increase and reach a maximal mixing ratio of 6.9 ppm at scan 24. At scan 24 the flame front has already reached the extractive probe, and thus the maximum intake of smoke and ambient air is achieved; the temperature of the fuel bed is ca. 600 ∘C, consistent with the flaming phase. The gradual decay in phenol production as the flame front passes could be due to several factors: (i) an increased temperature required for complete combustion of the C6H6O (ii) residence time of phenol, (iii) phenol production in the smoldering phase as a tar–char, or (iv) adsorption to the walls of the stainless-steel tubing and cell. A cross section of Fig. 6 shows the rapid onset of phenol production at given temperatures, followed by a gradual decay in concentration: this is indicative of phenol production throughout the burning of inkberry as a species.
The shape of the temporal profile yields information as to the production of phenol throughout the evolution of burning. Figure 7 shows the progression of the phenol concentration following its first observed presence in the burn for three different species. These graphs are effectively a cross section of Fig. 6, showing the progression of the height of the phenol peak (directly correlated with the phenol concentration) throughout the burn (with time being represented by the scan number in both cases). The level of phenol generation was observed to vary between plant species. Temporal profiles of the phenol concentration were constructed for burns with three different species: sparkleberry, inkberry, and fetterbush. These plots illustrate a range of behavior, with inkberry and sparkleberry having similar temporal profiles and similar maxima of ca. 6.5 ppm and fetterbush having a different temporal profile. It is important to note that Burn 97 (sparkleberry) was measured at 0.6 cm−1, while Burns 87 and 93 were measured at 1.0 cm−1, although the profile of Burn 97 is consistent with that of Burn 87. That is to say, we do not believe the small change in resolution affects the recovered mixing ratios. Demonstrated in Fig. 7, trace amounts of phenol appear at the onset of combustion and throughout the pyrolysis phase. Phenol reaches its highest concentrations, however, during the flaming stage as all three temporal profiles reach a maximum during the latter stages of the burn. Moreover, phenol remains throughout the duration of the burn and is not consumed by secondary reactions, as is, e.g., ethene. For these burns, fetterbush was observed to have the lowest maximum concentration of phenol, only 3.1 ppm, for the three species, while sparkleberry and inkberry had similar maxima (as well as similar temporal profiles).
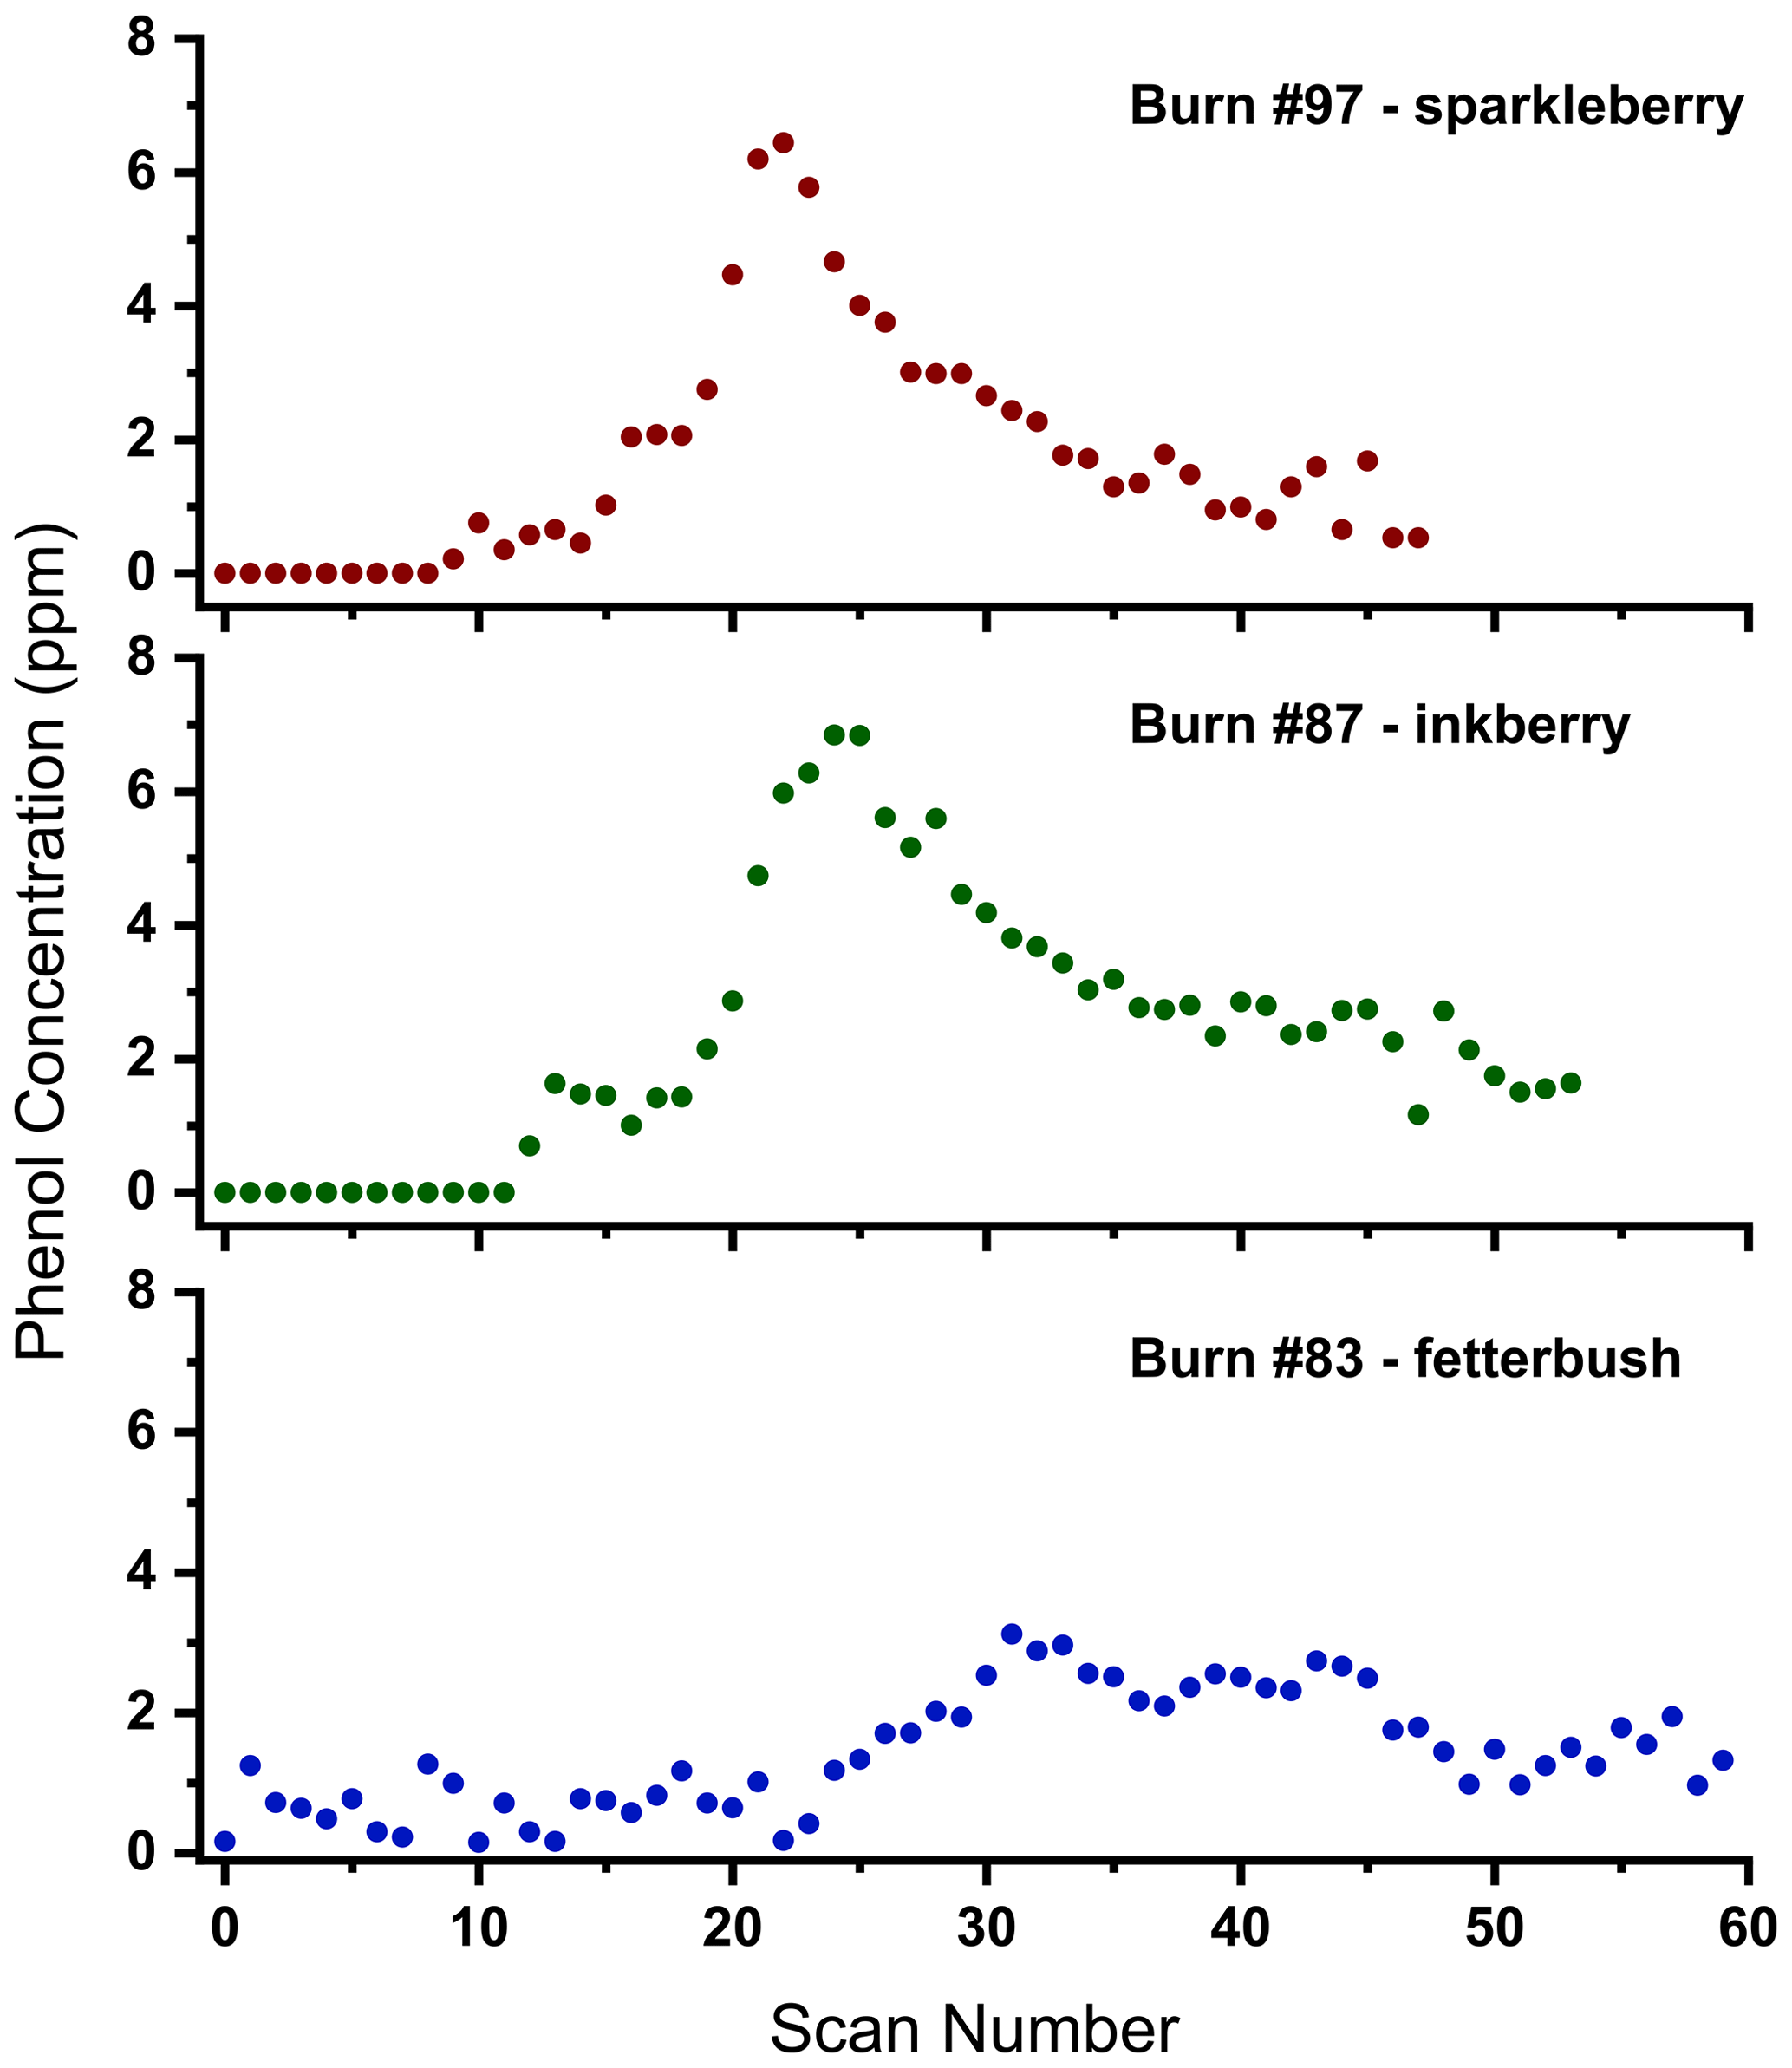
Figure 7Temporal mixing ratios of phenol for different shrub species. Phenol mixing ratios plotted over time are indicated by the scan number for Burn 97 with sparkleberry (red), Burn 87 with inkberry (green), and Burn 20 with fetterbush (blue), all on a longleaf pine straw bed.
The observed differences in phenol for both the temporal profile and overall peak concentrations could arise due to differences in leaf structure and shape or possibly due to differences in leaf and plant composition. Pyrolytic production of phenol has been previously attributed to multiple components of plant composition, including phenol content, lignin content, and the amount of cellulose in each plant species. Therefore, varying phenols, lignin, and cellulose in these plant species could be the source of phenol concentration variability for each burn. The physical composition of multiple plant species, including inkberry and fetterbush, was analyzed by Matt et al. (2020); it was shown that inkberry has 2.6 times the percentage of phenol by composition (9.0 %) as fetterbush (3.4 %). Although sparkleberry was not included in that study, it can be suggested that the compositions of inkberry and sparkleberry are similar due to the observed phenol in this experiment as well as plant characteristics. Sparkleberry is a member of the Vaccinium genus, which contains many species collectively known as blueberries that are known to contain high levels of phenolic compounds in the fruits (e.g., Prior et al., 1998). This study and the results of Matt et al. (2020) support the present hypothesis that peak concentrations of phenol are the highest for sparkleberry and inkberry due to higher phenolic content in the plants.
The analytical methods used in this study attempt to provide a detailed view of prescribed burning by enlisting two different FTIR acquisition modes, static and dynamic. By capturing a “snapshot” of a single burn experiment used in the static method, one can discern the gases with higher specificity and in turn decipher complex spectra through the use of chemometrics to extract compounds with high concentrations, leaving behind a residual to be analyzed. Lower resolution may hinder these efforts and allow compounds that are present at lower mixing ratios to be obscured by more strongly absorbing compounds, e.g., carbon dioxide, water, and ethene. In this study we were able to detect additional compounds, e.g., phenol, benzene, and allene, with greater confidence. However, in gaining specificity there is a loss of time resolution, and this is where the dynamic method becomes advantageous. The FTIR dynamic acquisition method when synchronized to thermal imaging, while lower in sensitivity, allows for an overall profile of the burn and can help assign phases to the dynamic stages of the pyrolysis and combustion. That is, the dynamic method in conjunction with thermal IR imaging provides a more detailed description as temperature and chemical composition profiles can be correlated with and assigned to certain phases of the burns. In this study pyrolysis, flaming, and smoldering combustion were identified using these new techniques, which can aid in the improvement of fire behavior models used by land managers to conduct prescribed fires.
Data are not publicly available as data release has not been authorized by the sponsor of this research.
CAB, ONW, DRW, TLM, and TJJ contributed to the writing of this paper. CAB, AMB, RGT, and TLM set up instrumentation and recorded infrared data. CAB, AMB, and ONW provided data processing and analysis. JC provided thermal imaging and videography. DRW and TJJ were the project managers.
The authors declare that they have no conflict of interest.
This work was supported by the Department of Defense's Strategic Environmental Research and Development Program (SERDP) within project RC-2640, and we gratefully acknowledge our sponsors for their support. PNNL is operated for the US Department of Energy by the Battelle Memorial Institute under contract DE-AC05-76RL01830.
This research has been supported by the Strategic Environmental Research and Development Program (grant no. RC-2640).
This paper was edited by Daniela Famulari and reviewed by three anonymous referees.
Agee, J. K.: Fire and pine ecosystems, in Ecology and Biogeography of Pinus, edited by: Richardson, D. M., Cambridge University Press, Cambridge, UK, 193–218, 2000.
Aitchison, J.: The statistical analysis of compositional data, Chapman and Hall, London, New York, USA, 1986.
Akagi, S. K., Yokelson, R. J., Burling, I. R., Meinardi, S., Simpson, I., Blake, D. R., McMeeking, G. R., Sullivan, A., Lee, T., Kreidenweis, S., Urbanski, S., Reardon, J., Griffith, D. W. T., Johnson, T. J., and Weise, D. R.: Measurements of reactive trace gases and variable O3 formation rates in some South Carolina biomass burning plumes, Atmos. Chem. Phys., 13, 1141–1165, https://doi.org/10.5194/acp-13-1141-2013, 2013.
Akagi, S. K., Burling, I. R., Mendoza, A., Johnson, T. J., Cameron, M., Griffith, D. W. T., Paton-Walsh, C., Weise, D. R., Reardon, J., and Yokelson, R. J.: Field measurements of trace gases emitted by prescribed fires in southeastern US pine forests using an open-path FTIR system, Atmos. Chem. Phys., 14, 199–215, https://doi.org/10.5194/acp-14-199-2014, 2014.
Alves, C. A., Gonçalves, C., Pio, C. A., Mirante, F., Caseiro, A., Tarelho, L., Freitas, M. C., and Viegas, D. X.: Smoke emissions from biomass burning in a Mediterranean shrubland, Atmos. Environ., 44, 3024–3033, 2010.
Aminfar, A., Cobian-Iñiguez, J., Ghasemian, M., Espitia, N. R., Weise, D. R., and Princevac, M.: Using background-oriented schlieren to visualize convection in a propagating wildland fire, Combust. Sci. Technol., 5, 1–21, https://doi.org/10.1080/00102202.2019.1635122, 2019.
Aminfar, A.: Application of Computer Vision to Transport Phenomena, PhD, University of California, Riverside, USA, 2019.
Amini, E., Safdari, M.-S., DeYoung, J. T., Weise, D. R., and Fletcher, T. H.: Characterization of pyrolysis products from slow pyrolysis of live and dead vegetation native to the southern United States, Fuel, 235, 1475–1491, https://doi.org/10.1016/j.fuel.2018.08.112, 2019.
Barbour, M. G. and Billings, W. D. (Eds.): North American terrestrial vegetation, 2nd ed., Cambridge University Press, Cambridge, UK, 2000.
Behm, A., Duryea, M. L., Long, A. J., and Zipperer, W. C.: Flammability of native understory species in pine flatwood and hardwood hammock ecosystems and implications for the wildland–urban interface, Int. J. Wildland Fire, 13, 355–365, https://doi.org/10.1071/WF03075, 2004.
Biswell, H. H.: Prescribed burning in California wildlands vegetation management, University of California Press, Berkeley, CA, USA, pp. 255, 1989.
Brilli, F., Gioli, B., Ciccioli, P., Zona, D., Loreto, F., Janssens, I. A., and Ceulemans, R.: Proton Transfer Reaction Time-of-Flight Mass Spectrometric (PTR-TOF-MS) determination of volatile organic compounds (VOCs) emitted from a biomass fire developed under stable nocturnal conditions, Atmos. Environ., 97, 54–67, 2014.
Burgan, R. E. and Susott, R. A.: Influence of sample processing techniques and seasonal variation on quantities of volatile compounds of gallberry, saw-palmetto and wax myrtle, Int. J. Wildland Fire, 1, 57–62, https://doi.org/10.1071/WF9910057, 1991.
Burling, I. R., Yokelson, R. J., Griffith, D. W. T., Johnson, T. J., Veres, P., Roberts, J. M., Warneke, C., Urbanski, S. P., Reardon, J., Weise, D. R., Hao, W. M., and de Gouw, J.: Laboratory measurements of trace gas emissions from biomass burning of fuel types from the southeastern and southwestern United States, Atmos. Chem. Phys., 10, 11115–11130, https://doi.org/10.5194/acp-10-11115-2010, 2010.
Burling, I. R., Yokelson, R. J., Akagi, S. K., Urbanski, S. P., Wold, C. E., Griffith, D. W. T., Johnson, T. J., Reardon, J., and Weise, D. R.: Airborne and ground-based measurements of the trace gases and particles emitted by prescribed fires in the United States, Atmos. Chem. Phys., 11, 12197–12216, https://doi.org/10.5194/acp-11-12197-2011, 2011.
Bytnerowicz, A., Arbaugh, M. A., Andersen, C. K., and Riebau, A. R. (Eds.): Wildland fires and air pollution, Elsevier, Amsterdam, the Netherlands, Boston, USA, 2009.
Carter, M. C. and Foster, C. D.: Prescribed burning and productivity in southern pine forests: a review, For. Ecol. Manag., 191, 93–109, 2004.
Christensen, N. L.: Vegetation of the Southeastern Coastal Plain, in North American Terrestrial Vegetation, edited by: Barbour, M. G. and Billings, W. D., Cambridge University Press, New York, NY, USA, 397–448, 2000.
Christian, T. J., Kleiss, B., Yokelson, R. J., Holzinger, R., Crutzen, P. J., Hao, W. M., Shirai, T., and Blake, D. R.: Comprehensive laboratory measurements of biomass-burning emissions: 2. First intercomparison of open-path FTIR, PTR-MS, and GC-MS/FID/ECD, J. Geophys. Res.-Atmos., 109, D02311, https://doi.org/10.1029/2003JD003874, 2004.
Chi, C. T., Horn, D. A., Zanders, D. L., Opferkuch, R. E., Nyers, J. M., Pierovich, J. M., Lavdas, L. G., McMahon, C. K., Nelson Jr., R. M., Johansen, R. W., and Ryan, P. W.: Source Assessment: Prescribed Burning, State of the Art, Environmental Protection Technology, United States Environmental Protection Agency, Research Triangle Park, NC, USA, available at: https://nepis.epa.gov/ (last access: 5 March 2021), 1979.
Cohen, S., Hall, J., and Hiers, J. K.: Fire Science Strategy, Strategic Environmental Research and Development Program, Resource Conservation and Climate Change Program Area, Washington, DC, USA, available at: https://serdp-estcp.org/content/download/30210/291748/file/Fire{%}20Science{%}20Strategy.pdf (last access: 5 March 2021), 2014.
Collard, F. X. and Blin, J.: A review on pyrolysis of biomass constituents: Mechanisms and composition of the products obtained from the conversion of cellulose, hemicelluloses and lignin, Renew. Sustain. Energy Rev., 38, 594–608, 2014.
Crutzen, P. J. and Goldammer, J. G. (Eds.): Fire in the environment: the ecological, atmospheric, and climatic importance of vegetation fires: report of the Dahlem Workshop, held in Berlin, 15–20 March 1992, Wiley, Chichester, UK, New York, USA, 1993.
Depew, C. A., Mann, M. J., and Corlett, R. C.: A laboratory simulation of wood pyrolysis under field conditions, Combust. Sci. Technol., 6, 241–246, https://doi.org/10.1080/00102207208952326, 1972.
Di Blasi, C.: Modeling chemical and physical processes of wood and biomass pyrolysis, Prog. Energy Combust. Sci., 34, 47–90, https://doi.org/10.1016/j.pecs.2006.12.001, 2008.
Dimitrakopoulos, A. P.: Thermogravimetric analysis of Mediterranean plant species, J. Anal. Appl. Pyrolysis, 60, 123–130, https://doi.org/10.1016/S0165-2370(00)00164-9, 2001.
Fairburn, J. A., Behie, L. A., and Svrcek, W. Y.: Ultrapyrolysis of n-hexadecane in a novel micro-reactor, Fuel, 69, 1537–1545, 1990.
Frenklach, M., Taki, S., Durgaprasad, M. B., and Matula, R. A.: Soot formation in shock-tube pyrolysis of acetylene, allene, and 1,3-butadiene, Combust. Flame, 54, 81–101, 1983.
Frenklach, M., Yuan, T., and Ramachandra, M. K.: Soot formation in binary hydrocarbon mixtures, Energy Fuels, 2, 462–480, 1988.
Gilman, J. B., Lerner, B. M., Kuster, W. C., Goldan, P. D., Warneke, C., Veres, P. R., Roberts, J. M., de Gouw, J. A., Burling, I. R., and Yokelson, R. J.: Biomass burning emissions and potential air quality impacts of volatile organic compounds and other trace gases from fuels common in the US, Atmos. Chem. Phys., 15, 13915–13938, https://doi.org/10.5194/acp-15-13915-2015, 2015.
Griffith, D. W. T.: MALT5 User guide Version 5.5.9, 2016.
Goode, J. G., Yokelson, R. J., Susott, R. A., and Ward, D. E.: Trace gas emissions from laboratory biomass fires measured by open-path Fourier transform infrared spectroscopy: Fires in grass and surface fuels, J. Geophys. Res.-Atmos., 104, 21237–21245, 1999.
Goode, J. G., Yokelson, R. J., Ward, D. E., Susott, R. A., Babbitt, R. E., Davies, M. A., and Hao, W. M.: Measurements of excess O3, CO2, CO, CH4, C2H4, C2H2, HCN, NO, NH3, HCOOH, CH3COOH, HCHO, and CH3OH in 1997 Alaskan biomass burning plumes by airborne Fourier transform infrared spectroscopy (AFTIR), J. Geophys. Res.-Atmos., 105, 22147–22166, 2000.
Gordon, I. E., Rothman, L. S., Hill, C., Kochanov, R. V., Tan, Y., Bernath, P. F., Birk, M., Boudon, V., Campargue, A., Chance, K. V., Drouin, B. J., Flaud, J.-M., Gamache, R. R., Hodges, J. T., Jacquemart, D., Perevalov, V. I., Perrin, A., Shine, K. P., Smith , M.-A. H., Tennyson, J., Toon, G. C., Tran, H., Tyuterev, V. G., Barbe, A., Császár, A. G., Devi, V. M., Furtenbacher, T., Harrison, J. J., Hartmann, J.-M., Jolly, A., Johnson, T. J., Karman, T., Kleiner, I., Kyuberis, A. A., Loos, J., Lyulin, O. M., Massie, S. T., Mikhailenko, S. N., Moazzen-Ahmadi, N., Müller, H. S. P., Naumenko, O. V., Nikitin, A. V., Polyansky, O. L., Rey, M., Rotger, M., Sharpe, S. W., Sung, K., Starikova, D., S. A. Tashkun, S. A., Van der Auwera, J., Wagner, G., Wilzewski, J., Wcisło, P., Yu, S., and Zak, E. J.: The HITRAN2016 molecular spectroscopic database, J. Quant. Spectrosc. Radiat. Transfer, 203, 3–69, 2017.
Guérette, E.-A., Paton-Walsh, C., Desservettaz, M., Smith, T. E. L., Volkova, L., Weston, C. J., and Meyer, C. P.: Emissions of trace gases from Australian temperate forest fires: emission factors and dependence on modified combustion efficiency, Atmos. Chem. Phys., 18, 3717–3735, https://doi.org/10.5194/acp-18-3717-2018, 2018.
Hardy, C. C., Ottmar, R. D., Peterson, J. L., Core, J. E., and Seamon, P.: Smoke management guide for prescribed and wildland fire; 2001 ed., PMS 420-2 National Wildfire Coordinating group, Boise, ID, USA, 226 pp., 2001.
Hatch, L. E., Yokelson, R. J., Stockwell, C. E., Veres, P. R., Simpson, I. J., Blake, D. R., Orlando, J. J., and Barsanti, K. C.: Multi-instrument comparison and compilation of non-methane organic gas emissions from biomass burning and implications for smoke-derived secondary organic aerosol precursors, Atmos. Chem. Phys., 17, 1471–1489, https://doi.org/10.5194/acp-17-1471-2017, 2017.
Hawthorne, S. B., Krieger, M. S., Miller, D. J., and Mathiason, M. B.: Collection and quantitation of methoxylated phenol tracers for atmospheric pollution from residential wood stoves, Environ. Sci. Technol., 23, 470–475, https://doi.org/10.1021/es00181a013, 1989.
Hough, W. A.: Caloric value of some forest fuels of the southern United States, Research Note, USDA Forest Service, Southeastern Forest Experiment Station, Asheville, NC, USA, available at: http://www.treesearch.fs.fed.us/pubs/2778 (last access: 5 March 2021), 1969.
Hurst, D. F., Griffith, D. W. T., Carras, J. N., Williams, D. J., and Fraser, P. J.: Measurements of trace gases emitted by Australian savanna fires during the 1990 dry season, J. Atmos. Chem., 18, 33–56, 1994a.
Hurst, D. F., Griffith, D. W. T., and Cook, G. D.: Trace gas emissions from biomass burning in tropical Australian savannas, J. Geophys. Res., 99, 16441–16456, 1994b.
Ingemarsson, A., Nilsson, U., Nilsson, M., Pedersen, J. R., and Olsson, J. O.: Slow pyrolysis of spruce and pine samples studied with GC/MS and GC/FTIR/FID, Chemosphere, 36, 2879–2889, 1998.
Johnson, T. J., Simon, A., Weil, J. M., and Harris, G. W.: Applications of time-resolved step-scan and rapid-scan FT-IR spectroscopy: Dynamics from ten seconds to ten nanoseconds, Appl. Spectrosc., 47, 1376, 1993.
Johnson, T. J., Masiello, T., and Sharpe, S. W.: The quantitative infrared and NIR spectrum of CH2I2 vapor: vibrational assignments and potential for atmospheric monitoring, Atmos. Chem. Phys., 6, 2581–2591, https://doi.org/10.5194/acp-6-2581-2006, 2006.
Johnson, T. J., Profeta, L. T. M., Sams, R. L., Griffith, D. W. T., and Yokelson, R. L.: An infrared spectral database for detection of gases emitted by biomass burning, Vib. Spectrosc., 53, 97–102, 2010.
Jolly, W. M., Parsons, R. A., Hadlow, A. M., Cohn, G. M., McAllister, S. S., Popp, J. B., Hubbard, R. M., and Negron, J. F.: Relationships between moisture, chemistry, and ignition of Pinus contorta needles during the early stages of mountain pine beetle attack, For. Ecol. Manag., 269, 52–59, https://doi.org/10.1016/j.foreco.2011.12.022, 2012.
Jolly, W. M., Hintz, J., Linn, R. L., Kropp, R. C., Conrad, E. T., Parsons, R. A., and Winterkamp, J.: Seasonal variations in red pine (Pinus resinosa) and jack pine (Pinus banksiana) foliar physio-chemistry and their potential influence on stand-scale wildland fire behavior, For. Ecol. Manag., 373, 167–178, https://doi.org/10.1016/j.foreco.2016.04.005, 2016.
Karl, T. G., Christian, T. J., Yokelson, R. J., Artaxo, P., Hao, W. M., and Guenther, A.: The Tropical Forest and Fire Emissions Experiment: method evaluation of volatile organic compound emissions measured by PTR-MS, FTIR, and GC from tropical biomass burning, Atmos. Chem. Phys., 7, 5883–5897, https://doi.org/10.5194/acp-7-5883-2007, 2007.
Keresztury, G., Billes, F., Kubinyi, M., and Sundius, T.: A density functional, infrared linear dichroism, and normal coordinate study of phenol and its deuterated derivatives: revised interpretation of the vibrational spectra, J. Phys. Chem, 102, 1371–1380, 1998.
Kibet, J., Khachatryan, L., and Dellinger, B.: Molecular products and radicals from pyrolysis of lignin, Environ. Sci. Technol., 46, 12994–13001, 2012.
Kochanov, R. V., Gordon, I. E., Rothman, L. S., Shine, K. P., Sharpe, S. W., Johnson, T. J., Wallington, T. J., Harrison, J. J., Bernath, P. F., Birk, M., and Wagner, G.: Infrared absorption cross-sections in HITRAN2016 and beyond: Expansion for climate, environment, and atmospheric applications, J. Quant. Spectrosc. Radiat. Transf., 230, 172–221, 2019.
Koss, A. R., Sekimoto, K., Gilman, J. B., Selimovic, V., Coggon, M. M., Zarzana, K. J., Yuan, B., Lerner, B. M., Brown, S. S., Jimenez, J. L., Krechmer, J., Roberts, J. M., Warneke, C., Yokelson, R. J., and de Gouw, J.: Non-methane organic gas emissions from biomass burning: identification, quantification, and emission factors from PTR-ToF during the FIREX 2016 laboratory experiment, Atmos. Chem. Phys., 18, 3299–3319, https://doi.org/10.5194/acp-18-3299-2018, 2018.
Ledesma, E. B., Marsh, N. D., Sandrowitz, A. K., and Wornat, M. J.: An experimental study on the thermal decomposition of catechol, Proc. Combust. Inst., 29, 2299–2306, https://doi.org/10.1016/S1540-7489(02)80280-2, 2002.
Liu, X., Huey, L. G., Yokelson, R. J., Selimovic, V., Simpson, I. J., Müller, M., Jimenez, J. L., Campuzano-Jost, P., Beyersdorf, A. J., Blake, D. R., Butterfield, Z., Choi, Y., Crounse, J. D., Day, D. A., Diskin, G. S., Dubey, M. K., Fortner, E., Hanisco, T. F., Hu, W., King, L. E., Kleinman, L., Meinardi, S., Milkoviny, T., Onasch, T. B., Palm, B. B., Peischl, J., Pollack, I. B., Ryerson, T. B., Sachse, G. W., Sedlacek, A. J., Shilling, J. E., Springston, S., St. Clair, J. M., Tanner, D. J., Teng, A. P., Wennberg, P. O., Wisthaler, A., and Wolfe, G. M.: Airborne measurements of western US wildfire emissions: Comparison with prescribed burning and air quality implications, J. Geophys. Res.-Atmos., 122, 6108–6129, https://doi.org/10.1002/2016JD026315, 2017.
Melvin, M. A.: 2015 National Prescribed Fire Use Survey Report, Technical Report, Coalition of Prescribed Fire Councils, Inc., available at: http://stateforesters.org/sites/default/files/publication-documents/2015 Prescribed Fire Use Survey Report.pdf (last access: 5 March 2021), 2015.
Matt, F. J., Dietenberger, M. A., and Weise, D. R.: Summative and ultimate analysis of live leaves from southern U. S. forest plants for use in fire modeling, Energy Fuels, 34, 4703–4720, https://doi.org/10.1021/acs.energyfuels.9b04107, 2020.
Neuman, J. A., Huey, L. G., Ryerson, T. B., and Fahey, D. W.: Study of inlet materials for sampling atmospheric nitric acid, Environ. Sci. Technol., 33, 1133–1136, https://doi.org/10.1021/es980767f, 1999.
Paton-Walsh, C., Deutscher, N. M., Griffith, D. W. T., Forgan, B. W., Wilson, S. R., Jones, N. B., and Edwards, D. P.: Trace gas emissions from savanna fires in northern Australia, J. Geophys. Res., 115, D16314, https://doi.org/10.1029/2009JD013309, 2010.
Paton-Walsh, C., Smith, T. E. L., Young, E. L., Griffith, D. W. T., and Guérette, É.-A.: New emission factors for Australian vegetation fires measured using open-path Fourier transform infrared spectroscopy – Part 1: Methods and Australian temperate forest fires, Atmos. Chem. Phys., 14, 11313–11333, https://doi.org/10.5194/acp-14-11313-2014, 2014.
Phillips, M. C., Myers, T. L., Johnson, T. J., and Weise, D. R.: In-situ measurement of pyrolysis and combustion gases from biomass burning using swept wavelength external cavity quantum cascade lasers, Opt. Express, 28, 8680–8700, 2020.
Prior, R. L., Cao, G., Martin, A., Sofic, E., McEwen, J., O'Brien, C., Lischner, N., Ehlenfeldt, M., Kalt, W., Krewer, G., and Mainland, C. M.: Antioxidant capacity as influenced by total phenolic and anthocyanin content, maturity, and variety of Vaccinium species, J. Agric. Food Chem., 46, 2686–2693, https://doi.org/10.1021/jf980145d, 1998.
Pyne, S. J.: World fire: the culture of fire on earth, Pbk. ed., University of Washington Press, Seattle, USA, 1997.
Roscioli, J. R., Zahniser, M. S., Nelson, D. D., Herndon, S. C., and Kolb, C. E.: New approaches to measuring sticky molecules: improvement of instrumental response times using active passivation, J. Phys. Chem. A, 120, 1347–1357, https://doi.org/10.1021/acs.jpca.5b04395, 2015.
Safdari, M.-S., Amini, E., Weise, D. R., and Fletcher, T. H.: Comparison of pyrolysis of live wildland fuels heated by radiation vs. convection, Fuel, 268, 117342, https://doi.org/10.1016/j.fuel.2020.117342, 2020.
Saiz-Jimenez, C. and de Leeuw, J. W.: Lignin pyrolysis products: Their structures and their significance as biomarkers, Org. Geochem., 10, 869–876, https://doi.org/10.1016/S0146-6380(86)80024-9, 1986.
Scharko, N. K., Oeck, A. M., Myers, T. L., Tonkyn, R. G., Banach, C. A., Baker, S. P., Lincoln, E. N., Chong, J., Corcoran, B. M., Burke, G. M., Ottmar, R. D., Restaino, J. C., Weise, D. R., and Johnson, T. J.: Gas-phase pyrolysis products emitted by prescribed fires in pine forests with a shrub understory in the southeastern United States, Atmos. Chem. Phys., 19, 9681–9698, https://doi.org/10.5194/acp-19-9681-2019, 2019a.
Scharko, N. K., Oeck, A. M., Tonkyn, R. G., Baker, S. P., Lincoln, E. N., Chong, J., Corcoran, B. M., Burke, G. M., Weise, D. R., Myers, T. L., Banach, C. A., Griffith, D. W. T., and Johnson, T. J.: Identification of gas-phase pyrolysis products in a prescribed fire: first detections using infrared spectroscopy for naphthalene, methyl nitrite, allene, acrolein and acetaldehyde, Atmos. Meas. Tech., 12, 763–776, https://doi.org/10.5194/amt-12-763-2019, 2019b.
Scott, A. C., Bowman, D. M. J. S., Bond, W. J., Pyne, S. J., and Alexander, M. E.: Fire on earth: an introduction, John Wiley & Sons, Inc, Chichester, UK, 2014.
Sekimoto, K., Koss, A. R., Gilman, J. B., Selimovic, V., Coggon, M. M., Zarzana, K. J., Yuan, B., Lerner, B. M., Brown, S. S., Warneke, C., Yokelson, R. J., Roberts, J. M., and de Gouw, J.: High- and low-temperature pyrolysis profiles describe volatile organic compound emissions from western US wildfire fuels, Atmos. Chem. Phys., 18, 9263–9281, https://doi.org/10.5194/acp-18-9263-2018, 2018.
Selimovic, V., Yokelson, R. J., Warneke, C., Roberts, J. M., de Gouw, J., Reardon, J., and Griffith, D. W. T.: Aerosol optical properties and trace gas emissions by PAX and OP-FTIR for laboratory-simulated western US wildfires during FIREX, Atmos. Chem. Phys., 18, 2929–2948, https://doi.org/10.5194/acp-18-2929-2018, 2018.
Sharpe, S. W., Sams, R. L., Johnson, T. J., Chu, P. M., Rhoderick, G. C., and Guenther, F. R.: Creation of 0.10-cm−1 resolution quantitative infrared spectral libraries for gas samples, Vibrational Spectroscopy-based Sensor Systems, Proc. SPIE, 4577, 12–24, https://doi.org/10.1117/12.455730, 2002.
Shimanouchi, T.: Tables of Vibrational Frequencies, Consolidated Vol. I., National Bureau of Standards, Washington, D.C., 1972.
Stein, Y. S., Antal Jr., M. J., and Jones Jr., M.: A study of the gas-phase pyrolysis of glycerol, J. Anal. Appl. Pyrol., 4, 283–296, 1983.
Stockwell, C. E., Yokelson, R. J., Kreidenweis, S. M., Robinson, A. L., DeMott, P. J., Sullivan, R. C., Reardon, J., Ryan, K. C., Griffith, D. W. T., and Stevens, L.: Trace gas emissions from combustion of peat, crop residue, domestic biofuels, grasses, and other fuels: configuration and Fourier transform infrared (FTIR) component of the fourth Fire Lab at Missoula Experiment (FLAME-4), Atmos. Chem. Phys., 14, 9727–9754, https://doi.org/10.5194/acp-14-9727-2014, 2014.
Susott, R. A.: Characterization of the thermal properties of forest fuels by combustible gas analysis, For. Sci., 28, 404–420, 1982.
Thomas, S., Ledesma, E. B., and Wornat, M. J.: The effects of oxygen on the yields of the thermal decomposition products of catechol under pyrolysis and fuel-rich oxidation conditions, Fuel, 86, 2581–2595, https://doi.org/10.1016/j.fuel.2007.02.003, 2007.
Tihay, V. and Gillard, P.: Pyrolysis gases released during the thermal decomposition of three Mediterranean species, J. Anal. Appl. Pyrolysis, 88, 168–174, https://doi.org/10.1016/j.jaap.2010.04.002, 2010.
Varhegyi, G., Jakab, E., and Antal, M. J.: Is the Broido-Shafizadeh model for cellulose pyrolysis true?, Energy Fuels, 8, 1345–1352, https://doi.org/10.1021/ef00048a025, 1994.
Viatte, C., Strong, K., Hannigan, J., Nussbaumer, E., Emmons, L. K., Conway, S., Paton-Walsh, C., Hartley, J., Benmergui, J., and Lin, J.: Identifying fire plumes in the Arctic with tropospheric FTIR measurements and transport models, Atmos. Chem. Phys., 15, 2227–2246, https://doi.org/10.5194/acp-15-2227-2015, 2015.
Waldrop, T. A. and Goodrick, S. L.: Introduction to prescribed fires in southern ecosystems, Science Update, USDA Forest Service, Southern Research Station, Asheville, NC, USA, available at: http://www.treesearch.fs.fed.us/pubs/41316 (last access: 6 March 2021), 2012.
Ward, D. E.: Combustion chemistry and smoke, in Forest Fires: Behavior and Ecological Effects, edited by E. A. Johnson and K. Miyanishi, Academic Press, San Diego, CA, USA, 55–77, 2001.
Ward, D. E. and Hao, W. M.: Projections of emissions from burning of biomass for use in studies of global climate and atmospheric chemistry, 19 p., Air and Waste Management Association, Vancouver, British Columbia, Canada, available at: http://www.treesearch.fs.fed.us/pubs/43258 (last access: 6 March 2021), 1991.
Ward, D. E. and Hardy, C. C.: Smoke emissions from wildland fires, Environ. Int., 17, 117–134, 1991.
Ward, D. E. and Radke, L. F.: Emissions measurement from vegetation fires: a comparative evaluation of methods and results, in Fire in the environment: the ecological, atmospheric, and climatic importance of vegetation fires: report of the Dahlem Workshop, held in Berlin, 15–20 March 1992, edited by: Crutzen, P. J. and Goldammer, J. G., John Wiley & Sons Ltd., 53–76, available at: http://www.fs.fed.us/rm/pubs_other/rmrs_1993_ward_d001.pdf (last access: 6 March 2021), 1993.
Warneke, C., Roberts, J. M., Veres, P., Gilman, J., Kuster, W. C., Burling, I., Yokelson, R., and de Gouw, J. A.: VOC identification and inter-comparison from laboratory biomass burning using PTR-MS and PIT-MS, Int. J. Mass Spectrom., 303, 6–14, https://doi.org/10.1016/j.ijms.2010.12.002, 2011.
Weise, D. R., Johnson, T. J., and Reardon, J.: Particulate and trace gas emissions from prescribed burns in southeastern U.S. fuel types: Summary of a 5 year project, Fire Saf. J., 74, 71–81, https://doi.org/10.1016/j.firesaf.2015.02.016, 2015.
Weise, D. R., Fletcher, T. H., Cole, W., Mahalingam, S., Zhou, X., Sun, L., and Li, J.: Fire behavior in chaparral – Evaluating flame models with laboratory data, Combust. Flame, 191, 500–512, https://doi.org/10.1016/j.combustflame.2018.02.012, 2018.
Weise, D. R., Palarea-Albaladejo, J., Johnson, T. J., and Jung, H.: Analyzing wildland fire smoke emissions data using compositional data techniques, J. Geophys. Res.-Atmos., 125, 1–18, https://doi.org/10.1029/2019JD032128, 2020.
Williams, S. D., Johnson, T. J., Sharpe, S. W., Yavelak, V., Oates, R. P., and Brauer, C. S.: Quantitative vapor-phase IR intensities and DFT computations to predict absolute IR spectra based on molecular structure: I. Alkanes. J. Quant. Spectrosc. Radiat. Transf., 129, 298–307, https://doi.org/10.1016/j.jqsrt.2013.07.005, 2013.
Yang, H., Yan, R., Chen, H., Lee, D. H., and Zheng, C.: Characteristics of hemicellulose, cellulose and lignin pyrolysis, Fuel, 86, 1781–1788, 2007.
Yee, L. D., Kautzman, K. E., Loza, C. L., Schilling, K. A., Coggon, M. M., Chhabra, P. S., Chan, M. N., Chan, A. W. H., Hersey, S. P., Crounse, J. D., Wennberg, P. O., Flagan, R. C., and Seinfeld, J. H.: Secondary organic aerosol formation from biomass burning intermediates: phenol and methoxyphenols, Atmos. Chem. Phys., 13, 8019–8043, https://doi.org/10.5194/acp-13-8019-2013, 2013.
Yokelson, R. J., Griffith, D. W. T., and Ward, D. E.: Open-path Fourier transform infrared studies of large-scale laboratory biomass fires, J. Geophys. Res., 101, 21067, https://doi.org/10.1029/96JD01800, 1996.
Yokelson, R. J., Susott, R., Ward, D. E., Reardon, J., and Griffith, D. W. T.: Emissions from smoldering combustion of biomass measured by open-path Fourier transform infrared spectroscopy, J. Geophys. Res.-Atmos., 102, 18865–18877, 1997.
Yokelson, R. J., Christian, T. J., Bertschi, I. T., and Hao, W. M.: Evaluation of adsorption effects on measurements of ammonia, acetic acid, and methanol, J. Geophys. Res., 108, 4649, https://doi.org/10.1029/2003JD003549, 2003.
Yokelson, R. J., Burling, I. R., Gilman, J. B., Warneke, C., Stockwell, C. E., de Gouw, J., Akagi, S. K., Urbanski, S. P., Veres, P., Roberts, J. M., Kuster, W. C., Reardon, J., Griffith, D. W. T., Johnson, T. J., Hosseini, S., Miller, J. W., Cocker III, D. R., Jung, H., and Weise, D. R.: Coupling field and laboratory measurements to estimate the emission factors of identified and unidentified trace gases for prescribed fires, Atmos. Chem. Phys., 13, 89–116, https://doi.org/10.5194/acp-13-89-2013, 2013.
Zhou, X. and Mahalingam, S.: Evaluation of reduced mechanism for modeling combustion of pyrolysis gas in wildland fire, Combust. Sci. Technol., 171, 39–70, https://doi.org/10.1080/00102200108907858, 2001.
The use of trade or firm names in this publication is for reader information and does not imply endorsement by the US Department of Agriculture of any product or service.