the Creative Commons Attribution 4.0 License.
the Creative Commons Attribution 4.0 License.
 | 29 Mar 2021
Ångström exponent errors prevent accurate visibility measurement
Hengnan Guo
Zefeng Zhang
Lin Jiang
Junlin An
Bin Zhu
Hanqing Kang
Jing Wang
Visibility is an indicator of atmospheric transparency, and it is widely used in many research fields, including air pollution, climate change, ground transportation, and aviation. Although efforts have been made to improve the performance of visibility meters, a significant error exists in measured visibility data. This study conducts a well-designed simulation calibration of visibility meters, which proves that current methods of visibility measurement include a false assumption, leading to the long-term neglect of an important source of visibility error caused by erroneous values of Ångström exponents. This error has two characteristics, namely (1) independence, which means that the magnitude of the error is independent of the performance of the visibility meter. It is impossible to reduce this error by improving the performance of visibility meters. The second characteristic is (2) uncertainty, which means the magnitude of the error does not show a clear change pattern but can be substantially larger than the measurement error of visibility meters. It is impossible to accurately estimate the magnitude of this error or its influence on visibility measurements. Our simulations indicate that, as errors in visibility caused by erroneous values of Ångström exponents are inevitable using current methods of visibility measurement, reliable visibility data cannot be obtained without major adjustments to current measurement methods.
- Article
(2697 KB) - Full-text XML
- BibTeX
- EndNote


Visibility is a fundamental meteorological parameter which is widely used in research related to synoptic meteorology, air quality, climatology, human health, and fields closely related to daily life such as ground transportation, aviation, and navigation (Che et al., 2007; Huang et al., 2009; Hyslop, 2009; Konstantopoulos et al., 2010; Li et al., 2016). The performance of visibility meters has been significantly improved through considerable engineering efforts; however, reliable visibility data are still not available (Singh et al., 2017). Therefore, it is necessary to discuss whether there are problems with visibility measurement methods leading to the neglect of important potential sources of errors.
Traditionally, visibility measurements were performed by trained human observers (Watson, 2002). In 1924, Koschmieder related visibility (v) and atmospheric extinction coefficient (b) at a given contrast threshold (ε) (Eq. 1), which provided a theoretical basis for measuring visibility with instruments (Koschmieder, 1924). In 1957, the World Meteorological Organization (WMO) set a benchmark for visibility measurement by introducing the meteorological optical range (MOR; WMO, 1957). Subsequently, automated visibility meters gradually replaced human observations.
However, it is vital to determine if the MOR is consistent with human observations of visibility. After deducting the influence of the measurement error, two main differences exist between the two. First, the contrast threshold (ε) is different. The contrast threshold of the MOR is defined as a constant value (0.05), whereas that of the human eye is typically between 0.0077 and 0.06 (WMO, 2018), as determined by the physiological structure. Second, the measurement wavelength is different. The MOR requires a light source at a colour temperature of 2700 K (WMO, 2018), whose emission spectrum peaks at a wavelength of 1.07 µm, according to Wien's displacement law. In contrast, human observation is restricted to the visible light range and is most sensitive at a wavelength of ∼0.55 µm (Feynman et al., 2011). WMO claims that “visibility and MOR should be equal” if the influence of the contrast threshold can be excluded, which implies that the choice of the measurement wavelength of the light source will not affect the measurement of visibility.
However, Ångström indicated the spectral dependence of the extinction coefficient as early as 1929 (Ångström, 1929). Combining the inverse relationship between visibility and the extinction coefficient (Eq. 1), we obtain the following:
where q is the Ångström exponent, which is used to convert the visibility measured at a wavelength of λ1 () to the visibility at a reference wavelength of λ0 (). Erroneous values of q can clearly lead to errors when converting to . The relationship between the relative error of visibility (X) and the absolute error of q (Δq) is shown in Eq. (3), where Δq represents the deviation of the erroneous values of q (qE) from the true values of q (qT); is the visibility at the reference wavelength of λ0 calculated from the visibility measured at λ1 (), using qT (Eq. 2), and is calculated using qE. Equation (3) suggests that any errors in the values of q will appear as errors in the measurement of visibility, as illustrated in Fig. 1. It should be noted that the magnitude of this error is related not only to the absolute error of q (Δq) but also to the choice of the measurement wavelength.
The question arises whether reliable values of Ångström exponents (q) can be obtained during visibility measurement. If so, there is no need to consider the influence of Eq. (3) on errors in the visibility measurement; if not, further investigation should be conducted into the possible range of Δq and its effect on the visibility measurement.

Figure 1Influence of the absolute error of the Ångström exponent (q) on the relative error of visibility.
The Guide to Instruments and Methods of Observation (WMO, 2018) cites the intercomparison of visibility measurements (Middleton, 1952; WMO, 1990), where the difference in MOR and visibility by day is attributed to the difference in the contrast threshold. The conclusion reached in this guide states that “Visibility and MOR should be equal if the observer's contrast threshold is 0.05 (using the criterion of recognition) and the extinction coefficient is the same in the vicinity of the instrument and between the observer and the objects” (WMO, 2018). This conclusion implies that there is no need to consider a deviation from the true values of visibility measured at a wavelength of λ0 () when converting the visibility measured at λ1 () to λ0 (), using Eq. (3); i.e., the errors in the values of q are negligible. Therefore, visibility meters with different measurement wavelengths can obtain consistent visibility measurements, and the following statements are true: (1) the measurement wavelength of visibility meters can be arbitrarily selected because the visibility measured at any wavelength can be mutually converted, (2) the reference visibility can be artificially defined, such as the MOR, because the reliability of visibility data will not be reduced by converting the visibility measured at various wavelengths into the reference wavelength, and (3) multiple visibility benchmarks, such as MOR and meteorological visibility by day, can be used simultaneously in the same way that units, such as grams and kilograms, can be completely substituted to measure mass.
In fact, existing methods of visibility measurement, using visibility meters with different wavelengths that are currently in use are formulated under the premise that the WMO's recommended approach is adequate. For example, the light source of Biral RWS-30 is at 850 nm (Biral, 2018), that of Optec LPV-3 is at 550 nm (Optec, 2011), and Vaisala LT31 uses a white light source (Vaisala, 2018). However, this guide does not explain why the MOR is consistent with human observations of visibility when the contrast threshold is the same. In other words, no theoretical basis is provided to prove that reliable values of q can be obtained in the visibility measurement. This study conducts a well-designed simulation calibration of visibility meters, which proves that it is impossible to obtain reliable values of q or to determine the magnitude of Δq. Considering the possible range of q in the atmosphere, it can be inferred that errors in visibility caused by erroneous values of q cannot be ignored; therefore, apparent errors exist in the error estimates of current visibility measurements.
The aim of the simulation calibration of visibility meters is to develop a function for the Ångström exponent (q), thus converting the visibility measured at a wavelength of λ1 () to the visibility at the reference wavelength of λ0 (). To describe the problem more clearly, the following assumptions are made for the simulation calibration.
-
The contrast thresholds (ε) of all visibility meters are assumed to be the same. During the calibration, the atmospheric extinction coefficient (b) was measured, without measurement error, using ideal visibility meters. Therefore, the values of q can be accurately calculated in each measurement using Eq. (4), which is obtained by combining Eqs. (1) and (2) as follows:
-
Assuming that the extinction coefficient (b) can be fully attributed to aerosol particles, and that the information about the characteristics of aerosol particles is clear during the calibration process, the extinction coefficient can be derived using Eq. (5) as follows:
where accounts for the average extinction coefficient contributed by particles with a diameter of D at an incident light wavelength of λ. The particle size distribution function is given by n(D), where N represents the particle number concentration, and f(D) is the probability distribution function of the aerosol particles, that is, the normalised particle size distribution function.
Equation (6) is derived for the calculation of the Ångström exponent (q) after combining Eqs. (4) and (5). It should be noted that the particle number concentration (N) is not included in Eq. (6), as it is eliminated in the derivation of Eq. (6), indicating that q is only related to the physical and chemical parameters of aerosol particles and not to their number concentration.
-
As for hygroscopic particles on which water vapour condenses, the refractive index of mixed particles can be calculated using the weighted average of the volume ratio of each composition, and the diameter of mixed particles can be calculated using the hygroscopic growth factor (GF), which is defined as the ratio of humidified particle diameter to the diameter at dry conditions (Jacobson, 2001; Chen et al., 2012; Zhang et al., 2017). The relationship between the GF and refractive index (m) of mixed particles can be expressed by Eq. (7), where ma and mw represent the refractive indices of dry aerosol particles and pure water, respectively.
-
It is assumed that the calibration can be effectively performed by professional calibration personnel and that no subjective errors occur in the calibration process. Calibration personnel know the exact measurement wavelength of the specific visibility meter and can accurately record the results of the visibility measurements. During calibration, the measurement results of the reference visibility meter at the reference wavelength of λ0 are known to be reliable, unlike those of the visibility meter at λ1. Calibration personnel can accurately measure the number concentration of aerosol particles and the ambient relative humidity but cannot measure the physical and chemical parameters of aerosol particles, such as the particle size distribution and complex refraction index.
The calibration was conducted simultaneously for four independent groups (urban, marine, rural, and remote continental). The purpose of the calibration was to find a way to convert the visibility measured at a wavelength of λ1 (1.07 µm) to the visibility at the reference wavelength of λ0 (0.55 µm). During the calibration process, the aerosol particles of the four groups were spherical homogeneous particles with a refractive index of 1.53. However, the particle size distribution was not the same but consistent with the typical probability distribution function of aerosol particles in urban, marine, rural, and remote continental settings, respectively (Seinfeld and Pandis, 2016), as shown in Fig. 2a.
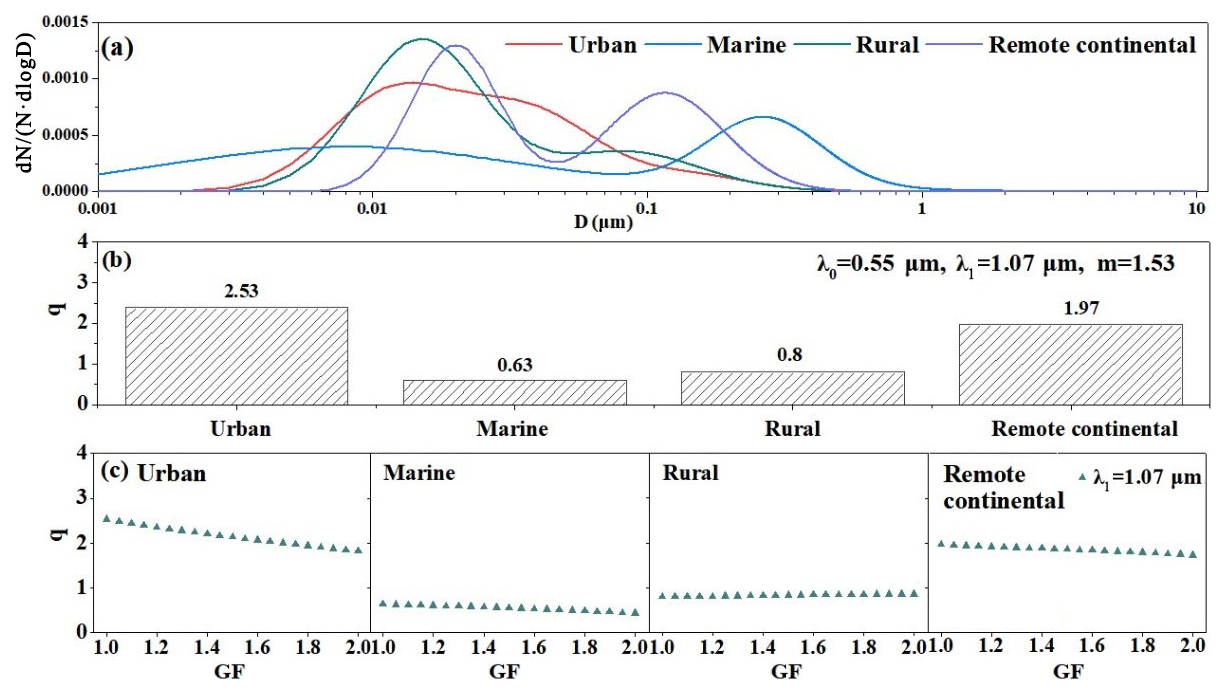
Figure 2Critical data used or obtained for the urban, marine, rural, and remote continental groups in the simulation calibration. Panel (a) shows the probability distribution function of aerosol particle size. Panel (b) shows the values of the Ångström exponent (q) obtained in the simulation calibration. Panel (c) shows the relationship between q and the hygroscopic growth factor (GF).
The four groups used exactly the same calibration method and procedure, as follows. First, the number concentration of aerosol particles was set to N1, and the visibility was measured at wavelengths of λ0 and λ1, recorded as and , respectively. The values of q corresponding to N1 were obtained by substituting the measurement results into Eq. (2), which were denoted by q1. Then, the aerosol number concentration was changed, and the above steps were repeated. Ni denotes the ith change in the aerosol number concentration, the corresponding visibility measurements are and , and the calculated q value is qi. If the aerosol number concentration changed n times in the calibration, n groups of the values of , , and q were obtained. Finally, these n groups of data were fitted to determine the fitting formula for q and, eventually, determine the calibration function for converting to .
It can be inferred from the assumptions in the simulation calibration that the calibration data can also be obtained by theoretical calculation with identical results. Therefore, the calibration process can be calculated and analysed using the Mie theory (Bohren and Huffman, 1983). Because only the number concentration of aerosol particles was changed in the simulation calibration, according to Eqs. (5) and (1) and under the assumptions of the calibration, the number concentration of aerosol particles was directly proportional to the extinction coefficient ( and ) and inversely proportional to visibility ( and ). Therefore, for all four groups, q remained constant after substituting n groups of and or and obtained in the calibration into Eq. (2) or Eq. (6). Then, the calibration function (Eq. 8) was formulated, where qc indicates that q is a constant value. Because of the differences in the size distribution of aerosol particles between groups, the corresponding value of q given by the four groups was bound to be different, as shown in Fig. 2b. Therefore, four different calibration curves were obtained for the four groups.
4.1 Relationship between visibility and the Ångström exponent
The common conclusion reached during calibration of the four groups is that q is a constant variable independent of visibility. This is a different conclusion from previous studies, where q is determined by an empirical formula that uses visibility as a variable (Middleton, 1952; Kim et al., 2001; Nebuloni, 2005). Therefore, it is vital to determine which conclusion is correct.
Equation (6) clearly specifies the determining variables of q in which the aerosol number concentration does not appear. In the above simulation calibration, visibility is changed by changing the aerosol number concentration. Therefore, we conclude that q is not correlated with visibility. However, a different conclusion would be reached if the visibility is changed by changing the ambient relative humidity during calibration. Particles absorb water with increasing relative humidity (Mikhailov et al., 2009; Cheng et al., 2015), causing both the probability distribution function and the refractive index of aerosol particles to change (Eq. 7). Then, it follows from Eqs. (5) and (1) that both the extinction coefficient (b) and visibility (v) are correlated with relative humidity. The relationship between q and GF were calculated using Eq. (6) (Fig. 2c). According to Eq. (6), q is a function of relative humidity; therefore, visibility is correlated with q. We derive an equation for q as a function of visibility from this calibration for all four groups; however, their functions are different.
In addition to the measurement wavelength, q is determined by the physical and chemical parameters of aerosol particles in Eq. (6), i.e., the refractive index and probability distribution function of the diameter of the aerosol particles, as discussed by other researchers (Schuster et al., 2006). These parameters are constantly changing in the atmosphere; thus, they cannot be directly measured by visibility meters and do not directly correspond to visibility. Regarding equations for q as a function of visibility obtained during calibration or measurement, as long as the physical and chemical parameters of aerosol particles change significantly, the equations are no longer applicable. Therefore, it is impossible to obtain a universally applicable empirical formula for q and visibility. This raises the inevitable question of why some formulas have been used for such a long time now that there are no general empirical formulas.
4.2 Impact of empirical equations on visibility measurement
The sources of the visibility measurement error can be discussed using Eq. (2). The contrast threshold (ε) is a predefined constant; therefore, the error of visibility theoretically arises from the measurement error of visibility meters and erroneous values of q. If it is accepted that a definite function of q and v exists, and that the empirical formula for is correct, then Eq. (9) should be written in advance into the programmes of visibility meters for which the light source wavelength is λ1, rather than the reference wavelength λ0, and the output visibility is no longer but .
For the calibration of visibility meters with a wavelength of λ1, the aim is to convert to the visibility measured at the reference wavelength (), and the calibration work is assigned to the urban, marine, rural, and remote continental groups. Since is considered correct for all the four groups, the difference between measured by the visibility meter at λ1 and measured at λ0 is wrongly attributed to the measurement error. Then, the formula converting to is obtained by this calibration. By comparing Eqs. (8) with (9), Eq. (10) represents the calibration function developed by the four groups, where qc denotes the four constants obtained by the four groups, as shown in Fig. 2b.
The calibration function Eq. (10) obtained in this calibration appears to be different from Eq. (8) obtained in the simulation calibration on the surface, but it is actually the same. The calibration of visibility meters aims to convert the visibility measured at a wavelength of λ1 () to the visibility at the reference wavelength of λ0 (). The method of calculating q using a predefined empirical formula only adds an additional intermediate step, meaning that is first converted to then to in the calibration; therefore, there is no effect on the final visibility output. If the calibration can be effectively completed, the influence of the empirical formula can be theoretically eliminated to achieve identical visibility outputs after calibration, regardless of whether the empirical formula is preset in the visibility meter and regardless of the expression of the empirical formula. This conclusion can explain, to a certain extent, why some empirical formulas have been used to calculate q in visibility measurements for such a long time.
From a purely mathematical perspective, presetting an incorrect empirical formula of q has no effect on the visibility outputs, as discussed above. Nevertheless, this does not mean that it has no effect on the error estimation of the visibility measurement, which leads to at least two problems, namely (1) incorrect attribution of the error and (2) incorrect description of the nature of the error. The first problem is the attribution error in which erroneous values of q are incorrectly attributed to the measurement error of visibility. Disturbance of the physical and chemical parameters of aerosol particles is inevitable in the actual calibration, leading to changes in the values of q. Therefore, only in Eq. (11), which truly describes the calibration result, does qi represent the value of q in the ith measurement. The first term on the right-hand side of the equation is the empirical formula of q obtained in the simulation calibration, and the second term represents the deviation of q in the ith calibration (qi) from q calculated using the empirical formula. The measurement errors of instruments can be divided into systematic and random errors. The attribution error misinterprets the process of obtaining the first term, that is, the empirical formula of q, as the calibration to systematic errors and misinterprets the second term as random errors.
Second, incorrect attribution of the visibility error will lead to problems in describing the nature of the error. Stability is a prerequisite for all measurements. The systematic error is typically a constant deviation from the true value, which can be eliminated by calibration. Random error is not identifiable but follows a certain distribution, such as a normal distribution, and can be estimated through multiple measurements and calibration. However, q is not directly measured in the current visibility measurement, nor are the physical and chemical parameters determining q. Therefore, the error in selecting the inappropriate q value is not a measurement problem; the first term in Eq. (11) is not a systematic error, and the second term is not a random error. Therefore, it is important to discuss whether existing calibration methods for visibility meters, which are based on the understanding of measurement problems, can reasonably be applied to calibrate the error caused by erroneous values of q. If the answer is yes, the existing calibration methods for visibility meters are correct; if the answer is no, then a major defect exists in the current measurement methods of visibility meters. The key to answering this question is in determining whether the calibration function for visibility meters is generally applicable.
The calibration curves of visibility meters were obtained by the urban, marine, rural, and remote continental groups in the simulation calibration. The expressions of the calibration curves all follow Eq. (8); however, the values of qc are different; hence, the obtained calibration curves are also different. If the error in selecting the inappropriate q value is misunderstood as the measurement error of visibility meters, then the cause of this difference is incomprehensible. However, if it is understood that q is determined by Eq. (6), then it is clear that the difference in the values of qc is caused by the difference in the probability distribution function for the size of aerosol particles used by the four groups in the calibration. If visibility is measured by the marine, rural, and remote continental groups after calibration, in parallel with the visibility meter calibrated by the urban group, then the relative error of the intercomparison measurement will be 254 %, 213 %, and 45 %, respectively. Such a large error is caused by erroneous values of q. The WMO provides the following suggestions for this unacceptable error.
According to WMO (2018) “the calibration should be verified regularly in very good visibility, that is, over 10 to 15 km”. The WMO also requires that “atmospheric conditions resulting in erroneous calibration must be avoided” (WMO, 2018). The recommendations of WMO essentially reduce the influence of q on visibility measurements by artificially controlling the calibration conditions. Generally, the physical and chemical characteristics of aerosol particles are stable at specific observation sites. After adding more conditions, such as visibility and weather conditions, the variation range of the physical and chemical parameters of aerosol particles will become smaller, and the range of q will become smaller. Obviously, regardless of whether one visibility meter is calibrated repeatedly, or multiple visibility meters are calibrated simultaneously, the calibration result will be approximately the same, according to the suggestions of WMO, where the first term in Eq. (11) will be approximately identical, and the absolute value of the second term will change minimally. Therefore, as long as the visibility meter results are reliable, the measured visibility data after calibration will exhibit good consistency.
Although the recommendations of WMO effectively solve the consistency problem of visibility measurement data, it cannot solve the problem of error in visibility caused by erroneous values of q. This is because the physical and chemical characteristics of aerosol particles in the atmosphere are constantly changing. Even at the same observation site, many variables can cause changes in the physical and chemical properties of aerosol particles, such as wind, relative humidity, and emission sources. Clearly, the values of q also change constantly in the atmosphere and will not follow the empirical formula obtained in the calibration. Therefore, we cannot expect a stable term similar to the first term in Eq. (11), and we cannot expect the second term to have a certain statistical dispersion. As q is not directly or indirectly measured in the current visibility measurement, the actual value of q at the observation site is not clear at the time of observation, nor is the absolute error of q or the error in visibility data caused by erroneous q.
In order to assess the influence of the Ångström exponent (q) on the error of visibility data, it is necessary to clarify the range of q in the ambient atmosphere. Although long-term observations of q have not been included in past visibility measurements, they can be found in abundance in sun photometer measurements. Of course, the measurement objects and principles of sun photometers are different from those of visibility meters; therefore, the values of q calculated from the aerosol optical depth (AOD) measured by multiwavelength photometers might be different from those calculated from visibility data measured by visibility meters. However, q is determined by the physical and chemical parameters of aerosol particles. In addition, several studies have demonstrated that there is consistency between visibility and AOD measurements (Kaufman and Fraser, 1983; Wu et al., 2014). For example, AOD inversed by visibility agrees well with satellite-based AOD (Wang et al., 2009), and surface visibility derived from satellite retrievals of AOD exhibits good consistency with measured visibility data (Kessner et al., 2013). Therefore, it is feasible to discuss the change in q using the values of q derived from AOD data as a reference.
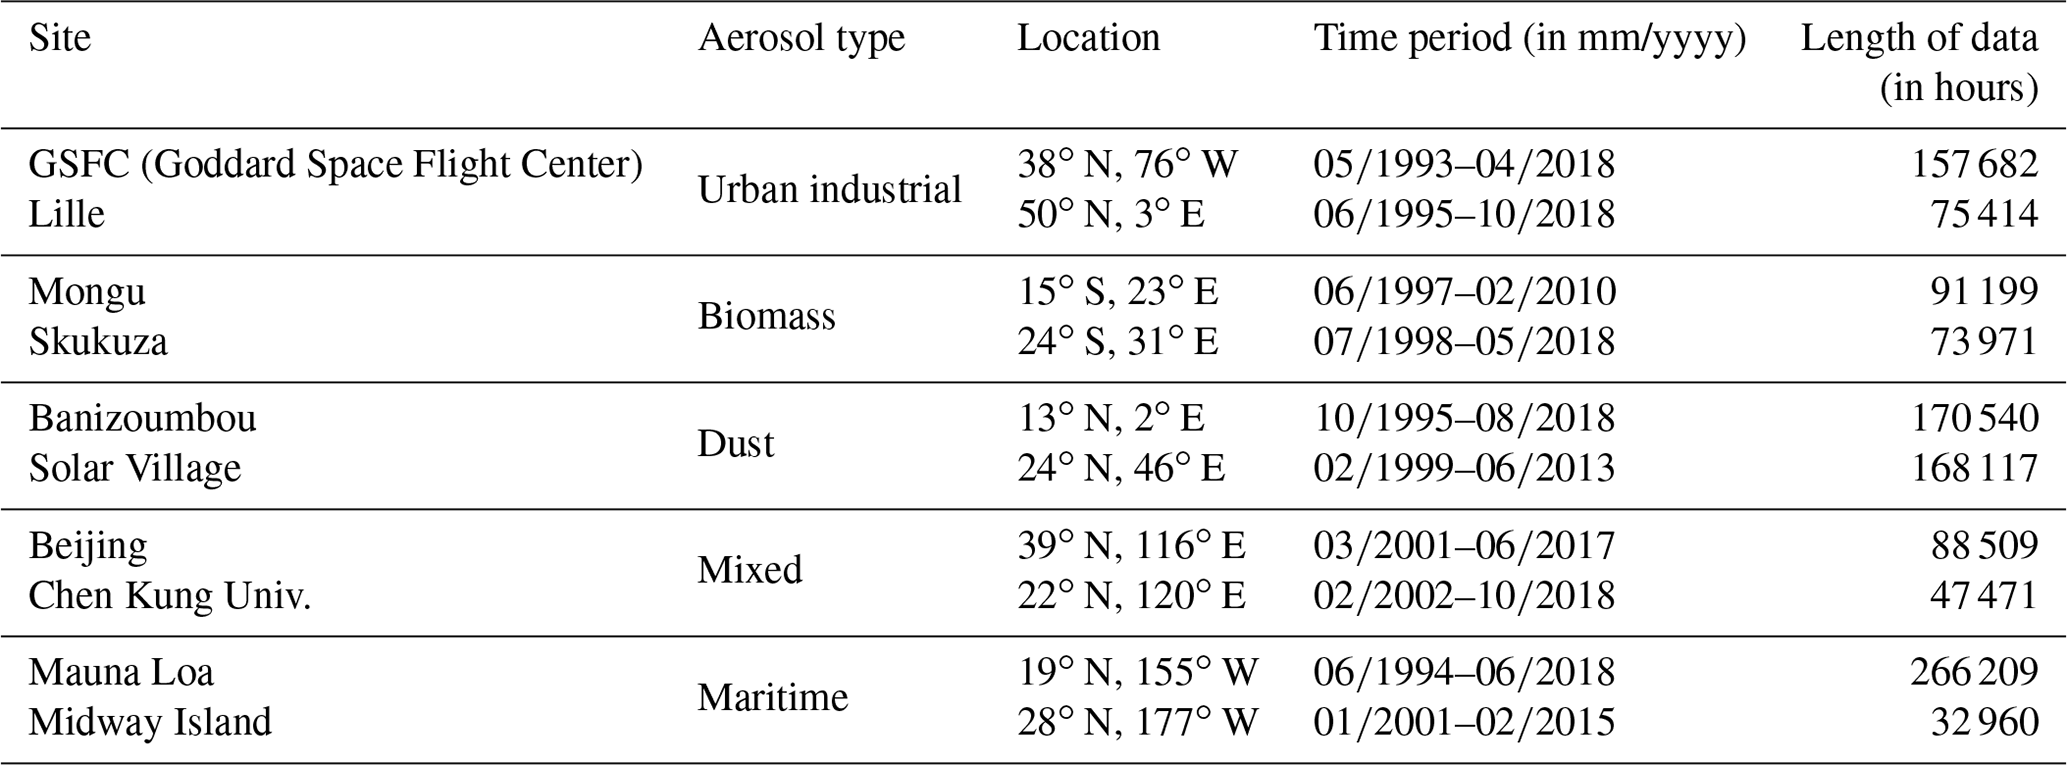
The Aerosol Robotic Network (AERONET) is the largest global network of photometers, with more than 800 stations worldwide (Holben et al., 1998). We selected 10 sites for analysis, which represent different aerosol types; the details of the sites are given in Table 1. As the wavelength pair of µm in the measurement wavelengths provided by AERONET is the most similar to the wavelength pair of µm in the visibility measurement, the values of q calculated from AOD at 0.87 µm (AOD0.87) and 0.44 µm (AOD0.44) are discussed here. The relationship between q and AOD at 0.87 µm is shown in Fig. 3a, which exhibits no obvious correlation at any measurement site; thus, q cannot be determined by AOD0.87. As AOD is directly proportional to the extinction coefficient of the atmosphere, and the extinction coefficient is inversely proportional to visibility, it is clear from Fig. 3a that the values of q cannot be determined from visibility – even for the same measurement site.
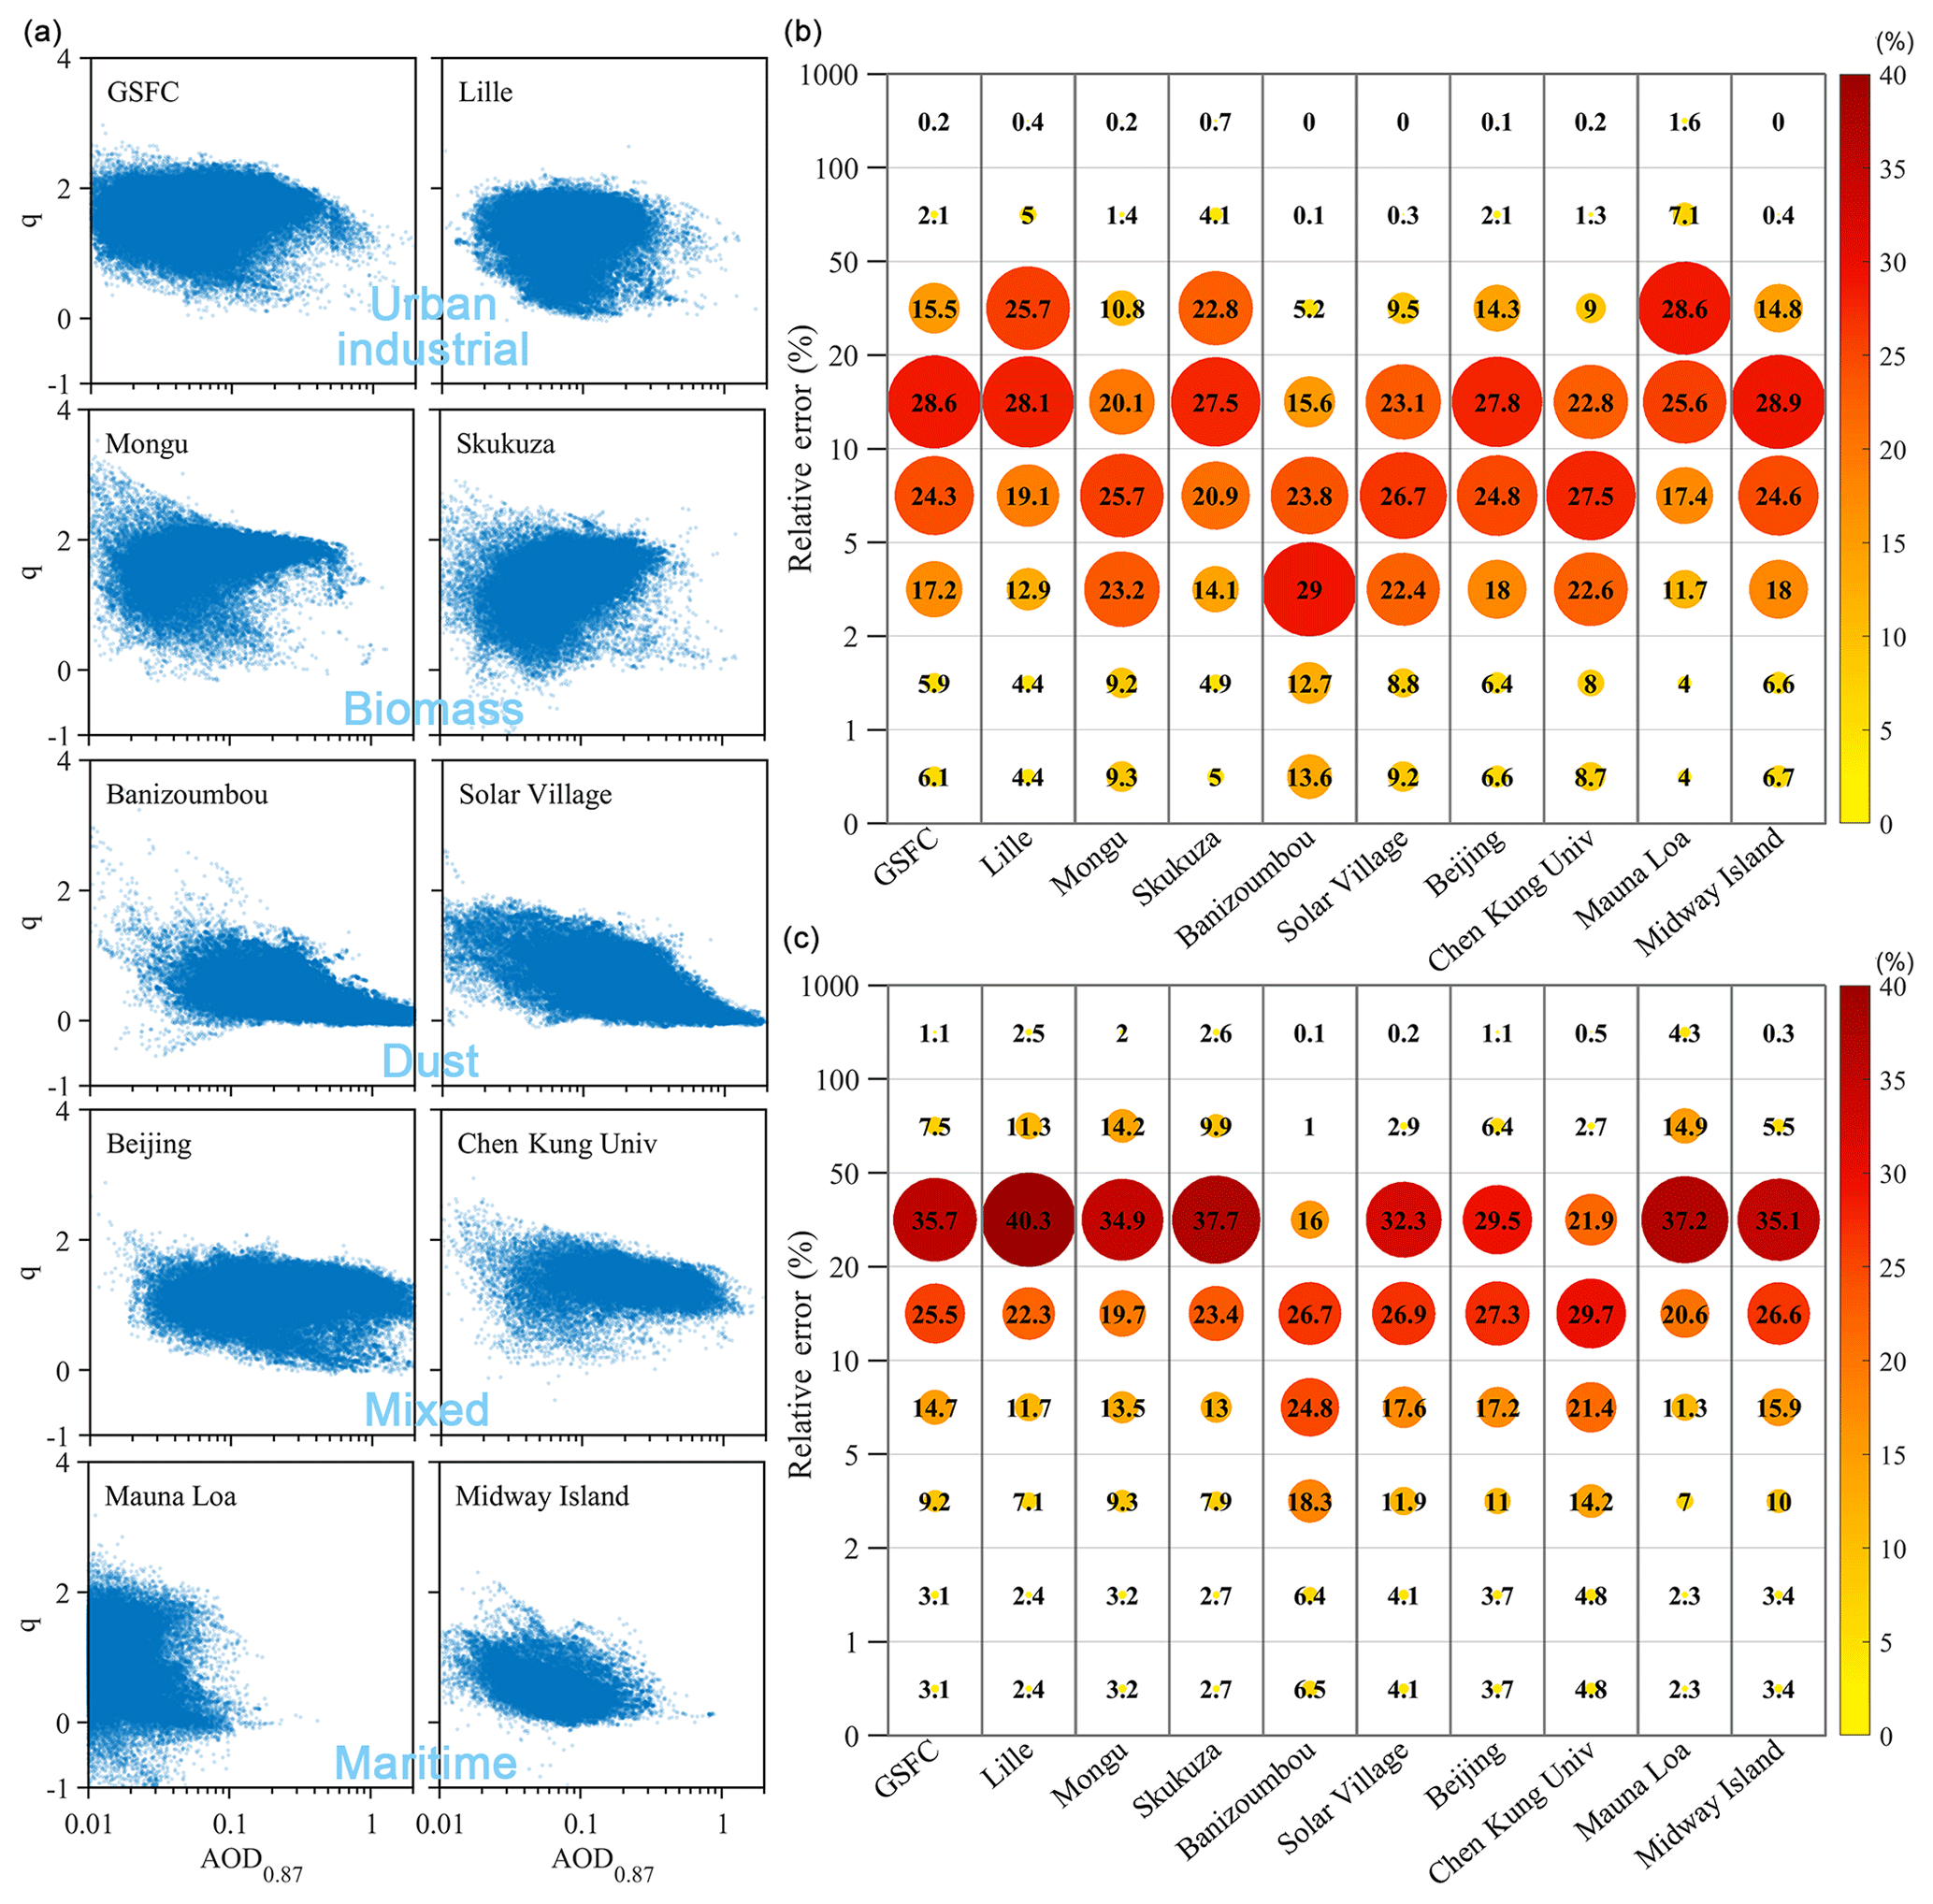
Figure 3Relationship between the Ångström exponent (q) and AOD at a wavelength of 0.87 µm at 10 typical sites (a). Distribution of absolute value of relative error (b, c) of AOD data converted to a wavelength of 0.44 caused by erroneous values of q obtained in the calibration, using scheme 1 and scheme 2, respectively.
Table 1Details of AERONET sites used to obtain Ångström exponents (q) and AOD measurements.
In accordance with the calibration process of visibility meters, we used AOD data at 0.87 and 0.44 µm to obtain a scheme for calculating the Ångström exponent; then, we determined the function for calculating AOD at 0.44 µm from the measured AOD0.87 data, and finally, we evaluated the deviation of calculated values (i.e., AOD data calculated to 0.44 µm) from the measured values (i.e., measured AOD0.44 data). A total of two evaluation schemes were used. The first performed the calibration once a month, using all q data of 1 month to obtain the calibration function for that month. After the calibration was completed, only AOD0.87 measurements of that month were used to calculate the AOD at 0.44 µm. Using the measured AOD0.44 data as the true value, we calculated the absolute value of the relative error of the calculated AOD data for each specific month over the entire time period at each site. Figure 3b shows the ratio of the number of data with different absolute values of relative errors, according to scheme 1, to the total number of data for each specific site. It is clear from Fig. 3b that data with large relative errors exist, even if the calibration is performed once a month. The results of scheme 1 indicate that the values of q may change significantly in a short time. In the second scheme, the calibration was performed monthly, using all q data of 1 month. The difference is that all measured AOD0.87 data, over the entire time period, were used to calculate the AOD at 0.44 µm. The absolute value of the relative errors of calculated AOD data for each specific month was calculated over the whole time period and then grouped into bins of the given intervals, as shown in Fig. 3c. Compared to Fig. 3b, the relative error of the calculated AOD at 0.44 µm is far larger when using scheme 2 compared to scheme 1, indicating that a consistent formula for q does not exist, even for the same site.
Although the relative error of AOD caused by erroneous values of q cannot be used as a conclusion to evaluate the visibility error caused by erroneous values of q, it can still be used as a reference. The values of q can vary widely in the ambient atmosphere, and the absolute error of q is not clear. Therefore, the visibility error caused by q cannot be ignored, and sometimes it is much larger than that caused by the error in the visibility measurement.
The MOR is the visibility measurement benchmark set by WMO, but its measurement wavelength is neither the same as the wavelength of maximum sensitivity of the human eye nor the measurement wavelength of common visibility meters. If the absolute error of q can be guaranteed to be small, there will be no problem; otherwise, additional errors will occur in visibility measurements. The calibration simulations performed in this study indicate that it is impossible not only to obtain reliable Ångström exponents but also to determine the visibility error caused by erroneous values of q using current visibility measurement methods. Considering the wide range of values of q in the ambient atmosphere, the error of visibility caused by erroneous values of q can be much larger than that caused by the measurement error. Therefore, it is impossible to reduce the visibility error by improving the performance of visibility meters alone. Further work is required to improve the measurement accuracy of visibility.
It is also recommended that the historical visibility data are checked. Because the error of visibility caused by erroneous values of q is ignored, the error of visibility data obtained in the measurement may be much larger than the error given by the manufacturers of visibility meters. Therefore, it is necessary to check previous visibility data and obtain visibility measurements corresponding to specific measurement wavelengths for use in future research.
Furthermore, we recommend that the measurement standards of visibility be modified to eliminate the visibility error caused by erroneous values of q. There are two ideas considered here. The first is to regulate the measurement wavelength of visibility meters to be strictly consistent with the reference measurement wavelength. Its advantage is that consistent, reliable, and guaranteed visibility data could be obtained. However, we should be highly cautious regarding the choice of reference measurement wavelength in this case. For example, the MOR requires a light source at a colour temperature of 2700 K, and this measurement wavelength is completely different from that of the human eye. Therefore, as the light emitted by a black body does not consist of a single wavelength, can such a light source be suitable and widely used in visibility measurement? The second idea is to stop using visibility measured at a specific wavelength as the benchmark for visibility measurement. Instead, we should establish measurement standards focussed on the reliability of the measurement of the extinction coefficient and set industry standards according to different usage scenarios.
The Ångström exponent and AOD data are available at Aerosol Robotic Network (https://aeronet.gsfc.nasa.gov/cgi-bin/webtool_inv_v3, AERONET, 2019).
ZZ conceived and designed the experiments, contributed to the analysis of the results, and wrote the paper. HG performed the simulations and generated the figures. LJ processed the data and generated the figures. JA, BZ, HK, and JW were involved in the discussions and helped in the data analysis.
The authors declare that they have no conflict of interest.
This work was supported by the National Key Research and Development Program of China (grant no. 2016YFA0602003). We thank the AERONET principal investigators and their staff for establishing and maintaining the sites used in this study.
This research has been supported by the National Basic Research Program of China (grant no. 2016YFA0602003).
This paper was edited by Pierre Herckes and reviewed by two anonymous referees.
AERONET: Data Download Tool, available at: https://aeronet.gsfc.nasa.gov/cgi-bin/webtool_inv_v3, last access: 15 February 2019.
Ångström, A.: On the atmospheric transmission of Sun radiation and on dust in the air, Geogr. Ann., 11, 156–166, 1929.
Biral: RWS 30-Manual, UK, available at: https://www.biral.com/wp-content/uploads/2018/05/RWS-30-User-Manual-107384.00B.pdf (last access: 27 January 2021), 2018.
Bohren, C. F. and Huffman, D. R.: Absorption and Scattering of Light by Small Particles, Wiley, New York, USA, 1983.
Che, H., Zhang, X., Li, Y., Zhou, Z., and Qu, J. J.: Horizontal visibility trends in China 1981–2005, Geophys. Res. Lett., 34, L24706, https://doi.org/10.1029/2007gl031450, 2007.
Chen, J., Zhao, C. S., Ma, N., Liu, P. F., Göbel, T., Hallbauer, E., Deng, Z. Z., Ran, L., Xu, W. Y., Liang, Z., Liu, H. J., Yan, P., Zhou, X. J., and Wiedensohler, A.: A parameterization of low visibilities for hazy days in the North China Plain, Atmos. Chem. Phys., 12, 4935–4950, https://doi.org/10.5194/acp-12-4935-2012, 2012.
Cheng, Y., Su, H., Koop, T., Mikhailov, E., and Pöschl, U.: Size dependence of phase transitions in aerosol nanoparticles, Nat. Commun., 6, 5923, https://doi.org/10.1038/ncomms6923, 2015.
Feynman, R. P., Leighton, R. B., and Sands, M.: The Feynman Lectures on Physics, The New Millennium Edition, Basic Books, New York City, USA, 2011.
Holben, B. N., Eck, T. F., Slutsker, I., Tanré, D., Buis, J. P., Setzer, A., Vermote, E., Reagan, J. A., Kaufman, Y. J., Nakajima, T., Lavenu, F., Jankowiak, I., and Smirnov, A.: AERONET – A Federated Instrument Network and Data Archive for Aerosol Characterization, Remote Sens. Environ., 66, 1–16, https://doi.org/10.1016/S0034-4257(98)00031-5, 1998.
Huang, W., Tan, J., Kan, H., Zhao, N., Song, W., Song, G., Chen, G., Jiang, L., Jiang, C., Chen, R., and Chen, B.: Visibility, air quality and daily mortality in Shanghai, China, Sci. Total Environ., 407, 3295–3300, https://doi.org/10.1016/j.scitotenv.2009.02.019, 2009.
Hyslop, N. P.: Impaired visibility: the air pollution people see, Atmos. Environ., 43, 182–195, https://doi.org/10.1016/j.atmosenv.2008.09.067, 2009.
Jacobson, M. Z.: Global direct radiative forcing due to multicomponent anthropogenic and natural aerosols, J. Geophys. Res.-Atmos., 106, 1551–1568, https://doi.org/10.1029/2000jd900514, 2001.
Kaufman, Y. J. and Fraser, R. S.: Light extinction by aerosols during summer air pollution, J. Clim. Appl. Meteorol., 22, 1694–1706, https://doi.org/10.1175/1520-0450(1983)022<1694:lebads>2.0.co;2, 1983.
Kessner, A. L., Wang, J., Levy, R. C., and Colarco, P. R.: Remote sensing of surface visibility from space: A look at the United States East Coast, Atmos. Environ., 81, 136–147, https://doi.org/10.1016/j.atmosenv.2013.08.050, 2013.
Kim, I. I., McArthur, B., and Korevaar, E. J.: Comparison of laser beam propagation at 785 nm and 1550 nm in fog and haze for optical wireless communications, Proc. SPIE 4214, Optical Wireless Communications III, https://doi.org/10.1117/12.417512, 2001.
Konstantopoulos, P., Chapman, P., and Crundall, D.: Driver's visual attention as a function of driving experience and visibility, Using a driving simulator to explore drivers' eye movements in day, night and rain driving, Accident Anal. Prev., 42, 827–834, https://doi.org/10.1016/j.aap.2009.09.022, 2010.
Koschmieder, H.: Theorie der horizontalen sichtweite, Beiträge zur Physik der freien Atmosphäre, Meteorol. Z., 12, 33–55, 1924.
Li, C., Martin, R. V., Boys, B. L., van Donkelaar, A., and Ruzzante, S.: Evaluation and application of multi-decadal visibility data for trend analysis of atmospheric haze, Atmos. Chem. Phys., 16, 2435–2457, https://doi.org/10.5194/acp-16-2435-2016, 2016.
Middleton, W. E. K.: Vision Through the Atmosphere, University of Toronto Press, Toronto, Canada, 1952.
Mikhailov, E., Vlasenko, S., Martin, S. T., Koop, T., and Pöschl, U.: Amorphous and crystalline aerosol particles interacting with water vapor: conceptual framework and experimental evidence for restructuring, phase transitions and kinetic limitations, Atmos. Chem. Phys., 9, 9491–9522, https://doi.org/10.5194/acp-9-9491-2009, 2009.
Nebuloni, R.: Empirical relationships between extinction coefficient and visibility in fog, Appl. Optics, 44, 3795–3804, https://doi.org/10.1364/AO.44.003795, 2005.
Optec: Model LPV-3 and Model LPV-4-technical manual, USA, available at: https://www.optecinc.com/visibility/pdf/lpv_3&4_technical_manual_rev4.pdf (last access: 27 January 2021), 2011.
Schuster, G. L., Dubovik, O., and Holben, B. N.: Angstrom exponent and bimodal aerosol size distributions, J. Geophys. Res.-Atmos., 111, D07207, https://doi.org/10.1029/2005JD006328, 2006.
Seinfeld, J. H. and Pandis, S. N.: Atmospheric Chemistry and Physics: From Air Pollution to Climate Change, Wiley, New York, USA, 2016.
Singh, A., Bloss, W. J., and Pope, F. D.: 60 years of UK visibility measurements: impact of meteorology and atmospheric pollutants on visibility, Atmos. Chem. Phys., 17, 2085–2101, https://doi.org/10.5194/acp-17-2085-2017, 2017.
Vaisala: Transmissometer LT31-Datasheet, Finland, available at: https://www.vaisala.com/sites/default/files/documents/LT31-Datasheet-B210416EN-E.pdf (last access: 27 January 2021), 2018.
Wang, K., Dickinson, R. E., and Liang, S.: Clear Sky Visibility Has Decreased over Land Globally from 1973 to 2007, Science, 323, 1468–1470, 2009.
Watson, J. G.: Visibility: Science and Regulation, J. Air Waste Manag. Assoc., 52, 628–713, https://doi.org/10.1080/10473289.2002.10470813, 2002.
WMO: Ninth session of the Executive Committee: abridged report with resolutions, WMO-No. 67, World Meteorological Organization, Geneva, Switzerland, 335 pp., 1957.
WMO: The First WMO Intercomparison of Visibility Measurements: Final Report WMO/TD-No. 401, (Griggs, D. J., Jones, D. W., Ouldridge, M., and Sparks, W. R., World Meteorological Organization, Geneva, Switzerland, 153 pp., 1990.
WMO: Guide to Instruments and Methods of Observation, Volume I – Measurement of Meteorological Variables, World Meteorological Organization, Geneva, Switzerland, 573 pp., 2018.
Wu, J., Luo, J., Zhang, L., Xia, L., Zhao, D., and Tang, J.: Improvement of aerosol optical depth retrieval using visibility data in China during the past 50 years, J. Geophys. Res.-Atmos., 119, 13370–13387, https://doi.org/10.1002/2014jd021550, 2014.
Zhang, Z., Shen, Y., Li, Y., Zhu, B., and Yu, X.: Analysis of extinction properties as a function of relative humidity using a κ-EC-Mie model in Nanjing, Atmos. Chem. Phys., 17, 4147–4157, https://doi.org/10.5194/acp-17-4147-2017, 2017.
- Abstract
- Introduction
- Assumptions in the simulation calibration
- Simulation of visibility meter calibration
- Discussion on calibration results of visibility meters
- Applicability of calibration
- Estimation of visibility error attributed to q
- Conclusions and recommendations
- Data availability
- Author contributions
- Competing interests
- Acknowledgements
- Financial support
- Review statement
- References