the Creative Commons Attribution 4.0 License.
the Creative Commons Attribution 4.0 License.
 | 13 Apr 2021
Design and characterization of a new oxidation flow reactor for laboratory and long-term ambient studies
Ningjin Xu
Oxidation flow reactors (OFRs) are frequently used to study the formation and evolution of secondary aerosol (SA) in the atmosphere and have become valuable tools for improving the accuracy of model simulations and for depicting and accelerating realistic atmospheric chemistry. Driven by rapid development of OFR techniques and the increasing appreciation of their wide application, we designed a new all-Teflon reactor, the Particle Formation Accelerator (PFA) OFR, and characterized it in the laboratory and with ambient air. A series of simulations and experiments were performed to characterize (1) flow profiles in the reactor using computational fluid dynamics (CFD) simulations, (2) the UV intensity distribution in the reactor and the influence of it and varying O3 concentration and relative humidity (RH) on the resulting equivalent OH exposure (OHexp), (3) transmission efficiencies for gases and particles, (4) residence time distributions (RTDs) for gases and particles using both computational simulations and experimental verification, (5) the production yield of secondary organic aerosol (SOA) from oxidation of α-pinene and m-xylene, (6) the effect of seed particles on resulting SA concentration, and (7) SA production from ambient air in Riverside, CA, US. The reactor response and characteristics are compared with those of a smog chamber (Caltech) and of other oxidation flow reactors: the Toronto Photo-Oxidation Tube (TPOT), the Caltech Photooxidation Flow Tube (CPOT), the TUT Secondary Aerosol Reactor (TSAR), quartz and aluminum versions of Potential Aerosol Mass reactors (PAMs), and the Environment and Climate Change Canada OFR (ECCC-OFR).
Our studies show that (1) OHexp can be varied over a range comparable to that of other OFRs; (2) particle transmission efficiency is over 75 % in the size range from 50 to 200 nm, after minimizing static charge on the Teflon surfaces; (3) the penetration efficiencies of CO2 and SO2 are 0.90 ± 0.02 and 0.76 ± 0.04, respectively, the latter of which is comparable to estimates for LVOCs; (4) a near-laminar flow profile is expected based on CFD simulations and suggested by the RTD experiment results; (5) m-xylene SOA and α-pinene SOA yields were 0.22 and 0.37, respectively, at about 3 × 10¹¹ molec. cm−3 s OH exposure; (6) the mass ratio of seed particles to precursor gas has a significant effect on the amount of SOA formed; and (7) during measurements of SA production when sampling ambient air in Riverside, the mass concentration of SA formed in the reactor was an average of 1.8 times that of the ambient aerosol at the same time.
- Article
(2719 KB) - Full-text XML
-
Supplement
(447 KB) - BibTeX
- EndNote


Atmospheric aerosols play major roles in air pollution, global climate change, and visibility reduction (Seinfeld and Pandis, 2006). The complex mixtures of inorganic and organic species present in atmospheric aerosols originate from both direct, or primary, emissions and production of secondary aerosol (SA) from atmospheric reactions. Organic aerosol (OA) makes up a substantial fraction of atmospheric aerosols and is comprised of primary OA (POA) that is directly emitted in the particle phase and secondary OA (SOA) that is formed in the atmosphere through reactions of gas phase precursors. SOA forms when the reaction of volatile organic compounds (VOCs) with gas phase oxidants produces less-volatile functionalized compounds (Pankow, 1994; Jimenez et al., 2009; George and Abbatt, 2010) and when water-soluble organics dissolve in the aqueous phase (aerosol water or cloud droplets) and are subsequently oxidized (Lim et al., 2010; Ervens et al., 2011). However, the mechanisms of SOA formation are still poorly understood and are continuously extended and refined. Part of the complexity of SOA formation arises from the numerous oxidation reactions involving the large number of VOCs in the atmosphere (Aljawhary et al., 2016). Additionally, after formation from precursor gases the SOA can evolve through multiphase and multi-generational processes, forming more complex distributions of compounds comprised of thousands of molecules (Xu et al., 2015; Chen et al., 2018; Shrivastava et al., 2019).
For decades, comprehensive laboratory studies on the sources, formation, and aging of SOA have been conducted in batch-mode atmospheric reactors, which are also known as environmental chambers or smog chambers (Pandis et al., 1991; Carter et al., 2005; Song et al., 2005; Weitkamp et al., 2007). Though such chambers can create environments that closely simulate the complexity of the atmosphere, results from their use are affected by the loss of particles and semi-volatile compounds to the walls (Zhang et al., 2014; Nah et al., 2016, 2017), by limitations on experiment duration and extent of reaction, and by potential leakage of room or outside air into the Teflon bags (Pierce et al., 2008; Matsunaga and Ziemann, 2010; Krechmer et al., 2015). Moreover, the size of common smog chambers, which typically range from about 5 to 250 m3 (Lonneman et al., 1981; Mentel et al., 1996; Wang et al., 2014; Tkacik et al., 2017), imposes a substantial restriction on their use for studying aerosol formation in ambient air (Bruns et al., 2015). Oxidation flow reactors (OFRs) have been developed as a complement to traditional smog chambers and offer advantages such as providing oxidant exposure that can greatly exceed that possible in smog chambers and is variable over a wide range (Kroll et al., 2009), portability for use in the field (Wong et al., 2011), and the ability to investigate time-varying sources of SA (Kang et al., 2007). Inside an OFR, extremely high concentrations of hydroxyl radical and/or other oxidants are maintained (up to 1010 molec. cm−3 for OH), such that sampled air experiences the equivalent of several hours to days or even weeks of oxidative chemistry over the residence time of just a few minutes. Shorter residence times minimize interaction of the gases and particles with walls (Keller and Burtscher, 2012) and permit measurements of dynamic environments and sources. The portability and flexibility of OFRs also make them versatile, with the same experimental system applicable for a variety of laboratory and field measurements. Their fast response also makes them better suited than smog chambers for experiments probing the influence of a matrix of parameters on SOA formation (Slowik et al., 2012; Palm et al., 2018).
Previous investigations of potential SA formation using different types of OFRs have resulted in optimized designs and strategies for studying specific sources or processes, such as measuring time-resolved SOA formation from gasoline vehicles during a transient driving cycle (Karjalainen et al., 2016) and from rapidly changing vehicular emission sources (Simonen et al., 2017). Several groups have employed OFRs to study SA formation from ambient air, with examples including investigation of the variability of precursor gases and the resulting SOA in a ponderosa pine forest (Palm et al., 2016), high-time-resolution quantification of SOA formation from ambient air in central Amazonia (Palm et al., 2018), and observation of SOA formation and aging from urban air (Ortega et al., 2016). For laboratory-based studies, the concentrations and SOA yield (Y) for certain precursors can serve as a reference to estimate total SOA potential (Iinuma et al., 2004; Loza et al., 2014). Yields determined for common precursors can also provide a quantitative measure of performance of a reactor relative to others of varying design and purpose (Kang et al., 2011; Lambe et al., 2015). Numerous studies have been conducted investigating differences in the SOA yield between OFRs and large environmental smog chambers (Matsunaga and Ziemann, 2010; Bruns et al., 2015; Lambe et al., 2011, 2015). For example, Lambe et al. (2011) showed that the SOA yield they observed in a PAM reactor is similar to that reported for the Caltech smog chamber. Other studies focused on SOA produced from different precursor gas sources. For example, Li et al. (2019) used a new OFR (the Environment and Climate Change Canada OFR; ECCC-OFR) to evaluate the SOA yields of single compounds (alkanes and α-pinene) and of complex precursor mixtures, such as emissions from oil sands. Ahlberg et al. (2017) found that using single-precursor experiment yields could lead to underestimated SOA mass loadings if aerosol dynamics is not properly accounted for. Cubison et al. (2011) characterized the evolution of laboratory biomass burning emissions using a PAM reactor, and Kang et al. (2011) estimated the SOA-forming potential of model organic compounds.
Reactor design is a critical step in the development of an OFR system and determines overall applicability and performance. The geometry and dimensions of the reactor have substantial impacts on velocity profiles, residence time distributions, wall effects, and extent of reaction. The reactor design mainly includes the selection of materials, the inlet configuration, the diameter-to-length ratio, the body length, the strategies for mixing the reactants, and the mode(s) of generating the hydroxyl radical or other oxidant(s). For example, some inlet designs can lead to dead zones near the reactor walls, increasing the difficulty of achieving laminar flow in the entrance of the reactor and broadening the residence time distribution (RTD) (Mitroo et al., 2018). The position and power output of the UV lamp(s) are determined by the reactor materials and their transparency and by temperature control requirements during operation (Kang et al., 2007; Ezell et al., 2010). With most OFRs, the lamps are either mounted on the inner surface for metal-wall reactors or outside for quartz-based reactors. The emitted wavelengths and intensity uniformity of the UV lamp(s) are also important considerations in reactor design (Li et al., 2015). Selection of wall materials and any surface treatments is guided by an application-dependent balance of the importance of loss of gas-phase compounds or delays in their transfer, loss of charged particles to non-conductive materials, and UV transmittance for designs for which the lamps are outside of the reactor. Common materials used in OFRs include chromate-coated aluminum (e.g., PAM), silicon-coated stainless steel (e.g., TPOT), and quartz (e.g., CPOT, TSAR, and ECCC-OFR). Recent studies of organic gas transmission through common tubing types described by Deming et al. (2019) suggest perfluoroalkoxy (PFA) and fluorinated ethylene propylene (FEP) Teflon may be alternative choices for applications for which minimizing wall losses of gases is a priority. Kang et al. (2007) described the prototype PAM chamber, a 19 L cylinder made of Teflon FEP film. To the best of our knowledge, there are no previous studies describing that all-Teflon OFR, and no data are available that show the advantages and disadvantages of the all-Teflon reactor compared with those constructed from other materials such as quartz and metal.
Here we present the design of a new all-Teflon OFR called the Particle Formation Accelerator or PFA OFR. The reactor consists of a vertically oriented tube, with the inlet at the bottom and outlet at the top. One notable design difference between the PFA OFR and other OFRs is its use of a relatively small and low power lamp at the top of the reactor, which promotes thermal stratification and minimizes convective mixing. We report the results of computational, laboratory, and field studies through which it was characterized. UV intensity and total OH exposure (OHexp) were quantified inside the flow tube. The flow profile in the OFR was modeled and the resulting residence time distributions of gases and particles were both modeled and experimentally verified. Two precursor species were used to investigate SOA yield and the dependence of that yield on variations in parameters such as precursor concentrations, OH exposure, and the presence and concentration of seed particles. SOA mass yields are compared with those reported in the literature for the same VOCs. Field testing was conducted by measuring SA formation in ambient air sampled in Riverside, CA, US. Collectively, these tests confirm the utility of the PFA OFR for both laboratory and field studies.
2.1 Reactor design
2.1.1 PFA OFR and flow dynamic characterization
A cutaway view of the PFA OFR is shown in Fig. 1. It consists of a PFA-Teflon tube sealed between inlet and outlet end caps that were machined from blocks of polytetrafluoroethylene (PTFE). The reactor is oriented vertically, with the inlet at the bottom and outlet at the top. The PFA tube has a volume of 7.5 L and dimensions of 151 cm length × 7.8 cm ID. Both end caps have an OD of 10.2 cm and are sealed with the reactor tube by FEP-encapsulated O-rings. The small diameter-to-length ratio of the reactor section of 0.052 was selected to result in a narrow residence time distribution in the flow tube and a more uniform OH exposure (Lambe et al., 2011). However, the small diameter also results in a reactor surface-area-to-volume ratio of 0.53 cm−1 that is higher than that of the TPOT (0.33 cm−1) and PAM (0.23 cm−1).
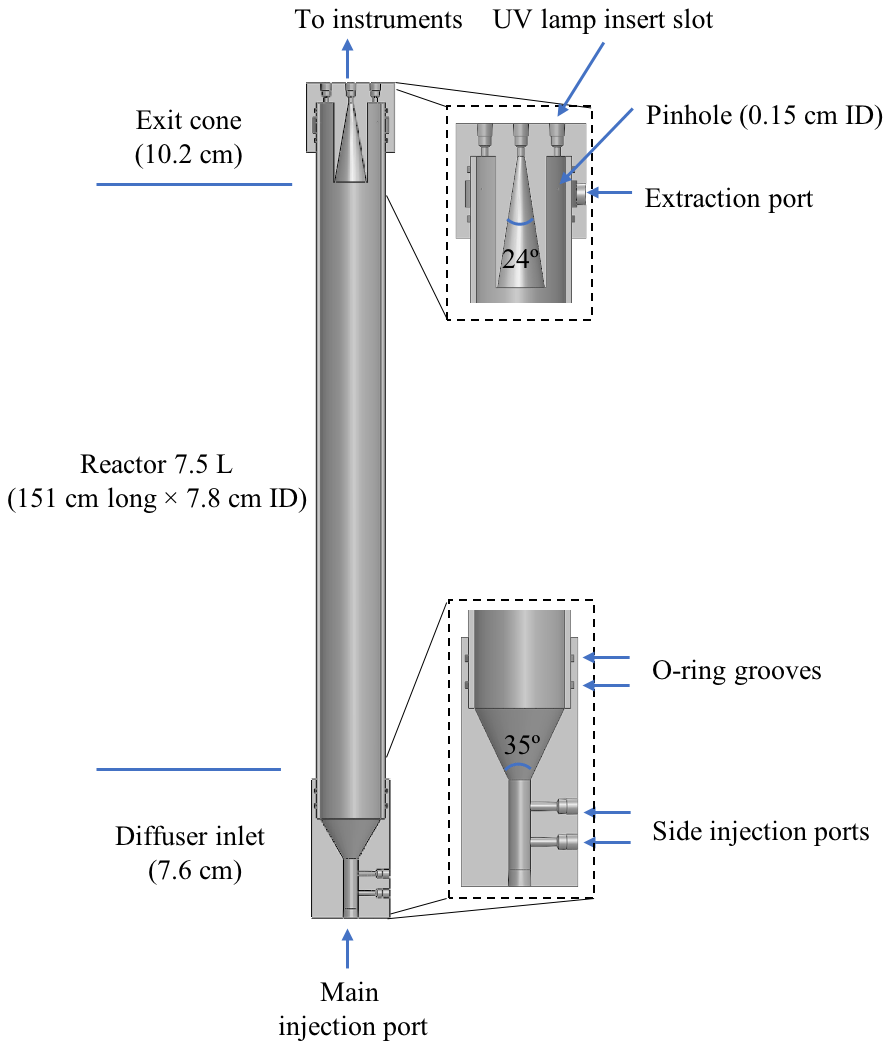
Some design elements of the PFA OFR are similar to those of other recently developed OFRs (Kang et al., 2007; Karjalainen et al., 2016; Huang et al., 2017), though there are some important differences as well. The inlet end cap has a 5.1 cm length × 1.3 cm ID bore used as the main sample air injection port, two side injection ports for introducing seed particles and O3, and a cone-shaped diffuser. That cone, which serves as the transition between the inlet injection port and the reactor tube, has an angle of 35∘, which is close to that suggested by Huang et al. (2017) for minimizing recirculation. The sample flow gradually expands and is expected to be fully developed shortly after entering the reactor tube. A single length of PFA tube (Ametek FPP P/N 33HPSC40x3.00) is used as the main body in order to simplify construction. Only the central ∼ 50 % of the flow through the reactor is extracted and analyzed. That sample flow converges through an exit cone in the outlet end cap that tapers at an angle of 24∘ from an ID of 4 cm to the 0.33 cm ID of the outlet bore through the top of the end cap. The outer ∼ 50 % of the flow that is most influenced by interactions with the reactor walls flows into an annulus surrounding it. From there, it is pulled through 12 uniformly spaced ∼ 0.15 cm ID pinholes drilled through the PFA pipe about 3 cm from the top. The flow extracted through those pinholes travels into a channel between the flow tube and the end cap and then through a port on the top cap where it is purged by a vacuum pump. The diameter of the opening into the sample exit cone was selected such that, for the expected parabolic velocity profile, the nominal 1:1 sample–side flow ratio does not perturb gas streamlines.
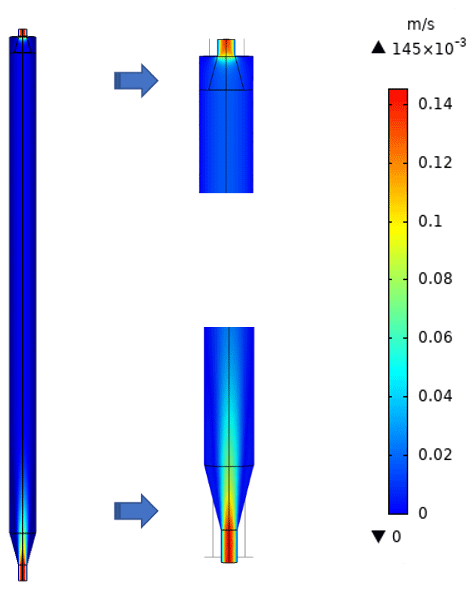
To characterize the flow field and velocity distribution profile inside the PFA OFR, computational fluid dynamics (CFD) simulations were performed using a 3D geometry model in COMSOL Multiphysics 5.4 software, which has been used by several research groups to optimize and evaluate their reactor designs and to explore suitability for applications in atmospheric and aerosol chemistry studies (Renbaum-Wolff et al., 2013; Zhang et al., 2015; Huang et al., 2017). The 2D geometry velocity profile simulation result is shown in Fig. 2. The simulation used the actual design and dimensions of the PFA OFR. The flow at the entrance to the sample outlet tube of the main body is assumed to be fully developed and laminar, while an atmospheric pressure boundary condition at the annular outflow boundary and the no-slip condition at all the other boundaries were applied. Though high velocity extends into the central tube flow region above the inlet, within 15 cm from the entrance of the diffuser cone the velocity profile is nearly parabolic, with a decrease in the maximum velocity over the entrance length from 12 to 3 cm s−1. The simulation suggests that jetting is minimal and that the area influenced by recirculation is negligible.
2.1.2 UV source and intensity profile
The outlet end cap has NPT thread ports to accommodate one or two 0.5 cm OD lamps. For the results discussed here, one 5.1 cm length × 0.5 cm OD ozone-free (254 nm only) low-pressure mercury lamp (BHK Inc; PN 80-1057-01) was inserted into the cap. Though the lamp is not isolated from the flow, its position in the side purge flow annulus prevents any contact between it and the sampled flow. The handle of the UV lamp is secured and sealed with a Swagelok male connector fitting. Use of a relatively small and low power lamp at one end of the reactor is perhaps the most significant design difference between the PFA OFR and others. One objective of the approach was to promote thermal stratification caused by the hot lamp at the top of the reactor in order to minimize convective mixing. An obvious complication is that UV intensity, and therefore OH production, is expected to decay with distance through the long reactor tube. To mitigate that decay, materials were selected that are highly UV reflective, such that emitted photons penetrate far down the reactor tube as they are repeatedly reflected by the walls. The PFA tube is non-absorbing at 254 nm but is not opaque and would allow UV to leak out. Thus, the tube is wrapped with an inner layer of a highly reflective 0.32 cm thick expanded PTFE gasket (ePTFE; Inertech) and an outer layer of aluminized Mylar (Vivosun), though the combination of materials results in sufficiently high reflectance for the 254 nm emission peak of a mercury lamp. Silva et al. (2010) showed that the reflectance of ePTFE at 175 nm is significantly lower, with the difference thought to be due to absorption by O2 trapped in pores. Reflectance at the 185 nm emission peak of a mercury lamp is expected to be slightly higher than that at 175 nm, but it is likely that a significant intensity gradient would still exist and so a 254 nm only lamp is used, and ozone is generated externally and introduced with the sample flow. The high reflectance of the ePTFE at 254 nm directs UV back into the reactor tube and results in increased intensity and uniformity. This illumination approach reduces power consumption and heat generation, thereby simplifying temperature control and long-term deployment for use in the field.
2.1.3 Temperature control
Temperature uniformity within an OFR and temperature stability over time impact overall performance. Incomplete removal of the lamp heat can cause convective mixing through the reactor, resulting in increased loss of particles and gases and broadening of the RTD (Lambe et al., 2011; Mitroo et al., 2018). Techniques used to minimize heating by the lamps include enclosing them in sleeves that are continuously flushed with N2, but continuously controlling temperature during long-term field studies can still be challenging (Li et al., 2019). The PFA OFR assembly is protected by a shell made from 13 cm × 13 cm square aluminum tube. Two U-bolts mounted through the surface of the aluminum shell hold the reactor securely, preventing accumulation of static charge that could otherwise result from shifting between the reactor body and the ePTFE and Mylar layers. The shell also provides a barrier to reduce the accumulation of static charge from inadvertent touching or other contact. A total of four fans are mounted on opposite faces near the top and bottom of the shell. The fans near the bottom bring air into the space between the reactor and the shell and those near the top exhaust it, which removes heat generated by the low-power UV lamp and weakens the temperature gradient through the whole system. The average working temperature for the tests reported below was approximately 23.6 ∘C, which is close to the average room temperature of 22.7 ∘C. A temperature rise of less than 2 ∘C was observed during continuous operation over several days.
2.2 Experimental setup
The PFA OFR is an OFR254-type oxidation flow reactor, in which O3 must be generated externally and introduced with the sample flow (Li et al., 2015). Among the advantages of OFR185-type oxidation flow reactors is their ability to be operated without an inlet, which is often desirable for field investigations. As noted above, reflectance of 185 nm UV by the ePTFE is insufficient to produce the intensity and spatial uniformity required to rely on photolysis of O2 and H2O for generation of O3 and OH. Instead, the OH radicals are produced as the 254 nm UV radiation photolyzes O3 introduced with the sample to generate excited oxygen atoms, O(1D), which then react with H2O in ambient air or humidified laboratory air. For the laboratory experiments described here, O3 and humidified zero air were mixed with the tracer or precursor gas(es) prior to being introduced into the reactor inlet. The schematic of the PFA OFR and associated experimental equipment for laboratory and field experiments are shown in Fig. 3a and b, respectively. Ozone was produced by flowing zero air through an O3 generator (Jelight Company Inc. Model 610). The flow rate was controlled to 0.4 L min−1 and the O3 mixing ratio was monitored by an O3 analyzer (Teledyne Model T400U). The resulting O3 concentration can be easily and precisely adjusted by changing the position of a sleeve that covers a portion of the UV lamp or by adjusting the flow rate of air through the generator. When used, seed particles were generated using an atomizer and differential mobility analyzer (DMA), as is described in the RTD experiment section. The flow at the outlet of the reactor was split using a Swagelok tee. From one leg of the tee a 150 cm length × 0.635 cm OD PFA tube was connected to gas measurement instruments including the O3 analyzer, an SO2 analyzer (Teledyne Model T100UP), and a gas chromatograph with flame ionization detector (GC-FID, SRI Inc. Model 8610C). A 0.95 cm OD stainless tube was connected to the other leg of the tee and carried the aerosol exiting the reactor to a fabricated scanning mobility particle sizer (SMPS), which measured the particle size distribution roughly once every 4 min. For the ambient air experiments, outdoor air was brought inside the lab and to the PFA OFR with a 200 cm length × 0.95 cm OD anti-static PFA tube (Fluorotherm H2 PFA). A 150 cm × 0.95 cm OD length of copper tube was used as a bypass in parallel with the OFR, with sampling alternated between the two through the use of an automated three-way valve. The residence time of the bypass line was approximately 2 s. Instrument operation and experimental sequencing were controlled using National Instruments LabVIEW software.
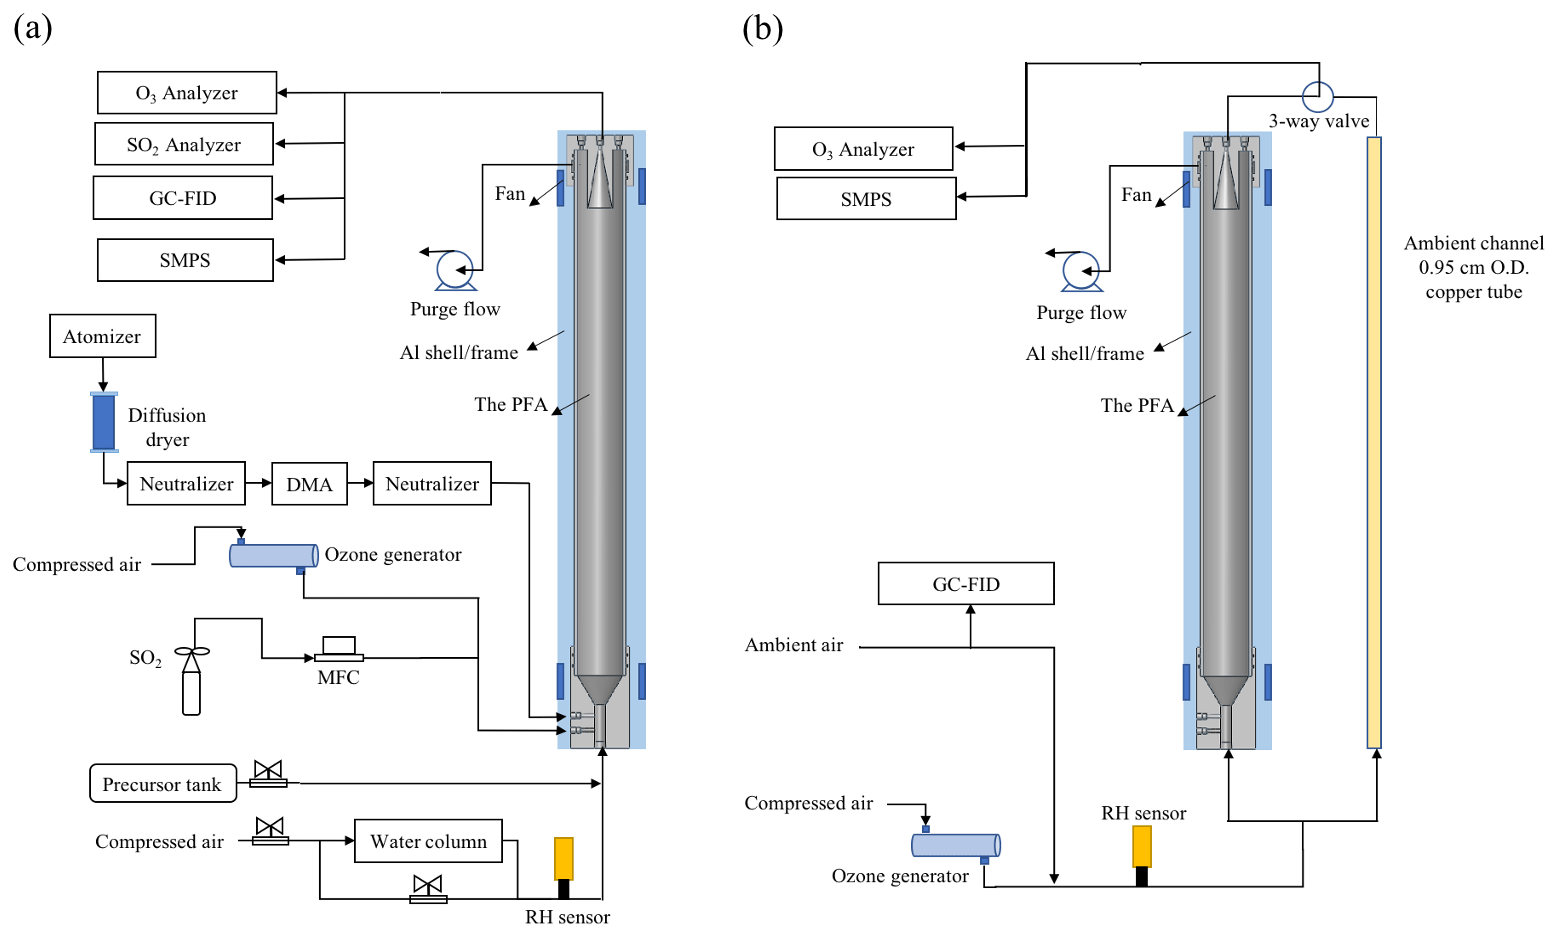
Figure 3Schematic diagram of the PFA OFR and associated experimental setup for (a) the laboratory and (b) field experiments.
The total flow rate for the laboratory tests was 3.5 L min−1, corresponding to an average residence time of 130 s, while those of the PAM, TPOT, and CPOT are about 100, 110, and 1500 s, respectively. A purge flow rate of 1.5 L min−1 was extracted from the annulus outside of the sample exit cone as described above. The ambient experiments were conducted using a slightly lower flow rate of 3 L min−1, resulting in a residence time of 150 s, and with a 1.5 L min−1 purge flow.
2.3 RTD experiments
The residence time distributions of particles and gases were experimentally characterized and compared with results obtained from an ideal laminar flow model simulation. The experimental configuration is illustrated in Fig. 3a. Monodisperse ammonium sulfate (AS) particles were generated by atomizing a 0.04 M aqueous AS solution with an atomizer (TSI Inc. Model 3076). The atomized particles were dried by directing them through a silica gel/molecular sieve diffusion column. The size of the particles was selected using a differential mobility analyzer (DMA). The aerosol was brought to a steady state charge distribution before and after size classification by the DMA using soft X-ray neutralizers. The residence time distributions (RTDs) for particles were characterized by introducing 30 s pulses of 200 nm AS particles into the PFA OFR while measuring the particle counts in the outlet flow with a condensation particle counter (CPC, TSI Inc. Model 3762).
RTDs for gases were characterized by injecting 10 s pulses of SO2 and CO2. Pulses of a compressed gas mixture containing 27.5 ppm SO2 in nitrogen (Airgas) were injected into a continuous zero air flow, with the pulse width controlled by opening and closing a mass-flow controller (Alicat Scientific, PN MC-100SCCM-D/5M). The SO2 concentration was monitored from the sampling outlet of the PFA OFR with an SO2 analyzer. Prior to the measurements, the reactor was purged with zero air for as long as required to reach a measured SO2 mixing ratio that was stable at less than 0.5 ppb. To test the response function of a gas that would not react on or be taken up by the walls, 10 s pulses of CO2 were injected from a custom-made CO2 tank, with the pulses controlled by manually opening and closing a valve. The CO2 concentration was measured at the outlet of the PFA OFR by a gas analyzer (Li-COR Biosciences, Model Li-840A). A CO2 background of 400 ppm was subtracted from the results because it was not removed by the zero air generator. The residence time distributions of both gases and particles were determined with the UV lamp turned on and turned off. The whole process described above was repeated three times.
2.4 Gas and particle loss quantification
Particle losses in the reactor were characterized using AS particles within the diameter range from 50 to 200 nm. The monodisperse AS particles were size-selected by a DMA and then passed through a soft X-ray neutralizer after size classification. Upon exiting the neutralizer, the size-dependent fraction of particles that possess at least one positive or negative charge varies from about 41 % for 50 nm particles to 71 % for 200 nm particles (Wiedensohler, 1988). The flow rate through the reactor was kept at 3.5 L min−1.
Particles were directed through the reactor or through a 150 cm length × 0.95 cm OD copper tube bypass, with sampling alternated between the two through the use of an automated three-way valve. The particle transmission efficiency was calculated from the ratio of the particle concentrations measured at the outlets of the reactor and bypass using a CPC (TSI Inc. Model 3760A). After a set of initial tests, the static charge on the PFA, PTFE, and ePTFE surfaces was minimized by pushing concentrated bipolar ions generated with an electronic ionizer (Simco-Ion Inc., Fusion) through and around the flow tube for more than 12 h. Additional measurements of 50 and 100 nm particles were made after minimizing the static charge. The measurements were repeated 2 or 3 times for each particle size, with agreement between measurements found to be to within ±5 % when sampling the same diameter.
Gas losses were determined by continuously injecting gas mixtures containing CO2 and SO2 and measuring the ratio of the concentrations downstream and upstream of the reactor with the CO2 and SO2 analyzers identified above. For the SO2 transmission efficiency tests, the PFA OFR walls were first passivated by flowing SO2 gas through the OFR for at least 15 min and until a stable concentration was measured by the SO2 analyzer connected to the outlet.
2.5 UV intensity profile and OH exposure level
The 254 nm intensity at multiple positions inside the reactor was examined using a spectroradiometer (OceanView, Model USB4000 UV-FL) via a fiber-optic cable. The influence of the reflective material(s) wrapped around the flow tube was assessed by measuring when it was wrapped only with aluminum-coated Mylar and when it was wrapped with a combination of a ePTFE gasket (inner layer) and Mylar (outer layer). The OH production rate and corresponding equivalent exposure was varied by changing the UV intensity, RH, and injected O3 concentration. Here, OHexp is defined as the OH concentration (molec. cm−3) multiplied by the mean residence time of the sample in the reactor. The UV intensity from the lamp was controlled over a range of 50 % to 100 % using a lamp manager (BHK. Inc, PN IM10003) by stepping the control voltage from 0 to 5 V. The O3 concentration in the reactor was varied by adjusting the position of a sleeve over the lamp in the ozone generator. To quantify OHexp, SO2 was injected with initial mixing ratios ranging from 150 to 250 ppb. For each test, the UV lamp was initially off and was turned on only after the SO2 concentration measured at the outlet was stable. After the lamp was turned on, the concentration of SO2 was monitored at the reactor outlet. The distribution of the O3 and OH within the PFA OFR was not measured in the current study. Future studies will be designed to investigate their profiles that result from that of UV. The typical concentration pattern observed is shown in Fig. S1. OH exposure was quantified for each UV lamp intensity and O3 concentration combination using Eqs. (1) and (2) (Davis et al., 1979; Atkinson et al., 2004). The procedure was repeated 2 or 3 times at each UV intensity.
Here, is cm3 molec.−1 s−1, [SO2]0 and [SO2]f are SO2 concentrations measured at the reactor outlet without and with the UV lamp turned on.
3.1 UV intensity distribution and OHexp level
The normalized UV intensity as a function of distance from the lamp located at the top of the reactor is shown in Fig. 4a. The normalized UV intensity is calculated as the intensity at a specified position divided by the maximum measured inside the PFA OFR. As expected, an intensity gradient exists, with decreasing intensity with distance from the lamp. The gradient is much steeper when the flow tube is not wrapped with the ePTFE gasket. Without the ePTFE gasket, the intensity near the bottom of the tube is only 15 % of that at the top. Adding the ePTFE resulted in an intensity 30 cm from the bottom that was approximately 5 times higher than that with only the Mylar. The relative UV intensity enhancement (ERIntensity) is shown as a function of position in Fig. 4b. The UV intensity is enhanced by a factor of between about 2 and 6 with the addition of the ePTFE layer. In addition to increasing the average UV intensity, the use of the reflective gasket reduced the gradient in intensity, resulting in more uniform OH generation throughout the reactor.
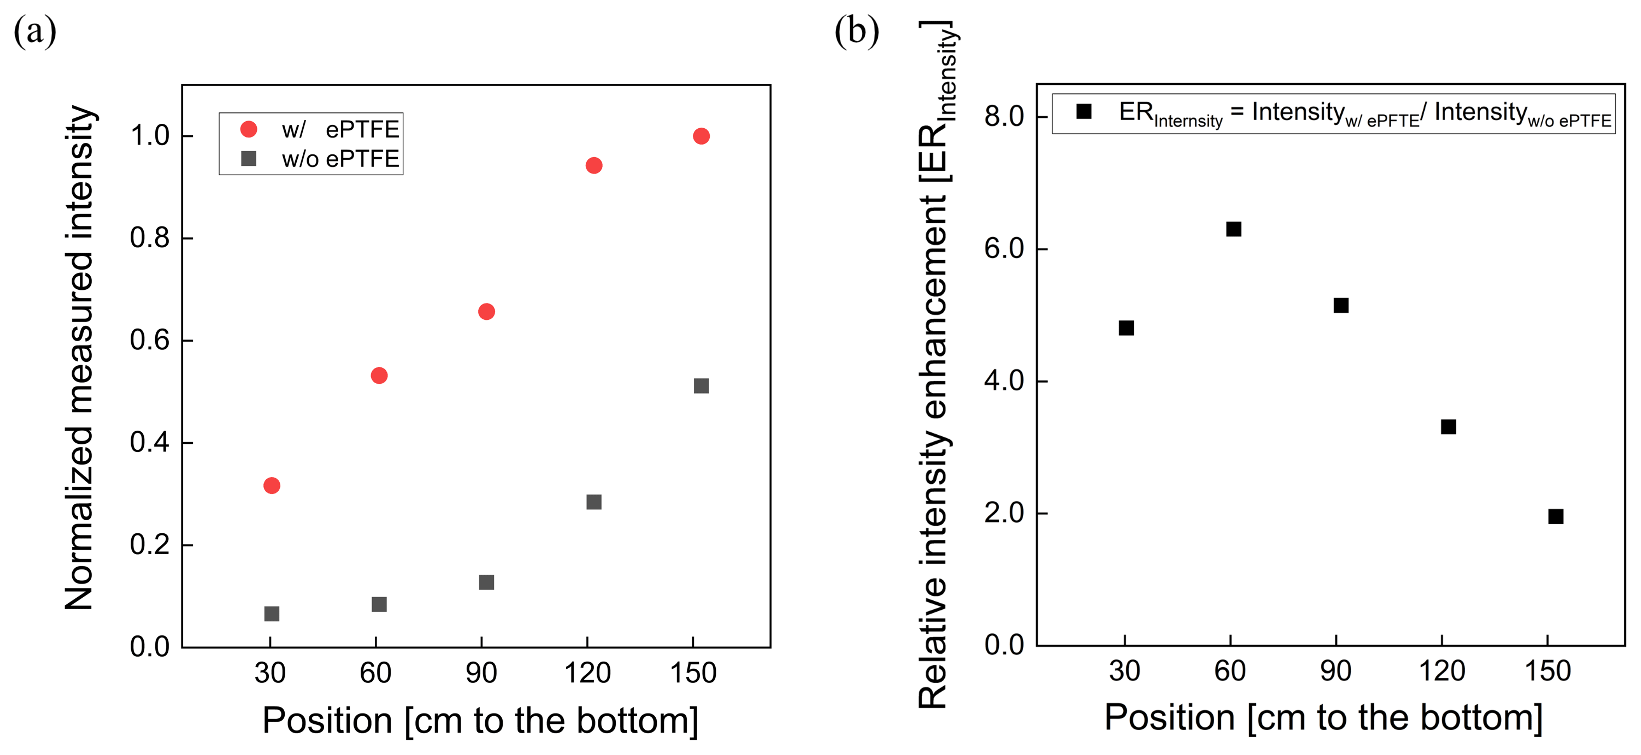
Figure 4Relative UV intensity profile (a) and intensity enhancement (b) achieved when the flow tube was wrapped with a reflective ePTFE gasket.
The maximum photon flux (with the maximum lamp power) was estimated for ozone concentration measured at the exit of the OFR and known RH using a photochemical model used in previous studies (Li et al., 2015; Peng et al., 2015, 2019). The input photon flux of the model was adjusted to match the measured ozone concentration and OH exposure, which resulted in a maximum photon flux estimate of ∼ 2.4 × 10¹⁴ photons cm−2 s−1 and 1.1 × 10¹⁵ without and with the ePTFE layer, resulting in about 1.5 and 7 times, respectively, that calculated from the lamp output power when neglecting any reflection. The OH concentration and resulting OHexp were varied by varying the UV intensity, the added O3 concentration, and the RH. Figure 5 shows the sensitivity of OH exposure as a function of photon flux at 254 nm with and without ePTFE wrapped around the flow tube. Without the ePTFE wrap around the reactor (black solid symbols), the OH concentration ranged from approximately 1.3 × 10⁸ to 2.2 × 10⁹ molec. cm−3. The corresponding OHexp ranges from 2 × 10¹⁰ to 3.3 × 10¹¹ molec. cm−3 s, which is approximately equivalent to 0.15 to 2.5 d of atmospheric exposure based on the reference average OH concentration of 1.5 × 10⁶ molec. cm−3. The increased reflectance and UV intensity with the ePTFE wrap (red solid symbols) resulted in a maximum OHexp of approximately 1.1 × 10¹² molec. cm−3 s, equivalent to 8.5 d of atmospheric OH exposure, for the same RH (40 %) and O3 mixing ratio (3.3 ppm). Overall, the highly reflective (and non-absorbing) materials used result in OH exposure comparable to that in other OFRs despite the use of a relatively low power output lamp.
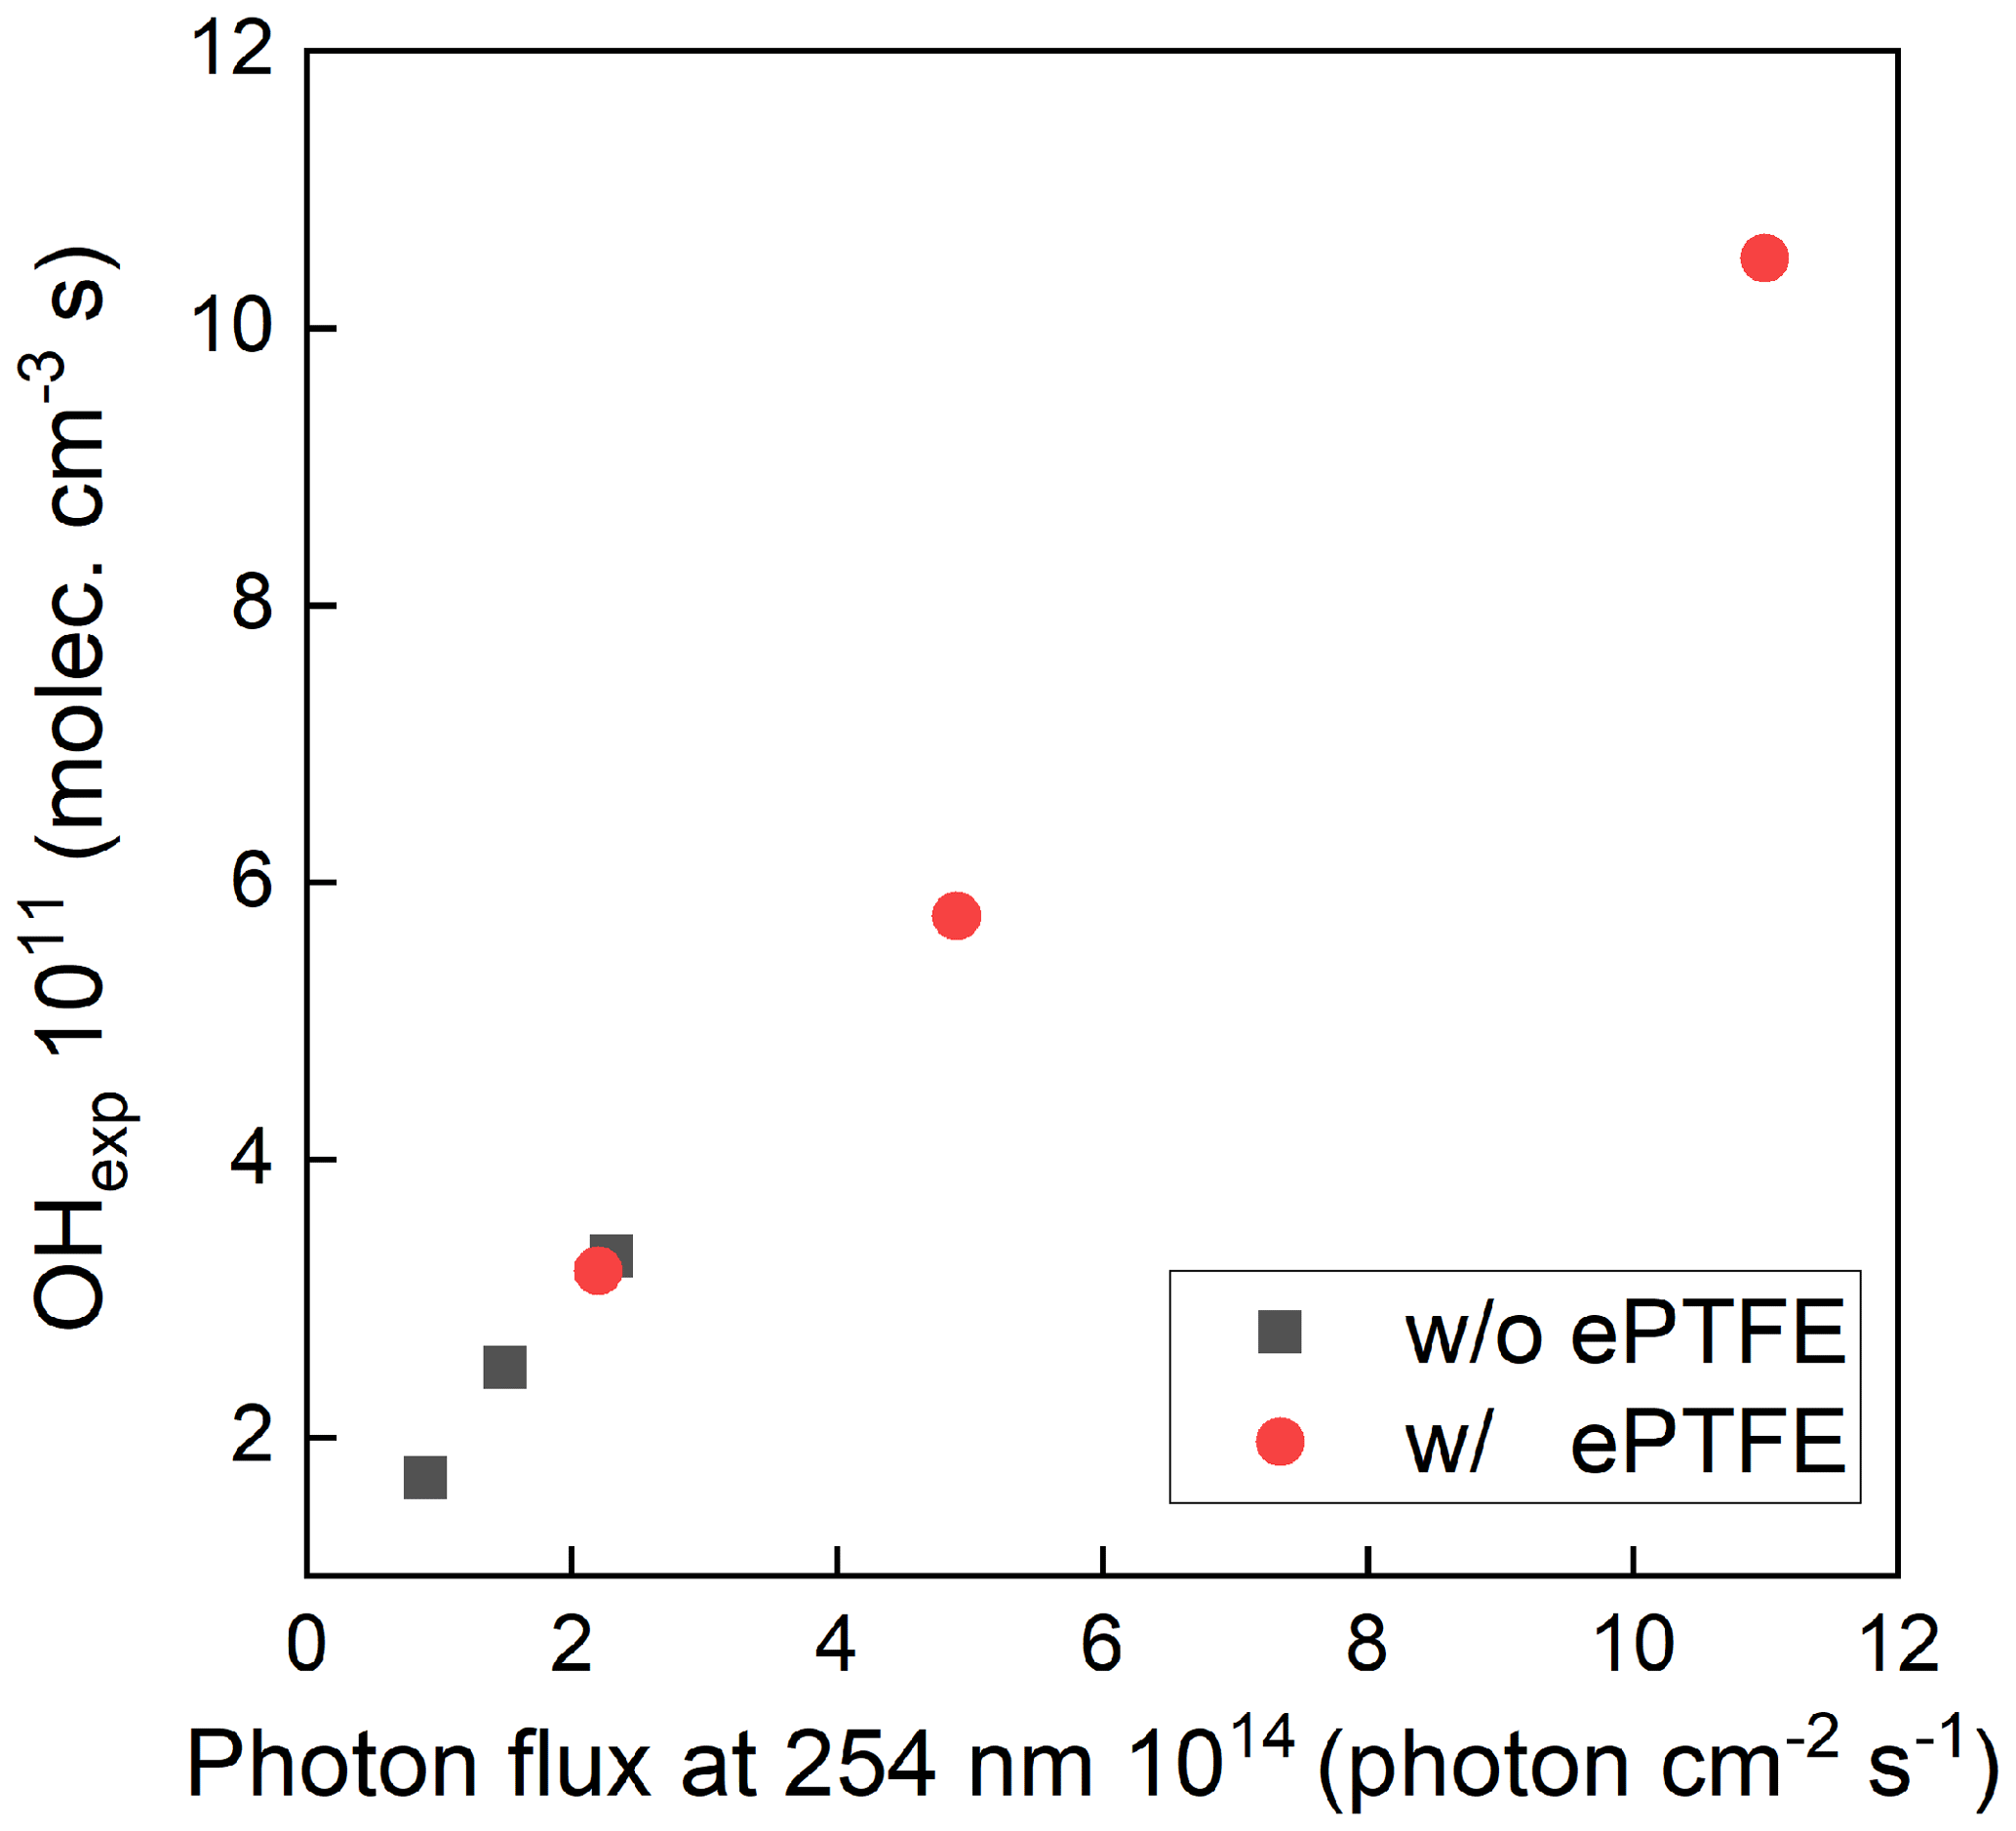
Figure 5Variations in the concentration of OH as a function of photon flux at 254 nm with (red solid points) and without ePTFE (black solid points) wrapped around the flow tube. Both experiments were done with the same OH reactivity.
3.2 Gas and particle transmission efficiency
Figure 6 shows the transmission efficiency of AS particles with mobility diameter ranging from 50 to 200 nm. As stated above, particle transmission efficiency is calculated as the ratio of the concentration exiting the reactor to that exiting a copper tube bypass. Concentrations measured upstream and downstream of the copper tube agreed within ±1 %, confirming minimal loss in the bypass line. We performed two sets of tests: first, following the removal of static charge on the inner surface of the reactor tube (preliminary removal process), and second, following the additional removal of static charge between the ePTFE/Mylar wrap and the outer surface of the reactor tube (secondary removal process). The particle transmission efficiency after removal of only the charge on the inner surface of the tube was 0.39, 0.75, and 0.93 for 50, 80, and 100 nm diameter particles, respectively. With the removal of the static charge on the outer surface of the tube, the transmission efficiency of 50 nm and 80 nm particles increased from 0.39 to 0.75 and from 0.75 to 0.84, respectively. Each experiment was repeated twice, with agreement within ±10 % when sampling the same particle size and with the same flow rate. These results indicate that loss of small particles in the reactor can be significantly reduced by minimizing the static charge on both the inner and outer surfaces of the reactor tube. The similarity in the resulting 36 % of the 50 nm particles that are no longer lost and the 41 % of those 50 nm particles that are expected to be charged (Wiedensohler, 1988) suggests electrostatic loss was minimal after the static charge was minimized. Comparison with the particle transmission efficiency of other types of flow tube reactors with non-conductive wall materials is included in Fig. 6. The PAM reactor referenced is the horizontal 46 cm length × 22 cm ID glass cylindrical chamber with a volume of 15 L that was described by Lambe et al. (2011), hereafter referred to as the quartz PAM. The results show that the particle transmission efficiencies through the PFA OFR, TSAR, and ECCC-OFR are higher than those for the quartz PAM, TPOT, and CPOT reactors, which may in part be due to their use of similar cone-shaped inlets and of centerline sampling. The particle transmission efficiencies of the quartz PAM, CPOT, and TPOT for 50–100 nm particles are 30 %–50 %, 15 %–25 %, and 35 %–65 % lower than that of the PFA-OFR, respectively. On the other hand, the transmission efficiency through the TSAR and the ECCC-OFR is 5 %–25 % higher than for the PFA-OFR, though at least some of this difference is caused by the longer residence time of the PFA OFR than that of the other two reactors.
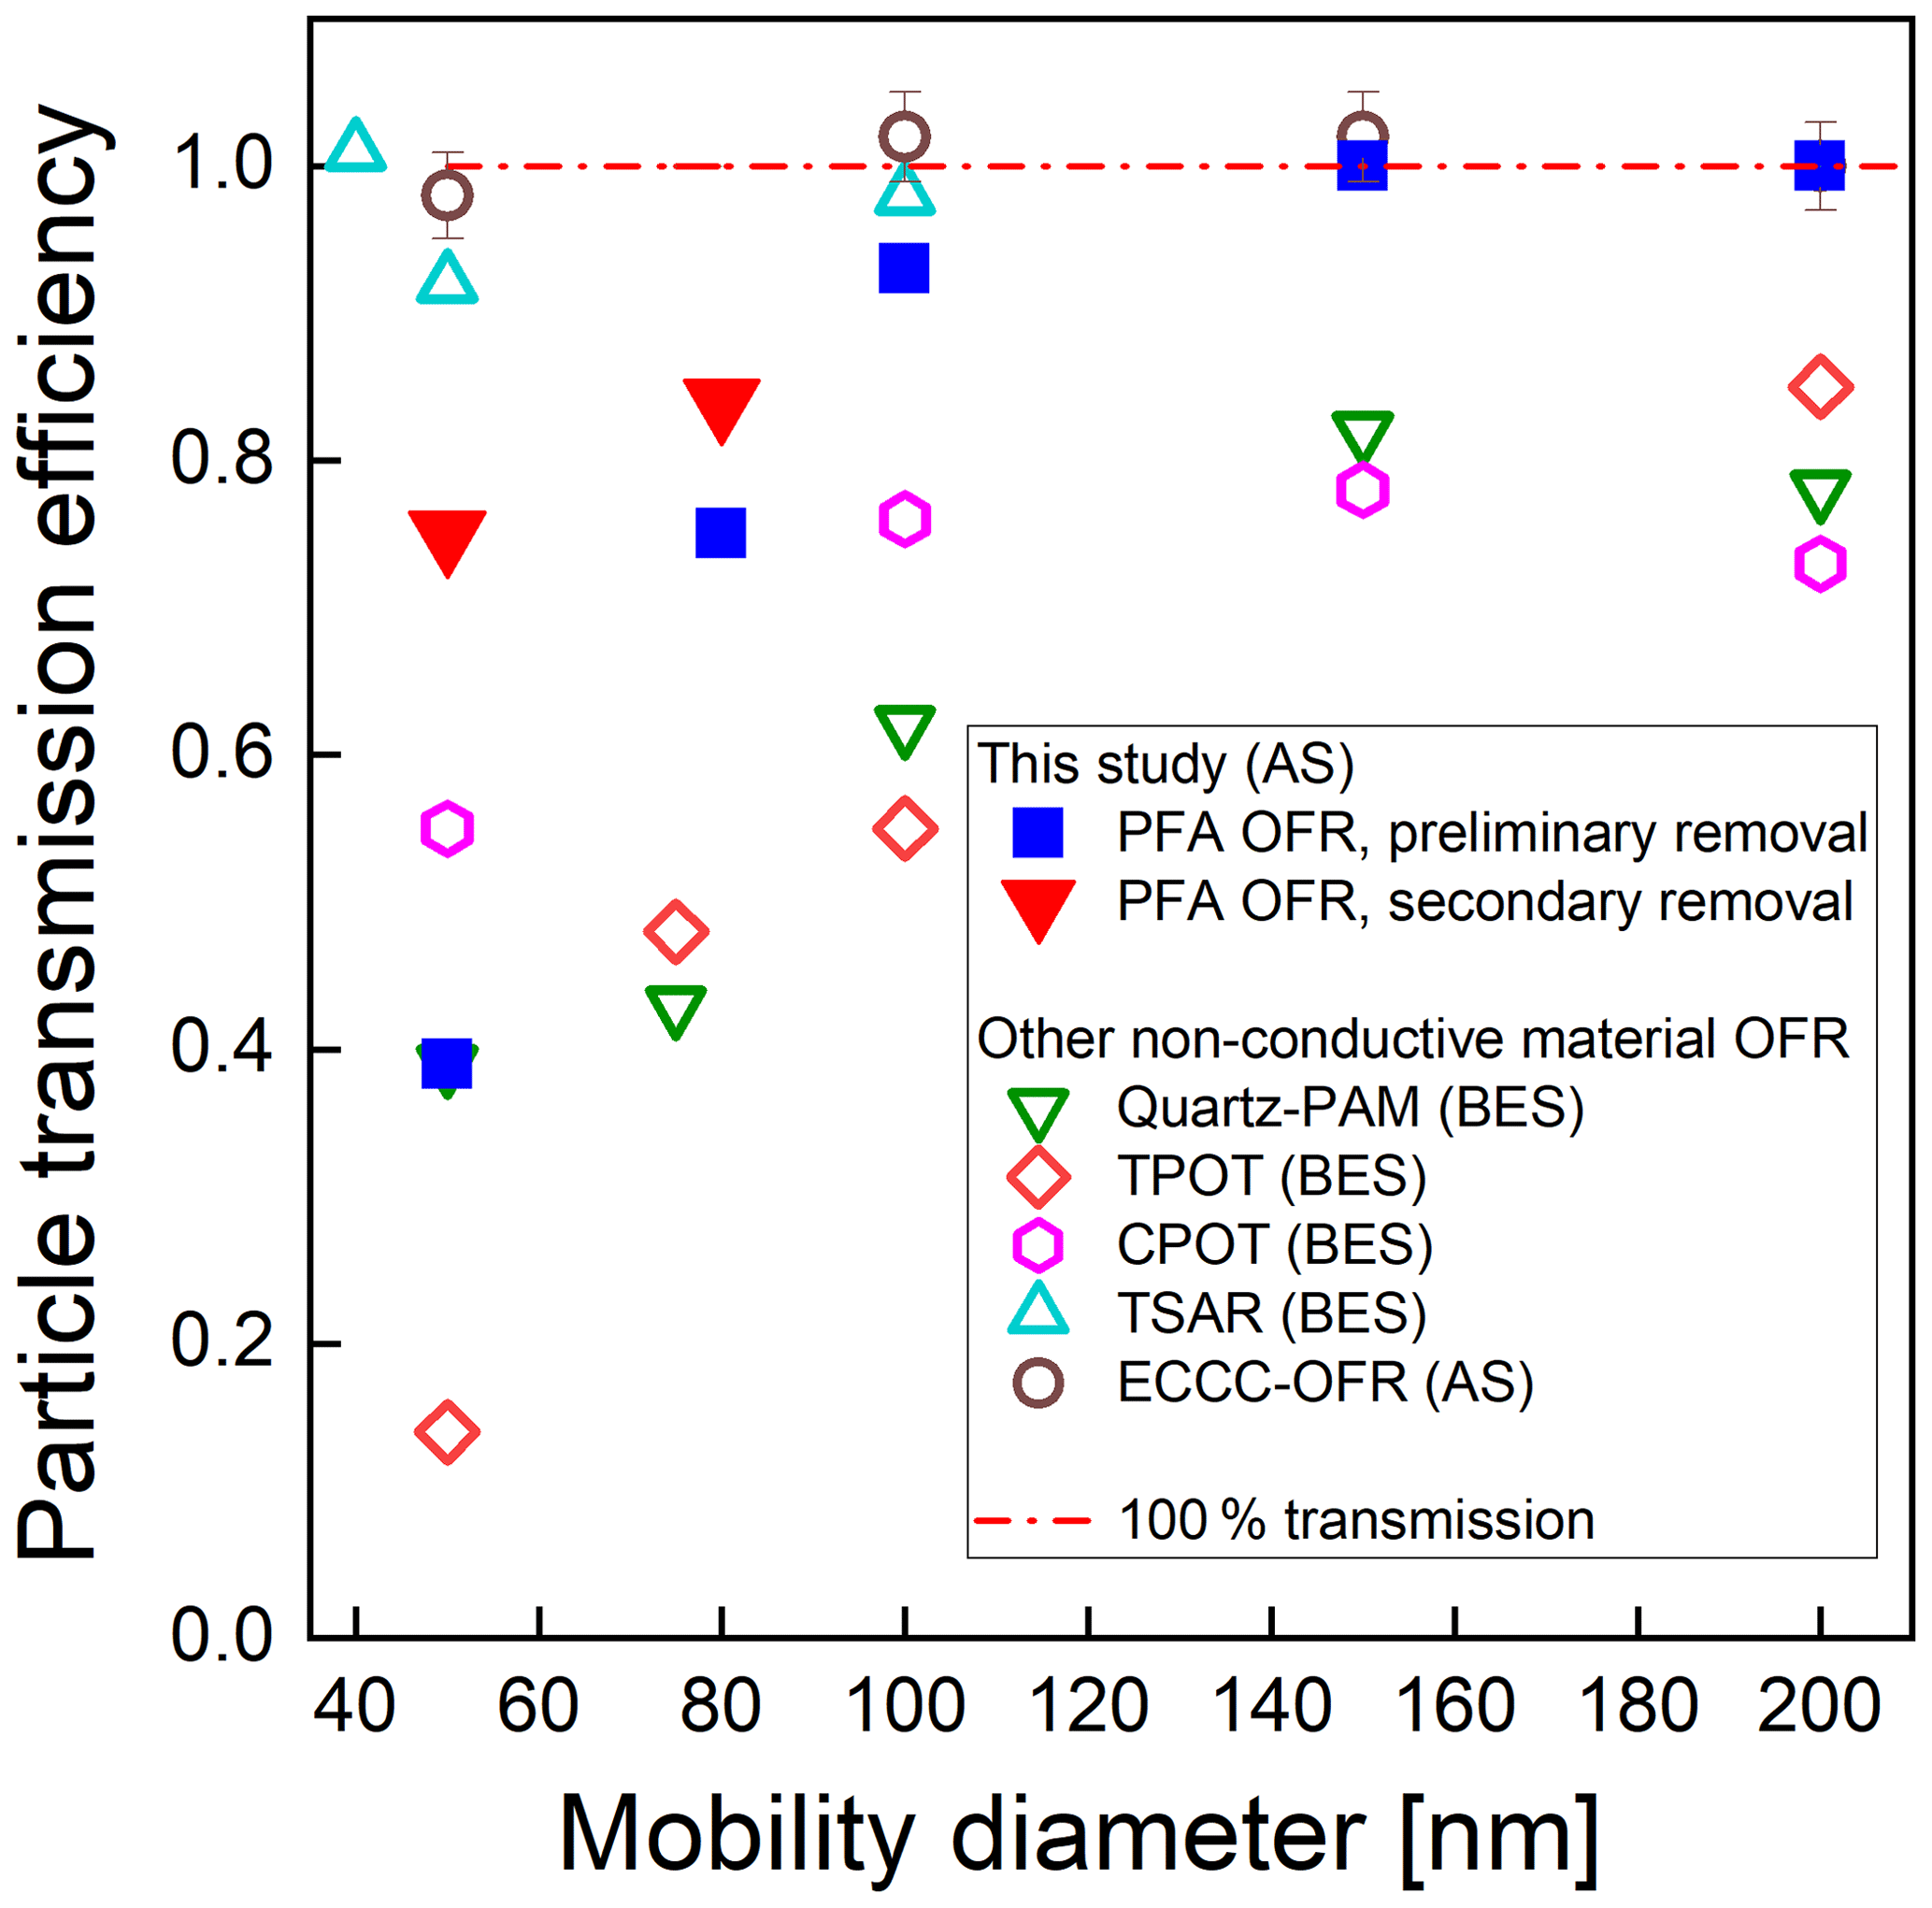
Figure 6Measured particle transmission efficiency of the PFA OFR, quartz PAM and TPOT (Lambe et al., 2011), CPOT (Huang et al., 2017), TSAR (Simonen et al., 2017), and ECCC-OFR (Li et al., 2019) flow reactors as a function of mobility diameter for bis(2-ethylhexyl) sebacate (BES) and ammonium sulfate (AS). Our results are shown as blue squares and red triangles.
The experimental configuration used to measure the loss of SO2 and CO2 is similar to that used to characterize the gas RTD. The penetration efficiencies of CO2 and SO2 were 0.90 ± 0.02 and 0.76 ± 0.04, respectively. The wall loss for most precursor species is expected to be equal to or less than the 24 % found for SO2 because it is a good surrogate for wall-adhering species (Lambe et al., 2011; Ahlberg et al., 2017; Huang et al., 2017). For comparison, Lambe et al. (2011) reported that the measured CO2 and SO2 transmission efficiencies for the TPOT were 0.97 ± 0.10 and 0.45 ± 0.13, respectively, and for the quartz PAM were 0.91 ± 0.09 and 1.2 ± 0.4, respectively.
The fate of low-volatility organic compounds (LVOCs) that can condense onto particles, stick to the reactor walls, react with OH, or exit the reactor before condensing can be evaluated using the approach described by Palm et al. (2016). Based on the simple model they present, LVOC wall losses for the PFA OFR have an upper limit of approximately 30 % for a residence time of 130 s, which is comparable to that observed for SO2 (24 %). Although the LVOC fate method is strongly dependent on the design and the geometry of the reactor, the consistency between the estimated loss and that measured for SO2 suggests the value is a reasonable estimate of the vapor loss for our design. Losses of some gases are expected to be greater in this OFR than in most others because of its larger surface-area-to-volume () ratio of 0.53 cm−1, which is greater than that of the PAM reactor, while the mean residence times of the two are similar. However, losses of some gases may be lower as well because only the central core flow is subsampled, all Teflon materials are used, and, as is described in the next section, the RTD is comparatively narrow, which suggests less mixing than in other OFRs.
3.3 Gas and particle residence time distributions
The residence time probability distribution functions for particles and gases are shown in Fig. 7a and b. Reporting the results as normalized distribution functions facilitates comparison of the flow characteristics of reactors of different shapes and sizes. RTDs of idealized devices and those reported for CPOT and quartz PAM are also shown in Fig. 7a and b for comparison (PAMWiki, 2020). The residence time probability distribution function is defined as the normalized measured concentration (Cout(t)) divided by the total area of the normalized pulse (Fogler, 2006; Simonen et al., 2017), as described in Eq. (3) below. The average residence time was calculated as the summation of the product of the measured concentration and the corresponding residence time, all divided by the total area of the pulse.
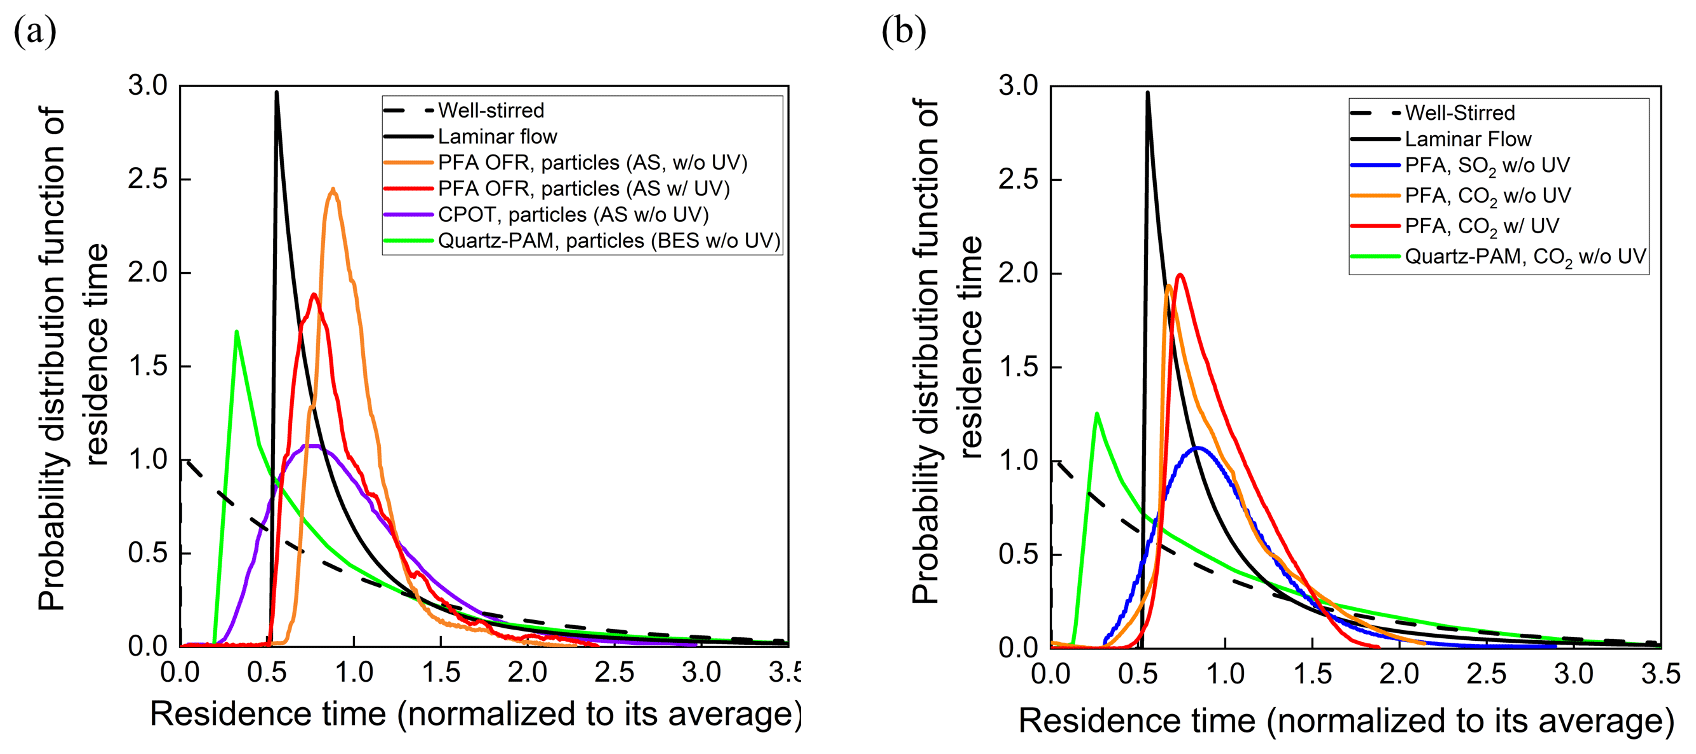
Figure 7Residence time probability distribution functions of the PFA OFR, CPOT (Huang et al., 2017), and quartz-PAM flow tubes (Lambe et al., 2011) as a function of residence time for (a) particles and (b) gases.
The residence time distributions of particles and gases in the PFA OFR shown in Fig. 7a and b approach those expected for laminar developed flow. Measured RTDs for both particles and gases have relatively short tails at longer times compared with the ideal laminar flow pulse, as is expected because only the center ∼ 50 % of the sample flow is subsampled and directed to the analyzers. Relative to the total flow through the reactor, the subsampled core has a narrower velocity range and less interaction with the walls. Extraction of the side purge flow also helps by preventing recirculation near the outlet. The RTDs measured with the UV lamp turned on are only slightly broader than those with it turned off. Previous studies report that UV lamps broaden the RTD because they heat the reactor walls and enhance convection inside the reactor (Simonen et al., 2017). Significant degradation is not observed in the PFA OFR, presumably because of the use of a comparatively low-power light source, circulation of air through the reactor housing, and the reactor being oriented vertically with the lamp at the top to promote stratification and to minimize convective mixing. Reversible uptake by the walls is responsible for the broader RTD for SO2 relative to that for CO2.
We also investigated the effect of the ratio of the sample to side flow on the RTD for AS particles. The condition without the side purge flow was numerically simulated in COMSOL 5.4 by coupling the Laminar Flow and the Transport in Dilute Species packages. This result is compared with the RTD of that obtained experimentally with different sample–side flow ratios in Fig. S2. The experimental results show the improvement in RTD response as the sample–side flow ratio is decreased. We expect future efforts to include simulation studies, such as the model-derived relationship between the sample–side flow ratio and the losses of particles and gases.
3.4 SOA yield measurements
Secondary organic aerosol yields (Y) are defined as the mass of OA formed (ΔCOA) per reacted precursor mass (ΔHC) (Odum et al., 1996). The measured yields of m-xylene and α-pinene SOA as a function of OH exposure and organic aerosol concentration (COA) are shown in Fig. 8a and b. Here, the SOA yields are corrected for size-dependent gas and particle losses, with an average magnitude of the combined correction of 25 %. For comparison, the magnitude of the particle wall loss correction of the PAM reactor was 32 % ± 15 % (Lambe et al., 2015). The COA was calculated by multiplying the volume concentration measured with an SMPS by an assumed density of 1.2 g cm−3. The mixing ratios of m-xylene and α-pinene introduced into the PFA OFR were in the ranges of 20–118 and 13–145 ppb, respectively. The OHexp was not measured simultaneously during the yield experiments, but applying the OFR254 OH exposure estimation equation as a function of O3, RH, and UV lamp power (Peng et al., 2015) and the assumption that the OH reactivity was the same for both sets of measurements resulted in estimated values that are consistent with the measured OHexp described in Sect. 3.1. As expected, the SOA yield was observed to be dependent on OH exposure and aerosol mass concentration. The m-xylene SOA yield was 0.22 at 3 × 10¹¹ molec. cm−3 s OH exposure and an OA mass concentration of 46 µg m−3 and the α-pinene SOA yield was 0.37 at 3 × 10¹¹ molec. cm−3 s OH exposure and a mass concentration of 178 µg m−3.
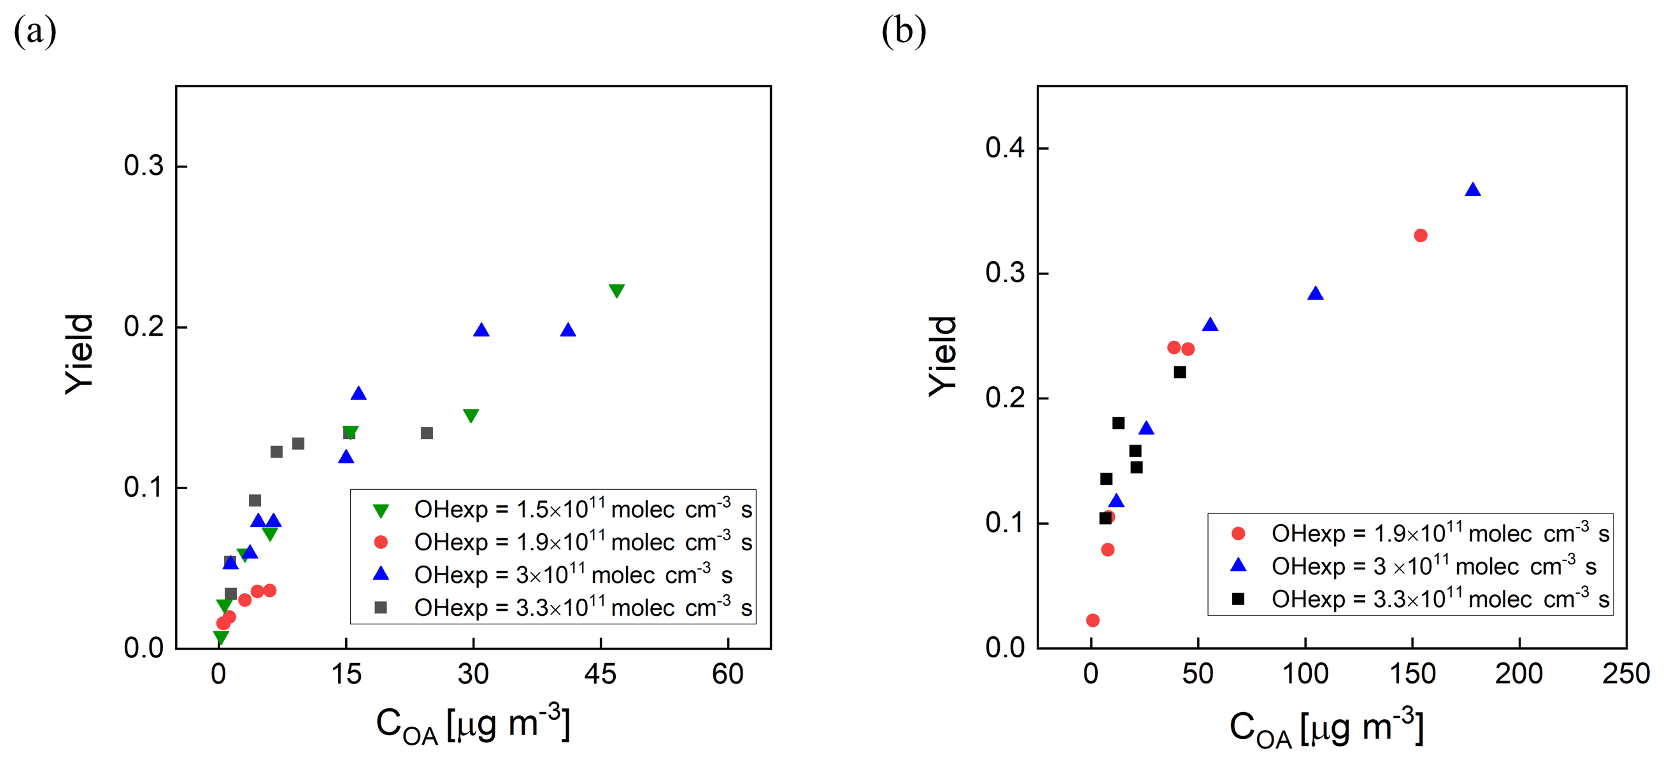
Figure 8SOA yield as a function of organic aerosol concentration (COA) for (a) m-xylene SOA and (b) α-pinene SOA generated in the PFA OFR. Marker color reflects experimental combinations of UV intensity, O3 mixing ratio, and RH. Each marker represents one VOC concentration.
The measured yields are compared with those reported by Lambe et al. (2011) for the TPOT (for 262–263 ppb precursor mixing ratio), the quartz PAM (78–88 ppb), and the Caltech environmental chamber (14–48 ppb), and by Ahlberg et al. (2017) for the aluminum PAM (14–179 ppb of α-pinene and 43–395 ppb of m-xylene). The comparisons as a function of COA are shown in Fig. 9a and b. The SOA yields are higher in the PFA OFR than those in the quartz PAM and TPOT but lower than in the aluminum PAM. The α-pinene SOA yields in the PFA OFR (0.37 ± 0.02) and Caltech chamber (0.42 ± 0.06) agreed within 12 % for comparable OH exposures (∼ 1011 molec. cm−3 s). A contributor to differences in yield among the OFRs is variation in OHexp, which, as noted above, was not measured during the yield experiments. Our estimates of OHexp neglect the impact of varying OH reactivity (OHR), which is defined as the summation of the product of the concentrations of species that react with OH and their reaction rate constants (Li et al., 2015; Peng et al., 2015). During our experiments, the maximum OH reactivities for the m-xylene and α-pinene experiments were 34 and 103 s−1, respectively, which is higher than the 5.5 s−1 estimated for the SO2 experiments that were used to determine the dependence of OHexp on RH, O3 concentration, and lamp power. This is also a source of uncertainty in PAM yields that were reported in Lambe et al. (2011) and is estimated by Li et al. (2015) to result in a factor of 2 uncertainty in OHexp obtained from their model-derived equation. Differences in O3 concentrations and resulting partitioning between reactions with O3 and OH are expected to be more important for α-pinene than for m-xylene. The formed SOA is dependent on the reactivity of one or more of the SOA-forming compounds and the oxidant concentrations (McFiggans et al., 2019). For the same O3 mixing ratio (3.3 ppm) and OH exposure (3 × 10¹¹ molec. cm−3 s) described above, the reactivities of α-pinene towards O3 and OH are estimated to be 6.8 × 10⁻³ and 111 × 10−3 s−1, while that of m-xylene towards OH is estimated to be 50 × 10−3 s−1.
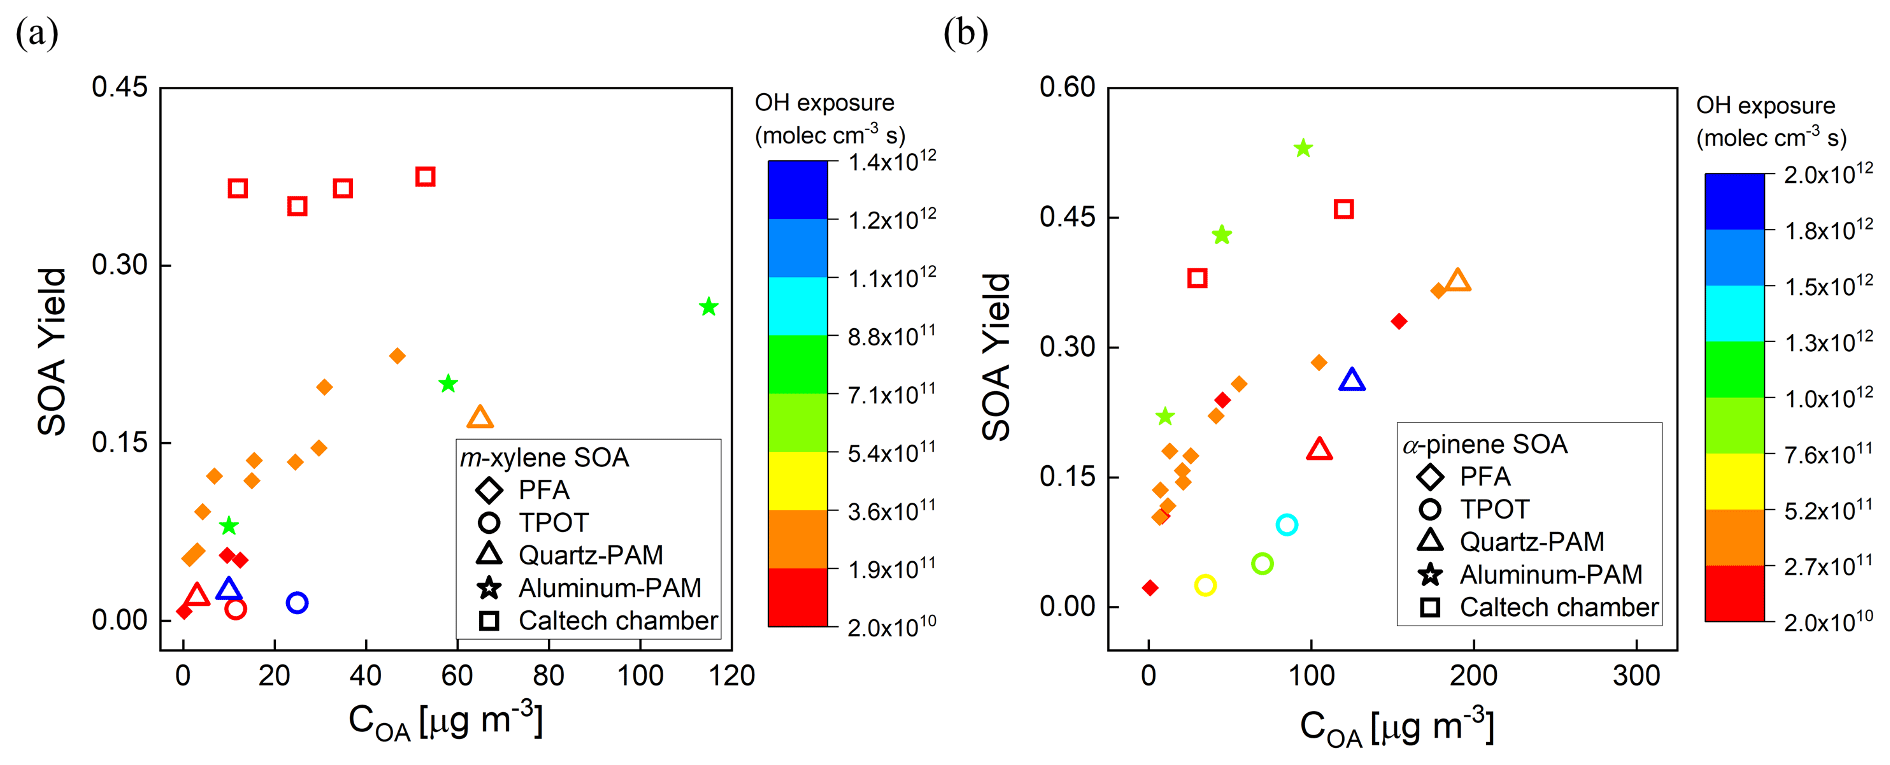
Figure 9Comparison of SOA yields as a function of organic aerosol concentration (COA) with those reported for other OFRs and one large Teflon chamber. (a) m-Xylene SOA and (b) α-pinene SOA. Marker color reflects the OHexp.
To investigate the effect of the RTD and wall interactions on aerosol production, we repeated the α-pinene SOA yield experiments under the same experimental conditions, but without extracting the side purge flow and, therefore, without subsampling just the central core flow. Doing so results in a broadened RTD and sampling of air that, on average, interacted more with the flow tube walls. The resulting α-pinene SOA yields as a function of organic aerosol concentration (COA) with (black squares) and without (red triangles) extracting the side purge flow are shown in Fig. S3. The figure shows that the narrower RTD and reduced wall effects accompanying subsampling of the central flow result in higher SOA yields, which may partially explain why the yield presented in Fig. 9 is slightly higher than that reported for other OFRs. Additional experiments are needed to determine the relative importance of the RTD and the wall effects and to evaluate any role of other differences between the experiments such as the increased average residence time (and OHexp) when not subsampling just the higher velocity central core flow.
3.5 Seed particle SOA enhancement
The influence of seed particle concentration was investigated by measuring SOA yield for varying ratios of the mass concentrations of α-pinene and AS seed. For all experiments a constant flow rate (0.7 L min−1) containing the AS seed particles was introduced together with a varying mixing ratio of α-pinene (8–30 ppb). Using the same method that was presented in Sect. 2.4, a DMA generated a narrow mode of AS seed particles centered at a diameter of 200 nm. The average mass concentration of the AS aerosol throughout the experiments was 40 µg m−3. The O3 concentration, RH, and UV lamp power were the same for all measurements, with a resulting OHexp of about 2 × 10¹¹ molec. cm−3 s, which is consistent with the OHexp estimated from the model-derived equation (Peng et al., 2015). Measurements for each precursor concentration were repeated 2 or 3 times, with agreement between measurements to within ±10 %. Figure 10a and b show the volume size distributions for one set of experiments with and without added AS particles. The results show that the addition of seed particles suppresses the nucleation mode as condensation on the larger particles is favored. The concentration of α-pinene SOA increased with the addition of high concentrations of seed particles, as is expected because the increased surface area promotes condensation on the aerosol and decreases the fraction of low-volatility oxidation products that reach and are lost to the walls or are further oxidized in the gas phase. In these experiments, the yield increased by as much as a factor of 3 at the minimum precursor–seed mass ratio of about 2. The magnitude of the enhancement decreased with increasing precursor–seed ratio and was within the run-to-run variability for ratios exceeding about 5, which is shown in Fig. S4.
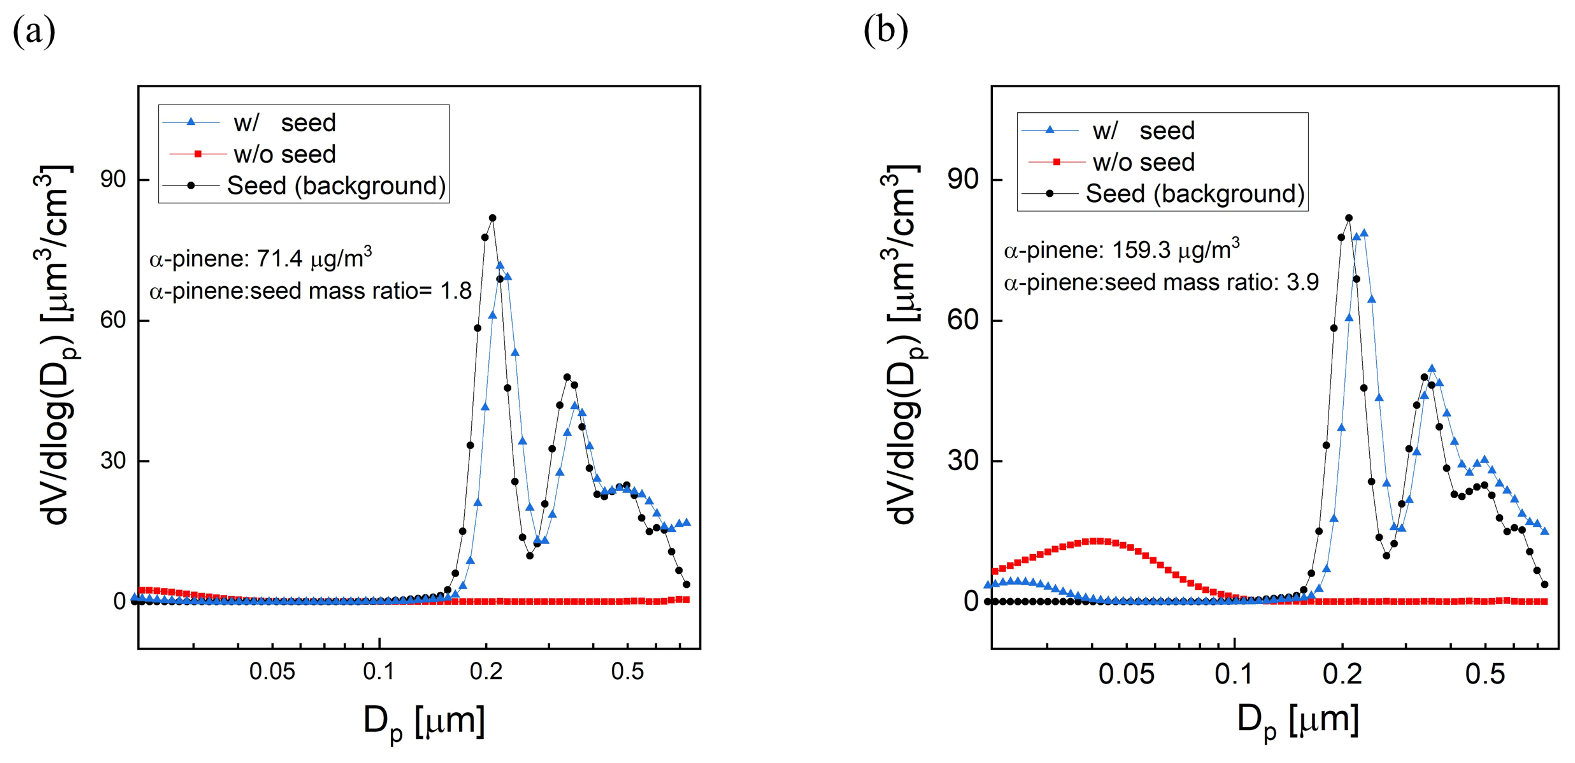
Figure 10Example sets of volume size distributions from experiments evaluating the impact of adding AS seed particles on SOA yield. The precursor : seed mass ratio is (a) 1.8 (b) 3.9.
3.6 Aerosol formed from oxidation of ambient air
Ambient air from outside our lab at the UCR College of Engineering – Center for Environmental Research and Technology (CE-CERT) in Riverside, CA, was processed by the PFA OFR for several days in January 2020. Figure 11a and b show results for a 30 h period (7–8 January 2020) and a 6 h period on 8 January 2020. Throughout the sampling period, the SMPS alternated through sets of three measurements of the processed aerosol at the exit of the reactor and sets of two measurements of unprocessed aerosol that bypassed the reactor through a copper tube. Each cycle of 5 measurements lasted 21 min. The OHexp during the sampling period estimated from the model-derived equation introduced in Sect. 3.4 was in the range of 1–4 × 10¹¹ molec. cm−3 s for the maximum lamp power and measured ozone concentration and RH.
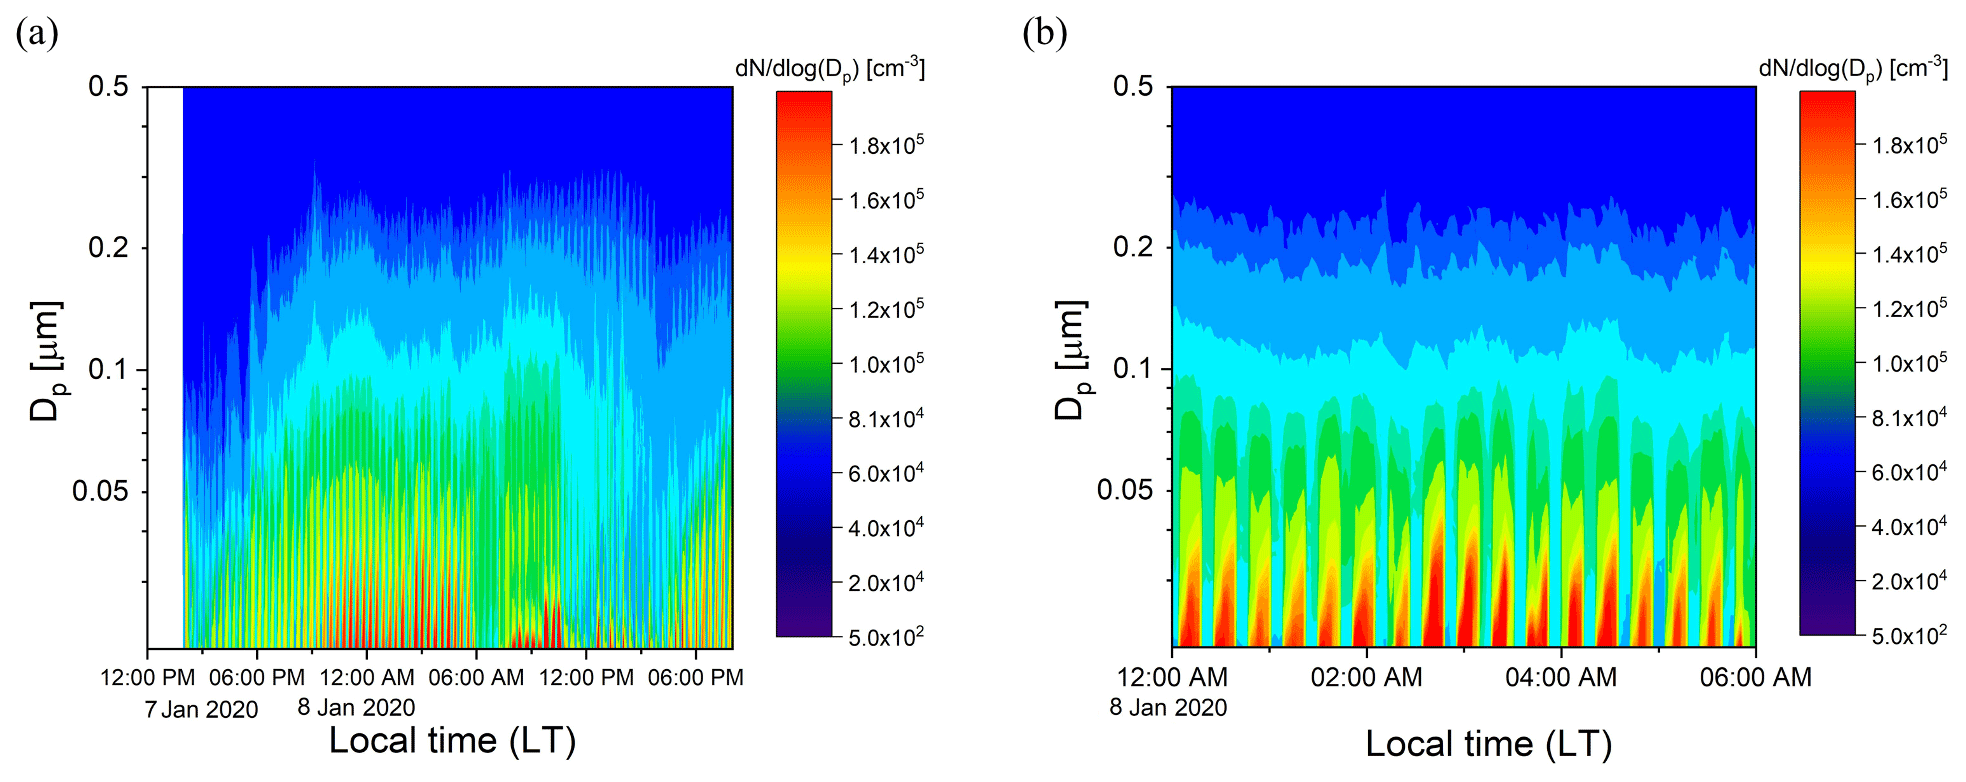
Figure 11Example time series of size distributions of the aerosol processed by the PFA OFR and that which bypassed it over (a) 30 h on 7–8 January 2020 and (b) 6 h on 8 January 2020. The bands of high concentration were measured when the aerosol and ambient air were processed through the reactor.
Time series of aerosol mass concentrations calculated from integration of the SMPS size distributions are shown in Fig. 12a. The mass concentration of the aerosol exiting the reactor was corrected for the fractional dilution by the injected O3 flow and for size-dependent gas and particle transmission efficiencies. The aerosol mass concentration increased significantly in the reactor during the oxidation process. A relative SA enhancement (ERSA) is defined here as the ratio of the mass concentration of SA divided by that of the ambient (unprocessed) aerosol, with the SA simply defined as the difference between the processed and unprocessed aerosols. The ERSA for the same sampling period is shown in Fig. 12b. A consistent diurnal pattern was not observed throughout the sampling period. The SA mass concentration was an average of 1.8 times that of the ambient aerosol during the selected period. More SA formation was observed during nighttime on 8 January, while decreasing amounts formed until around noon. The maximum enhancement due to SA formation was observed in the late afternoon on 7 January, when the SA mass concentration was approximately 7 times that of the ambient aerosol. A small SA enhancement was also observed during the late afternoon on 8 January. The overall temporal pattern likely reflects the impact of traffic-related emissions from nearby roads, including a major highway that is about 1.5 km away. In the future there is a need to add more comprehensive measurements of the chemical composition of the particulate and gaseous species.
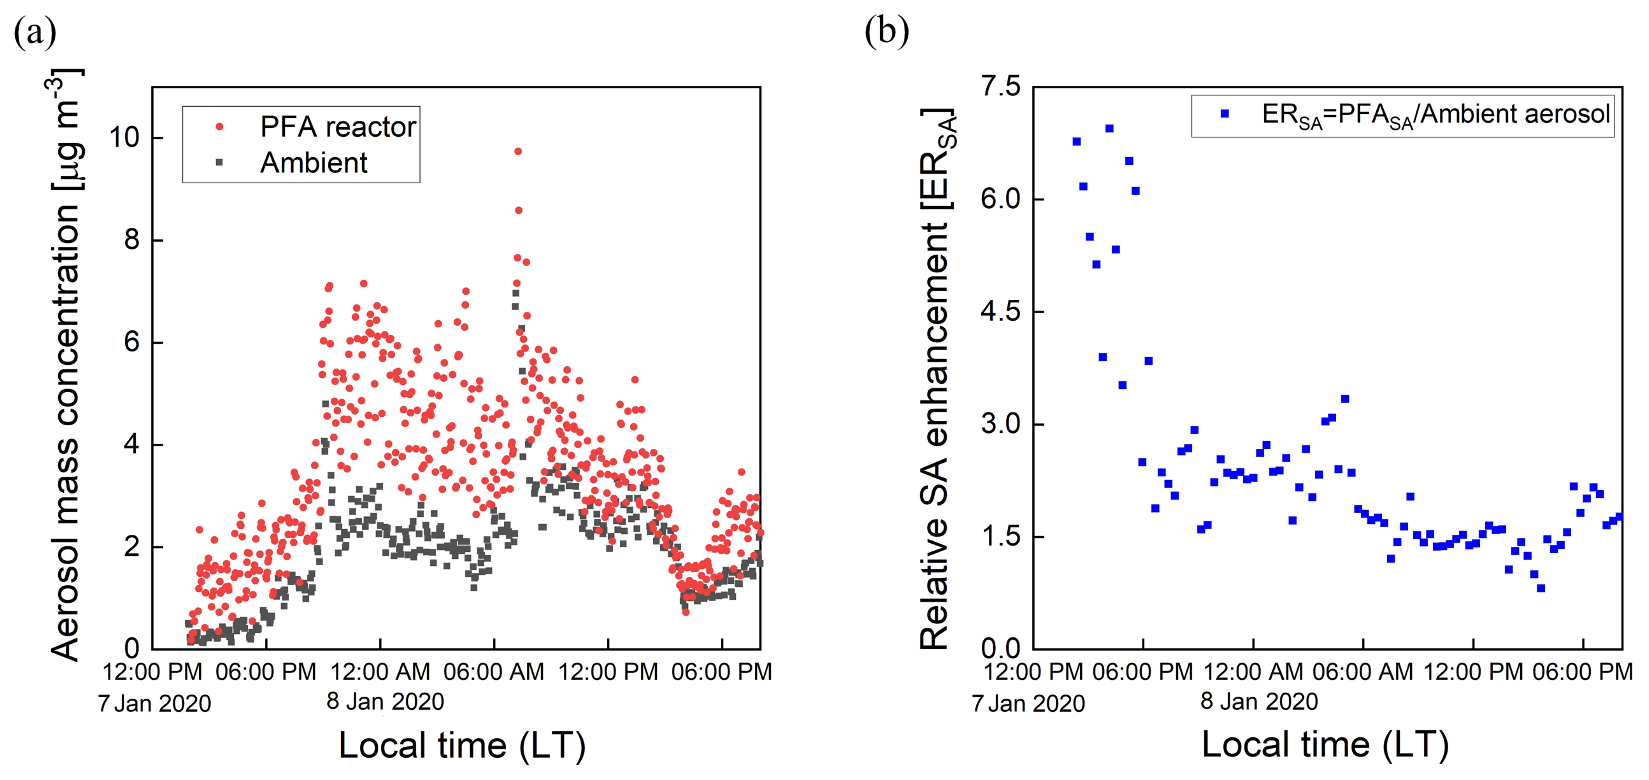
Figure 12Time series of mass concentrations of the aerosol exiting the PFA OFR and that bypassing it (a), and (b) the relative enhancement of the mass concentration due to SA formation.
A new all-Teflon reactor, the Particle Formation Accelerator (PFA) OFR, was designed, constructed, and characterized using both experimental measurements and CFD modeling. Its performance was examined and evaluated through laboratory measurements and with ambient air. The reactor response and characteristics were compared with those from a smog chamber (Caltech) and other oxidation flow reactors: the Toronto Photo-Oxidation Tube (TPOT), Caltech Photooxidation Flow Tube (CPOT), the TUT Secondary Aerosol Reactor (TSAR), quartz and aluminum versions of Potential Aerosol Mass reactors (PAMs), and the Environment and Climate Change Canada OFR (ECCC-OFR).
Our results show that OHexp can be varied over a range comparable to that of other OFRs, with the dependence on UV lamp power, RH, and O3 concentration characterized and reported. The particle transmission efficiency is over 75 % in the size range from 50 to 200 nm after minimizing static charge on the PFA, PTFE, and ePTFE surfaces. The gas transmission efficiencies of CO2 and SO2 are 0.90 ± 0.02 and 0.76 ± 0.04, respectively, with the latter comparable to estimated transmission of LVOCs through the PAM reactor. Computational simulation and experimental verification of particle and gas residence time distributions (RTDs) show that the flow through the reactor is nearly laminar, with narrower RTDs than reported for OFRs with greater diameter-to-length ratios, making it better suited for measurements of dynamic sources with time-varying composition or concentration.
The mass yields of SOA from the oxidation of α-pinene and m-xylene, and the effect of seed particles on those yields, were investigated. At comparable OH exposure, the m-xylene and α-pinene SOA yields are slightly higher than those in the quartz PAM and TPOT, but lower than in the aluminum PAM. A likely contributor to differences in yields between the PFA OFR and other OFRs is the uncertainty in OHexp, which was not measured simultaneously during the yield measurements and was determined from separate experiments for which the OH reactivity differed. The α-pinene SOA yields in the PFA OFR (0.37 ± 0.02) and Caltech chamber (0.42 ± 0.06) agree within 12 % for comparable OH exposures (∼1011 molec. cm−3 s). The presence and concentration of seed particles was shown to have a significant effect on SOA yield. At a nominally fixed OH exposure of 2 × 10¹¹ molec. cm−3 s, the α-pinene SOA yield for the minimum precursor–seed mass ratio of about 2 was about 3 times that when no seed particles were added. The magnitude of the enhancement decreased with increasing precursor : seed ratio and was within the run-to-run variability for ratios exceeding about 5. The SA production from ambient air was studied in Riverside, CA. The mass concentration of SA formed in the reactor was about twice the mass concentration of the ambient aerosol at the same time.
Overall, the computational and experimental results indicate that the PFA OFR is suitable for laboratory studies and for field use that includes measurement of rapidly changing ambient concentrations. Future efforts will include adding direct measurement of OHexp during measurements, development of an OHexp estimation description for the PFA OFR comparable to that reported for other OFRs, and further exploring the influence of OH reactivity on OHexp and of seed particles on SOA yield. We will also expand upon measurements of the composition of the particulate products and gaseous precursors during one or more field studies to evaluate how well the PFA OFR simulates atmospheric chemistry that typically requires hours or days.
Data presented in this work are available from the authors.
The supplement related to this article is available online at: https://doi.org/10.5194/amt-14-2891-2021-supplement.
DRC designed the reactor and edited the paper. NX performed the experiments and simulations, processed the data, and wrote the paper.
The authors declare that they have no conflict of interest.
This paper was edited by Mingjin Tang and reviewed by three anonymous referees.
Ahlberg, E., Falk, J., Eriksson, A., Holst, T., Brune, W. H., Kristensson, A., Roldin, P., and Svenningsson, B.: Secondary organic aerosol from VOC mixtures in an oxidation flow reactor, Atmos. Environ., 161, 210–220, https://doi.org/10.1016/j.atmosenv.2017.05.005, 2017.
Aljawhary, D., Zhao, R., Lee, A. K. Y., Wang, C., and Abbatt, J. P. D.: Kinetics, Mechanism, and Secondary Organic Aerosol Yield of Aqueous Phase Photo-oxidation of α-Pinene Oxidation Products, J. Phys. Chem. A, 120, 1395–1407, https://doi.org/10.1021/acs.jpca.5b06237, 2016.
Atkinson, R., Baulch, D. L., Cox, R. A., Crowley, J. N., Hampson, R. F., Hynes, R. G., Jenkin, M. E., Rossi, M. J., and Troe, J.: Evaluated kinetic and photochemical data for atmospheric chemistry: Volume I – gas phase reactions of Ox, HOx, NOx and SOx species, Atmos. Chem. Phys., 4, 1461–1738, https://doi.org/10.5194/acp-4-1461-2004, 2004.
Bruns, E. A., El Haddad, I., Keller, A., Klein, F., Kumar, N. K., Pieber, S. M., Corbin, J. C., Slowik, J. G., Brune, W. H., Baltensperger, U., and Prévôt, A. S. H.: Inter-comparison of laboratory smog chamber and flow reactor systems on organic aerosol yield and composition, Atmos. Meas. Tech., 8, 2315–2332, https://doi.org/10.5194/amt-8-2315-2015, 2015.
Carter, W. P. L., Cocker, D. R., Fitz, D. R., Malkina, I. L., Bumiller, K., Sauer, C. G., Pisano, J. T., Bufalino, C., and Song, C.: A new environmental chamber for evaluation of gas-phase chemical mechanisms and secondary aerosol formation, Atmos. Environ., 39, 7768–7788, https://doi.org/10.1016/j.atmosenv.2005.08.040, 2005.
Chen, L., Huang, Y., Xue, Y., Cao, J., and Wang, W.: Effect of oligomerization reactions of Criegee intermediate with organic acid/peroxy radical on secondary organic aerosol formation from isoprene ozonolysis, Atmos. Environ., 187, 218–229, https://doi.org/10.1016/j.atmosenv.2018.06.001, 2018.
Cubison, M. J., Ortega, A. M., Hayes, P. L., Farmer, D. K., Day, D., Lechner, M. J., Brune, W. H., Apel, E., Diskin, G. S., Fisher, J. A., Fuelberg, H. E., Hecobian, A., Knapp, D. J., Mikoviny, T., Riemer, D., Sachse, G. W., Sessions, W., Weber, R. J., Weinheimer, A. J., Wisthaler, A., and Jimenez, J. L.: Effects of aging on organic aerosol from open biomass burning smoke in aircraft and laboratory studies, Atmos. Chem. Phys., 11, 12049–12064, https://doi.org/10.5194/acp-11-12049-2011, 2011.
Davis, D. D., Ravishankara, A. R., and Fischer, S.: SO2 oxidation via the hydroxyl radical: Atmospheric fate of HSOx radicals, Geophys. Res. Lett., 6, 113–116, https://doi.org/10.1029/GL006i002p00113, 1979.
Deming, B. L., Pagonis, D., Liu, X., Day, D. A., Talukdar, R., Krechmer, J. E., de Gouw, J. A., Jimenez, J. L., and Ziemann, P. J.: Measurements of delays of gas-phase compounds in a wide variety of tubing materials due to gas–wall interactions, Atmos. Meas. Tech., 12, 3453–3461, https://doi.org/10.5194/amt-12-3453-2019, 2019.
Ervens, B., Turpin, B. J., and Weber, R. J.: Secondary organic aerosol formation in cloud droplets and aqueous particles (aqSOA): a review of laboratory, field and model studies, Atmos. Chem. Phys., 11, 11069–11102, https://doi.org/10.5194/acp-11-11069-2011, 2011.
Ezell, M. J., Johnson, S. N., Yu, Y., Perraud, V., Bruns, E. A., Alexander, M. L., Zelenyuk, A., Dabdub, D., and Finlayson-Pitts, B. J.: A new aerosol flow system for photochemical and thermal studies of tropospheric aerosols, Aerosol Sci. Tech., 44, 329–338, https://doi.org/10.1080/02786821003639700, 2010.
Fogler, H. S.: Elements of Chemical Reaction Engineering, 4th Edn., Prentice Hall, Upper Saddle River, 869–878, 2006.
George, I. J. and Abbatt, J. P. D.: Heterogeneous oxidation of atmospheric aerosol particles by gas-phase radicals, Nat. Chem., 2, 713, https://doi.org/10.1038/nchem.806, 2010.
Huang, Y., Coggon, M. M., Zhao, R., Lignell, H., Bauer, M. U., Flagan, R. C., and Seinfeld, J. H.: The Caltech Photooxidation Flow Tube reactor: design, fluid dynamics and characterization, Atmos. Meas. Tech., 10, 839–867, https://doi.org/10.5194/amt-10-839-2017, 2017.
Iinuma, Y., Böge, O., Gnauk, T., and Herrmann, H.: Aerosol-chamber study of the α-pinene/O3 reaction: Influence of particle acidity on aerosol yields and products, Atmos. Environ., 38, 761–773, https://doi.org/10.1016/j.atmosenv.2003.10.015, 2004.
Jimenez, J. L., Canagaratna, M. R., Donahue, N. M., Prevot, A. S. H., Zhang, Q., Kroll, J. H., DeCarlo, P. F., Allan, J. D., Coe, H., Ng, N. L., Aiken, A. C., Docherty, K. S., Ulbrich, I. M., Grieshop, A. P., Robinson, A. L., Duplissy, J., Smith, J. D., Wilson, K. R., Lanz, V. A., Hueglin, C., Sun, Y. L., Tian, J., Laaksonen, A., Raatikainen, T., Rautiainen, J., Vaattovaara, P., Ehn, M., Kulmala, M., Tomlinson, J. M., Collins, D. R., Cubison, M. J., Dunlea, E. J., Huffman, J. A., Onasch, T. B., Alfarra, M. R., Williams, P. I., Bower, K., Kondo, Y., Schneider, J., Drewnick, F., Borrmann, S., Weimer, S., Demerjian, K., Salcedo, D., Cottrell, L., Griffin, R., Takami, A., Miyoshi, T., Hatakeyama, S., Shimono, A., Sun, J. Y., Zhang, Y. M., Dzepina, K., Kimmel, J. R., Sueper, D., Jayne, J. T., Herndon, S. C., Trimborn, A. M., Williams, L. R., Wood, E. C., Middlebrook, A. M., Kolb, C. E., Baltensperger, U., and Worsnop, D. R.: Evolution of organic aerosols in the atmosphere, Science, 326, 1525–1529, https://doi.org/10.1126/science.1180353, 2009.
Kang, E., Root, M. J., Toohey, D. W., and Brune, W. H.: Introducing the concept of Potential Aerosol Mass (PAM), Atmos. Chem. Phys., 7, 5727–5744, https://doi.org/10.5194/acp-7-5727-2007, 2007.
Kang, E., Toohey, D. W., and Brune, W. H.: Dependence of SOA oxidation on organic aerosol mass concentration and OH exposure: experimental PAM chamber studies, Atmos. Chem. Phys., 11, 1837–1852, https://doi.org/10.5194/acp-11-1837-2011, 2011.
Karjalainen, P., Timonen, H., Saukko, E., Kuuluvainen, H., Saarikoski, S., Aakko-Saksa, P., Murtonen, T., Bloss, M., Dal Maso, M., Simonen, P., Ahlberg, E., Svenningsson, B., Brune, W. H., Hillamo, R., Keskinen, J., and Rönkkö, T.: Time-resolved characterization of primary particle emissions and secondary particle formation from a modern gasoline passenger car, Atmos. Chem. Phys., 16, 8559–8570, https://doi.org/10.5194/acp-16-8559-2016, 2016.
Keller, A. and Burtscher, H.: A continuous photo-oxidation flow reactor for a defined measurement of the SOA formation potential of wood burning emissions, J. Aerosol Sci., 49, 9–20, https://doi.org/10.1016/j.jaerosci.2012.02.007, 2012.
Krechmer, J. E., Coggon, M. M., Massoli, P., Nguyen, T. B., Crounse, J. D., Hu, W., Day, D. A., Tyndall, G. S., Henze, D. K., Rivera-Rios, J. C., Nowak, J. B., Kimmel, J. R., Mauldin, R. L., Stark, H., Jayne, J. T., Sipilä, M., Junninen, H., St. Clair, J. M., Zhang, X., Feiner, P. A., Zhang, L., Miller, D. O., Brune, W. H., Keutsch, F. N., Wennberg, P. O., Seinfeld, J. H., Worsnop, D. R., Jimenez, J. L., and Canagaratna, M. R.: Formation of Low Volatility Organic Compounds and Secondary Organic Aerosol from Isoprene Hydroxyhydroperoxide Low-NO Oxidation, Environ. Sci. Technol., 49, 10330-10339, https://doi.org/10.1021/acs.est.5b02031, 2015.
Kroll, J. H., Smith, J. D., Che, D. L., Kessler, S. H., Worsnop, D. R., and Wilson, K. R.: Measurement of fragmentation and functionalization pathways in the heterogeneous oxidation of oxidized organic aerosol, Phys. Chem. Chem. Phys., 11, 8005–8014, https://doi.org/10.1039/b905289e, 2009.
Lambe, A. T., Ahern, A. T., Williams, L. R., Slowik, J. G., Wong, J. P. S., Abbatt, J. P. D., Brune, W. H., Ng, N. L., Wright, J. P., Croasdale, D. R., Worsnop, D. R., Davidovits, P., and Onasch, T. B.: Characterization of aerosol photooxidation flow reactors: heterogeneous oxidation, secondary organic aerosol formation and cloud condensation nuclei activity measurements, Atmos. Meas. Tech., 4, 445–461, https://doi.org/10.5194/amt-4-445-2011, 2011.
Lambe, A. T., Chhabra, P. S., Onasch, T. B., Brune, W. H., Hunter, J. F., Kroll, J. H., Cummings, M. J., Brogan, J. F., Parmar, Y., Worsnop, D. R., Kolb, C. E., and Davidovits, P.: Effect of oxidant concentration, exposure time, and seed particles on secondary organic aerosol chemical composition and yield, Atmos. Chem. Phys., 15, 3063–3075, https://doi.org/10.5194/acp-15-3063-2015, 2015.
Li, K., Liggio, J., Lee, P., Han, C., Liu, Q., and Li, S.-M.: Secondary organic aerosol formation from α-pinene, alkanes, and oil-sands-related precursors in a new oxidation flow reactor, Atmos. Chem. Phys., 19, 9715–9731, https://doi.org/10.5194/acp-19-9715-2019, 2019.
Li, R., Palm, B. B., Ortega, A. M., Hlywiak, J., Hu, W., Peng, Z., Day, D. A., Knote, C., Brune, W. H., De Gouw, J. A., and Jimenez, J. L.: Modeling the radical chemistry in an oxidation flow reactor: Radical formation and recycling, sensitivities, and the OH exposure estimation equation, J. Phys. Chem. A, 119, 4418–4432, https://doi.org/10.1021/jp509534k, 2015.
Lim, Y. B., Tan, Y., Perri, M. J., Seitzinger, S. P., and Turpin, B. J.: Aqueous chemistry and its role in secondary organic aerosol (SOA) formation, Atmos. Chem. Phys., 10, 10521–10539, https://doi.org/10.5194/acp-10-10521-2010, 2010.
Lonneman, W. A., Bufalini, J. J., Kuntz, R. L., and Meeks, S. A.: Contamination from Fluorocarbon Films, Environ. Sci. Technol., 15, 99–103, https://doi.org/10.1021/es00083a011, 1981.
Loza, C. L., Craven, J. S., Yee, L. D., Coggon, M. M., Schwantes, R. H., Shiraiwa, M., Zhang, X., Schilling, K. A., Ng, N. L., Canagaratna, M. R., Ziemann, P. J., Flagan, R. C., and Seinfeld, J. H.: Secondary organic aerosol yields of 12-carbon alkanes, Atmos. Chem. Phys., 14, 1423–1439, https://doi.org/10.5194/acp-14-1423-2014, 2014.
Matsunaga, A. and Ziemann, P. J.: Gas-wall partitioning of organic compounds in a teflon film chamber and potential effects on reaction product and aerosol yield measurements, Aerosol Sci. Tech., 44, 881–892, https://doi.org/10.1080/02786826.2010.501044, 2010.
McFiggans, G., Mentel, T. F., Wildt, J., Pullinen, I., Kang, S., Kleist, E., Schmitt, S., Springer, M., Tillmann, R., Wu, C., Zhao, D., Hallquist, M., Faxon, C., Le Breton, M., Hallquist, Å. M., Simpson, D., Bergström, R., Jenkin, M. E., Ehn, M., Thornton, J. A., Alfarra, M. R., Bannan, T. J., Percival, C. J., Priestley, M., Topping, D., and Kiendler-Scharr, A.: Secondary organic aerosol reduced by mixture of atmospheric vapours, Nature, 565, 587–593, https://doi.org/10.1038/s41586-018-0871-y, 2019.
Mentel, T. F., Bleilebens, D., and Wahner, A.: A study of nighttime nitrogen oxide oxidation in a large reaction chamber – The fate of NO2, N2O5, HNO3, and O3 at different humidities, Atmos. Environ., 4007–4020, https://doi.org/10.1016/1352-2310(96)00117-3, 1996.
Mitroo, D., Sun, Y., Combest, D. P., Kumar, P., and Williams, B. J.: Assessing the degree of plug flow in oxidation flow reactors (OFRs): a study on a potential aerosol mass (PAM) reactor, Atmos. Meas. Tech., 11, 1741–1756, https://doi.org/10.5194/amt-11-1741-2018, 2018.
Nah, T., Sanchez, J., Boyd, C. M., and Ng, N. L.: Photochemical Aging of α-pinene and β-pinene Secondary Organic Aerosol formed from Nitrate Radical Oxidation, Environ. Sci. Technol., 50, 222–231, https://doi.org/10.1021/acs.est.5b04594, 2016.
Nah, T., McVay, R. C., Pierce, J. R., Seinfeld, J. H., and Ng, N. L.: Constraining uncertainties in particle-wall deposition correction during SOA formation in chamber experiments, Atmos. Chem. Phys., 17, 2297–2310, https://doi.org/10.5194/acp-17-2297-2017, 2017.
Odum, J. R., Hoffmann, T., Bowman, F., Collins, D., Flagan, R. C., and Seinfeld, J. H.: Gas/particle partitioning and secondary organic aerosol yields, Environ. Sci. Technol., 30, 2580–2585, https://doi.org/10.1021/es950943, 1996.
Ortega, A. M., Hayes, P. L., Peng, Z., Palm, B. B., Hu, W., Day, D. A., Li, R., Cubison, M. J., Brune, W. H., Graus, M., Warneke, C., Gilman, J. B., Kuster, W. C., de Gouw, J., Gutiérrez-Montes, C., and Jimenez, J. L.: Real-time measurements of secondary organic aerosol formation and aging from ambient air in an oxidation flow reactor in the Los Angeles area, Atmos. Chem. Phys., 16, 7411–7433, https://doi.org/10.5194/acp-16-7411-2016, 2016.
Palm, B. B., Campuzano-Jost, P., Ortega, A. M., Day, D. A., Kaser, L., Jud, W., Karl, T., Hansel, A., Hunter, J. F., Cross, E. S., Kroll, J. H., Peng, Z., Brune, W. H., and Jimenez, J. L.: In situ secondary organic aerosol formation from ambient pine forest air using an oxidation flow reactor, Atmos. Chem. Phys., 16, 2943–2970, https://doi.org/10.5194/acp-16-2943-2016, 2016.
Palm, B. B., de Sá, S. S., Day, D. A., Campuzano-Jost, P., Hu, W., Seco, R., Sjostedt, S. J., Park, J.-H., Guenther, A. B., Kim, S., Brito, J., Wurm, F., Artaxo, P., Thalman, R., Wang, J., Yee, L. D., Wernis, R., Isaacman-VanWertz, G., Goldstein, A. H., Liu, Y., Springston, S. R., Souza, R., Newburn, M. K., Alexander, M. L., Martin, S. T., and Jimenez, J. L.: Secondary organic aerosol formation from ambient air in an oxidation flow reactor in central Amazonia, Atmos. Chem. Phys., 18, 467–493, https://doi.org/10.5194/acp-18-467-2018, 2018.
PAMWiki: https://sites.google.com/site/ pamwiki/, last access: 10 October 2020.
Pandis, S. N., Paulson, S. E., Seinfeld, J. H., and Flagan, R. C.: Aerosol formation in the photooxidation of isoprene and β-pinene, Atmos. Environ. A-Gen., 25, 997–1008, https://doi.org/10.1016/0960-1686(91)90141-S, 1991.
Pankow, J. F.: An absorption model of gas/particle partitioning of organic compounds in the atmosphere, Atmos. Environ., 28, 185–188, https://doi.org/10.1016/1352-2310(94)90093-0, 1994.
Peng, Z., Day, D. A., Stark, H., Li, R., Lee-Taylor, J., Palm, B. B., Brune, W. H., and Jimenez, J. L.: HOx radical chemistry in oxidation flow reactors with low-pressure mercury lamps systematically examined by modeling, Atmos. Meas. Tech., 8, 4863–4890, https://doi.org/10.5194/amt-8-4863-2015, 2015.
Peng, Z., Lee-Taylor, J., Orlando, J. J., Tyndall, G. S., and Jimenez, J. L.: Organic peroxy radical chemistry in oxidation flow reactors and environmental chambers and their atmospheric relevance, Atmos. Chem. Phys., 19, 813–834, https://doi.org/10.5194/acp-19-813-2019, 2019.
Pierce, J. R., Engelhart, G. J., Hildebrandt, L., Weitkamp, E. A., Pathak, R. K., Donahue, N. M., Robinson, A. L., Adams, P. J., and Pandis, S. N.: Constraining particle evolution from wall losses, coagulation, and condensation-evaporation in smog-chamber experiments: Optimal estimation based on size distribution measurements, Aerosol Sci. Tech., 42, 1001–1015, https://doi.org/10.1080/02786820802389251, 2008.
Renbaum-Wolff, L., Grayson, J. W., Bateman, A. P., Kuwata, M., Sellier, M., Murray, B. J., Shilling, J. E., Martin, S. T., and Bertram, A. K.: Viscosity of a-pinene secondary organic material and implications for particle growth and reactivity, P. Natl. Acad. Sci. USA, 110, 8014–8019, https://doi.org/10.1073/pnas.1219548110, 2013.
Seinfeld, J. H. and Pandis, S. N.: Atmospheric Chemistry and Physics: From Air Pollution to Climate Change, 2nd Edn., John Wiley & Sons, New York, 2006.
Shrivastava, M., Andreae, M. O., Artaxo, P., Barbosa, H. M. J., Berg, L. K., Brito, J., Ching, J., Easter, R. C., Fan, J., Fast, J. D., Feng, Z., Fuentes, J. D., Glasius, M., Goldstein, A. H., Alves, E. G., Gomes, H., Gu, D., Guenther, A., Jathar, S. H., Kim, S., Liu, Y., Lou, S., Martin, S. T., McNeill, V. F., Medeiros, A., de Sá, S. S., Shilling, J. E., Springston, S. R., Souza, R. A. F., Thornton, J. A., Isaacman-VanWertz, G., Yee, L. D., Ynoue, R., Zaveri, R. A., Zelenyuk, A., and Zhao, C.: Urban pollution greatly enhances formation of natural aerosols over the Amazon rainforest, Nat. Commun., 10, 1–12, https://doi.org/10.1038/s41467-019-08909-4, 2019.
Silva, C., Pinto Da Cunha, J., Pereira, A., Chepel, V., Lopes, M. I., Solovov, V., and Neves, F.: Reflectance of polytetrafluoroethylene for xenon scintillation light, J. Appl. Phys., 107, 064902, https://doi.org/10.1063/1.3318681, 2010.
Simonen, P., Saukko, E., Karjalainen, P., Timonen, H., Bloss, M., Aakko-Saksa, P., Rönkkö, T., Keskinen, J., and Dal Maso, M.: A new oxidation flow reactor for measuring secondary aerosol formation of rapidly changing emission sources, Atmos. Meas. Tech., 10, 1519–1537, https://doi.org/10.5194/amt-10-1519-2017, 2017.
Slowik, J. G., Wong, J. P. S., and Abbatt, J. P. D.: Real-time, controlled OH-initiated oxidation of biogenic secondary organic aerosol, Atmos. Chem. Phys., 12, 9775–9790, https://doi.org/10.5194/acp-12-9775-2012, 2012.
Song, C., Na, K., and Cocker, D. R.: Impact of the hydrocarbon to NOx ratio on secondary organic aerosol formation, Environ. Sci. Technol., 39, 3143–3149, https://doi.org/10.1021/es0493244, 2005.
Tkacik, D. S., Robinson, E. S., Ahern, A., Saleh, R., Stockwell, C., Veres, P., Simpson, I. J., Meinardi, S., Blake, D. R., Yokelson, R. J., Presto, A. A., Sullivan, R. C., Donahue, N. M., and Robinson, A. L.: A dual-chamber method for quantifying the effects of atmospheric perturbations on secondary organic aerosol formation from biomass burning emissions, J. Geophys. Res., 122, 6043–6058, https://doi.org/10.1002/2016JD025784, 2017.
Wang, X., Liu, T., Bernard, F., Ding, X., Wen, S., Zhang, Y., Zhang, Z., He, Q., Lü, S., Chen, J., Saunders, S., and Yu, J.: Design and characterization of a smog chamber for studying gas-phase chemical mechanisms and aerosol formation, Atmos. Meas. Tech., 7, 301–313, https://doi.org/10.5194/amt-7-301-2014, 2014.
Weitkamp, E. A., Sage, A. M., Pierce, J. R., Donahue, N. M., and Robinson, A. L.: Organic aerosol formation from photochemical oxidation of diesel exhaust in a smog chamber, Environ. Sci. Technol., 41, 6969–6975, https://doi.org/10.1021/es070193r, 2007.
Wiedensohler, A.: An approximation of the bipolar charge distribution for particles in the submicron size range, J. Aerosol Sci., 19, 387–389, https://doi.org/10.1016/0021-8502(88)90278-9, 1988.
Wong, J. P. S., Lee, A. K. Y., Slowik, J. G., Cziczo, D. J., Leaitch, W. R., MacDonald, A., and Abbatt, J. P. D.: Oxidation of ambient biogenic secondary organic aerosol by hydroxyl radicals: Effects on cloud condensation nuclei activity, Geophys. Res. Lett., 38, https://doi.org/10.1029/2011GL049351, 2011.
Xu, L., Guo, H., Boyd, C. M., Klein, M., Bougiatioti, A., Cerully, K. M., Hite, J. R., Isaacman-VanWertz, G., Kreisberg, N. M., Knote, C., Olson, K., Koss, A., Goldstein, A. H., Hering, S. V., De Gouw, J., Baumann, K., Lee, S. H., Nenes, A., Weber, R. J., and Ng, N. L.: Effects of anthropogenic emissions on aerosol formation from isoprene and monoterpenes in the southeastern United States, P. Natl. Acad. Sci. USA, 112, 37–42, https://doi.org/10.1073/pnas.1417609112, 2015.
Zhang, X., Cappa, C. D., Jathar, S. H., McVay, R. C., Ensberg, J. J., Kleeman, M. J., and Seinfeld, J. H.: Influence of vapor wall loss in laboratory chambers on yields of secondary organic aerosol, P. Natl. Acad. Sci. USA, 111, 5802–5807, https://doi.org/10.1073/pnas.1404727111, 2014.
Zhang, Y., Sanchez, M. S., Douet, C., Wang, Y., Bateman, A. P., Gong, Z., Kuwata, M., Renbaum-Wolff, L., Sato, B. B., Liu, P. F., Bertram, A. K., Geiger, F. M., and Martin, S. T.: Changing shapes and implied viscosities of suspended submicron particles, Atmos. Chem. Phys., 15, 7819–7829, https://doi.org/10.5194/acp-15-7819-2015, 2015.