the Creative Commons Attribution 4.0 License.
the Creative Commons Attribution 4.0 License.
 | 28 Apr 2021
Performance of an open-path near-infrared measurement system for measurements of CO2 and CH4 during extended field trials
Nicholas M. Deutscher
Travis A. Naylor
Christopher G. R. Caldow
Hamish L. McDougall
Alex G. Carter
David W. T. Griffith
Open-path measurements of atmospheric composition provide spatial averages of trace gases that are less sensitive to small-scale variations and the effects of meteorology. In this study we introduce improvements to open-path near-infrared (OP-NIR) Fourier transform spectrometer measurements of CO2 and CH4. In an extended field trial, the OP-NIR achieved measurement repeatability 6 times better for CO2 (0.28 ppm) and 10 times better for CH4 (2.1 ppb) over a 1.55 km one-way path than its predecessor. The measurement repeatability was independent of path length up to 1.55 km, the longest distance tested. Comparisons to co-located in situ measurements under well-mixed conditions characterise biases of 1.41 % for CO2 and 1.61 % for CH4 relative to in situ measurements calibrated to World Meteorological Organisation – Global Atmosphere Watch (WMO-GAW) scales. The OP-NIR measurements can detect signals due to local photosynthesis and respiration, and local point sources of CH4. The OP-NIR is well-suited for deployment in urban or rural settings to quantify atmospheric composition on kilometre scales.
- Article
(2972 KB) - Full-text XML
- BibTeX
- EndNote


Anthropogenic greenhouse gases, primarily carbon dioxide (CO2) and methane (CH4), are the main drivers of systematic changes in the Earth's climate, especially a net warming of the atmosphere and oceans. Characterising sources and sinks of greenhouse gases to and from the atmosphere is critical to understanding past, present, and future change.
Open-path measurements of atmospheric composition can provide complementary information to that available from in situ point measurements. By integrating over kilometre-length scales, open-path measurements provide quantifications that are less sensitive to small-scale variability and more representative of model spatial scales. In applications around detecting remote point sources, an integrated path also improves the likelihood of sampling through an emission plume. These advantages may come at the cost of precision and accuracy compared to in situ point measurements.
Technologies available for open-path measurements include differential optical absorption spectroscopy (DOAS), differential absorption lidar (DIAL), integrated path differential absorption (IPDA) lidar, chirped laser dispersion spectroscopy (CLaDS) tunable diode laser absorption spectroscopy (TDLAS), frequency comb spectroscopy, and open-path FTIR (OP-FTIR).
Single-wavelength open-path instruments include DIAL, IPDA, CLaDS and TDLAS. Tunable diode lasers are a relatively inexpensive technology capable of measurements of many atmospheric constituents, depending on the internal laser used. These have been applied to the detection of CO2 and CH4 in the past, but measured amounts vary considerably from instrument to instrument, and they are susceptible to drifts and inaccuracies (Feitz et al., 2018). CLaDS techniques, which rely on the phase of detected light, have been used for open-path measurements of methane (Nikodem et al., 2015; Plant et al., 2015). DIAL is a LIDAR-based technique that uses the differential backscatter signal between two wavelengths, one of strong absorption and the other of weak, to quantify concentrations of atmospheric absorbers. IPDA is a variant of DIAL, using topographical targets to allow integrated-path measurements. DIAL (Queisser et al., 2016) and IPDA (Wagner and Plusquellic, 2016) can be applied to integrated-path measurements of CO2 and CH4. In general, laser-based techniques can have low power requirements but are only tuned around a single wavelength and therefore can typically only detect a single gas. In addition, this leaves them susceptible to potential interferences. GreenLITE™ (Dobler et al., 2013; Lian et al., 2019) gets around some of the interference aspect by measuring at two wavelengths.
DOAS is typically applied in the ultraviolet and visible regions of the spectrum, making it unsuitable for measuring greenhouse gases. Recent advances have seen the expansion of DOAS-type measurements into the near infrared (NIR), delivering repeatability in CO2 measurements of 2–4 ppm over kilometre-scale path lengths and CH4 repeatability of the order of 200 ppb (Saito et al., 2015).
Frequency comb spectroscopy enables measurements across a range a spectral wavelengths. For example, Alden et al. (2019) employ a dual-frequency comb spectrometer to measure methane, operating over a 270 cm−1 spectral window centred at 7000 cm−1 at high spectral resolution (0.0067 cm−1). This combination of a wider window and high spectral resolution allows for the simultaneous retrieval of interfering species, especially atmospheric water vapour, improving the inherent stability and accuracy of the measurement. The instruments can operate in different wavelength regions; Rieker et al. (2014) describe an earlier system operating around 6000 cm−1 at 0.0033 cm−1 resolution, which measures CO2, CH4, H2O, HDO, and 13CO2 over 2 km path lengths, with 5 min precision of better than 1 ppm for CO2 and 3 ppb for CH4 with agreement between instruments of better than 1 ppm CO2 and 7 ppb for CH4 (Waxman et al., 2017).
While not operating at the spectral resolutions achieved by laser-based spectroscopy, open-path FTIR spectrometers can operate over even wider spectral regions, allowing quantification of many gases that absorb infrared radiation in the atmosphere. Open-path mid-infrared (OP-MIR) measurements (200–4000 cm−1) are limited to relatively short path lengths because of the low brightness of the internal MIR light source. Open-path MIR measurements have been used to quantify CO2 and CH4 on paths up to 400 m (e.g. Desservettaz et al., 2019; Phillips et al., 2019) in an urban environment. More typically they have been applied on 100 m scales for quantification of area sources coupled with a tracer gas, micrometerological techniques or a backward lagrangian stochastic model (WINDTRAX) (Bai et al., 2018; Flesch et al., 2016; Jones et al., 2011; Laubach et al., 2013; Loh et al., 2009; Naylor et al., 2016; Phillips et al., 2016). OP-MIR has also been used to detect and quantify a point CO2 and CH4 source during a controlled release experiment (Cartwright et al., 2019; Feitz et al., 2018). At these path lengths, repeatability of 1 ppm CO2 and 5 ppb for CH4 can be achieved. Tomographic techniques for quantifying fluxes, such as described by Humphries et al. (2012), could be applied to open-path measurements.
Griffith et al. (2018) detailed a pilot study extending OP-FTIR to measurements in the near-infrared (NIR) spectral region (4000–13 500 cm−1), where higher source brightness results in better collimation of the beam and theoretically longer paths. In addition, there are fewer interfering species, though the absorptions of CO2 and CH4 are weaker relative to MIR as they are overtone and combination bands. The instrument was deployed over a 1.55 km one-way path and demonstrated repeatability of 1.7 ppm for CO2 and 21 ppb for CH4 for 5 min averages. This paper details further developments and field trials based on the instrument introduced in that study and demonstrates significant improvements in precision and accuracy.
Section 2 describes the instrument, data processing and corrections applied to the data. The field deployment and testing of the instrument are described in Sect. 3, while the results are presented and discussed in Sect. 4. The conclusions are then presented in Sect. 5.
The instrument described here is based on the instrument described by Griffith et al. (2018), which was deployed in Heidelberg, Germany. We describe the instrument, retroreflector array and data processing and highlight the modifications relative to Griffith et al. (2018).
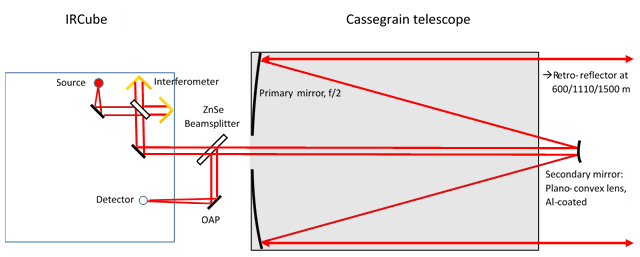
Figure 1Schematic diagram of the setup of the OP-NIR spectrometer, its coupling to the Cassegrain telescope, and the light path through these and subsequent to/from the retroreflector.
Figure 1 shows a schematic of the instrument setup. The central component of the open-path NIR (OP-NIR) system is a low spectral resolution FTIR spectrometer, the Bruker IRcube (Bruker Optik, Ettlingen, Germany). The spectrometer has an internal 25 W tungsten globe restricted to 11 W as the NIR radiation source, quartz beam splitter and TE-cooled Indium Gallium Arsenide (InGaAs) detector optimised for the NIR spectral region, covering the spectral range from 3800 to 10 000 cm−1. This covers the same spectral range as that used in the Total Carbon Column Observing Network (TCCON) (Wunch et al., 2011), which measures total column CO2, CH4 and other gases using the Sun as a light source. Unlike TCCON, the IRcube used in this study has a low spectral resolution of 0.5 cm−1 (maximum optical path difference of 1.8 cm). The spectrometer is relatively compact (310 × 290 × 220 mm, 14 kg).
For this work, the relatively small spectrometer allows it to be mounted on an Automated Instrument Mount (AIM, Omegalec, Unanderra, NSW, Australia), previously also used for open-path MIR measurements. AIM allows programmable, adjustable pointing of the instrument, driven by stepper motors on each of an elevation and azimuth axis. AIM and the instrument are supported on a heavy-duty tripod (MOOG-QuickSet, Northbrook, IL, USA). The spectrometer is rigidly coupled to a beam-expanding telescope. In contrast to the setup used by Griffith et al. (2018), here we use a 50 : 50 zinc selenide (ZnSe) beam splitter instead of an optic fibre to couple the interferometer and detector to the telescope and a Schmidt-Cassegrain (Meade Instruments Corporation, Irvine, CA, USA), instead of a Newtonian, telescope. In addition, the light is modulated prior to exiting the spectrometer, minimising the effects of stray light from the environment on the measurements. The telescope has the Schmidt corrector plate removed and uses a custom convex 30 mm diameter secondary mirror with 50 mm focal length mounted on a micrometre stage for fine-focus adjustment to convert the telescope to a beam expander. Direct back reflection off centre of the secondary mirror to the beam splitter, which would result in a shorter measurement path, is minimised by masking the centre of the secondary mirror using non-reflective material. This setup more closely resembles that used with existing OP-MIR systems (Flesch et al., 2016; Naylor et al., 2016; Phillips et al., 2016) and in initial lab and field trials provided an order of magnitude more throughput than the optic fibre coupling described by Griffith et al. (2018).
The retroreflector initially used was a hollow gold-coated corner cube array (30 × 63 mm, PLX Inc, Deer Park, NY, USA) previously deployed with the OP-MIR systems. This was later replaced by an array of 49 × 50 mm solid BK-7 glass retroreflectors (JEOC, Zhejiang, China) with a total dimension of 600 mm by 625 mm (height × width). The solid glass corner cubes are less prone to condensation and dust accumulation, easily cleaned, and require less maintenance in the field, as well as being considerably less expensive to purchase. The beam transmitted over the open path is returned to the telescope via the retroreflector array. The returning beam is reflected off the beam splitter and focussed onto the InGaAs detector in the spectrometer.
Auxiliary information is logged at the spectrometer end of the path. A temperature sensor (LM335 diode) is housed in a solar shield to protect from direct solar radiation, while a pressure sensor (Vaisala PTB110, Helsinki, Finland) is housed in a vented box. These are logged on the same time interval as spectral collection.
The instrument is powered by 240 V mains power. For field deployment, it was housed in a portable aluminium garden shed.
2.1 Data processing
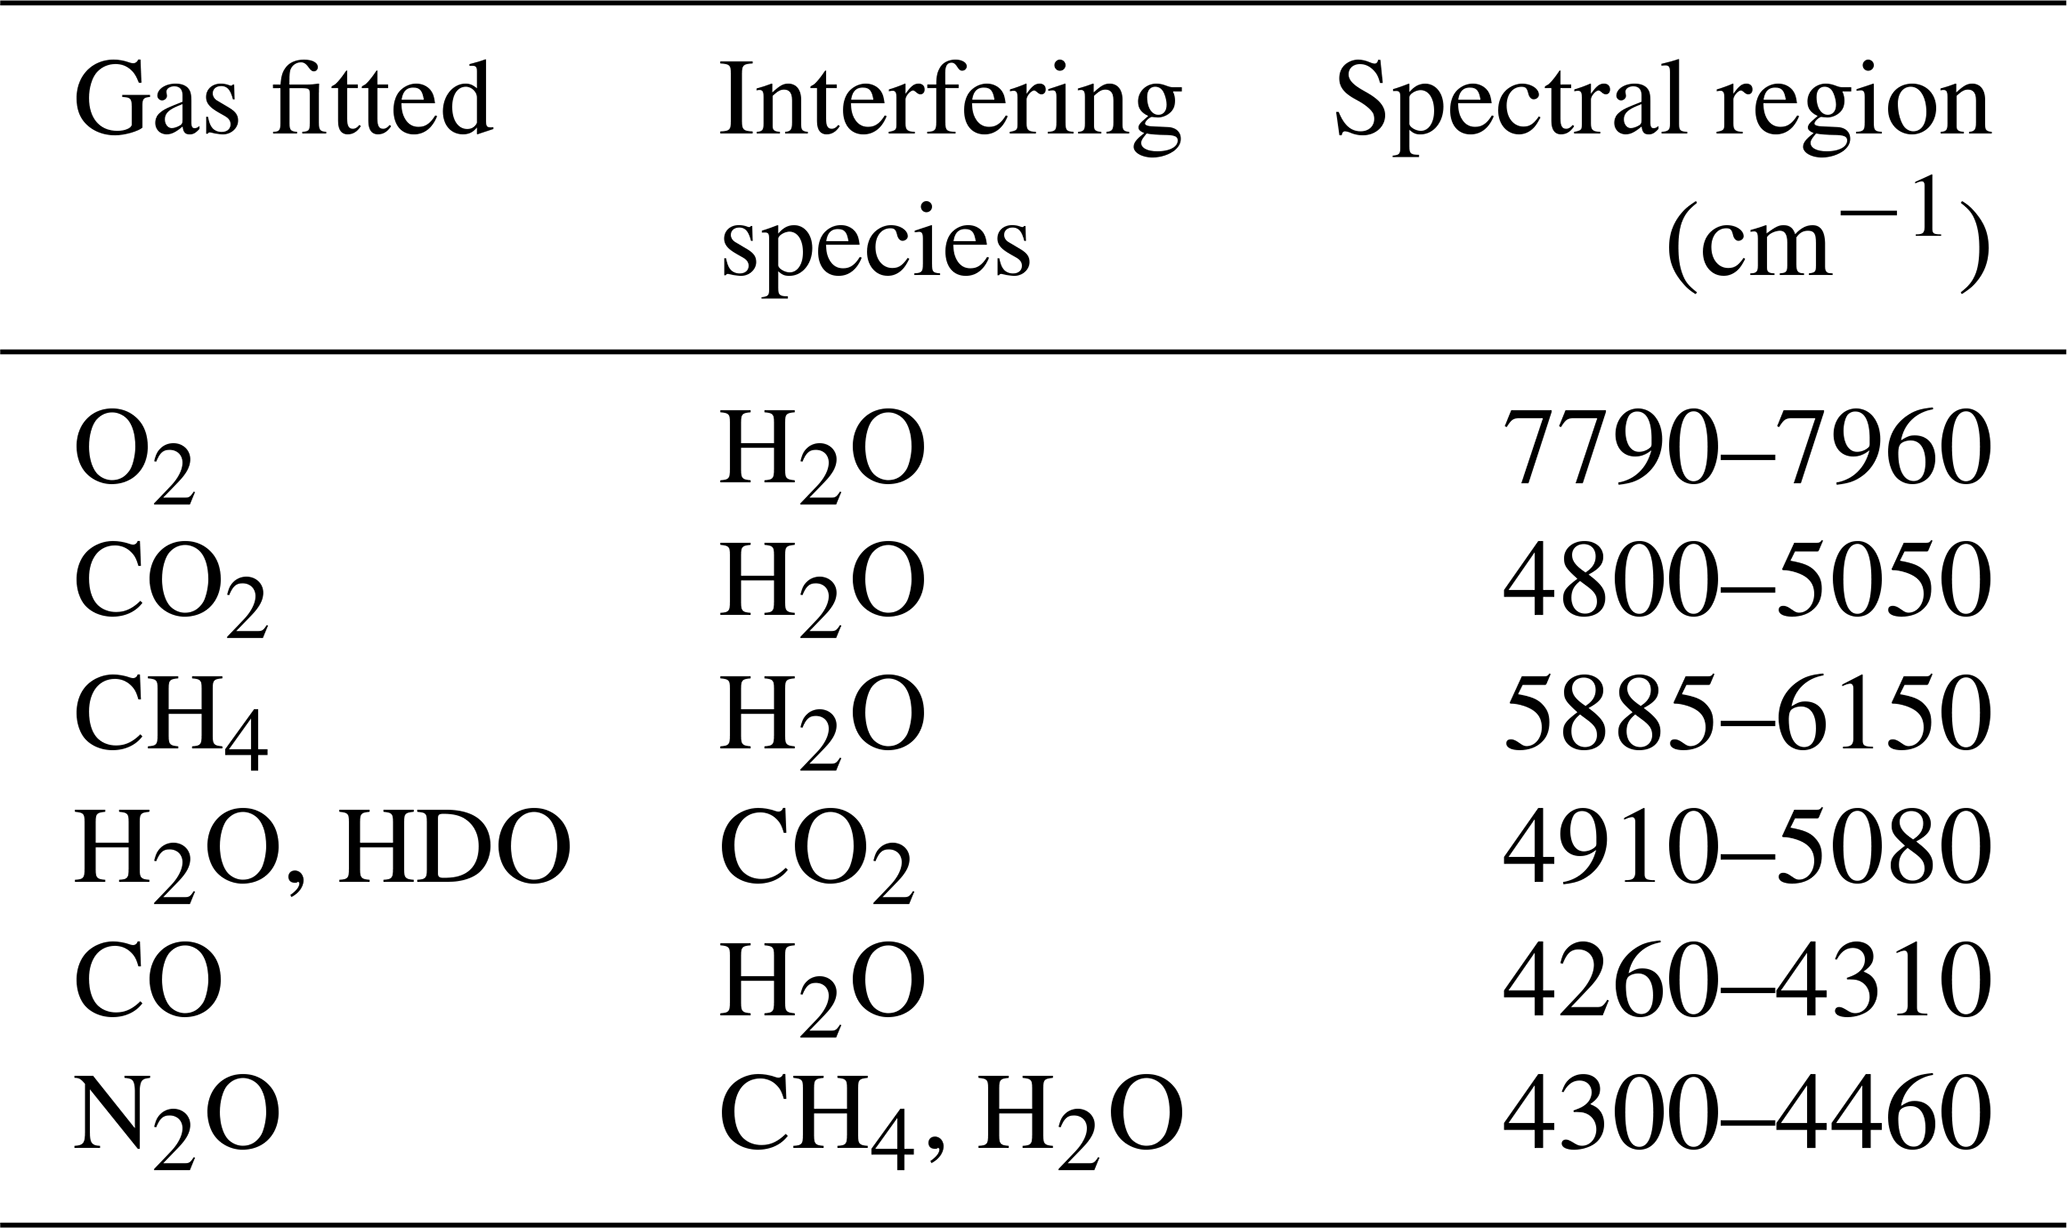
From the collected NIR spectra, path-averaged trace gas mole fractions are retrieved by fitting a calculated spectrum to the measured spectrum. The calculated spectrum is generated using a forward model, Multiple Atmospheric Layer Transmission (MALT, Griffith, 1996). The forward model uses absorption line parameters based on HITRAN 2016 (Gordon et al., 2017) (updated from HITRAN 2008, Rothman et al., 2009; used in Griffith et al., 2018), measured temperature, pressure and path length, and an initial estimate of trace gas amounts, together with an instrument model accounting for resolution, apodisation, line shape, spectral shift and continuum shape. The calculated spectrum is iteratively adjusted using the Levenberg–Marquardt algorithm to achieve the best fit to the measured spectrum. This yields a path-integrated number of molecules (column density, molecules cm−2), which is converted to a path-averaged mole fraction using the air density calculated from pressure and temperature. Spectra are fitted in a number of different windows. Those used for this work are summarised in Table 1 and are illustrated in Griffith et al. (2018).
Table 1Summary of the spectral windows used for retrieval of path-averaged concentrations in the open-path NIR spectra; see Griffith et al. (2018) for plots.
Spectra are fitted in real time immediately after collection to provide an initial estimate of trace gas mole fractions; however, we subsequently re-fit the spectra to account for two corrections: (1) the residual back-reflection from the secondary mirror and (2) differences between the temperature measured at one end of the path and the effective or true path-averaged temperature. The retrievals are corrected to dry-air mole fractions using the H2O column retrieved from the spectra.
2.1.1 Short-path correction
A small fraction of the outgoing beam is reflected directly back from the centre of the convex secondary mirror to the beam splitter and detector. Outgoing radiation can also be reflected by the external beam splitter and returned to the beam splitter and detector after diffuse reflection from the inside of the instrument cover. Both of these effects result in radiation that does not traverse the full atmospheric path. These effects are minimised by blocking the centre of the secondary mirror and shielding the instrument cover with a non-reflective, matt black surface. Despite these measures, the short-path signal is not completely eliminated but remains relatively constant and is independent of the long-path intensity. It therefore represents a variable relative contribution to the total intensity.
For a more accurate analysis of the long-path spectrum, a correction for this effect is derived and applied. An off-target spectrum is recorded and stored by pointing the telescope away from the retroreflector to ensure there is no long-path contribution. A least-squares fit of the stored off-target spectrum is performed for each long-path measurement in the 5000–5500 cm−1 region, which is otherwise blacked out by H2O absorption in the full path. The least-squares fit provides a scaling factor to apply to the stored off-target spectrum, which is then subtracted from the measured spectrum across the full wavelength range. The spectral analysis is then repeated on the resulting long-path-only spectrum. Example long-path and short-path spectra are shown in Fig. 2.
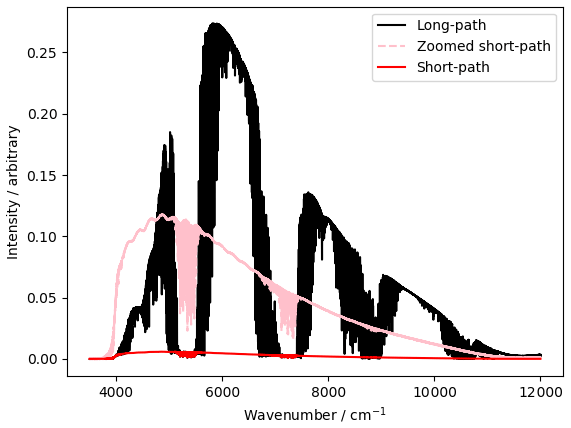
Figure 2Example long-path spectrum (23:48 AEST (Australian eastern standard time) 5 December 2018, black) and original (red) and 20× zoom (pink) short-path spectrum (21:48 AEST 2 December 2018).
2.1.2 Path-averaged temperature
Temperature is required in the spectral analysis to generate the forward model spectrum from HITRAN line parameters and to calculate air density when deriving mole fractions. Air density is directly inversely proportional to temperature; therefore, a 1 % error in absolute temperature will result in an inversely proportional error in the mole fraction. The measured temperature at one end of the path is not necessarily representative of the effective mean temperature along the long path due to variation of the temperature within the path and the possibility that the measured temperature could be influenced by solar radiation and thermal mass of surrounds. In general, the measured temperature is also likely to be taken closer to the ground than the average measurement height (beam path) along the open path.
To determine the effective path-averaged temperature, an initial fit to the CO2 window (Table 1) is performed, including the temperature in the least-squares fit. The retrieved temperature is then applied as a fixed value in reanalysis of all windows. The retrieved temperatures show the greatest difference from the measurements during daytime, when solar heating of the sensor results in a positive bias in the apparent measured values and can be as much as 5–10 ∘C. Waxman et al. (2017) found that a similar process was necessary with frequency comb spectroscopy open-path measurements.
The net effect of the refitting process to account for both the short-path correction and path-averaged temperature yields the differences illustrated in Fig. 3. The refitted temperatures are generally lower. This, together with removing the short-path absorption, results in an increase in retrieved mole fractions after refitting.

Figure 3Time series illustrating the impact of re-processing the original spectra to account for contributions from short-path (spurious) reflections and inaccuracies in measured temperature. The figure shows, in order from bottom to top, the original (red) and refitted (black) CO2 (d), the difference between the refitted and original CO2 (c), the measured (red) and fitted (black) temperature (b), and the difference between the fitted and measured temperature (a).
After initial testing over short path lengths within the lab and on the University of Wollongong campus, the instrument was deployed on an extended field campaign to a New South Wales Department of Primary Industries (NSW-DPI) agricultural research site, Elizabeth Macarthur Agricultural Institute (EMAI) at Menangle, NSW. The site is located just outside the current Sydney urban area, 52 km to the south-west of the city. The location is depicted in the map in Fig. 4.
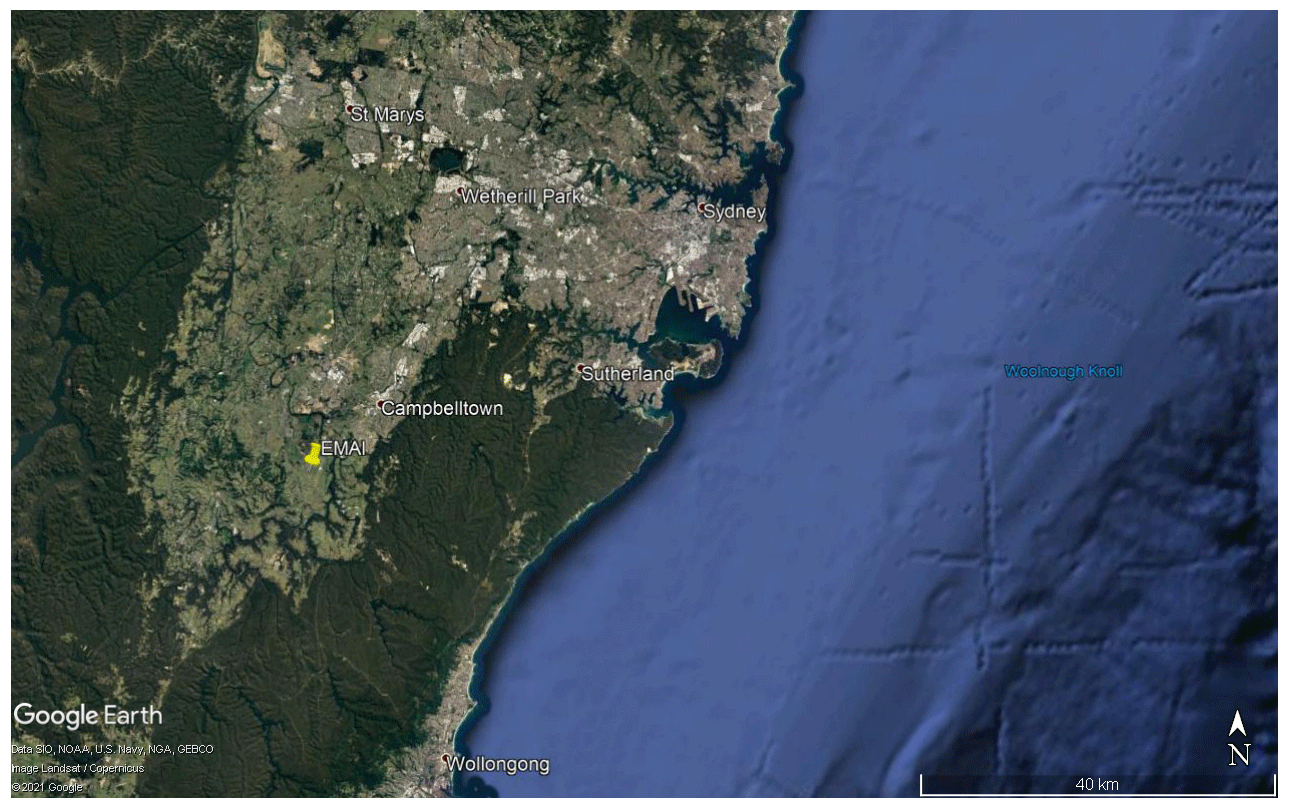
Figure 4Map showing the location of EMAI relative to Sydney and Wollongong. The measurement path and corresponding elevation profile are shown in Fig. 8. Map data © Google Earth.
Table 2Summary of the open-path NIR instrument setup at EMAI. Previous work by Griffith et al. (2018) in Heidelberg is used as a reference. Dates are in YYYYMMDD.

The instrument was located on site for about 4 months (123 d), from 4 August 2018 to 12 December 2018. Throughout the deployment period, several changes to the setup took place, as summarised in Table 2. Firstly, the path length was varied by moving the retroreflector array from 0.6 to 1.11 to 1.55 km distant from the FTIR, resulting in total path lengths of 1.20, 2.22 and 3.10 km. The terrain limited the one-way path to a maximum of 1500 m. At 600 m, the retroreflector array was changed from the hollow gold-coated array to the array of BK7 glass corner cubes. Finally, the telescope was changed from a 10 to 12 in. (25 to 30 cm) version.
Accounting for two periods where the instrument was removed for (1) a re-alignment and (2) the change in telescope size, the OP-NIR measured successfully during the remote deployment for 92 % of the possible time. Data losses occurred due to power failures and on-site instrument maintenance. After filtering to remove spectra with small signals due mostly to rain, fog and condensation on the retroreflectors (less than 5 % of the maximum) and poor fits (rms residual greater than 0.007), a further 9 % of measurements were removed, mostly due to moisture, meaning the system was able to provide measurements of path-averaged mole fractions 83 % of the time.
3.1 Cavity RingDown Spectrometer (CRDS) in situ measurements
During the campaign, a Picarro G2301 Cavity RingDown Spectrometer (CRDS) (Crosson, 2008) measuring CO2, CH4 and H2O was deployed. The CRDS measured continuously and was co-located with the OP-NIR spectrometer from 30 November to 12 December 2018. The CRDS sampled from an inlet mounted above the roof of the instrument shed at approximately 2.5 m above ground level. It was calibrated against a suite of WMO-traceable gas standards before and after the deployment and showed no drift in calibration during the period.
3.2 Meteorological data
Weather data are collected on site by NSW-DPI 1.2 km to the south-south-east of the OP-NIR instrument shelter. These are collected with 10 min resolution using a Measurement Engineering Australia all-in-one weather station, supplying wind speed and direction, temperature, humidity, solar radiation, and precipitation.
The time series of CO2, CH4, O2, H2O, CO and N2O from the EMAI deployment are shown in Fig. 5. While the CO (120 ± 80 ppb, mean ± standard deviation) and N2O (330 ± 60 ppb) retrievals are centred on realistic values, the scatter about these is large due to the transmission cutoff of the BK7 glass corner cubes at lower frequencies where these species absorb. This could be improved by using corner cubes of different glass or quartz, but the focus of the remainder of this work will be on CO2 and CH4.
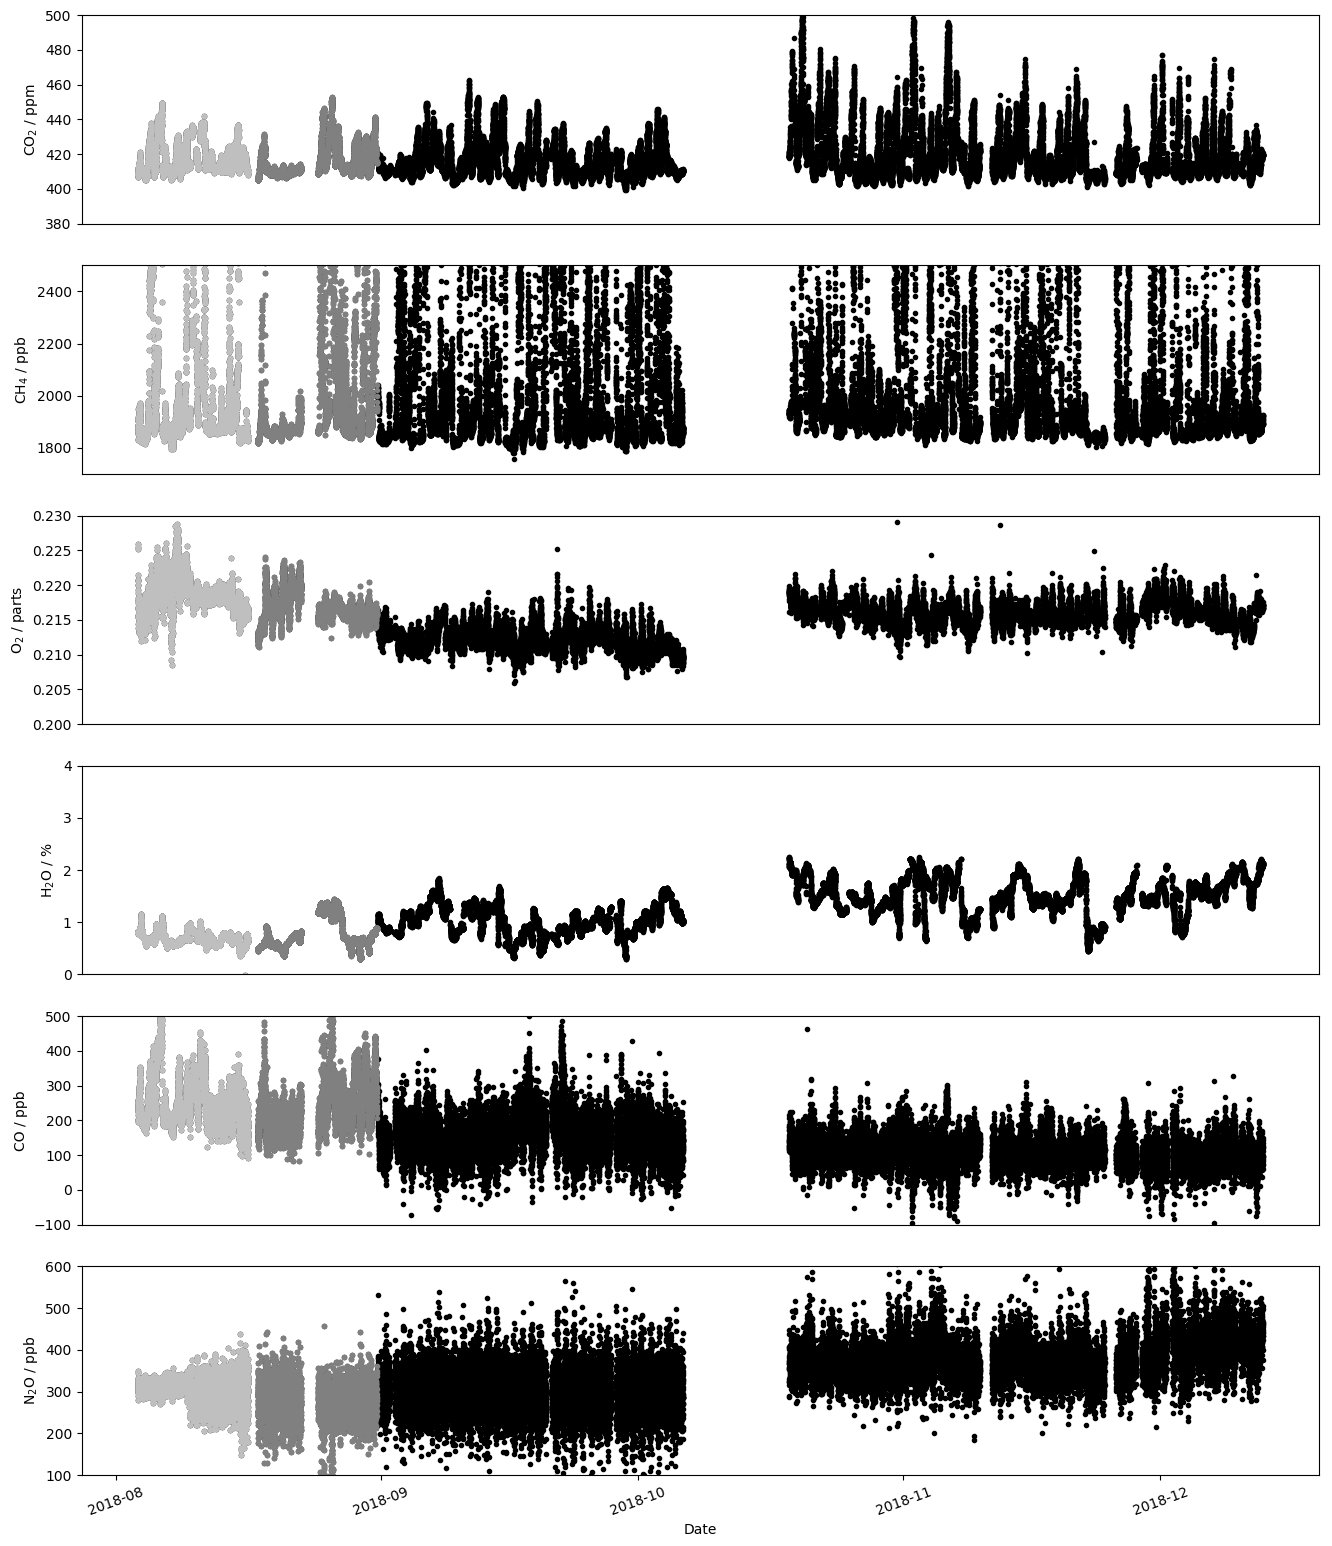
Figure 5Time series of the retrieved path-averaged mole fractions for the 600, 1110 and 1500 m path lengths. Data collected at a one-way path length of 600 m are shown in light grey, at 1110 m in darker grey, and the 1500 m path length in black. The CH4 y axis has been zoomed to 1700 to 2500 nmol mol−1.
4.1 Measurement performance
We assess the performance of the system using a variety of metrics. Firstly, we calculate the signal-to-noise ratio (SNR) within the spectra by ratioing consecutive spectra and calculating the root-mean-square (rms) noise of the result in the 6300–6500 cm−1 spectral region, free from atmospheric absorption.
Secondly, we assess the repeatability of the path-averaged mole fraction measurements by choosing periods when atmospheric variability is small, specifically at wind speeds greater than 2 m s−1. This does not eliminate all sources of real atmospheric variability; therefore, a low-frequency running mean (40 points/2 h) was also subtracted from the time series in order to assess the variability in the trace gas measurements. Allan deviations (Allan, 1966; Werle et al., 1993) are also calculated and for single measurements agree with the standard deviations of the noise time series.
Table 3Summary of the measurement performance during the field deployment at each path length and over changes in instrument setup. The numbered measurement periods and setups correspond to those in Table 2.
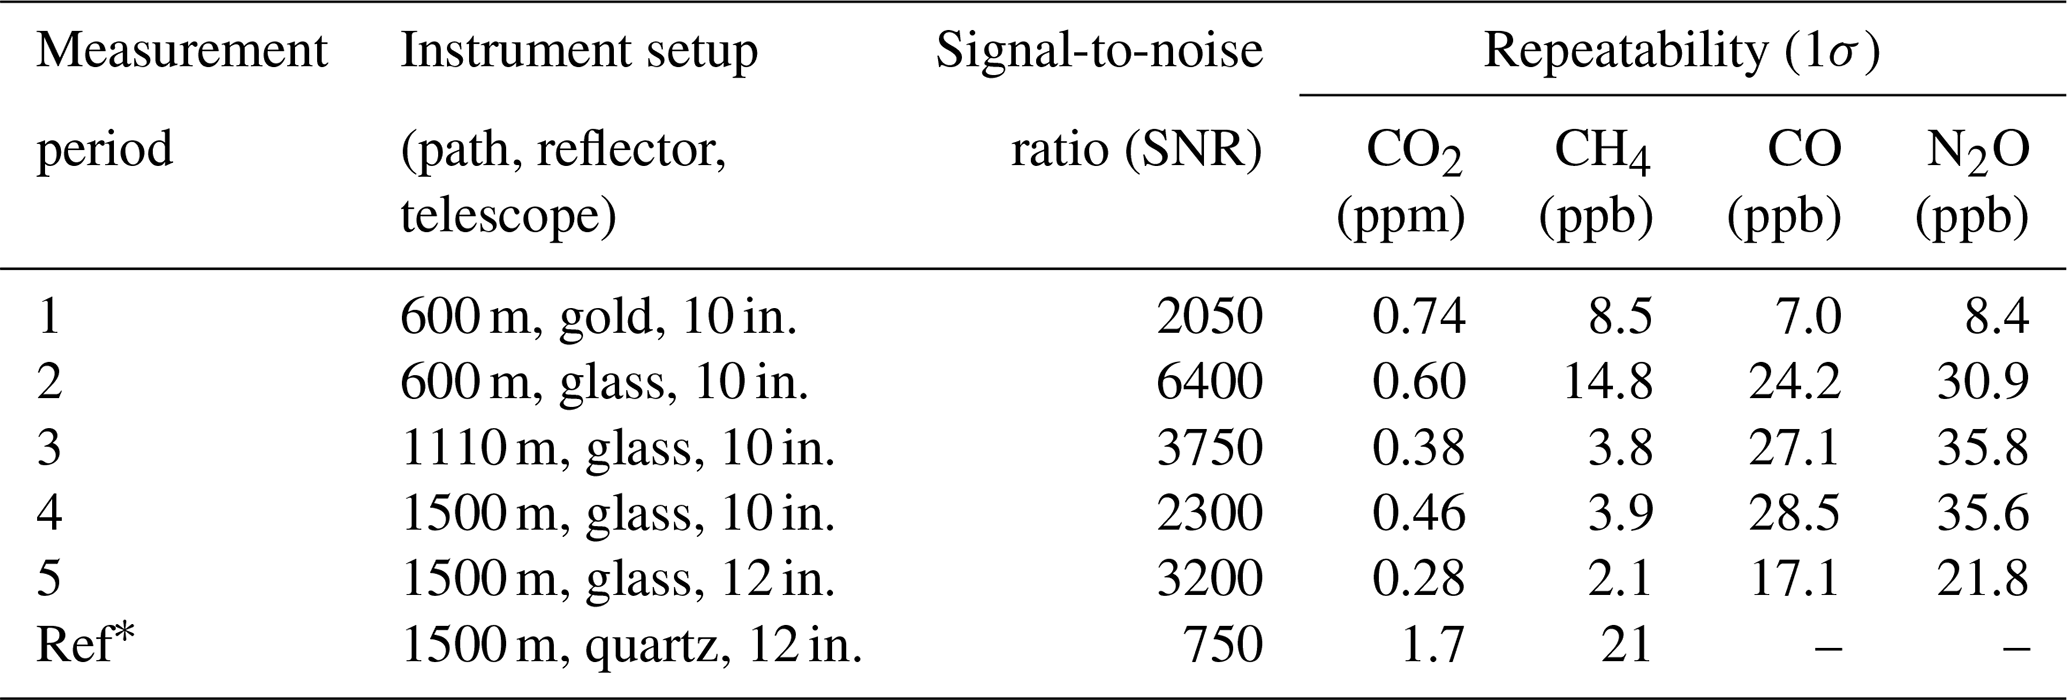
∗ Deployment at Heidelberg (Griffith et al., 2018).
The results are summarised in Table 3 for varying path lengths and instrument setups with the results from the original Heidelberg deployment (Griffith et al., 2018) for comparison. A change in retroreflector array at 600 m path length yields SNR improvement of about a factor of 3 and a small improvement in trace gas retrieval repeatability for CO2 (18 %) and CH4 (44 %), as shown in the difference in performance between measurement periods 1 and 2. The retroreflector arrays are nearly identical in size; therefore, this is attributed to the newer, cleaner optics. Measurements of CO and N2O are, however, compromised by the change in reflector due to lower transmission at these wavelengths through the glass corner cubes.
For a (constant) detector-noise limited spectrum measurement, increasing path length from 600 to 1110 to 1500 m would decrease spectrum signal and SNR as the inverse square of the path length, while in practice we observe an approximately inverse linear falloff. This is consistent with a component of noise proportional to the signal, presumably due to a combination of turbulence and photon noise. The depth of absorption lines increases in proportion to path length, so the net absorption : noise ratio (and thus measurement precision) remains roughly constant with path length.
An increased telescope diameter from 10 to 12 in. (25 to 30 cm) at 1550 m also yielded a 40 % improvement in SNR compared to a theoretical increase of 44 % based on the relative increase in surface area. Larger telescope diameters should therefore yield further improvements in SNR. This setup yielded the best trace gas repeatabilities, though some variability between setups occurs from the availability of suitable well-mixed atmospheric periods and underlying atmospheric variability.
Finally, comparing period 5 with the Heidelberg reference performance in Table 3 at almost identical path length, the new system has 4 times better SNR and repeatability 6 times (0.28 ppm) and 10 times (2.1 ppb) better for CO2 and CH4, respectively, than the original system described by Griffith et al. (2018).
4.2 Comparison to in situ measurements
The time series of OP-NIR and CRDS measurements and their differences are shown in Fig. 6. In the majority of the time series the two instruments capture the same broad events and the OP-NIR compares reasonably well with the Picarro measurements over the concurrent measurement period. The OP-NIR measurements typically exhibit less variability than the in situ measurements, especially at night and/or during low wind-speed conditions. This is expected, because the OP-NIR measures the spatial average of gas mole fractions and thus variability along the path averaged over the time of each OP-NIR measurement – 3 min in this case. In contrast, in situ techniques are sensitive to spatio-temporal variability at their location on the timescale of several seconds, such as localised gas fluxes and/or atmospheric mixing or lack thereof.
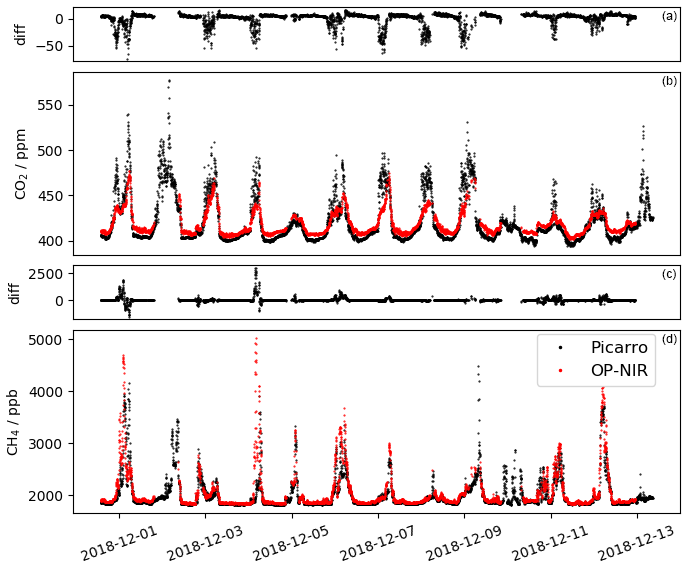
Figure 6Time series of measured CO2 (a, b) and CH4 (c, d) from the OP-NIR (red) and in situ CRDS (black) measurements while the CRDS was co-located with the OP-NIR, from 1 to 13 December 2018. For each gas, the upper panel (a, c) shows the difference between the OP-NIR and CRDS measurements.
The comparison between the OP-NIR and Picarro for CO2 is shown in Fig. 7. The measurements are divided into three categories: sunny (solar radiation above 100 W m−2), well-mixed (wind speed greater than 2 m s−1) and all other data. Picarro CO2 measurements are consistently higher at night and lower during the day in sunny periods compared to the OP-NIR measurements. Usually over grassland such as at the field site, there is a net flux of CO2 from the atmosphere to the biosphere during the day, due to photosynthetic uptake being larger than respiration. The reverse is true at night. These fluxes establish a vertical CO2 gradient near the Earth's surface, with higher CO2 near the surface during the night and lower CO2 near the surface during the day. The CRDS inlet is closer to the surface (2.5 m) than the mean height of the OP-NIR path (23 m; see Fig. 8), which may explain why the Picarro CO2 measurements are higher at night and lower during the day than the OP-NIR.
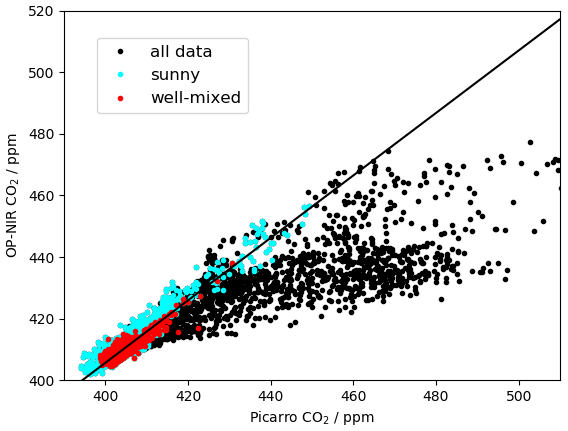
Figure 7Comparison of path-averaged CO2 measured by the open-path NIR and in situ CO2 measured by the CRDS. All data points are shown in black, with those from well-mixed conditions (wind speeds greater than 2 m s−1) in red and those during sunlight hours (solar radiation greater than 100 W m−2) in cyan. The best-fit line (OP-NIR = 1.0141 ± 0.0002 × Picarro) for the fit of OP-NIR vs. in situ measurements under well-mixed conditions is shown.
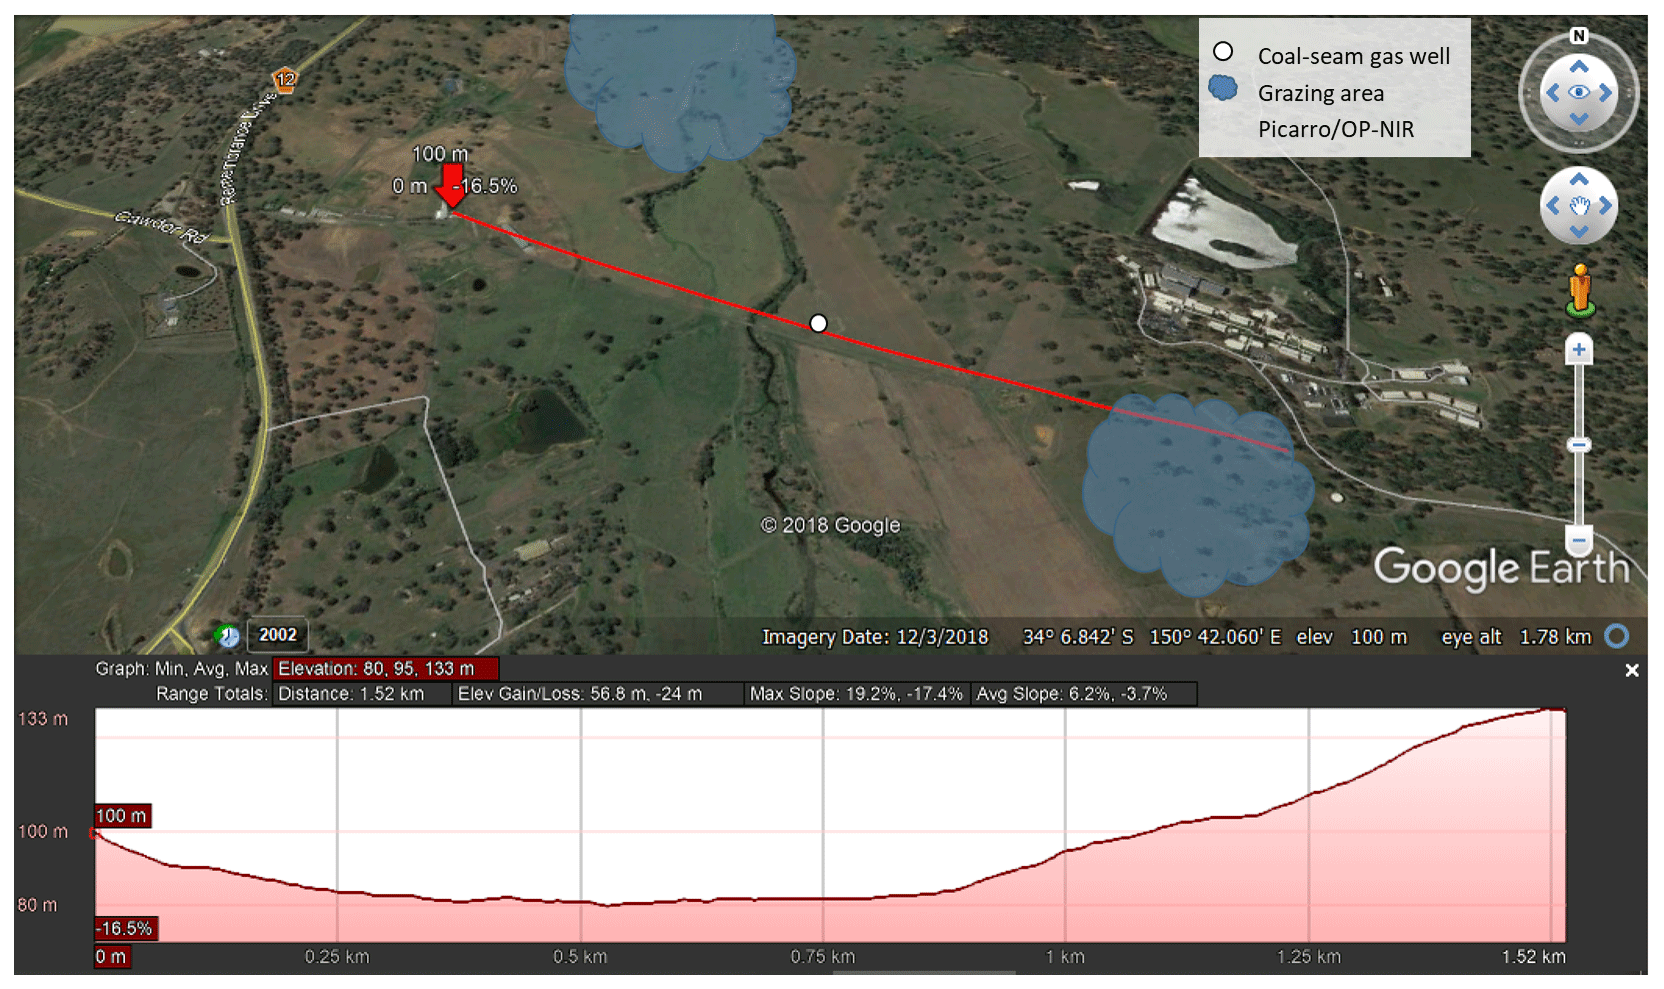
Figure 8Map of the 1.55 km path at EMAI and corresponding elevation profile. The OP-NIR and stationary Picarro were located at the left end of the path and the retroreflector array at the right end. The mean elevation across the 1.55 km observation path is 118 m above sea level, an average of 23 m above surface elevation. Map © Google Earth.
For CH4 (Fig. 9) variations in both directions occur, with the OP-NIR measurements often higher than the CRDS. This is due to the presence of two local sources in the fields over which the open-path beam passes – a coal-seam gas (CSG) well located almost directly under the path at 500 m from the retroreflector and grazing stock (sheep and cattle) most often located around the eastern end of the path. The CRDS is located to the western side of the field and, since it is a point rather than path-integrated measurement, it samples less influence from these sources.
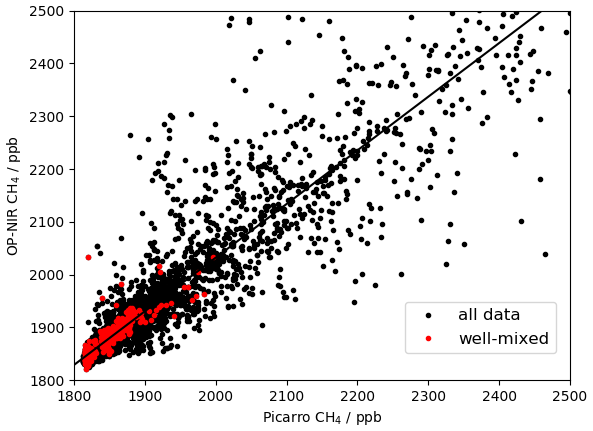
Figure 9Comparison of path-averaged CH4 measured by the open-path NIR and in situ CH4 measured by the CRDS. All data points are shown in black, with those from well-mixed conditions (wind speeds greater than 2 m s−1 and from the westerly sector) in red. The best-fit line of OP-NIR = 1.0161 ± 0.0004 × Picarro for the fit of OP-NIR vs. in situ measurements under well-mixed conditions is shown.
A polar bivariate plot for CH4 from open-path measurements is shown for the data from the entire campaign in Fig. 10. The highest CH4 values are seen under conditions with low wind speeds, indicating a source under or very close to the measurement path and/or a build-up of CH4 under stable atmospheric conditions. Other high amounts are also seen from a sector to the south-east, with some enhancements to the north. The nearest CSG well is located approximately 5 m to the south of the open path, 500 m from the retroreflector end of the 1500 m path. When they were in nearby fields, the majority of sheep were located to the east/south-east of the instrument shed (south of the retroreflector), while cattle were periodically located to the south-east of the instrument and regularly to the north. As the experiment was conducted remotely, we do not have exact records of stock movements. The locations of the potential sources are illustrated in Fig. 8.
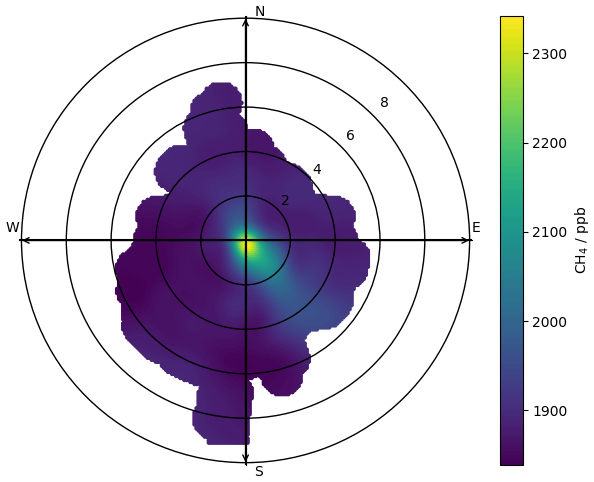
Figure 10Polar bivariate plot showing the relationship between CH4, wind speed and wind direction over the full campaign.
For CH4, an additional criterion is therefore added to the definition of well-mixed conditions to account for the CSG well, sheep and cattle that are present near to the OP-NIR measurement path. We therefore also include only data from the westerly sector in our definition of well-mixed conditions, i.e. wind directions between 180 and 360∘.
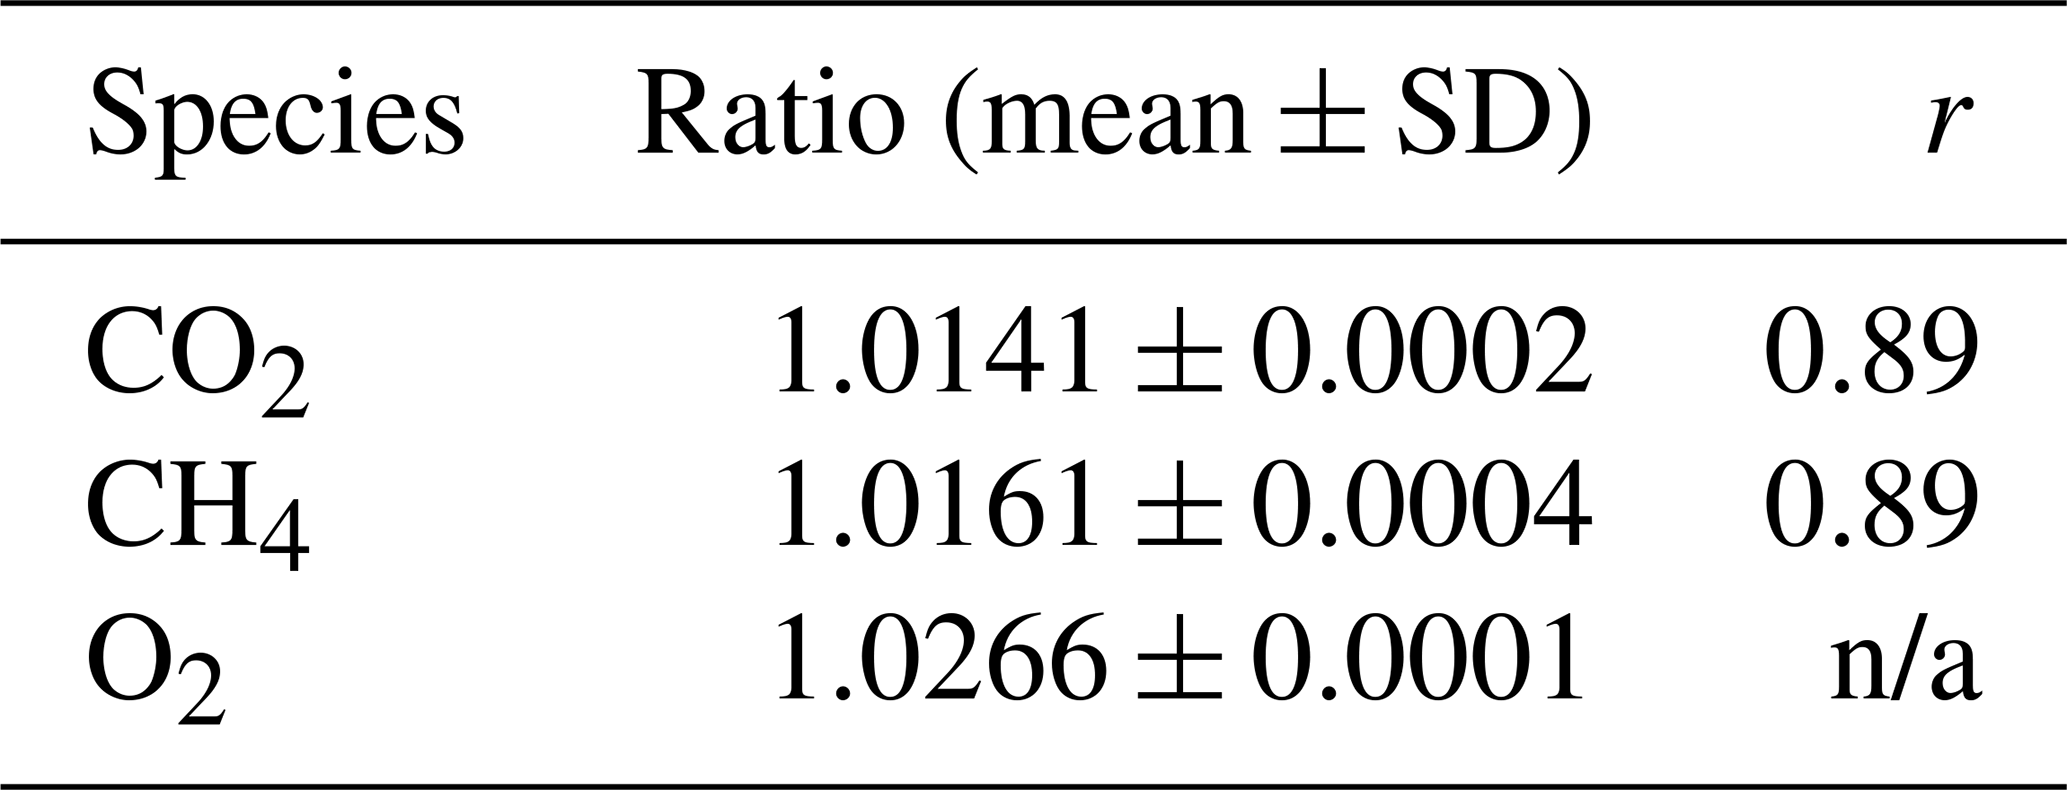
Comparison between the in situ CRDS measurements and the path-averaged FTIR measurements under well-mixed conditions is used to assess the bias of the OP-NIR system. Under these conditions, the relationship between the OP-NIR and CRDS falls tightly on a line. For CO2, this corresponds to a slope of 1.0141 ± 0.0002 (r=0.89); i.e. the OP-NIR is biased high by 1.41 % (≈ 6 ppm at 400 ppm) relative to the in situ measurement scale. Figure 9 shows the comparison between in situ and open-path CH4. With wind speeds above 2 m s−1 from the west, the relationship between the open-path and in situ measurements lies around a slope of 1.0161 ± 0.0004 (r=0.89). There is much more scatter in the relationship for CH4 than CO2, indicative of the variety and spatial inhomogeneity of local sources and sinks. For both CO2 and CH4, these biases are approximately a factor of 2 smaller using HITRAN 2016 line parameters compared to HITRAN 2008 used in Griffith et al. (2018).
The comparison between the OP-NIR and in situ measurements is summarised in Table 4.
Table 4Calculated biases of OP-NIR measurements relative to either in situ measurements or known mole fractions. “n/a” means not applicable.
4.3 Future directions
At EMAI, we were limited to testing up to 1.55 km due to the availability of appropriate lines of sight, but the pathlength-independent behaviour of the OP-NIR measurement repeatability out to 1500 m suggests that longer path lengths are possible. Given the cost-effective BK7 glass retroreflectors, the surface area of the retroreflector array could be further increased to facilitate this. A larger telescope could also increase the signal, enabling longer path lengths to be used. The inexpensive nature of the retroreflectors and the use of the AIM unit with programmable pointing mean that a multiple-path configuration would also be possible. This could produce a doubling of effective path length or enable setups where upwind/downwind measurement pairs can be taken over wider areas than previously possible with the OP-MIR system (Cartwright et al., 2019; Feitz et al., 2018).
The ability to co-retrieve CO and N2O would enable the system to be used in a broader range of applications, in both urban and rural settings. At moderate increased expense, alternative glass retroreflectors could be used to improve signals at these wavelengths, which should lead to improved precision. These co-retrieved gases could help to identify and quantify atmospheric signals especially from combustion (CO) or soil/wastewater processes (N2O).
Open-path measurements are more likely to capture point source emissions than single point measurements provided that the repeatability is good enough to resolve this over the integrated path. The OP-NIR spatial scale is more comparable to the scale of many atmospheric models, which facilitates model intercomparison studies. Other potential applications include measurements from industrial-scale composting, landfills, and wastewater treatment, agricultural monitoring of soil (fertiliser) or animal emissions, and gas pipeline monitoring and leak detection when combined with appropriate modelling.
In this paper, we present refinements to an open-path Fourier transform infrared system measuring in the near-infrared spectral region. Over paths up to 1.55 km one way, the system can achieve repeatability of better than 0.1 % (at 0.28 ppm) for CO2 and close to 0.1 % (at 2.1 ppb) for CH4 for 3 min averaging times under well-mixed atmospheric conditions. The measurement precision is essentially independent of path length. Comparison to co-located in situ measurements, also under well-mixed conditions, indicates offsets of approximately 1.5 % from measurements traceable to WMO scales. The open-path measurements therefore have a calibration offset of 1.41 % for CO2 and 1.61 % for CH4. The open-path measurements also prove capable of detecting signals from photosynthesis, respiration, and ruminant stock on local scales.
Data are in preparation for submission to a publicly accessible database after approval from funding bodies.
NMD led the research and co-ordinated writing of the paper. NMD and DWTG were responsible for acquiring funding for this research. NMD, DWTG and TAN organised field trials, which were executed by them, CGRC and HLM. NMD, DWTG, TAN and CGRC were involved in project direction. TAN, DWTG, NMD, CGRC and AGC were all involved in data analysis. All the authors contributed to writing and editing the manuscript.
The authors declare that they have no conflict of interest.
The authors are grateful to staff at Elizabeth Macarthur Agricultural Institute, especially Greg Scott and Ania Deutscher for organising and providing access to the EMAI field site and Michael Fitzgerald for providing weather station data. The authors wish to acknowledge financial assistance provided through Australian National Low Emissions Coal Research and Development (ANLEC R&D). ANLEC R&D is supported by COAL21 Ltd and the Australian Government through the Clean Energy Initiative. This research project used assets provided by the Australian Government Education Investment Fund through the CO2CRC. We also acknowledge the support of AuScope for the Picarro CRDS analyser used in this work. Nicholas M. Deutscher is funded via an ARC Future Fellowship, FT180100327. We an indebted to the input of colleagues throughout the project, especially Peter Rayner and Jeremy Silver at the University of Melbourne.
This research has been supported by the Australian National Low Emissions Coal Research and Development (grant no. 7-0816-0304) and the Australian Research Council (grant no. FT180100327).
This paper was edited by Andreas Hofzumahaus and reviewed by two anonymous referees.
Alden, C. B., Coburn, S. C., Wright, R. J., Baumann, E., Cossel, K., Perez, E., Hoenig, E., Prasad, K., Coddington, I., and Rieker, G. B.: Single-Blind Quantification of Natural Gas Leaks from 1 km Distance Using Frequency Combs, Environ. Sci. Technol., 53, 2908–2917, https://doi.org/10.1021/acs.est.8b06259, 2019. a
Allan, D. W.: Statistics of Atomic Frequency Standards, P. IEEE, 54, 221–230, https://doi.org/10.1109/PROC.1966.4634, 1966. a
Bai, M., Suter, H., Lam, S. K., Davies, R., Flesch, T. K., and Chen, D.: Gaseous emissions from an intensive vegetable farm measured with slant-path FTIR technique, Agr. Forest Meteorol., 258, 50–55, https://doi.org/10.1016/j.agrformet.2018.03.001, 2018. a
Cartwright, L., Zammit-Mangion, A., Bhatia, S., Schroder, I., Phillips, F., Coates, T., Negandhi, K., Naylor, T., Kennedy, M., Zegelin, S., Wokker, N., Deutscher, N. M., and Feitz, A.: Bayesian atmospheric tomography for detection and quantification of methane emissions: application to data from the 2015 Ginninderra release experiment, Atmos. Meas. Tech., 12, 4659–4676, https://doi.org/10.5194/amt-12-4659-2019, 2019. a, b
Crosson, E. R.: A cavity ring-down analyzer for measuring atmospheric levels of methane, carbon dioxide, and water vapor, Appl. Phys. B-Lasers O., 92, 403–408, https://doi.org/10.1007/s00340-008-3135-y, 2008. a
Desservettaz, M., Phillips, F., Naylor, T., Price, O., Samson, S., Kirkwood, J., and Paton-Walsh, C.: Air Quality Impacts of Smoke from Hazard Reduction Burns and Domestic Wood Heating in Western Sydney, Atmosphere, 10, 557, https://doi.org/10.3390/atmos10090557, 2019. a
Dobler, J. T., Harrison, F. W., Browell, E. V., Lin, B., McGregor, D., Kooi, S., Choi, Y., and Ismail, S.: Atmospheric CO2 column measurements with an airborne intensity-modulated continuous wave 1.57 µm fiber laser lidar, Appl. Opt., 52, 2874–2892, https://doi.org/10.1364/AO.52.002874, 2013. a
Feitz, A., Schroder, I., Phillips, F., Coates, T., Negandhi, K., Day, S., Luhar, A., Bhatia, S., Edwards, G., Hrabar, S., Hernandez, E., Wood, B., Naylor, T., Kennedy, M., Hamilton, M., Hatch, M., Malos, J., Kochanek, M., Reid, P., Wilson, J., Deutscher, N., Zegelin, S., Vincent, R., White, S., Ong, C., George, S., Maas, P., Towner, S., Wokker, N., and Griffith, D.: The Ginninderra CH4 and CO2 release experiment: An evaluation of gas detection and quantification techniques, Int. J. Greenh. Gas Con., 70, 202–224, https://doi.org/10.1016/j.ijggc.2017.11.018, 2018. a, b, c
Flesch, T. K., Baron, V. S., Wilson, J. D., Griffith, D. W., Basarab, J. A., and Carlson, P. J.: Agricultural gas emissions during the spring thaw: Applying a new measurement technique, Agr. Forest Meteorol., 221, 111–121, https://doi.org/10.1016/j.agrformet.2016.02.010, 2016. a, b
Gordon, I. E., Rothman, L. S., Hill, C., Kochanov, R. V., Tan, Y., Bernath, P. F., Birk, M., Boudon, V., Campargue, A., Chance, K. V., Drouin, B. J., Flaud, J. M., Gamache, R. R., Hodges, J. T., Jacquemart, D., Perevalov, V. I., Perrin, A., Shine, K. P., Smith, M. A., Tennyson, J., Toon, G. C., Tran, H., Tyuterev, V. G., Barbe, A., Császár, A. G., Devi, V. M., Furtenbacher, T., Harrison, J. J., Hartmann, J. M., Jolly, A., Johnson, T. J., Karman, T., Kleiner, I., Kyuberis, A. A., Loos, J., Lyulin, O. M., Massie, S. T., Mikhailenko, S. N., Moazzen-Ahmadi, N., Müller, H. S., Naumenko, O. V., Nikitin, A. V., Polyansky, O. L., Rey, M., Rotger, M., Sharpe, S. W., Sung, K., Starikova, E., Tashkun, S. A., Auwera, J. V., Wagner, G., Wilzewski, J., Wcisło, P., Yu, S., and Zak, E. J.: The HITRAN2016 molecular spectroscopic database, J. Quant. Spectrosc. Ra., 203, 3–69, https://doi.org/10.1016/j.jqsrt.2017.06.038, 2017. a
Griffith, D. W. T.: Synthetic Calibration and Quantitative Analysis of Gas-Phase FT-IR Spectra, Appl. Spectrosc., 50, 59–70, 1996. a
Griffith, D. W. T., Pöhler, D., Schmitt, S., Hammer, S., Vardag, S. N., and Platt, U.: Long open-path measurements of greenhouse gases in air using near-infrared Fourier transform spectroscopy, Atmos. Meas. Tech., 11, 1549–1563, https://doi.org/10.5194/amt-11-1549-2018, 2018. a, b, c, d, e, f, g, h, i, j, k, l, m
Humphries, R., Jenkins, C., Leuning, R., Zegelin, S., Griffith, D., Caldow, C., Berko, H., and Feitz, A.: Atmospheric Tomography: A Bayesian Inversion Technique for Determining the Rate and Location of Fugitive Emissions, Environ. Sci. Technol., 46, 1739–1746, https://doi.org/10.1021/es202807s, 2012. a
Jones, F. M., Phillips, F. A., Naylor, T., and Mercer, N. B.: Methane emissions from grazing Angus beef cows selected for divergent residual feed intake, Anim. Feed Sci. Tech., 166–167, 302–307, https://doi.org/10.1016/j.anifeedsci.2011.04.020, 2011. a
Laubach, J., Bai, M., Pinares-Patiño, C. S., Phillips, F. A., Naylor, T. A., Molano, G., Cárdenas Rocha, E. A., and Griffith, D. W.: Accuracy of micrometeorological techniques for detecting a change in methane emissions from a herd of cattle, Agr. Forest Meteorol., 176, 50–63, https://doi.org/10.1016/j.agrformet.2013.03.006, 2013. a
Lian, J., Bréon, F.-M., Broquet, G., Zaccheo, T. S., Dobler, J., Ramonet, M., Staufer, J., Santaren, D., Xueref-Remy, I., and Ciais, P.: Analysis of temporal and spatial variability of atmospheric CO2 concentration within Paris from the GreenLITE™ laser imaging experiment, Atmos. Chem. Phys., 19, 13809–13825, https://doi.org/10.5194/acp-19-13809-2019, 2019. a
Loh, Z., Leuning, R., Zegelin, S., Etheridge, D., Bai, M., Naylor, T., and Griffith, D.: Testing Lagrangian atmospheric dispersion modelling to monitor CO2 and CH4 leakage from geosequestration, Atmos. Environ., 43, 2602–2611, https://doi.org/10.1016/j.atmosenv.2009.01.053, 2009. a
Naylor, T. A., Wiedemann, S. G., Phillips, F. A., Warren, B., McGahan, E. J., and Murphy, C. M.: Emissions of nitrous oxide, ammonia and methane from Australian layer-hen manure storage with a mitigation strategy applied, Anim. Prod. Sci., 56, 1367, https://doi.org/10.1071/AN15584, 2016. a, b
Nikodem, M., Plant, G., Sonnenfroh, D., and Wysocki, G.: Open-path sensor for atmospheric methane based on chirped laser dispersion spectroscopy, Appl. Phys. B-Lasers O., 119, 3–9, https://doi.org/10.1007/s00340-014-5938-3, 2015. a
Phillips, F. A., Wiedemann, S. G., Naylor, T. A., McGahan, E. J., Warren, B. R., Murphy, C. M., Parkes, S., and Wilson, J.: Methane, nitrous oxide and ammonia emissions from pigs housed on litter and from stockpiling of spent litter, Anim. Prod. Sci., 56, 1390–1403, https://doi.org/10.1071/AN15650, 2016. a, b
Phillips, F. A., Naylor, T., Forehead, H., Griffith, D. W., Kirkwood, J., and Paton-Walsh, C.: Vehicle ammonia emissions measured in an urban environment in Sydney, Australia, using open path fourier transform infra-red spectroscopy, Atmosphere, 10, 208, https://doi.org/10.3390/ATMOS10040208, 2019. a
Plant, G., Nikodem, M., Mulhall, P., Varner, R., Sonnenfroh, D., and Wysocki, G.: Field Test of a Remote Multi-Path CLaDS Methane Sensor, Sensors, 15, 21315–21326, https://doi.org/10.3390/s150921315, 2015. a
Queisser, M., Granieri, D., and Burton, M.: A new frontier in CO2 flux measurements using a highly portable DIAL laser system, Sci. Rep., 6, 33834, https://doi.org/10.1038/srep33834, 2016. a
Rieker, G. B., Giorgetta, F. R., Swann, W. C., Kofler, J., Zolot, A. M., Sinclair, L. C., Baumann, E., Cromer, C., Petron, G., Sweeney, C., Tans, P. P., Coddington, I., and Newbury, N. R.: Frequency-comb-based remote sensing of greenhouse gases over kilometer air paths, Optica, 1, 290–298, https://doi.org/10.1364/OPTICA.1.000290, 2014. a
Rothman, L., Gordon, I., Barbe, A., Benner, D., Bernath, P., Birk, M., Boudon, V., Brown, L., Campargue, A., Champion, J.-P., Chance, K., Coudert, L., Dana, V., Devi, V., Fally, S., Flaud, J.-M., Gamache, R., Goldman, A., Jacquemart, D., Kleiner, I., Lacome, N., Lafferty, W., Mandin, J.-Y., Massie, S., Mikhailenko, S., Miller, C., Moazzen-Ahmadi, N., Naumenko, O., Nikitin, A., Orphal, J., Perevalov, V., Perrin, A., Predoi-Cross, A., Rinsland, C., Rotger, M., Šimečková, M., Smith, M., Sung, K., Tashkun, S., Tennyson, J., Toth, R., Vandaele, A., and Auwera, J. V.: The HITRAN 2008 molecular spectroscopic database, J. Quant. Spectrosc. Ra., 110, 533–572, https://doi.org/10.1016/j.jqsrt.2009.02.013, 2009. a
Saito, H., Manago, N., Kuriyama, K., and Kuze, H.: Near-infrared open-path measurement of CO2 concentration in the urban atmosphere, Opt. Lett., 40, 2568–2571, https://doi.org/10.1364/OL.40.002568, 2015. a
Wagner, G. A. and Plusquellic, D. F.: Ground-based, integrated path differential absorption LIDAR measurement of CO2, CH4, and H2O near 16 µm, Appl. Opt., 55, 6292, https://doi.org/10.1364/ao.55.006292, 2016. a
Waxman, E. M., Cossel, K. C., Truong, G.-W., Giorgetta, F. R., Swann, W. C., Coburn, S., Wright, R. J., Rieker, G. B., Coddington, I., and Newbury, N. R.: Intercomparison of open-path trace gas measurements with two dual-frequency-comb spectrometers, Atmos. Meas. Tech., 10, 3295–3311, https://doi.org/10.5194/amt-10-3295-2017, 2017. a, b
Werle, P., Mücke, R., and Slemr, F.: The limits of signal averaging in atmospheric trace-gas monitoring by tunable diode-laser absorption spectroscopy (TDLAS), Appl. Phys. B-Photo., 57, 131–139, https://doi.org/10.1007/BF00425997, 1993. a
Wunch, D., Toon, G. C., Blavier, J.-F. L., Washenfelder, R. A., Notholt, J., Connor, B. J., Griffith, D. W., Sherlock, V., and Wennberg, P. O.: The Total Carbon Column Observing Network, Philos. T. Roy. Soc. A, 369, 2087, https://doi.org/10.1098/rsta.2010.0240, 2011. a