the Creative Commons Attribution 4.0 License.
the Creative Commons Attribution 4.0 License.
 | 06 May 2021
Consistency of total column ozone measurements between the Brewer and Dobson spectroradiometers of the LKO Arosa and PMOD/WRC Davos
Julian Gröbner
Herbert Schill
Luca Egli
René Stübi
Total column ozone measured by Brewer and Dobson spectroradiometers at Arosa and Davos, Switzerland, have systematic seasonal variations of around 1.5 % using the standard operational data processing. Most of this variability can be attributed to the temperature sensitivity of approx. +0.1 %/K of the ozone absorption coefficient of the Dobson spectroradiometer (in this study D101). While the currently used Bass and Paur ozone absorption cross-sections produce inconsistent results for Dobson and Brewer, the use of the ozone absorption cross-sections from Serdyuchenko et al. (2014) in conjunction with an effective ozone temperature dataset produces excellent agreement between the four Brewers investigated (of which two are double Brewers) and Dobson D101. Even though other ozone absorption cross-sections available in the literature are able to reduce the seasonal variability as well, all of those investigated produce systematic biases in total column ozone between Brewer and Dobson of +2.1 % to −3.2 %. The highest consistency in total column ozone from Brewers and Dobson D101 at Arosa and Davos is obtained by applying the Rayleigh scattering cross-sections from Bodhaine et al. (1999), the ozone absorption cross-sections from Serdyuchenko et al. (2014), the effective ozone temperature from either ozone-sondes or the European Centre for Medium-Range Weather Forecasts (ECMWF), and the measured line spread functions of Brewer and Dobson. The variability of 0.9 % between Brewer and Dobson for single measurements can be reduced to less than 0.1 % for monthly means. As shown here, the applied methodology produces consistent total column ozone datasets between Brewer and Dobson spectroradiometers, with average differences of 0.0 % and a remaining seasonal variability of 0.11 %. For collocated Brewer and Dobson spectroradiometers, as is the case for the Arosa and Davos total column ozone times series, this allows for the merging of these two distinct datasets to produce a homogeneous time series of total column ozone measurements. Furthermore, it guarantees the long-term future of this longest total column ozone time series, by proposing a methodology for how to eventually replace the ageing Dobson spectroradiometer with the state-of-the art Brewer spectroradiometer.
- Article
(4978 KB) - Full-text XML
-
Supplement
(5052 KB) - BibTeX
- EndNote


The world's longest continuous total column ozone time series was initiated in 1926 at the Lichtklimatisches Observatorium (LKO), at Arosa, in the Swiss Alps with Dobson D002 (Staehelin et al., 2018). It currently consists of a suite of six instruments, three Dobson and three Brewer spectroradiometers, which measure the direct spectral solar irradiance at several narrow wavelength bands between 305 and 345 nm. Since 2010, Brewer B072 has been relocated to the Physikalisch-Meteorologisches Observatorium Davos, World Radiation Center (PMOD/WRC), located in the nearby valley of Davos (1590 m a.s.l.), at 12 km horizontal distance from Arosa (1850 m a.s.l.), to investigate the possibility of relocating the measurements from LKO Arosa to PMOD/WRC Davos. As demonstrated from the simultaneous measurements by the Brewer spectroradiometers located at LKO Arosa and PMOD/WRC, Davos, total column ozone measurements between the two sites are consistent to better than 1 %, which is well within the uncertainties of the measurements (Stübi et al., 2017b). Dobson D101 was moved in January 2016, in order to validate the consistency between the two sites using Dobson spectroradiometers as well (Stübi et al., 2020). In 2018, two further instruments, Dobson D051 and Brewer B156, were moved from LKO Arosa to PMOD/WRC, with the objective of finalising the relocation of the whole LKO instrumentation to PMOD/WRC by June 2021.
The Brewer spectroradiometers were installed at LKO Arosa in 1988 (Brewer B040), 1991 (Brewer B072), and 1998 (Brewer B156) to complement the Dobson spectroradiometers already in operation. The objective has been to eventually replace the Dobson spectroradiometers with the more modern and automated Brewer spectroradiometers. However collocated measurements between Dobson and Brewer spectroradiometers have shown seasonal variations of the order of 2 % to 3 %, which have been linked to the effective ozone temperature (Kerr et al., 1988; Köhler et al., 2018; Vanicek et al., 2012; Staehelin et al., 1998; Redondas et al., 2014). These known systematic variabilities between the two instrument types have so far precluded a merging of datasets from these instruments and have led to the continuous simultaneous operation of the Dobsons and Brewers at LKO Arosa.
A study by Redondas et al. (2014) on the use of different ozone absorption cross-sections in Brewer and Dobson total column ozone retrieval algorithms has shown that most of the observed discrepancies can be reconciled by taking into account the temperature dependence of the ozone absorption coefficient of the Dobson spectroradiometer. The study investigated five ozone absorption cross-sections, accessible on the ACSO (Absorption Cross Sections of Ozone) initiative web page (http://igaco-o3.fmi.fi/ACSO, last access: 30 April 2021). Redondas et al. (2014) came to the conclusion that the cross-sections measured by Serdyuchenko et al. (2014) substantially reduced the observed seasonal dependence of the differences between Dobson and Brewer.
In this study, we revisit the issue of the consistency of Brewer and Dobson total column ozone measurements discussed in Redondas et al. (2014), with the following additional elements:
-
an additional dataset of ozone absorption cross-sections measured in the frame of the EMRP project ATMOZ (Mark Weber, personal communication, 2018);
-
a dataset of absorption cross sections measured within the ESA SEOM-IAS project (Scientific exploitation of Operational Missions – Improved Atmospheric Spectroscopy Databases) (Birk et al., 2018);
-
recent line spread functions from Dobson D101 measured using the tuneable and portable radiation source (TuPS) (Šmid et al., 2020);
-
a comprehensive dataset of total column ozone measurements from 2016 to 2020 for Brewers MKII B040, MKII B072, MKIII B156, MKIII B163, and Dobson D101.
2.1 Total ozone column measurement
Brewer and Dobson spectroradiometers retrieve the atmospheric total column ozone from the absorption of direct solar radiation by the atmosphere, as described by the Beer–Lambert law:
where λ is the wavelength, I0 is the solar irradiance at the top of the atmosphere, I the irradiance measured at the surface, τ the optical depth of the atmosphere, and μ the slant path (air mass). The equation can be rewritten as
to retrieve the optical depth τ at a specific wavelength. In the ultraviolet range between 300 and 340 nm, the main atmospheric absorber is ozone. Even though sulfur dioxide and nitrogen dioxide also absorb in this wavelength range, their amount in the atmosphere above Arosa and Davos is so small that it can be neglected here. The influence of the scattering and absorption by atmospheric aerosols on the ozone retrieval is minimised by using ratios of measurements at wavelengths close by, as discussed later.
The only further attenuation comes from Rayleigh scattering (τβ), which needs to be subtracted from the total optical depth τ to retrieve the optical depth for ozone:
where X is the total amount of ozone in the atmospheric column, α(λ) the ozone absorption coefficient, and μβ and the effective air mass for Rayleigh scattering and ozone absorption respectively.
While the Brewer spectroradiometer uses a slit mask to measure the solar irradiance at four wavelengths quasi-simultaneously, the Dobson spectroradiometer measures the intensity ratio at two wavelength pairs by adjusting an optical wedge for each pair to attenuate the higher of the two intensities with respect to the other. The total column ozone X is then retrieved by a linear combination of the solar radiation measurements at these four wavelengths,
according to , where F0, F, Δβ, and Δα are the weighted sums of the logarithms of the top of atmosphere solar irradiance, logarithms of the measured solar irradiance, Rayleigh scattering coefficient, and ozone absorption coefficient at wavelength λi respectively. The weighting coefficients wi are and for the Brewer and Dobson spectroradiometers respectively, with i defined by the instrument wavelength according to Table 1. The weighting coefficients for the Brewer were specifically selected to cancel any absorption that is linear across the four wavelengths, which is a good approximation for the aerosol optical depth in this wavelength range. It should be noted that apart from very rare aerosol intrusions, the aerosol optical depth at Arosa and Davos is very close to background levels and therefore has a negligible influence on the ozone retrieval (Nyeki et al., 2012).
2.2 Brewer and Dobson spectroradiometers
The spectroradiometers operating at Davos and Arosa belong respectively to the global Brewer and Dobson networks and are traceable to their respective network reference instruments, Dobson D083 via the RVI regional Dobson D064 from Hohenpeissenerg, Germany, and the Brewer Triad maintained by the Regional Brewer Calibration Centre for Europe (RBCC-E), at the Izaña Atmospheric Research Centre, Tenerife, Canary Islands, Spain (León-Luis et al., 2018). For details on the maintenance and calibration schedules, we refer to the publications of Scarnato et al. (2010) and Stübi et al. (2017a). The calibration report from the latest calibration campaign which took place in July 2018 is available through Redondas et al. (2019). The consistency between the Brewer spectroradiometers operated at Arosa is of the order of 0.5 % (Stübi et al., 2017a). A recent analysis for the manually and automatically operated Dobson spectroradiometers at Arosa has found a similar consistency of 0.5 % (Stübi et al., 2020).
The four Brewer spectroradiometers are two single-monochromator Brewers MKII B040 and B072 and two double-monochromator Brewers MKIII B156 and B163. From the three Dobsons, only D101 and D062 continuously measure total column ozone, while D051 is usually reserved for Umkehr measurements and is only occasionally fitted with the zenith prism for direct solar radiation measurements. As the line spread function measurements with the TuPS were not successful on D062 due to the low sensitivity of the instrument, only D101 will be used in this study.
The top-of-the-atmosphere calibration constants F0 were obtained through direct comparisons with the reference spectroradiometers from each network during site visits to Arosa and Davos. Following the standard operating procedures, the measurements are then corrected for instrument drifts between calibrations by applying standard lamp corrections which are automatically made several times per day for Brewer spectroradiometers and manually on a weekly schedule for Dobson spectroradiometers. All four Brewer spectroradiometers were calibrated at Arosa in 2016 and 2018, while Brewer B163 also took part in the RBCC-E campaigns at El Arenosillo, Spain, in the years in between (2017 and 2019). The default calibration period for Dobsons has been scheduled every 4 to 5 years, resulting in calibrations of the Dobson spectroradiometers at LKO Arosa in 2012, 2017, and 2018. The third calibration in 2018 was necessary due to the bad weather conditions in 2017, which did not allow for a reliable calibration at the time.
2.2.1 Stray light correction of single Brewers
The total column ozone measurements from the single Brewer spectroradiometers B040 and B072 were corrected for stray light according to the methodology described in Redondas et al. (2019). The empirical correction function was obtained by direct comparison with the reference double-monochromator Brewer B185 of the Regional Brewer Calibration Center Europe during the campaign in Arosa in July 2018. The total column ozone corrected for stray light is obtained by correcting the extraterrestrial constant F0 of Eq. (4):
where osc represents the ozone slant path, and a and b are empirical constants derived for B040 and B072 with respect to the reference Brewer B185. The constants a and b are shown in Fig. 18 (, b=5.21) and Fig. 27 (, b=3.92) of the report (Redondas et al., 2019) for B040 and B072 respectively. The corrections in total column ozone increase exponentially with increasing ozone slant path and are quite small; for example at an ozone slant path of 1000, the corrections for B040 and B072 are +0.3 % and +0.6 % respectively. The largest corrections of +1.1 % and +1.6 % occur at an ozone slant path of 1390 DU for B040 and B072 respectively.
2.2.2 Line spread functions
The spectral resolution and wavelength calibration of the Brewer spectroradiometers are obtained from the measurements of a set of spectral emission lines from several spectral discharge lamps, as described in Gröbner et al. (1998). The width of the line spread functions at the ozone position of the Brewer spectroradiometer, approximated with a trapezoid, is obtained by linearly interpolating between nearby spectral emission line measurements. The ozone absorption coefficients are then retrieved by convolving the selected ozone absorption cross-sections with these calculated line spread functions.
The spectral characterisation of the Dobson spectroradiometers at LKO Arosa was not performed in the past due to the need of a tuneable monochromatic source. Instead, nominal ozone absorption coefficients, based on the primary Dobson instrument, D083, were used by all Dobsons of the global Dobson network. To improve the situation, the tuneable portable source (TuPS) was developed in 2016, in the frame of the project (EMRP ATMOZ, 2014–2017), to allow for the individual spectral characterisation of Dobson spectroradiometers (Šmid et al., 2020). This device was used in 2019 to measure the line spread functions of Dobson D101 and to calculate the ozone absorption coefficients based on these measurements.
Table 1 shows the spectral characteristics of the four Brewers and of Dobson D101 used in this study, as well as the nominal wavelength positions of the Dobson according to the Dobson handbook. Figure 1 shows the measured line spread functions of Dobson D101 as well as the nominal slit functions used for the calculation of the operational ozone absorption coefficients according to Bernhard et al. (2005).
Table 1Central wavelength positions of the Brewer B040, B072, B156, and B163 spectroradiometers and Dobson D101. The weighting coefficients and are also shown.
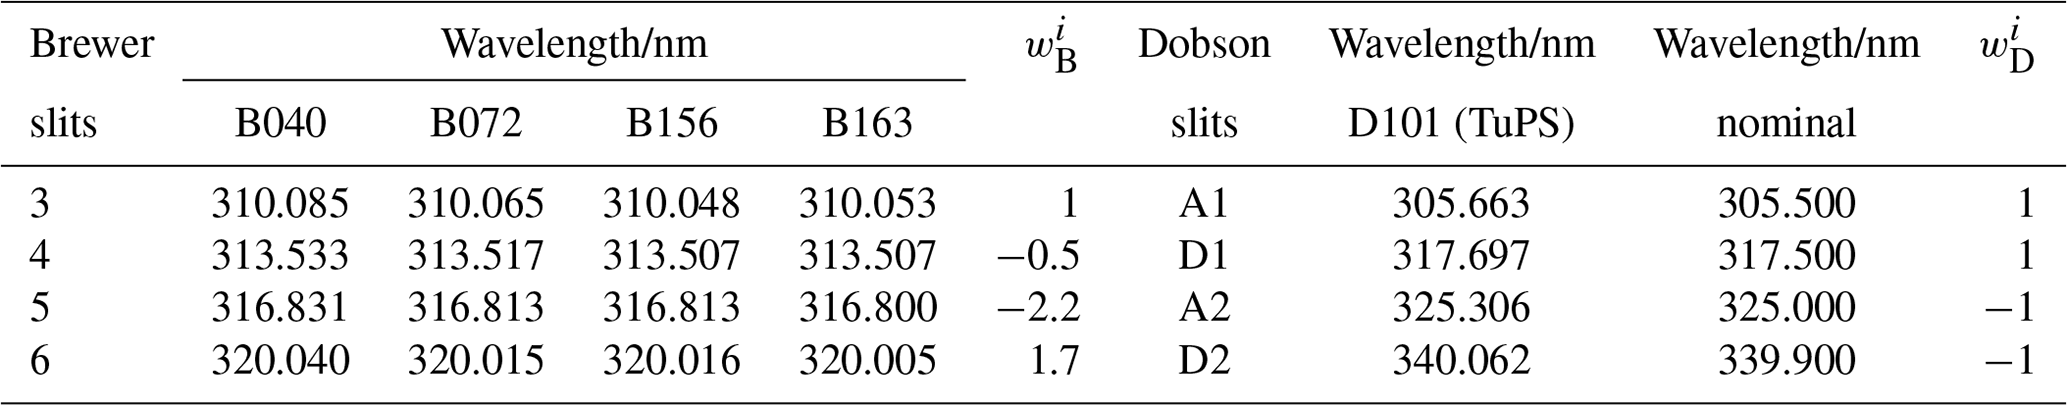
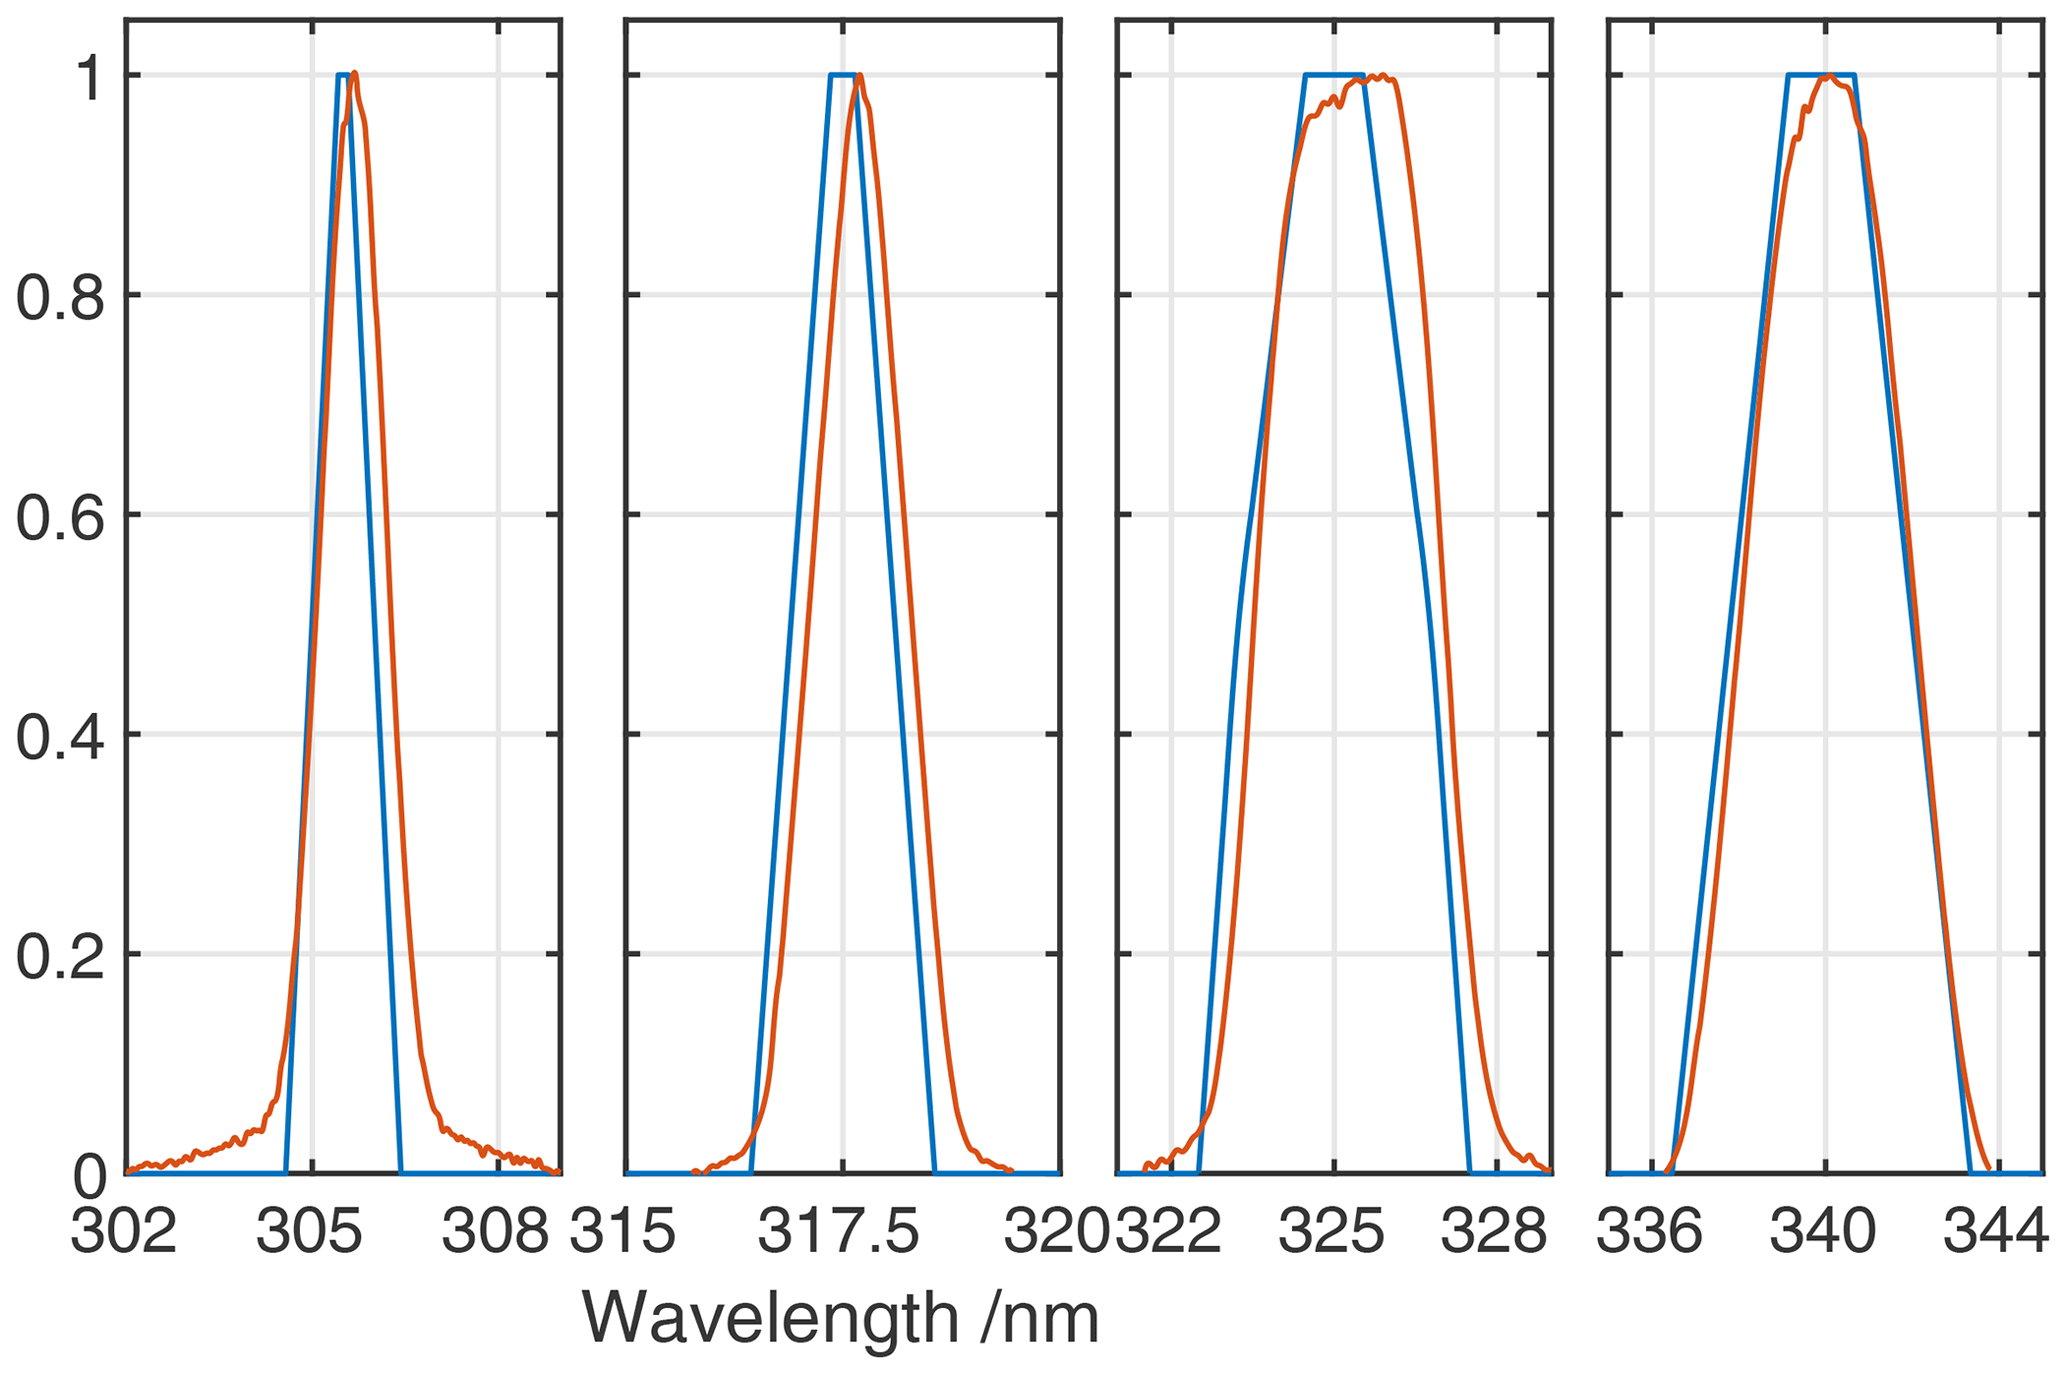
Figure 1Line spread functions of Dobson D101 measured in 2019 using the portable tuneable source (TuPS) (red) and the nominal parameterised slits for the A and D wavelength pairs (blue).
2.3 Effective ozone temperature and ozone height from ozone-sondes
The effective ozone temperature Teff is calculated from ozone and temperature profiles measured by ozone-sondes launched every 2 to 3 d at the aerological station of MeteoSwiss in Payerne, 220 km distance from Davos. The effective ozone temperature is obtained from the integral of temperature T(z) and ozone density O3(z) profiles according to
where z represents the vertical height above ground. The ozone and temperature above the sonde burst height, which occurs typically around 30 km, are obtained by extending the measured ozone and temperature profiles with the standard ozone and temperatures taken from the US Standard Atmosphere (NOAA, 1976), which are normalised to the sonde temperature and ozone density values just below the sonde burst height.
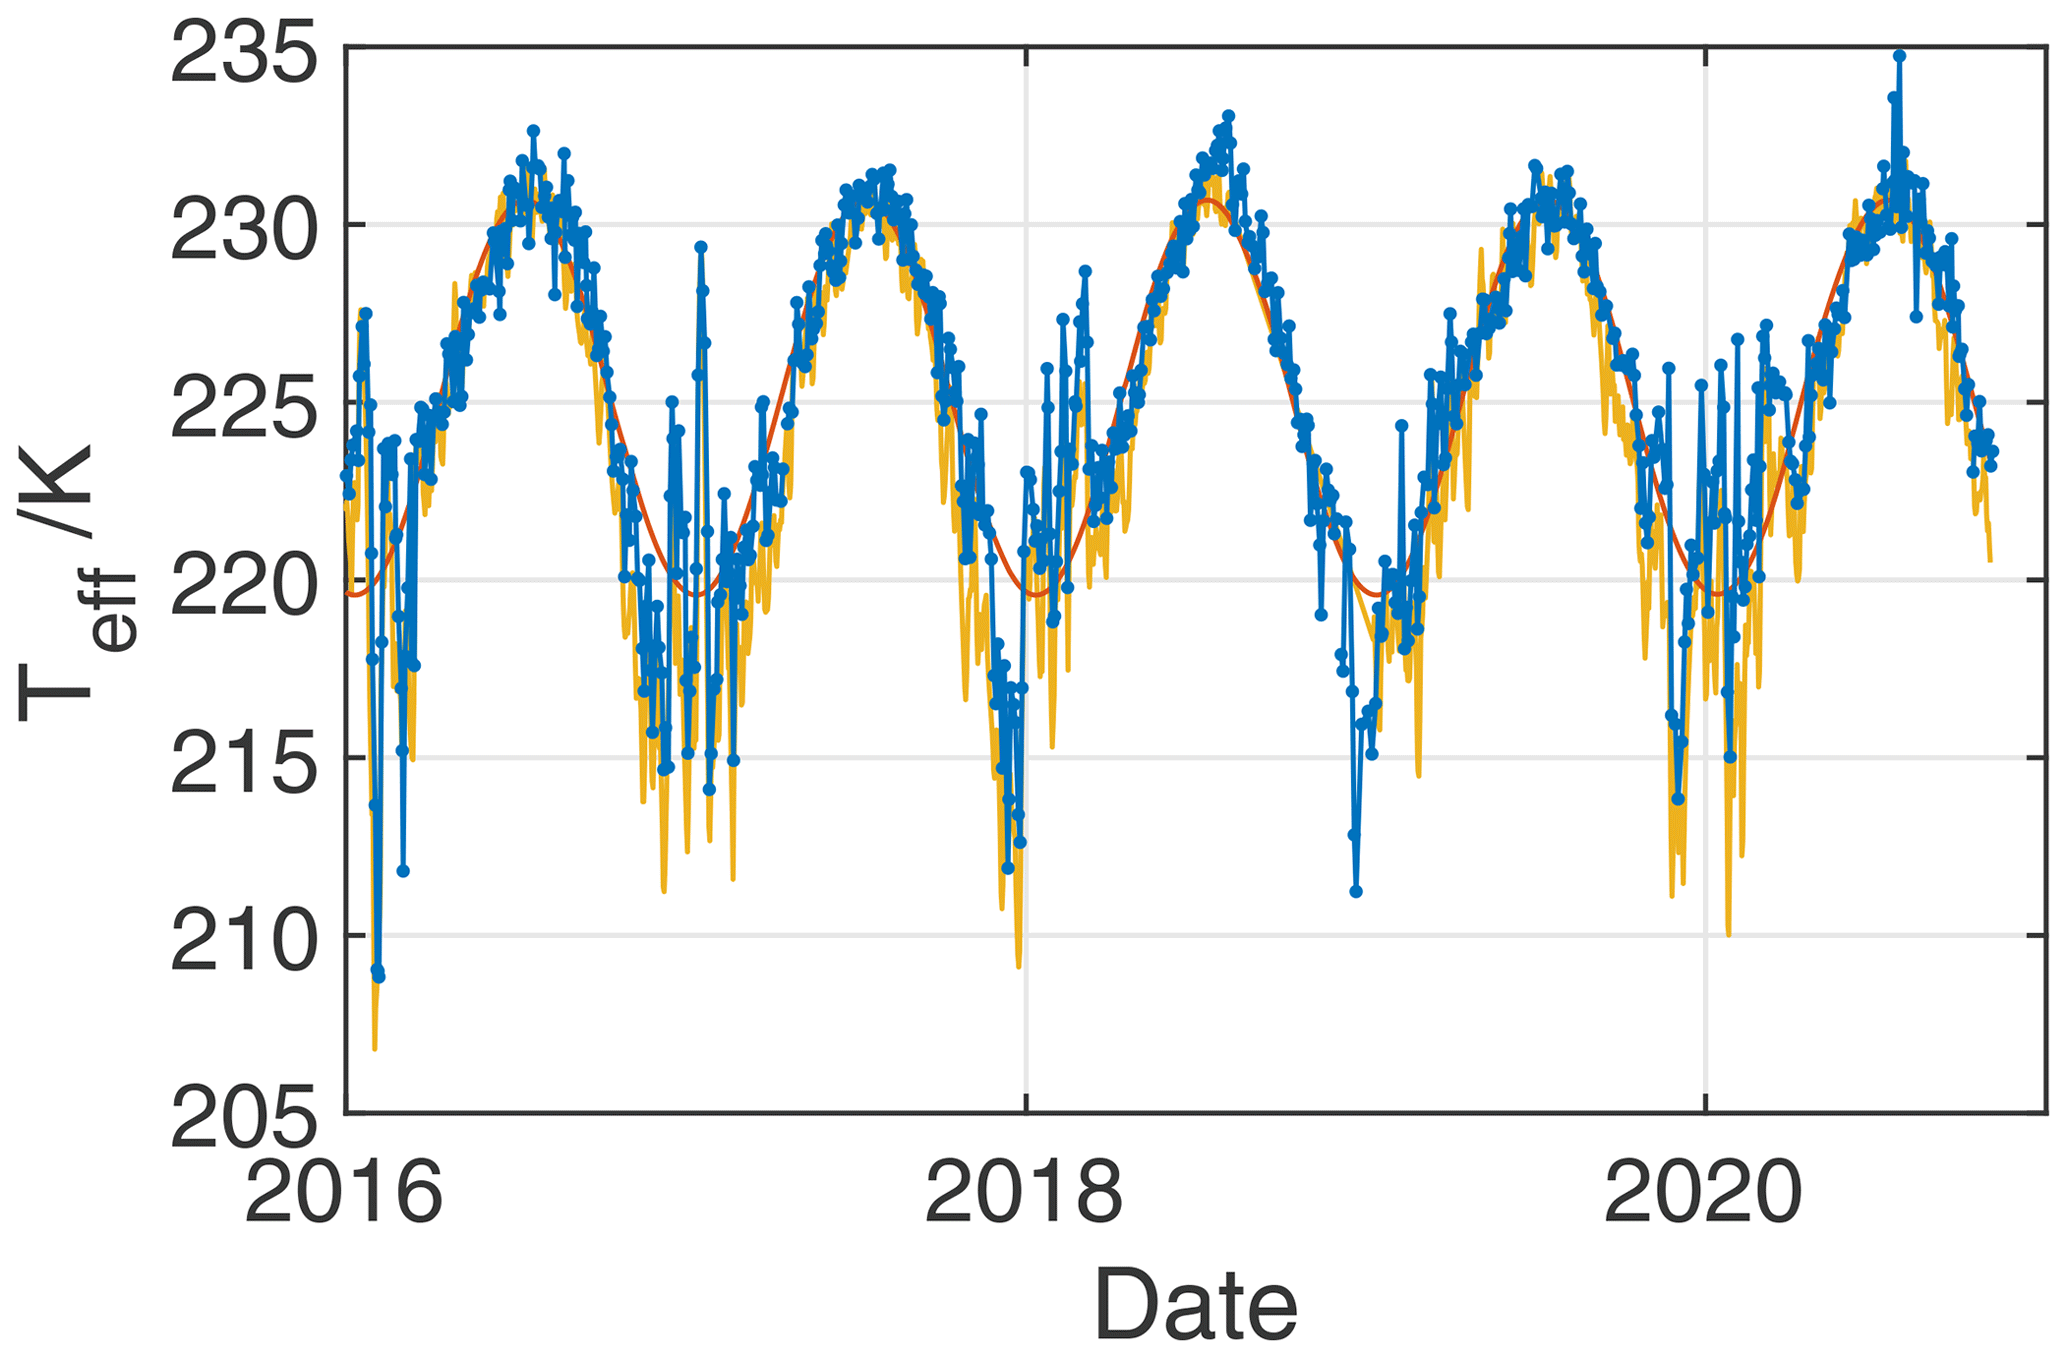
Figure 2Effective ozone temperature calculated from ozone-sonde launches at Payerne (blue curve) and from the ECMWF reanalysis (yellow curve). A periodic function is fitted to the radiosonde data, resulting in an amplitude of 5.7 K and an average temperature of 225.2 K.
Figure 2 shows the effective ozone temperature over Payerne from 2016 to 2020. The effective ozone temperature shows a distinct seasonal variation, with an average effective ozone temperature of 225.2 K throughout the period and with a 95 % coverage between 215 K in winter and 232 K in summer. The average seasonal variability of the effective ozone temperature is 11.4 K as estimated from a periodic fit to the data.
During the winter, the effective ozone temperature can fluctuate significantly, with changes of up to 15 K within a few days (e.g. from 225 K on 27 January 2016, to 209 K on 3 February 2016, and back to 224 K on 10 February 2016). The effective ozone temperatures on days without ozone-sonde launches were obtained from linearly interpolating between available measurements. The resulting dataset was smoothed with a 10 d running average to reduce the day-to-day noise.
We have also investigated the effective ozone temperature obtained from the European Centre for Medium-Range Weather Forecasts (ECMWF) reanalysis (http://www.temis.nl/climate/efftemp/overpass.php, last access: 30 April 2021) for Payerne, shown as the yellow curve in the figure. The effective temperature data are produced from a combination of multi-sensor reanalysis (MSR) and real-time data. For real-time data, the algorithm uses temperature profiles from ECMWF operational data, while for past data, ECMWF reanalysis data are used (van der A et al., 2010).
The two datasets agree very well for the period 2016 to 2020, with an average difference of only 0.9 K (ECMWF biased low) and a standard deviation of 2.5 K. Even though we will concentrate on the dataset obtained from the radiosondes, we will briefly comment on the use of the ECMWF dataset for the recalculation of the Dobson total column ozone time series later in the paper.
The corresponding effective ozone height Heff was also calculated by replacing the temperature profile in Eq. (6) with the height profile. The resulting average effective ozone layer over Payerne is found at 22.3 km, with a minimum of 20.2 km during the winter and a maximum of 23.8 km during the summer. The impact of this variability on the calculation of the ozone slant path for the measurements at Arosa and Davos is at most 0.3 % at an air mass of 3.9 (solar zenith angle, SZA, of 76), which is the maximum that can be reached due to the mountains blocking the horizon at both sites. As we are primarily interested in the comparison of Brewer and Dobson total column ozone, we have decided to use a constant ozone layer height of 22 km in the calculations of total column ozone from the Brewers and Dobson in this study. The effective molecular scattering height relevant for Rayleigh scattering was kept at 5 km as used in the nominal operating procedure.
2.4 Ozone absorption cross-sections
The operational ozone absorption coefficients in use by the Brewer and Dobson networks are based on the ozone cross-sections from Bass and Paur (1985) and are presented in Redondas et al. (2014) and the references therein. Furthermore, we have selected datasets of ozone absorption cross-sections available for the wavelength range 300 to 345 nm, which cover the wavelength range used by Brewer and Dobson spectroradiometers to retrieve total column ozone. The selected cross-sections are also available at several ozone temperatures, in order to calculate the ozone absorption cross-sections for the actual effective ozone temperature at Arosa and Davos. If not specified otherwise, these cross-sections were retrieved from the ACSO web page (http://igaco-o3.fmi.fi/ACSO/cross_sections.html, last access: 30 April 2021). The following six ozone absorption cross-sections were used in this study:
-
BPOp. The nominal ozone absorption coefficients based on the standard operational procedures of the Brewer and Dobson networks are used. For Brewer spectroradiometers, these are based on the Bass and Paur cross-sections at a temperature of 228 K, while for the Dobson spectroradiometers, they are equal to the ones of Dobson D083 as calculated by Komhyr et al. (1993) at 227 K.
-
IGQ. The quadratic polynomial temperature approximation of the Bass and Paur ozone absorption cross sections from the IGACO web page (file bp.par) is used.
-
DBM. The high-resolution dataset of Daumont et al. (1993), Brion et al. (1993), and Malicet et al. (1995) at five temperatures between 218 and 295 K is used. Due to the lack of measurements at temperatures below 218 K, the quadratic temperature approximation gives inconsistent values at temperatures lower than 218 K. As a compromise, we have therefore decided to calculate instead a linear temperature dependence function from the three lowest temperatures of the DBM dataset to extrapolate the DBM cross-sections to temperatures below the minimum temperature of 218 K.
-
IUP and IUP_A. Two datasets of ozone absorption cross-sections measured by the University of Bremen, IUP in 2013 (Serdyuchenko et al., 2014) and IUP_ATMOZ in 2017 (Mark Weber, personal communication, 2018), are used. The dataset IUP was used in previous investigations and has been selected by the WMO as the future new reference cross-sections for the Brewer and Dobson networks (Matthew Tully, personal communication, 2018). The IUP_ATMOZ cross-sections between 295 and 350 nm were measured in 2017 during the project EMRP ATMOZ and have improved noise characteristics in this wavelength region when compared to the original IUP cross-sections. Here, we used the quadratic polynomial temperature approximation provided for both datasets.
-
ACS. A recent dataset measured in the frame of the ESA project SEOM-IAS between 243 and 346 nm and at 193, 213, 233, 253, 273, and 293 K (Birk et al., 2018) is used. We determined a quadratic polynomial temperature dependence function from this dataset to calculate the ozone absorption cross-sections for this study.
2.4.1 Ozone absorption coefficients
The ozone absorption coefficient αi at wavelength λi is calculated by convolving the selected ozone absorption cross-sections σ(λ,Teff) for a particular effective ozone temperature Teff with the line spread function Si(λ) of the spectroradiometer:
where i specifies the central wavelength at which the measurement is taken. The ozone absorption coefficient Δα from Eq. (4) can then be calculated:
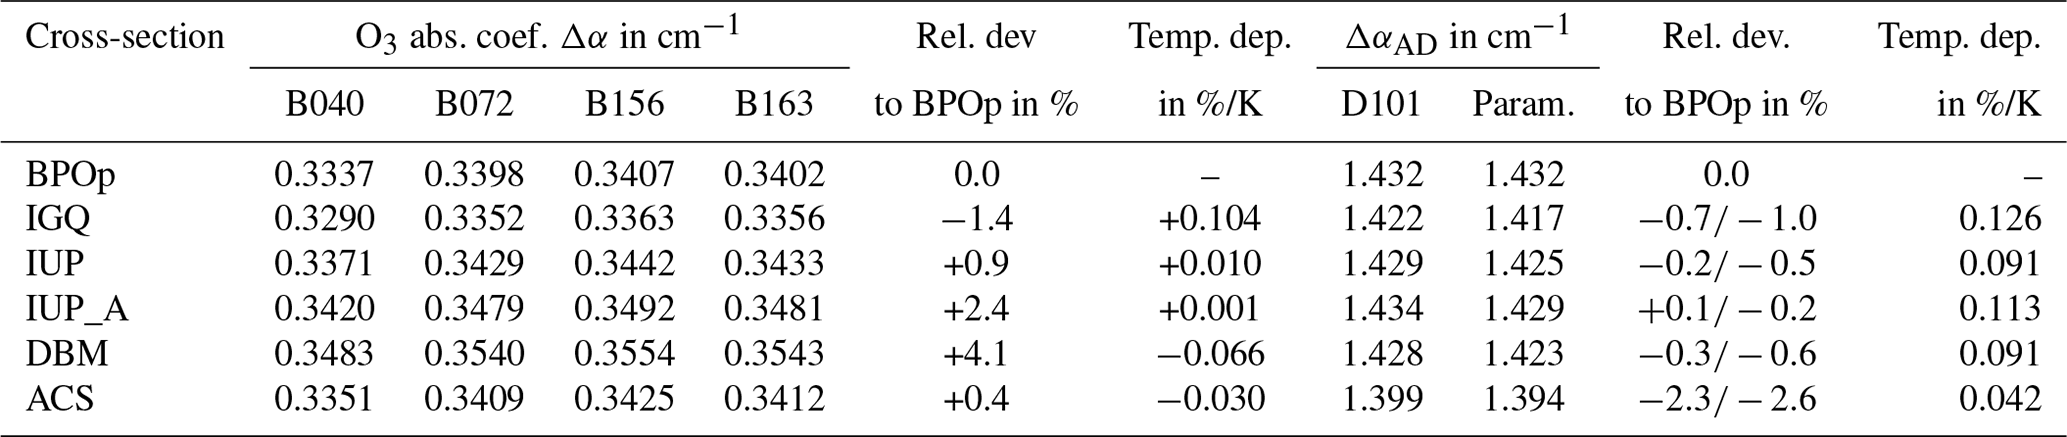
Table 2 summarises the ozone absorption coefficients Δα at a temperature of 228 K (−45 ∘C) for the ozone cross-sections described in the previous section. For historical reasons, the calculations to retrieve ozone from Dobson and Brewers have been performed using the common logarithm base 10 instead of the natural logarithm; thus log in the previous equations is replaced with log 10, and Δα and Δβ are divided accordingly by log 10. The table also shows the relative deviations between the different ozone absorption cross-sections relative to the operational coefficients. The total column ozone values calculated from these ozone absorption coefficients directly scale with these values and give a first indication by how much the total ozone values are shifted when using one or the other cross-section.
Table 2Weighted ozone absorption coefficients of Brewer B040, B072, B156, and B163 spectroradiometers and the AD weighted coefficients for Dobson D101 given per centimetre (cm−1). The relative deviations to the operational ozone absorption coefficients in the first row are also shown. IUP_A stands for IUP_ATMOZ. The temperature coefficients of the ozone absorption coefficients in %/K are calculated over the temperature range observed at Arosa and Davos.
The ozone absorption coefficients versus effective ozone temperature for Brewer B156 and Dobson D101 are shown in Fig. 3. Brewers B040, B072, and B163 follow the dependence of Brewer B156 very closely and are not shown separately .
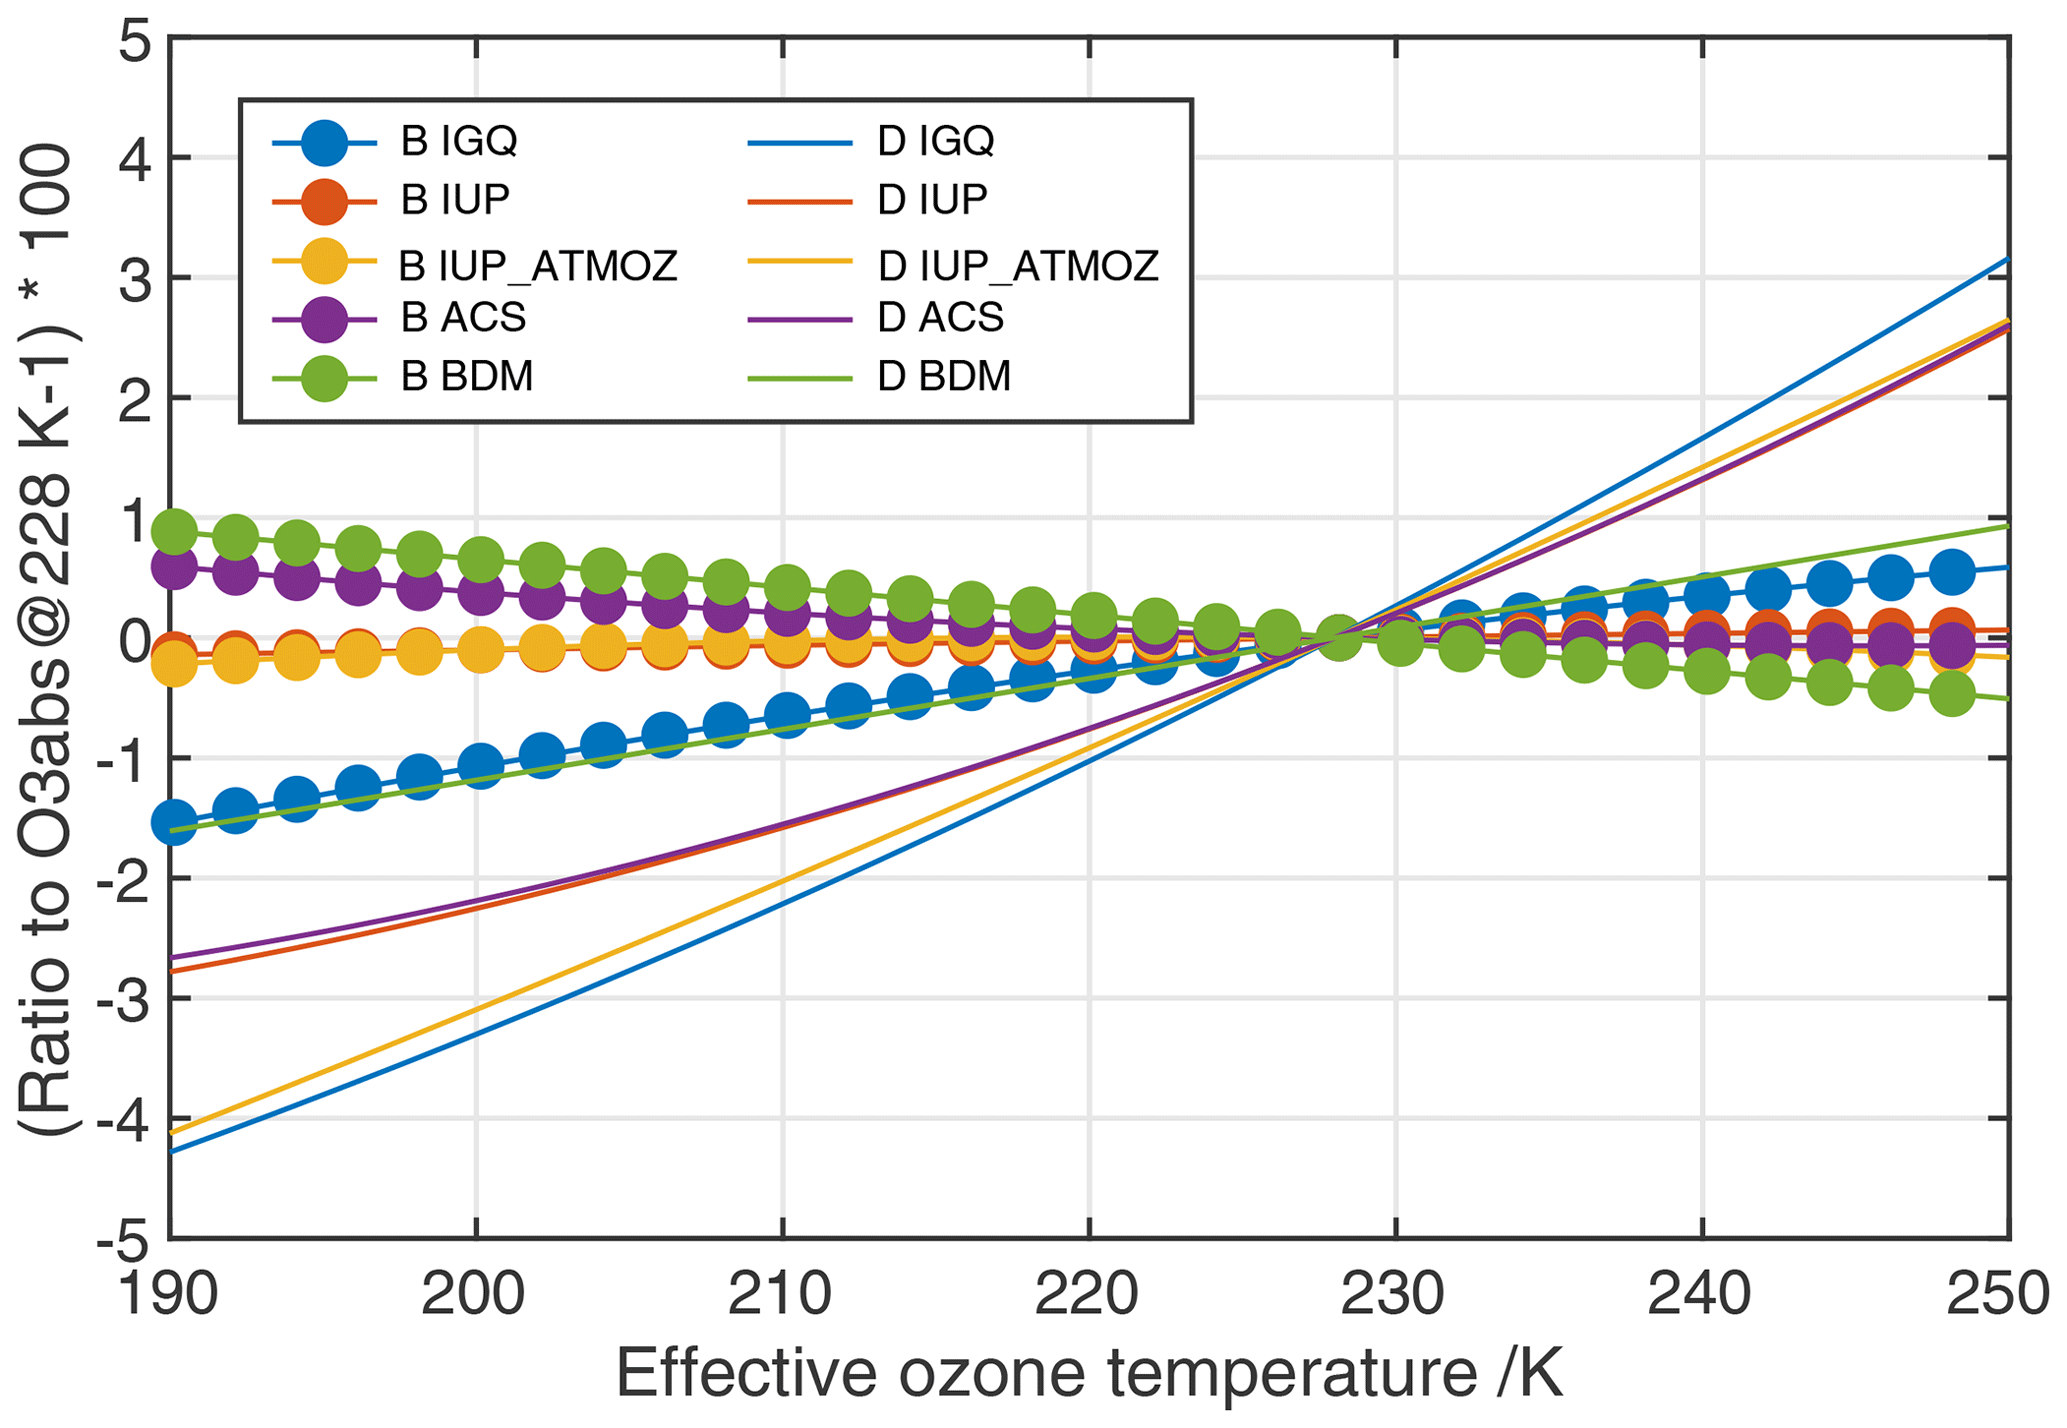
Figure 3Temperature dependence of the ozone absorption coefficients normalised at 228 K for Brewer B156 and Dobson D101 for the five ozone absorption cross-sections IGQ, IUP, IUP_ATMOZ, DBM, and ACS. The ozone absorption coefficients at 228 K are those shown in Table 2.
As can be seen in Table 2, the relative differences between the ozone absorption coefficients are the same for all Brewers. This indicates that a change in absorption cross sections for a Brewer spectroradiometer operated according to the standard procedure produces the same relative change in total column ozone. This is an important result for the Brewer network because it implies that the extraterrestrial constants retrieved from a comparison to a reference instrument would not change significantly when the ozone absorption cross-sections would get updated in the future. Redondas et al. (2014) reached a similar conclusion using the characterisations from 123 Brewers in the EUBREWNET database (http://www.eubrewnet.org/, last access: 30 April 2021).
It should be mentioned that the temperature dependence of the ozone absorption coefficients using the operational cross-sections based on Bass and Paur (1985), mentioned in Kerr (2002), is in good agrement with the results of this study. Furthermore, the revised temperature dependence of −0.005 %/K reported in Kerr (2002) is also in good agreement with the results of this study using the cross-sections of IUP and IUP_ATMOZ.
The same conclusion regarding a change of cross-sections also applies to the Dobson instrument, since the ozone absorption coefficients, calculated either using the measured line spread functions or the parameterised slits, result in the same relative offsets. However as seen in Table 2, the ozone absorption coefficient increases slightly by 0.3 % when using the measured slit functions with respect to the parameterised slits. Similar shifts between −0.6 % to +0.3 % were found for three Dobson spectroradiometers which were characterised during the project EMRP ATMOZ (Köhler et al., 2018), indicating that the specific spectral characteristics of a Dobson spectroradiometer have an impact of at least this magnitude on the retrieval of total column ozone. This demonstrates the need for an individual spectral characterisation of each Dobson spectroradiometer to reach uncertainties of 1 % or lower.
2.5 Rayleigh scattering coefficient
As shown explicitly in Eq. (4), Rayleigh scattering can cause a bias in the total ozone retrieval if it is not accounted properly. The Rayleigh scattering coefficients βi at wavelength λi are calculated by replacing the ozone absorption cross-section σ(λ,Teff) in Eq. (7) with the Rayleigh scattering coefficient β(λ), calculated using the parameterisation from Bodhaine et al. (1999) and scaled with the station pressure. The Rayleigh scattering coefficient Δβ is then the weighted mean of the individual coefficients according to Eq. (8).
2.5.1 Dobson D101
For Dobson D101, the nominal Rayleigh scattering coefficients used by the operational procedure are 0.114 and 0.104 cm−1 for the A and D wavelength pairs respectively. The coefficients calculated using the parameterised slit functions are 0.1140 and 0.1043 cm−1 for the A and D pairs respectively and are therefore equal to the nominal values to within their stated precision. The coefficients calculated for the actual line spread functions measured with the TuPS and using Bodhaine et al. (1999) are 0.1146 and 0.1038 cm−1 for the A and D wavelength pairs. The resulting total column ozone correction for the AD pair is 7.0 DU () for the nominal ozone and Rayleigh cross-sections. When using the measured (TuPS-based) line spread functions, the total ozone column correction is between 7.5 and 7.7 DU () depending on which ozone absorption cross-section is used. Thus the change in total column ozone resulting from using the Rayleigh scattering coefficients calculated for the actual Dobson D101 wavelengths and using the coefficients from Bodhaine et al. (1999) produces an ozone offset relative to the ozone values retrieved using the operational constants of between −0.4 to −0.6 DU for a mean station pressure at Davos of 840 mbar and depending on the actual ozone absorption cross-sections used.
2.5.2 Brewer
The same calculations were performed for the Brewer spectroradiometers. While using the nominal Rayleigh scattering coefficients found in the operational procedure results in a total column ozone correction of +0.3 DU, the use of the Rayleigh scattering coefficients from Bodhaine et al. (1999) produces a total column ozone offset of −2.6 DU, resulting in an offset of −2.9 DU relative to the operational ozone retrieval of the Brewer procedure (for B156, and Δβ=0.00098 cm−1). For Davos at a pressure of 840 mbar, the total column ozone shift resulting from the use of the Rayleigh scattering coefficients from Bodhaine et al. (1999) therefore results in a significant reduction of the total column ozone values of 2.4 DU with respect to the total column ozone calculation using the nominal constants of the Brewer operational procedure.
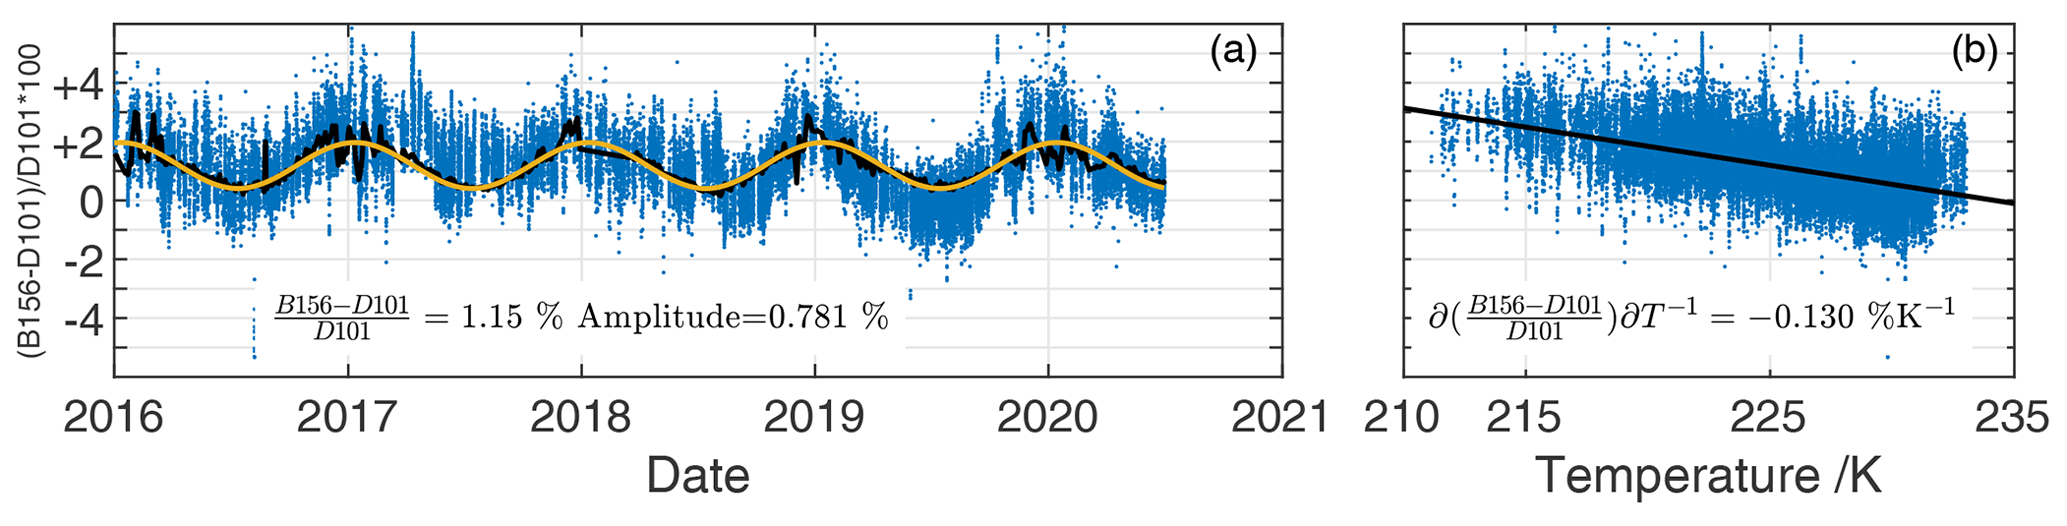
Figure 4(a) Relative differences of total column ozone between Brewer B156 and Dobson D101 for the period 1 January 2016 to 30 June 2020 using the operational ozone retrieval procedure with the ozone absorption cross-sections from Bass and Paur (1985). The yellow curve is a periodic fit to the data, while the black curve is obtained by combining the effective ozone temperature with the linear temperature dependence retrieved from the dataset. (b) The same relative differences, shown versus effective ozone temperature.
The datasets obtained from each ozone absorption cross-section were compared between the four Brewer spectroradiometers with the corresponding ones of Dobson D101. The comparisons were made by applying consistently the ozone effective temperatures as calculated from the ozone-sondes launched at Payerne (see Sect. 2.3), the Rayleigh scattering coefficients (see Sect. 2.5), and the ozone absorption coefficients calculated from the spectral characterisations performed on each instrument. We will primarily discuss the total column ozone comparison between Brewer B156 and Dobson D101, while the results of the comparisons between the other Brewers and Dobson D101 are summarised in the corresponding tables, and the figures of the comparisons are provided in the Supplement. The comparisons are based on simultaneous measurements within a 5 min window, totalling more than 40 000 measurements over the time period considered. The SZA varied between 23.3 and 75.7∘ and the corresponding effective air mass for ozone between 1.1 and 3.9.
3.1 Operational Bass and Paur cross-sections
Figure 4a shows the relative difference between the total column ozone from Brewer B156 and Dobson D101, calculated using the operational procedures. The amplitude of a sinusoidal fit to the data with a period of 1 year gives an amplitude of 0.78 %, with an average offset between the two datasets of 1.15 %. The relative difference in total column ozone between Brewer B156 and Dobson D101 extends over 4.0 % (from −0.69 % to +3.28 % defined as the 95 % data coverage), which is a significant inconsistency that needs to be addressed. Similar offsets and seasonal variations relative to Dobson D101 are also obtained for Brewers B040, B072, and B163.
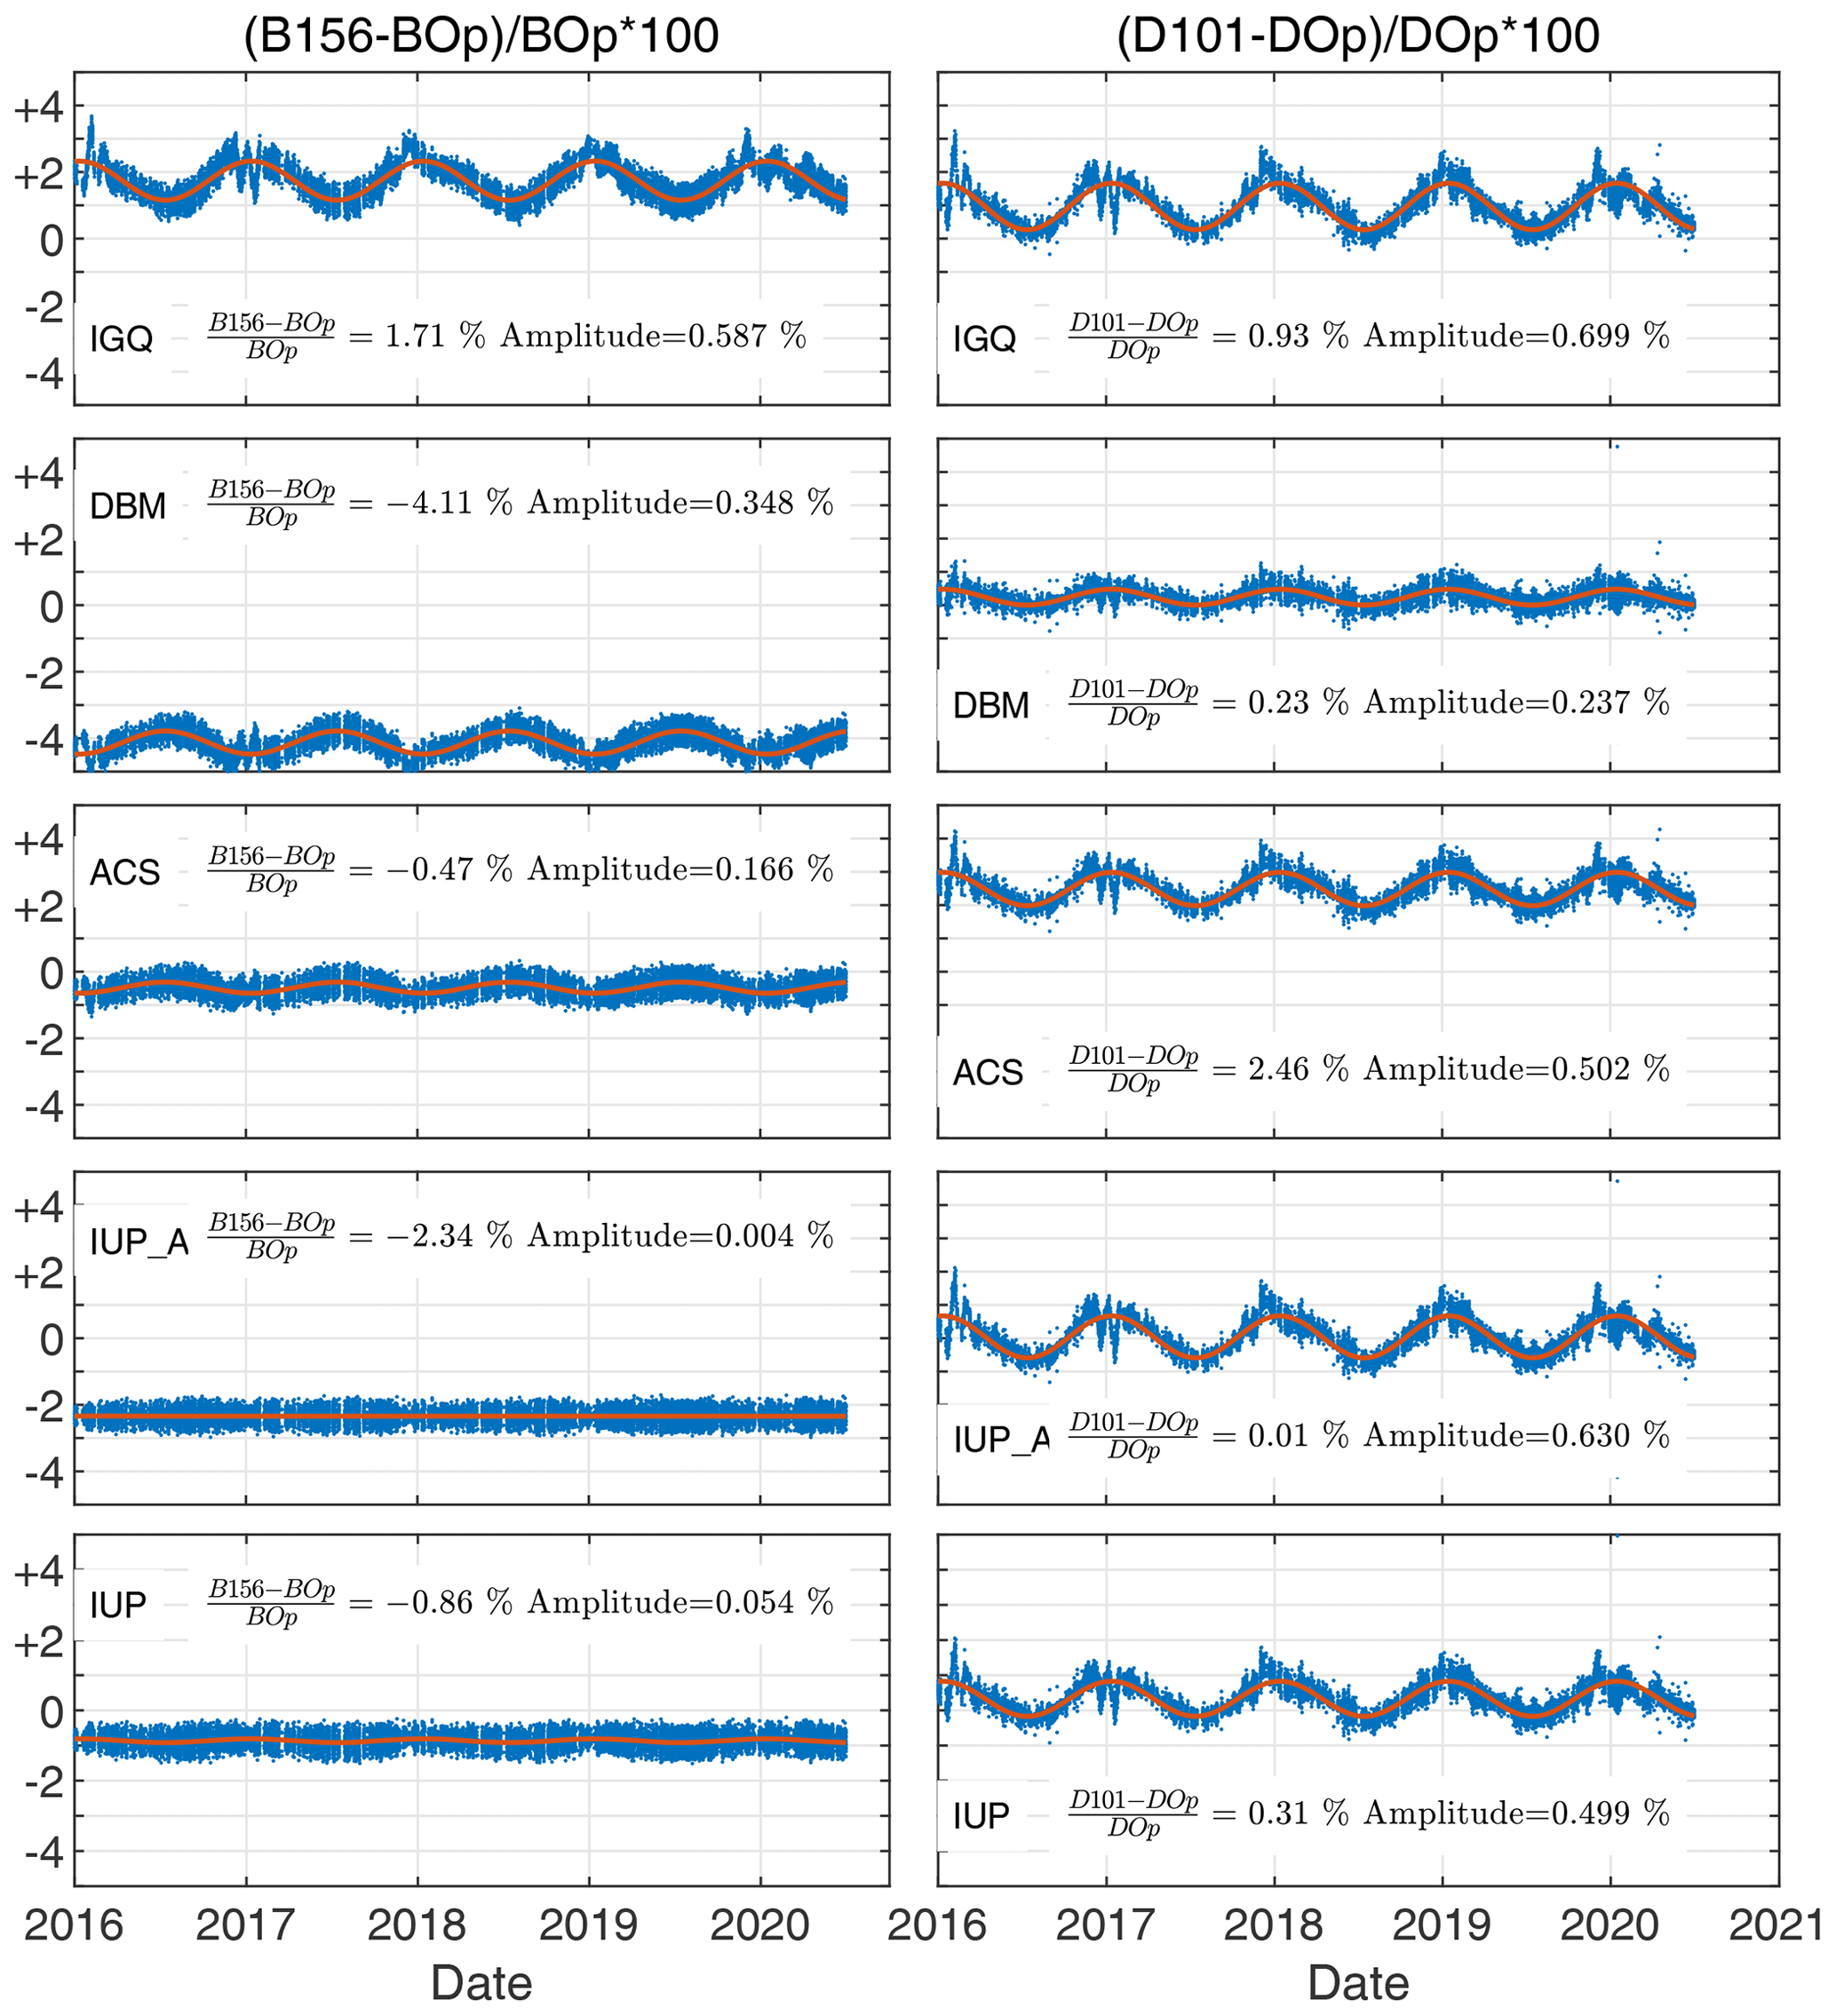
Figure 5Relative differences in total column ozone calculated with different ozone absorption cross-sections and effective ozone temperature relative to the operational ozone datasets for Brewer B156 (left panels) and Dobson D101 (right panels). The red curve in the figure represents a sinusoidal fit to the data with a period of 1 year. The average offset and amplitude of the sine wave are also shown.
As expected, this seasonal variability correlates very well with the effective ozone temperature as shown in Fig. 4b. Indeed, the temperature coefficient of −0.13 %/K retrieved from a linear fit to the data, combined with the amplitude of the average seasonal effective temperature variation of 5.7 K, gives an amplitude of 0.74 %, in excellent agreement with the amplitude of 0.78 % of the periodic fit to the dataset shown in Fig. 4a. This indicates that the seasonal variability observed between the Brewers and Dobson D101 is strongly correlated to the effective ozone temperature.
Table 3Average offset and seasonal amplitude in percent (%) of the relative differences between Brewers B040, B072, B156, and B163 and Dobson D101 for the five investigated ozone absorption cross-sections. These results are extracted from the appropriate figures, such as Fig. 6 for Brewer B156. The last row in the table (Br avg) represents the average of the results of the four Brewers relative to D101.
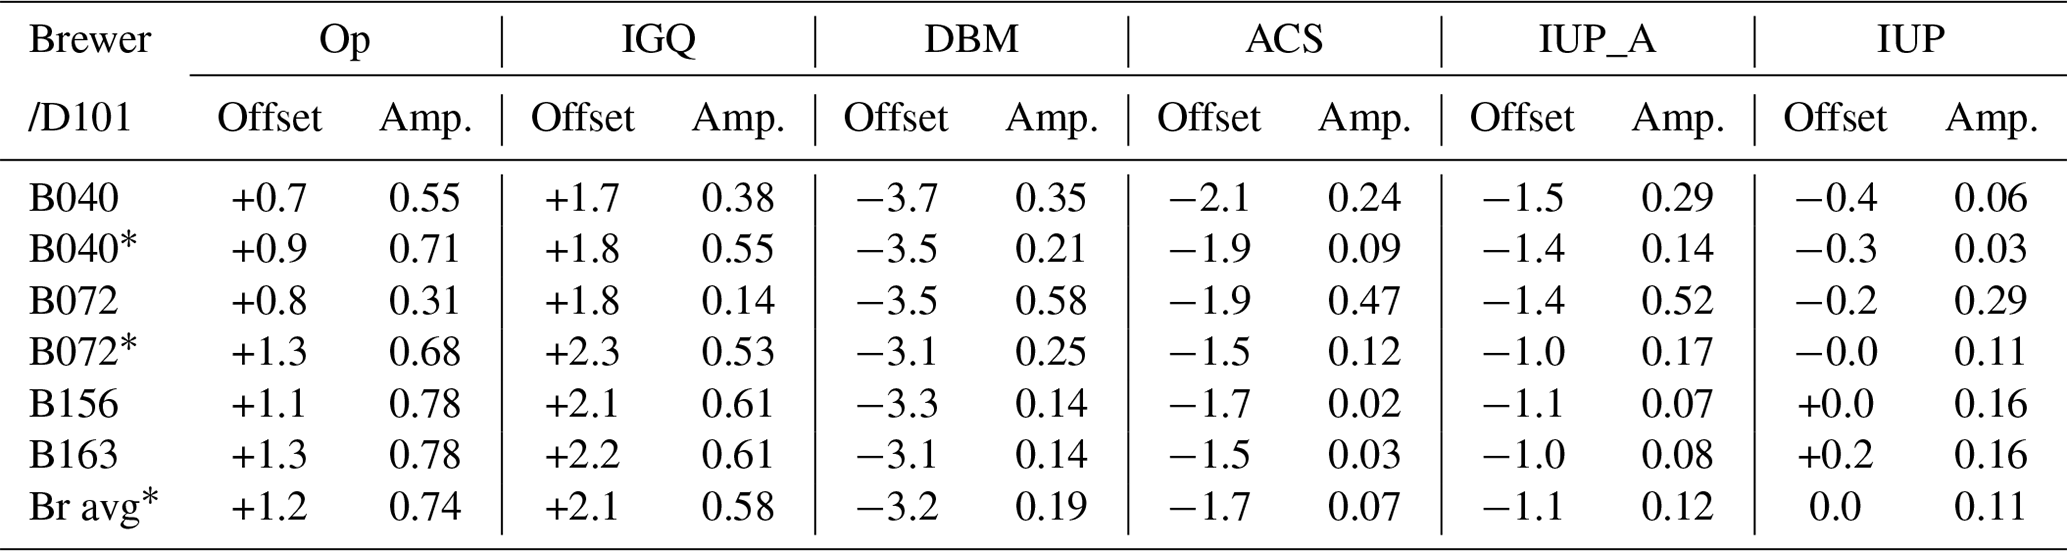
* Stray-light correction applied to the single Brewers, based on the calibration relative to the double Brewer B185 obtained during the RBCC-E calibration campaign in 2018.
The relative differences between the datasets calculated with different ozone absorption cross sections and taking into account the effective ozone temperature are shown in Fig. 5 with respect to the operational datasets for Brewer B156 and Dobson D101. The panels in the figure are based on the values shown in Table 2 and are therefore mainly a visual illustration of the impact of changing to a different ozone absorption cross-section with its specific ozone temperature dependence. Note that the Rayleigh correction of −2.4 DU was also included in the operational ozone dataset for Brewer B156, so it cancels out when taking the ratios shown in Fig. 5.
As expected, the amplitude of the periodic sine fit shown in the subfigures agrees very well with the temperature coefficients calculated for each ozone absorption cross-section shown in Table 2 multiplied by the effective ozone temperature and also with the seasonal fit of the ozone ratios between Brewer and Dobson shown in black in the figures. This excellent agreement indicates that the observed seasonal variability is mainly due to the temperature dependence of the ozone absorption coefficients calculated for Brewer or Dobson.
The most obvious feature apparent in Fig. 5 is the pronounced seasonal variability of the Dobson D101 datasets due to the inclusion of the effective ozone temperature in the calculations. On the other hand, the average offsets to the operational dataset are for the most part below 1 %, with the exception of the ACS data, with an offset of +2.5 %. In contrast, the changes for Brewer B156 show a much more reduced seasonal variability relative to the operational dataset, which indicates that the Brewer ozone measurement procedure (wavelength settings and relative weighting) produces an ozone absorption coefficient largely insensitive to the effective ozone temperature. On the other hand, the offsets between the ozone absorption coefficients calculated from these cross-sections vary between +1.7 % for the IGQ dataset to −4.1 % for DBM and are therefore much larger than for the Dobson. This larger variability is probably due to the smaller spectral widths of the line spread functions of the Brewer, which is therefore more sensitive to spectral noise in the cross-sections than from the wider Dobson line spread functions (see Eq. 7). Another reason could be the different wavelengths used in Brewers compared to Dobsons in conjunction with the spectral variability of the ozone absorption cross sections.
3.2 Consistency between Brewer and Dobson total column ozone datasets
The comparisons between the datasets of Brewer B156 and Dobson D101 are shown in Fig. 6 for the five cross-sections. The comparisons between the other three Brewers and D101 are summarised in Table 3 and are shown as figures in the Supplement.
A possible confounding factor could be the different locations of the Brewer and Dobson spectroradiometers during the study period, with Brewer B156 collocated with Brewer B040 from 2016 to 2018 at Arosa and then moved to Davos for the remaining period. However, as discussed in Stübi et al. (2017b), the observed differences in total column ozone between the two sites have shown no significant differences, and so no distinction has been made between the instruments located at Arosa or Davos.
As seen in Fig. 6 for Brewer B156 relative to Dobson D101, the relative differences in total column ozone show substantial variations, depending on which cross-section is used to calculate total column ozone. The largest seasonal variation in total column ozone measured by Brewer B156 relative to Dobson D101 is seen with the IGQ cross-sections, with an amplitude of 0.61 % and an average offset of +2.1 %. The observed seasonal variation is mainly due to a left-over dependence on effective ozone temperature as seen by the good agreement between the black and yellow curves. This implies that the temperature dependence of the IGQ cross-sections fails to account for the actual temperature dependence of the total column ozone retrieved by either Brewer or Dobson, a point already noted by Kerr (2002).
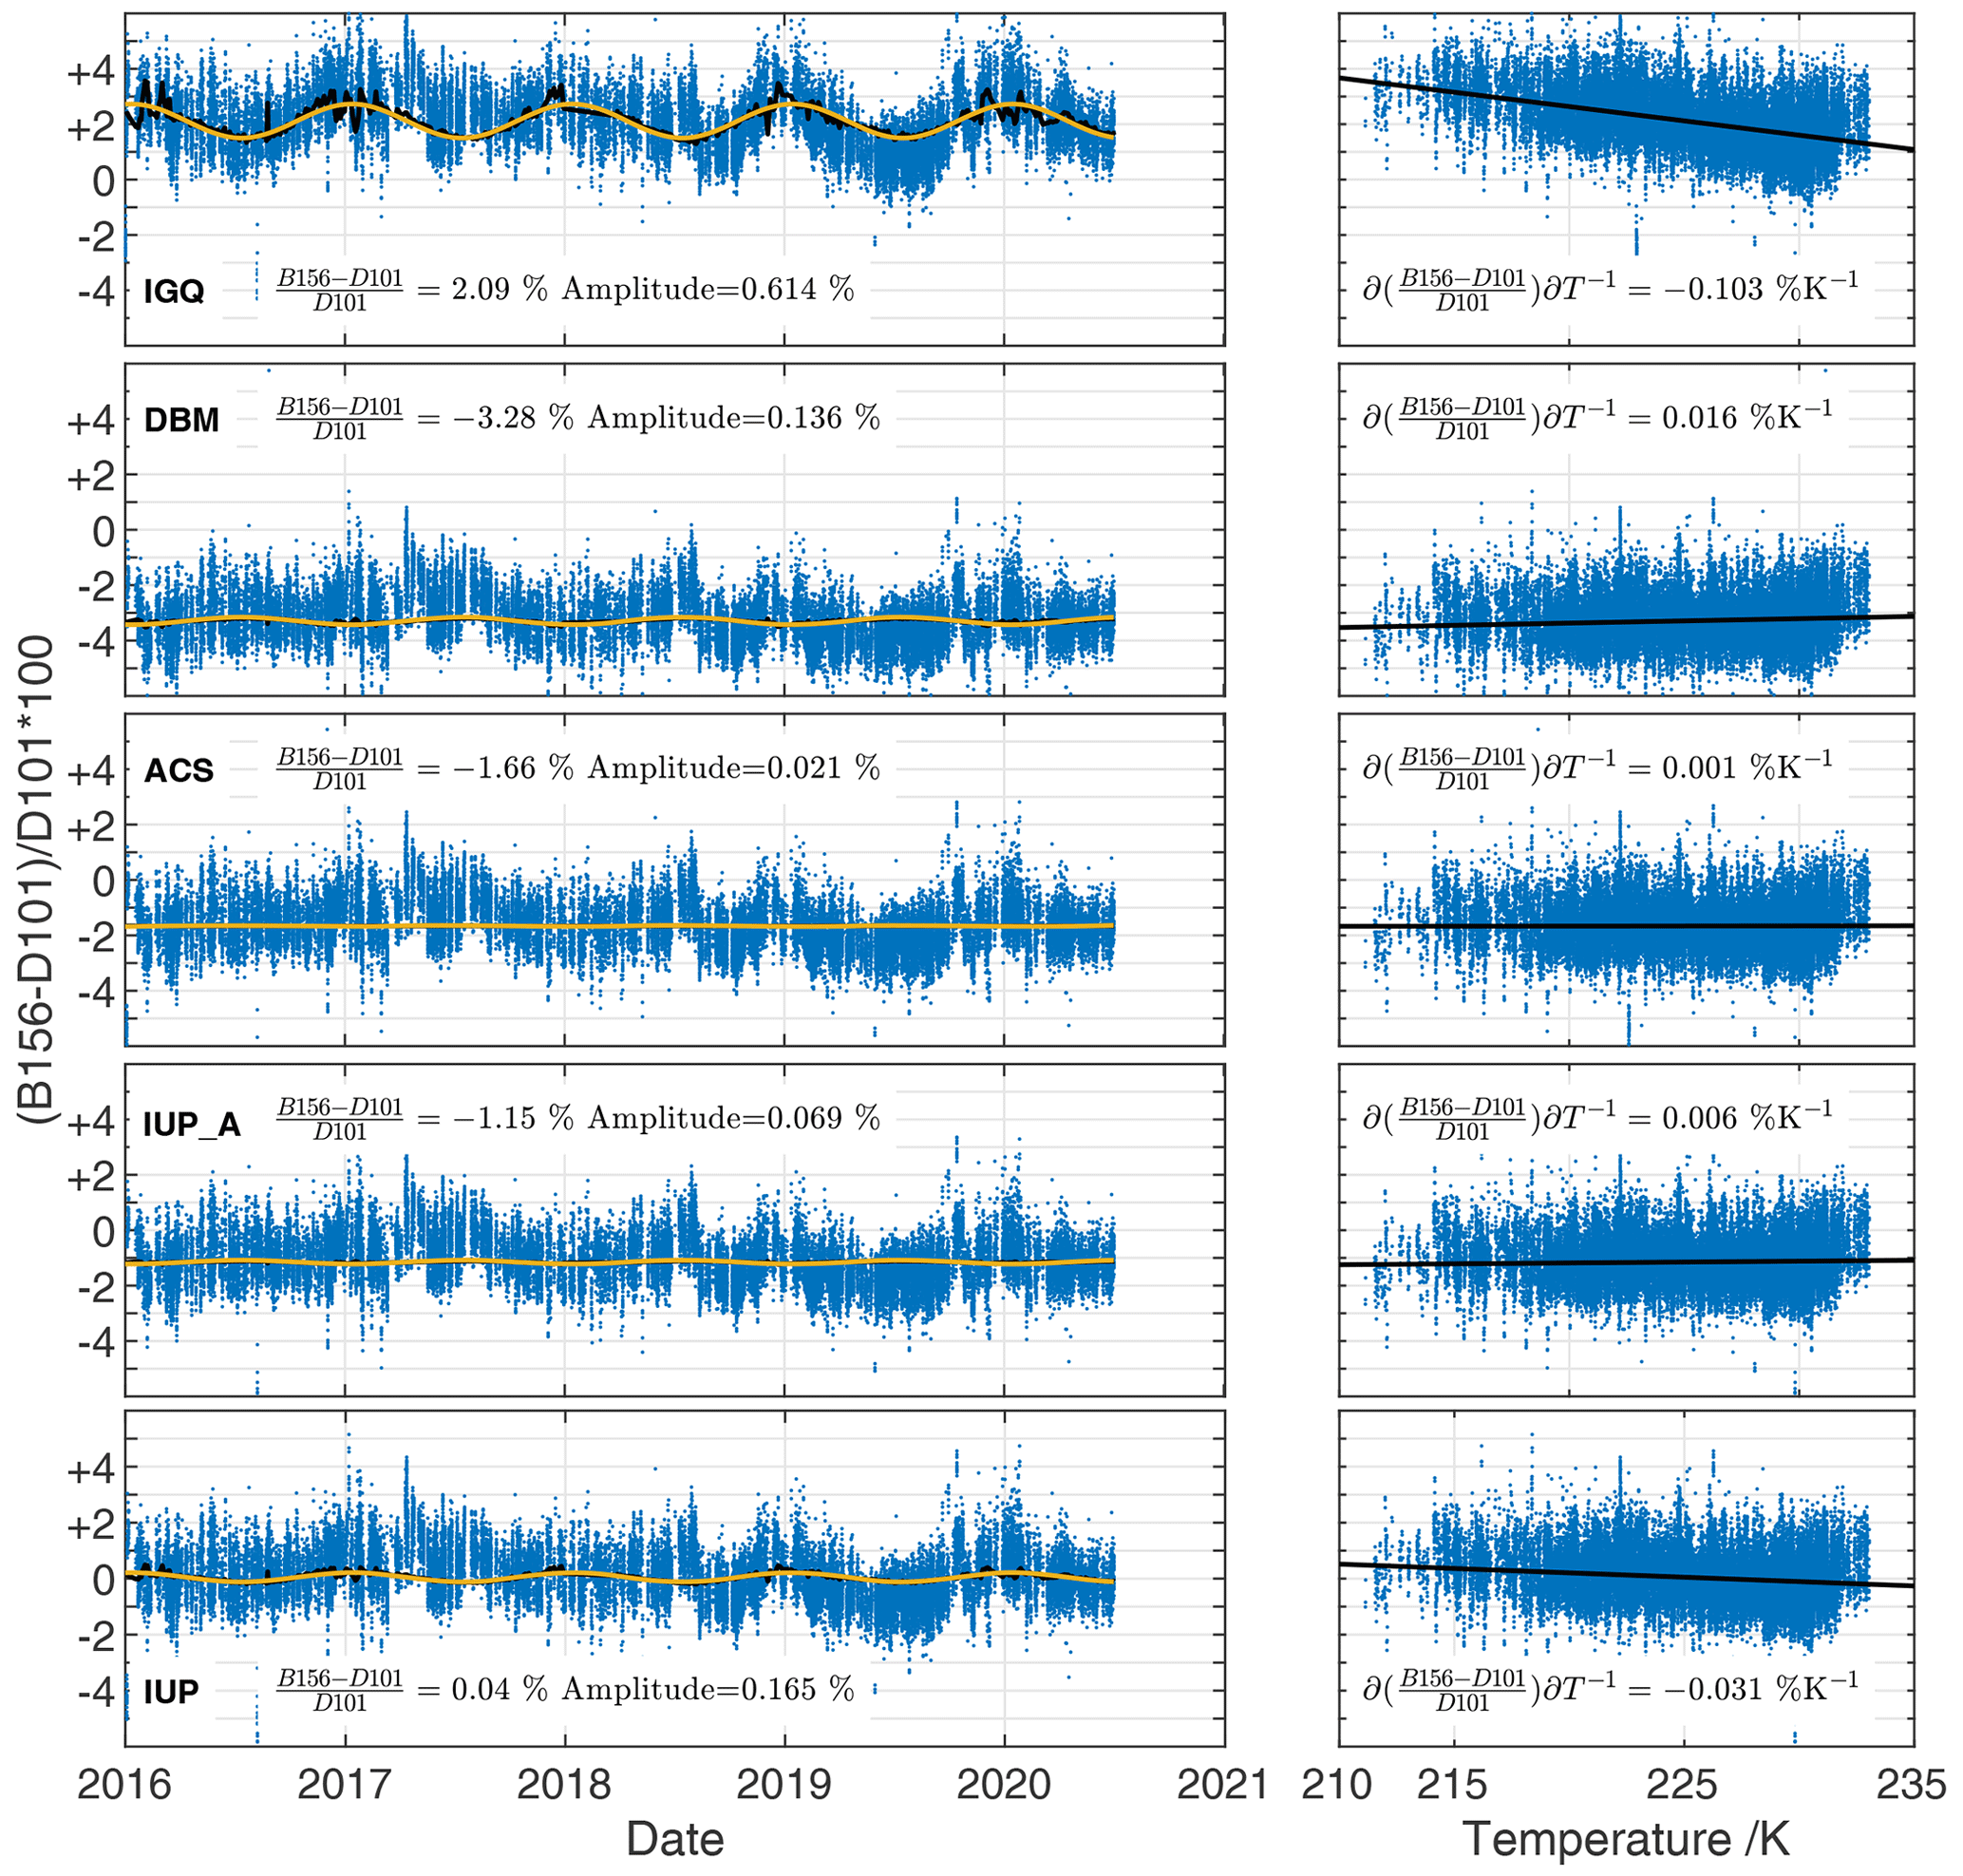
Figure 6Left panels: total column ozone relative differences between Brewer B156 and Dobson D101 for the five investigated cross-sections for the period 1 January 2016 to 30 June 2020. The black line represents the impact of the linear temperature coefficient calculated from this data using the effective ozone temperature, as shown on the corresponding panels on the right. The yellow curves represent a sine function fit to the data with a period of 1 year. The average offset and amplitude of the fitted sine curve are shown in the panels. Right panels: the same data shown with respect to the effective ozone temperature. The black line is a linear fit, and the value of the gradient is shown in the panels.
As can be seen in Table 3, there is a slight systematic difference in the seasonal variability of the single Brewer spectroradiometers relative to Dobson D101, compared to the one seen with the double Brewer spectroradiometers. Since single Brewer spectroradiometers are affected by stray light at the large ozone slant path, we have applied a correction based on the stray-light correction determined during the RBCC-E campaign in 2018, with respect to the reference double Brewer B185* (Redondas et al., 2019). The corrections are small but improve the consistency with the results from the double Brewers, as can be seen in Table 3.
The seasonal variabilities between the Brewers and Dobson D101 are significantly improved when any of the cross-sections ACS, DBM, IUP, or IUP_ATMOZ are used instead of the operational cross-sections or IGQ. The results from the individual Brewers are highly consistent, with a remaining seasonal amplitude equal to or less than 0.2 %. In contrast, large differences are observed in the offsets between the total column ozone calculated from these cross-sections for the Brewers and Dobson D101. The largest discrepancies of −3.2 % and −1.7 % are observed with the DBM and ACS cross-sections respectively, while the best agreement of 0.0 % is seen with IUP and −1.1 % with IUP_ATMOZ. These results confirm the findings by Redondas et al. (2014), who also saw similar large discrepancies with DBM and the best consistency with the IUP cross-sections.
The new results with ACS and IUP_ATMOZ complement the previous study by Redondas et al. (2014) and support the fact that the Dobson spectroradiometers are sensitive to effective ozone temperature and need a correction based on the temperature coefficients calculated from the ozone absorption cross-sections.
3.2.1 Total column ozone using the effective ozone temperature from ECMWF
The availability of a global dataset of effective ozone temperature becomes crucial if the decision is made to reprocess the whole historical dataset of the global Dobson network. Such a global dataset is available through the aforementioned ECMWF effective ozone temperature climatology, which has been made available daily since 1956 on a global scale. Without entering into a detailed discussion on this topic, we have evaluated how the reprocessed Dobson total column ozone dataset using either the ozone-sonde or ECMWF-based effective ozone temperature dataset agrees at Arosa and Davos. The total column ozone dataset reprocessed using the ECMWF temperatures is only 0.1 % lower on average than the ozone-sonde-based one, and the standard deviation of 0.2 % between the two datasets is also extremely low. Therefore, at least for the northern mid-latitude site of Arosa and Davos, either effective ozone temperature dataset can be used for the recalculation of the total column ozone from Dobson D101, with a bias of at most 0.1 % and a resulting uncertainty of less than 0.2 %.
3.2.2 Dependence on ozone slant path
A possible influence of stray light on the total column measurements was investigated by correlating the relative differences between the double Brewers B156 and B163 and Dobson D101 against the ozone slant path. The data were filtered by using only effective ozone temperatures of 225±2 K. As can be seen in Fig. 7, the relative differences vary by about ±1 %, with a slight curvature, indicating some small unexplained features between the instruments, which could be due to the actual extra-terrestrial constants coming from the independent calibrations performed on Brewers and Dobson or from the forward scattered radiation into the larger field of view of the Dobson (8∘ versus 1.5∘ for Dobson and Brewer respectively). However the instruments do not deviate systematically at a larger ozone slant path, which would be an indication for a stray-light impact on the ozone retrieval. The same comparison using the two single Brewers B040 and B072 is shown in Fig. 4S in the Supplement.
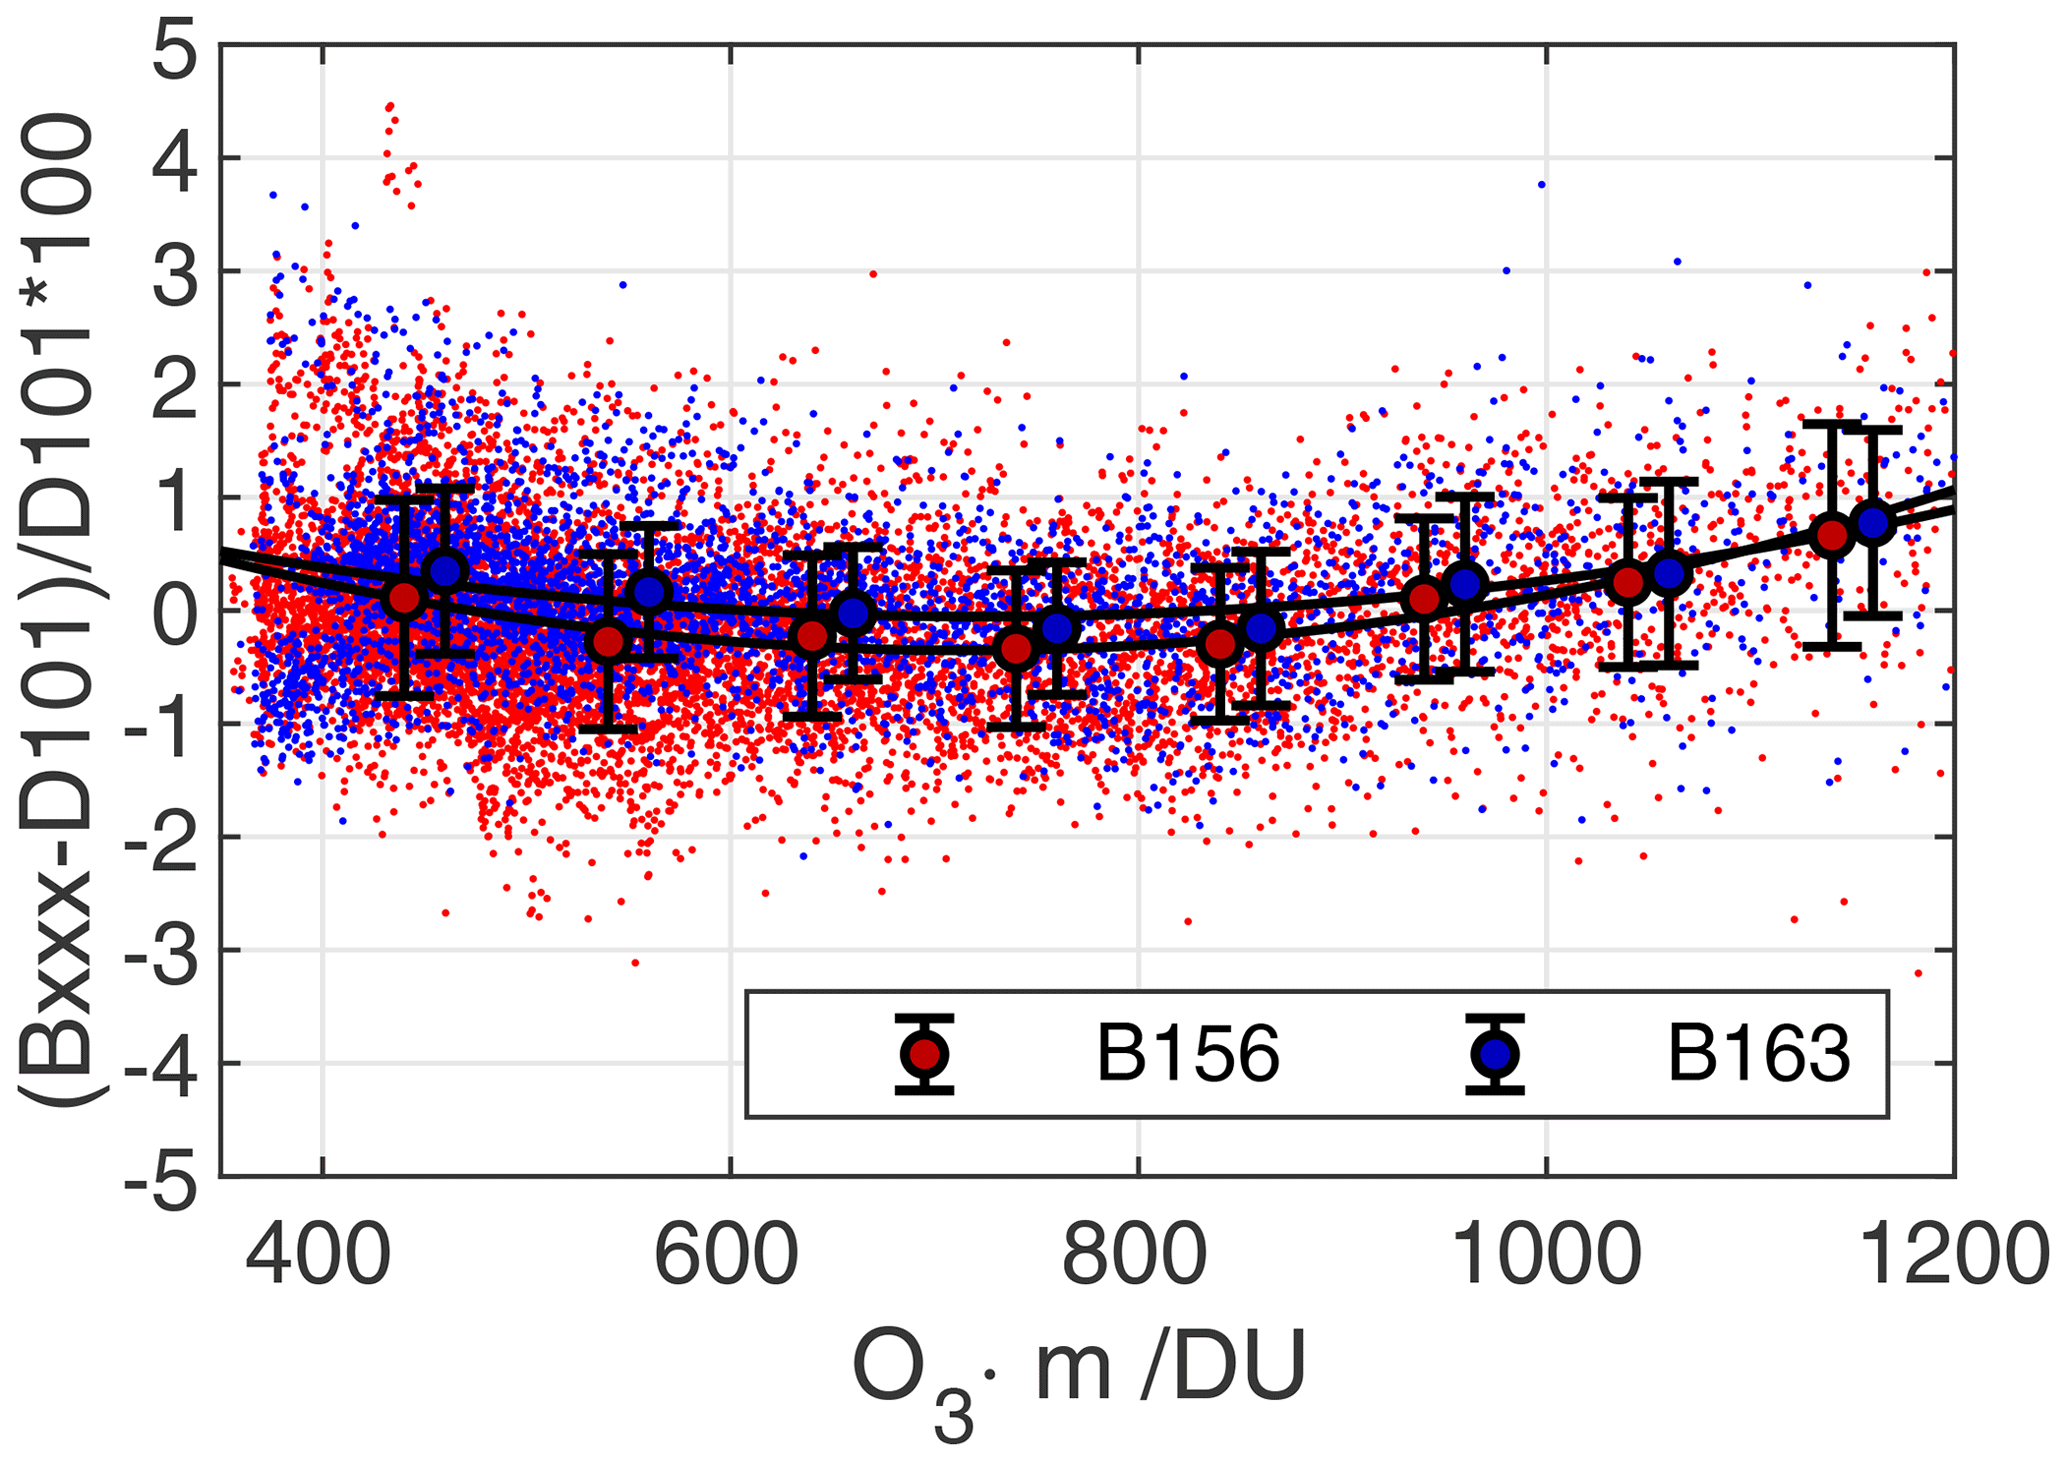
Figure 7Relative difference in total column ozone between Brewer B156 and Dobson D101 (red points) and B163 versus D101 (blue points) with respect to ozone slant path. The data were restricted to conditions with effective ozone temperature of 225±2 K. The error bars represent the standard deviation of the data points at selected ozone slant paths ±50.
Total column ozone measurements from Brewer and Dobson spectroradiometers located at Davos/Arosa in the Swiss Alps have been analysed. The highest consistency between Brewer and Dobsons is obtained with the IUP ozone absorption cross-sections (Serdyuchenko et al., 2014) and applying an effective ozone temperature correction. The ozone absorption coefficient of the Brewer spectroradiometer, as already noted by Redondas et al. (2014), is only weakly sensitive to a change in effective ozone temperature (0.1 % per 10 K; see Table 2), while for the Dobson, the sensitivity to effective ozone temperature is considerably larger, with 0.9 % per 10 K change.
Based on the results of the double Brewers B156 and B163, the lowest residual seasonal variability between Brewer and Dobson is obtained with the IUP, ACS, or IUP_ATMOZ cross-sections, indicating that their temperature dependence is the most consistent of the investigated ozone absorption cross-section datasets. Relative differences in total column ozone of 0.3 % or less are observed between all four Brewers and Dobson D101 when the IUP cross-sections are used.
Due to this significant sensitivity to effective ozone temperature, the total column ozone calculation procedure for the Dobson spectroradiometer requires this additional ancillary information to produce total column ozone corrected with the effective ozone temperature observed at Arosa and Davos or at other stations. This ancillary information can be obtained from ozone-sonde launches as done in this study or from climatological reanalyses such as from the ECMWF effective ozone temperature reanalysis.
As shown here, the use of measured spectral line spread functions to calculate the ozone absorption coefficient of the Dobson D101 improves the agreement with the collocated Brewer spectroradiometers. This well established procedure for Brewer spectroradiometers would also improve the general agreement within the Dobson network, since even the reference Dobsons used for the calibration of network Dobson instruments show relative differences in ozone absorption coefficients of up to 0.6 % when the actually measured line spread functions are used instead of the nominal ones (Köhler et al., 2018).
Implications for the total column ozone series of LKO Arosa and Davos
The results of this study are based on individual measurements by well maintained Brewers and Dobson spectroradiometers within the period 2016 to 2020 covering nearly 5 years of continuous measurements at air masses between 1.1 and 3.9.
Following the decision made by the WMO Scientific Advisory Group on Ozone and UV (WMO SAG O3UV), the total column ozone time series of LKO Arosa and Davos, which are based on six Dobson spectroradiometers over the period 1926 to the present, will need to be reprocessed using the IUP ozone absorption cross-sections and applying a correction for the effective ozone temperature following the methodology outlined here. Similarly, the total column ozone measurements from the Brewer spectroradiometers operating at LKO Arosa and Davos need to be reprocessed using the updated Rayleigh scattering cross-sections and the IUP ozone absorption cross-sections.
Once these datasets are reprocessed, both datasets from Brewer and Dobson can be merged to form a homogenised total column ozone dataset for LKO Arosa and Davos. The resulting uncertainty of the merged dataset can be estimated by the comparison of total column ozone measurements obtained between the collocated Brewer and Dobson instruments during the investigated period. As shown in the bottom left panel of Fig. 6 and in the figures in the Supplement, the comparison of coincident single total column ozone measurements within a 5 min window between Brewers B040, B072, B156, and B163 and Dobson D101 using the IUP cross-sections gives an excellent agreement, with offsets smaller than 0.3 % and standard deviations of less than 0.9 %. For daily means, this variability decreases to 0.7 %, and for monthly means, the relative difference between the four Brewers and Dobson D101 is already less than 0.1 %.
The datasets used in this study can be downloaded from https://doi.org/10.5281/zenodo.4559802 (Gröbner, 2021).
The supplement related to this article is available online at: https://doi.org/10.5194/amt-14-3319-2021-supplement.
JG analysed the datasets and wrote the manuscript, HS processed the datasets, LE analysed the line spread functions of Dobson D101 and calculated the ozone absorption coefficients, and RS is the scientist responsible for the Arosa and Davos total column ozone time series.
The authors declare that they have no conflict of interest.
This research has been supported by the ESA project QA4EO (grant no. QA4EO/SER/SUB/09) and by the project INFO3RS funded by MeteoSwiss (grant no. 123001926).
This paper was edited by Pawan K. Bhartia and reviewed by Alberto Redondas and one anonymous referee.
Bass, A. M. and Paur, R. J.: The ultraviolet cross-sections of ozone, I – The measurements, II – Results and temperature dependence, in: Atmospheric Ozone, edited by: Zerefos, C. S. and Ghazi, A., Springer, Dordrecht, The Netherlands, 606–616, https://doi.org/10.1007/978-94-009-5313-0_120, 1985. a, b, c
Bernhard, G., Evans, R. D., Labow, G. J., and Oltmans, S. J.: Bias in Dobson total ozone measurements at high latitudes due to approximations in calculations of ozone absorption coefficients and air mass, J. Geophys. Res.-Atmos., 110, D10305, https://doi.org/10.1029/2004JD005559, 2005. a
Birk, M. and Wagner, G.: ESA SEOM-IAS – Measurement and ACS database O3 UV region, Version I, [Data set], Zenodo, https://doi.org/10.5281/zenodo.1485588, 2018. a, b
Bodhaine, B. A., Wood, N. B., Dutton, E. G., and Slusser, J. S.: On Rayleigh Optical Depth Calculations, J. Atmos. Ocean. Tech., 16, 1854–1861, 1999. a, b, c, d, e, f
Brion, J., Chakir, A., Daumont, D., Malicet, J., and Parisse, C.: High-resolution laboratory absorption cross section of O3, Temperature effect, Chem. Phys. Lett., 213, 610–612, 1993. a
Daumont, D., Brion, J., Charbonnier, J., and Malicet, J.: Ozone UV spectroscopy I: Absorption cross-sections at room temperature, J. Atmos. Chem., 15, 145–155, 1992. a
EMRP ATMOZ (2014–2017): https://www.euramet.org/research-innovation/search-research-projects/details/project/traceability-for-atmospheric-total-column-ozone/, last access: 18 December 2020. a
Gröbner, J.: datasets for the paper in AMT: Consistency of total column ozone measurements between the Brewer and Dobson spectroradiometers of the LKO Arosa and PMOD/WRC Davos, Version V1.0 [data set], Zenodo, https://doi.org/10.5281/zenodo.4559802, 2021. a
Gröbner, J., Wardle, D. I., McElroy, C. T., and Kerr, J. B.: Investigation of the wavelength accuracy of Brewer spectrophotometers, Appl. Optics, 37, 8352–8360, 1998. a
Kerr, J. B.: New methodology for deriving total ozone and other atmospheric variables from Brewer spectrophotometer direct sun spectra, J. Geophys. Res.-Atmos., 107, 4731, https://doi.org/10.1029/2001JD001227, 2002. a, b, c
Kerr, J. B., Asbridge, I. A., and Evans, W. F. J.: Intercomparison of Total Ozone Measured by the Brewer and Dobson Spectrophotometers at Toronto, J. Geophys. Res.-Atmos., 93, 11129–11140, https://doi.org/10.1029/JD093iD09p11129, 1988. a
Köhler, U., Nevas, S., McConville, G., Evans, R., Smid, M., Stanek, M., Redondas, A., and Schönenborn, F.: Optical characterisation of three reference Dobsons in the ATMOZ Project – verification of G. M. B. Dobson's original specifications, Atmos. Meas. Tech., 11, 1989–1999, https://doi.org/10.5194/amt-11-1989-2018, 2018. a, b, c
Komhyr, W. D., Mateer, C. L., and Hudson, R. D.: Effective Bass – Paur 1985 ozone absorption coefficients for use with Dobson ozone spectrophotometers, J. Geophys. Res.-Atmos., 98, 20451–20465, 1993. a
León-Luis, S. F., Redondas, A., Carreño, V., López-Solano, J., Berjón, A., Hernández-Cruz, B., and Santana-Díaz, D.: Internal consistency of the Regional Brewer Calibration Centre for Europe triad during the period 2005–2016, Atmos. Meas. Tech., 11, 4059–4072, https://doi.org/10.5194/amt-11-4059-2018, 2018. a
Malicet, J., Daumont, D., Charbonnier, J., Parisse, C., Chakir, A., and Brion, J.: Ozone UV spectroscopy, II. Absorption cross-sections and temperature dependence, J. Atmos. Chem, 21, 263–273, 1995. a
NOAA: National Oceanic and Atmospheric Administration (NOAA), US Standard Atmosphere, NOAA-S/T 76-1562, 1976. a
Nyeki, S., Halios, C. H., Baum, W., Eleftheriadis, K., Flentje, H., Gröbner, J., Vuilleumier, L., and Wehrli, C.: Ground-based aerosol optical depth trends at three high-altitude sites in Switzerland and southern Germany from 1995 to 2010, J. Geophys. Res.-Atmos., 117, D18202, https://doi.org/10.1029/2012JD017493, 2012. a
Redondas, A., Evans, R., Stuebi, R., Köhler, U., and Weber, M.: Evaluation of the use of five laboratory-determined ozone absorption cross sections in Brewer and Dobson retrieval algorithms, Atmos. Chem. Phys., 14, 1635–1648, https://doi.org/10.5194/acp-14-1635-2014, 2014. a, b, c, d, e, f, g, h, i
Redondas, A., León-Luís, S. F., López-Solano, J., Berjón, A., and Carreño, V.: Thirteenth Intercomparison Campaign of the Regional Brewer Calibration Center Europe, Joint publication of State Meteorological Agency (AEMET), Madrid, Spain and World Meteorological Organization (WMO), Geneva, Switzerland, WMO/GAW Report No. 246, https://doi.org/10.31978/666-20-018-3, 2019. a, b, c, d
Scarnato, B., Staehelin, J., Stübi, R., and Schill, H.: Long-term total ozone observations at Arosa Switzerland) with Dobson and Brewer instruments (1988–2007), J. Geophys. Res.-Atmos., 115, D13306, https://doi.org/10.1029/2009JD011908, 2010. a
Šmíd, M., Porrovecchio, G., Tesař, J., Burnitt, T., Egli, L., Grőbner, J., Linduška, P., and Staněk, M.: The design and development of a tuneable and portable radiation source for in situ spectrometer characterisation, Atmos. Meas. Tech. Discuss. [preprint], https://doi.org/10.5194/amt-2020-244, in review, 2020. a, b
Serdyuchenko, A., Gorshelev, V., Weber, M., Chehade, W., and Burrows, J. P.: High spectral resolution ozone absorption cross-sections – Part 2: Temperature dependence, Atmos. Meas. Tech., 7, 625–636, https://doi.org/10.5194/amt-7-625-2014, 2014. a, b, c, d, e
Staehelin, J., Kegel, R., and Harris, N. R. P.: Trend analysis of the homogenized total ozone series of Arosa (Switzerland), 1926–1996, J. Geophys. Res.-Atmos., 103, 8389–8399, 1998. a
Staehelin, J., Viatte, P., Stübi, R., Tummon, F., and Peter, T.: Stratospheric ozone measurements at Arosa (Switzerland): history and scientific relevance, Atmos. Chem. Phys., 18, 6567–6584, https://doi.org/10.5194/acp-18-6567-2018, 2018. a
Stübi, R., Schill, H., Klausen, J., Vuilleumier, L., and Ruffieux, D. C.: Reproducibility of total ozone column monitoring by the Arosa Brewer spectrophotometer triad, J. Geophys. Res.-Atmos., 122, 4735–4745, https://doi.org/10.1002/2016JD025735, 2017a. a, b
Stübi, R., Schill, H., Klausen, J., Vuilleumier, L., Gröbner, J., Egli, L., and Ruffieux, D.: On the compatibility of Brewer total column ozone measurements in two adjacent valleys (Arosa and Davos) in the Swiss Alps, Atmos. Meas. Tech., 10, 4479–4490, https://doi.org/10.5194/amt-10-4479-2017, 2017b. a, b
Stübi, R., Schill, H., Maillard Barras, E., Klausen, J., and Haefele, A.: Quality assessment of Dobson spectrophotometers for ozone column measurements before and after automation at Arosa and Davos, Atmos. Meas. Tech. Discuss. [preprint], https://doi.org/10.5194/amt-2020-441, in review, 2020. a, b
van der A, R. J., Allaart, M. A. F., and Eskes, H. J.: Multi sensor reanalysis of total ozone, Atmos. Chem. Phys., 10, 11277–11294, https://doi.org/10.5194/acp-10-11277-2010, 2010. a
Vaníček, K., Metelka, L., Skřivánková, P., and Staněk, M.: Dobson, Brewer, ERA-40 and ERA-Interim original and merged total ozone data sets – evaluation of differences: a case study, Hradec Králové (Czech), 1961–2010, Earth Syst. Sci. Data, 4, 91–100, https://doi.org/10.5194/essd-4-91-2012, 2012. a