the Creative Commons Attribution 4.0 License.
the Creative Commons Attribution 4.0 License.
 | 11 May 2021
Optimal use of the Prede POM sky radiometer for aerosol, water vapor, and ozone retrievals
Rei Kudo
Henri Diémoz
Victor Estellés
Monica Campanelli
Masahiro Momoi
Franco Marenco
Claire L. Ryder
Osamu Ijima
Akihiro Uchiyama
Kouichi Nakashima
Akihiro Yamazaki
Ryoji Nagasawa
Nozomu Ohkawara
Haruma Ishida
The Prede POM sky radiometer is a filter radiometer deployed worldwide in the SKYNET international network. A new method, called Skyrad pack MRI version 2 (MRI v2), is presented here to retrieve aerosol properties (size distribution, real and imaginary parts of the refractive index, single-scattering albedo, asymmetry factor, lidar ratio, and linear depolarization ratio), water vapor, and ozone column concentrations from the sky radiometer measurements. MRI v2 overcomes two limitations of previous methods (Skyrad pack versions 4.2 and 5, MRI version 1). One is the use of all the wavelengths of 315, 340, 380, 400, 500, 675, 870, 940, 1020, 1627, and 2200 nm if available from the sky radiometers, for example, in POM-02 models. The previous methods cannot use the wavelengths of 315, 940, 1627, and 2200 nm. This enables us to provide improved estimates of the aerosol optical properties, covering almost all the wavelengths of solar radiation. The other is the use of measurements in the principal plane geometry in addition to the solar almucantar plane geometry that is used in the previous versions. Measurements in the principal plane are regularly performed; however, they are currently not exploited despite being useful in the case of small solar zenith angles when the scattering angle distribution for almucantars becomes too small to yield useful information. Moreover, in the inversion algorithm, MRI v2 optimizes the smoothness constraints of the spectral dependencies of the refractive index and size distribution, and it changes the contribution of the diffuse radiances to the cost function according to the aerosol optical depth. This overcomes issues with the estimation of the size distribution and single-scattering albedo in the Skyrad pack version 4.2. The scattering model used here allows for non-spherical particles, improving results for mineral dust and permitting evaluation of the depolarization ratio.
An assessment of the retrieval uncertainties using synthetic measurements shows that the best performance is obtained when the aerosol optical depth is larger than 0.2 at 500 nm. Improvements over the Skyrad pack versions 4.2 and 5 are obtained for the retrieved size distribution, imaginary part of the refractive index, single-scattering albedo, and lidar ratio at Tsukuba, Japan, while yielding comparable retrievals of the aerosol optical depth, real part of the refractive index, and asymmetry factor. A radiative closure study using surface solar irradiances from the Baseline Surface Radiation Network and the parameters retrieved from MRI v2 showed consistency, with a positive bias of the simulated global irradiance of about +1 %. Furthermore, the MRI v2 retrievals of the refractive index, single-scattering albedo, asymmetry factor, and size distribution have been found to be in agreement with integrated profiles of aircraft in situ measurements of two Saharan dust events at the Cape Verde archipelago during the Sunphotometer Airborne Validation Experiment in Dust (SAVEX-D) 2015 field campaign.
- Article
(2765 KB) - Full-text XML
-
Supplement
(767 KB) - BibTeX
- EndNote


Aerosols, water vapor, and ozone are the most impacting factors in the atmospheric radiative budget in the solar wavelength band under a cloudless sky. Indeed, the scattering and absorption of solar radiation by aerosols, as well as absorption by water vapor and ozone, have an important effect in the ultraviolet, visible, and near-infrared wavelength regions. It is essential to observe these temporal and spatial changes and to evaluate their impacts on the atmospheric radiative budget and climate change (IPCC, 2013).
The columnar properties of aerosol, ozone, and water vapor can be retrieved by ground-based remote sensing using sun–sky radiometers. A sun–sky radiometer is a narrowband filter photometer that measures the solar direct radiation and the angular distribution of the diffuse radiation, usually at ultraviolet, visible, and near-infrared wavelengths. Such instruments are deployed worldwide in the international networks of AERONET (Holben et al., 1998) and SKYNET (Nakajima et al., 2020). Specifically, the Prede POM sky radiometer is the standard instrument from SKYNET, and now more than 100 instruments of this kind are used around the world. Methods to retrieve aerosol properties, water vapor, and ozone column concentrations from the sky radiometer have been developed in the last 30 years. Nakajima et al. (1996) developed the “Skyrad pack”, which is an all-in-one package including methods for the calibration of the sky radiometer and for the retrieval of aerosol physical and optical properties from solar direct and diffuse radiation at the wavelengths of 340, 380, 400, 500, 675, 870, and 1020 nm. The products of the Skyrad pack version 4.2 (Skyrad v4.2) are the volume size distribution (VSD), real and imaginary parts of the refractive index (RRI and IRI), aerosol optical depth (AOD), single-scattering albedo (SSA), and phase function. The AOD (related to the columnar burden of aerosols), SSA (ratio of scattering to scattering + absorption), and phase function (angular distribution of scattering) or asymmetry factor (ASM; a measure of the preferred direction of forward and backward scattering) are necessary to evaluate the impact of aerosols on the atmospheric radiative balance. Kobayashi et al. (2006) later developed the Skyrad pack MRI (Meteorological Research Institute) version 1 (MRI v1) as a derivative of the Skyrad pack mainstream series. MRI v1 is based on a statistical optimal estimation algorithm similar to the retrieval method employed within the NASA AERONET network (Dubovik and King, 2000). More recently, Kobayashi et al. (2010) introduced treatment for randomly oriented spheroidal particles in MRI v1 based on the data table developed by Dubovik et al. (2006). The phase function of dust particles estimated from spheroids is a more accurate representation than the spherical approximation used in previous versions of the software. Alongside this, Hashimoto et al. (2012) upgraded the Skyrad pack version 4.2 to version 5 (Skyrad v5). They also introduced the statistical optimal estimation algorithm and a data quality control method. The products available from the Skyrad v5 and MRI v1 are similar to the ones that can be derived from the Skyrad v4.2.
In addition to this, the sky radiometer can measure the direct and diffuse radiation at 315 and 940 nm, which is absorbed by ozone and water vapor. Khatri et al. (2014) developed a calibration method from measurements at 315 nm and retrieved total ozone (TO3) from the direct irradiance. Uchiyama et al. (2018a) calibrated the sky radiometer measurement at 940 nm by the Langley method from observations taken at a high mountain site. Campanelli et al. (2014, 2018) and Uchiyama et al. (2018a) developed the calibration methods based on the modified Langley method (Reagan et al., 1986; Bruegge et al., 1992; Halthore et al., 1997) and applied it to low-altitude sites. The modified Langley-based methods need an empirical equation to calculate the transmittance at 940 nm. Momoi et al. (2020) developed the on-site self-calibration method, which does not require the empirical equation. They estimated the calibration constant at 940 nm by using the dependency of the angular distribution of the diffuse radiances normalized to the direct irradiance on the precipitable water vapor (PWV). All the methods showed that PWV was successfully retrieved from the calibrated sky radiometer measurement at 940 nm.
SKYNET has collaborated with international lidar networks, such as AD-Net (Sugimoto et al., 2005). In the framework of these activities, a synergistic method, SKYLIDAR, was developed to estimate the vertical profiles of the extinction coefficient, SSA, and ASM from the sky radiometer and lidar measurements (Kudo et al., 2016). This enabled us to estimate the atmospheric heating rate by remote sensing techniques (Kudo et al., 2016, 2018). Another synergistic approach employs the particle extinction-to-backscatter ratio (lidar ratio; LIR) and the linear depolarization ratio (DEP). These are important aerosol optical properties observed by Raman lidars and high-spectral-resolution lidars (HSRLs), and they have been used for the aerosol typing (e.g., Burton et al., 2012; Groß et al., 2015). Recently, the LIR and DEP have been included in version 3 of the AERONET products, and some aerosol typing studies have already been conducted (e.g., Shin et al., 2018). The relations between LIR, DEP, and aerosol types based on the lidar observations are utilized in these studies. Conversely, the LIR derived from a sun–sky radiometer can be utilized instead of an assumed value to estimate the vertical profile of the extinction coefficient from conventional elastic backscatter lidars, which are deployed worldwide.
In this study, we developed a new method, the Skyrad pack MRI version 2 (MRI v2), to retrieve aerosol properties (VSD, RRI, IRI, AOD, SSA, ASM, LIR, and DEP), PWV, and TO3 from sky radiometer data. Our method has two advantages compared to Skyrad v4.2–v5 and MRI v1. Firstly, MRI v2 is able to use the observations at all the available wavelengths from the sky radiometer, from 315 to 2200 nm, and simultaneously retrieve the aerosol optical properties, the PWV, and the TO3. This possibility was not available in Skyrad v4.2–v5 and MRI v1 for which only the following wavelengths were exploited: 340, 380, 400, 500, 675, 870, and 1020 nm. Since the retrieved aerosol optical properties cover a good part the solar wavelength region from 300 to 3000 nm, a detailed characterization of the radiative transfer in short wavelengths under clear-sky conditions is thus possible from the sky radiometer measurements. Secondly, our method can be applied to both scanning patterns of the sky radiometer, i.e., solar almucantar and principal plane geometries. The preferred and most used scanning pattern is the almucantar geometry, but principal plane measurements are useful in the case of small solar zenith angles because in that case the range of scattering angles obtained with the almucantar geometry is too small. Skyrad pack versions earlier than v3 allowed users to analyze scanning data in the principal plane geometries. However, the recent retrieval methods of Skyrad v4.2, v5, and MRI v1 could only be applied to data obtained from the almucantar geometry, which prevented the analysis of the data routinely collected in the principal plane geometry. This reduced the number of observations available, particularly at observational sites at low latitudes.
The sky radiometer data used in this study are described in Sect. 2. The algorithms of the MRI v2 retrieval method and the simulation of the surface solar irradiance using the MRI v2 retrieved parameters are described in Sect. 3. The retrieval uncertainty is evaluated using the simulated data from the sky radiometer in Sect. 4. In Sect. 5, the results of the application of MRI v2 to the measurements at Tsukuba, Japan, and at Praia, Cape Verde, are shown. The MRI v2 products are compared with the Skyrad v4.2 and v5 products and the aircraft in situ measurements. All the results are summarized in Sect. 6.
2.1 Observations at Tsukuba, Japan
Our newly developed method was applied to the measurements of the sky radiometer model POM-02 (Prede Co., Ltd., Tokyo, Japan) from February to October 2018 at the Meteorological Research Institute, Japan Meteorological Agency (36.05∘ N, 140.13∘ E; about 25 m a.s.l.) in Tsukuba, Japan, about 50 km northeast of Tokyo. This instrument measures solar direct irradiance and the angular distribution of the diffuse irradiances at the scattering angles of 2, 3, 4, 5, 7, 10, 15, 20, 25, 30, 40, 50, 60, 70, 80, 90, 100, 110, 120, 130, 140, 150, and 160∘ in the solar almucantar (ALM) or principal plane (PPL) geometries. The measurable maximum scattering angle depends on the solar zenith angle (θ0) and is 2θ0 for ALM geometry. The measurable scattering angle for PPL geometry is due to the motion range of the sky radiometer. For the comparison of the retrievals from the diffuse irradiances in the ALM and PPL geometries, we used a different observation schedule compared to the SKYNET standard one. The latter performs scanning in the ALM geometry every 10 min, while scanning in the PPL geometry is conducted only in the case that the solar zenith angle is less than 15∘. Our procedure performs a scan in the ALM and PPL geometries every 15 min regardless of the value of the solar zenith angle. The measured wavelengths are 315, 340, 380, 400, 500, 675, 870, 940, 1020, 1627, and 2200 nm, and their full width at half-maximum is 3±0.6 nm for near-ultraviolet wavelengths, 10±2.0 nm for visible wavelengths, and 20±4.0 nm for near-infrared wavelengths (Uchiyama et al., 2018a).
Our retrieval method uses the atmospheric transmittances (Td) and the diffuse radiance normalized by the direct irradiances (R). Td is obtained from the direct irradiance measurement (Vd) by giving the calibration constant (Fo):
where λ is the wavelength, Res is the sun–Earth distance in astronomical units, mo is the optical air mass, and τR, τA, and τG are the optical depths of Rayleigh scattering, aerosol extinction, and gas absorption, respectively. R is calculated by
where Vs is the diffuse irradiance measurement, Θ is the scattering angle, and ΔΩ is the solid view angle. The solid view angle is determined by scanning the distribution of radiation around the solar disk (Nakajima et al., 1996; Uchiyama et al., 2018b; Nakajima et al., 2020). The solid view angle of the sky radiometer is about at wavelengths from 315 to 1020 nm and about at wavelengths of 1627 and 2200 nm (Uchiyama et al., 2018b), and the corresponding field of view is 1.0 and 0.95∘, respectively. The diffuse radiance measurement is described as , and the multiplication by cancels the calibration constant included in Vs(λ) and Vd(λ) because the direct and diffuse irradiances are measured by the same sensor. Only diffuse radiance at scattering angles larger than 3∘ is used in MRI v2, since at the scattering angle of 2∘ abnormally large values were seen in the data. In addition, the diffuse radiances at 1627 and 2200 nm at scattering angles higher than 30∘ were removed because of the weak scattering of solar radiation and low sensitivity of the detector at 1627 and 2200 nm (Uchiyama et al., 2019).
The calibration constants at 340, 380, 400, 500, 675, 870, 940, 1020, 1627, and 2200 nm were transferred from our reference sky radiometer by side-by-side comparison. The reference sky radiometer was calibrated by the Langley method using observation data at the NOAA Mauna Loa observatory in Hawaii, USA (19.54∘ N, 155.58∘ W; 3397.0 m a.s.l.) (Uchiyama et al., 2014b, 2018a). The calibration constant at 315 nm was determined by accounting for the TO3 measured by the Brewer spectrophotometer at the Aerological Observatory, Japan Meteorological Agency, located next to the Meteorological Research Institute. The calibration procedure for 315 nm is described in Appendix A.
Completely clear-sky conditions are required for accurate retrievals. Therefore, in Sect. 5.1, we selected clear-sky conditions based on the method by Kudo et al. (2010). The method judges the clear-sky condition from the temporal variations of the surface solar irradiance measured by a co-located pyranometer.
The measurements of the surface solar irradiances at the Aerological Observatory under clear-sky conditions were used for verifying the simulated surface solar irradiances using the retrieved aerosol properties, PWV, and TO3. The Aeorological Observatory is a station of BSRN (Baseline Surface Radiation Network; Driemel et al., 2018). The solar direct and hemispheric diffuse irradiances are measured by a pyrheliometer (Kipp & Zonen CHP1) and pyranometer (Kipp & Zonen CMP22) with a shading ball in front of the sun. The global irradiances are obtained by the sum of the direct and hemispheric diffuse irradiance measurements. The pyrheliometer and pyranometer are regularly calibrated once every 5 years by the Japan Meteorological Agency and traceable to the WRR (World Radiometric Reference). The pyrheliometer and pyranometer used in this study were calibrated in January 2017 and July 2016, respectively. The BSRN measurement errors are 2 % for global, 0.5 % for direct, and 2 % for diffuse irradiance (McArthur, 2005).
2.2 SAVEX-D
The Sunphotometer Airborne Validation Experiment in Dust (SAVEX-D) was conducted in August 2015 at the Cape Verde archipelago (Estellés et al., 2018) in conjunction with two airborne campaigns: AERosol properties – Dust (AER-D) and Ice in Clouds Experiment – Dust (ICE-D) over the eastern tropical Atlantic. The main objective of SAVEX-D was the validation of the SKYNET and AERONET aerosol products in conditions dominated by Saharan dust with aircraft in situ measurements performed and integrated in the vertical. Two flights were successfully carried out under clear-sky conditions on 16 and 25 August near Praia (14.948∘ N, 23.483∘ W; 128 m a.s.l.) and Sal (16.733∘ N, 22.935∘ W; 60 m a.s.l.) islands at the Cape Verde archipelago, respectively. Saharan dust originating from Africa was observed during the two flights with AOD at 500 nm higher than 0.5 and 0.2, respectively. More details from the field campaigns were made available by Marenco et al. (2018) and Ryder et al. (2018).
A sky radiometer model POM-01 was deployed at Praia airport during SAVEX-D. We applied Skyrad MRI v2 to the sky radiometer data for the solar direct irradiances and the diffuse radiances in the ALM geometry at the wavelengths of 443, 500, 675, 870, and 1020 nm (Estellés et al., 2018). Note that even measurements at a non-standard wavelength of 443 nm can be processed by our algorithm, since wavelengths used in our retrieval method can be flexibly customized to the measurements. In this study, the VSD, RRI, IRI, SSA, and ASM of the MRI v2 products were compared with those derived from the in situ measurements (Ryder et al., 2018). The details of the aircraft in situ measurements and methods to derive the aerosol physical and optical properties were described in Ryder et al. (2018).
3.1 Retrieval of aerosols, precipitable water vapor, and total ozone
3.1.1 Inversion strategy
Our retrieval method is based on an optimal estimation technique similar to the one employed in the AERONET retrieval (Dubovik and King, 2000). The VSD, RRI, IRI, PWV, and TO3 are simultaneously optimized to all the measurements of the sky radiometer and all the a priori constraints. The best solution is obtained by minimizing the objective function,
where x is a state vector to be optimized, the vector yobs represents measurements, the vector y(x) represents the simulations by the forward model corresponding to yobs, W2 is the covariance matrix of y, the vector ya(x) is an a priori constraint for x, and Wa is an associated covariance matrix. The minimization of f(x) is conducted with the algorithm developed by Kudo et al. (2016). A logarithmic transformation is applied to x and y. The minimum of f(x) in the log (x)-space is searched by the iteration of , where vector d is determined by the Gauss–Newton method, and a scalar α is determined by the line search with the Armijo rule. The details of the measurements (yobs) and state vector (x) are described in Sect. 3.1.2. The forward model (y(x)) is introduced in Sect. 3.1.3. The a priori constraint (ya(x)) is described in Sect. 3.1.4. Skyrad v4.2–v5 and MRI v1 also employ the optimal estimation technique using a similar cost function as in Eq. (4), but a priori constraints are different. This is also described in Sect. 3.1.4. The Gauss–Newton method used for the minimization of Eq. (4) is an iterative method and requires an initial value of x. We describe the initial value and final outputs in Sect. 3.1.5.
3.1.2 Measurement and state vectors
The yobs comprises transmittances at the wavelengths of 315, 340, 380, 400, 500, 675, 870, 940, 1020, 1627, and 2200 nm and the normalized diffuse radiances at scattering angles larger than 3∘ in the ALM or PPL geometries. Note that the wavelengths and scattering angles used in our method can be arbitrarily selected. For example, we used the wavelengths of 443, 500, 675, 870, and 1020 nm in Sect. 5.2.
Similarly to the retrieval methods of Dubovik and King (2000) and Kobayashi et al. (2010), the covariance matrix W2 of Eq. (4) was assumed to be diagonal, and the values were given by the measurement errors of the transmittance and normalized diffuse radiance. The measurement error of the transmittance mainly depends on the uncertainty of the calibration constant. Uchiyama et al. (2018a) estimate the error of the calibration constant determined by the Langley method using observation data at the NOAA Mauna Loa Observatory to be from 0.2 % to 1.3 %, and the error due to the transfer of the calibration constant from the reference instrument by the side-by-side comparison was from 0.1 % to 0.5 %. Therefore, we assumed the value of 2 % as the measurement error of the transmittances at all the wavelengths. The measurement errors of normalized diffuse radiances are defined as 5 % in the work of Kobayashi et al. (2006). We also employed the same value, but we introduced a dynamic weight factor depending on the AOD as follows:
where τA(λ) is the AOD at wavelength λ. This factor increases with a decrease in AOD and takes into account the fact that the absolute value of the diffuse radiance, as well as the signal-to-noise ratio, decreases with decreasing AOD. In actual measurements, the angular distribution of the diffuse radiances at 1627 and 2200 nm has unnatural oscillations with scattering angles in the cases of low AOD. This is due to the low signal-to-noise ratio of the detector at 1627 and 2200 nm (Uchiyama et al., 2019). When τA(λ) is more than 0.3, the value of W is 5 %. The value of 0.3 was empirically determined through many trials by applying different values of τA(λ) to the measurements at Tsukuba.
The components of x are the PWV, TO3, RRI, and IRI at 315, 340, 380, 400, 500, 675, 870, 940, 1020, 1627, and 2200 nm, as well as the parameters describing VSD. We assumed that the VSD consists of spherical and non-spherical particles and is expressed as the combination of 20 lognormal distributions in the range of the particle radius from 0.03 to 30.0 µm:
where r is the particle radius, V(r) is volume, and Ci, rm,i, si, and εi are the maximum volume, center radius, width, and volume ratio of the spherical particle to the sum of spherical and non-spherical particles for each lognormal distribution, respectively. The first term of Eq. (7) refers to spherical particles and the second term to non-spherical particles. rlm is a radius to separate into the fine and coarse modes. It is defined as the radius at the local minimum of the and is determined at every iterative step of in the minimization process of f(x). We assumed that the fine mode comprises only spherical particles, and the coarse mode is a mixture of non-spherical and spherical particles with a ratio of ε. The optimized parameters of the size distribution are Ci and ε. rm,i is fixed by the radius that separates the range of 0.03 and 30 µm at log-spaced intervals, ln Δr. The si is also fixed by . The value of 1.65 is empirically selected from the range of si that satisfies the following two conditions. The first condition determines the maximum value of si. The observed width of the fine mode of the VSD is smaller than that of the coarse mode and is about 0.4 (Dubovik et al., 2002). Since we express the VSD as the combination of the lognormal distributions (Eq. 6), the si should be smaller than 0.4. The second condition is the minimum value of si. The at the middle radius of two lognormal distributions, , should be larger than . If not, the shape of has unnatural oscillations. Hence, the si should be larger than , where 2.35si is the full width at half-maximum of the lognormal distribution.
The admitted radii of the VSD range from 0.03 to 30 µm in MRI v2. However, the radius range of the previous SKYNET retrieval methods is from 0.01 to 20.0 µm. The radius range used in the AERONET retrieval is from 0.05 to 15 µm. We investigated the radius range that can actually be estimated from all the sky radiometer data by a similar technique as in Tonna et al. (1995). Figure A2 shows the Mie kernel functions of scattering and extinction for wavelengths from 315 to 2200 nm and scattering angles from 2 to 120∘. We can see that sky radiometer measurements carry information on the VSD in the radius range from approximately 0.02 to 30 µm. When we limit the scattering angle range from 3 to 60∘ and the wavelength range from 340 to 1020 nm, the radius range that can be retrieved is roughly from 0.03 to 10 µm. We might retrieve giant particles around 20 µm from diffuse radiances at the wavelengths of 1627 and 2200 nm at a scattering angle of 2∘. In practice, the measurement errors of the diffuse radiances at the scattering angle of 2∘ are too large for almost all wavelengths. However, we extended the retrieval range of the size distribution to the radius of 30 µm for the following reason. The size distribution up to 20 µm can be retrieved using measurements at 1627 and 2200 nm at the scattering angle of 3∘. Since we constrain the size distribution at both ends of the radius range to low values by the smoothness constraint of Eq. (10), the size distribution at radii larger than 20 µm is necessary. In addition, we might be able to use the measurements at a scattering angle of 2∘ in the future.
3.1.3 Forward modeling
The forward model y(x) calculates the transmittances and the normalized diffuse radiances from x. The aerosol extinction and scattering coefficients, as well as the phase function for the spherical particles, are calculated by the Mie theory. For the non-spherical particles, we employed the optical properties of the randomly oriented spheroids with a fixed aspect ratio distribution, which is optimized to the laboratory measurement of mineral dust (feldspar sample) phase matrices (Dubovik et al., 2006). The vertical profile of aerosols can be customized, but at this first stage it is assumed to be constant from the surface to the altitude of 2 km.
The gaseous absorption coefficients for water vapor and ozone are calculated by the correlated k-distribution (CKD) method according to the inputs of the PWV and TO3. The data table for the CKD method is developed by Sekiguchi and Nakajima (2008) using the HITRAN 2004 database. The vertical profile of ozone is given from the 1976 version of the US standard atmosphere. The vertical profiles of water vapor, temperature, and pressure are also given from the US 1976 standard atmosphere, but we can optionally select other auxiliary data. For example, the daily measurements of the radiosonde launched at 00:00 UTC at the Aerological Observatory were used in Sect. 5.1, while the US 1976 standard atmosphere was used in Sect. 5.2. Other than water vapor and ozone, the gaseous absorption of CO2, N2O, CO, CH4, and O2 is considered in the forward model. Their vertical profiles were given from the standard atmosphere, and their absorption coefficients were calculated by the CKD method.
The solar direct irradiances and the diffuse radiances in the ALM and PPL geometries are calculated by the radiative transfer model, RSTAR (Nakajima and Tanaka, 1986, 1988). The diffuse radiances were calculated using the IMS method (Nakajima and Tanaka, 1988), which is an approximation method to simulate the diffuse radiances near the sun. For only the calculation at wavelengths of 315, 940, and 2200 nm, the response function of the interference filter of the sky radiometer was taken into account because the spectral changes in the absorption of ozone and water vapor within the filter bandwidth cannot be ignored. We divided the 315 and 940 nm bands into five sub-bands and the 2200 nm band into three sub-bands. For other wavelengths, the monochromatic calculation was assumed. We also incorporated the vector radiative transfer model, PSTAR (Ota et al., 2010), as an alternative to the scalar model RSTAR. The two radiative transfer codes can be easily switched. The option of the PSTAR will be useful if polarization measurements, such as in AERONET (Holben et al., 1998), are introduced to the sky radiometer in the future. Furthermore, we parallelized the codes of RSTAR and PSTAR using OpenMP because radiative transfer calculations at the wavelengths from 315 to 2200 nm are time-consuming.
3.1.4 A priori constraints
A smoothness constraint for the refractive index and size distribution is necessary for a stable retrieval (Dubovik and King, 2000). We constrained the spectral dependencies of the RRI and IRI by limiting the values of the following first derivatives of the refractive index with the wavelength
where n and k are the RRI and IRI at the wavelength λ, and Nλ is the number of wavelengths. For the VSD, the second derivatives of Ci (Eq. 6) with respect to the particle radius are introduced by
where C0 and C21 are the volumes outside the radius range from 0.03 to 30.0 µm, and and are the initial values of Ci in the iteration of the Gauss–Newton method (Sect. 3.1.5). The small values of C0 and C21 prevent C1 and C20 from being abnormal values. The denominator of the second derivative was ignored because the rm,i has an equal interval.
Skyrad v4.2–v5 and MRI v1 use a similar cost function as in Eq. (4), but a priori constraints are different. Skyrad v4.2 and MRI v1 employ similar smoothness constraints for the RRI, IRI, and VSD, but Skyrad v5 does not use them. MRI v1 and Skyrad v5 employ a priori estimates for the RRI, IRI, and VSD. This restricts the range of the solution but is useful to eliminate unrealistic values. MRI v2 does not use a priori estimates, similarly to the AERONET algorithm, which successfully retrieves the RRI, IRI, and VSD without a priori estimates (Dubovik and King, 2000).
The covariance matrix in Eq. (4) determines the strength of the smoothness constraints. We assumed that the matrix is diagonal, and the values of each element corresponding to the RRI, IRI, and VSD are set empirically. The typical ranges of the RRI and IRI for tropospheric aerosols are from 1.4 to 1.6 and from 0.005 to 0.05, respectively, at the visible and near-infrared wavelengths (Dubovik and King, 2000). We therefore defined the values of as
The typical VSD is expressed by a bimodal lognormal distribution. The AERONET retrievals obtained in different aerosol conditions around the world (Dubovik et al., 2002) show that the width of the lognormal distribution for the fine mode is about half of that for the coarse mode. This suggests that the second derivative of the fine mode with respect to the particle radius is also larger than that of the coarse mode. Therefore, different values of Wa were given to the fine and coarse modes:
These values were empirically determined based on the work of Dubovik and King (2000) and through numerous trial-and-error processes using the measurements of the SAVEX-D campaign.
3.1.5 Initial values and outputs
The objective function (Eq. 4) is minimized by the iteration of the Gauss–Newton method. The iterative method requires the initial value of x. The initial values of the RRI and IRI are given as 1.50–0.005i at all the wavelengths. The ratio of the spherical particles in the coarse mode, ε, is 0.1. The volume of each lognormal distribution, Ci, is given from the size distribution created by the following procedure.
-
AOD at weak gas absorption wavelengths of 340, 380, 400, 500, 675, 870, and 1020 nm is directly calculated from the direct irradiances.
-
Consider a bimodal size distribution with fixed mode radii of 0.1 and 1.0 µm and widths of 0.4 and 0.8 for the fine and coarse modes, respectively.
-
The volume ratio between the fine and coarse modes is fitted to an Ångström exponent obtained from the AOD in step (1).
-
The total volume of the size distribution is fitted to the AOD at 500 nm.
After finding the best solution of x, the VSD, RRI, IRI, AOD, SSA, ASM, and phase function are provided as output. In addition, we calculate the LIR and DEP because these are important optical properties in synergistic analyses using both the sky radiometer and lidar observations.
The objective function of Eq. (4) is a measure of how much the x is optimized to the yobs. However, the objective function includes the terms of the a priori constraints and does not imply a fitting to only yobs. Therefore, we output another measure of the fitness,
where Ny is the number of elements in the vector yobs. Equation (14) is the mean of the differences between the sky radiometer measurements and ones calculated from the x by the forward model, weighted by their respective experimental uncertainties. We can filter out the retrievals that are not well optimized to the measurements by giving a threshold to fobs(x). We used the threshold of 1.0, and the retrieval results that did not satisfy the condition of fobs(x)>1.0 were discarded in this study. This means that almost all the elements of the vector y(x) lie in the range of yobs±W.
3.2 Surface solar irradiance
In the study of aerosol–radiation interaction, it is important to ensure consistency between the observed and simulated surface solar irradiances. For this radiative closure study, the global, direct, and diffuse components of the surface solar irradiance in the wavelength region from 300 to 3000 nm were calculated from the retrieved aerosol optical properties, PWV, and TO3, and we compared them with those observed at the Aerological Observatory in Sect. 5.1.
The surface solar irradiances were calculated by our developed radiative transfer model (Asano and Shiobara, 1989; Nishizawa et al., 2004; Kudo et al., 2011). Note that this model is different from RSTAR and PSTAR used in the forward model of MRI v2. The solar spectrum between 300 and 3000 nm was divided into 54 intervals. Gaseous absorption by water vapor, carbon dioxide, oxygen, and ozone was calculated by the CKD method. The inputs to the radiative transfer model are AOD, SSA, and phase function at 54 wavelengths from 300 to 3000 nm. These were calculated from the retrieved VSD, RRI, and IRI. The RRI and IRI at wavelengths between 315 and 2200 nm were interpolated from the retrieved RRI and IRI in the log–log space. For wavelengths less than 315 nm and more than 2200 nm, the retrieved RRI and IRI at 315 and 2200 nm were used. A main advantage of MRI v2 is that the aerosol optical properties are retrieved in a wavelength range covering almost the whole shortwave band.
4.1 Radiometric uncertainties
The uncertainties of the MRI v2 retrieval products were evaluated using the simulations of the sky radiometer measurements. The simulation was conducted for the three aerosol models of water-soluble, dust, and biomass burning (Table 1) used in the accuracy assessment of the AERONET retrieval (Dubovik et al., 2000). In the simulation, normally distributed random errors were added to direct irradiances, diffuse radiances, and surface albedo. The standard deviations used in generating the random errors are described in Table 2. The AOD, solar zenith angle, PWV, and TO3 used in the simulation were randomly selected from the ranges in Table 1. We conducted 200 simulations for each of three aerosol models and two scanning patterns of the ALM and PPL geometries. Our retrieval method was applied to a total of 1200 simulation datasets. In 98 out of the 1200 results, fobs(x) was more than the threshold of 1.0. When the perturbations in the simulation data were too large, our retrieval method was not able to optimize the parameters to the simulation data. The 98 retrievals were not included in the following results.
Table 1Configuration of the simulation in the assessment of retrieval uncertainties.
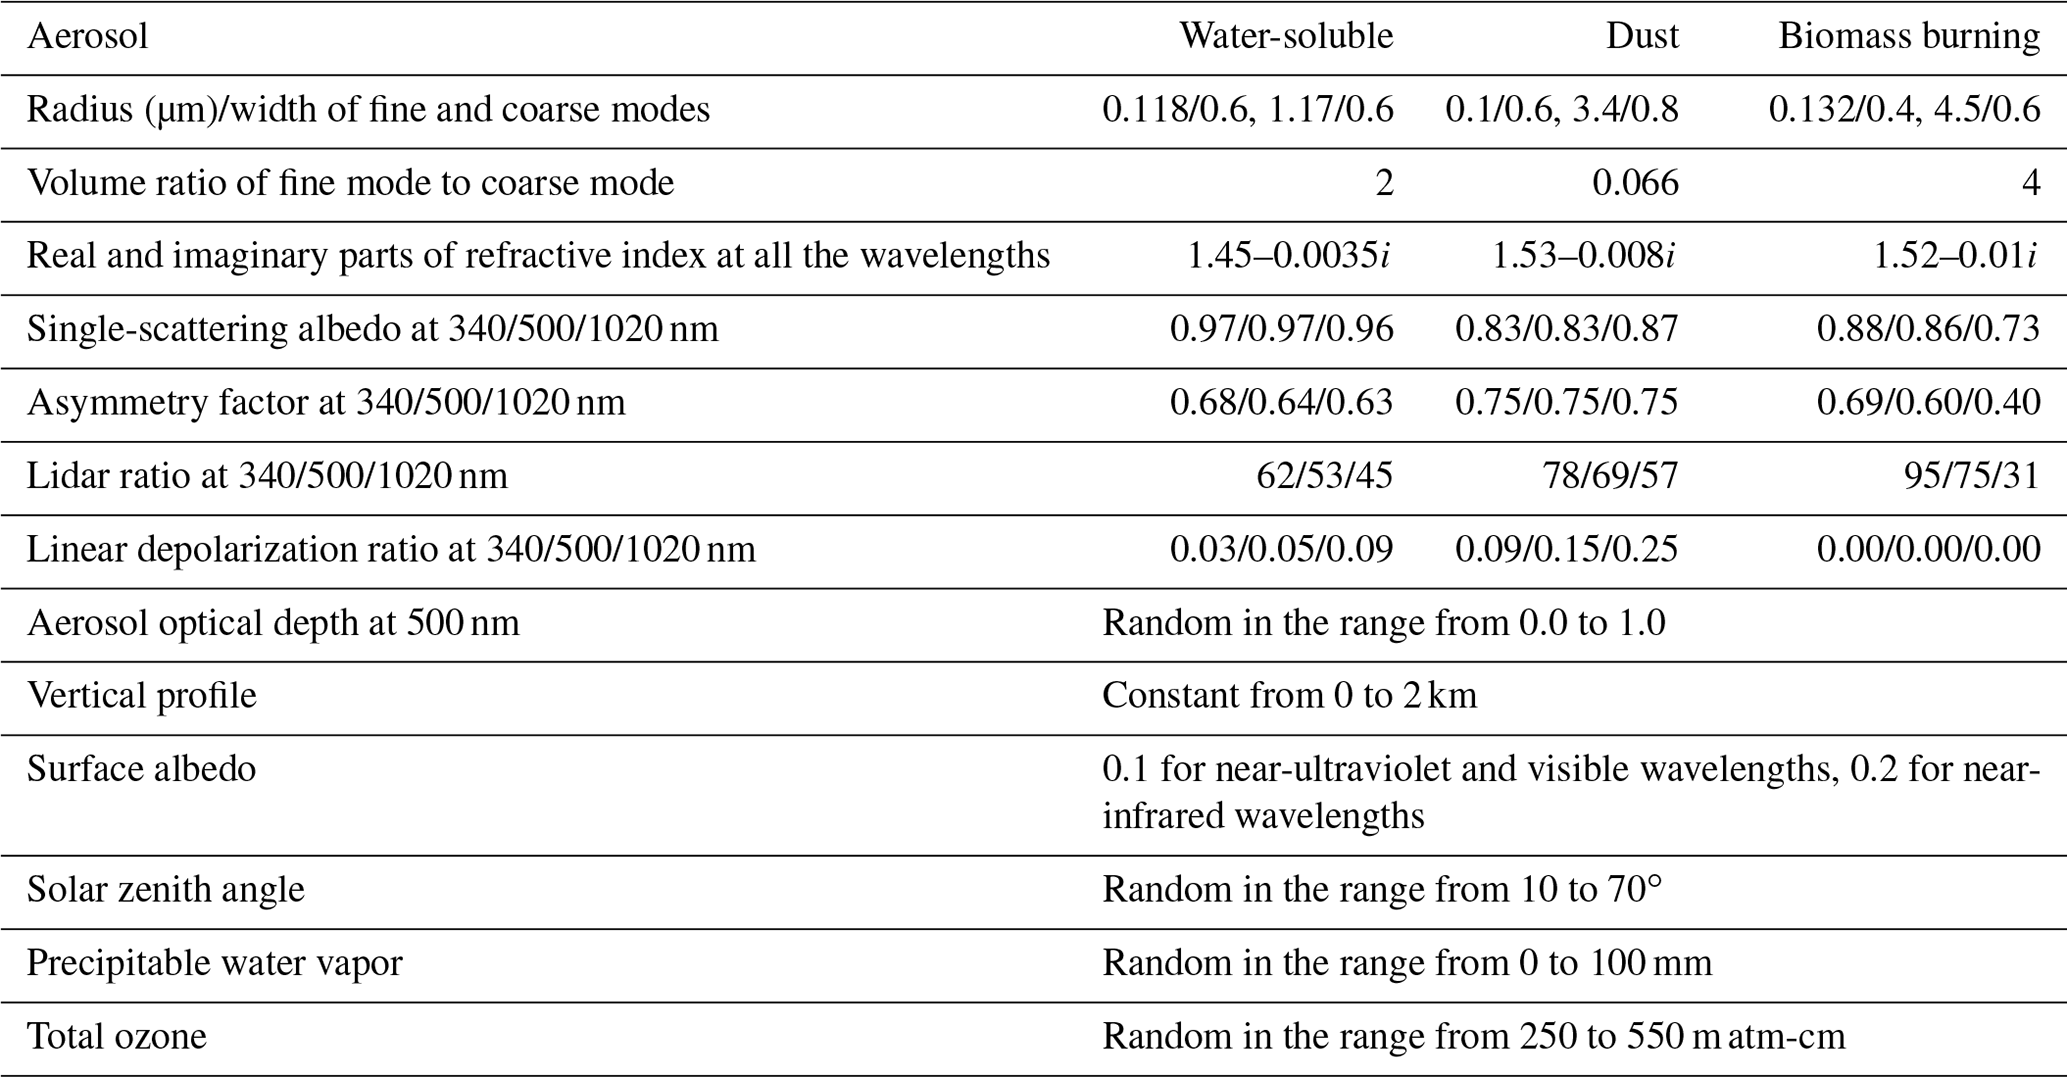
The size distribution and refractive index for water-soluble, dust, and biomass burning are cited from Dubovik et al. (2000). Depolarization ratios of the biomass burning model are not zero but less than 0.001.
Table 2Random errors of the simulation in the assessment of retrieval uncertainties.

The standard deviations for direct irradiance and diffuse radiances were determined from the works of Uchiyama et al. (2018a) and Kobayashi et al. (2006), respectively.
Figure 1 shows the dependencies of the retrieval errors of SSA on the solar zenith angle and AOD. In this study, we define the retrieval error as a deviation of the retrieved value from the simulated value for each individual simulation. When the solar zenith angle is small, the range of scattering angle for the diffuse radiance measurements is small, and the available information on the phase function from the diffuse radiances becomes smaller. We expected that this would affect the retrieval of aerosols, but no clear dependency of the retrieval errors of the SSA on the solar zenith angle is seen in Fig. 1. The retrieval errors of the other aerosol physical and optical properties, PWV, and TO3 also did not show any apparent dependencies on the solar zenith angle.
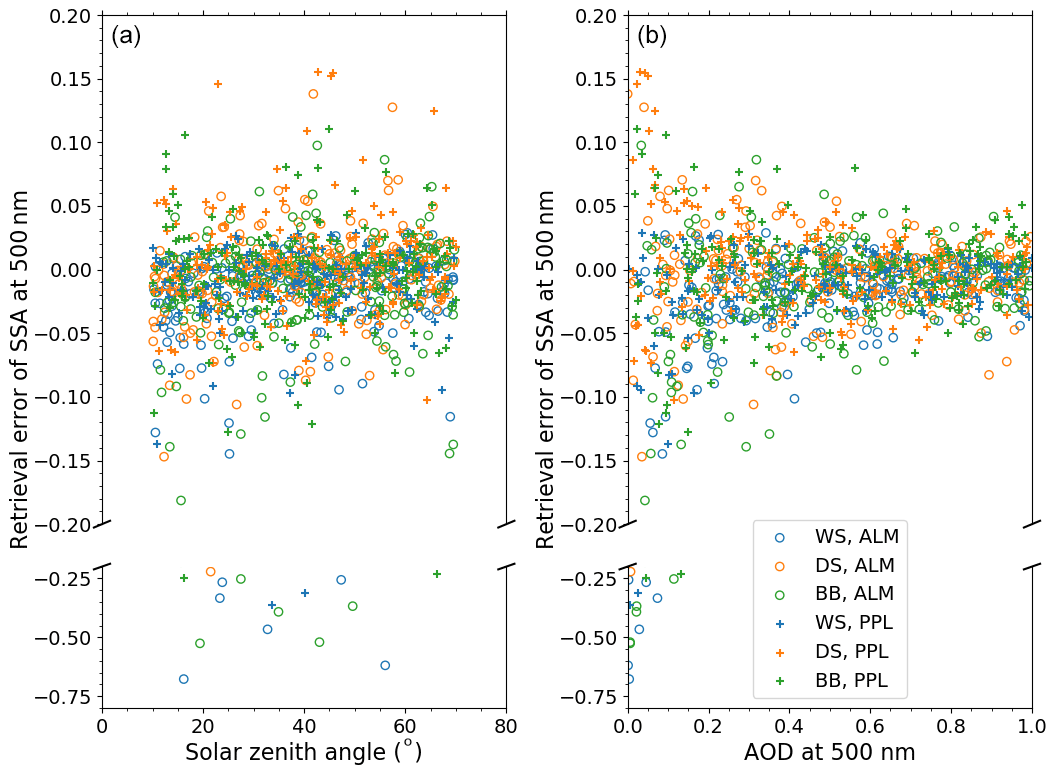
Figure 1Dependencies of the retrieval errors of the single-scattering albedo at 500 nm on the solar zenith angle (a) and the aerosol optical depth at 500 nm (b). WS, DS, and BB denote the water-soluble (blue), dust (orange), and biomass burning (green) models, respectively. ALM and PPL denote the scanning patterns of the almucantar (circle) and principal plane (plus) geometries, respectively.
Small AODs make it difficult to retrieve the refractive index because the diffuse radiances are less sensitive to the refractive index in this case (Dubovik et al., 2000). The retrieval errors of the SSA were obviously greater when the AOD was smaller than 0.2 (Fig. 1). This dependence on AOD was also seen in the retrieval errors of the other aerosol physical and optical properties.
The means (bias) and standard deviations (uncertainty) for the retrieval errors of the aerosol physical and optical properties, PWV, and TO3 are summarized in Table 3. Note that the AOD in Table 3 is calculated from the retrieved VSD, RRI, and IRI and is not directly obtained from the direct solar irradiance. Overall, both the biases and uncertainties of the retrieval errors were large in the case of an AOD less than 0.2. In particular, we note a positive bias in the IRI and an uncertainty of more than 100 %. This bias affected the SSA and LIR, which depend on the IRI. The SSA showed a negative bias and the LIR a positive one. Even if the AOD at 500 nm was more than 0.2, the retrievals at the near-infrared wavelengths were biased in the results of the IRI, SSA, and LIR of the water-soluble and biomass burning models (bias +179 % and +59 %, respectively, with an uncertainty of ±400 % to 450 %). This is because the AOD of the two aerosol models is low at near-infrared wavelengths. Conversely, the retrieval errors at the near-infrared wavelengths for the dust model were smaller (bias +3 %, uncertainty 30 %). The retrieval errors of the DEP for the biomass burning also were more than 100 %. The reason for the large retrieval error is that the simulated value of the DEP is near zero.

Figure 2 illustrates the retrieved VSD for three aerosol models. The VSD is normalized to the total volume. The shaded area shows the radius range around the fine- and coarse-mode peaks (mode radius ± 1 standard deviation). The bias and uncertainty of the VSD in Table 3 are calculated from the results in the shaded areas. The biases of the retrieval errors around the fine- and coarse-mode peaks were less than 22 % (Table 3), but the uncertainties were not small (Fig. 2). The retrieval errors were also large outside the shaded areas (Fig. 2). The retrieval error at a radius larger than the coarse-mode radius + 1 standard deviation was more than 100 % for water-soluble and biomass burning models. However, the retrieval error of the dust model was small at % for AOD 0.2 and % for AOD >0.2. The VSD at radii up to 30 µm was retrieved well in the dust case. In the result of the ALM geometry for the dust model, there is a single subset with a high fine mode and low coarse mode. Since the AOD at 500 nm used in this simulation was too small at , the retrieval failed.
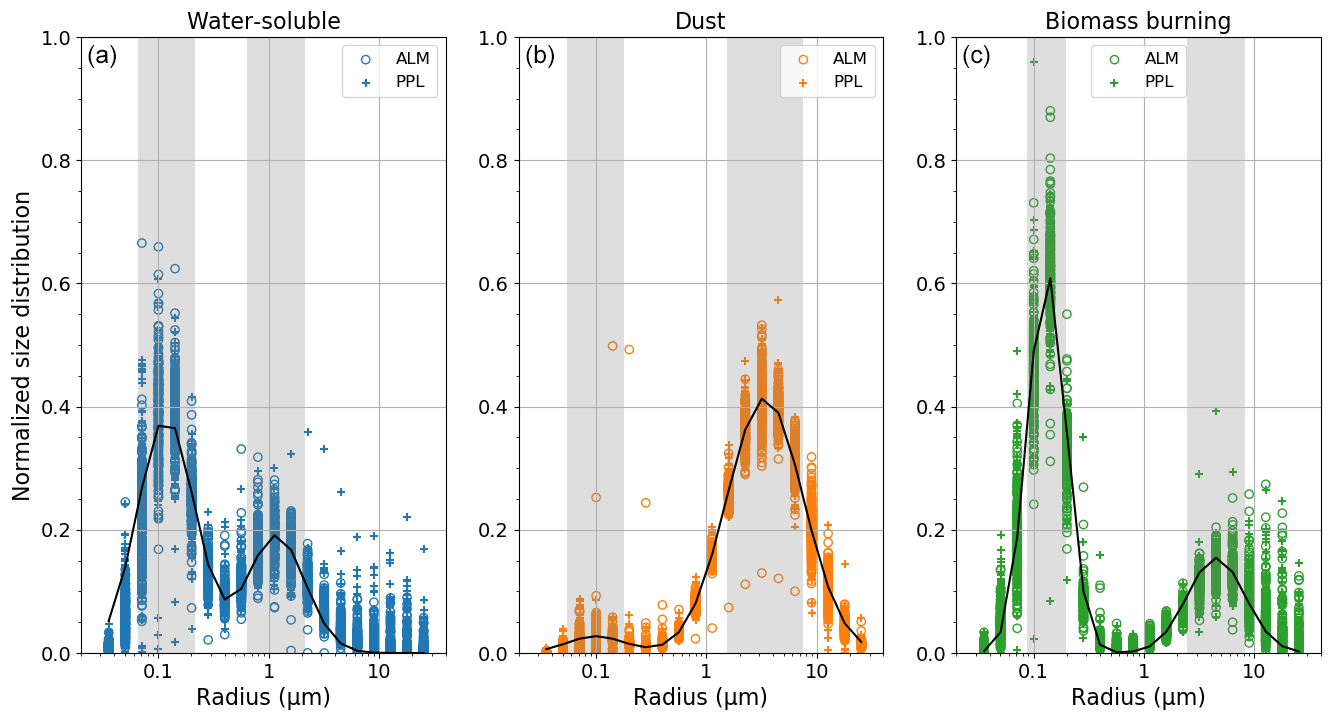
Figure 2The retrieved (circle and plus) and simulated (solid line) volume size distributions for water-soluble (left, blue), dust (center, orange), and biomass burning (right, green). The size distribution is normalized to the total volume. Circle and plus symbols indicate that the scanning patterns of simulated data are the almucantar (ALM) and principal plane (PPL) geometries, respectively. The shaded area is the range of the radius around the peak of the fine and coarse modes. The range of the radius around the peak is defined as mode radius ± 1 standard deviation (see Table 1).
Overall, the retrieval results at the near-ultraviolet and visible wavelengths were good in the case that the AOD at 500 nm was larger than 0.2: the absolute values of biases + uncertainties in the retrieval products were less than 0.04 for AOD, less than 0.05 for RRI, less than 130 % for IRI, less than 50 % for VSD, less than 0.05 for SSA, less than 0.02 for ASM, less than 20 for LIR, and less than 60 % for DEP. Regardless of the AOD, the retrieval errors of the PWV and TO3 were less than 8 mm and 42 m atm-cm, respectively.
4.2 Uncertainty in the aerosol vertical profile
In the previous numerical experiments, we investigated the differences of the retrieval errors between the ALM and PPL geometries without finding clear differences. One reason is that, so far, we have not considered the error from the aerosol vertical profile in the retrieval. The aerosol vertical profile affects the diffuse radiances in the PPL geometry (Torres et al., 2014; Momoi et al., 2020). Therefore, we now investigate the impacts of the aerosol vertical profile on the retrievals for the ALM and PPL geometries. For this purpose, we simulated the sky radiometer data for the dust and biomass burning models with different aerosol vertical profiles and conducted the retrieval with a fixed aerosol vertical profile from 0 to 2 km. Three patterns of the aerosol vertical profiles, constant from 0 to 2 km (P1), from 2 to 4 km (P2), and from 4 to 6 km (P3), were used in the simulation. The constant profile makes it easy to understand the influences of the aerosol layer altitude. Other parameters were set as follows: the aerosol optical depth at 500 nm was 0.5, the PWV was 30 mm, the TO3 was 350 m atm-cm, and the solar zenith angle was 45∘.
Table 4 summarizes the means for the retrieval errors of all the parameters, and Fig. 3 shows the retrieval errors of SSA and ASM. The impact of the aerosol vertical profile on the retrieval errors of the aerosol properties, PWV, and TO3 for the PPL geometry was larger than that for the ALM geometry. The retrieval errors for the PPL geometry obviously depend on the aerosol vertical profile. The retrieval errors of SSA for both the dust and biomass burning models were positive at wavelengths smaller than 870 nm and negative at wavelengths larger than 870 nm (Fig. 3). These positive and negative errors were related to the diffuse radiances. Figure 4 shows the mean ratio of the simulated diffuse radiances to those of P1 over the scattering angles. The mean ratios of P2 and P3 for the PPL geometry were more than 1.0 at wavelengths smaller than 870 nm. Only the mean ratios at 940 and 2200 nm, which have strong water vapor absorption, were less than 1.0. The mean ratios at 1020 and 1627 nm were about 1.0. The strong diffuse radiances of P2 and P3 at wavelengths smaller than 870 nm for the PPL geometry caused the underestimation of the IRI (Table 4) and the overestimation of the SSA (Fig. 3 and Table 4). The weak diffuse radiances of P2 and P3 at 940 and 2200 nm for the PPL geometry increased the IRI and decreased the SSA. The changes in the diffuse radiances at 1020 and 1627 nm are negligible, but the SSA at these wavelengths was underestimated (Fig. 3). This is because the combined effect of the increased IRI at 940 and 2200 nm and the smoothness constraint of the spectral change for the IRI increased the IRI at 1020 and 1627 nm. Consequently, the IRI at all near-infrared wavelengths was overestimated and the SSA was underestimated (Table 4). Figure 5 plots the ratio of the diffuse radiance to that of P1 at 340 and 940 nm. The strong diffuse radiances at wavelengths smaller than 870 nm for the PPL geometry in Fig. 4 were due to the large diffuse radiance at scattering angles more than 90∘. This increase in the diffuse radiances at backward angles became small at longer wavelengths and was negligible at 1020 and 2200 nm. The increase in the backward scattering of P2 and P3 for the PPL geometry affects the balance of the forward and backward scattering and leads to the decrease in the ASM and the increase in the RRI because, as predicted by the Mie theory, the ASM decreases with an increase in the RRI (Hansen and Travis, 1974). On the other hand, the ratio of the diffuse radiances at 940 nm was large at scattering angles smaller than 90∘ and was small at scattering angles larger than 90∘. This was also seen at 2200 nm. This feature and the smoothness constraint for the RRI caused the overestimation of the ASM and underestimation of the RRI at the near-infrared wavelengths (Fig. 3 and Table 4).
Table 4Means of the retrieval errors for the almucantar and principal plane geometries.
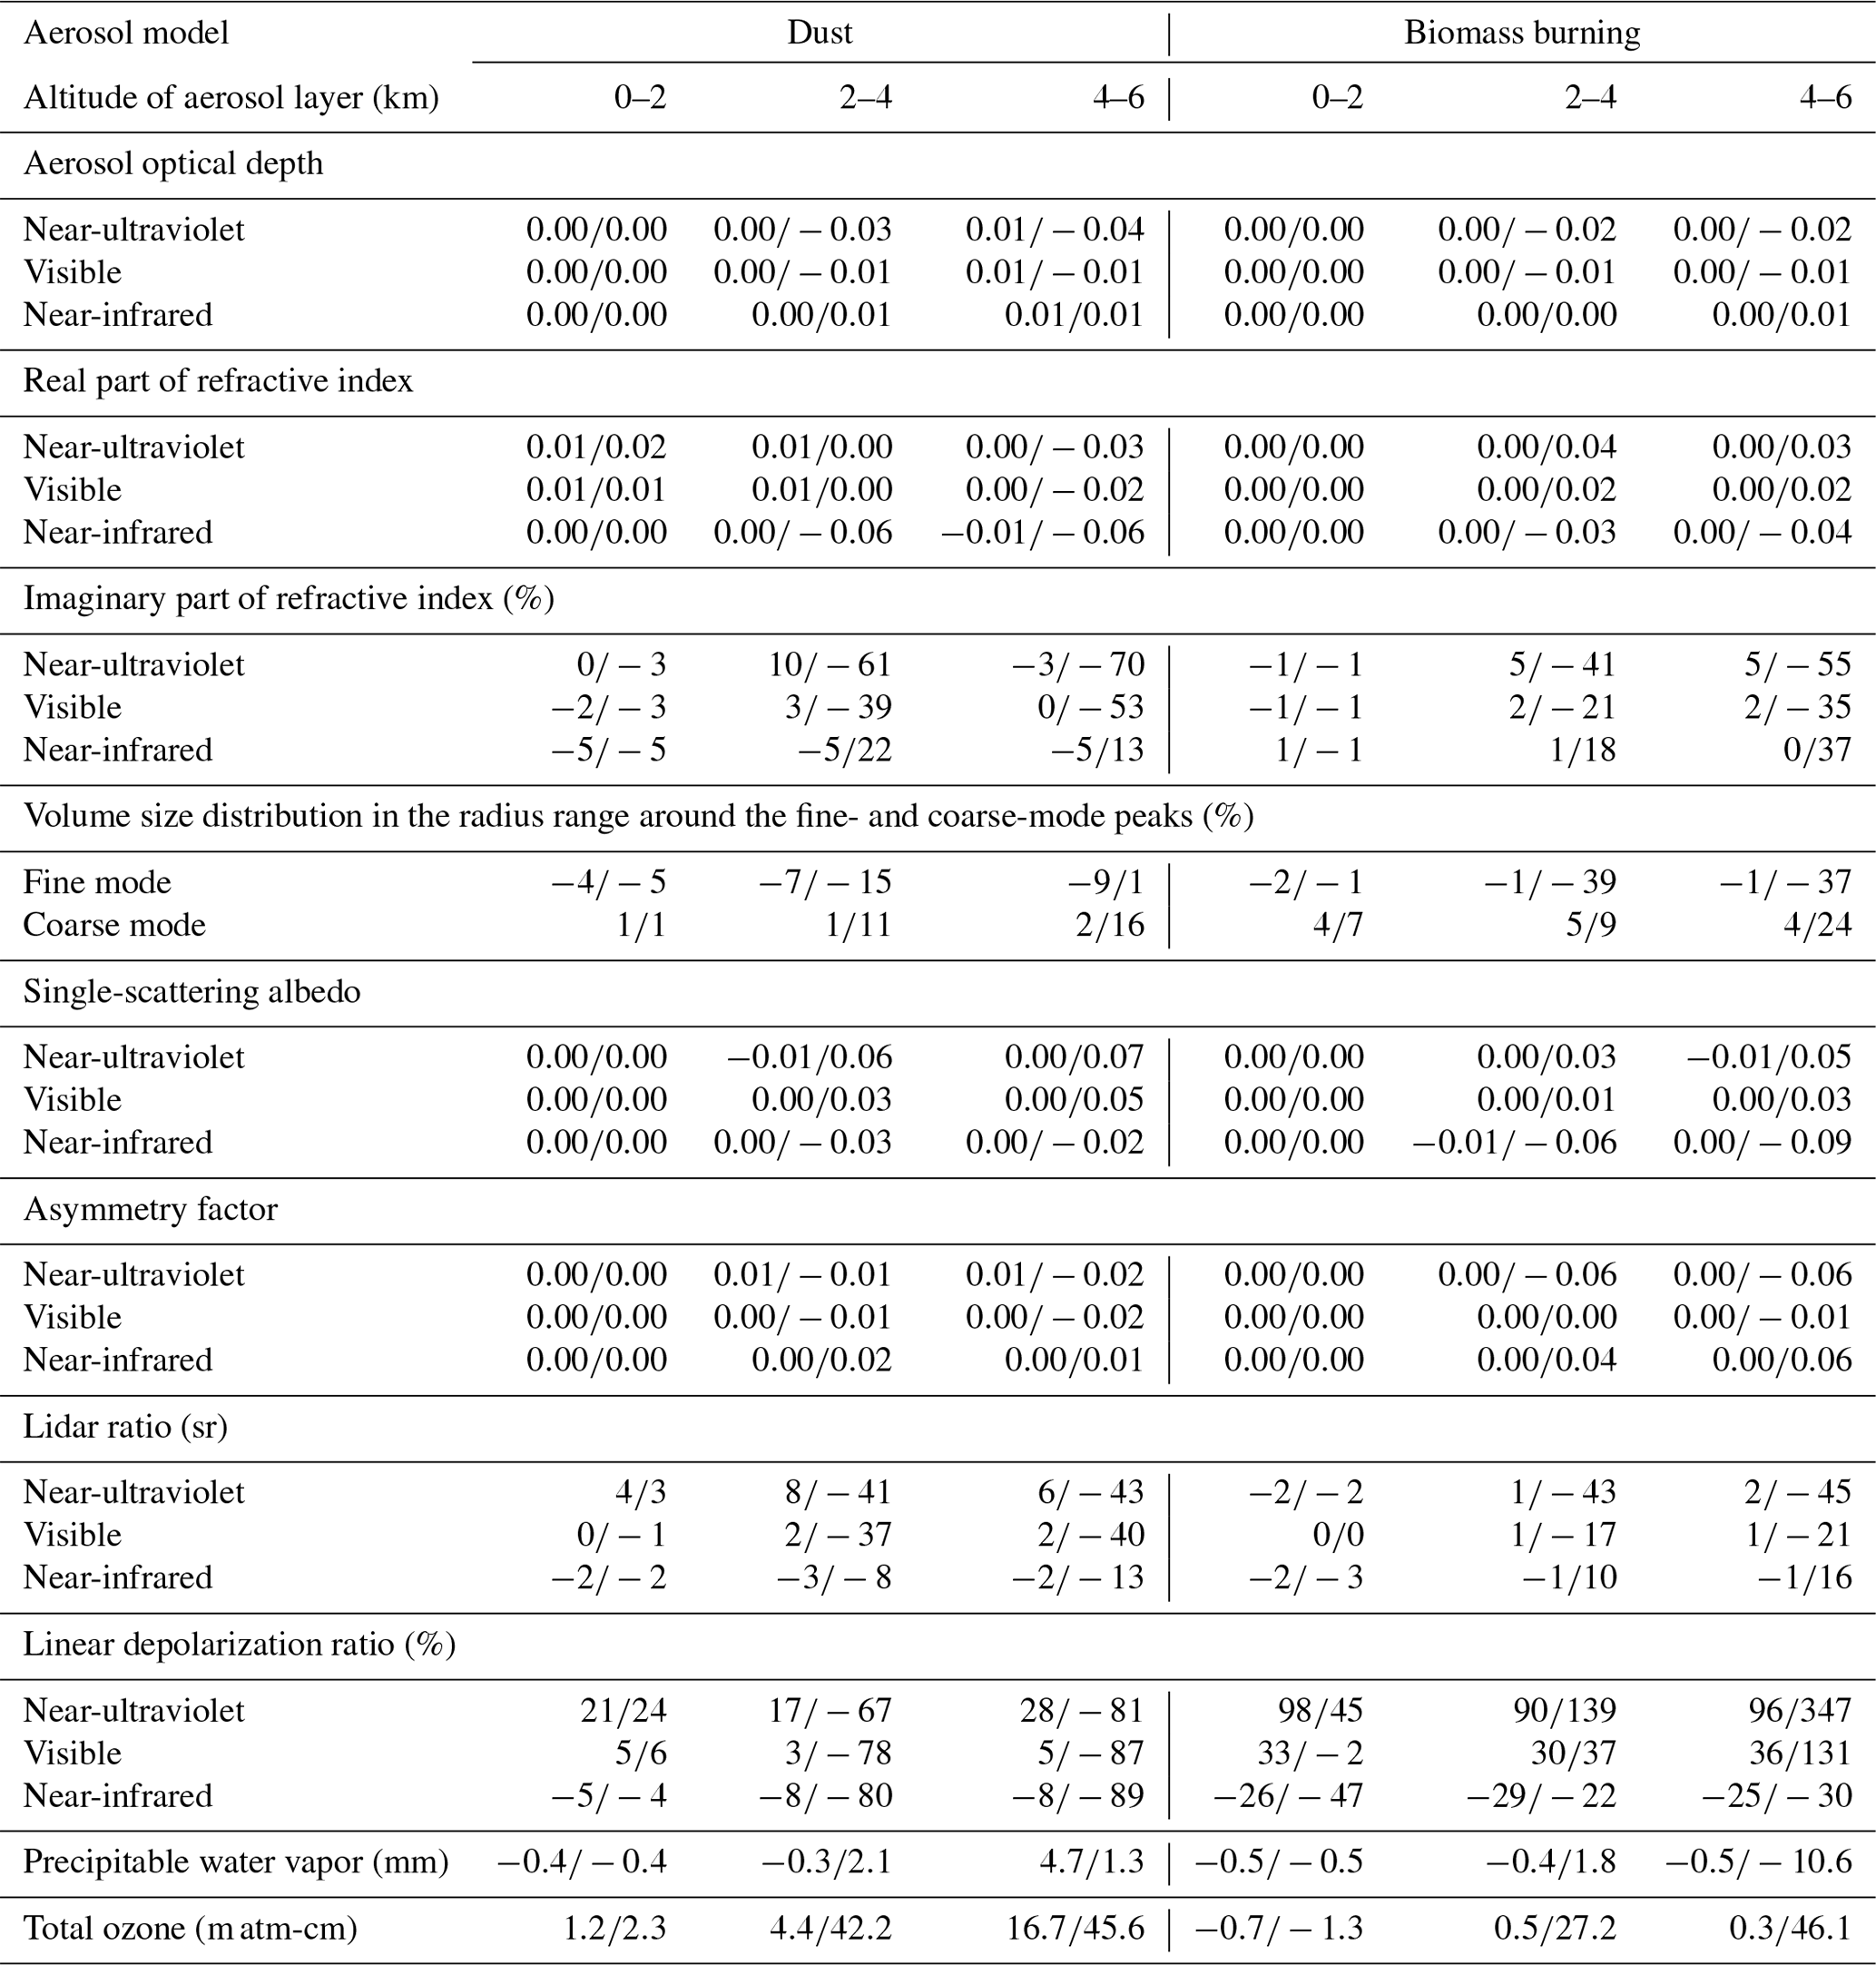
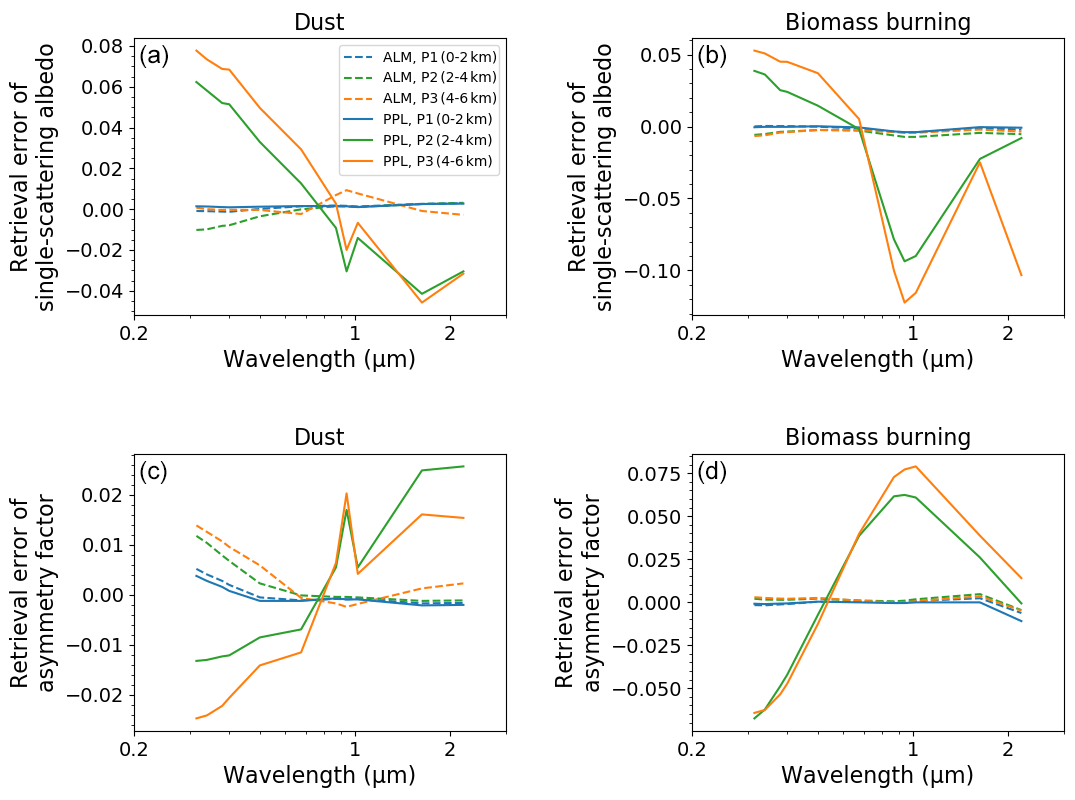
Figure 3Retrieval error of the single-scattering albedo (a, b) and asymmetry factor (c, d) from the simulation data for the dust (a, c) and biomass burning models (b, d) with different aerosol vertical profiles of 0 to 2 km (blue), 2 to 4 km (green), and 4 to 6 km (orange). The solid and dashed lines are the retrieval errors for the simulations data in the almucantar (ALM) and principal plane (PPL) geometries, respectively. Note that the y-axis ranges for dust and biomass burning differ in the plots.
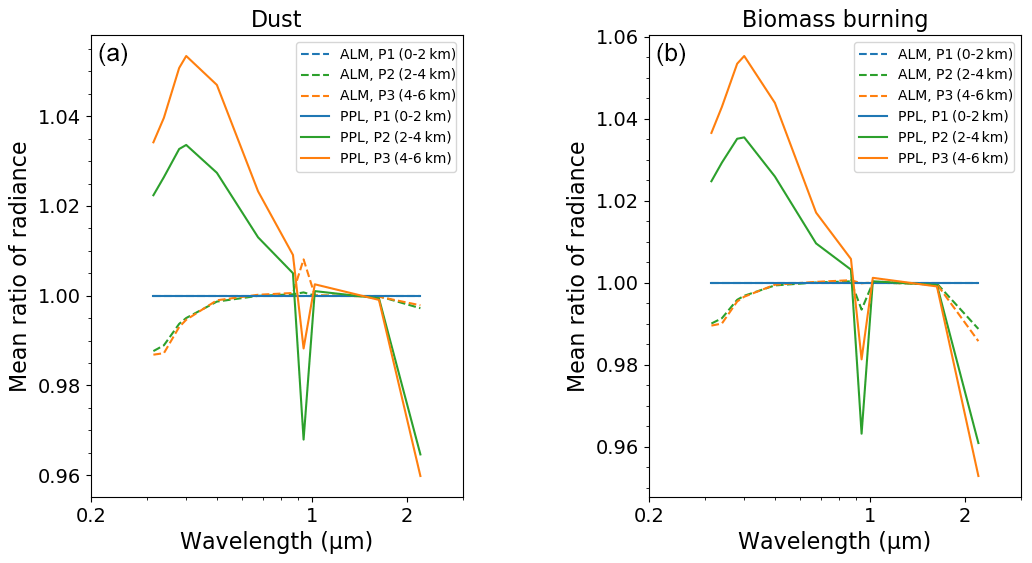
Figure 4Mean ratio of the simulated diffuse radiances over the scattering angle with aerosol vertical profiles of 0 to 2 km (blue), 2 to 4 km (green), and 4 to 6 km (orange) to those with the aerosol vertical profile of 0 to 2 km. The left and right panels are the simulations for the dust (a) and biomass burning (b) models, respectively. The solid and dashed lines are the simulations for the almucantar (ALM) and principal plane (PPL), respectively.
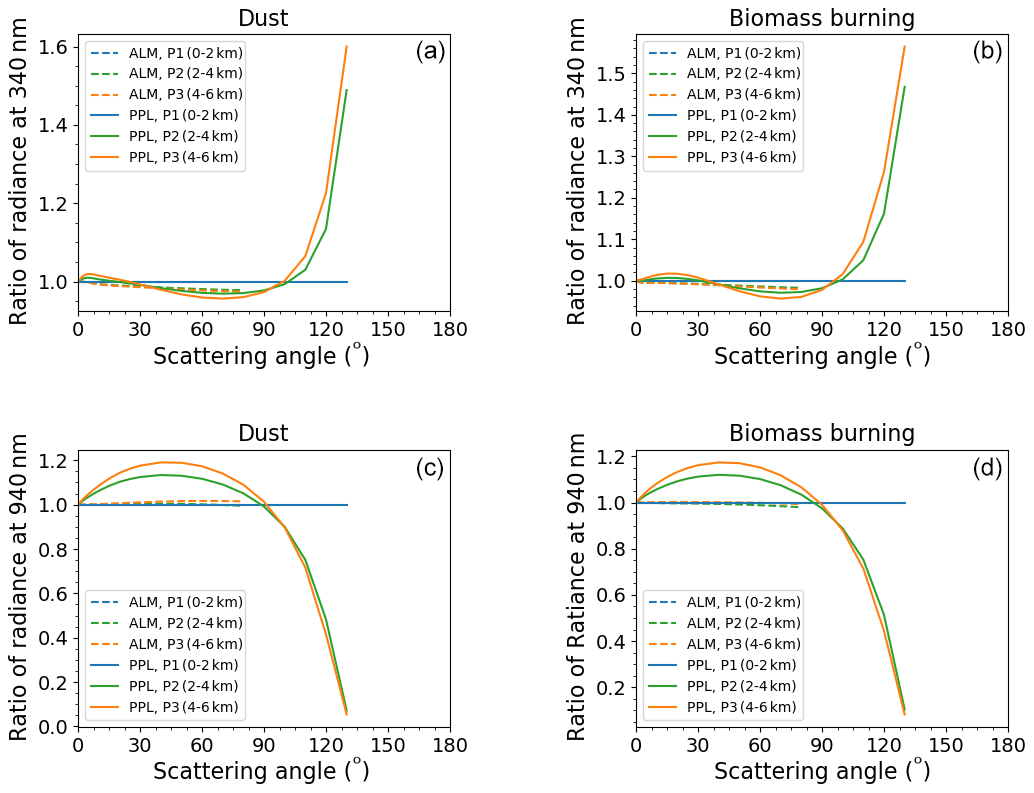
Figure 5Ratio of the simulated diffuse radiances at 340 nm (a, b) and 940 nm (c, d) with different aerosol vertical profiles of 0 to 2 km (blue), 2 to 4 km (green), and 4 to 6 km (orange) to those with an aerosol vertical profile of 0 to 2 km. The left and right panels are the simulations for the dust and biomass burning models, respectively. The solid and dashed lines are the simulations for the almucantar (ALM) and principal plane (PPL) geometries, respectively.
The above experiment suggests that the influence of the aerosol vertical profile cannot be ignored in the retrieval using the data for the PPL geometry. In practice, the aerosol vertical profile has large variability. The synergistic approach with lidar is a reasonable solution for this problem (e.g., Kudo et al., 2016).
5.1 Application to the measurements at Tsukuba
The sky radiometer data collected from February to October 2018 in Tsukuba were processed by MRI v2 and Skyrad v4.2 and v5 using the following five configurations.
-
ALM-SW. Aerosol physical and optical properties were retrieved from the measurements in the ALM geometry. To assess the sensitivity of the retrievals to the available measurements, a subset of the measuring wavelengths (i.e., only 340, 380, 400, 500, 675, 870, and 1020 nm) was chosen. The PWV and TO3 were not retrieved but were given from the measurements of the radiosonde at 00:00 UTC and the daily mean of the Brewer spectrophotometer observation.
-
PPL-SW. These are measurements in the PPL geometry with the same wavelength subset as in ALM-SW.
-
ALM-LW. Aerosol physical and optical properties, PWV, and TO3 were retrieved from the measurements in the ALM geometry. The complete set of data at all the wavelengths from 315 to 2200 nm was used.
-
PPL-LW. These are measurements in the PPL geometry using the full range of wavelengths.
-
V42. The same dataset as in ALM-SW was employed, but the retrieval method was Skyrad v4.2.
-
V5. The same dataset as in ALM-SW was employed, but the retrieval method was Skyrad v5.
The aerosol physical and optical properties, PWV, and TO3 of the five patterns were compared. In addition, the surface solar irradiance simulated using the retrieved quantities from MRI v2 were compared with the measurements.
We rejected 8.2 % of the data according to the quality control of Eq. (14) in the retrieval using the simulation data (Sect. 4.1), but the rejected data in the measurements under the clear-sky conditions in Tsukuba were 0.07 % for ALM-SW, 0.61 % for PPL-SW, 3.12 % for ALM-LW, and 4.37 % for PPL-LW.
5.1.1 Aerosols
Figure 6 illustrates the daily means of AOD, the Ångström exponent, RRI, IRI, SSA, ASM, LIR, and DEP. The wavelength is 500 nm. The AOD is calculated from the retrieved VSD, RRI, and IRI; therefore, it can be considered a metric of the degree of “internal closure” of the model itself. The Ångström exponent is calculated from a logarithmic fit from the AOD at the wavelengths of 340, 380, 400, 500, 675, 870, and 1020 nm. The AOD, ranging from 0.047 to 0.53, was larger in spring from March to May. The Ångström exponent ranged from 0.49 to 1.86, with lower values in spring. The large AOD and small Ångström exponent in spring can be explained by transport of dust from China and Mongolia (e.g., Kudo et al., 2010, 2018). The AOD and Ångström exponent with all configurations agreed well.
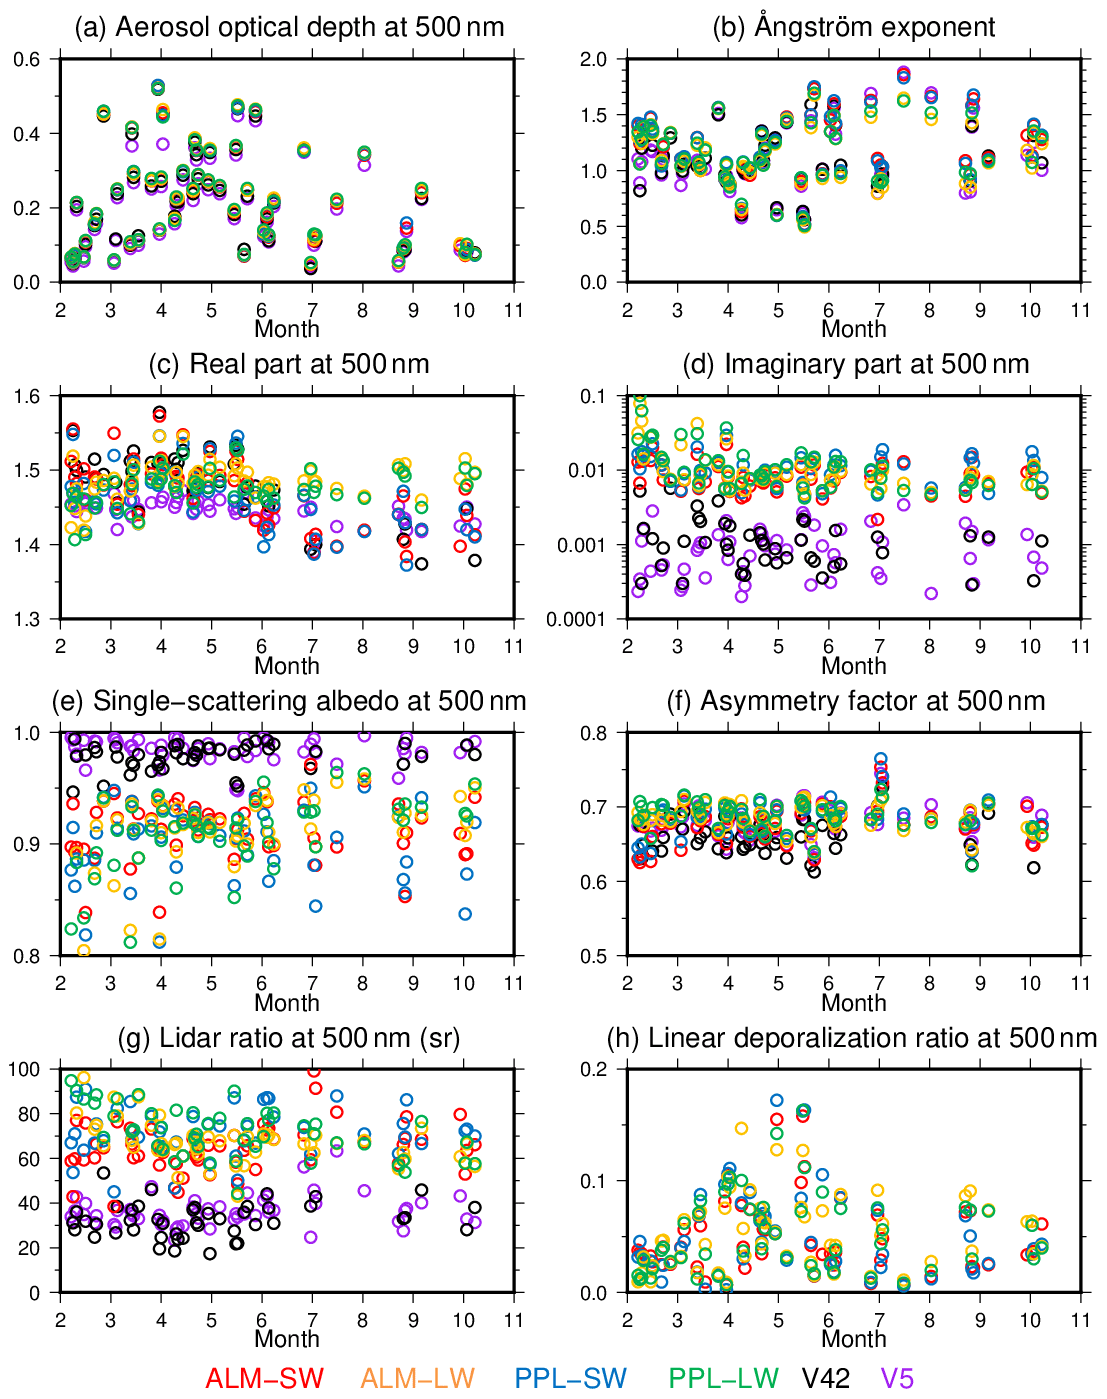
Figure 6Daily means of aerosol optical depth (a), Ångström exponent (b), real (c) and imaginary (d) parts of the refractive index, single-scattering albedo (e), asymmetry factor (f), lidar ratio (g), and linear depolarization ratio (h). Colors indicate the ALM-SW (red), ALM-LW (yellow), PPL-SW (blue), PPL-LW (green), V42 (black), and V5 (purple) retrieval patterns.
The RRI at 500 nm for all the retrievals was large in spring, ranging from 1.45 to 1.55. According to the database of Hess et al. (1998) and Aoki et al. (2005), the RRI of dust is about 1.53 at visible wavelengths and larger than that for other aerosols except black carbon. The RRI values of ALM-SW and PPL-SW were consistent with those of the V42 and V5 through the observation period. However, the RRI of ALM-LW and PPL-LW was lower in February and larger from June to October. The AOD at 500 nm was generally smaller than 0.2 during these periods, and the differences of the RRI are within the retrieval uncertainties of the RRI (Table 3). As mentioned in Sect. 4.1, the refractive index is less sensitive to diffuse radiances for low AOD. In particular, the AOD at 1627 and 2200 nm was less than 0.1 in February and June to October. It is difficult to retrieve the refractive index at 1627 and 2200 nm in this condition. The retrieval errors at 1627 and 2200 nm might affect the RRI at short wavelengths through the smoothness constraint for the spectral dependency of the RRI.
The IRI at 500 nm of MRI v2 (ALM-SW, PPL-SW, ALM-LW, and PPL-LW) was from 0.002 to 0.1 and was large in February and March. Hence, the SSA of MRI v2 was from 0.74 to 0.97 and was small in February and March. In winter, the local emission of black carbon is increased by the combustion of fuels, and Uchiyama et al. (2014a) show that the SSA derived from the measurements of the integrating nephelometer and absorption photometer in Tsukuba decreases in winter. The IRI of MRI v2 was larger than those of V42 and V5 in the whole period. Therefore, the SSA of MRI v2 was also smaller than V42 and V5 in the whole period, with a difference larger than 0.05. Previous studies show that Skyrad v4.2 tends to underestimate the IRI and overestimate the SSA by 0.02 to 0.1 compared with AERONET (Che et al., 2008; Estellés et al., 2012; Khatri et al., 2016). Hence, the IRI and SSA of MRI v2 may be closer to AERONET retrievals.
Although the ASM of MRI v2 and V5 at 500 nm was slightly larger than V42, the ASM of all the retrieval patterns had similar values from 0.6 to 0.7. These are within the typical values of tropospheric aerosols (Dubovik et al., 2002).
The LIR of MRI v2 ranged from 40 to 100 sr and was larger than those of V42 and V5, i.e., 20 to 40 sr. Observations from the HSRL at Tsukuba in 2 years show that the LIR at 532 nm is 68±39.8 sr for spherical particles and 48±27.1 sr for non-spherical particles (Tatarov et al., 2006). Tsukuba is a rural city near Tokyo, and the typical LIR observed in polluted or urban air is from 40 to 80 sr (Burton et al., 2012; Groß et al., 2015). The LIR of MRI v2 was within the ranges of the HSRL observations at Tsukuba and typical polluted air, while those of V42 and V5 were too small. The LIR increases as the SSA decreases. In addition, non-spherical particles are incorporated in MRI v2 but not in the Skyrad v4.2 and v5. Generally, for the same refractive index and particle size, the phase function of non-spherical particles at the scattering angle 180∘ is smaller than that of spherical particles, and the LIR of non-spherical particles is larger than that of spherical particles (e.g., Dubovik et al., 2006; Kudo et al., 2016). Both the SSA and the particle shape contribute to the difference of the LIR between MRI v2 and Skyrad v4.2–v5.
The DEP was large, up to 0.2, in spring because of the transported dust. The difference among the ALM-SW, PPL-SW, ALM-LW, and PPL-LW retrievals was small. The V42 and V5 do not consider non-spherical particles and cannot derive the DEP. A total of 2 years of observations with the Raman lidar at Tsukuba show the DEP of the dust layer to be about 0.2±0.07 (Sakai et al., 2003). Considering that our retrieval is a columnar property and includes spherical particles at low altitudes in addition to the dust layer, it is natural that our retrieved DEP is slightly smaller than that of the dust layer directly observed by the lidar.
Figure 7 shows the spectral dependencies of AOD and VSD normalized by the total volume, RRI, IRI, SSA, ASM, LIR, and DEP. They are represented as means over the whole observation period. The spectral dependencies of the AOD in all the retrievals showed good agreement. The difference of the RRI, ASM, and DEP among all the retrievals was also small.
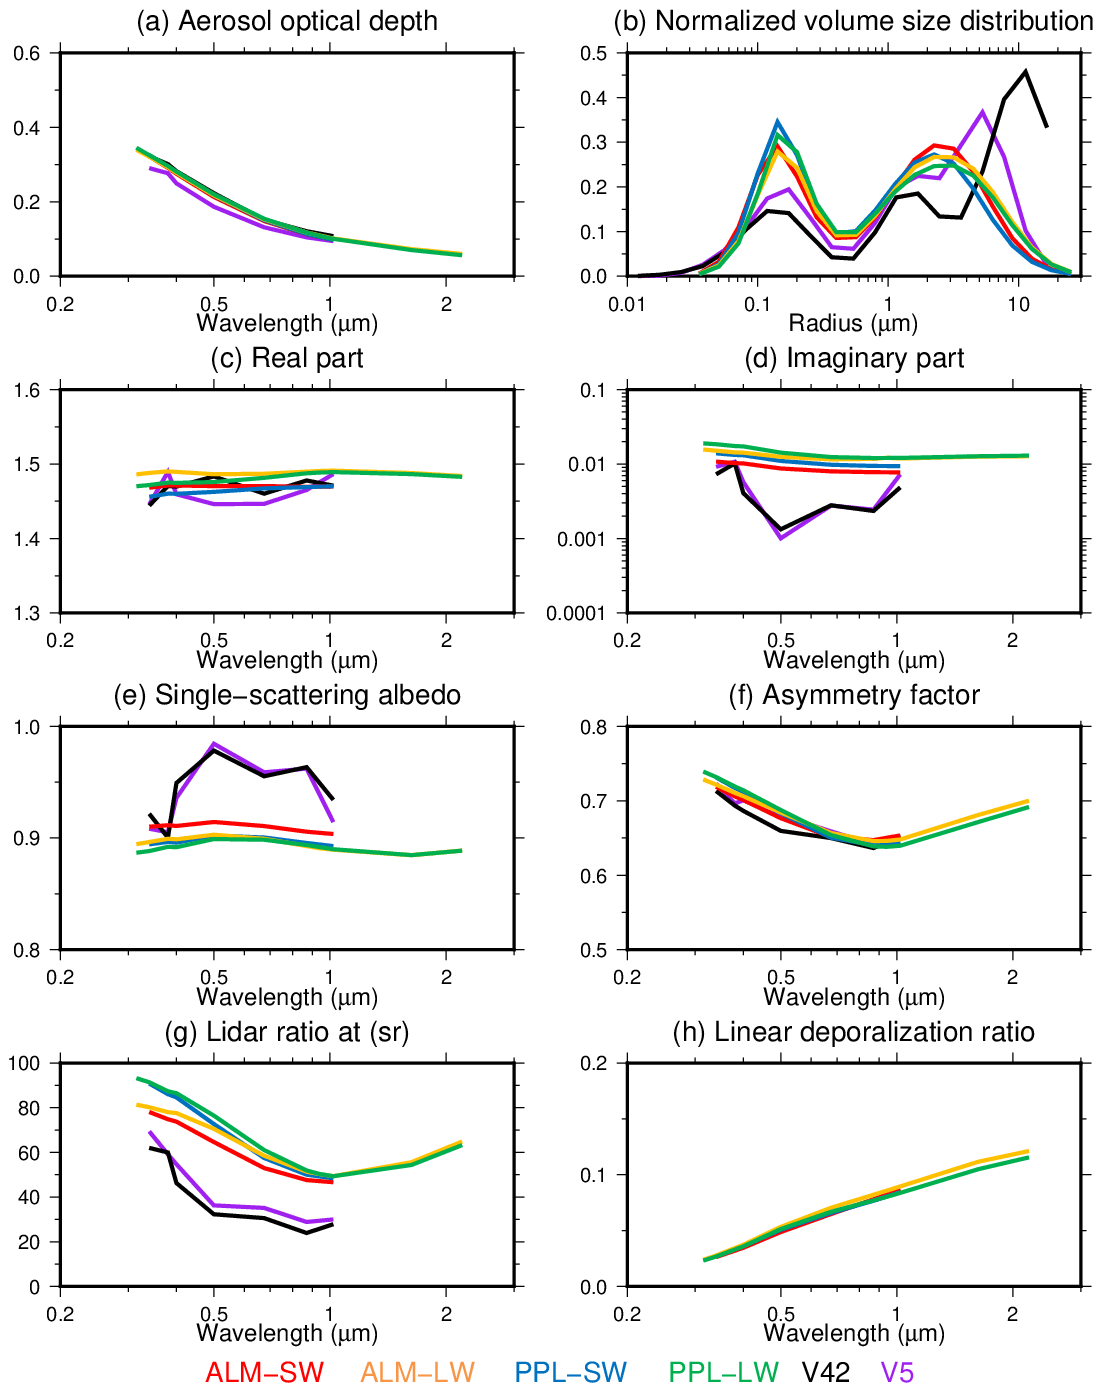
Figure 7Means during the whole observation period for aerosol optical depth (a), normalized volume size distribution to total volume (b), real (c) and imaginary (d) parts of the refractive index, single-scattering albedo (e), asymmetry factor (f), lidar ratio (g), and linear depolarization ratio (h). Colors indicate the ALM-SW (red), ALM-LW (yellow), PPL-SW (blue), PPL-LW (green), V42 (black), and V5 (purple) retrieval patterns.
The spectral changes in the IRI and SSA of MRI v2 were small. However, the IRI of V42 and V5 drastically decreased by about 1 order of magnitude from the near-ultraviolet wavelength to the visible wavelength. Hence, the SSA was small at near-ultraviolet wavelengths and large at visible and near-infrared wavelengths. The differences of the SSA at visible wavelengths between MRI v2 and Skyrad v4.2 and v5 could come from the a priori constraint of the spectral dependency for the IRI. It should be considered that the constraint of MRI v2 is stronger than those of the Skyrad v4.2 and v5.
The LIR of V42 and V5 retrievals was smaller than that from MRI v2 at all the wavelengths. This could be due to the differences of the particle shape and SSA. The lidar ratio of the retrieval for the almucantar geometry (ALM-SW and ALM-LW) at the near-ultraviolet and visible wavelengths was about 10 sr smaller than that of the retrieval for the principal plane geometry (PPL-SW and PPL-LW). However, this value is within the retrieval uncertainties (Tables 3 and 4).
Figure 7b shows the VSD normalized to the total volume. The normalized VSD from MRI v2 had a similar bimodal shape. However, the normalized VSD of V42 had a trimodal shape. The normalized VSD of V5 had a shape like a mixture of MRI v2 and V42. Although there are no desert regions in Tsukuba, the third mode of V42 appeared in the whole observation period, regardless of season. It is unrealistic that almost all the data were contaminated by cirrus clouds. The third mode of the Skyrad v4.2 was also found during other comparisons with AERONET retrievals (Che et al., 2008; Estellés et al., 2012). If the third mode is real, the microplastics might be a cause because our observational site neighbors the highway. The wear and tear from tires are major sources of microplastics, and the particle size range is from 1 nm to 100 µm (Kole et al., 2017; Evangeliou et al., 2020). However, we could not find any data or investigations that relate our results to microplastics. If the third mode is not real, we have to consider the measurement errors of the diffuse radiances at scattering angles near the sun. According to Fig. B1, it is possible that the third mode at a radius of around 10 µm is created by diffuse radiances at scattering angles around 3∘ and at wavelengths of around 1020 nm. Indeed, the third mode does not appear if we do not use the diffuse radiances at scattering angles less than 4∘ (Fig. 8a). We need to investigate the measurement accuracies of the diffuse radiances at scattering angles near the sun. In the MRI v2 retrieval, the dynamic weight factor depending on the AOD (Eq. 5) weakens the contribution of the diffuse radiances at the near-infrared wavelengths to the objective function (Eq. 4). This has the effect of suppressing the third mode of the VSD. Figure 8b shows the influences of the dynamic weight factor. If the dynamic weight factor is removed, the third mode appears in the MRI v2 retrievals.
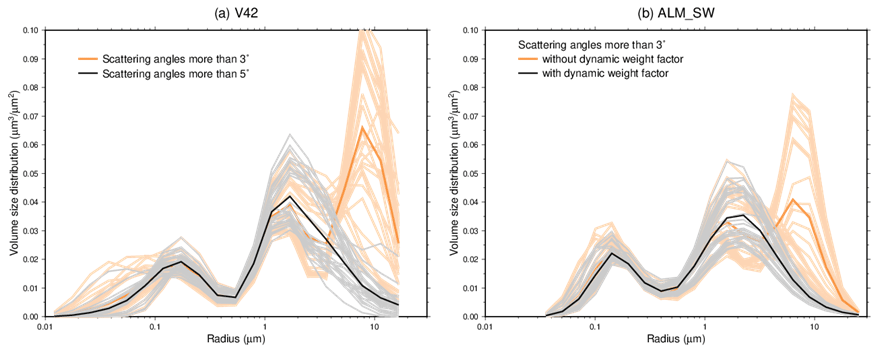
Figure 8Retrieved volume size distribution in Tsukuba on 14 March 2018. (a) The results of the Skyrad v4.2 using the diffuse radiances at scattering angles more than 3∘ (orange) and 5∘ (gray and black). (b) The results of MRI v2 using the diffuse radiances at a scattering angle more than 3∘ and with (gray and black) and without (orange) the dynamic weight factor in Eq. (5). The thick lines are daily means.
We further examined the differences of the ALM-SW, V42, and V5 retrievals because their wavelength subset is the standard in SKYNET. Figure 9 shows the comparison of AOD from the ALM-SW, V42, and V5 retrievals with the AOD obtained from the direct irradiance (DAOD). The DAOD was calculated by the Skyrad v4.2 software. The AOD of ALM-SW, V42, and V5 is calculated from the retrieved VSD, RRI, and IRI. The AOD of V42 and V5 agreed with the DAOD, but the AOD of ALM-SW was slightly larger than the DAOD. The mean differences of the AOD of ALM-SW from the DAOD were less than about 0.02 for all the wavelengths (Table 5). The large AOD of ALM-SW is because MRI v2 optimizes the parameters to the transmittances, but Skyrad v4.2 and v5 optimize the parameters to the DAOD. In the optimal estimation, the parameters are preferentially optimized to the measurements, which significantly contributes to the objective function (Eq. 4). The contributions of the measurements depend on the value of W in Eq. (4). The value of W for the DAOD is 0.01 in the Skyrad v5. This means that the algorithm tries to optimize the parameters to DAOD ±0.01. In MRI v2, the value of 2 % is given to the transmittance. The aerosol optical depth (τ) is related to the transmittance (T) by
where m is optical air mass. For simplicity, the optical depths for the Rayleigh scattering and gaseous absorption are ignored. The relation of the perturbation between τ and T is given from the partial differential of Eq. (15) with respect to T as follows:
where Δτ and ΔT are the perturbations for τ and T. Since is 0.02 in MRI v2, Δτ ranges between 0.01 and 0.02 in the range of m from 1 to 2. On the other hand, Δτ is 0.01 in the Skyrad v5. Therefore, the fitness of the parameters to the DAOD in MRI v2 is weaker than in Skyrad v5.
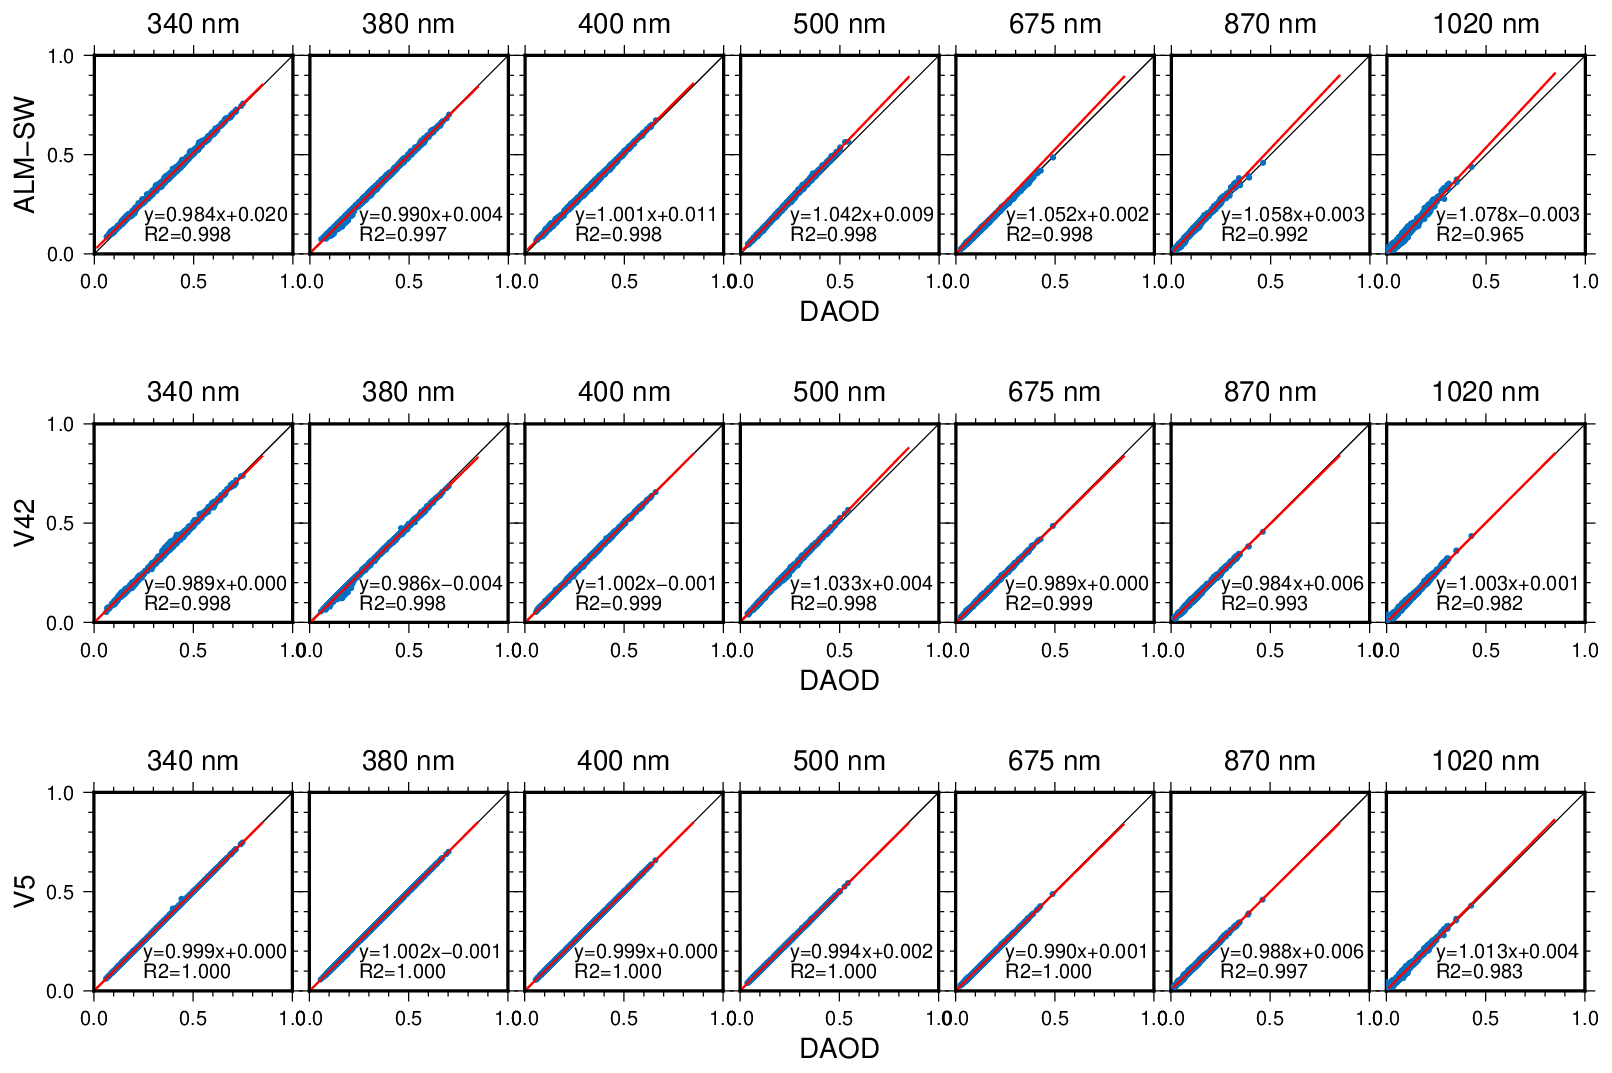
Figure 9Comparisons of aerosol optical depth of ALM-SW, V42, and V5 with the aerosol optical depth derived from the direct irradiance (DAOD). The aerosol optical depths of ALM-SW, V42, and V5 are calculated from the retrieved size distribution and refractive index; and R2 are the linear fitting and the coefficient of determination for all the data.
Table 5Means and standard deviations of differences between the DAOD (aerosol optical depth derived from the direct irradiance) and the aerosol optical depth of ALM-SW, V42, and V5.

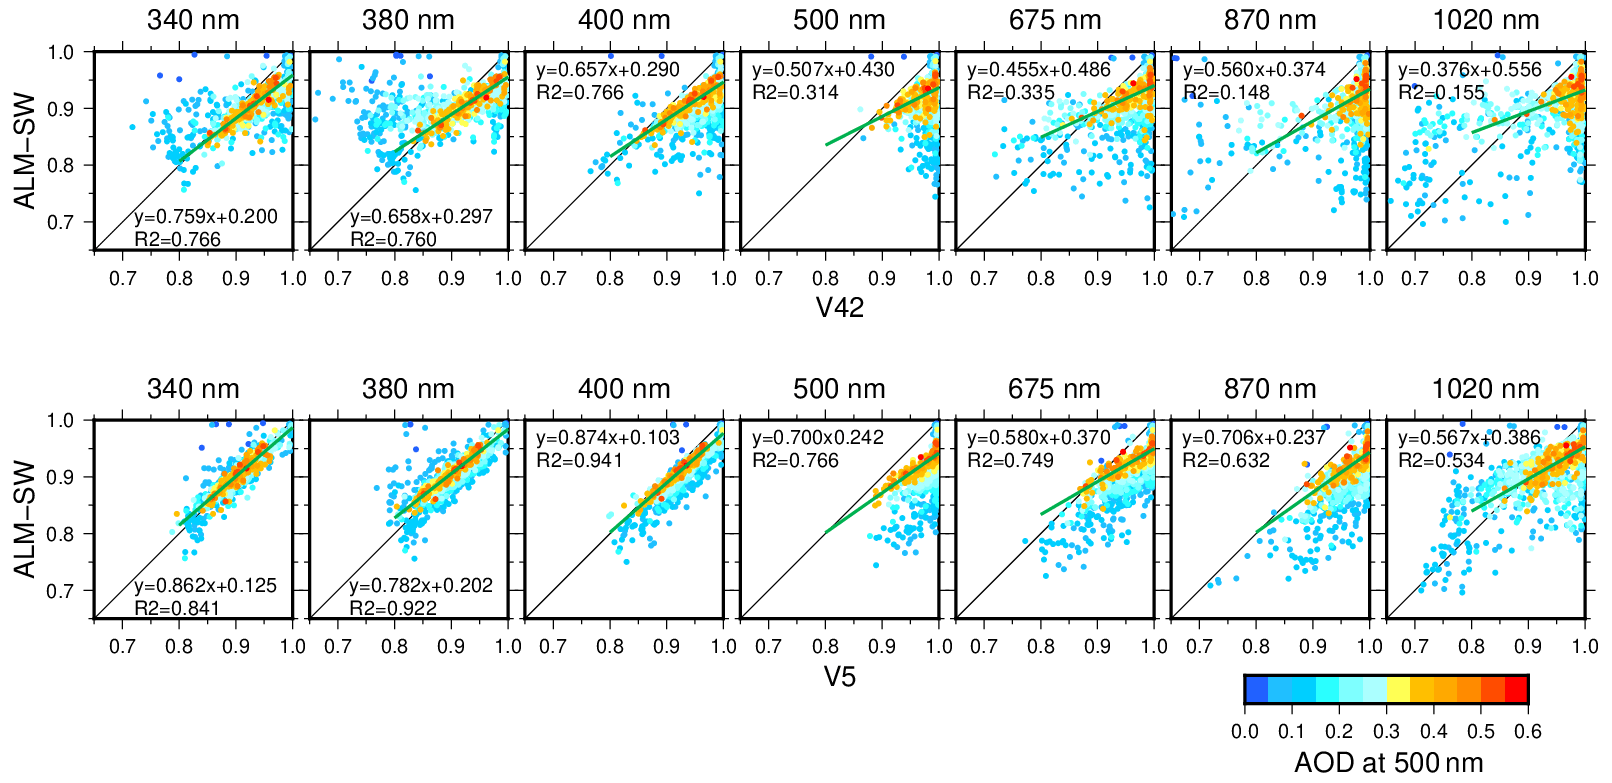
Figure 10Comparisons of the single-scattering albedo between ALM-SW, V42, and V5. Colors indicate the aerosol optical depth at 500 nm; and R2 are the linear fitting and the coefficient of determination for the data relating to an aerosol optical depth of more than 0.3.
Figure 10 shows the comparison of SSA between ALM-SW, V42, and V5. The SSA of ALM-SW at 340, 380, and 400 nm agreed with that of V5 and was slightly smaller than that of V42. The SSA of ALM-SW at wavelengths larger than 500 nm was smaller than those of V42 and V5, and the differences between ALM-SW, V42, and V5 became larger at longer wavelengths. The uncertainty of the retrieved SSA is large for low AODs because the diffuse radiances become insensitive to the SSA. Therefore, the differences of the SSA between ALM-SW, V42, and V5 were large at longer wavelengths. Overall, the SSA approached similar values when the AOD at 500 nm was more than 0.3. Furthermore, the coefficients of determination between the ALM-SW and V5 were higher than the V42. These features were also seen in the scatter plots of the RRI, IRI, ASM, and LIR (Figs. S1 to S4). Figure 11 illustrates the normalized VSD of ALM-SW, V42, and V5 for the different values of AOD at 500 nm. The third mode of the V42 retrieval decreases when the AOD is more than 0.3. The third mode of the SKYRAD v4.2 is a common feature in the case of low AODs. The normalized VSD of V5 had a shape closer to that of ALM-SW in the case of high AOD.
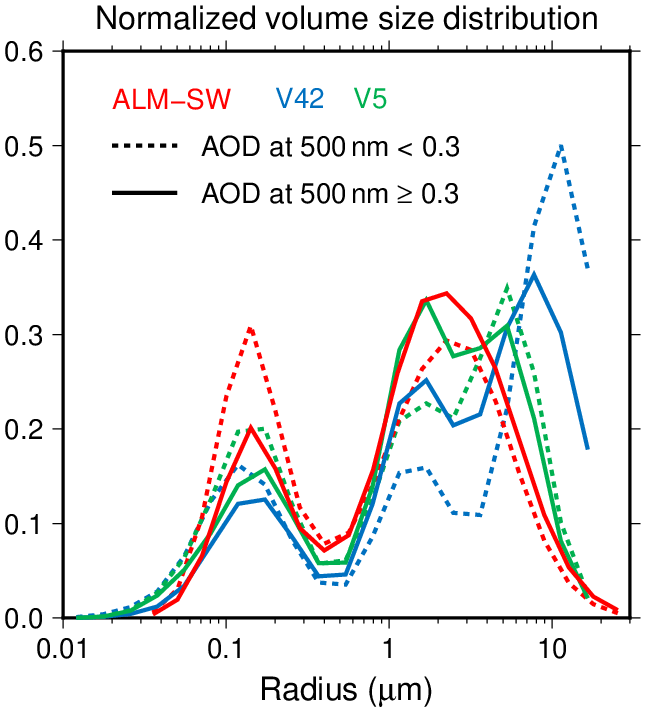
Figure 11Means of normalized volume size distributions of the ALM-SW (red), V42 (blue), and V5 (green) for the data on aerosol optical depth at 500 nm more than 0.3 (thick lines) and less than 0.3 (broken lines).
Table 6 is a summary of the differences between the ALM-SW, V42, and V5 retrievals for the different grades of the AOD at 500 nm. The AOD, RRI, and ASM of ALM-SW, V42, and V5 agreed. Conversely, the differences of IRI, SSA, and LIR between the ALM-SW, V42, and V52 were larger than the expected uncertainty; however, the differences decrease in the case that the AOD is more than 0.3. These differences were caused by the smoothness constraint for the refractive index and size distribution, as well as the particle shape, in the retrieval algorithm.
Table 6Means and standard deviations of the differences between the ALM-SW retrievals and the V42 (upper) and V5 (lower) retrievals.
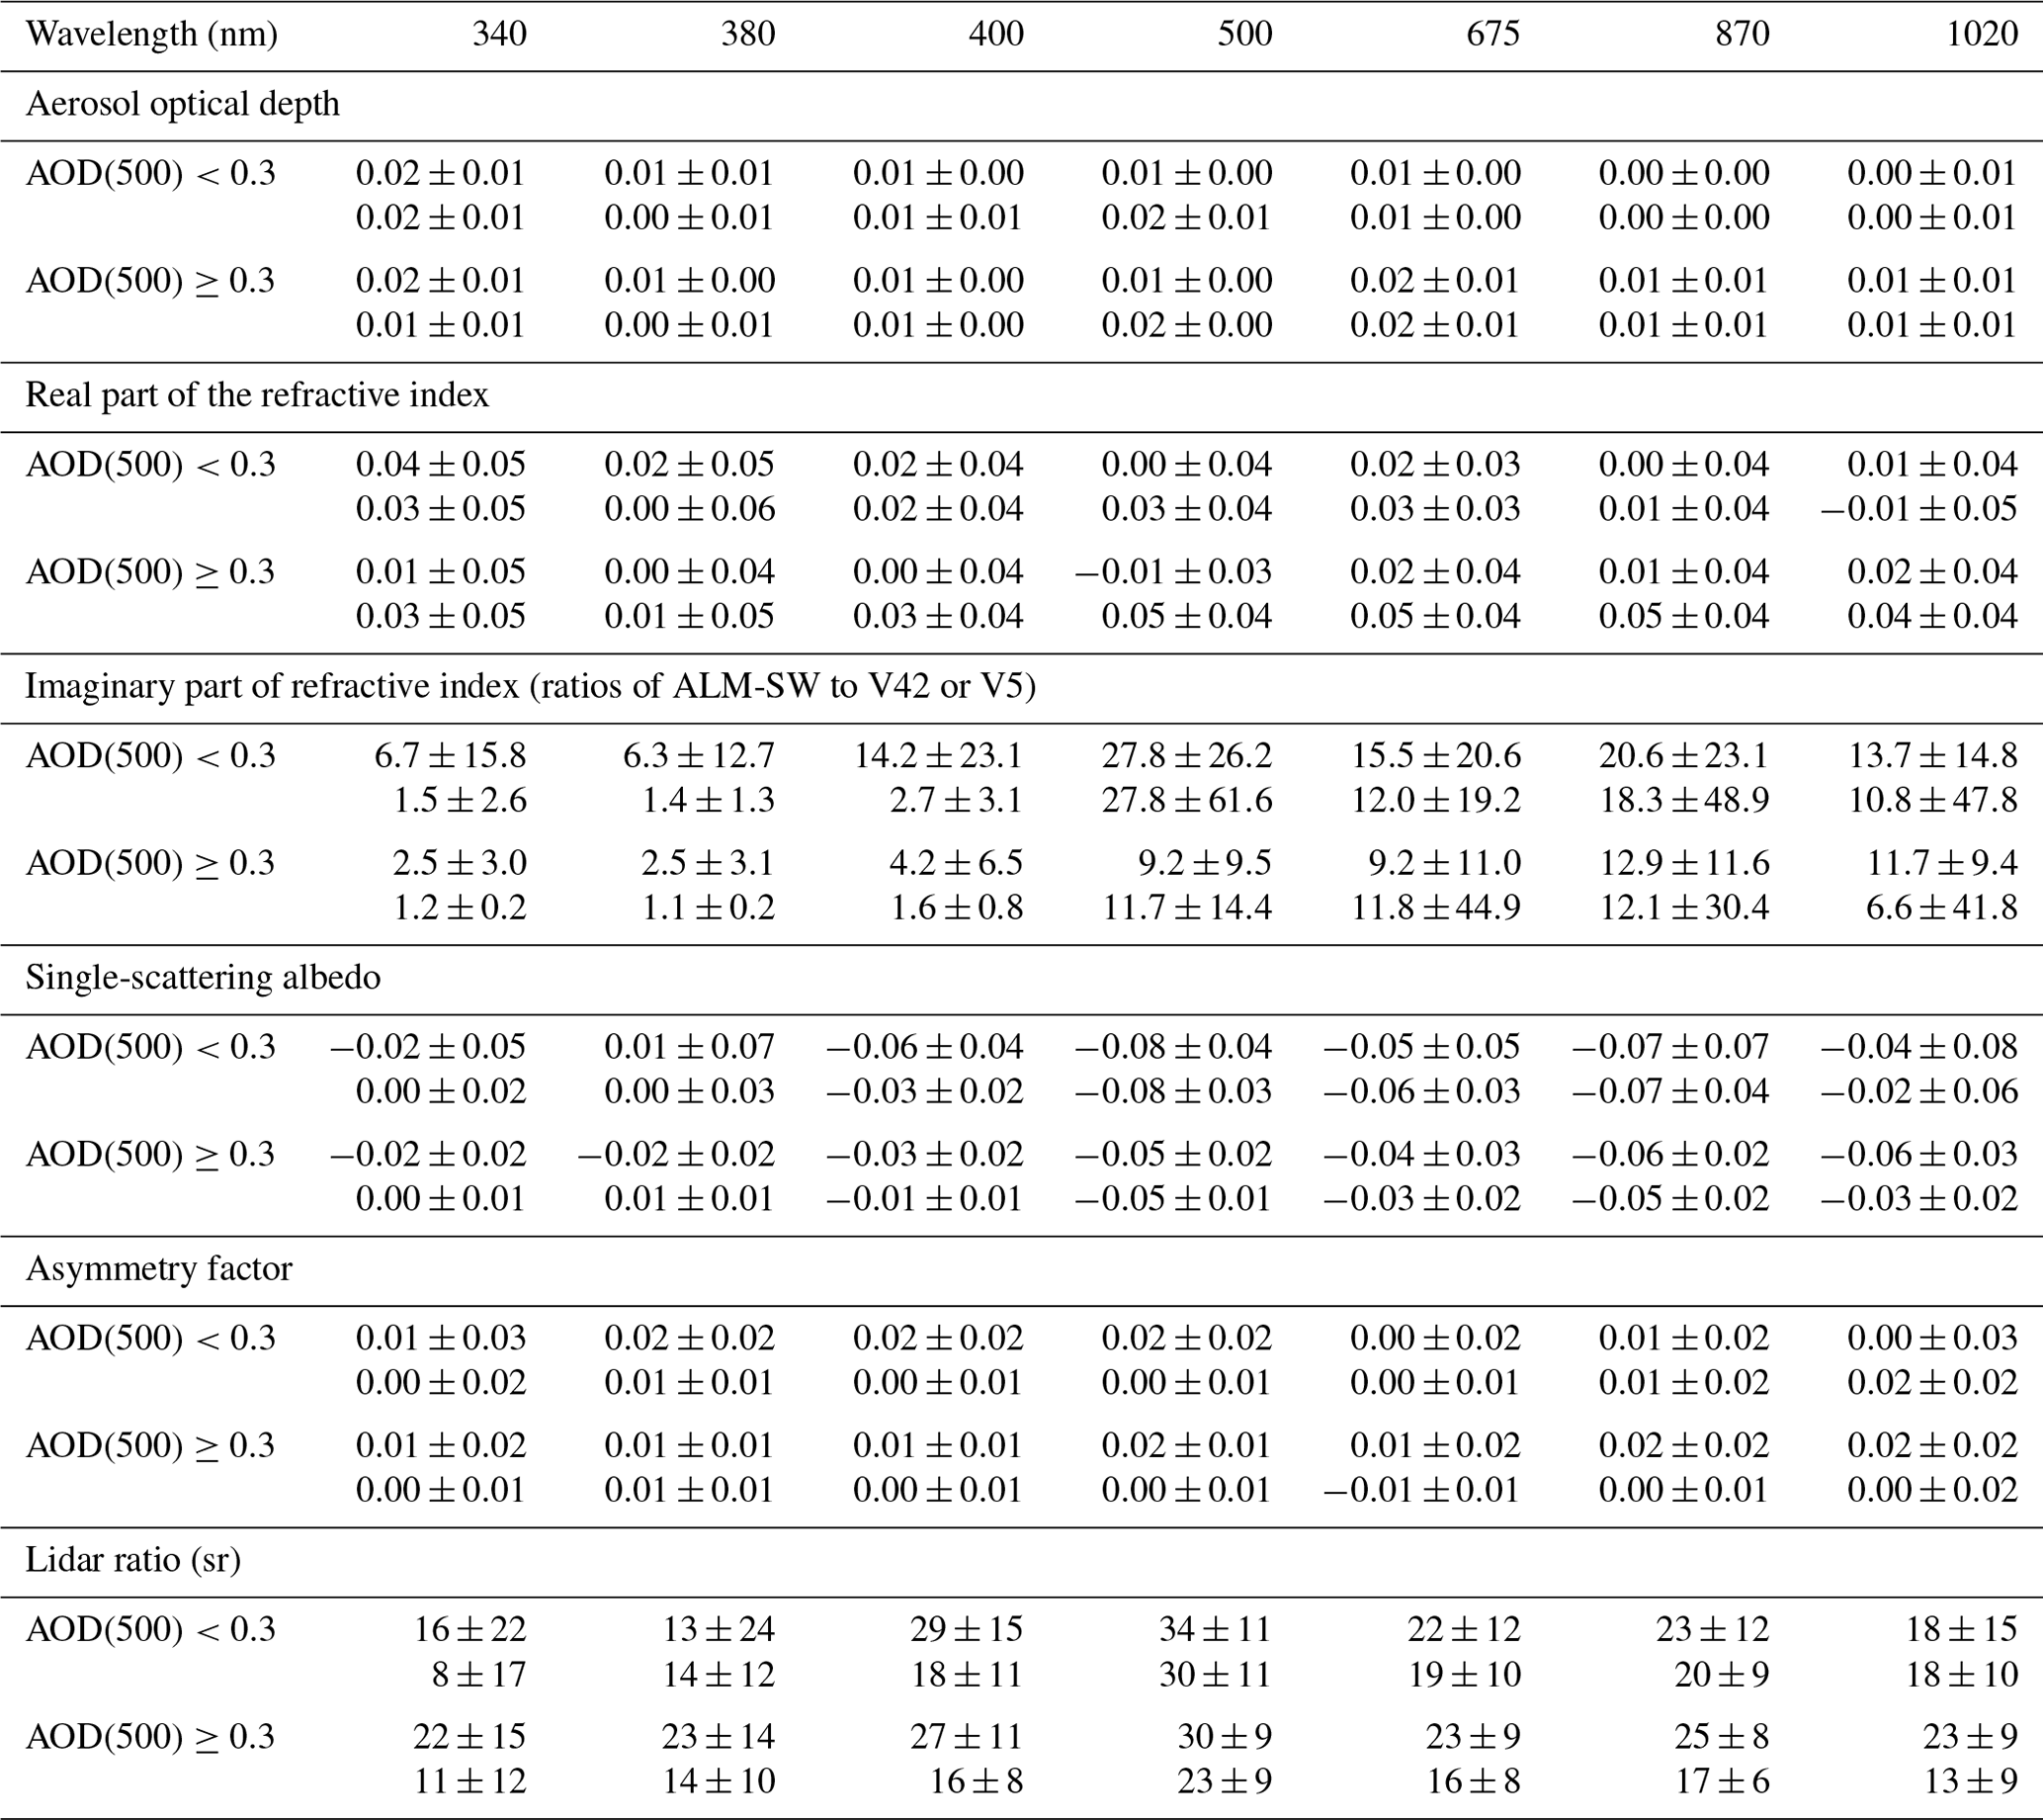
AOD(500): aerosol optical depth at 500 nm of the V42.
5.1.2 Water vapor and ozone
Figure 12 shows the PWV of the ALM-LW and PPL-LW retrieval results and radiosonde observations at 00:00 UTC (09:00 Japan standard time). Note that Skyrad v4.2 and v5 cannot use the measurements at 315 and 940 nm and cannot estimate PWV and TO3. All the radiosonde data in the whole observation period are plotted in Fig. 12a, but the ALM-LW and PPL-LW are the retrieval results under clear-sky conditions. Therefore, the ALM-LW and PPL-LW retrieval results in Fig. 12a follow the lower envelope of the radiosonde data. The seasonal changes in the ALM-LW and PPL-LW results agreed well with the radiosonde data (Fig. 12a). This is also visible from the scatter plot between the ALM-LW and PPL-LW (Fig. 12b). The means and standard deviations of the differences between the retrievals and the radiosonde observations were 0.1±2.7 mm for the ALM-LW and 0.1±3.9 mm for the PPL-LW and were within the expected retrieval uncertainty of PWV (Table 3). Previous work with PWV retrieval from the sky radiometer shows that the bias and root mean square deviation of retrieval error range from −0.01 to −0.2 mm, from 1.35 to 1.97 mm (Campanelli et al., 2018), from 0.33 to 0.90 mm, and from 1.79 to 1.98 mm (Uchiyama et al., 2014b), respectively. Our results show slightly large deviations but are comparable to the previous works.
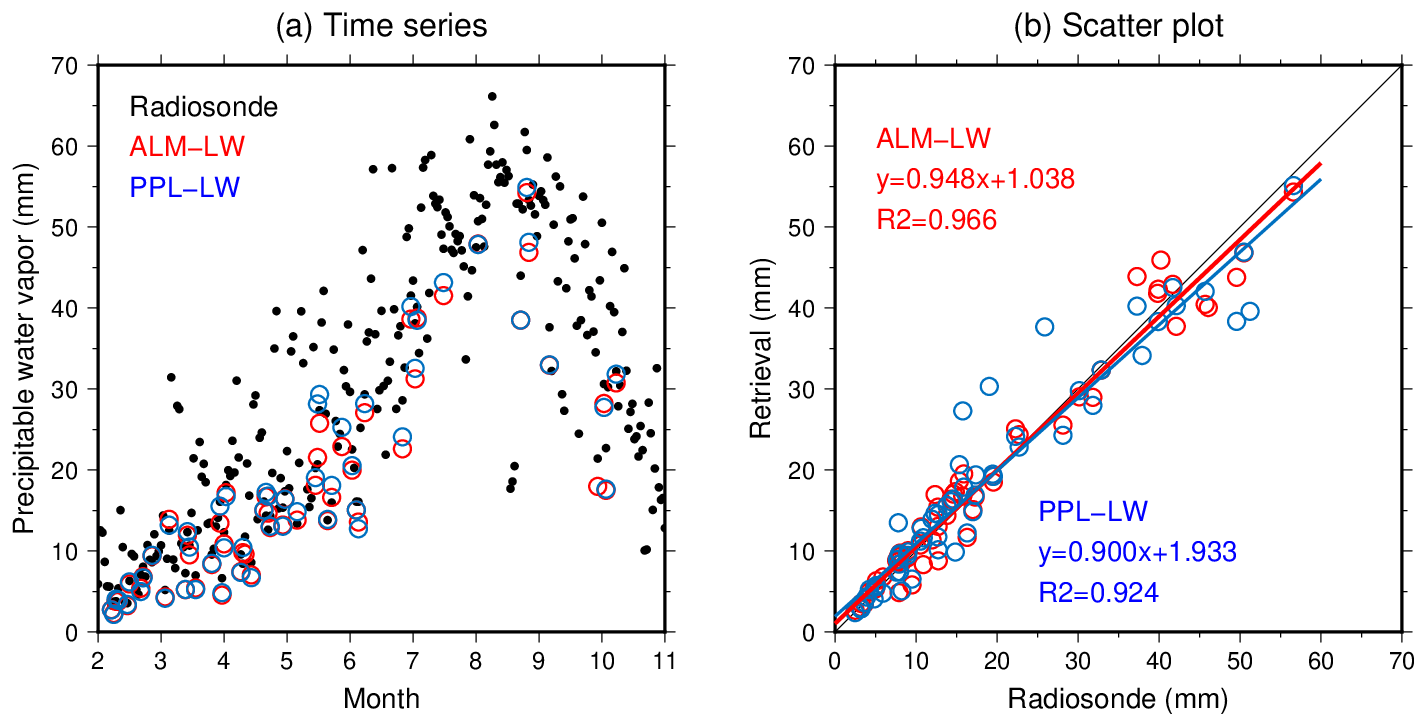
Figure 12Seasonal changes (a) and scatter plots (b) for the precipitable water vapor of the ALM-LW (red), PPL-LW (blue), and radiosonde observations (black); and R2 are the linear fitting and coefficient of determination.
Figure 13 shows the comparison of the TO3 between the ALM-LW and PPL-LW retrievals and the Brewer spectrophotometer observations. The seasonal changes were consistent among the different techniques (Fig. 13a), and the coefficient of determination was good: more than 0.7 (Fig. 13b). However, the TO3 of the ALM-LW and PPL-LW was slightly large. The means and standard deviations of the differences between the retrievals and the Brewer spectrophotometer were 24±25 m atm-cm for the ALM-LW and 23±24 m atm-cm for the PPL-LW.
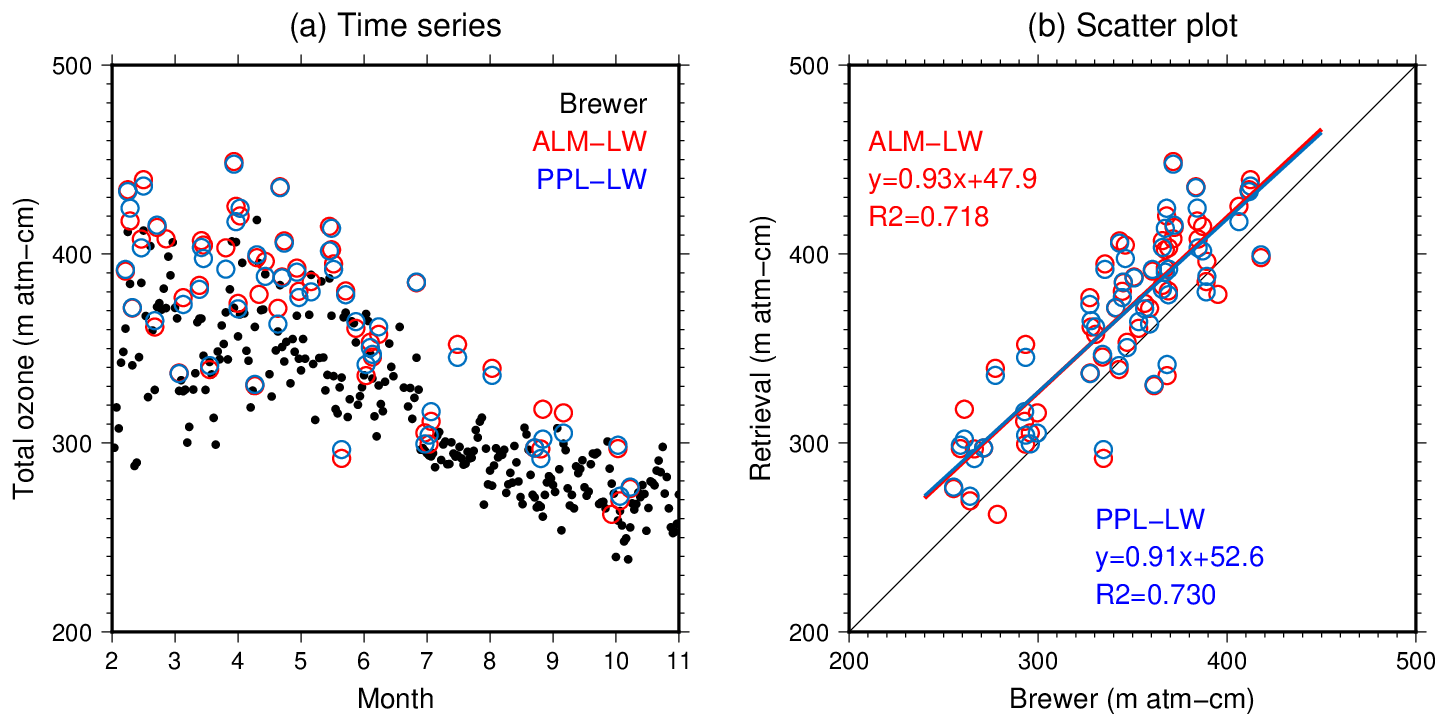
Figure 13Seasonal changes (a) and scatter plots (b) for the total ozone of the ALM-LW (red), PPL-LW (blue), and Brewer spectrophotometer observations (black); and R2 are the linear fitting and coefficient of determination.
In both PWV and TO3 retrievals, the differences between the ALM-LW and PPL-LW were small. It should be considered that the influence of the aerosol vertical profile was small. The PWV could be stably provided from the sky radiometer. However, further investigation is necessary for the calibration of the measurements at 315 nm and the retrieval of the TO3.
5.1.3 Surface solar radiation
The global, direct, and diffuse components of the surface solar irradiance calculated from the retrieved aerosol optical properties, PWV, and TO3 of the ALM-SW, PPL-SW, ALM-LW, PPL-LW, V42, and V5 were compared with the measurements at the Aerological Observatory, an observational station of BSRN (Fig. 14). Considering the measurement errors of the surface solar irradiance (Sect. 2.1), all the calculated irradiances from the retrievals showed good agreements with the measurements. In the MRI v2 results, the mean differences between the calculated irradiances from the retrievals and the measurements were from 2 to 7 W m−2 (from 0.4 % to 1.2 %) for the global irradiance, from 4 to 10 W m−2 (from 0.6 % to 1.2 %) for the direct irradiance, and from −2 to −1 W m−2 (from −3.8 % to −1.9 %) for the diffuse irradiance, respectively. The ALM-LW and PPL-LW results for the global and direct irradiances were slightly better than the ALM-SW and PPL-SW; i.e., the use of all the wavelengths and the retrieval of water vapor and ozone turn out to be effective. The mean differences of the global irradiances of V42 and V5 were 14 and 12 W m−2 (2.2 % and 1.9 %), slightly worse than that of MRI v2. The differences of the direct irradiances between V42, V5, and MRI v2 were small, but the differences of the diffuse irradiances were large. The mean differences of the diffuse irradiance for V42 and V5 were positive, and those for MRI v2 were negative. This means that the SSA of V42 and V5 is overestimated, and the SSA of MRI v2 is underestimated.
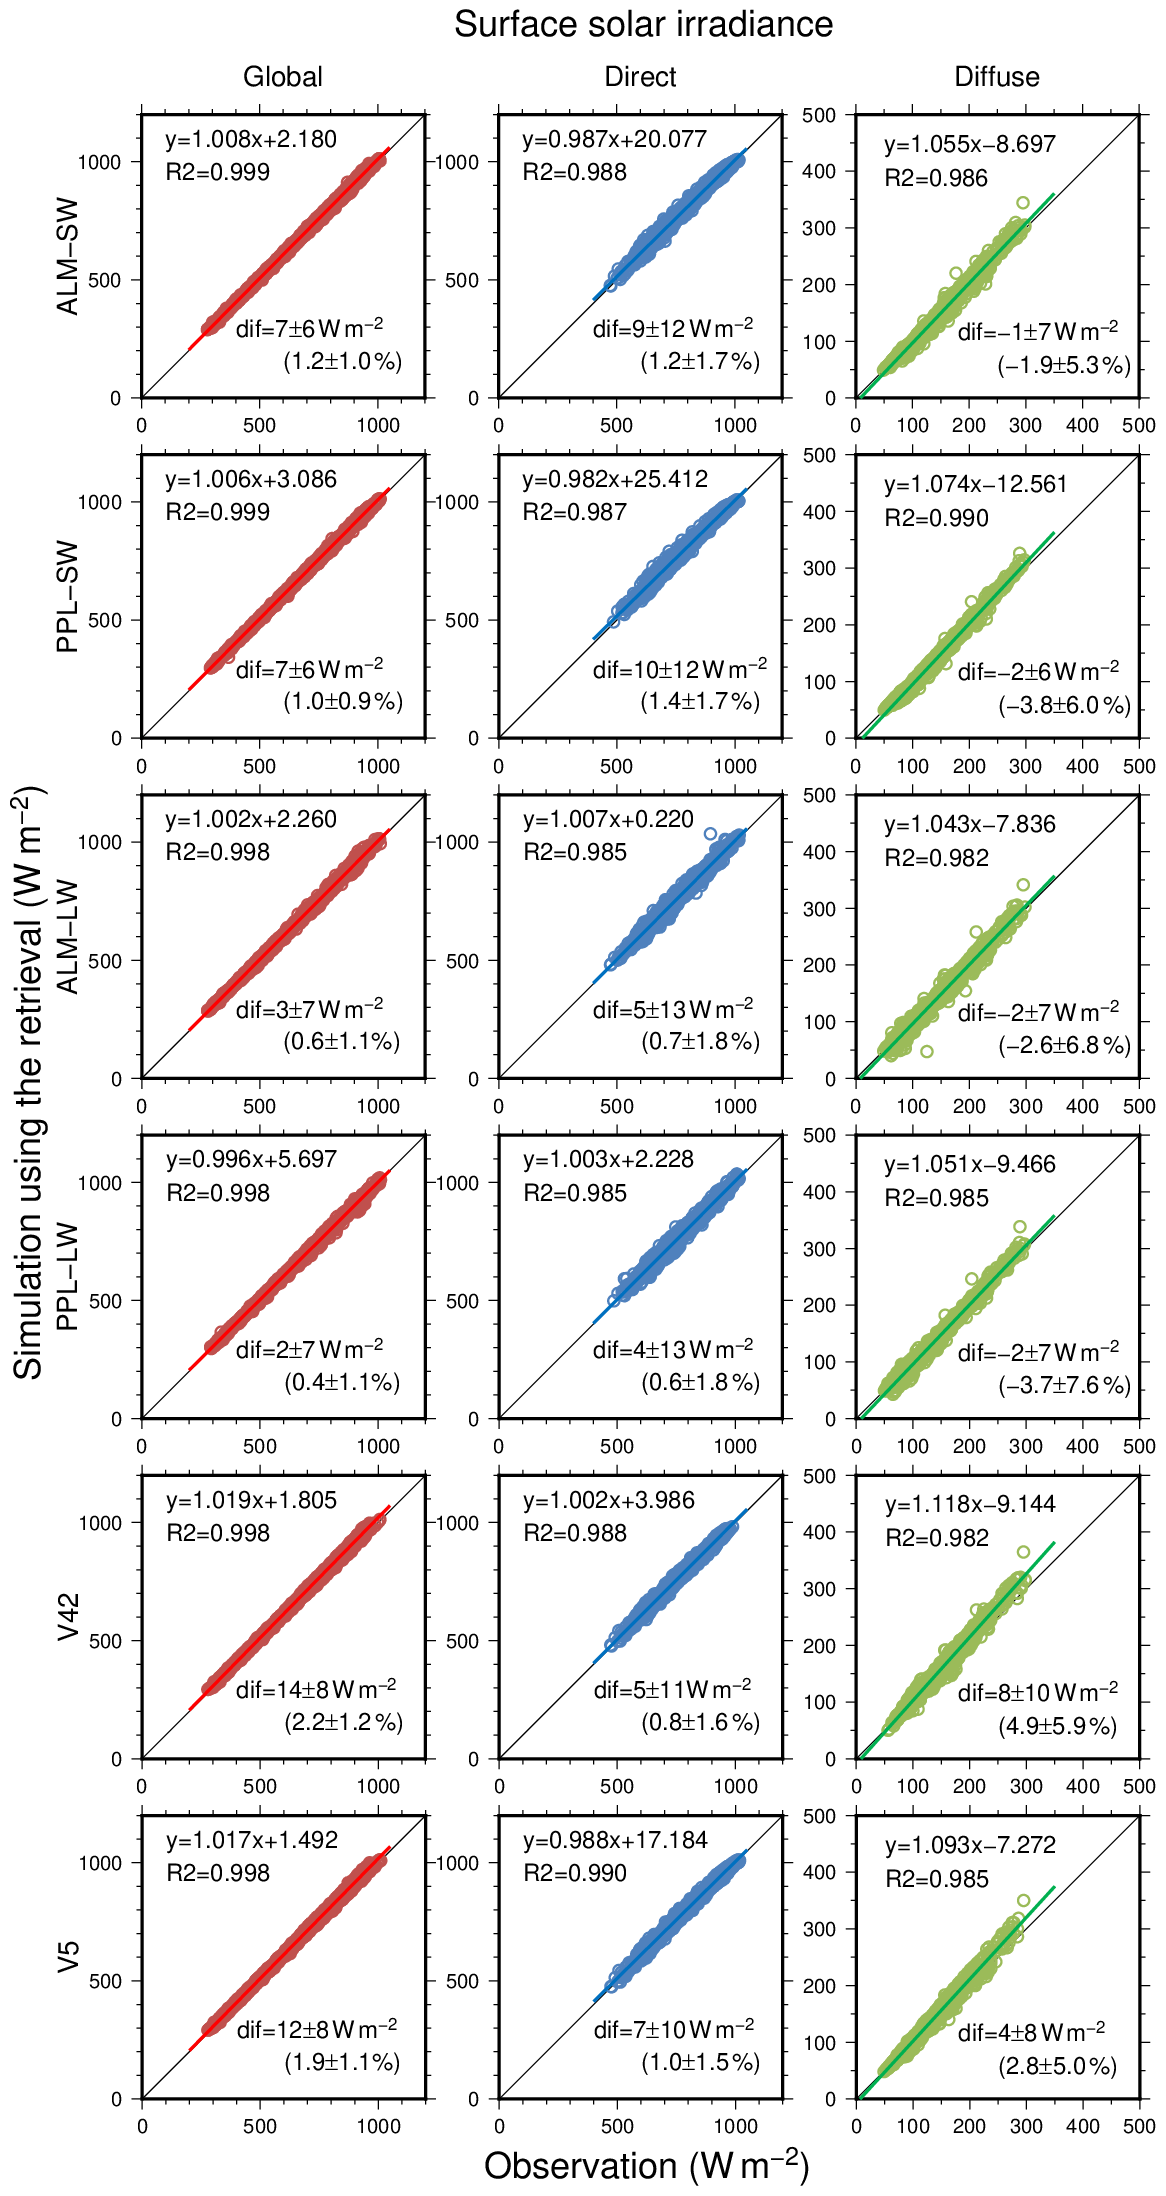
Figure 14Comparison of global, direct, and diffuse solar irradiances between the measurements and the simulations using ALM-SW, ALM-LW, PPL-SW, PPL-LW, V42, and V5 retrieval results. The notation “dif” indicates the mean and standard deviation of the differences; and R2 are the linear fitting and coefficient of determination.
Figure 15 shows the deviations of the calculated global, direct, and diffuse irradiances from the measurements as a function of AOD at 500 nm. Note that there are no data around AOD values of 0.6 in the V5 results because Skyrad v5 failed to retrieve the aerosol optical properties. In the MRI v2 results, the direct irradiance deviations increased with a decrease in AOD. They ranged from −5 % to 5 % around AOD values of 0.6 but increased up to 10 % at AOD less than 0.2. The diffuse irradiance deviations decreased with a decrease in AOD. Most of the diffuse irradiance deviations were positive, from 0 % to 10 %, around AOD values of 0.6 but ranged from −20 % to 10 % at AOD less than 0.2. The negative mean differences of the diffuse irradiances in the MRI v2 results in Fig. 14 were due to the underestimation of the diffuse irradiances at low AOD. The overestimation of the direct irradiances at low AOD is due to the underestimation of the retrieved AOD, and the underestimated AOD results in the underestimation of the diffuse irradiances. Furthermore, the uncertainty of the SSA retrieved by MRI v2 was large in the case of AOD less than 0.2, and the SSA was underestimated (Table 3). The underestimations of the retrieved AOD and SSA were the reason for the underestimated diffuse irradiances at AOD less than 0.2. However, the contribution of the diffuse irradiance to the global irradiance is small in the case of low AOD. Consequently, the global irradiance deviations of the MRI v2 results ranged from −5 % to 5 %, and their dependencies on AOD were smaller than the direct and diffuse irradiance deviations.
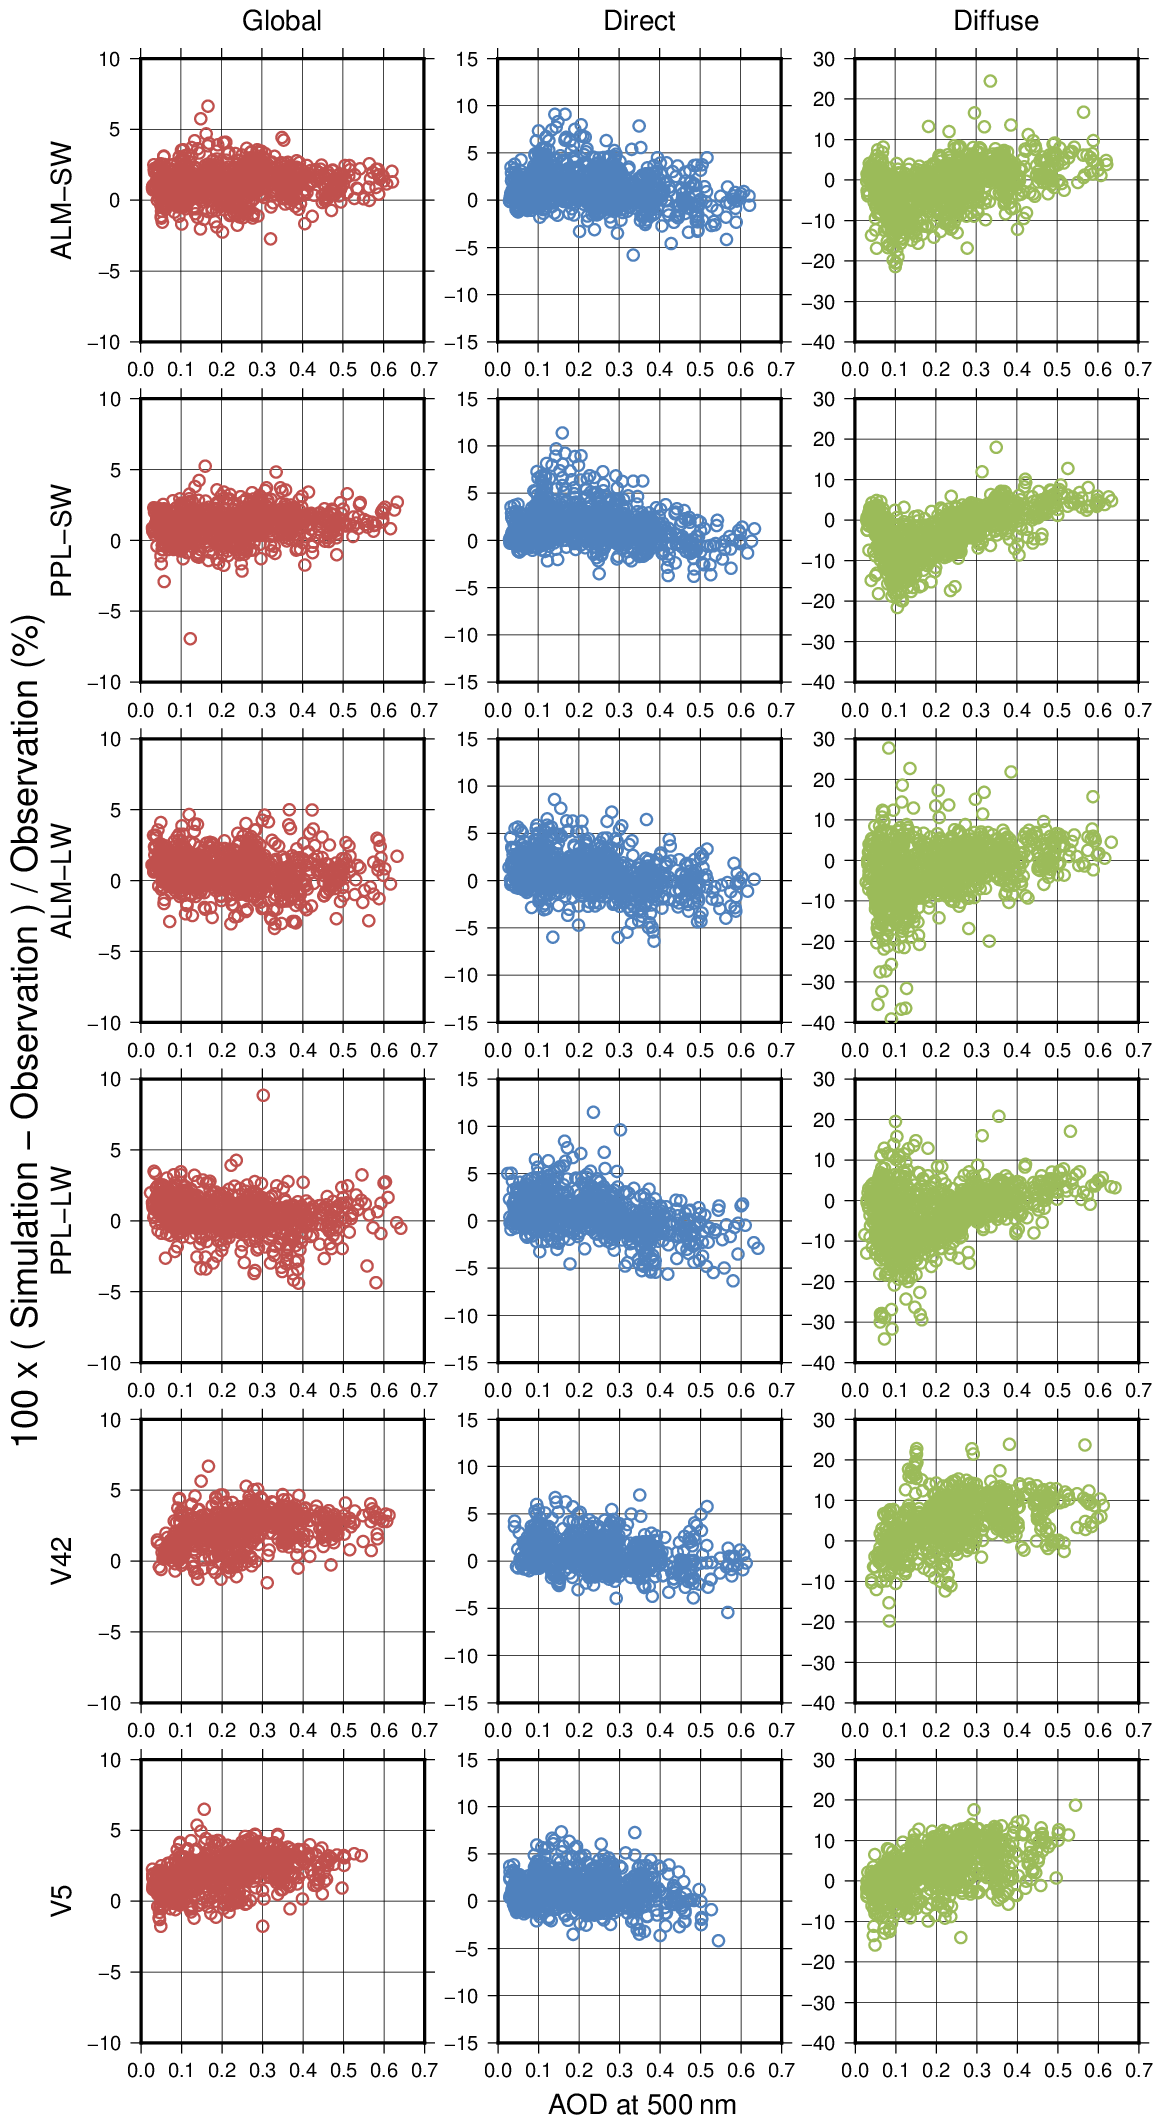
Figure 15Deviations of global (red), direct (blue), and diffuse (green) solar irradiances between the measurements and the simulations using ALM-SW, ALM-LW, PPL-SW, PPL-LW, V42, and V5 retrieval results as a function of the aerosol optical depth at 500 nm.
Similar to the MRI v2 results, the direct irradiance deviations of the V42 and V5 results ranged from −5 % to 5 % and increased with a decrease in AOD. The diffuse irradiance deviations of the V42 and V5 results decreased with a decrease in AOD. Most of the diffuse irradiance deviations ranged from −10 % to 10 % for AOD less than 0.2 and were better than the MRI v2 results. For AOD larger than 0.2, most of the diffuse irradiance deviations ranged from 0 % to 15 % and were larger than the MRI v2 results. The positive mean differences of the diffuse irradiances in the V42 and V5 results in Fig. 14 were due to the overestimation of the diffuse irradiances at high AOD. Since most of the direct irradiance deviations ranged from −3 % to 5 % and were biased to be positive at AOD larger than 0.2, the retrieved AOD is considered to be slightly underestimated. However, the diffuse irradiance deviations were positive. Therefore, the overestimation of the retrieved SSA was the reason for the overestimation of the diffuse irradiances at high AOD. This supports the fact that the SSA retrieved by the MRI v2 is better than that of V42 and V5 at high AOD. The contribution of the diffuse irradiance to the global irradiance increases with an increase in AOD. As a result, the global irradiance deviations of the V42 and V5 results were positive, from 0 % to 5 %, at AOD larger than 0.2. This results in positive mean differences of the global irradiances in the V42 and V5 results in Fig. 14.
Overall, the calculated global, direct, and diffuse irradiances from the MRI v2 retrievals agreed well with the measurements. However, the differences between the calculated and measured irradiances depended on AOD and SSA. The underestimation of the SSA retrieved by MRI v2 at low AOD is an issue to be solved in the future.
5.2 Comparison with the aircraft in situ measurements during SAVEX-D
The MRI v2 was applied to POM-01 sky radiometer measurements during the SAVEX-D campaign that took place at Praia in the Cape Verde archipelago in August 2015 (Estellés et al., 2018). The retrieval results were compared with the in situ measurements from the Facility for Airborne Atmospheric Measurements (FAAM) atmospheric research aircraft (Ryder et al., 2018). Table 7 shows the aerosol optical properties retrieved from the sky radiometer in the two flights performed. The AOD observed by the sky radiometer at 500 nm was about 0.64±0.10 on 16 August and 0.25±0.04 on 25 August. On both days, Saharan dust originating from Africa was observed at altitudes from 1 to 6 km by an airborne lidar (Marenco et al., 2018). Maritime aerosols were also observed in the boundary layer, but dust particles were dominant (Ryder et al., 2018). Therefore, Saharan dust is a major contributor to the retrieved columnar aerosol optical properties from the sky radiometer. The RRI, IRI, SSA, and ASM of MRI v2 showed good agreement with those derived from the aircraft in situ measurements (Table 7). The sky radiometer reports the optical properties at 500 nm, whereas the in situ measurement reports those same properties at 550 nm. Given the short wavelength difference, we think that these quantities are comparable because the spectral changes in these quantities are small between 500 and 550 nm (e.g., Hess et al., 1998).
Table 7Aerosol optical properties of the MRI v2 retrievals using the sky radiometer measurements during SAVEX-D, the aircraft in situ measurements of Saharan dust in six flights during AER-D, and Raman lidar measurements of Saharan dust in 3 d during SAMUM 2.
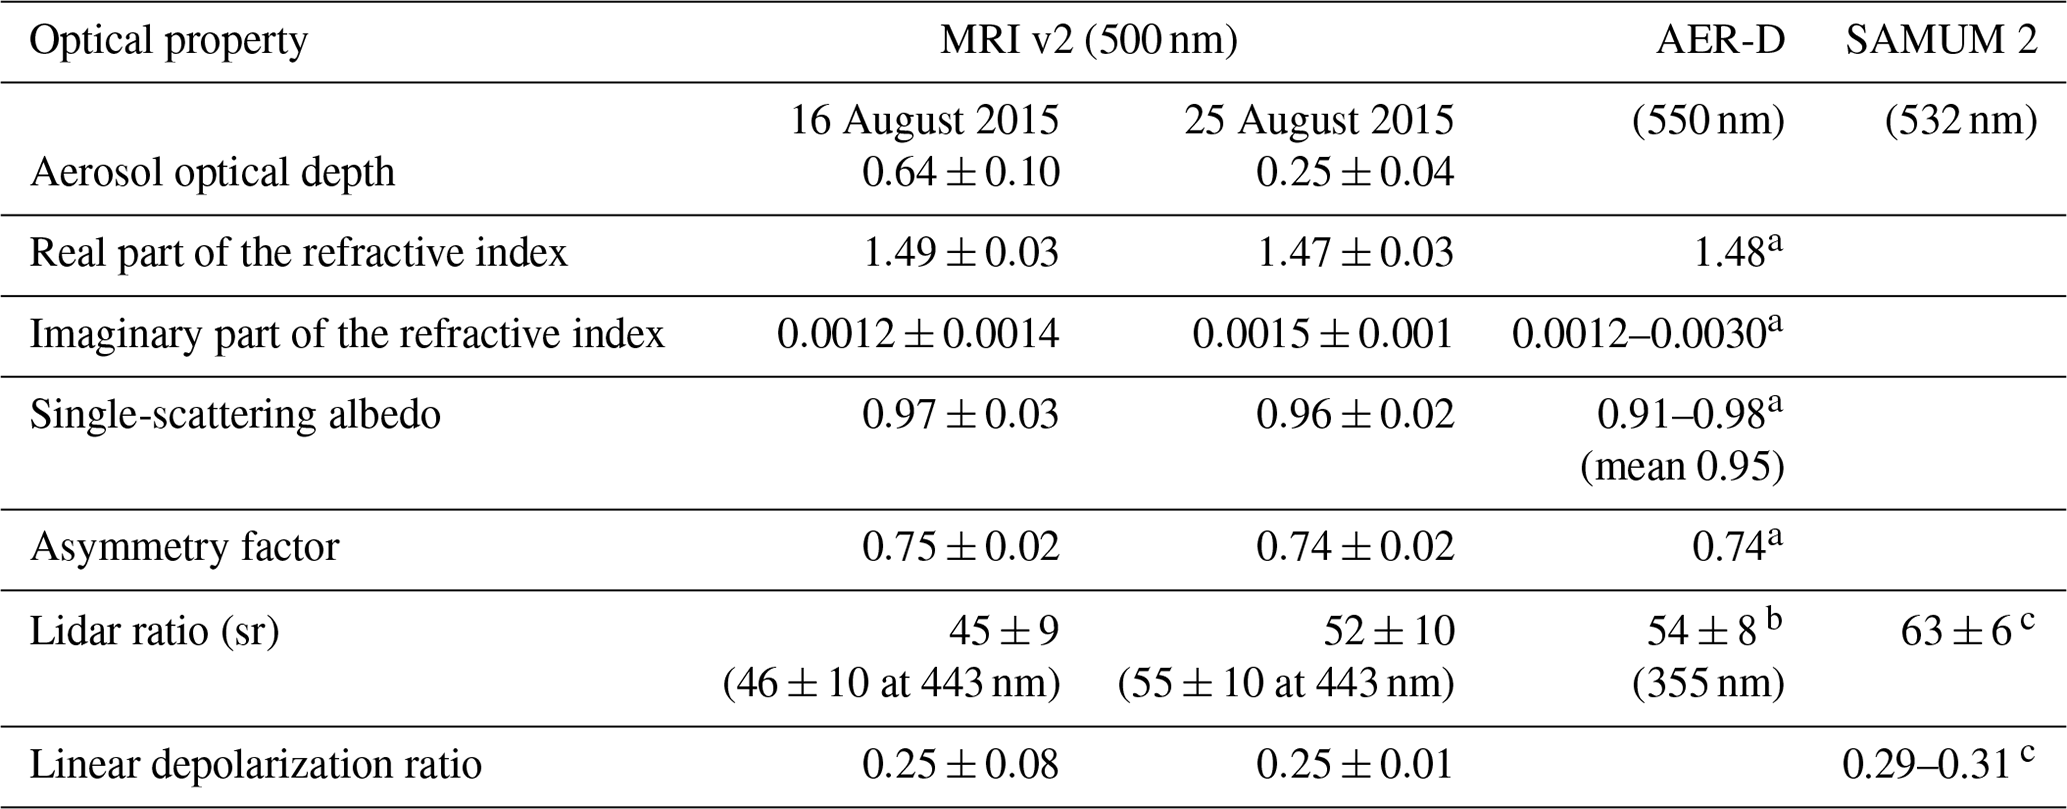
a Aircraft in situ measurements over the Cape Verde islands during AER-D in 2015 (Ryder et al., 2018). b Elastic backscatter lidar measurements over the Cape Verde islands during AER-D in 2015 (Marenco et al., 2018). c Raman lidar measurements over the Cape Verde islands during SAMUM 2 in 2008 (Groß et al., 2011).
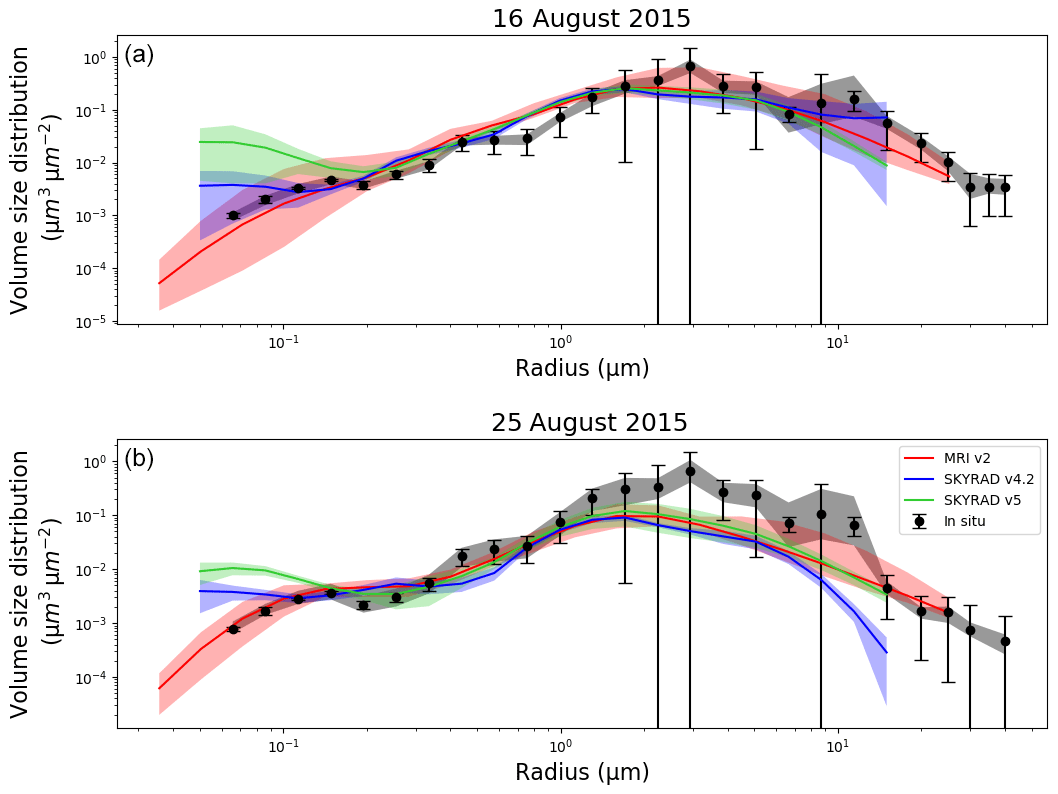
Figure 16Volume size distributions of the MRI v2 (red), Skyrad v4.2 (blue), and Skyrad v5 (green) retrievals as well as in situ measurements (black) on (a) 16 and (b) 25 August 2015 during SAVEX-D. The closed circle, error bar, and shaded area for the in situ measurements indicate the mean, measurement uncertainty, and uncertainty due to vertical integration. The solid line and shaded area for MRI v2 indicate the mean, minimum, and maximum. Solid lines and shaded areas for Skyrad v4.2 and v5 indicate the means and standard deviations.
Figure 16 shows the comparison of the VSD in the two flights. In addition to MRI v2, the retrievals of the Skyrad v4.2 and v5 were compared with the in situ measurements. In the result on 16 August, all the retrievals revealed a good performance for the coarse mode (radius >0.5 µm). The fine mode (radius <0.2 µm) of Skyrad v5 was overestimated. The fine mode of Skyrad v4.2 was slightly overestimated but agreed with the in situ measurements within the mean ± 1 standard deviation. All the retrievals failed to reproduce the peak of the VSD at the radius around 10 µm because the sky radiometer data at wavelengths from 443 to 1020 nm (1627 and 2200 nm are not available in the POM-01 model) and at scattering angles more than 3∘ do not have information on the VSD at a radius around 10 µm (Sect. 3.1 and Fig. B1). In the result on 25 August 2015, all the retrievals underestimated the VSD at radii larger than 1.0 µm, in particular the v4.2. For the radius <0.2 µm, all distributions displayed the same behavior as for 16 August. During the 25 August experiment, the sky radiometer, which was deployed at the ground site of Praia, measured direct and diffuse radiation in the southern direction. However, the flight was conducted close to the island of Sal, which is located northeast of Praia, at Santiago island. This spatial difference of the observations and the horizontal heterogeneity of the transported dust are the causes of the underestimation of the coarse mode. Overall, the MRI v2 showed good performances for both the fine and coarse modes of the VSD.
The LIR and DEP were not obtained from the aircraft in situ measurements. Therefore, the retrieved LIR and DEP were compared with the lidar measurements of Saharan dust during AER-D and SAMUM 2 (Table 7). The LIR of MRI v2 was 45±9 and 52±10 sr at 500 nm, and it was 46±10 and 55±10 sr at 443 nm, respectively, for 16 and 25 August. The LIR derived from the airborne elastic backscatter lidar during AER-D was 54±8 at 355 nm (Marenco et al., 2018). Although the wavelengths are different, the LIR of MRI v2 was close to that of the airborne lidar. It is shown that Saharan dust has similar values of LIR between 355 and 532 nm (e.g., Groß et al., 2015; Shin et al., 2018). The DEP of MRI v2 was 0.25±0.08 and 0.25±0.01 at 500 nm. The DEP was not obtained from the airborne lidar during AER-D. Therefore, the DEP of MRI v2 was compared with the ground-based Raman lidar measurements during the second field campaign of the Saharan Mineral Dust Experiment (SAMUM 2) in the literature. Groß et al. (2011) investigated the LIR and DEP of Saharan dust over Praia during SAMUM 2. The Raman lidar observations from 28 to 30 January 2008 show that the LIR was 63±6 sr at both 355 and 532 nm, and the DEP was about 0.3 at 532 nm. The LIR and DEP of MRI v2 were slightly smaller than the Raman lidar measurements. The MRI v2 retrieval is the columnar property including maritime aerosols in the boundary layer. Since the LIR of sea salt is around 20 sr and the DEP is near zero (e.g., Groß et al., 2015), sea salt contributes to decreasing both the LIR and DEP. Furthermore, Ryder et al. (2018) described the aspect ratio of the sampled particles in the flights during the AER-D campaign flights as slightly smaller than the typical value of Saharan dust. This would be the reason that the LIR and DEP of the sky radiometer retrievals were smaller than the lidar observations during SAMUM 2.
In summary, under dusty conditions, the physical and optical properties of Saharan dust retrieved by MRI v2 were broadly consistent with those of the aircraft in situ and lidar measurements. For further evaluation, in situ validations of the different species for other case studies, such as biomass burning aerosols, are necessary.
We developed a new method, Skyrad MRI v2, to retrieve aerosol columnar properties (volume size distribution, real and imaginary parts of the refractive index, single-scattering albedo, asymmetry factor, lidar ratio, and linear depolarization ratio), water vapor, and ozone from sky radiometer measurements. The advantages of MRI v2 are a full use of all the sky radiometer wavelengths from 315 to 2200 nm and application to two scanning patterns of the measurements in the ALM and PPL geometries. The use of all the wavelengths provides the aerosol properties covering the full shortwave band and enables the more accurate evaluation of the aerosol impacts on the atmospheric radiative budget. The Skyrad v4.2–v5 and MRI v1 were applicable to only the measurement in the ALM geometry, but we can analyze the measurements in the PPL geometry by using MRI v2. This increases the number of observations available, particularly at observation sites at low latitudes.
We have estimated the retrieval uncertainties of MRI v2 using simulated data with perturbations comparable to the uncertainties of the measured solar direct irradiance, diffuse radiance, and surface albedo. The resulting retrieval errors showed a dependency on the AOD and were small in the case of AODs larger than 0.2. The absolute values of biases ± uncertainties in the retrieval products at the near-ultraviolet, visible, and near-infrared wavelengths were less than 0.04 for the AOD, less than 0.05 for the RRI, less than 130 % for the IRI, less than 50 % for the VSD, less than 0.05 for the SSA, less than 0.02 for the ASM, less than 20 for the LIR, and less than 60 % for the DEP. The retrieval errors of the PWV and TO3 were less than 8 mm and 42 m atm-cm, respectively. Furthermore, the influence of the aerosol vertical profile on the retrieval was investigated. The impact of the aerosol vertical profile on the retrieval from the diffuse radiances in the ALM geometry was small. However, the aerosol vertical profile cannot be ignored in the retrieval from the diffuse radiances in the PPL geometry. The largest impacts of the aerosol vertical profile were observed in the diffuse radiances at backscattering angles. The increase in the diffuse radiances resulted in the overestimation of the SSA. The increase in the backward scattering relative to the forward scattering resulted in the underestimation of the ASM. The best solution of this problem is co-located observations of a sky radiometer and lidar, with a synergistic analysis (e.g., Kudo et al., 2016). Another solution may be a synergistic use of measurements in both the ALM and PPL geometries. The aerosol vertical profile affects the measurements in the PPL geometry, particularly at 940 nm. This implies that the aerosol vertical profile may be estimated from the measurements in the PPL geometry. In this aspect, scanning in both the ALM and PPL geometries should be conducted every time regardless of the solar zenith angle, although the standard scanning schedule in the ALM and PPL geometry depends on the solar zenith angle.
The MRI v2 was applied to measurements at Tsukuba, Japan. The results of aerosol physical and optical properties are compared with the Skyrad v4.2 and v5. The AOD, RRI, ASM showed good agreement. The IRI of MRI v2 was larger than those of the Skyrad v4.2 and v5. Hence, the SSA of MRI v2 was smaller than the Skyrad v4.2 and v5. In previous studies, it has been pointed out that the Skyrad v4.2 tends to overestimate the SSA compared to AERONET (Che et al., 2008; Estellés et al., 2012; Khatri et al., 2016). The MRI v2 overcomes this problem. The LIR of MRI v2 was larger than the one from Skyrad v4.2 and was closer to the HSRL measurements. This is because the MRI v2 considers non-spherical particles. The DEP of MRI v2 increased to about 0.2 in the dust cases in spring. The results were close to the Raman lidar measurements of the dust layers. The VSD of MRI v2 had a typical bimodal shape, but the Skyrad v4.2 had a trimodal shape. This behavior in Skyrad v4.2 is also pointed out by the works of Che et al. (2008) and Estellés et al. (2012). There is a possibility that the trimodal shape was due to the overly large diffuse radiances at scattering angles around 3∘. The problem was also improved in the MRI v2 retrieval. The PWV of MRI v2 agreed with the radiosonde measurements. The TO3 of MRI v2 was larger, about 25 m atm-cm, than the Brewer spectrophotometer measurements, but the seasonal change was consistent. The overestimation could be due to the calibration constant at 315 nm. Furthermore, we investigated the radiative closure of the surface solar irradiance between the measurements of BSRN and simulations using the retrieved aerosol optical properties, PWV, and TO3. The simulated surface solar irradiances agreed with the measurements, and the mean errors for the global irradiances were about +1 %.
The MRI v2 was compared with data from two flight periods during SAVEX-D 2015. The aerosol physical and optical properties retrieved in two events of transported Saharan dust were compared with those derived from the aircraft in situ measurements of the Saharan dust (Ryder et al., 2018; Marenco et al., 2018). The RRI, IRI, SSA, ASM, VSD, and LIR of MRI v2 agreed well with the aircraft in situ measurements. Furthermore, the LIR and DEP of MRI v2 were consistent with those of Saharan dust observed by the Raman lidar (Groß et al., 2011). The MRI v2 showed a good performance for dust. Recently, it has been shown that dust is substantially coarser than represented in current global climate models (Kok et al., 2017; Adebiyi and Kok, 2020). Theoretically, we showed that the size distribution at a radius greater than 10 µm can be retrieved by using sky radiometer measurements at 1627 and 2200 nm. Since the MRI v2 can utilize the measurements at 1627 and 2200 nm but the Skyrad v4.2–v5 and MRI v1 cannot, the remote sensing of SKYNET with MRI v2 would be useful to investigate dust particles.
MRI v2 brought out the performance of the sky radiometer more than ever, and the radiative closure experiment showed consistency between the surface solar radiation and the retrieved aerosol, water vapor, and ozone. MRI v2 would be useful for monitoring aerosols, water vapor, and ozone, as well as evaluating their impacts on surface solar radiation and validating satellite products and aerosol prediction models. For further development, co-located observations with a lidar are useful. The aerosol vertical profile is assumed in MRI v2, but the lidar improves it. The depolarization ratio from the lidar and the refractive index and size distribution from the sky radiometer would be useful to improve the scattering model of non-spherical particles, such as dust, soot, and volcanic ash particles. MRI v2 uses the same randomly oriented spheroid model with a fixed aspect ratio distribution as AERONET, but it is shown that there are inconsistencies in the spectral variabilities of the lidar ratio and depolarization ratio of dust particles between the lidar and AERONET sun photometer data, in particular in the near-ultraviolet wavelength range (Müller et al., 2010). Recently, various realistic particle models have been developed for dust (e.g., Ishimoto et al., 2010; Gasteiger et al., 2011), soot (e.g., Kahnert et al., 2013; Ishimoto et al., 2019), and volcanic ash (e.g., Lindqvist et al., 2011). The application of these models to sky radiometer and lidar data would improve the remote sensing of aerosols. The sky radiometer covers the major three wavelengths of the lidar: 355, 532, and 1064 nm. This may be an advantage compared to the AERONET sun photometer. Moreover, introducing polarization measurements to the sky radiometer may help to retrieve non-spherical particles. MRI v2 is useful for future study because the vector radiative transfer model is already incorporated into MRI v2.
The sky radiometer data at 315 nm were calibrated with reference to the daily mean TO3 observed by the Brewer spectrophotometer at the Aerological Observatory. The calibration procedure is as follows.
-
The AOD at wavelengths other than 315 nm is calculated from the solar direct irradiances.
-
The AOD at 315 nm is calculated by the extrapolation in the log–log plane of wavelength and AOD.
-
Select a day with conditions under which the daily change in the AOD is small. This is a condition required in the Langley method.
-
An initial value of the calibration constant at 315 nm is estimated by the Langley method.
-
Transmittance at 315 nm is calculated using the calibration constant at 315 nm.
-
The TO3 is estimated by minimizing the following objective function:
where Tobs is the observed transmittance of (5), and T(TO3) is the calculated transmittance by the same forward model described in Sect. 2.3. That is, the response functions of the interference filter and the vertical profiles of pressure, temperature, and ozone concentration are taken into account. This nonlinear least-square problem is solved by the Gauss–Newton method.
-
The daily mean TO3 is calculated.
-
The daily mean TO3 is compared with that observed by the Brewer spectrophotometer. If the difference is large, the calibration constant is changed manually; go back to (5). If the difference is small, the process is stopped. The threshold for the difference is defined as 3 m atm-cm, which is about 1 % of the climate value of the TO3: 310 m atm-cm at Tsukuba.
This procedure is currently not automated. We subjectively selected 15 d during the observation period at Tsukuba and estimated the calibration constants at 315 nm. Figure A1 shows the result of the calibration constant at 315 nm and the fitting line by the polynomial regression. The calibration constant drastically changed in a year. This feature is also pointed out by Khatri et al. (2014). We were not able to find the cause of this change in this study. Further investigation is necessary. The calibration constant obtained by the polynomial approximation was used in the analysis in Sect. 5.1.
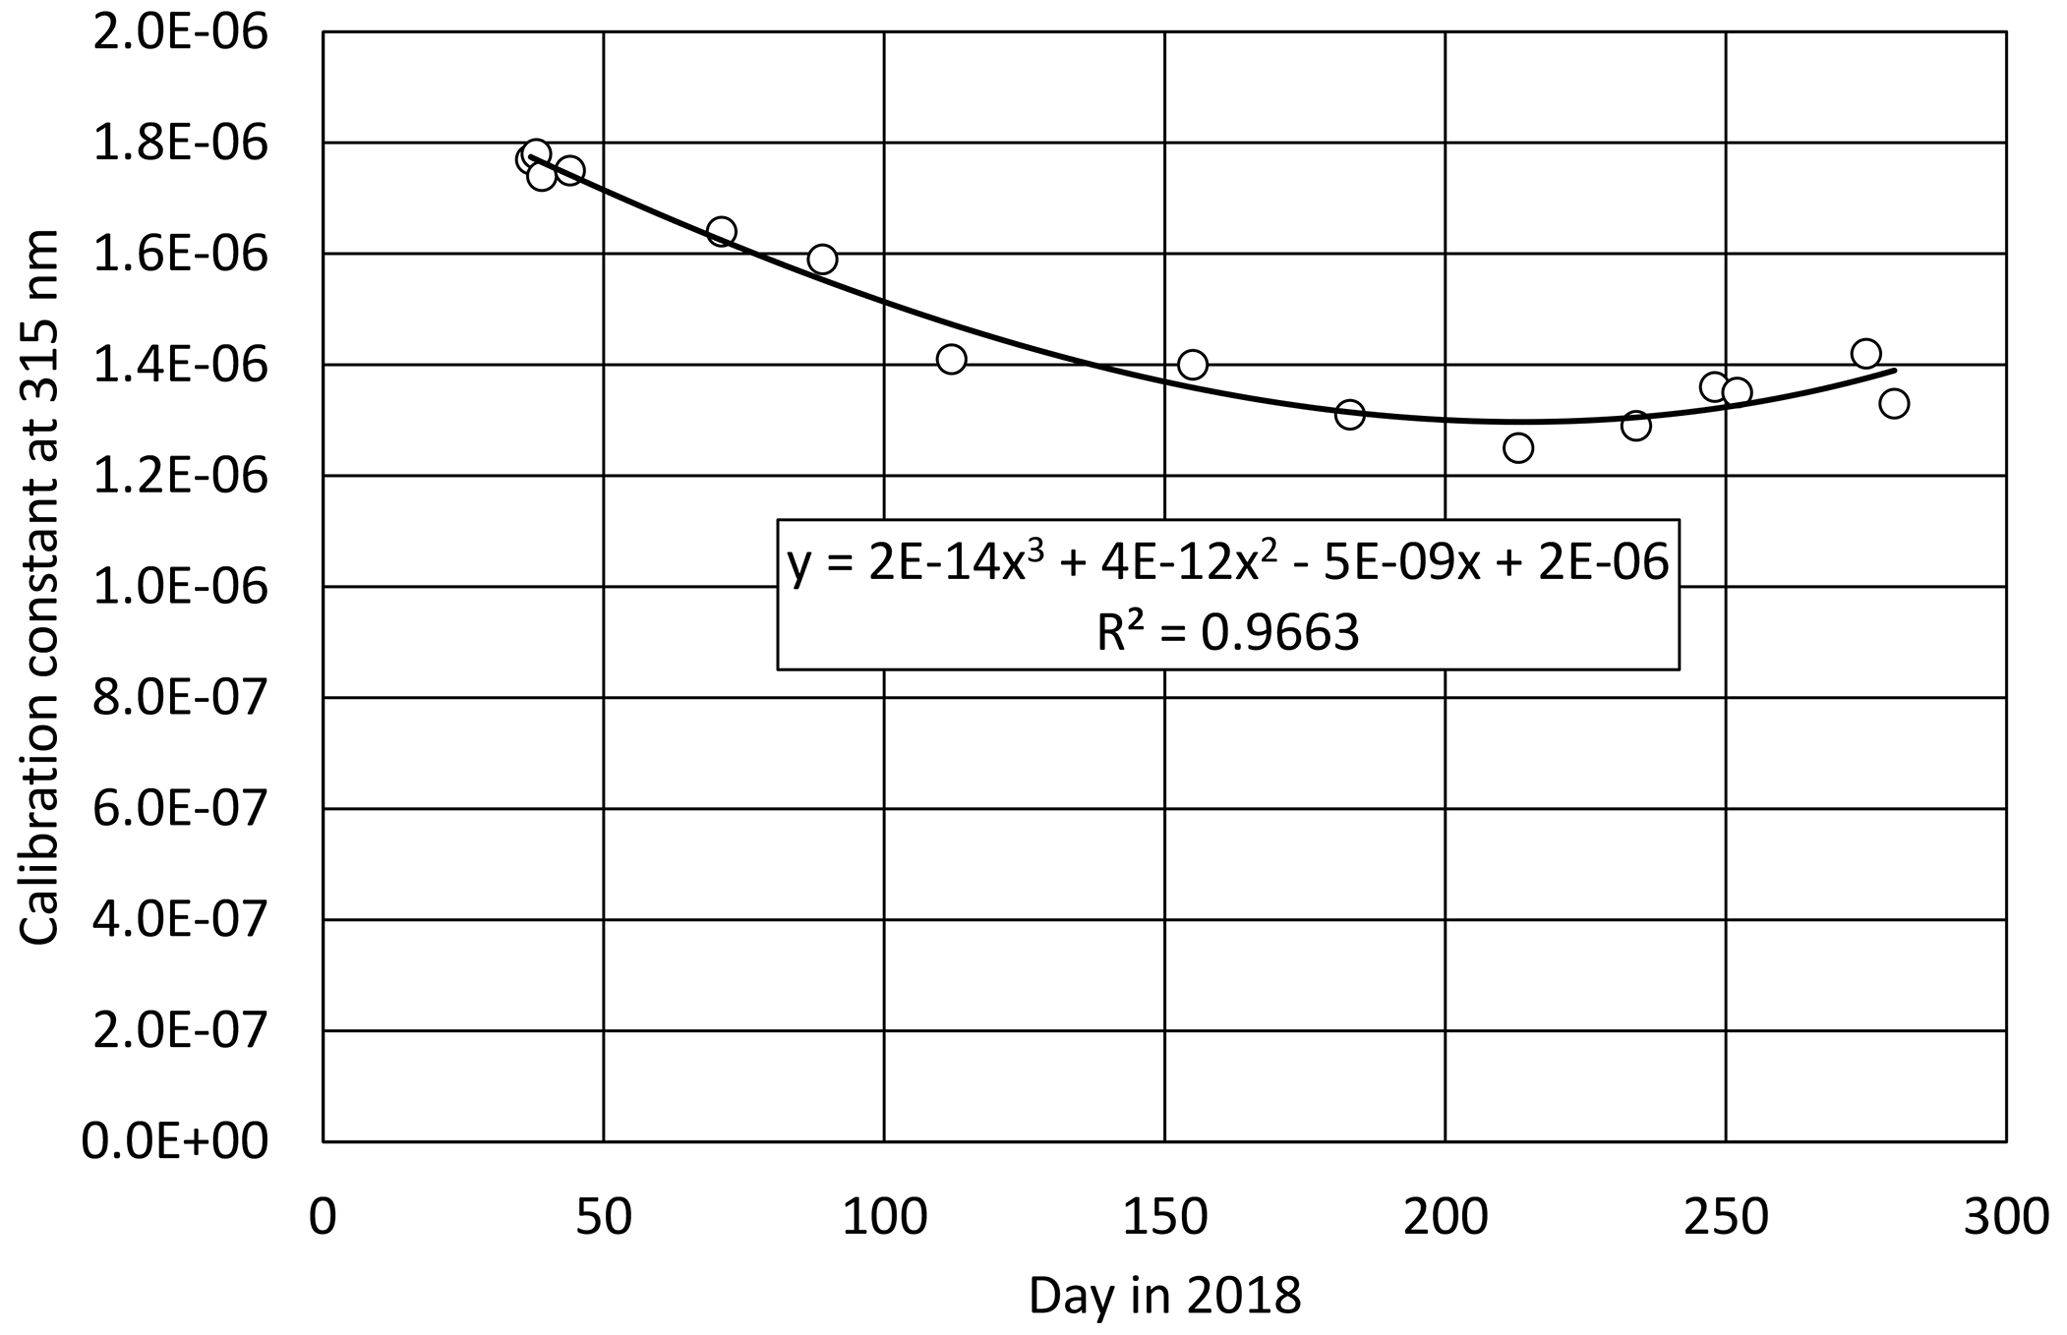
Figure A1Estimated calibration constant at 315 nm and the fitting line by the polynomial regression. R2 is the coefficient of determination.
Tonna et al. (1995) investigated the relation of the size distribution to the sun–sky photometer measurements based on Mie theory. The kernel functions for scattering and extinction relating to the phase function and optical depth were described as follows:
where x is size parameter, i1 and i2 are the Mie intensity functions, Qe is the extinction coefficient, θ is scattering angle, and is the complex refractive index. These functions are normalized to their integral over x and are investigated in Tonna et al. (1995). We also used the same functions but plotted the kernel functions as a function of the particle radius, taking the wavelength and the scattering angle as parameters (Fig. B1). Although Tonna et al. (1995) plotted the kernel functions at the scattering angles of 3, 10, 30, 60, and 120∘, we added the kernel functions at the scattering angle of 2∘ because the sky radiometer measures the diffuse radiances at the scattering angle of 2∘. From the behavior of the kernel functions in Fig. B1, we can see that the sky radiometer model POM-01 measurements, the wavelength of which is from 315 to 1020 nm, have information on the size distribution at the radius from 0.02 to 20 µm. Since the model POM-02 has measurements at wavelengths of 1627 and 2200 nm, the radius range is broader: from 0.02 to 30 µm.

Figure B1Normalized kernel functions for extinction and scattering at six scattering angles and at 11 wavelengths. The complex refractive index is assumed to be 1.45–.
The Skyrad pack MRI version 2 software is available on request by contacting the first author of the paper. The software program is coded in Fortran and is compiled on both Intel and GNU Fortran platforms.
The sky radiometer data are available on request by contacting the first author of the paper.
The supplement related to this article is available online at: https://doi.org/10.5194/amt-14-3395-2021-supplement.
RK developed the Skyrad MRI v2 code and performed the sky radiometer retrieval experiments. MC and HD intensively tested the Skyrad MRI v2 code on the SKYNET/Europe data. HD and MM improved the Skyrad MRI v2 code. RK, AU, AY, RN, NO, and HI carried out the observation at Tsukuba. VE, MC, FM, and CR proposed the SAVEX-D experiment. VE, FM, and CR worked in the AER-D and SAVEX-D mission science team implementing the airborne sampling strategy. OI and KN worked on the BSRN observations at Tsukuba, Japan. RK prepared the paper with contributions from all co-authors.
The authors declare that they have no conflict of interest.
This article is part of the special issue “SKYNET – the international network for aerosol, clouds, and solar radiation studies and their applications (AMT/ACP inter-journal SI)”. It does not belong to a conference.
The authors are grateful to the OpenCLASTR project for allowing us to use SKYRAD.PACK, RSTAR, and PSTAR in this research. The SAVEX-D campaign airborne data were obtained using the BAe-146-301 Atmospheric Research Aircraft operated by Airtask Ltd and managed by the Facility for Airborne Atmospheric Measurements (FAAM). It was a success thanks to many staff members at the Met Office, the University of Leeds, the University of Manchester, the University of Hertfordshire, FAAM, Directflight Ltd, Avalon Engineering, and BAE Systems.
This research has been supported by the Japan Society for the Promotion of Science KAKENHI (grant no. 15H01728), the EUFAR TNA project (European Union Seventh Framework Programme (grant agreement no. 312609)), and the Spanish Ministry of Economy and Competitiveness–European Regional Development Fund (project nos. CGL2017-86966-R and RTI2018-096548-B-I00).
This paper was edited by Stelios Kazadzis and reviewed by three anonymous referees.
Adebiyi, A. A. and Kok, J. F.: Climate models miss most of the coarse dust in the atmosphere, Sci. Adv., 6, eaaz9507, https://doi.org/10.1126/sciadv.aaz9507, 2020.
Aoki, T., Tanaka, T. Y., Uchiyama, A., Chiba, M., Mikami, M., Yabuki, S., and Key, J. R.: Sensitivity experiments of direct radiative forcing caused by mineral dust simulated with a chemical transport model, J. Meteorol. Soc. Jpn., 83, 315–331, https://doi.org/10.2151/jmsj.83A.315, 2005.
Asano, S. and Shiobara, M.: Aircraft measurements of the radiative effects of tropospheric aerosols: I. Observational results of the radiation budget, J. Meteorol. Soc. Jpn., 67, 847–861, https://doi.org/10.2151/jmsj1965.67.5_847, 1989.
Bruegge, C. J., Conel, J. E., Green, R. O., Margolis, J. S., Holm, R. G., and Toon, G.: Water vapor column abundance retrievals during FIFE, J. Geophys. Res., 97, 18759–18768, 1992.
Campanelli, M., Nakajima, T., Khatri, P., Takamura, T., Uchiyama, A., Estelles, V., Liberti, G. L., and Malvestuto, V.: Retrieval of characteristic parameters for water vapour transmittance in the development of ground-based sun–sky radiometric measurements of columnar water vapour, Atmos. Meas. Tech., 7, 1075–1087, https://doi.org/10.5194/amt-7-1075-2014, 2014.
Campanelli, M., Mascitelli, A., Sanò, P., Diémoz, H., Estellés, V., Federico, S., Iannarelli, A. M., Fratarcangeli, F., Mazzoni, A., Realini, E., Crespi, M., Bock, O., Martínez-Lozano, J. A., and Dietrich, S.: Precipitable water vapour content from ESR/SKYNET sun–sky radiometers: validation against GNSS/GPS and AERONET over three different sites in Europe, Atmos. Meas. Tech., 11, 81–94, https://doi.org/10.5194/amt-11-81-2018, 2018.
Che, H., Shi, G., Uchiyama, A., Yamazaki, A., Chen, H., Goloub, P., and Zhang, X.: Intercomparison between aerosol optical properties by a PREDE skyradiometer and CIMEL sunphotometer over Beijing, China, Atmos. Chem. Phys., 8, 3199–3214, https://doi.org/10.5194/acp-8-3199-2008, 2008.
Driemel, A., Augustine, J., Behrens, K., Colle, S., Cox, C., Cuevas-Agulló, E., Denn, F. M., Duprat, T., Fukuda, M., Grobe, H., Haeffelin, M., Hodges, G., Hyett, N., Ijima, O., Kallis, A., Knap, W., Kustov, V., Long, C. N., Longenecker, D., Lupi, A., Maturilli, M., Mimouni, M., Ntsangwane, L., Ogihara, H., Olano, X., Olefs, M., Omori, M., Passamani, L., Pereira, E. B., Schmithüsen, H., Schumacher, S., Sieger, R., Tamlyn, J., Vogt, R., Vuilleumier, L., Xia, X., Ohmura, A., and König-Langlo, G.: Baseline Surface Radiation Network (BSRN): structure and data description (1992–2017), Earth Syst. Sci. Data, 10, 1491–1501, https://doi.org/10.5194/essd-10-1491-2018, 2018.
Dubovik, O. and King, M. D.: A flexible inversion algorithm for retrieval of aerosol optical properties from sun and sky radiance measurements, J. Geophys. Res.-Atmos., 105, 20673–20696, https://doi.org/10.1029/2000JD900282, 2000.
Dubovik, O., Smirnov, A., Holben, B. N., King, M. D., Kaufman, Y. J., Eck, T. F., and Slutsker, I.: Accuracy assessments of aerosol optical properties retrieved from aerosol robotic network (AERONET) sun and sky radiance measurements, J. Geophys. Res.-Atmos., 105, 9791–9806, https://doi.org/10.1029/2000JD900040, 2000.
Dubovik, O., Holben, B., Eck, T. F., Smirnov, A., Kaufman, Y. J., King, M. D., Tanré, D., and Slutsker, I.: Variability of absorption and optical properties of key aerosol types observed in worldwide locations, J. Atmos. Sci., 59, 590–608, https://doi.org/10.1175/1520-0469(2002)059<0590:voaaop>2.0.co;2, 2002.
Dubovik, O., Sinyuk, A., Lapyonok, T., Holben, B. N., Mishchenko, M., Yang, P., Eck, T. F., Volten, H., Muñoz, O., Veilhelmann, B., van der Zande, W. J., Leon, J. F., Sorokin, M., and Slutsker, I.: Application of spheroid models to account for aerosol particle nonsphericity in remote sensing of desert dust, J. Geophys. Res., 111, D11208, https://doi.org/10.1029/2005JD006619, 2006.
Estellés, V., Campanelli, M., Utrillas, M. P., Expósito, F., and Martínez-Lozano, J. A.: Comparison of AERONET and SKYRAD4.2 inversion products retrieved from a Cimel CE318 sunphotometer, Atmos. Meas. Tech., 5, 569-579, https://doi.org/10.5194/amt-5-569-2012, 2012.
Estellés, V., Marenco, F., Ryder, C., Segura, S., O'sullivan, D., Brooke, J., Campanelli, M., Buxmann, J., and Martínez-Lozano, J. A.: Validation of AERONET and ESR/SKYNET size distributions with airborne in situ measurementsin dust conditions, in: 9th International Workshop on Sand/Duststorms and Associated Dustfall, Tenerife, Spain, 22–24 May 2018.
Evangeliou, N., Grythe, H., Klimont, Z., Heyes, C., Eckhardt, S., Lopez-Aparicio, S., and Stohl, A.: Atmospheric transport is a major pathway of microplastics to remote regions, Nat. Commun., 11, 3381, https://doi.org/10.1038/s41467-020-17201-9, 2020.
Gasteiger, J., Wiegner, M., Groß, S., Freudenthaler, V., Toledano, C., Tesche, M., and Kandler, K.: Modeling lidar-relevant optical properties of complex mineral dust aerosols, Tellus B, 63, 725–741, https://doi.org/10.1111/j.1600-0889.2011.00559.x, 2011.
Groß, S., Wiegner, M., Freudenthaler, V., and Toledano, C.: Lidar ratio of Saharan dust over Cape Verde Islands: Assessment and error calculation, J. Geophys. Res., 116, D15203, https://doi.org/10.1029/2010JD015435, 2011.
Groß, S., Freudenthaler, V., Schepanski, K., Toledano, C., Schäfler, A., Ansmann, A., and Weinzierl, B.: Optical properties of long-range transported Saharan dust over Barbados as measured by dual-wavelength depolarization Raman lidar measurements, Atmos. Chem. Phys., 15, 11067–11080, https://doi.org/10.5194/acp-15-11067-2015, 2015.
Halthore, R. N., Eck, T. F., Holben, B. N., and Markham, B. L.: Sun photometric measurements of atmospheric water vapor column abundance in the 940 nm band, J. Geophys. Res.-Atmos., 102, 4343–4352, https://doi.org/10.1029/96JD03247, 1997.
Hansen, J. E. and Travis, L. D.: Light scattering in planetary atmospheres, Space Sci. Rev., 16, 527–610, https://doi.org/10.1007/BF00168069, 1974.
Hashimoto, M., Nakajima, T., Dubovik, O., Campanelli, M., Che, H., Khatri, P., Takamura, T., and Pandithurai, G.: Development of a new data-processing method for SKYNET sky radiometer observations, Atmos. Meas. Tech., 5, 2723–2737, https://doi.org/10.5194/amt-5-2723-2012, 2012.
Hess, M., Koepke, P., and Schult, I.: Optical Properties of Aerosols and Clouds: The Software Package OPAC, B. Am. Meteorol. Soc., 79, 831–844, https://doi.org/10.1175/1520-0477(1998)079<0831:OPOAAC>2.0.CO;2, 1998.
Holben, B. N., Eck, T. F., Slutsker, I., Tanré, D., Buis, J. P., Setzer, A., Vermote, E., Reagan, J. A., Kaufman, Y. J., Nakajima, T., Lavenu, F., Jankowiak, I., and Smirnov, A.: AERONET – A federated instrument network and data archive for aerosol characterization, Remote Sens. Environ., 66, 1–16, https://doi.org/10.1016/S0034-4257(98)00031-5, 1998.
IPCC: Climate Change 2013: The Physical Science Basis, in: Contribution of Working Group I to the Fifth Assessment Report of the Intergovernmental Panel on Climate Change (IPCC), edited by: Stocker, T. F., Qin, D., Plattner, G.-K., Tignor, M., Allen, S. K., Boschung, J., Nauels, A., and Xia, Y., Cambridge University Press, Cambridge, UK and New York, USA, 2013.
Ishimoto, H., Zaizen, Y., Uchiyama, A., Masuda, K., and Mano, Y.: Shape modeling of mineral dust particles for light-scattering calculations using the spatial Poisson-Voronoi tessellation, J. Quant. Spectrosc. Ra., 111, 2434–2443, https://doi.org/10.1016/j.jqsrt.2010.06.018, 2010.
Ishimoto, H., Kudo, R., and Adachi, K.: A shape model of internally mixed soot particles derived from artificial surface tension, Atmos. Meas. Tech., 12, 107–118, https://doi.org/10.5194/amt-12-107-2019, 2019.
Kahnert, M., Nousiainen, T., and Lindqvist, H.: Models for integrated and differential scattering optical properties of encapsulated light absorbing carbon aggregates, Opt. Express, 21, 7974–7993, 2013.
Khatri, P., Takamura, T., Yamazaki, A., and Uchiyama, A.: Use of 315 nm channel data of the sky radiometer to estimate the columnar ozone concentration: A preliminary study, J. Meteorol. Soc. Jpn., 92, 185–194, https://doi.org/10.2151/jmsj.2014-A12, 2014.
Khatri, P., Takamura, T., Nakajima, T., Estelles, V., Irie, H., Kuze, H., Campanelli, M., Sinyuk, A., Lee, S.-M., Sohn, B. J., Pandithurai, G., Kim, S.-W., Yoon, S. C., Martinez-Lozano, J. A., Hashimoto, M., Devara, P. C. S., and Manago, N.: Factors for inconsistent aerosol single scattering albedo between SKYNET and AERONET, J. Geophys. Res.-Atmos., 121, 1859–1877, https://doi.org/10.1002/2015JD023976, 2016.
Kobayashi, E., Uchiyama, A., Yamazaki, A., and Matsuse, K.: Application of the statistical optimization method to the inversion algorithm for analyzing aerosol optical properties from sun and sky radiance measurements, J. Meteorol. Soc. Jpn., 84, 1047–1062, https://doi.org/10.2151/jmsj.84.1047, 2006.
Kobayashi, E., Uchiyama, A., Yamazaki, A., and Kudo, R.: Retrieval of aerosol optical properties based on the spheroid model, J. Meteorol. Soc. Jpn., 88, 847–856, https://doi.org/10.2151/jmsj.2010-505, 2010.
Kok, J. F., Ridley, D. A., Zhou, Q., Miller, R. L., Zhao, C., Heald, C. L., Ward, D. S., Albani, S., and Haustein, K.: Smaller desert dust cooling effect estimated from analysis of dust size and abundance, Nat. Geosci., 10, 274–278, 2017.
Kole, P. J., Löhr, A. J., Van Belleghem, F. G. A. J., and Ragas, A. M. J.: Wear and tear of tyres: a stealthy source of microplastics in the environment, Int. J. Environ. Res. Pu., 14, 1265, https://doi.org/10.3390/ijerph14101265, 2017.
Kudo, R., Uchiyama, A., Yamazaki, A., and Kobayashi, E.: Seasonal characteristics of aerosol radiative effect estimated from ground-based solar radiation measurements in Tsukuba, Japan, J. Geophys. Res., 115, D01204, https://doi.org/10.1029/2009JD012487, 2010.
Kudo, R., Uchiyama, A., Yamazaki, A., Sakami, T., and Ijima, O.: Decadal changes in aerosol optical thickness and single scattering albedo estimated from ground-based broadband radiometers: A case study in Japan, J. Geophys. Res., 116, D03207, https://doi.org/10.1029/2010JD014911, 2011.
Kudo, R., Nishizawa, T., and Aoyagi, T.: Vertical profiles of aerosol optical properties and the solar heating rate estimated by combining sky radiometer and lidar measurements, Atmos. Meas. Tech., 9, 3223–3243, https://doi.org/10.5194/amt-9-3223-2016, 2016.
Kudo, R., Aoyagi, T., and Nishizawa, T.: Characteristics of aerosol vertical profiles in Tsukuba, Japan, and their impacts on the evolution of the atmospheric boundary layer, Atmos. Meas. Tech., 11, 3031–3046, https://doi.org/10.5194/amt-11-3031-2018, 2018.
Lindqvist, H., Nousiainen, T., Zubko, E., and Muñoz, O.: Optical modelling of vesicular volcanic ash particles, J. Quant. Spectrosc. Ra., 112, 1871–1880, 2011.
Marenco, F., Ryder, C., Estellés, V., O'Sullivan, D., Brooke, J., Orgill, L., Lloyd, G., and Gallagher, M.: Unexpected vertical structure of the Saharan Air Layer and giant dust particles during AER-D, Atmos. Chem. Phys., 18, 17655–17668, https://doi.org/10.5194/acp-18-17655-2018, 2018.
McArthur, L. J. B.: Baseline Surface Radiation Network (BSRN): operations manual, version 2.1, WCRP-121, WMO/TD-No. 1274, WCRP/WMO, available at: https://library.wmo.int/index.php?lvl=notice_display&id=11741#.YHPdsOj7RZc (last access: 13 April 2021), 2005.
Momoi, M., Kudo, R., Aoki, K., Mori, T., Miura, K., Okamoto, H., Irie, H., Shoji, Y., Uchiyama, A., Ijima, O., Takano, M., and Nakajima, T.: Development of on-site self-calibration and retrieval methods for sky-radiometer observations of precipitable water vapor, Atmos. Meas. Tech., 13, 2635–2658, https://doi.org/10.5194/amt-13-2635-2020, 2020.
Müller, D., Ansmann, A., Freudenthaler, V., Kandler, K., Toledano, C., Hiebsch, A., Gasteiger, J., Esselborn, M., Tesche, M., Heese, B., Althausen, D., Weinzierl, B., Petzold, A., and von Hoyningen-Huene, W.: Mineral dust observed with AERONET Sun photometer, Raman lidar, and in situ instruments during SAMUM 2006: Shape-dependent particle properties, J. Geophys. Res.-Atmos., 115, D11207, https://doi.org/10.1029/2009JD012523, 2010.
Nakajima, T. and Tanaka, M.: Matrix formulations for the transfer of solar radiation in a plane-parallel scattering atmosphere, J. Quant. Spectrosc. Ra., 35, 13–21, https://doi.org/10.1016/0022-4073(86)90088-9, 1986.
Nakajima, T. and Tanaka, M.: Algorithms for radiative intensity calculations in moderately thick atmospheres using a truncation approximation, J. Quant. Spectrosc. Ra., 40, 51–69, https://doi.org/10.1016/0022-4073(88)90031-3, 1988.
Nakajima, T., Tonna, G., Rao, R., Kaufman, Y., and Holben, B.: Use of sky brightness measurements from ground for remote sensing of particulate polydispersions, Appl. Optics, 35, 2672–2686, https://doi.org/10.1364/AO.35.002672, 1996.
Nakajima, T., Campanelli, M., Che, H., Estellés, V., Irie, H., Kim, S.-W., Kim, J., Liu, D., Nishizawa, T., Pandithurai, G., Soni, V. K., Thana, B., Tugjsurn, N.-U., Aoki, K., Go, S., Hashimoto, M., Higurashi, A., Kazadzis, S., Khatri, P., Kouremeti, N., Kudo, R., Marenco, F., Momoi, M., Ningombam, S. S., Ryder, C. L., Uchiyama, A., and Yamazaki, A.: An overview of and issues with sky radiometer technology and SKYNET, Atmos. Meas. Tech., 13, 4195–4218, https://doi.org/10.5194/amt-13-4195-2020, 2020.
Nishizawa, T., Asano, S., Uchiyama, A., and Yamazaki, A.: Seasonal variation of aerosol direct radiative forcing and optical properties estimated from ground-based solar radiation measurements, J. Atmos. Sci., 61, 57–72, https://doi.org/10.1175/1520-0469(2004)061<0057:SVOADR>2.0.CO;2, 2004.
Ota, Y., Higurashi, A., Nakajima, T., and Yokota, T.: Matrix formulations of radiative transfer including the polarization effect in a coupled atmosphere-ocean system, J. Quant. Spectrosc. Ra., 111, 878–894, https://doi.org/10.1016/j.jqsrt.2009.11.021, 2010.
Reagan, J. A., Thomason, L. W., Herman, B. M., and Palmer, J. M.: Assessment of atmospheric limitations on the determination of the solar spectral constant from ground-based spectroradiometer measurements, IEEE T. Geosci. Remote, GE-24, 258–265, https://doi.org/10.1109/TGRS.1986.289645, 1986.
Ryder, C. L., Marenco, F., Brooke, J. K., Estelles, V., Cotton, R., Formenti, P., McQuaid, J. B., Price, H. C., Liu, D., Ausset, P., Rosenberg, P. D., Taylor, J. W., Choularton, T., Bower, K., Coe, H., Gallagher, M., Crosier, J., Lloyd, G., Highwood, E. J., and Murray, B. J.: Coarse-mode mineral dust size distributions, composition and optical properties from AER-D aircraft measurements over the tropical eastern Atlantic, Atmos. Chem. Phys., 18, 17225–17257, https://doi.org/10.5194/acp-18-17225-2018, 2018.
Sakai, T., Nagai, T., Nakazato, M., Mano, Y., and Matsumura, T.: Ice clouds and Asian dust studied with lidar measurements of particle extinction-to-backscatter ratio, particle depolarization, and water-vapor mixing ratio over Tsukuba, Appl. Optics, 42, 7103–7116, https://doi.org/10.1364/ao.42.007103, 2003.
Sekiguchi, M. and Nakajima, T.: A k-distribution-based radiation code and its computational optimization for an atmospheric general circulation model, J. Quant. Spectrosc. Ra., 109, 2779–2793, https://doi.org/10.1016/j.jqsrt.2008.07.013, 2008.
Shin, S.-K., Tesche, M., Kim, K., Kezoudi, M., Tatarov, B., Müller, D., and Noh, Y.: On the spectral depolarisation and lidar ratio of mineral dust provided in the AERONET version 3 inversion product, Atmos. Chem. Phys., 18, 12735–12746, https://doi.org/10.5194/acp-18-12735-2018, 2018.
Sugimoto, N., Shimizu, A., Matsui, I., Uno, I., Arao, K., Dong, X., Zhao, S., Zhou, J., and Lee C.-H.: Study of asian dust phenomena in 2001–2003 using a network of continuously operated polarization lidars, Water Air Soil Poll., 5, 145–157, https://doi.org/10.1007/s11267-005-0732-1, 2005.
Tatarov, B., Sugimoto, N., Matsui, I., and Shimizu, A.: Two-Year-Observations of Optical Properties of the Tropospheric Aerosol and Clouds by a High-Spectral-Resolution Lidar over Tsukuba, Japan, in: Reviewed and Revised Papers Presented at the 23rd International Laser Radar Conference (23ILRC), Nara, Japan, 23–28 July 2006, 451–454, 25 July 2006.
Tonna, G., Nakajima, T., and Rao, R.: Aerosol features retrieved from solar aureole data: a simulation study concerning a turbid atmosphere, Appl. Optics, 34, 4486–4499, https://doi.org/10.1364/ao.34.004486, 1995.
Torres, B., Dubovik, O., Toledano, C., Berjon, A., Cachorro, V. E., Lapyonok, T., Litvinov, P., and Goloub, P.: Sensitivity of aerosol retrieval to geometrical configuration of ground-based sun/sky radiometer observations, Atmos. Chem. Phys., 14, 847–875, https://doi.org/10.5194/acp-14-847-2014, 2014.
Uchiyama, A., Yamazaki, A., Kudo, R., Kobayashi, E., Togawa, H., and Uesawa, D.: Continuous ground-based observation of aerosol optical properties at Tsukuba, Japan: trend and climatology, J. Meteorol. Soc. Jpn., 92, 93–108, https://doi.org/10.2151/jmsj.2014-A06, 2014a.
Uchiyama, A., Yamazaki, A., and Kudo, R.: Column water vapor retrievals from sky radiometer (POM-02) 940 nm data, J. Meteorol. Soc. Jpn., 92, 195–203, https://doi.org/10.2151/jmsj.2014-A13, 2014b.
Uchiyama, A., Matsunaga, T., and Yamazaki, A.: The instrument constant of sky radiometers (POM-02) – Part 1: Calibration constant, Atmos. Meas. Tech., 11, 5363–5388, https://doi.org/10.5194/amt-11-5363-2018, 2018a.
Uchiyama, A., Matsunaga, T., and Yamazaki, A.: The instrument constant of sky radiometers (POM-02) – Part 2: Solid view angle, Atmos. Meas. Tech., 11, 5389–5402, https://doi.org/10.5194/amt-11-5389-2018, 2018b.
Uchiyama, A., Shiobara, M., Kobayashi, H., Matsunaga, T., Yamazaki, A., Inei, K., Kawai, K., and Watanabe, Y.: Nocturnal aerosol optical depth measurements with modified sky radiometer POM-02 using the moon as a light source, Atmos. Meas. Tech., 12, 6465–6488, https://doi.org/10.5194/amt-12-6465-2019, 2019.
- Abstract
- Introduction
- Data
- Algorithms
- Uncertainties in retrieval products
- Application to real measurements
- Summary and conclusion
- Appendix A: Calibration of 315 nm
- Appendix B: Relation of the size distribution to the sky radiometer measurements
- Code availability
- Data availability
- Author contributions
- Competing interests
- Special issue statement
- Acknowledgements
- Financial support
- Review statement
- References
- Supplement