the Creative Commons Attribution 4.0 License.
the Creative Commons Attribution 4.0 License.
 | 12 May 2021
Beef cattle methane emissions measured with tracer-ratio and inverse dispersion modelling techniques
José I. Velazco
Trevor W. Coates
Frances A. Phillips
Thomas K. Flesch
Julian Hill
David G. Mayer
Nigel W. Tomkins
Roger S. Hegarty
Deli Chen
The development and validation of management practices to mitigate greenhouse gas (GHG) emissions from livestock require accurate emission measurements. This study assessed the accuracy of a practical inverse dispersion modelling (IDM) technique to quantify methane (CH4) emitted from a small cattle herd (16 animals) confined to a 63 m × 60 m experimental pen. The IDM technique calculates emissions from the increase in the CH4 concentration measured downwind of the animals. The measurements were conducted for 7 d. Two types of open-path (OP) gas sensors were used to measure concentration in the IDM calculation: a Fourier transform infrared spectrometer (IDM-FTIR) or a CH4 laser (IDM-Laser). The actual cattle emission rate was measured with a tracer-ratio technique using nitrous oxide (N2O) as the tracer gas. We found very good agreement between the two IDM emission estimates (308.1 ± 2.1 – mean ± SE – and 304.4 ± 8.0 g CH4 head−1 d−1 for the IDM-FTIR and IDM-Laser respectively) and the tracer-ratio measurements (301.9 ± 1.5 g CH4 head−1 d−1). This study suggests that a practical IDM measurement approach can provide an accurate method of estimating cattle emissions.
- Article
(1728 KB) - Full-text XML
- BibTeX
- EndNote


Agriculture is the main source of anthropogenic methane (CH4) emitted to the atmosphere, which includes emissions from ruminants, rice agriculture, waste treatment, and biomass burning (Solomon et al., 2007). Methane is an important greenhouse gas (GHG) with a global warming potential that is 28 times that of carbon dioxide (CO2) in a 100 year time frame (Myhre et al., 2013). Enteric CH4 from livestock is a major source of GHG emissions. A significant effort is being made to mitigate these emissions through diet modification, feed supplements, farm management, grazing strategies, and animal breeding (Min et al., 2020; Vyas et al., 2018), with ruminant nutritional management strategies seen as the most direct impact mitigation option (Cottle et al., 2011). Increasingly there is a requirement for mitigation claims to be validated when these practices are applied on farms (DoE, 2014), and simple and accurate methods for on-farm emission measurements are needed.
On-farm CH4 emissions from beef cattle have been measured using three main techniques:
-
Portable respiration hoods for tethered and non-tethered animals (Garnsworthy et al., 2012; Zimmerman and Zimmerman, 2012) directly measure the gas concentration of incoming and exhaust air from individual animals. However, this technique limits the animal's movements, requires intensive training for animals and labour, and it does not account for emissions from the animal's rectum.
-
Tracer-ratio gas releases from the animal (Johnson et al., 1994), such as SF6 (Grainger et al., 2007), assumes that the tracer gas and the emitted CH4 have similar transport paths, so that a tracer measurement can establish the CH4 emission rate. This is a simple technique, but there are challenges with logistics and handling animals that are similar to the respiration hood technique.
-
Micrometeorological techniques are typically considered a herd-scale measurement, where the emission rate is calculated from the measurement of enhanced gas concentrations downwind of an animal herd (Harper et al., 2011), and these include the mass balance technique (Laubach et al., 2008; Lockyer and Jarvis, 1995), eddy covariance (Dengel et al., 2011; Felber et al., 2015), and inverse dispersion techniques (Flesch et al., 2005; Todd et al., 2014). The main advantage of micrometeorological techniques is that they do not interfere with the animals or the environment.
The objective of this study was to examine the accuracy of a practical inverse dispersion modelling (IDM) technique for measuring CH4 emissions from beef cattle. The IDM technique offers the possibility of relatively simple emission measurements, without the need for animal handling or modifying animal behaviour. In this study, two IDM techniques are used to measure emissions from a small herd of confined cattle, and the results are tested against a robust tracer-ratio-based measurement.
2.1 Experimental design
The study took place at the Chiswick Pastoral Research Laboratory (30∘37′ S, 151∘33′ E) in Armidale, New South Wales, Australia, in February 2013. Methane emissions were measured from 16 Angus steers placed in a temporary 63 m × 60 m pen (Fig. 1) located in a flat and open field. There were no other cattle or animal manure storages nearby during the study, and the nearest trees (30 m height) were at least 300 m from the site. Vegetation in the field was removed prior to the study, and no pasture was available for the animals to graze on.
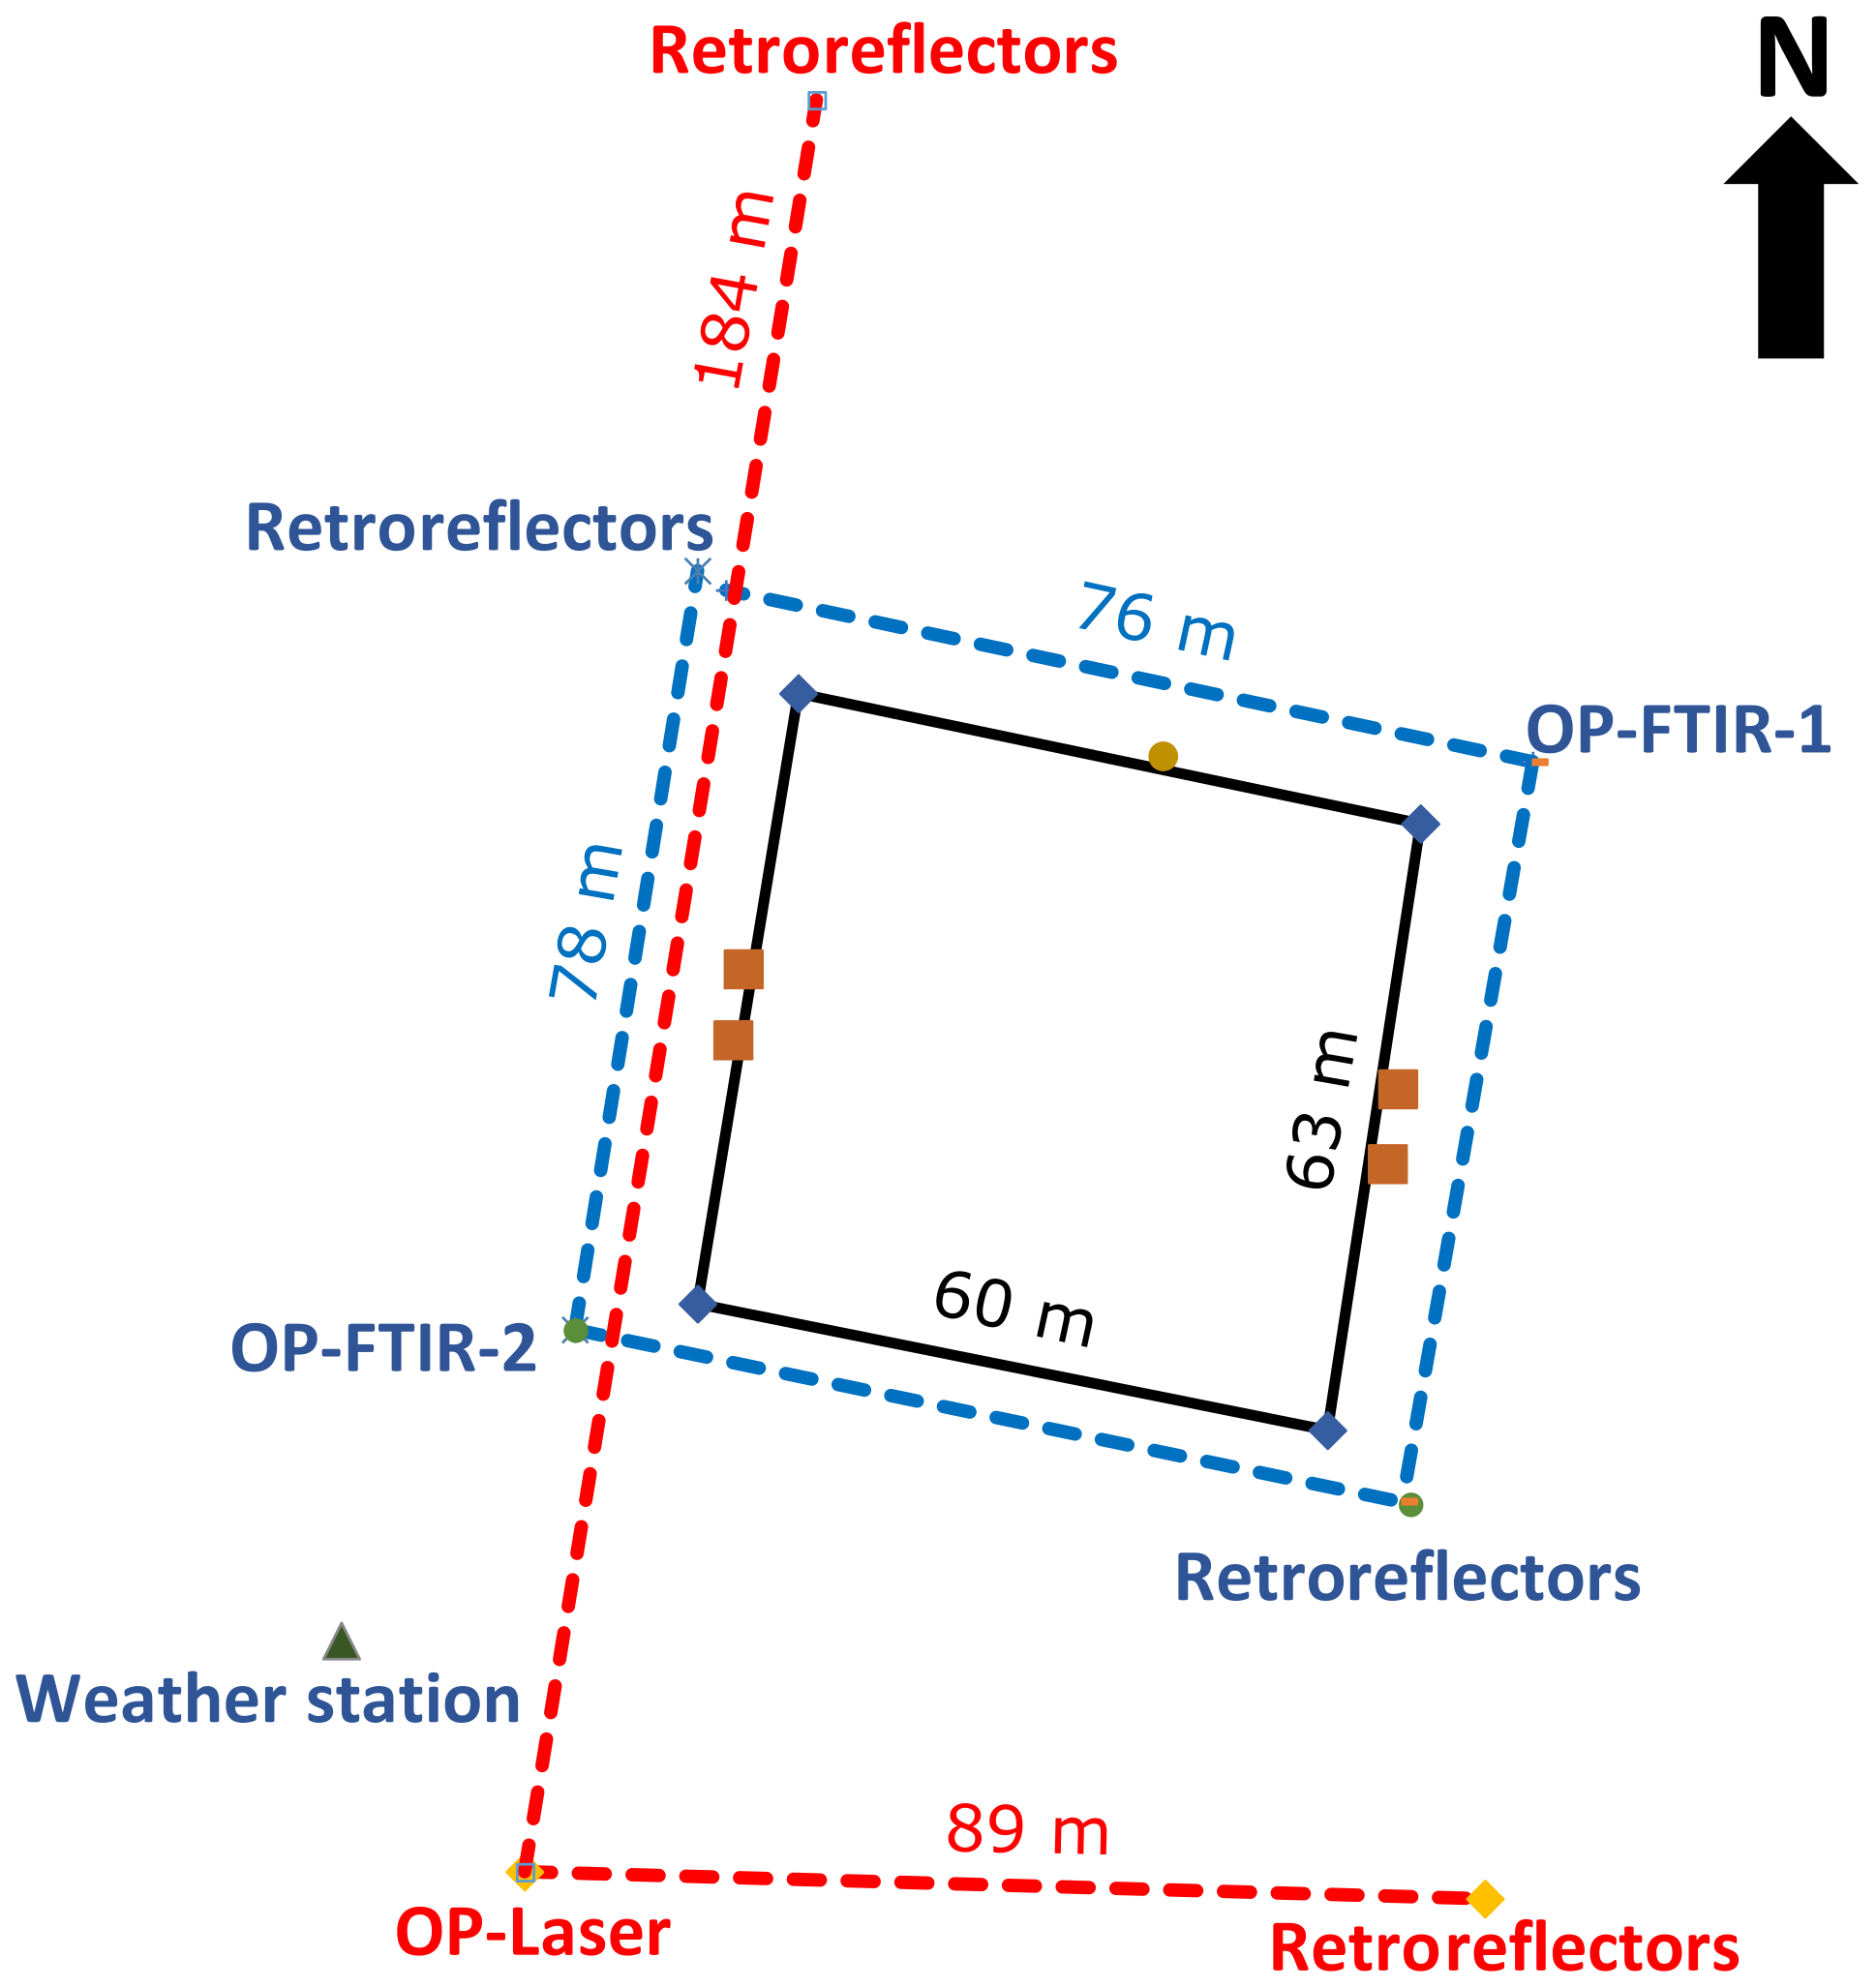
Figure 1Schematic layout of the experimental site, showing an animal pen in the centre, two OP-FTIR systems (blue dashed lines), and the OP-Laser system (red dashed lines). Two feeding troughs (brown squares) were on both sides of the pen, and one water trough (brown circle) was on the northern side of the pen. A weather station (green triangle) was 50 m away from the south-western corner of the pen.
The study cattle had an average body weight of 373 kg (standard deviation = 59 kg). The animals were fed a blended oaten–lucerne chaff ration (90.2 % dry matter, 15.1 % crude protein) dispensed from automated feeders (Bindon, 2001) that recorded the individual animal intakes. The feeding troughs were cleaned daily, and any remaining feed was weighed to check that the total consumed amount matched the sum of the individual animal intake. Feed and water were offered ad libitum. This feeding regime began 4 weeks prior to the emission measurements. During the 7 d emission measurement period, the average dry matter intake (DMI) was 11.9 kg head−1 d−1. Cattle manure was not removed during the measurement period. Approximately 2 weeks before the measurements, each animal was fitted with a backpack (glued to their back) to hold a small nitrous oxide (N2O) gas canister used for the tracer-ratio emission measurements (Jones et al., 2011).
During the emission measurement period (14 to 21 February 2013), each study animal carried a N2O canister in a backpack, and controlled rates of N2O were released as part of the tracer-ratio measurement technique. At 09:00 LT (local time) daily during the measurement period, the 16 study animals were walked from the cattle pen to the adjacent yards (80 m north), and the N2O gas canister in the backpack was replaced with a fully filled canister. Cattle were absent from the study pen for approximately 15 to 30 min while this occurred. Other than during the canister replacement period, the animals moved and ate freely in the pen while emissions were measured.
2.2 Concentration sensors
2.2.1 Open-path Fourier transform infrared (OP-FTIR) spectrometer system
Atmospheric concentrations of CH4 and N2O were measured upwind and downwind of the cattle pen using two open-path Fourier transform infrared (OP-FTIR) spectrometers. OP-FTIR can quantify a wide range of real-time gas concentrations simultaneously with high resolution (Smith et al., 2011). The details of the OP-FTIR system used in this study can be found in Bai (2010) and Paton-Walsh et al. (2014). Briefly, the modulated infrared (IR) beam from the Bruker IRcube spectrometer (Matrix-M IRcube, Bruker Optics, Ettlingen, Germany) is transferred through the optics to a modified Meade Schmidt-Cassegrain telescope (25.4 cm diameter, Model LX200R, Meade Instrument Corp., Irvine, California, USA) and a secondary mirror; it is then diverged to 250 mm parallel beam and extended to a distant retroreflector (up to 500 m from the spectrometer) (PLX Inc., Deer Park, New York, USA). The parallel beam is then reflected by the retroreflector and returned to a mercury cadmium telluride (MCT) detector (Infrared Associates Inc., Stuart, Florida, USA) where temperature is controlled by a Stirling cycle mechanical refrigerator cooling system (−196 ∘C; Ricor K508, Salem, New Hampshire, USA), as described further in Bai (2010). A Zener-diode thermometer (type LM335) and a barometer (PTB110, Vaisala, Helsinki, Finland) provide real-time ambient temperature and pressure data (at the same height as that of the measurement path) for the analysis of the measured spectra. The spectrometer is operated at a 1 cm−1 resolution, and one spectrometer scan takes approximately 4 s (13 scans min−1). For acceptable signal-to-noise ratios, a minimum measurement period of 1 min is required. The measured spectra are quantitatively analysed using the Multiple Atmospheric Layer Transmission (MALT) analysis program and a non-linear least squares fitting procedure described in Griffith (1996), based on the reference spectra from the high-resolution transmission molecular absorption database (HITRAN) (Rothman et al., 2009). The best-fitted spectrum is used to retrieve the line-average gas concentrations of CH4 and N2O over the measurement path. The sensitivity of the OP-FTIR units for CH4 and N2O is 1 ppb (part per billion), corresponding to 2 and 0.4 ppb for a 100 m path respectively. To achieve good spectra, parameters including the instrument field of view (FOV), the spectral signal intensity (spec. max), and the residual spectrum between the measured and modelled spectra (RMSresid) are examined. Spectronous software (Ecotech, Knoxfield, Victoria, Australia) automatically controls the spectrometer, sample collecting, spectrum analysis, data logging and display of the calculated concentrations in real time, and ambient pressure and temperature.
The OP-FTIR spectrometers were mounted on a motorized aiming system (custom-made at the University of Wollongong) to allow the spectrometer to be aimed at different retroreflectors. The two OP-FTIR units were positioned on opposite corners outside the cattle pen, and each unit was alternatively aimed at two retroreflectors so that the gas concentration was measured along the four sides of the pen (Fig. 1). This configuration allowed the downwind CH4 and N2O enhancements to be measured for any wind direction. The OP-FTIR measurement sequence was repeated automatically so that the line-average gas concentration on each path was measured every 5 min. The average gas concentrations on each of the four paths were averaged over a series of 15 min intervals, from which we calculated a time series of CH4 emissions. The OP-FTIR measurement paths fell approximately 7 m outside the fence line. The distance between the OP-FTIR sensor and retroreflector was either 76 or 78 m, and the measurement path was 1.4 m a.g.l. (above ground level).
2.2.2 Open-path laser (OP-Laser) system
The open-path laser (OP-Laser) system used a single laser unit (GasFinder2, Boreal Laser Inc., Edmonton, AB, Canada) located outside the animal pen, mounted on a pan-tilt scanning motor (PTU D300, FLIR Motion Control Systems, Burlingame, CA, USA). The OP laser contains a transceiver that houses the laser diode, drive electronics, detector module, and micro-computer subsystems. Collimated light emitted from the transceiver traverses the open measurement path to a distant retroreflector (up to 500 m) and back. A portion of the beam passes through an internal reference cell. The ratio of measured external and reference signals is used to determine the gas concentration from the open path. The retroreflector mounted on a tripod consists of an array of six gold-coated 6 cm corner cubes with effective diameters of approximately 20 cm. The scanning motor was programmed to sequentially measure the CH4 concentration on two paths. The paths ran along two sides of the pen, and their location was chosen to provide upwind and downwind concentrations during the prevailing easterly winds (Fig. 1). The two-paths were 89 and 184 m in length, and the laser measurement path was approximately 5 m outside the fence line. The laser alternated between the two paths with a dwell time of 1 min on each path. The line-average CH4 concentration was recorded approximately once a second, and the path-average concentrations were averaged into 15 min intervals. The sensitivity of the laser units is 1 part per million-metre (ppm-m), corresponding to 10 ppb for a 100 m path.
2.3 Methodologies
A tracer-ratio technique was used to measure CH4 emissions from the study animals. This is a conceptually simple and defensible method for measuring emissions, and we will consider this technique as giving the “true” CH4 emission rate from the animals. Two different implementations of the IDM technique were compared with the tracer-ratio measurements.
2.3.1 Tracer-ratio technique
The tracer-ratio measurements followed the procedure described in Bai (2010), Griffith et al. (2008), and Jones et al. (2011), with N2O used as the tracer gas and released through a canister at a controlled release rate. The N2O release point was closed to cattle mouth and nose where the majority of CH4 was emitted. The N2O tracer gas followed the emitted CH4 downwind of the animal pen, and both concentrations of N2O and CH4 were measured simultaneously by an OP-FTIR (Fig. 1).
The N2O tracer gas (> 99 %, BOC Instrument Grade, Australia) was released from pressurized canisters (Catalina Cylinders) located in insulated backpacks on each animal. Each canister was fitted with a head-encompassing capillary tube (0.025 mm inner diameter, SGE Analytical Science Pty Ltd, Australia) to control the N2O flow rate. The canister was filled with approximately 300 g of N2O to provide an average flow rate of 10 g h−1 over a 24 h period. The temperature of the canisters was recorded every 5 min (Thermochron Temperature model TCS, OnSolution, Australia). The canisters and temperature sensors were exchanged every 24 h at a nearby yard. Following the procedure in Bai (2010), the canister flow rate was calibrated with a gas temperature-dependent factor determined from the measured canister temperature. Canisters were also weighed at the start and end of each 24 h period to get the actual daily N2O release rate.
The calculation for each pressurized canister N2O flow rate follows three steps:
-
The N2O flow rate of each canister was calculated following Bai (2010) as
where is the individual canister flow rate (g h−1) at temperature T (∘C), t is time, T is temperature (∘C) at time (t), Q0 is a constant canister flow rate at a temperature of 0 ∘C (in g h−1), α is the N2O flow rate temperature-dependent factor (in g h−1 ∘C−1). The temperature was measured at 5 min intervals.
-
The integrated N2O flow rate over the total release time (RT, ∼ 24 h) equals the mass loss of N2O gas (, g):
where .
The mass loss of N2O was determined by the initial and the end weight of the canister (g), and respectively. The integrated N2O flow rate of each canister was then interpolated to a 15 min interval flow rate using a linear interpolation function (Igor 6.3.7.2). The total N2O flow rate of the 16 canisters () was used for the CH4 emission rate calculation.
-
Following the procedure described in Bai (2010), Griffith et al. (2008), and Jones et al. (2011), the herd emission rate of CH4 was calculated:
where is the CH4 emission rate (in g head−1 h−1); is the integrated N2O flow rate of total canisters in the animal backpacks, determined by the mass loss of N2O at canister temperature T and release time t (in g h−1), which is multiplied by 24 to calculate the emission rate (in g d−1). The ΔCH4 and ΔN2O parameters are the CH4 and N2O concentration enhancements (above the local background level) measured downwind of the animal pen using the OP-FTIR spectrometers, is the molecular mass of CH4 (16 g mol−1), is the molecular mass of N2O (44 g mol−1), and Nanimal is the number of animals (16).
During the study, we collected a number of air samples using volumetric flasks (600 mL). Samples were spaced along each measurement path and taken when animals were absent from the pen. These samples were later analysed in the laboratory using a closed-path FTIR spectrometer (Griffith, 1996), and the CH4 and N2O values were used to cross-calibrate the two OP-FTIR sensors.
Tracer-ratio emission measurements were excluded for periods when the canisters outlets were blocked, had dropped off the animals, when there was optical misalignment of the OP-FTIRs, or when the enhanced CH4 and N2O concentration was less than 50 and 10 ppb respectively.
2.3.2 Inverse dispersion modelling (IDM) technique
Herd CH4 emissions were calculated using the IDM technique (Flesch et al., 2004). This micrometeorological technique estimates emissions based on the enhancement of CH4 measured downwind of the animal pen. The link between the concentration enhancement and the pen emission rate is calculated using an atmospheric dispersion model. The freely available WindTrax (http://www.thunderbeachscientific.com, last access: 6 April 2020) software is used for that calculation. WindTrax combines a backward Lagrangian stochastic dispersion model with mapping software, and it takes the following parameters as input: the upwind and downwind CH4 concentration measurements, wind information from a sonic anemometer, and a map of the pen and gas sensor locations. General information on WindTrax applications is given in Flesch and Wilson (2005).
The upwind and downwind CH4 concentrations were measured using either the OP-FTIR system previously described (designated IDM-FTIR) or by an open-path CH4 laser system (designated IDM-Laser). Air samples collected during the study were used to cross-calibrate the laser and the OP-FTIR sensors (applying a retroactive correction multiplier to the laser concentrations). Air samples were collected at 2 min intervals to get 15 min average concentrations for the period from 09:15 to 09:30 LT when the cattle were not in the paddock. The samples were analysed by gas chromatography (Agilent 7890) at the University of Melbourne laboratory. Three positions were sampled: (1) directly west of the paddock along the laser/FTIR line; (2) near the laser, southwest of the paddock; and (3) far south of the paddock along the southerly laser line. Winds were light and from the east. We assumed that the CH4 and N2O concentrations at these positions would be similar (as cattle were absent) and would provide the basis for calibration of the lasers and FTIRs.
A weather station southwest of the cattle pen (Fig. 1) included a three-dimensional sonic anemometer (CSAT3, Campbell Scientific Inc, Logan Utah, USA) mounted 2.45 m a.g.l. The anemometer provided the wind information needed for the IDM calculation, including the friction velocity (u∗), Obukhov stability length (L), average wind speed and wind direction, and the standard deviation of the velocity fluctuations in the three directional components (). The surface roughness length (z0) was calculated from these variables (Garratt, 1992). The wind variables were averaged into 15 min intervals matched to the gas concentration dataset.
2.3.3 Data filtering criteria
The CH4 emissions were calculated at 15 min intervals using the WindTrax software. We defined the CH4 as coming from an elevated area source 0.8 m a.g.l., which overlaid the pen area. In the IDM analysis, we followed the procedure of Flesch et al. (2005) to remove error-prone intervals when either u∗ < 0.15 m s−1, < 5 m, z0 < 0.9 m, or the fraction of WindTrax trajectory touchdowns inside the pen source covered < 10 % of the pen area. Intervals were also removed when the concentrations measured by the OP-FTIR or the laser corresponded to low signal levels – i.e. FOV < 35, RMSresid < 0.2 %, spec.max < 0.25 in the spectral region of 2200 cm−1 for the OP-FTIR, the light level reported by the laser fell outside the 2000 to 13 000 range, or the laser quality parameter R2 < 0.97.
2.3.4 Calculating average emissions
The tracer-ratio and IDM measurements are a discontinuous time series of 15 min average emission rates lasting for 7 d. In order to create a properly weighted daily average emission rate, these discontinuous data were used to create an ensemble 24 h diurnal emission “curve” for each technique. Each emission observation was binned into one of the ninety-six 15 min periods making up the ensemble day. We used generalized additive models (GAM) fitted to the time series of gas emission to impute missing measurements (Bai et al., 2020). The time series of gas emission and the associated GAM fit for each measurement method are shown in the Appendix (Fig. A1). The average daily emission rate was calculated by summing the 15 min emission intervals over the 24 h day. Following IPCC (2006) recommendations, CH4 emissions were also calculated based on DMI (IPCC, 2006, their Eq. 10.21). This assumes a CH4 energy content of 55.65 MJ (kg CH4)−1, a DMI energy content of 18.45 MJ (kg DMI)−1, and a CH4 conversion factor of Ym = 6.5 %.
3.1 Climate conditions
During the 7 d emission measurement period, the total rainfall was 0.4 mm, and the average minimum and maximum ambient temperature was 12.9 and 22.4 ∘C respectively. The wind speeds (at 2.45 m a.g.l.) varied from 2 to 8 m s−1, and the wind direction was predominately from the east (Fig. 2). This period had excellent conditions for micrometeorological measurements due to the lack of precipitation, the absence of light wind periods, and the steady easterly winds.

Figure 2Ambient temperature (Airtemp), wind speed, and wind direction measured during the study. The atmospheric stability parameter () and wind friction velocity (u∗) are also plotted.
3.2 Methane emission measurements
3.2.1 Tracer-ratio measurements
The OP-FTIR system measured downwind CH4 enhancements between 50 and 150 ppb as well as N2O enhancements between 12 and 30 ppb during the study (Fig. 3). These enhancements are well above the minimum sensitivity of the OP-FTIR given by Bai (2010) of 2 ppb for CH4 and < 0.4 ppb for N2O. Over the 7 study days, emissions were measured during 90 % of the ensemble 24 h day (i.e. 86 of the 96 possible 15 min periods). The average daily emission rate (± standard error) from the tracer-ratio technique was 301.9 (± 1.5) g CH4 head−1 d−1 (Table 1).

Figure 3The concentration enhancement of N2O and CH4 from OP-FTIR and CH4 from OP-Laser over the measurement period from 14 to 21 February 2013.
Table 1Methane emission rates from the three micrometeorological measurements (tracer-ratio, IDM-FTIR, IDM-Laser) and an emission estimate based on the dry matter intake of the animals (using an IPCC recommended calculation∗). Methane yield (g CH4 kg−1 DMI) is also shown.

∗ IPCC (2006, their Eq. 10.21) calculation based on DMI that assumes a CH4 energy content of 55.65 MJ (kg CH4)−1, a DMI energy content of 18.45 MJ (kg DMI)−1, and a CH4 conversion factor of Ym = 6.5 %.
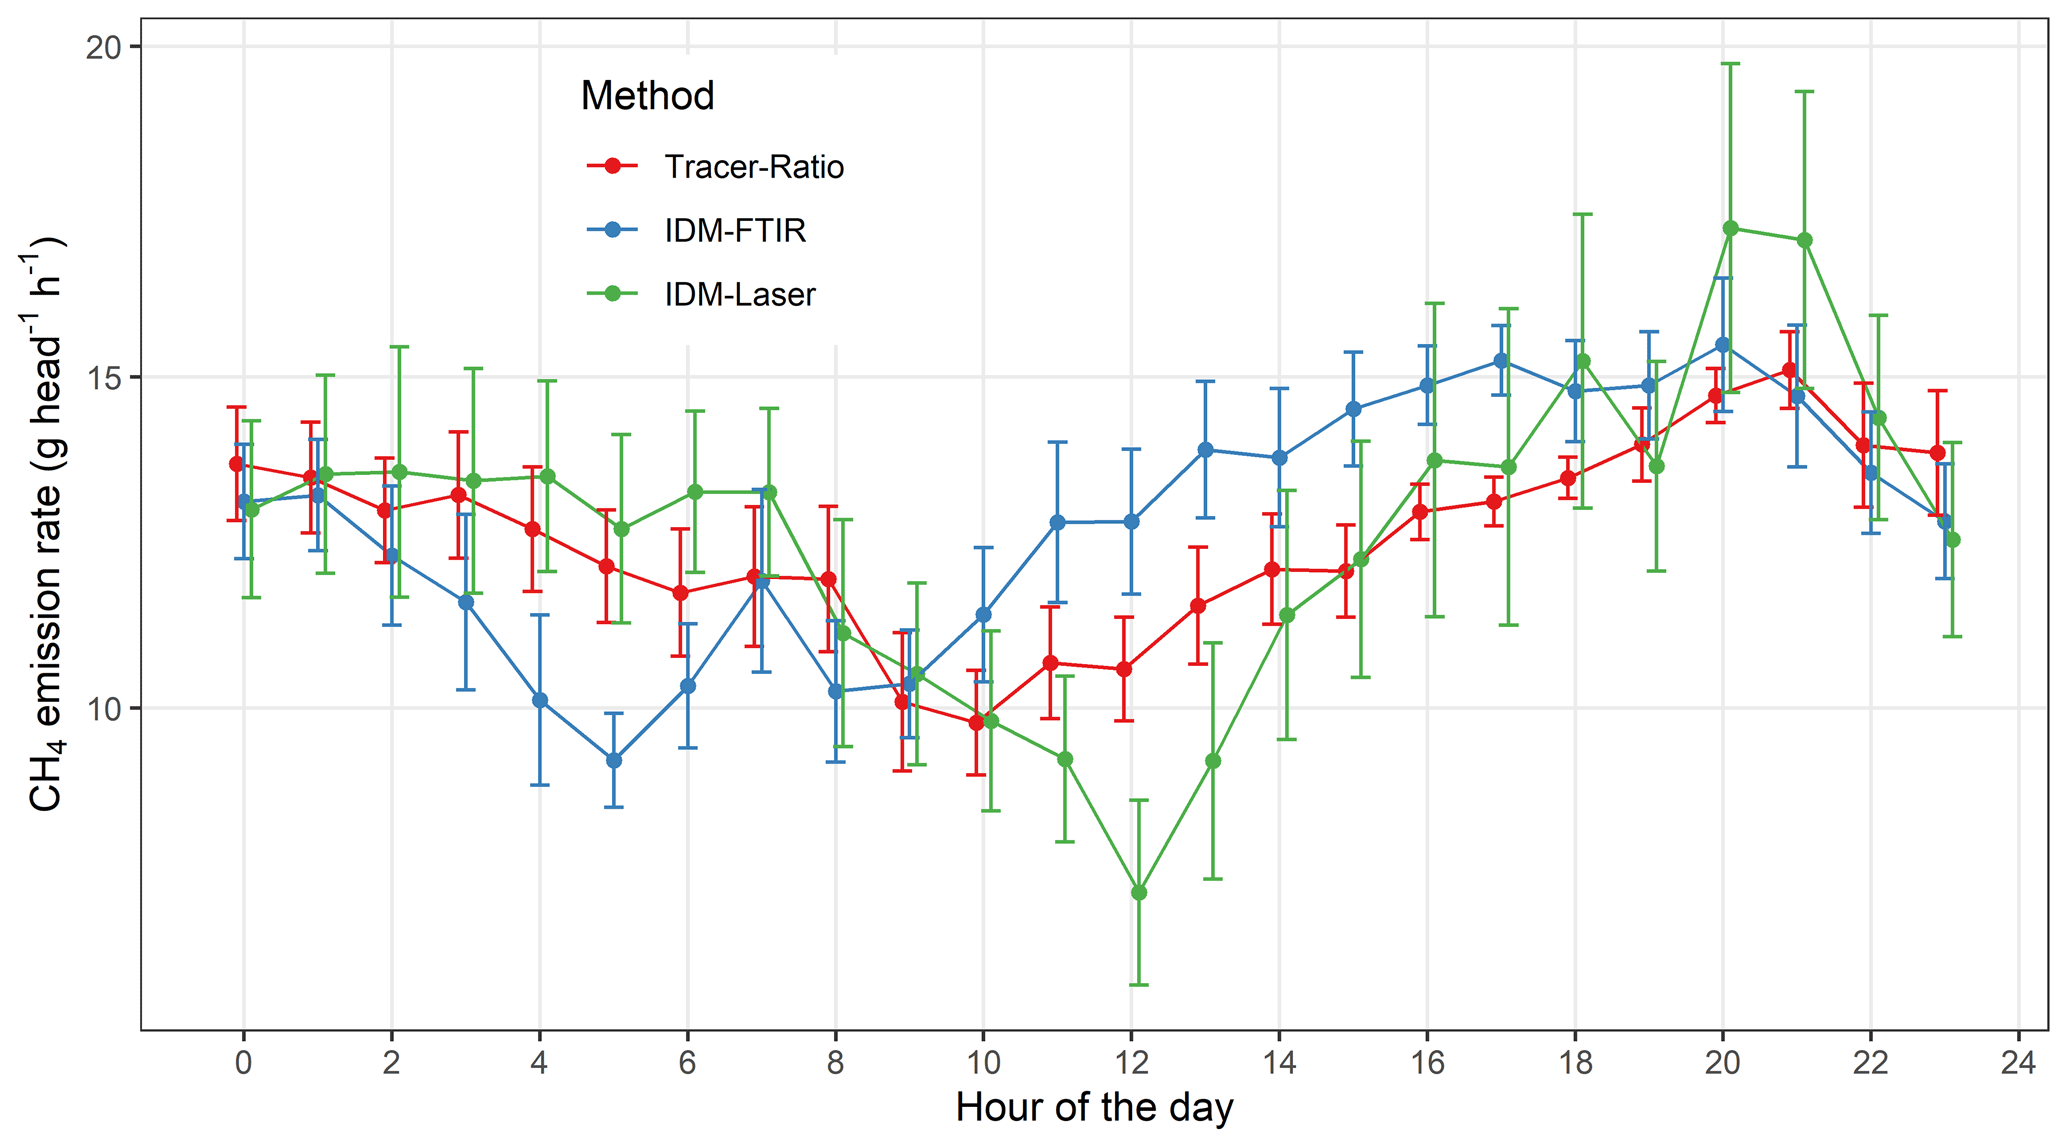
Figure 4Ensemble 24 h diurnal CH4 emission pattern measured using the IDM-Laser, IDM-FTIR, and tracer-ratio methods (hourly values based on 7 d of measurements). Error bars denote the standard error of the mean.
3.2.2 Inverse dispersion modelling measurements
Over the 7 d study, 90 % of the ensemble was represented by the IDM-FTIR measurements, and 79 % of the ensemble was represented by the IDM-Laser measurements. The majority of missing periods resulted from instrumental issues (e.g. low signals caused by condensation on mirrors or instrument power failure), and to a lesser extent by inappropriate meteorological conditions (e.g. low wind speed, u∗ < 0.15 m s−1). The 24 h diurnal CH4 flux over the measurement period is shown in Fig. 4. There are differences between the three ensemble emission relationships in Fig. 4. We assume that the tracer-FTIR data are the most accurate data set. Differences between the tracer and IDM approaches are due to a combination of a less sensitive laser sensor (compared with the OP-FTIR) and the incorrect assumption that animals were spread evenly over the pen (which effects the FTIR and laser estimates differently due to different measurement locations). Both the IDM-FTIR and tracer-ratio measurements show a similar emission pattern: emission rates at a minimum around 09:00 LT, and emission rates at a maximum during the early evening. This emission peak pattern reflected the time when animals were fed or when the pellets were topped up. However, the IDM-Laser shows a late minimum emission at 12:00 LT, likely due to a solar-related alignment of the retroreflector. We calculated average daily emission rates of 308.1 (± 2.1) and 304.4 (± 8.0) g CH4 head−1 d−1 for the IDM-FTIR and IDM-Laser measurements respectively (Table 1). These results are not statistically different from each other. Both IDM estimates were not statistical different from the tracer-ratio results.
There was excellent agreement between the tracer-ratio and the IDM measurements of cattle CH4 emissions (there were no statistical differences between the different techniques). For potential users of the IDM technique, these results are an important finding. When previously applied to cattle environments, some recent IDM studies have monitored animal positions assuming this information is critical to getting accurate calculations (e.g. McGinn et al., 2011). Alternatively, other studies constrained animal locations by fencing to minimize the errors when animal positions were not monitored (Flesch et al., 2016). However, our IDM calculations assuming cattle were evenly distributed across the paddock were nearly identical to the tracer-ratio results that implicitly include the impact of animal positions. This indicates that IDM studies like ours can use the much simpler approach in which the whole paddock is treated as a gas source and animal positions need not be monitored. This seems to confirm a similar finding from McGinn et al. (2015). The effect of this simplification on measurement accuracy is likely to depend on animal density and the size of the paddock. For example, the measurement of a small number of animals in a large paddock is likely to be very sensitive to the exact animal positions; however, in the modest sized paddock studied here (and in McGinn et al., 2015), this is not the case.
It is interesting to compare our measured CH4 emission rates with estimates made using the relationships suggested by IPCC (2006) based on DMI. Using the IPCC recommendations that CH4 emissions represent 6.5 % of the gross energy intake of the cattle (Ym) and with our DMI of 11.9 kg d−1, we calculate (IPCC, 2006, their Eq. 10.21) an emission rate of 254 g CH4 head−1 d−1. Using the equation from Charmley et al. (2016) with the yield of 20.7 g CH4 kg−1 DMI, the estimated CH4 emission rate is 246 g CH4 head−1 d−1. The DMI-based CH4 estimates were lower than the tracer-ratio measurement of 321 g CH4 head−1 d−1. What might explain this difference?
Weather conditions during our study were nearly ideal for the micrometeorological calculations, resulting in a large and representative set of emission calculations over the study, and a good estimate of the 24 h ensemble daily emission rate. A time-of-day sampling bias in the tracer-ratio measurements is unlikely to cause the difference.
Differences between the tracer-ratio and rates estimated by IPCC (2006) would occur if there were significant manure or rectal emissions that were measured by the micrometeorological techniques but were not reflected in the IPCC (2006) estimates. However, the general view is that these emissions are small in comparison with enteric emissions (Flessa et al., 1996; Kebreab et al., 2006; McGinn et al., 2019). In addition, when animals were absent from the pen, we did not observe enhanced CH4 levels downwind of the pen, indicating low emission rates from the pen manure. There were no manure stockpiles nearby during the study. This suggests that the IPCC (2006) estimates may have larger uncertainties.
Based on the tracer-ratio measurements, the CH4 conversion factor Ym in this study is higher than the value suggested by IPCC (2006) – that is, our measured Ym of 8.3 % is outside the 6.5 ± 1 % range suggested by IPCC (2006). However, the IPCC (2006) suggestion is a rough estimate, and several grazing studies have found Ym values higher than our 8.3 % (e.g. Tompkins and Charmley, 2015; McGinn et al., 2011; Ominski et al., 2006).
We are very confident in the tracer-ratio measurements given the conceptual simplicity of the approach (where each animal is a tracer gas source), given that the OP-FTIR is a very sensitive gas sensor, and given the agreement between the associated IDM measurements. Thus, we view the relatively high emission rates that we observed to be representative of the conditions of the study.
The (external) tracer ratio technique is a “gold standard” for measuring cattle emissions in an ambient outdoor environment. However, this technique is difficult to use given the need to outfit the animals with tracer sources and the requirement to monitor tracer gas concentrations downwind. Encouragingly, our results indicate that a logistically simple IDM technique can provide an accurate tool for measuring emissions from cattle, with far greater practicality than the tracer-ratio technique. It is worth noting that micrometeorological methods like IDM represent one of the major approaches for measuring cattle emissions (in addition to internal SF6 tracer technique and respiration chambers). Our results should give users added confidence that a practical micrometeorological technique can provide an accurate method of estimating CH4 emissions at farm scales.
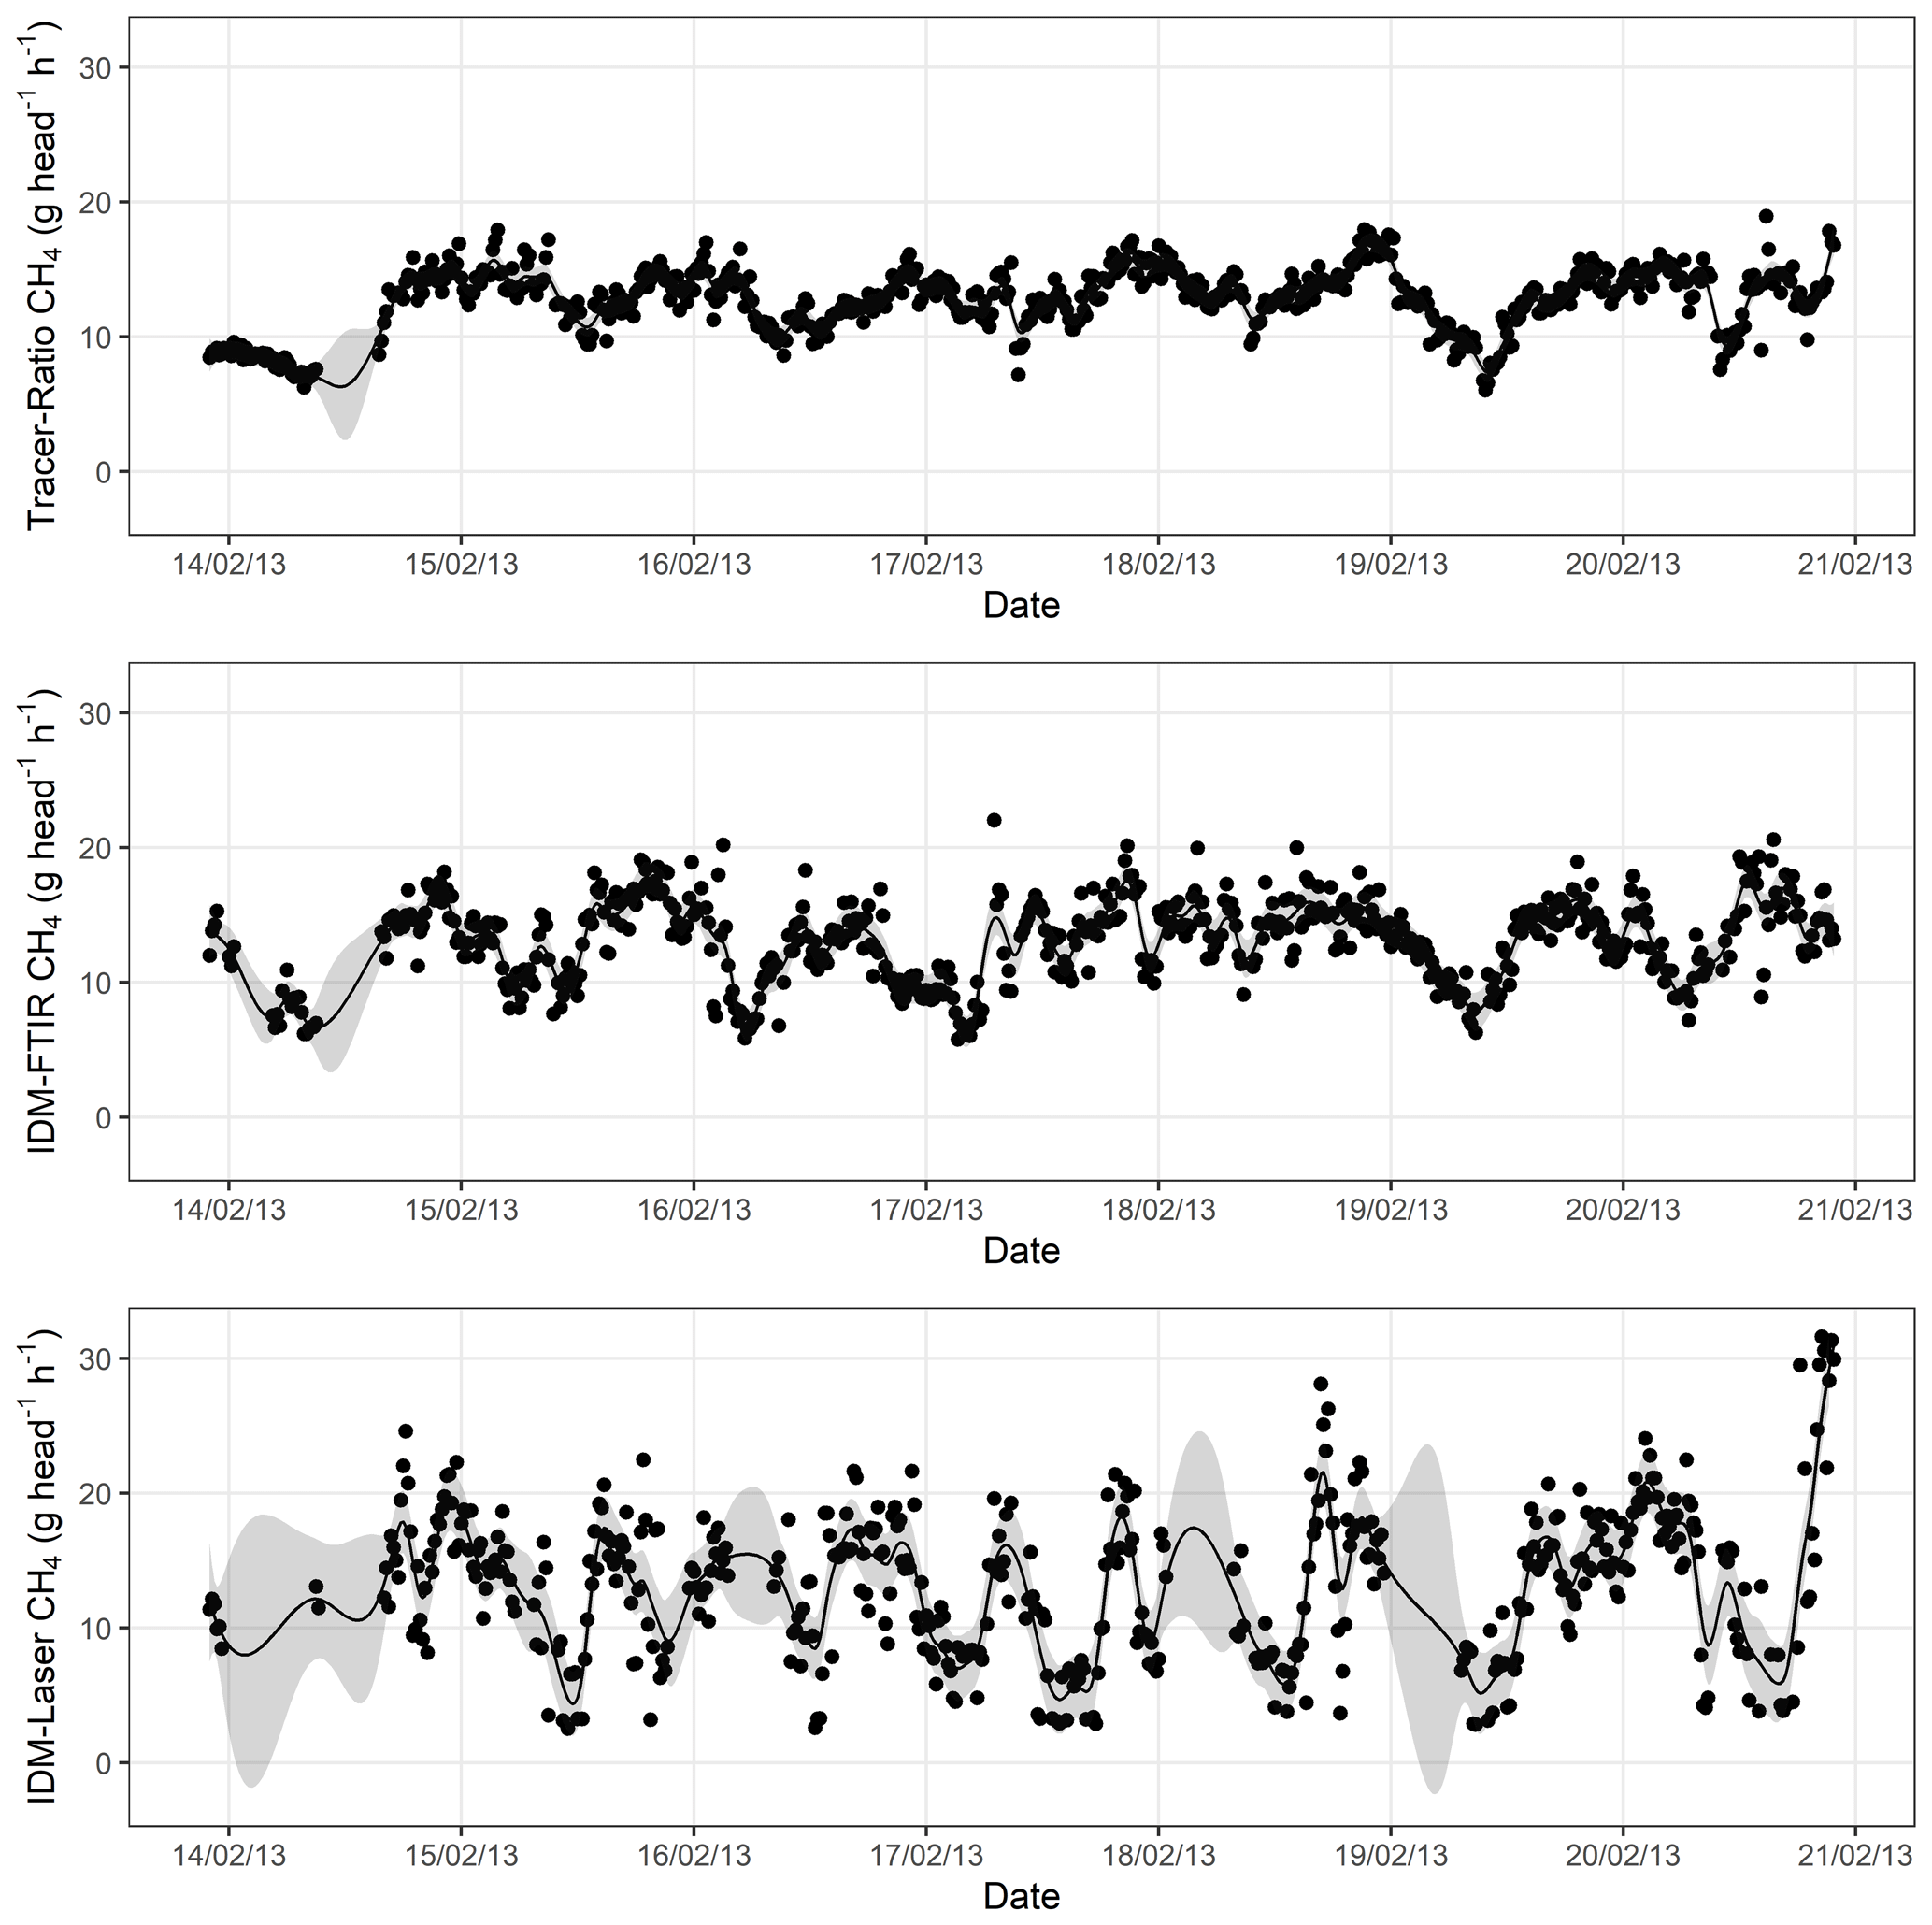
Figure A1Time series of CH4 emissions measured using the tracer-ratio, IDM-FTIR, and IDM-Laser methods. Black dots show the 15 min measurements. The solid black line shows the mean value of gas emission estimated from a GAM fit to the measurement data. The shaded area represents the 95 % credible intervals of the mean gas emission from the GAM fit (i.e. it contains 95 % of the potential mean values of gas emission at a given time).
The raw data are not available to the public. Please direct any inquiries regarding the data to the corresponding author (mei.bai@unimelb.edu.au).
All authors contributed to the conceptualization, methodology, draft writing, and original draft preparation. TWC, JIV, TKF, FAP, MB, and NWT were responsible for writing, reviewing, and editing the paper. TKF, JIV, TWC, FAP, and MB contributed to formal analysis. DC, RSH, NWT, JH, and DGM were responsible for funding acquisition and investigation.
The authors declare that they have no conflict of interest.
José I. Velazco was supported by an Australian Government scholarship funded by the Australian Agency for International Development and by the National Institute for Agricultural Research (INIA Uruguay). We thank Travis Naylor, Kithsiri Dassanayake, and Jianlei Sun for their field support. We are also grateful to Sheilah Nolan for editing the paper and to Raphaël Trouvé for helping with the GAMs.
This research has been supported by the CSIRO Sustainable Agriculture Flagship programme.
This paper was edited by Daniela Famulari and reviewed by two anonymous referees.
Bai, M.: Methane emissions from livestock measured by novel spectroscopic techniques, Doctor of Philosophy PhD Thesis, School of Chemistry, University of Wollongong, Wollongong, NSW, Australia, 303 pp., 2010.
Bai, M., Flesch, K. T., Trouvé, R., Coates, T. W., Butterly, C., Bhatta, B., Hill, J., and Chen, D.: Gas Emissions during Cattle Manure Composting and Stockpiling, J. Environ. Qual., 49, 228–235, https://doi.org/10.1002/jeq2.20029, 2020.
Bindon, B. M.: Genesis of the Cooperative Research Centre for the Cattle and Beef Industry: integration of resources for beef quality research (1993–2000), Aust. J. Exp. Agr., 41, 843–853, https://doi.org/10.1071/EA00067, 2001.
Charmley, E., Williams, S. R. O., Moate, P. J., Hegarty, R. S., Herd, R. M., Oddy, V. H., Reyenga, P., Staunton, K. M., Anderson, A., and Hannah, M. C.: A universal equation to predict methane production of forage-fed cattle in Australia, Anim. Prod. Sci., 56, 169–180, https://doi.org/10.1071/AN15365, 2016.
Cottle, D. J., Nolan, J. V., and Wiedemann, S. G.: Ruminant enteric methane mitigation: a review, Anim. Prod. Sci., 51, 491–514, https://doi.org/10.1071/AN10163, 2011.
Dengel, S., Levy, P. E., Grace, J., Jones, S. K., and Skiba, U. M.: Methane emissions from sheep pasture, measured with an open-path eddy covariance system, Glob. Change Biol., 17, 3524–3533, https://doi.org/10.1111/j.1365-2486.2011.02466.x, 2011.
DoE: Australian National Greenhouse Accounts. National Inventory Report 2012. Department of Environment, available at: http://www.environment.gov.au/node/35779, last access: 12 December 2014.
Felber, R., Münger, A., Neftel, A., and Ammann, C.: Eddy covariance methane flux measurements over a grazed pasture: effect of cows as moving point sources, Biogeosciences, 12, 3925–3940, https://doi.org/10.5194/bg-12-3925-2015, 2015.
Flesch, T. K. and Wilson, J. D.: Estimating tracer emissions with a backward Lagrangian stochastic technique, in: Micrometeorology in agricultural systems, edited by: Hatfield, J. L., Baker, J. M., and Viney, M. K., American Society of Agronomy, Inc. Crop Science Society of America, Inc. Soil Science Society of America, Inc., Ames, Iowa, USA, 2005.
Flesch, T. K., Wilson, J. D., Harper, L. A., Crenna, B. P., and Sharpe, R. R.: Deducing ground-to-air emissions from observed trace gas concentrations: A field trial, J. Appl. Meteorol., 43, 487–502, https://doi.org/10.1175/1520-0450(2004)043<0487:DGEFOT>2.0.CO;2, 2004.
Flesch, T. K., Wilson, J. D., Harper, L. A., and Crenna, B. P.: Estimating gas emissions from a farm with an inverse-dispersion technique, Atmos. Environ., 39, 4863–4874, https://doi.org/10.1016/j.atmosenv.2005.04.032, 2005.
Flesch, T. K., Baron, V., Wilson, J., Griffith, D. W. T., Basarab, J., and Carlson, P.: Agricultural gas emissions during the spring thaw: Applying a new measuremnt technique, Agric. Forest Meteorol., 221, 111–121, https://doi.org/10.1016/j.agrformet.2016.02.010, 2016.
Flessa, H., Dörsch, P., Beese, F., König, H., and Bouwman, A. F.: Influence of Cattle Wastes on Nitrous Oxide and Methane Fluxes in Pasture Land, J. Environ. Qual., 25, 1366–1370, https://doi.org/10.2134/jeq1996.00472425002500060028x, 1996.
Garnsworthy, P. C., Craigon, J., Hernandez-Medrano, J. H., and Saunders, N.: On-farm methane measurements during milking correlate with total methane production by individual dairy cows, J. Dairy Sci., 95, 3166–3180, https://doi.org/10.3168/jds.2011-4605, 2012.
Garratt, J. R.: The atmospheric boundary layer, Cambridge University Press, Cambridge, UK, 1992.
Grainger, C., Clarke, T., McGinn, S. M., Auldist, M. J., Beauchemin, K. A., Hannah, M. C., Waghorn, G. C., Clark, H., and Eckard, R. J.: Methane emissions from dairy cows measured using the Sulfur Hexafluoride (SF6) tracer and chamber techniques, J. Dairy Sci., 90, 2755–2766, https://doi.org/10.3168/jds.2006-697, 2007.
Griffith, D. W. T.: Synthetic calibration and quantitative analysis of gas-phase FT-IR spectra, Appl. Spectrosc., 50, 59–70, 1996.
Griffith, D. W. T., Bryant, G. R., Hsu, D., and Reisinger, A. R.: Methane emissions from free-ranging cattle: comparison of tracer and integrated horizontal flux techniques, J. Environ. Qual., 37, 582–591, https://doi.org/10.2134/jeq2006.0426, 2008.
Harper, L. A., Denmead, O. T., and Flesch, T. K.: Micrometeorological techniques for measurement of enteric greenhouse gas emissions, Anim. Feed Sci. Tech., 166–167, 227–239, https://doi.org/10.1016/j.anifeedsci.2011.04.013, 2011.
IPCC: 2006 IPCC Guidelines for National Greenhouse Gas Inventories, Prepared by the National Greenhouse Gas Inventories Programme, edited by: Eggleston, H. S., Buendia, L., Miwa, K., Ngara, T., and Tanabe, K., IGES, Hayama, Kanagawa, Japan, 2006.
Johnson, K., Huyler, M., Westberg, H., Lamb, B., and Zimmerman, P.: Measurement of methane emissions from ruminant livestock using a SF6 tracer technique, Environ. Sci. Technol., 28, 359–362, https://doi.org/10.1021/es00051a025, 1994.
Jones, F. M., Phillips, F. A., Naylor, T., and Mercer, N. B.: Methane emissions from grazing Angus beef cows selected for divergent residual feed intake, Anim. Feed Sci. Tech., 166, 302–307, https://doi.org/10.1016/j.anifeedsci.2011.04.020, 2011.
Kebreab, E., Clark, K., Wagner-Riddle, C., and France, J.: Methane and nitrous oxide emissions from Canadian animal agriculture: A review, Can. J. Anim. Sci., 86, 135–157, https://doi.org/10.4141/A05-010, 2006.
Laubach, J., Kelliher, F. M., Knight, T. W., Clark, H., Molano, G., and Cavanagh, A.: Methane emissions from beef cattle – a comparison of paddock- and animal-scale measurements, Aust. J. Exp. Agr., 48, 132–137, https://doi.org/10.1071/EA07256, 2008.
Lockyer, D. R. and Jarvis, S. C.: The measurement of methane losses from grazing animals, Environ. Pollut., 90, 383–390, https://doi.org/10.1016/0269-7491(95)00009-G, 1995.
McGinn, S. M., Turner, D., Tomkins, N., Charmley, E., Bishop-Hurley, G., and Chen, D.: Methane Emissions from Grazing Cattle Using Point-Source Dispersion, J. Environ. Qual., 40, 22–27, https://doi.org/10.2134/jeq2010.0239, 2011.
McGinn, S. M., Flesch, T. K., Coates, T. W., Charmley, E., Chen, D., Bai, M., and Bishop-Hurley, G.: Evaluating dispersion modelling options to estimate methane emissions from grazing beef cattle, J. Environ. Qual., 44, 97–102, https://doi.org/10.2134/jeq2014.06.0275, 2015.
McGinn, S. M., Flesch, T. K., Beauchemin, K. A., Shreck, A., and Kindermann, M.: Micrometeorological Methods for Measuring Methane Emission Reduction at Beef Cattle Feedlots: Evaluation of 3-Nitrooxypropanol Feed Additive, J. Environ. Qual., 48, 1454–1461, https://doi.org/10.2134/jeq2018.11.0412, 2019.
Min, B. R., Solaiman, S., Waldrip, H. M., Parker, D., Todd, R. W., and Brauer, D.: Dietary mitigation of enteric methane emissions from ruminants: A review of plant tannin mitigation options, Anim. Nutr., 6, 231–246, https://doi.org/10.1016/j.aninu.2020.05.002, 2020.
Myhre, G., Shindell, D., Bréon, F.-M., Collins, W., Fuglestvedt, J., Huang, J., Koch, D., Lamarque, J.-F., Lee, D., Mendoza, B., Nakajima, T., Robock, A., Stephens, G., Takemura, T., and Zhang, H.: Anthropogenic and Natural Radiative Forcing, in: Climate Change 2013: The Physical Science Basis. Contribution of Working Group I to the Fifth Assessment Report of the Intergovernmental Panel on Climate Change, edited by: Stocker, T. F., Qin, D., Plattner, G.-K., Tignor, M., Allen, S. K., Boschung, J., Nauels, A., Xia, Y., Bex, V., and Midgley, P. M., Cambridge University Press, Cambridge, United Kingdom and New York, NY, USA, 2013.
Ominski, K. H., Boadi, D. A., and Wittenberg, K. M.: Enteric methane emissions from backgrounded cattle consuming all-forage diets, Can. J. Anim. Sci., 86, 393–400, https://doi.org/10.4141/A05-051, 2006.
Paton-Walsh, C., Smith, T. E. L., Young, E. L., Griffith, D. W. T., and Guérette, É.-A.: New emission factors for Australian vegetation fires measured using open-path Fourier transform infrared spectroscopy – Part 1: Methods and Australian temperate forest fires, Atmos. Chem. Phys., 14, 11313–11333, https://doi.org/10.5194/acp-14-11313-2014, 2014.
Rothman, L. S., Gordon, I. E., Barbe, A., Benner, D. C., Bernath, P. F., Birk, M., Boudon, V., Brown, L. R., Campargue, A., Champion, J. P., Chance, K., Coudert, L. H., Dana, V., Devi, V. M., Fally, S., Flaud, J. M., Gamache, R. R., Goldman, A., Jacquemart, D., Kleiner, I., Lacome, N., Lafferty, W. J., Mandin, J. Y., Massie, S. T., Mikhailenko, S. N., Miller, C. E., Moazzen-Ahmadi, N., Naumenko, O. V., Nikitin, A. V., Orphal, J., Perevalov, V. I., Perrin, A., Predoi-Cross, A., Rinsland, C. P., Rotger, M., Šimečková, M., Smith, M. A. H., Sung, K., Tashkun, S. A., Tennyson, J., Toth, R. A., Vandaele, A. C., and Vander Auwera, J.: The HITRAN 2008 molecular spectroscopic database, J. Quant. Spectrosc. Ra., 110, 533–572, https://doi.org/10.1016/j.jqsrt.2009.02.013, 2009.
Smith, T. E. L., Wooster, M. J., Tattaris, M., and Griffith, D. W. T.: Absolute accuracy and sensitivity analysis of OP-FTIR retrievals of CO2, CH4 and CO over concentrations representative of “clean air” and “polluted plumes”, Atmos. Meas. Tech., 4, 97–116, https://doi.org/10.5194/amt-4-97-2011, 2011.
Solomon, S., Qin, D., Manning, M., Chen, Z., Marquis, M., Averyt, K. B., and Tignor, M.: Contribution of Working Group I to the Fourth Assessment Report of the Intergovernmental Panel on Climate Change Climate Change 2007: The Physical Science Basis, edited by: Solomon, S., Qin, D., Manning, M., Chen, Z., Marquis, M., Averyt, K. B., Tignor, M., and Miller, H. L., Cambridge University Press, Cambridge, United Kingdom and New York, NY, USA, 2007.
Todd, R. W., Altman, M. B., Cole, N. A., and Waldrip, H. M.: Methane Emissions from a Beef Cattle Feedyard during Winter and Summer on the Southern High Plains of Texas, J. Environ. Qual., 43, 1125–1130, https://doi.org/10.2134/jeq2013.09.0386, 2014.
Tomkins, N. W. and Charmley, E.: Herd-scale measurements of methane emissions from cattle grazing extensive sub-tropical grasslands using the open-path laser technique, Animal, 9, 2029–2038, https://doi.org/10.1017/S1751731115001688, 2015.
Vyas, D., Alemu, A. W., McGinn, S. M., Duval, S. M., Kindermann, M., and Beauchemin, K. A.: The combined effects of supplementing monensin and 3-nitrooxypropanol on methane emissions, growth rate, and feed conversion efficiency in beef cattle fed high-forage and high-grain diets, J. Anim. Sci., 96, 2923–2938, https://doi.org/10.1093/jas/sky174, 2018.
Zimmerman, P. R. and Zimmerman, R. S.: Method and system for monitoring and reducing ruminant methane production, in: U.S Patent 13/087,051, C-Lock, Inc., Rapid City, SD, USA, 2012.