the Creative Commons Attribution 4.0 License.
the Creative Commons Attribution 4.0 License.
 | 03 Jun 2021
Thermal dissociation cavity-enhanced absorption spectrometer for measuring NO2, RO2NO2, and RONO2 in the atmosphere
Chunmeng Li
Xiaorui Chen
Tianyu Zhai
Shiyi Chen
Limin Zeng
We developed thermal dissociation cavity-enhanced absorption spectroscopy (TD-CEAS) for the in situ measurement of NO2, total peroxy nitrates (PNs, RO2NO2), and total alkyl nitrates (ANs, RONO2) in the atmosphere. PNs and ANs were thermally converted to NO2 at the corresponding pyrolytic temperatures and detected by CEAS at 435–455 nm. The instrument sampled sequentially from three channels at ambient temperature, 453 and 653 K, with a cycle of 3 min, to measure NO2, NO2+ PNs, and NO2+ PNs + ANs. The absorptions between the three channels were used to derive the mixing ratios of PNs and ANs by spectral fitting. The detection limit (LOD, 1σ) for retrieving NO2 was 97 parts per trillion by volume (pptv) in 6 s. The measurement uncertainty of NO2 was 9 %, while the uncertainties of PN and AN detection were larger than those of NO2 due to chemical interferences that occurred in the heated channels, such as the reaction of NO (or NO2) with the peroxy radicals produced by the thermal dissociation of organic nitrates. Based on laboratory experiments and numerical simulations, we created a lookup table method to correct these interferences in PN and AN channels under various ambient organic nitrates, NO, and NO2. Finally, we present the first field deployment and compare it with other instruments during a field campaign in China. The advantages and limitations of this instrument are outlined.
- Article
(4959 KB) - Full-text XML
-
Supplement
(858 KB) - BibTeX
- EndNote


Organic nitrates (ONs) act as temporary NOx reservoir species, which affect atmospheric circulation and impact air quality and climate (Mellouki et al., 2015). Peroxy nitrates (PNs, RO2NO2) and alkyl nitrates (ANs, RONO2) are two important kinds of organic nitrates. They are closely related to the distribution of oxidants in the atmosphere by terminating the HOx cycle. ONs are also important precursors of secondary organic aerosols (SOAs) (Berkemeier et al., 2016; Lee et al., 2016; Ng et al., 2017; Rollins et al., 2012). Volatile organic compounds (VOCs) are oxidized by OH or O3 to produce peroxy radicals (RO2), and then RO2 reacts with NO2 to produce PNs (Reaction R1). In addition, the aldehydes formed during the process of NO3 oxidizing isoprene at night react with NO3 to form PNs. PNs can be divided into two categories depending on the nature of the RO2 group. One is peroxy acyl nitrates (PANs) when RO2 is R′C (O)OO, among which PPN (peroxypropionyl nitrate) and PAN (peroxyacetyl nitrate) dominate PNs with percentages of 75 %–90 % due to their relatively high thermal stability. The other is some peroxy nitrates without acyl groups, which are only abundant in cold regions (Roberts, 1990; Roberts et al., 1998b; Thieser et al., 2016; Wooldridge et al., 2010). The sink pathways of PNs include deposition, thermal decomposition, photolysis, and OH oxidation, and thermal decomposition dominates in the troposphere with a temperature dependence (Reaction R2). Therefore, the lifetime of PAN varies from less than 1 h to several months, depending on the environmental conditions.
In the high-NOx region, RO2 reacts primarily with NO to produce ANs. ANs can also be emitted directly from biomass combustion and the ocean. Ocean emissions are regarded as the main source of short-chain ANs (C1–C3), and up to tens of parts per trillion by volume (pptv) of the species above have been measured in marine areas (Atlas et al., 1993; Chuck et al., 2002; Talbot et al., 2000). NO3-initiated ANs during the night are generally considered to be important and have a higher organic nitrate yield than OH-initiated ANs (Horowitz et al., 2007; Perring et al., 2013). During the daytime, there is a branching reaction between RO2 and NO to form ANs (Reaction R3a) with a small branch ratio (1 %–30 %) (Arey et al., 2001; Reisen et al., 2005; Russell and Allen, 2005; Wennberg et al., 2018). Ambient ANs are removed by photolysis or oxidation to produce NOx or HNO3, transportation as NOx reservoirs, or deposition. ANs play a significant role in SOA formation (Lee et al., 2016; Zare et al., 2018). Monofunctional ANs are stable and account for a small proportion of ANs, among which those formed from alkanes can be tracers of human activities in remote areas (Simpson et al., 2006; Wang et al., 2003). Polyfunctional ANs are hard to detect since they are more reactive than monofunctional ANs.
The various sources and sinks of ONs complicate their atmospheric distribution. The measurement of ANs and PNs has been developed by gas chromatography (GC). GC is used for the separation of species, and then the separated substances are quantified by electron capture detectors (ECDs), luminol chemiluminescence (CL), or mass spectrometry (MS) (Atlas, 1988; Blanchard et al., 1993; Flocke et al., 2005; Gaffney et al., 1998; Hao et al., 1994; Luxenhofer et al., 1994; Tanimoto et al., 1999). These methods measure individual species accurately (Roberts et al., 2003), but the individual standards are incomprehensive. Furthermore, the methods suffer from relatively low time resolution (Blanchard et al., 1993). The strength of the bond between the NO2 group and the organic group determines the temperature to pyrolyze the organic nitrates. The cleavage of the NO2 group in PNs requires approximately 85–115 kJ mol−1 (Kirchner et al., 1999), while for ANs, the pyrolytic process requires approximately 160–170 kJ mol−1 (Roberts, 1990); therefore, PNs are more prone to dissociate thermally. Based on the feature of gradient pyrolysis of reactive nitrogen compounds, TD-LIF (thermal-dissociation laser-induced fluorescence) was developed to measure PNs, ANs, and gaseous HNO3 indirectly by quantifying the NO2 product (Day et al., 2002). Afterwards, chemical ionization mass spectrometry (CIMS), cavity ring-down spectroscopy (CRDS), and cavity attenuated phase-shift spectroscopy (CAPS) are used to quantify the pyrolytic products (Paul and Osthoff, 2010; Slusher et al., 2004; Thieser et al., 2016; Wild et al., 2014). The detection limits and response times of TD-CIMS are excellent, but 13C-labeled PAN is required as an internal standard. TD-CRDS and TD-CAPS show high spatial and temporal resolution and good measurement capability (Sadanaga et al., 2016; Sobanski et al., 2016). CEAS (cavity-enhanced absorption spectroscopy) is a powerful technology that can monitor several compounds or species simultaneously with broad absorption bands being detected (Fiedler et al., 2003) and has been applied to measure many species in field studies, such as NO2, HONO, NO3, N2O5, IO, glyoxal, and methylglyoxal (Ball et al., 2004; Barbero et al., 2020; Duan et al., 2018; Gherman et al., 2008; Jordan and Osthoff, 2020; Kahan et al., 2012; Langridge et al., 2006; Lechevallier et al., 2019; Liu et al., 2019; Min et al., 2016; Thalman and Volkamer, 2010; Vaughan et al., 2008; Venables et al., 2006; Ventrillard-Courtillot et al., 2010; Ventrillard et al., 2017; H. Wang et al., 2017; Washenfelder et al., 2016, 2008; Watt et al., 2009).
Organic nitrates have a large range of mixing ratios in the atmosphere that vary from several pptv in warm and remote regions to several parts per billion by volume (ppbv) in polluted regions. Field measurements of organic nitrates have been extensively conducted in the United States and Europe (Fischer et al., 2000; Glavas and Moschonas, 2001; Kastler and Ballschmiter, 1999; Perring et al., 2009; Roberts et al., 1998a; Sobanski et al., 2017), but related studies are sparse in China (Chen et al., 2017; Song et al., 2018; Sun et al., 2018; Zhang et al., 2018). Ozone pollution in China has occurred frequently in recent years (Ma et al., 2019; Shu et al., 2019; T. Wang et al., 2009, 2017; Yin et al., 2019). Although many studies have examined the effect of PNs and ANs on regulating ozone formation (Chen et al., 2018; Ling et al., 2016; Liu et al., 2018, 2012, 2010; Zeng et al., 2019; Zhang et al., 2014), the issue has not been well studied. Here, we developed a pyrolytic measurement system based on CEAS to detect NO2, PNs, and ANs in the atmosphere. In this study, the detailed setup of the instrument, laboratory characterizations, and its first field application in China are presented.
2.1 Instrumentation of TD-CEAS
Our instrument is designed to measure NO2, ANs, and PNs in the atmosphere and has the characteristics of good stability, low energy consumption, and portability. The total weight of the instrument is less than 30 kg, the overall size is cm, and power consumption is less than 300 W. The measurement of NO2 is achieved by CEAS. Due to the feature of gradient pyrolysis of ANs and PNs, the sample gas flowing out from three different channels contains the total amount of NO2 at different temperatures. The gradient of NO2 concentration absorption at different pyrolytic temperatures is used to retrieve the mixing ratio of NO2, PNs, and ANs. The time resolution of the instrument measurement is 6 s, the measurement time of each channel is 1 min, and each cycle is 3 min.
The CEAS system has been described in detail in previous literature (Duan et al., 2018; Fiedler et al., 2003; Gherman et al., 2008; Jordan and Osthoff, 2020; Jordan et al., 2019; Langridge et al., 2006; Liang et al., 2019; Liu et al., 2019; Min et al., 2016; Tang et al., 2020; Ventrillard-Courtillot et al., 2010; H. Wang et al., 2017; Yi et al., 2016); thus there is a brief introduction to the principle of the instrument here. NO2 molecules have a specific absorption structure in the wavelength range of 430–460 nm (Fig. S1 in the Supplement). Based on Lambert–Beer's law, the extinction coefficient (α) is proportional to the absorber's concentration and optical path. Here, α is mainly contributed by molecular absorption, Rayleigh scattering, and Mie scattering. In addition, it can also be obtained by comprehensive calculations through the intensity of the sampling spectrum, reference spectrum, mirror reflectivity, and effective cavity length.
In Eq. (1), λ is the wavelength of light, I0(λ) is the intensity of the reference spectrum, I(λ) is the sample spectrum, deff is the effective cavity length (see Sect. 3.2 in detail), R(λ) is the mirror reflectivity, αMie(λ) is the extinction due to Mie scattering, αRayl(λ) is the extinction due to Rayleigh scattering, and ni and σi(λ) are the number density and absorption cross section of ith gas compounds, respectively. According to Eq. (1), it is necessary to quantify the mirror reflectivity, effective cavity length, and NO2 absorption cross section.
As shown in Fig. 1a, the optical layout of the CEAS consists of a light source, collimating optics, a cage system, a high-finesse cavity, and a commercial spectrograph with a charge-coupled device (CCD) detector. The core of the light source module is a single-color LED (M450D3, Thorlabs, Newton, NJ, USA), which emits approximately 1850 mW optical power at approximately 450 nm with a full width at half maximum (FWHM) of 18 nm. To obtain a stable output of the light source, the input current and operating temperature of the light source are stabilized to reduce the intensity and wavelength drift. The switching power supply is 12 VDC with a current of 1.00±0.01 A. Constant current control is achieved through a stable current source. The temperature of the light source is controlled by the proportion integration differentiation (PID) algorithm and stabilized at 24.0±0.1 ∘C.
Four stainless-steel columns are used to collimate two opposing high-mirror mounting bases. The two endplates in the middle of the cage structure further enhance the stability of the system. The light source is introduced into the system through a fiber connected to a two-dimensional adjustment frame (CXY1, Thorlabs, Newton, NJ, USA) through a connector. The plano-convex lens (f=30 mm) is installed in another adjustment frame, and the two adjustment frames are connected by a customized X-shaped adapter, which is fixed at the end with the light source. The center alignment of the light source, lens, and high-reflectivity module is achieved by adjusting the adjustment frame in the vertical and horizontal directions. Then, blue light is introduced into an optical cavity composed of a pair of high-reflectivity (HR) mirrors. The reflectivity of HR mirrors (CRD450-1025-100, Advanced Thin Films, CO, USA) is reported by the manufacturer to be greater than 0.9999 (440–460 nm) with a radius curvature of 1.0 m and a diameter of 25.4 mm. The high-reflectivity mirrors are installed in the groove of the special customized base and sealed by an O-ring, and then the three-dimensional microadjustment is achieved by squeezing the lens and O-ring to finely adjust their pitch and yaw. The distance between mirrors is 39.0 cm, and high-purity nitrogen (>99.999 %), which passes through the small hole before the mirror base, is used as a purge gas to protect the mirror surface.
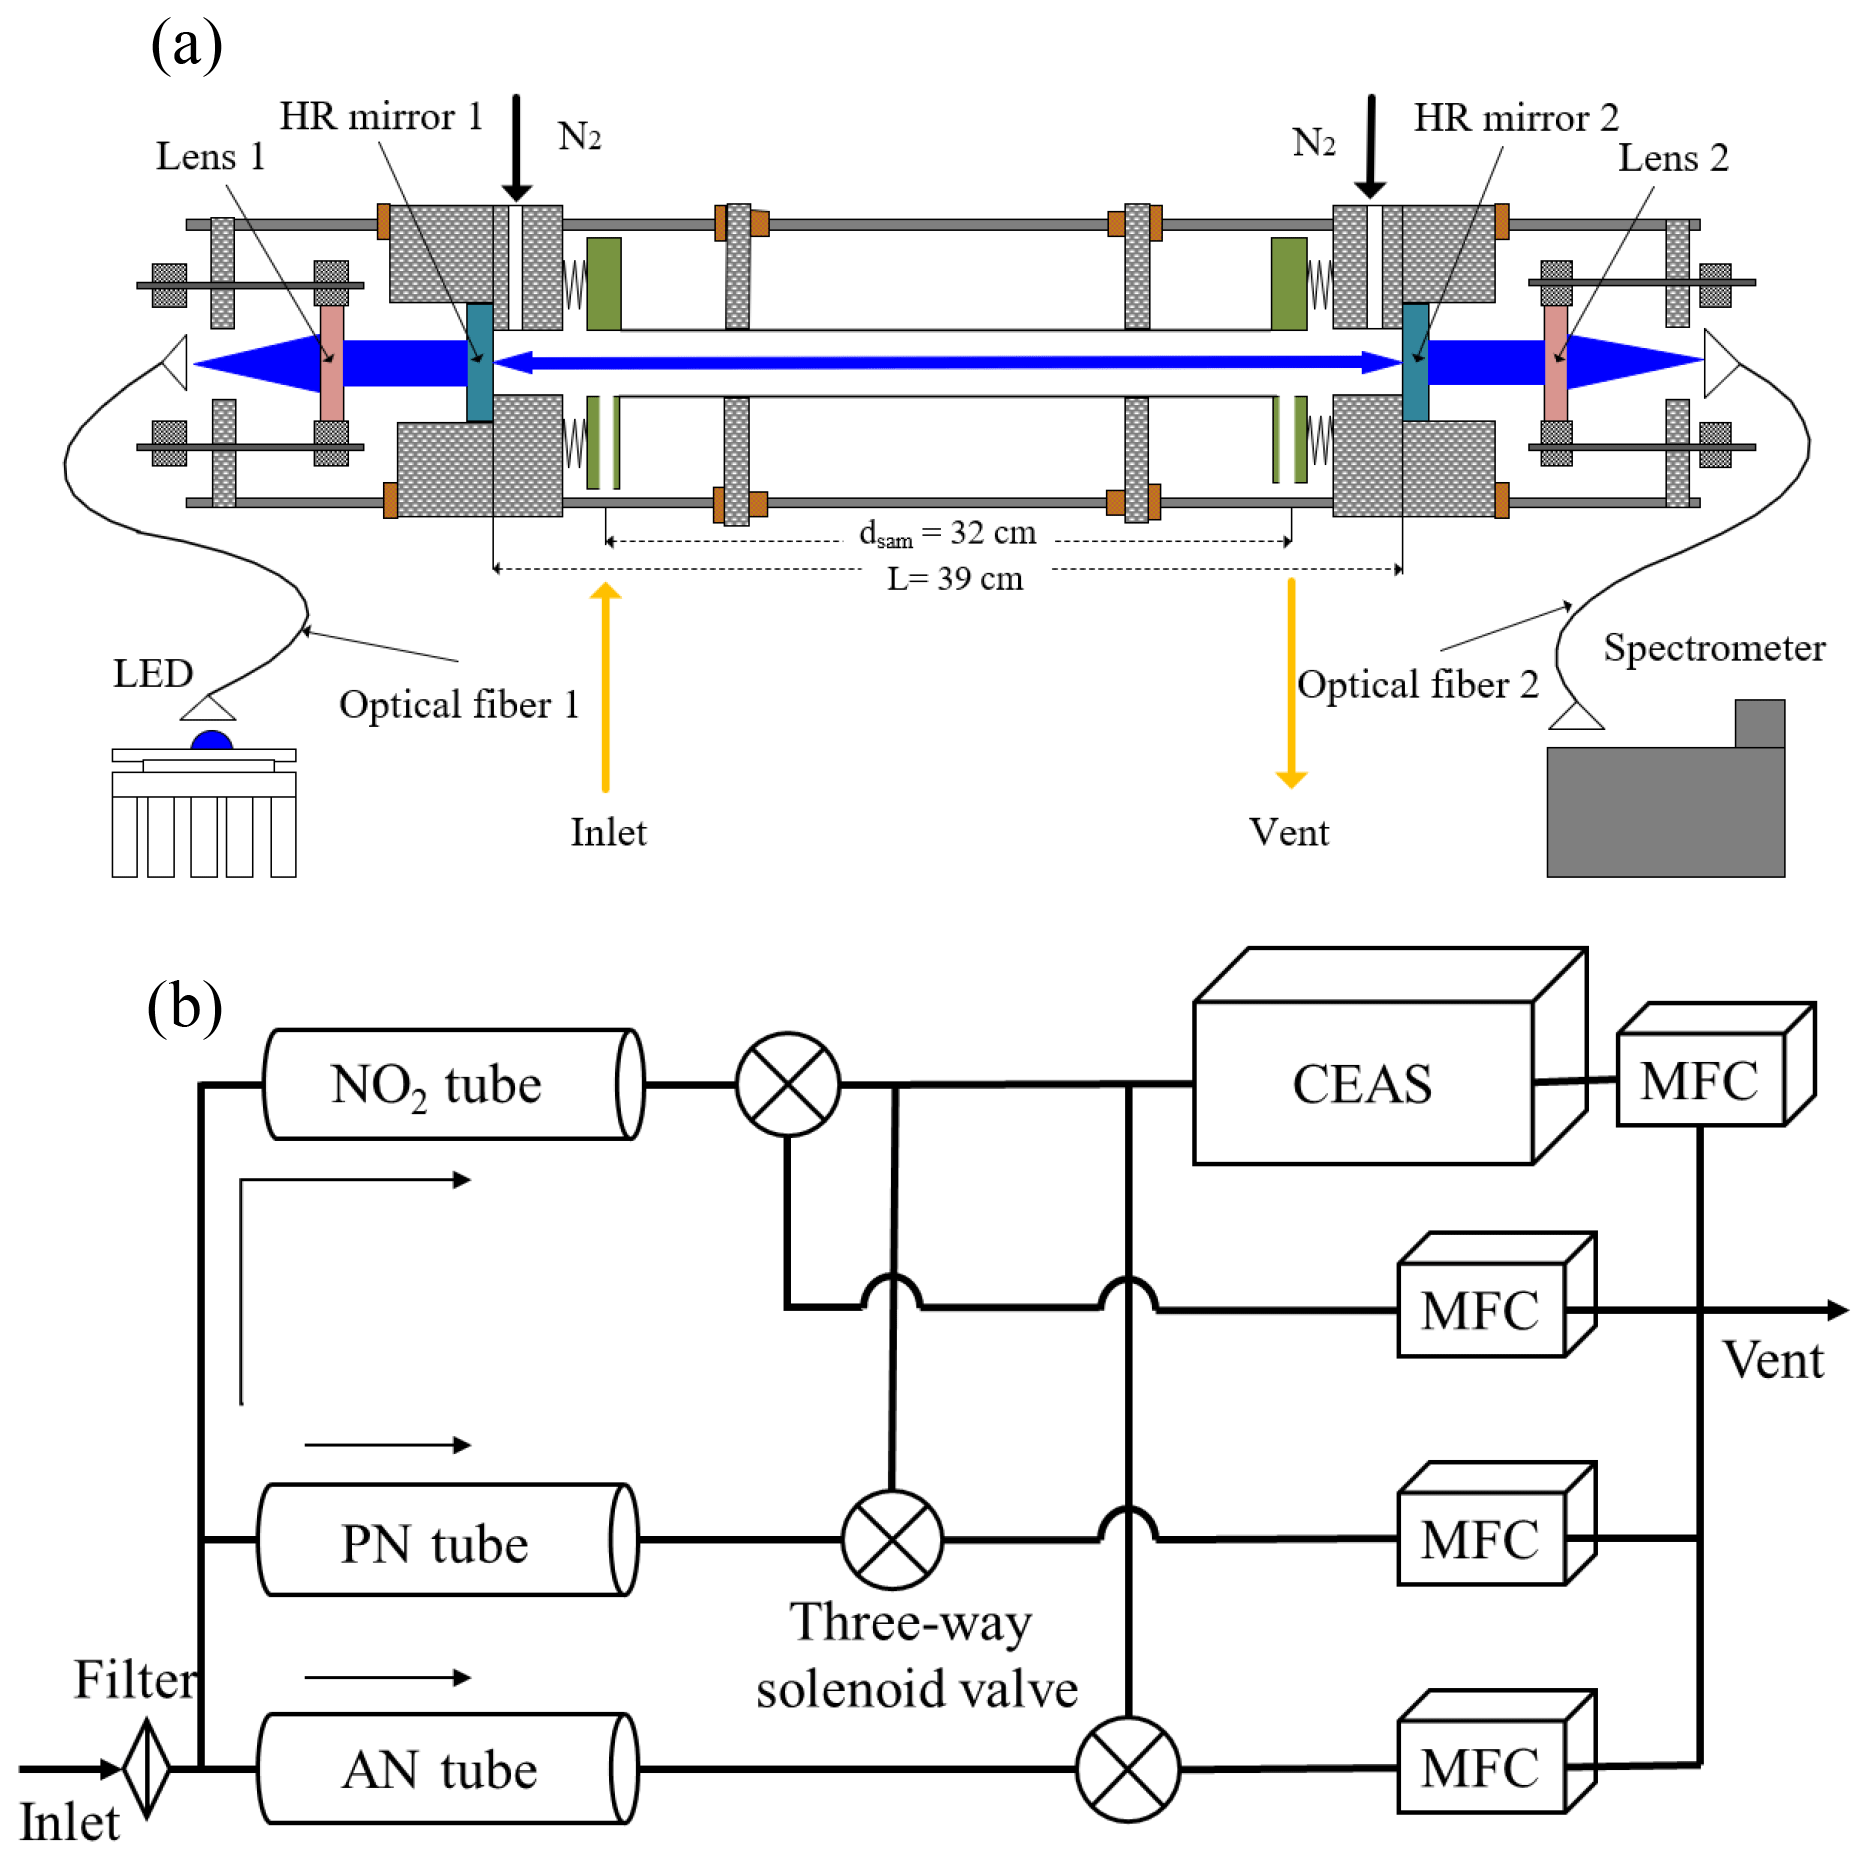
Figure 1The overall schematic of the CEAS (a) and the instrument (b). The CEAS is mainly composed of LEDs, collimating optics, a cage structure, a high-finesse cavity, and a spectrometer. After filtering the PM, the gas passes through three quartz tubes, and then the alternate measurements of NO2, NO2+ PNs, and NO2+ PNs + ANs are achieved by three-way solenoid valves.
The cavity system is sealed by two welded bellows, two polytetrafluoroethylene (PTFE) connecting pieces, and a stainless-steel sampling cell that is internally polished. The PTFE connecting piece connects the sampling cell and bellows and acts as a sample inlet and outlet. As shown in Fig. 1a, the distance between the inlet and outlet (dsam) is 32.0 cm. After passing through the sampling cavity, the blue light converges through another plano-convex mirror (f=50 mm). It enters the detector spectrometer (QE65PRO, Ocean Optics, Dunedin, FL, USA) for signal acquisition through an optical fiber. The dark current in the CCD of the spectrometer is reduced by controlling the temperature of the CCD at −20.0 ∘C; the width of the entrance slit is 100 µm, the corresponding wavelength resolution is 0.39 nm, and the detection wavelength range is 413.48–485.48 nm.
The schematic of the TD-CEAS is shown in Fig. 1b. The flow system mainly includes the particulate matter filter in the front end of the sampling line, quartz tubes for species pyrolytic conversion, three-way system switching module, detection module (CEAS), and flow control module. The sample gas first passes through a PTFE filter membrane (25 µm thickness, 4.6 cm diameter, and 2.5 µm pore size, Typris, China) to remove ambient aerosols. The sample gas enters the system through a in. PFA (polytetrafluoroethylene) tube and is then divided into three channels (NO2 channel, AN channel, and PN channel) by using two T-shaped PFA three-way connections. The gas flow at the end of each channel is controlled at 0.8 L min−1, and the total flow rate (sample flow gas and purge gas) is 2.6 L min−1 maintained by mass flow controllers and a diaphragm pump.
The quartz tubes have a length of 35 cm, which have an inner diameter of 5 mm and an outer diameter of 10 mm and are connected to the system through a 10 mm to 6.35 mm ( in.) PTFE connection. The quartz tubes of the AN channel and the PN channel are heated by resistance wires, and temperature is controlled by the PID algorithm. An asbestos sleeve on the quartz tube surface is used to insulate heat exchange with the external environment. The heating powers of the PN channel and AN channel are approximately 20 and 50 W, respectively. The length of the heating module is 15 cm. According to the pyrolytic efficiency experiment (see Sect. 3.4 for details), the heating temperatures for the AN and PN channels are controlled at 380 and 180 ∘C, respectively. One CEAS is used to detect the NO2 absorption of different channels to reduce the cross interference due to the difference of multidetectors. A solenoid valve is connected behind the quartz tube of each channel. At the same time, a time relay is used to periodically control the three T-shaped solenoid valves (71335SN2KVJ1, Parker Hannifin, USA), and the internal surface of the T-shaped solenoid valves is stainless steel. Each channel has the same constant flow rate regardless of whether the sampling air draws into the CEAS or vent. At the end of the channels, mass flow controllers are used to restrict the flow rate.
2.2 Laboratory experimental setup
To characterize the performance and potential interferences of this instrument, we used a photochemical PAN source in the laboratory experiments. Acetone undergoes photolysis at 285 nm from a Hg lamp and then generates excess PA radicals (peroxyacetyl radicals) in zero air. A small amount of NO reacts with PAs to form NO2, and then NO2 further reacts with PAs to form PAN. We obtained a standard PAN source in this way, which generated a source at a level of 1–10 ppbv. The source was used for the laboratory experiments after the temperature of the Hg lamp stabilized at 39.0 ∘C, and the source level and stability were double-checked by a GC-ECD instrument. To investigate the potential interferences caused by the pyrolysis of organic radical products reacting with ambient NO and NO2 in the TD-CEAS, a multigas calibrator (146i, Thermo Fisher Scientific, Inc., USA) was used to generate O3 gas by photolysis of oxygen and outputted well-mixed gases by diluting NO or NO2 with zero air according to the requirement of studying the potential inferences caused by ambient NO and NO2. NO (1 ppmv) and NO2 (10 ppmv) bottle gases were connected to the multigas calibrator. An ozone monitor was used to detect O3 levels in these experiments (49i, Thermo Fisher Scientific, Inc., USA). A NOx monitor was used to detect NO and NO2 levels in these experiments (42i, Thermo Fisher Scientific, Inc., USA). Pure N2 (>99.9999 %) and He (>99.9999 %) bottle gases were used to calibrate the mirror reflectivity of the CEAS and to purge the mirrors.
2.3 Box model
A box model was established to mimic the experimental results and study the potential interferences of NO and NO2 in the PN and AN measurements. The chemical mechanism is based on previous work (Thieser et al., 2016). These reactions during the pyrolytic process in the box model are listed in Text S1 in the Supplement, and the reaction rate of these reactions is mainly taken from the Master Chemical Mechanism, MCM v3.3 (website: http://mcm.leeds.ac.uk/MCM, last access: March 2020) (Jenkin et al., 1997; Saunders et al., 2003). As the wall loss has an important effect on the lifetime of free radicals, we set the wall loss constant (kwall) of RO2 to 0.3 s−1 (Thieser et al., 2016; Wooldridge et al., 2010). The wall loss rate coefficients of HO2 and OH are selected as the values of 0.5 and 5.4 s−1, respectively (Fuchs et al., 2008). The residence time of the sampling gas in each channel is calculated by considering the temperature distribution. The time step of the model is set to 0.001 s.
3.1 Mirror reflectivity
The spectra of pure N2 (>0.99999) or He (>0.99999) filling the cavity through the purge lines are collected to calibrate the mirror reflectivity, as the Rayleigh scattering section of the two is significantly distinct; therefore, R(λ) can be calibrated according to Eq. (2) (Chen and Venables, 2011; Min et al., 2016).
where d is the distance between two high-reflectivity mirrors, λ is the wavelength, and IHe(λ) are spectra obtained when the cavity is filled with pure N2 and He, respectively, and nHe are the number densities calculated at the measurement temperature and pressure in the cavity, respectively, and and σRayl,He(λ) are the Rayleigh scattering sections of N2 and He, respectively (Shardanand, 1977; Sneep and Ubachs, 2005). Figure 2 shows the average of the mirror reflectivity calibration results. R(λ) is above 0.9999 at 435–465 nm and up to 0.99992 at 450 nm. The total uncertainty of the mirror reflectivity is 5 %, which comes from the uncertainty in the scattering section of N2. The blue line is the average optical path length when the sampling flow rate in the cavity is 0.8 L min−1, which is equal to (deff is 31.84 cm), with a value up to 5.2 km at 450 nm.
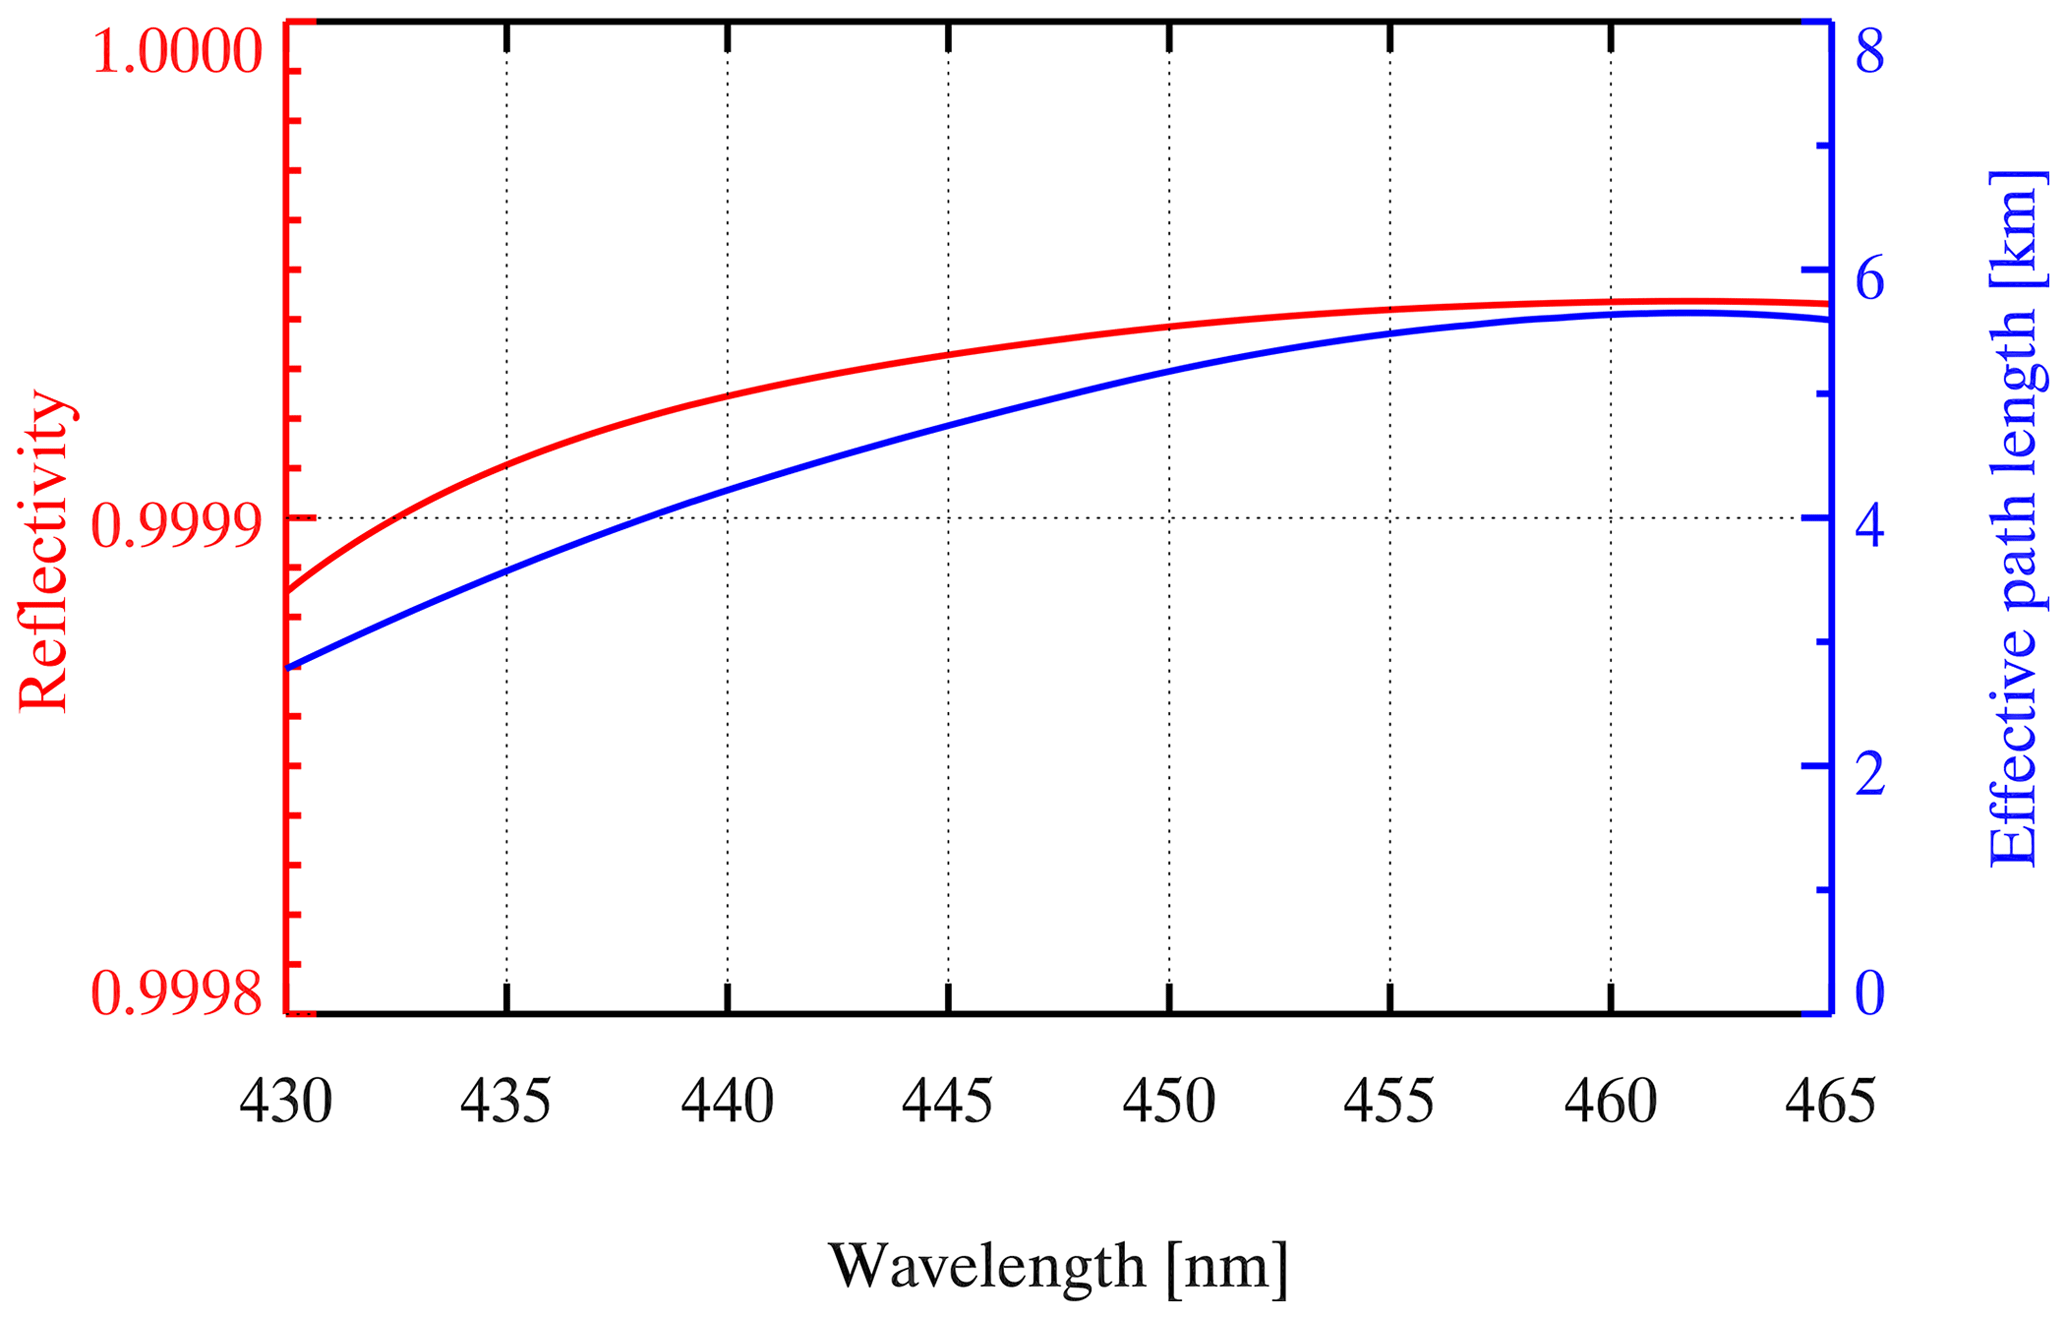
Figure 2Mirror reflectivity and optical path length calibrated by He (>0.99999) and N2 (>0.99999). The red line is the average R(λ), and the blue line is the optical path length.
3.2 Effective cavity length
The effective length of the absorbers (named effective cavity length, deff) in the detection cell is shorter than the physical distance of the cavity with purge; thus, it needs to be calibrated. We performed concentration determination on the NO2 standard source (130 ppbv) under two experimental settings with or without purging and then used Eq. (1) to calculate deff. The ratio of NO2 absorption with and without purging is equal to the ratio of the effective cavity length to the physical distance L between the mirrors (). A NO2 stand was prepared from a bottled standard (5 ppmv NO2) and diluted with high-purity N2 in a multigas calibrator (146i, Thermo Fisher Scientific, Inc., Waltham, MA, USA). As shown in Fig. 3a, the retrieved concentration of NO2 shows a general positive correlation trend with the flow rate with N2 purging; the concentration of NO2 is 130 ppbv without a purge. The at different sampling flow rates is shown in Fig. 3b. The ratio of the effective cavity length increases as the flow rate increases, suggesting the importance of airflow rate stability during sampling. The uncertainty of the prepared NO2 standard source is estimated to be 2.0 %, while the uncertainty of the NO2 absorption cross section is 4.0 %, according to Voigt et al. (2002). As a result, the total uncertainty of deff calibration is 4.5 % (Voigt et al., 2002).
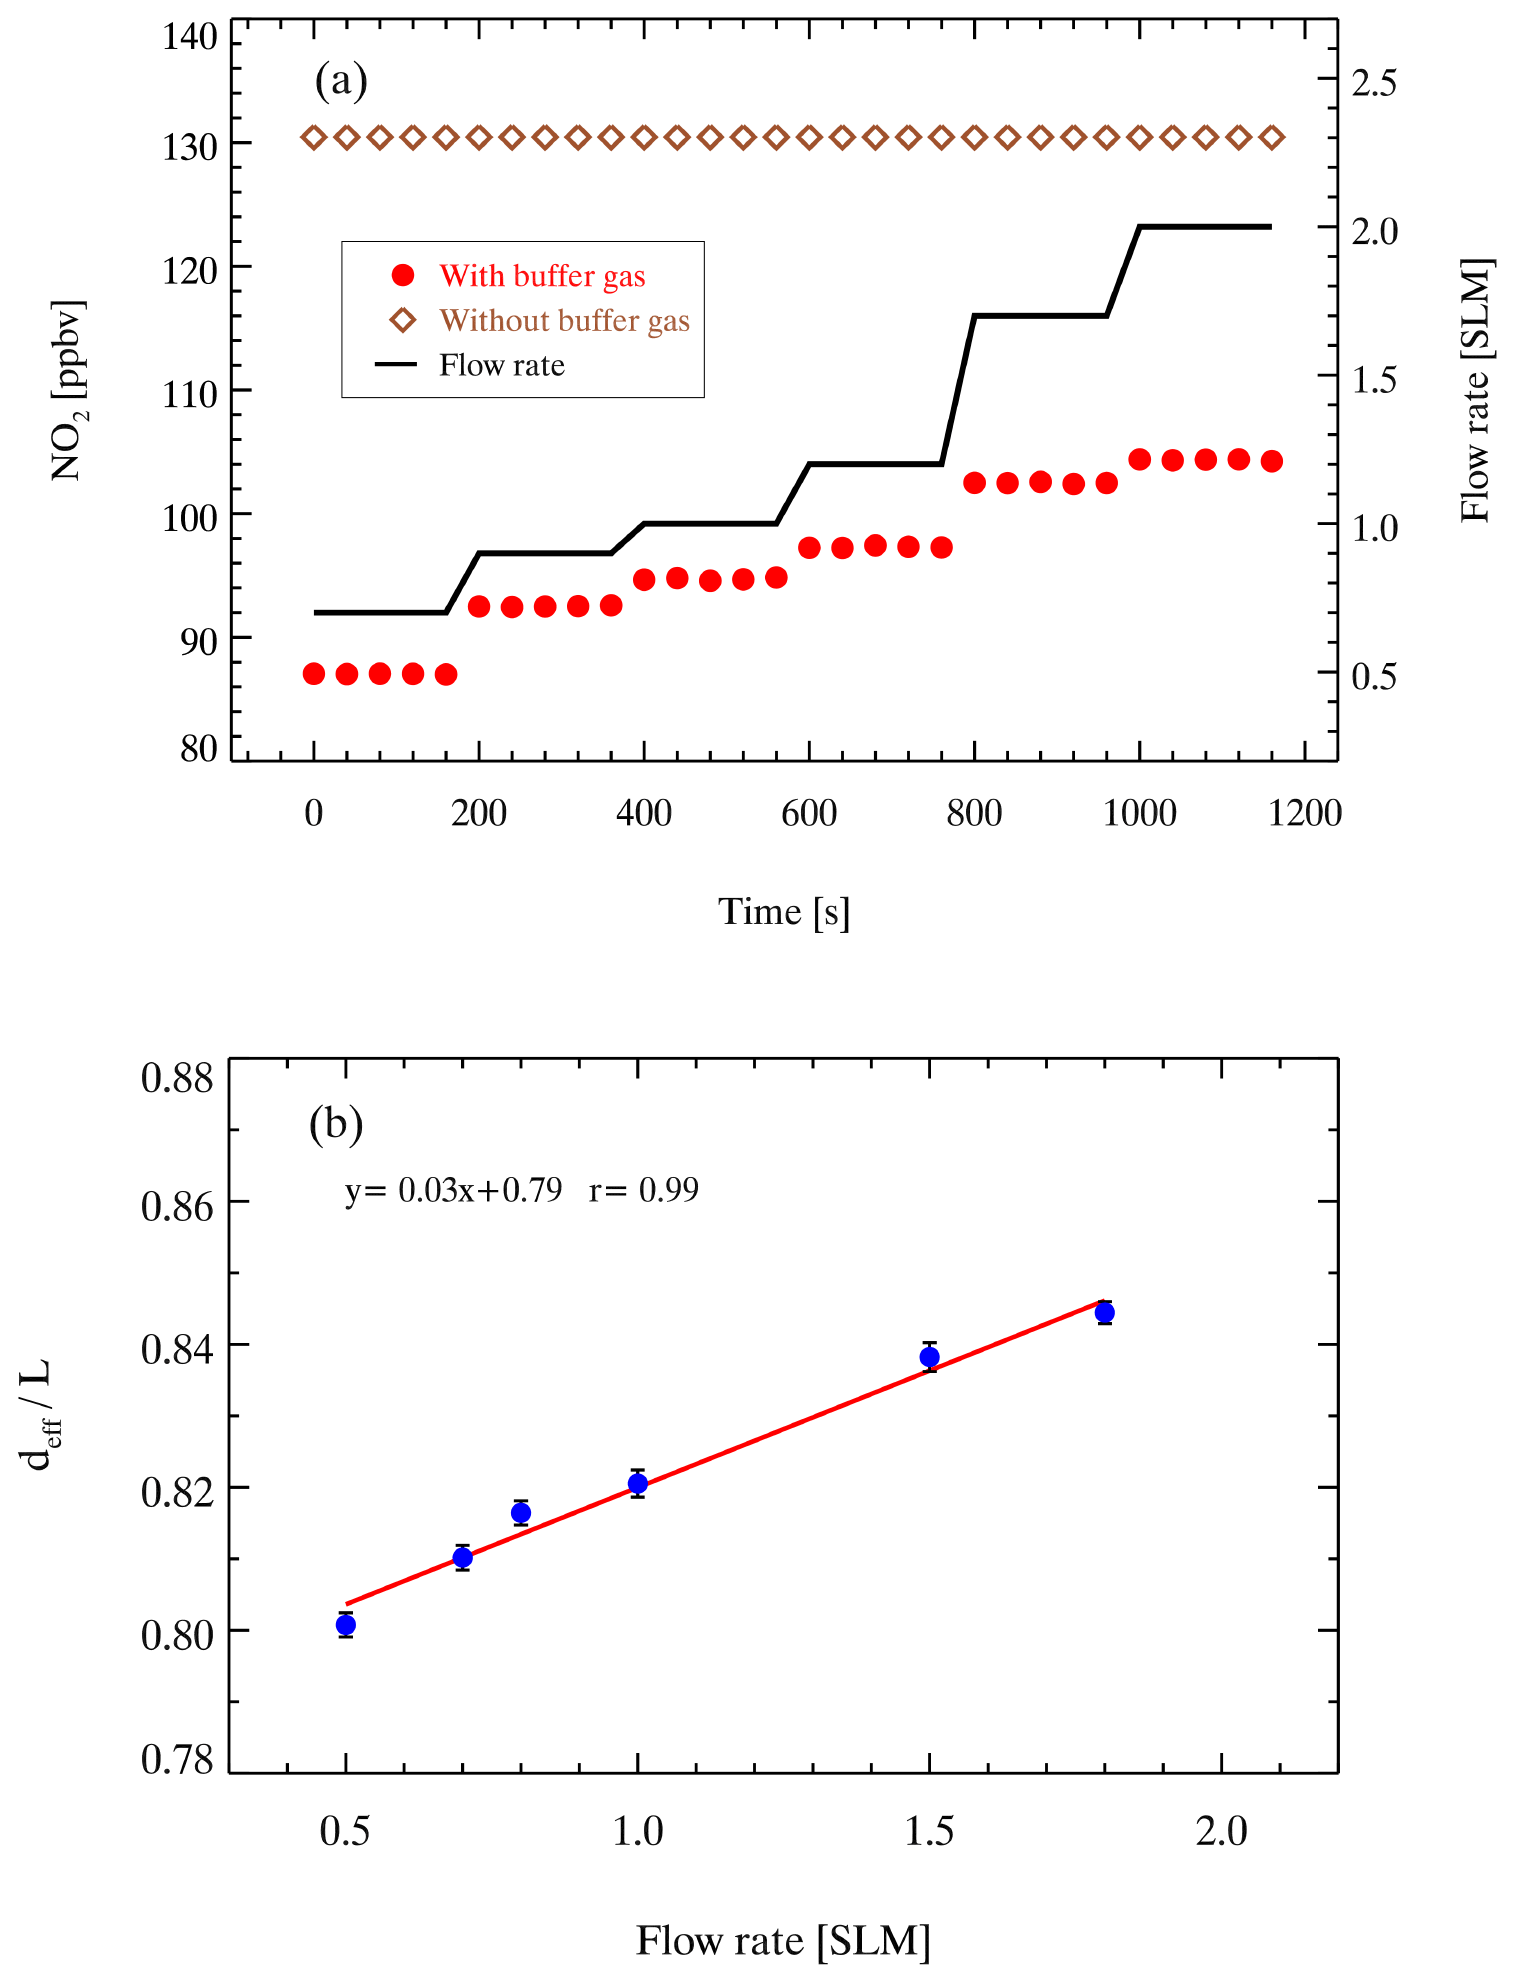
Figure 3The results of the effective cavity length. (a) The black line represents the flow rate, and the red points and brown diamonds represent the retrieved NO2 concentration with and without nitrogen purge (100 sccm ×2), respectively. (b) The relationship between the ratio of the effective cavity length (deff) to cavity physical distance (L) and the sampling flow rate.
3.3 Spectral fitting
The absorption cross section of NO2 measured by Voigt et al. (2002) is used to retrieve the NO2 concentration in this study. The absorption cross section of NO2 between 435–455 nm is selected to perform the spectral fitting. It has been reported that the NO2 cross section is not sensitive to temperature changes (Vandaele et al., 2002; Voigt et al., 2002); therefore, convolution is only performed for our instrument setup at ambient temperature. The peak at 436.2 nm of the Hg spectrum measured by the spectrometer is used to generate a wavelength-dependent instrument slit function that accounts for the change in spectral resolution over the CCD pixels. The convoluted cross section of NO2 is shown in Fig. S1. The measured absorption coefficient (α) is processed by the DOASIS (differential optical absorption spectroscopy intelligent system). The fitting shift is constrained within ±0.2 nm. Glyoxal has strong absorption in the same optical window (Liu et al., 2019; Min et al., 2016; Thalman et al., 2015; Thalman and Volkamer, 2010; Washenfelder et al., 2008), but here we do not take glyoxal absorption into consideration in the spectral fitting. The inclusion of glyoxal in the spectral fitting would enlarge the fitting residual. Our field measurements showed that the uncertainty caused by excluding glyoxal fitting was approximately 4 % (Fig. S2). Figure 4 shows two examples of the spectral fitting of the measured absorption of high and low NO2 at a 6 s integration time during the ambient measurement. The retrieved mixing ratios of NO2 were 16.2±0.1 and 1.8±0.1 ppbv, respectively. The corresponding fitting residual, which is the difference between the measured and fitting results, is in the range of at 435–455 nm. A typical measurement sequence during the ambient measurement is illustrated in Fig. 5, which displays NO2 mixing ratios of three channels alternatively. The mixing ratio of NO2 in different channels is detected periodically, and there are several transitional points due to switching measurement phases. Therefore, we excluded the transition point of each phase and the two data points before and after the transition point to avoid measurement error. As we discuss later, the mixing ratio of ANs and PNs can be calculated by subtracting the NO2 mixing ratio measured from different channels.
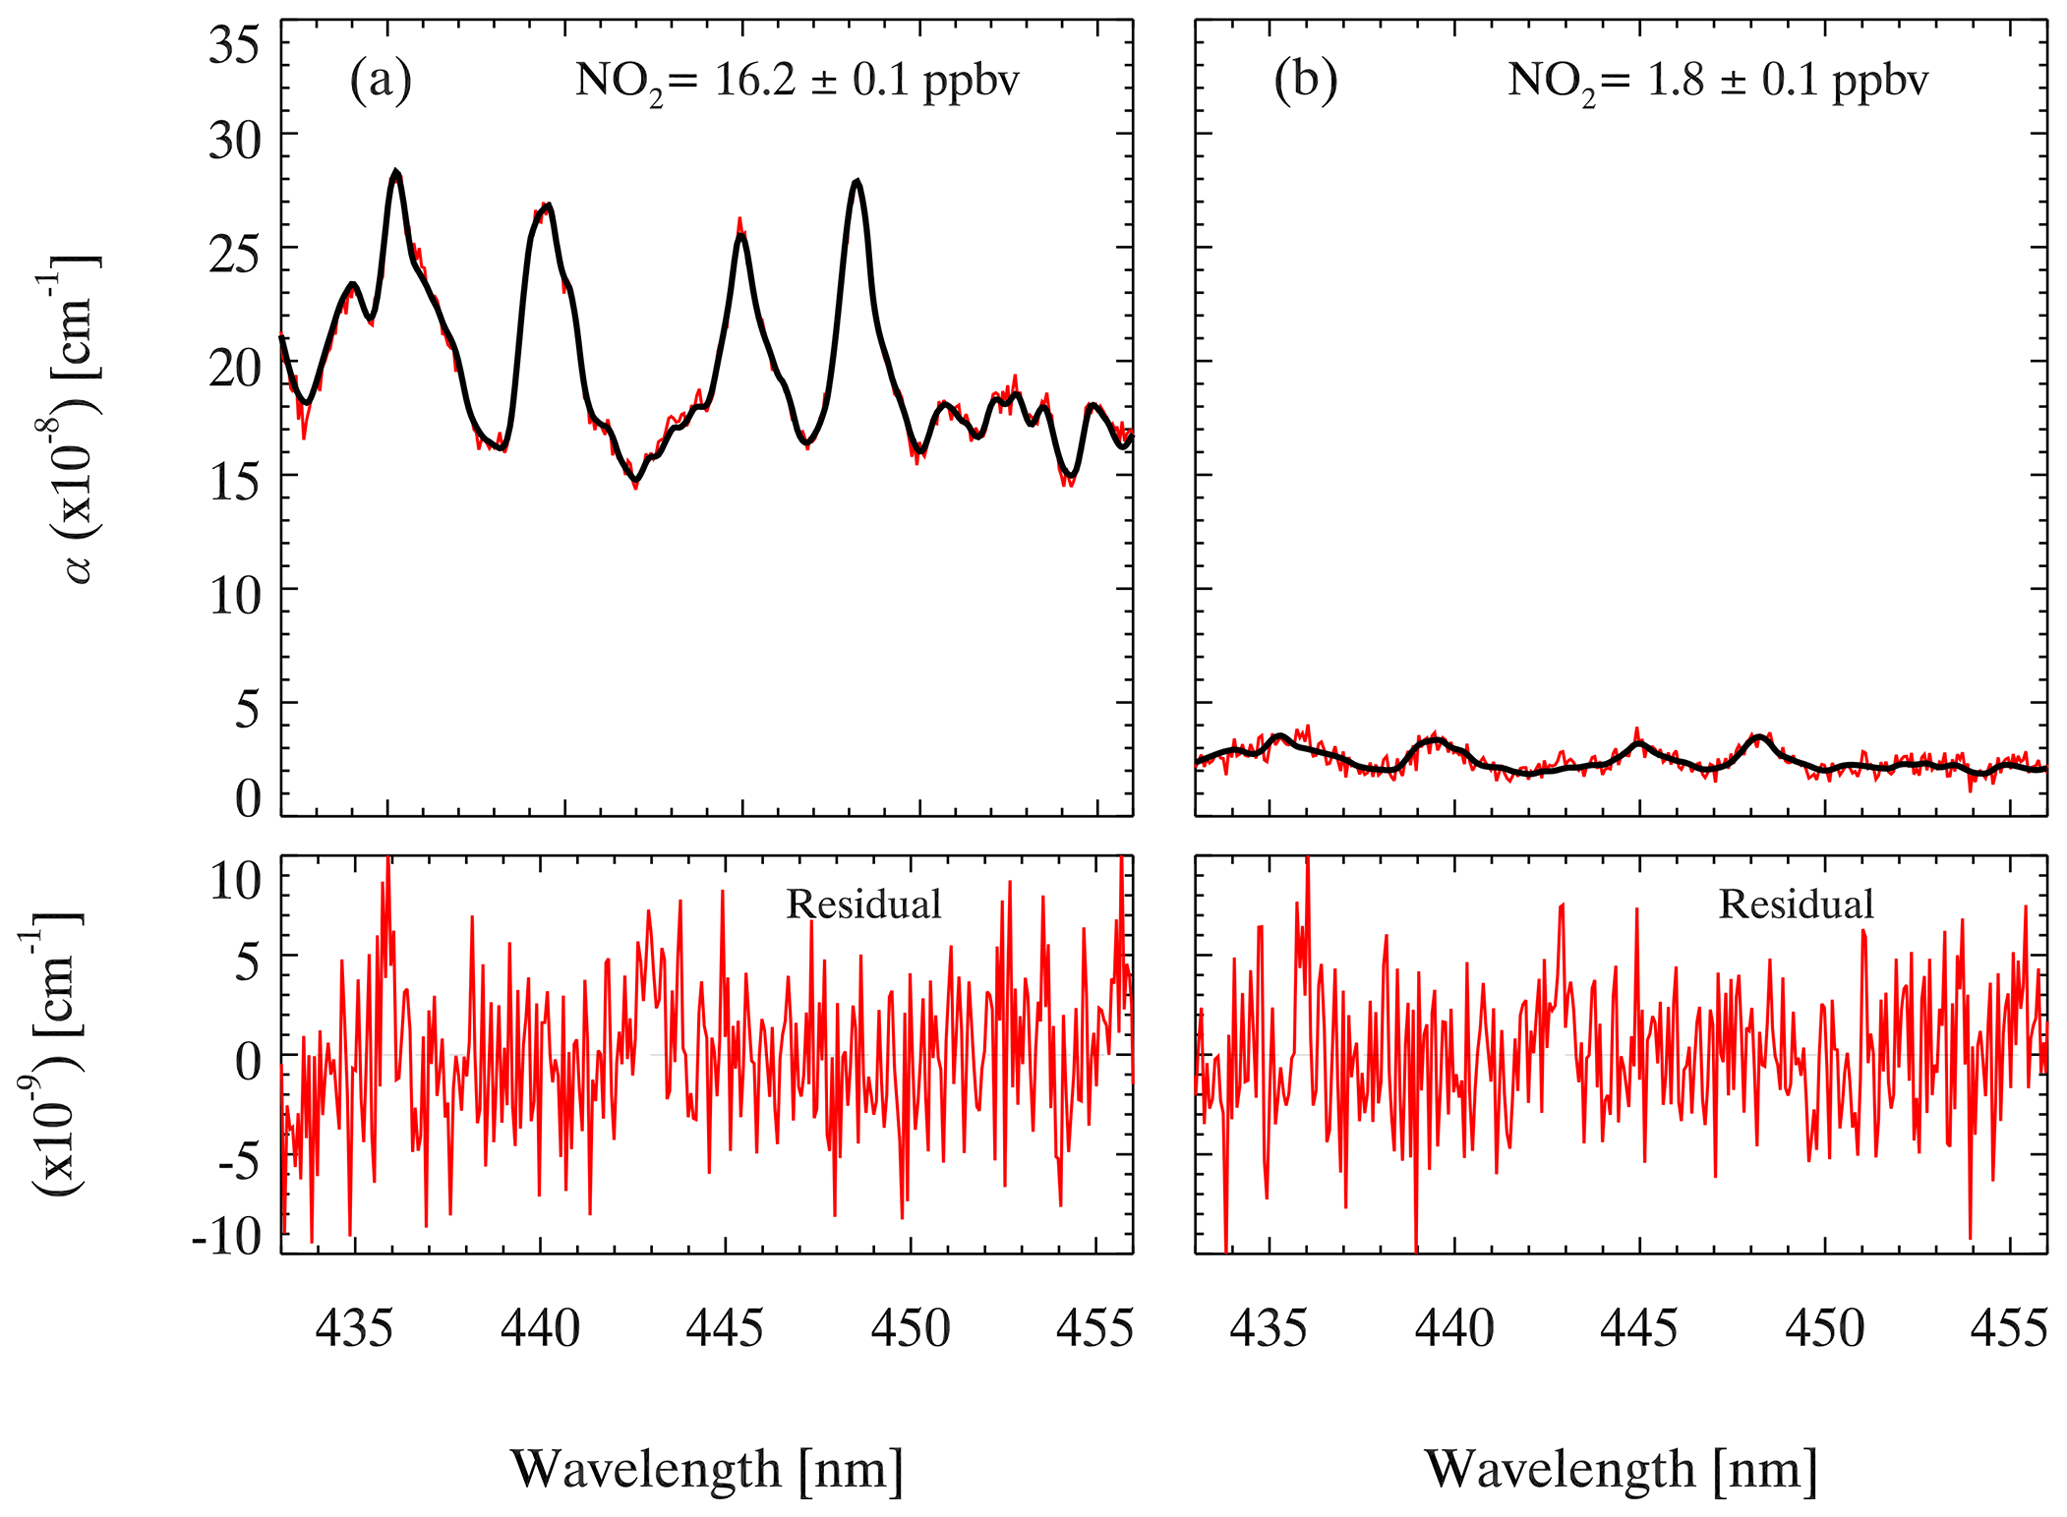
Figure 4An example of the spectral fit for an extinction spectrum measured (6 s average) during field measurements. The fitted results of NO2 are shown, and the total fit result and the residual at high concentrations (a) and low concentrations (b) are shown.
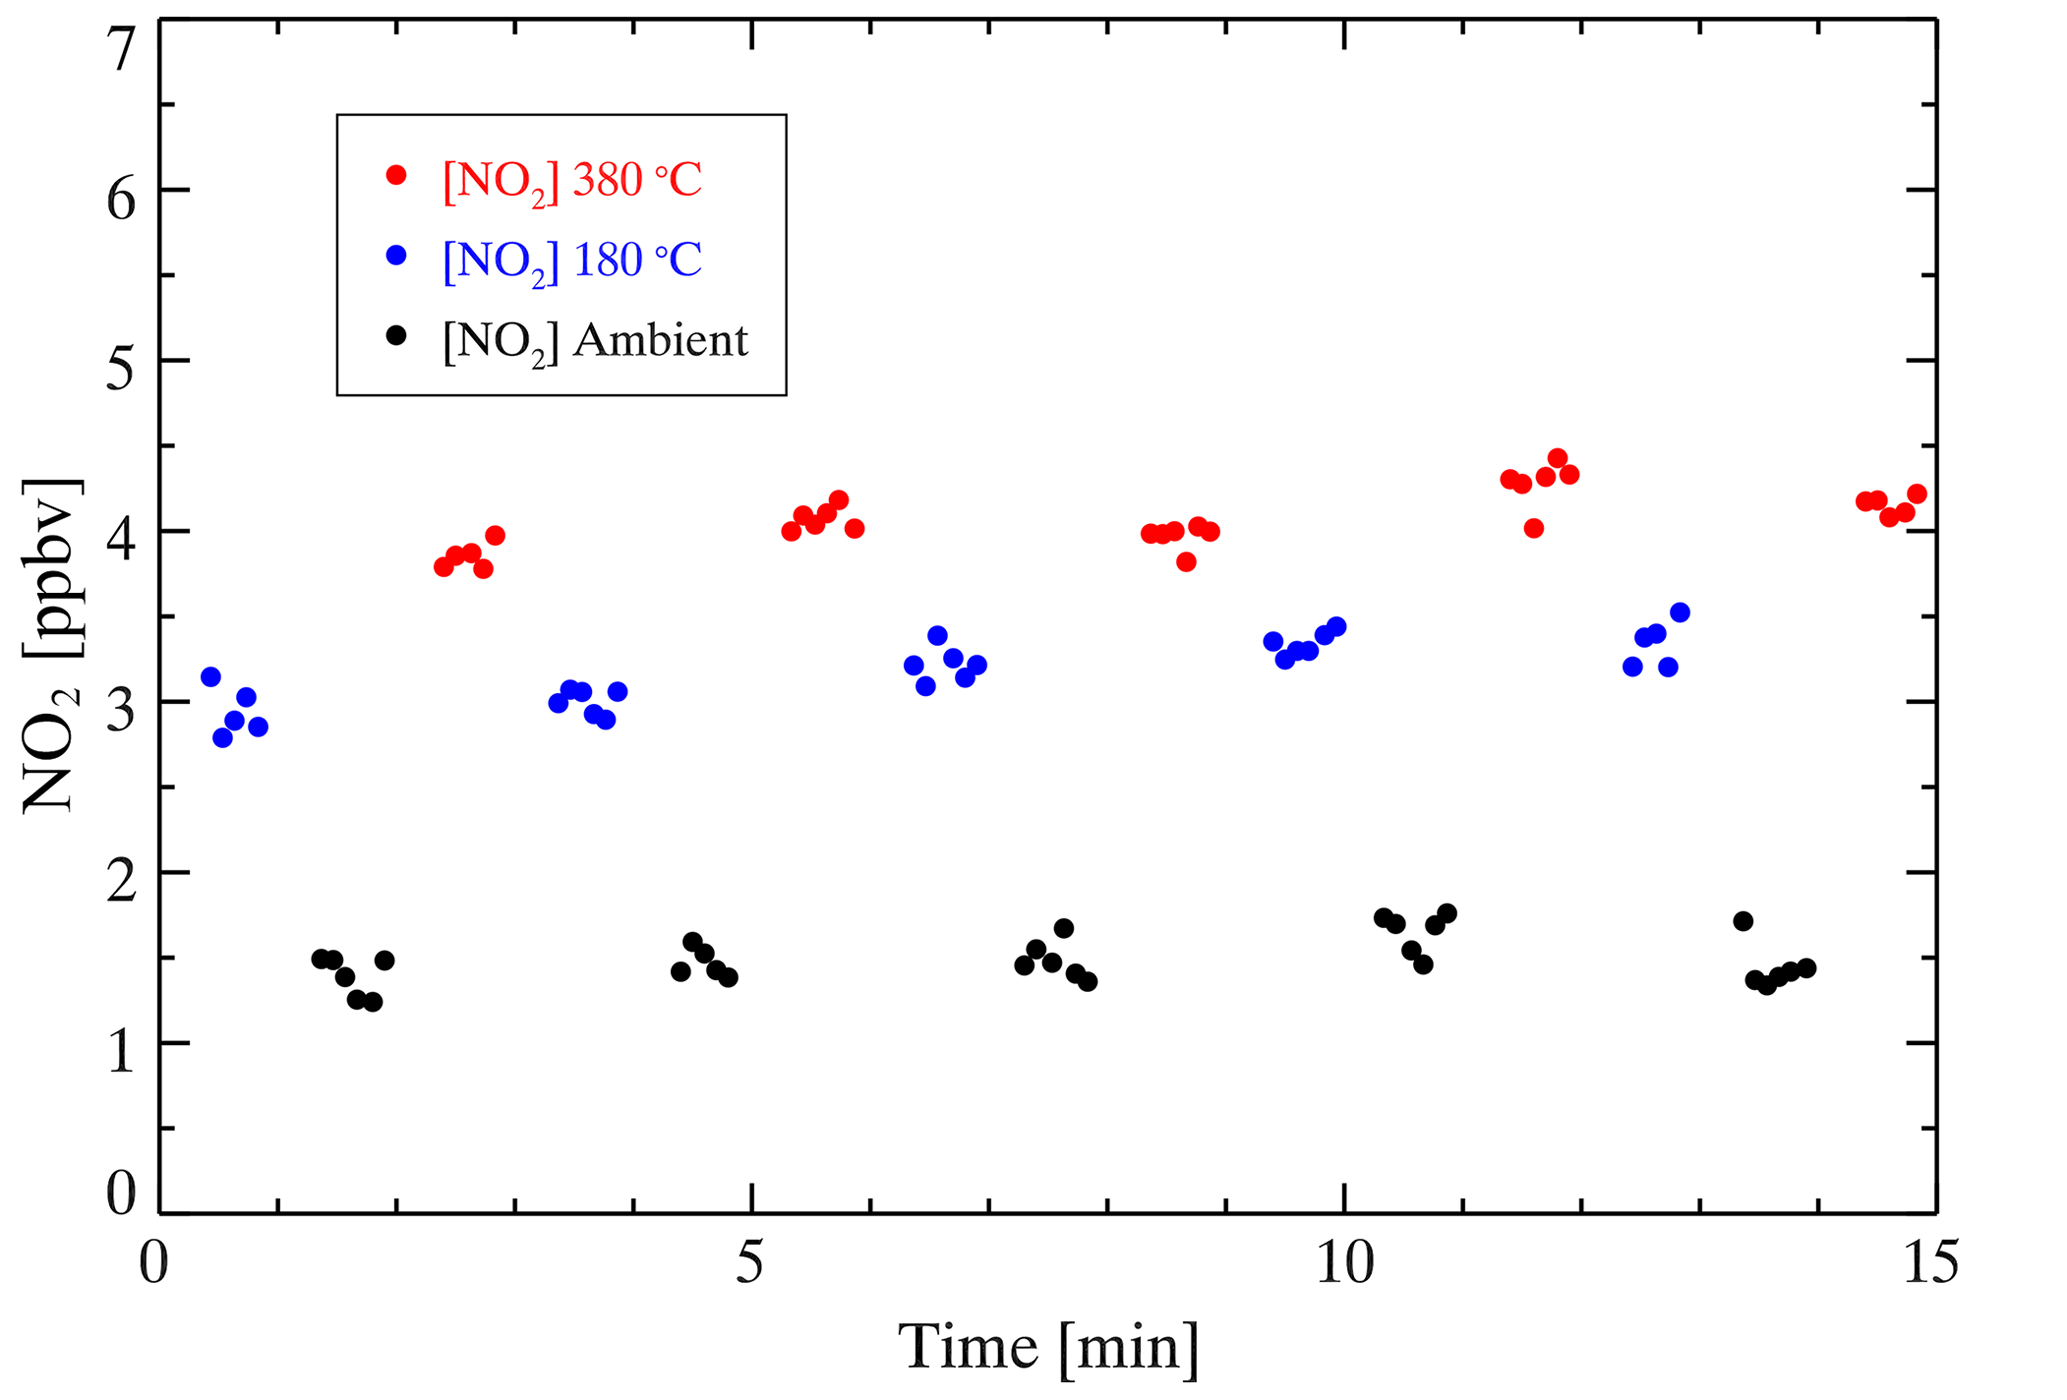
Figure 5An example of typical measurements performed in a field study with a 6 s spectrum integral time. A measurement cycle includes three phases whose duration is 60 s. The red points denote the NO2 mixing ratio measured in the AN channel ([NO2] 380 ∘C), the blue points denote the NO2 mixing ratio measured in the PN channel ([NO2] 180 ∘C), and the black points denote the NO2 mixing ratio measured in the reference channel ([NO2] ambient temperature).
There are two methods to determine the mixing ratio of ONs and PNs. One is the differential concentration method (“CONC”). As shown in Eqs. (3)–(6), the I0 is fixed during data analysis by using the N2 spectrum: ITD380 and ITD180 are the spectra obtained when the CEAS detects the AN channel and PN channel, respectively; is the N2 spectrum obtained when the cavity is filled with N2 (>0.99999); αTD380 and αTD180 are absorption coefficients when setting as I0, and setting ITD380 or ITD180 as I, respectively; and after deleting the abnormal points caused by phase switching, [ONs] is obtained by subtracting [NO2]TD380 from the average of [NO2]REF, and [PNs] is obtained by subtracting [NO2]TD180 from the average of [NO2]REF. The other method is the differential absorption method (“SPEC”), by using the dynamic background spectrum method for spectral fitting (Eqs. 7–8): IREF is the spectrum obtained at the reference channel, ONs can be retrieved based on ITD380 and IREF, and PNs can be retrieved by ITD180 and IREF. An intercomparison of field measurements shows that the SPEC method results in fewer outliers (Fig. 6). For the SPEC method, the shift and squeeze of the spectrum is performed only once during the spectral fitting, which reduces the uncertainty caused by the second spectral fitting. Therefore, we selected the SPEC method to retrieve the concentrations of NO2, PNs, and ANs in the following data processes.
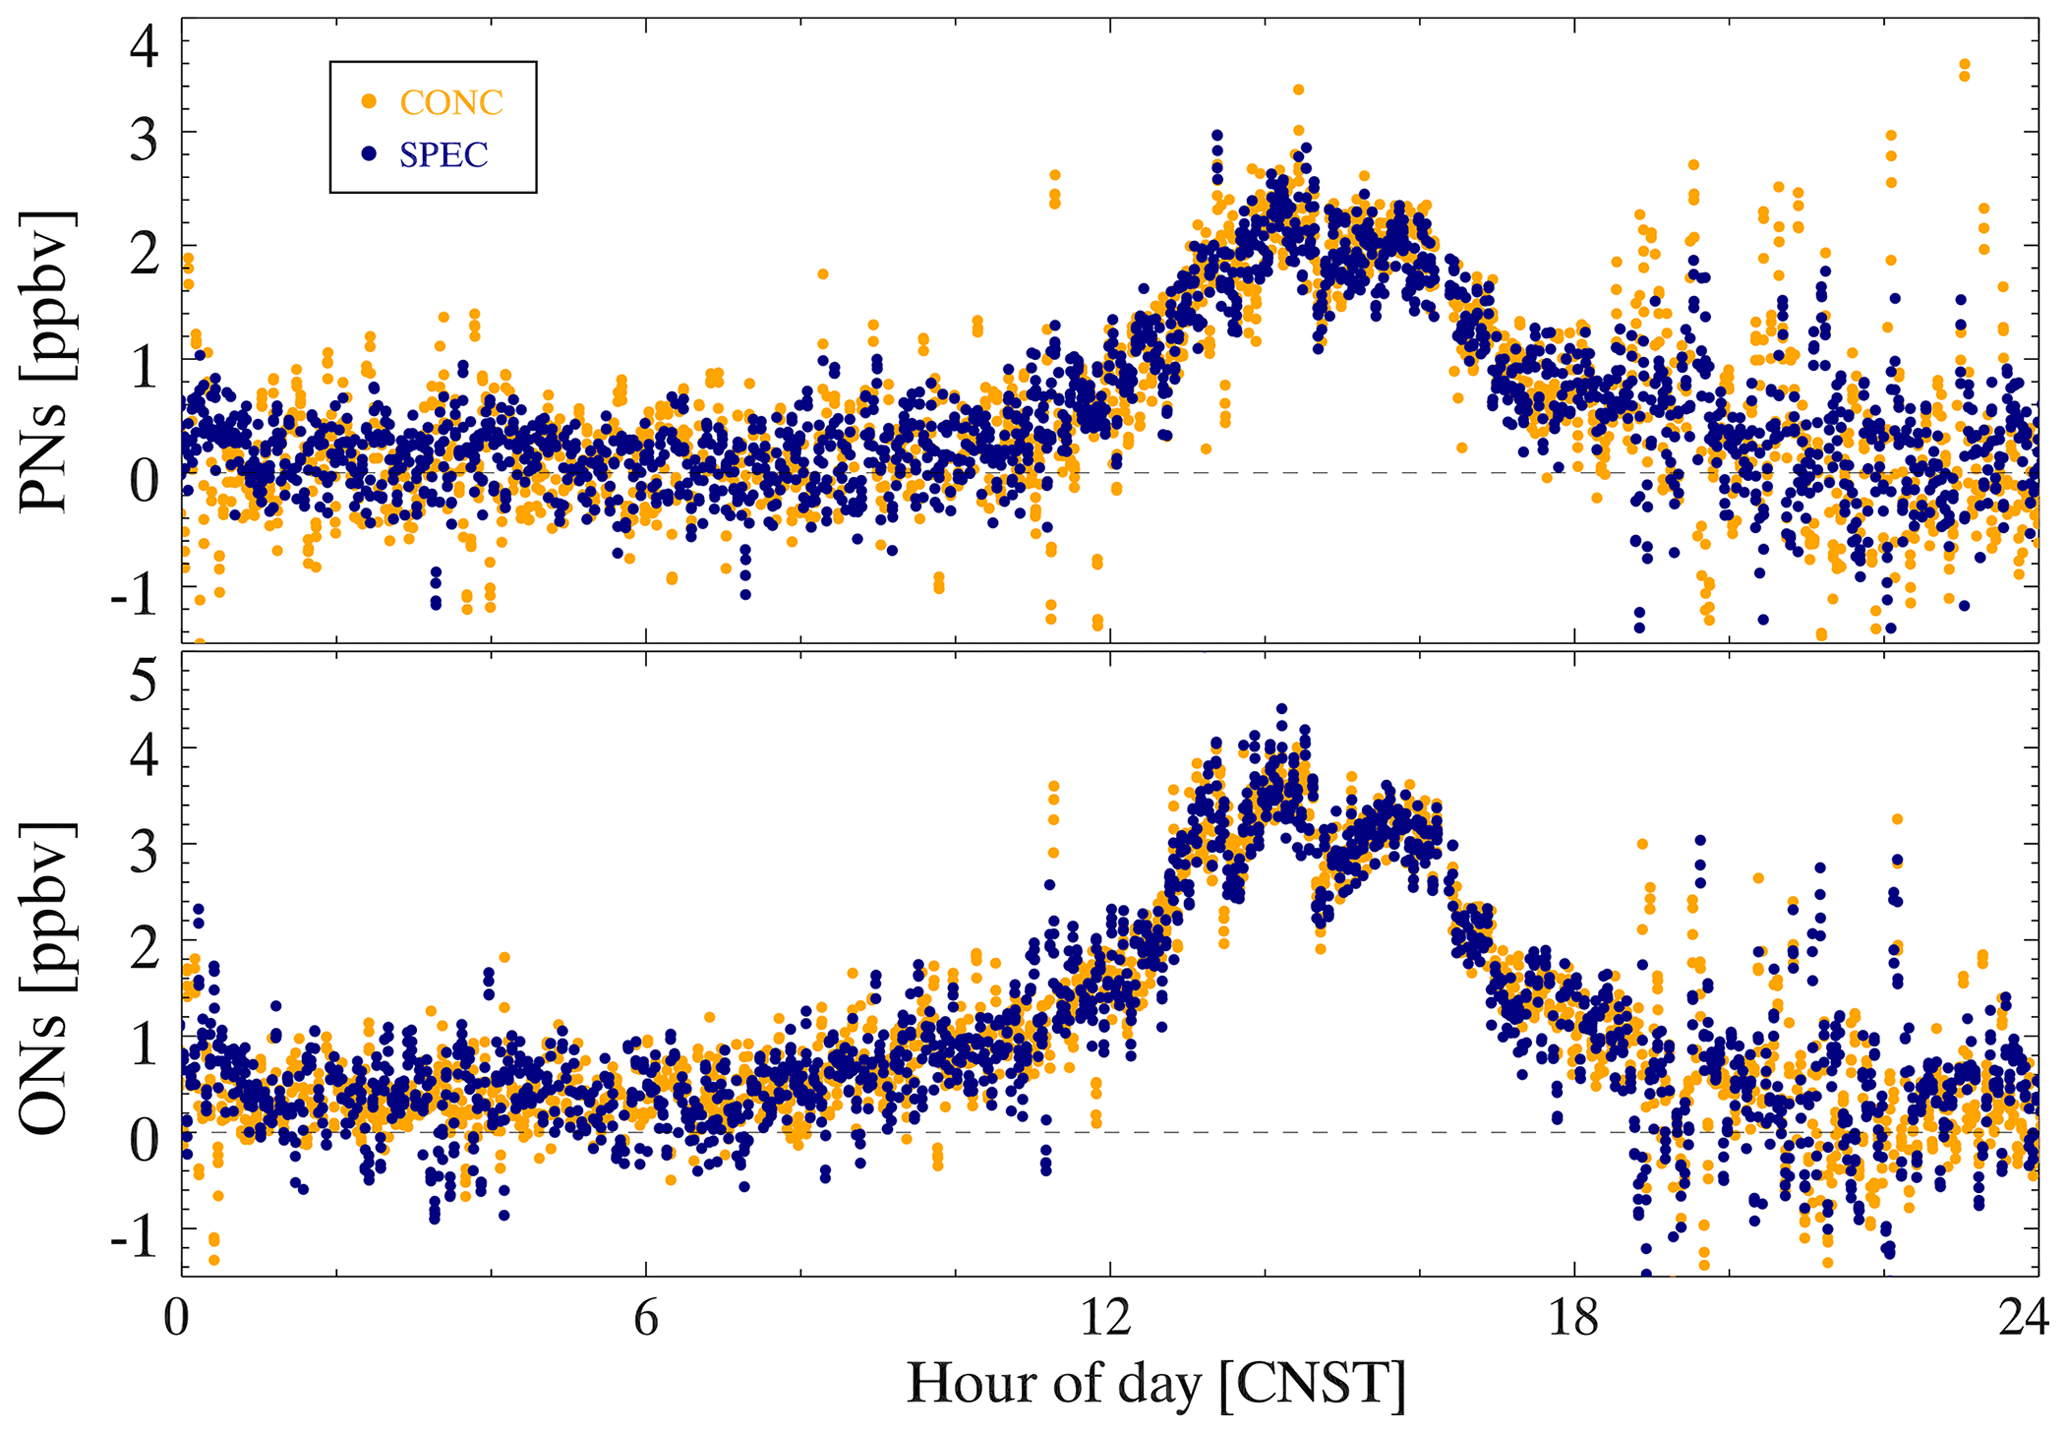
Figure 6An example of the calculation results of the fixed I0 (“CONC”) and dynamic I0 (“SPEC”) methods performed in the field measurements. Orange points represent the results of the CONC method, and dark blue points represent the calculation results of the SPEC method.
3.4 The efficiency of thermal dissociation
For the pyrolytic measurement of organic nitrates, the exact temperature setting for complete pyrolysis varies, mainly due to the many factors that affect the efficiency of thermal dissociation, such as the specificity of the quartz tube, the heating residence time, and the temperature distribution of the heating part (Womack et al., 2017). The thermal dissociation of PAN was tested separately in the PN channel and AN channel, and the efficiency curves were the same. The heating temperature is the temperature of the quartz tube surface rather than the airflow temperature in the quartz tube. The experiments were performed under normal sampling conditions, and the heating temperature was evaluated from room temperature to 440 ∘C to determine the appropriate heating temperature. Figure 7 shows that the pyrolysis of PAN starts when the heating temperature is approximately 50 ∘C. The curve seems to reach a plateau when the heating temperature is approximately 180 ∘C. However, the normalized signal of thermal dissociation of PAN reaches the final plateau once the temperature is above 360 ∘C. Similarly, PAN is reported to be thermally dissociated completely at approximately 400 ∘C (Friedrich et al., 2020). The presence of alkyl nitrates in the PAN source has been reported before by previous studies and was regarded as the reason for the dual-plateau profile of PN dissociation (Paul et al., 2009). Here, we cannot rule out the possibility of alkyl nitrate impurities. However, the source level of PAN is equal to 92±3 % of NOx input, suggesting only a very small percentage (≤8 % on average), if any, of ANs. If the PAN source is equal to 4 ppbv in the PN channel at 180 ∘C, as Fig. S3 shows, PAN will first dissociate completely, and then PAs will recombine with NO2 to form PAN when the airflow passes through the cooling lines.
To further study the thermal dissociation of organic nitrates in the heated channels, box model simulations were conducted to reproduce the response relationship between heating temperature and NO2 generated by pyrolysis. If the PAN source is equal to 4 ppbv in the PN channel at 180 ∘C, as Fig. S3 shows, PAN will first dissociate completely, and then PAs will recombine with NO2 to form PAN when the airflow passes through the cooling lines. As shown in Fig. 7, PAN gradually transforms into NO2 and CH3O2NO2 as the setting temperature increases. The simulated signals of thermal dissociation of PAN show two plateaus, which is generally consistent with the experimental results. However, there are some differences from 260 to 360 ∘C, which may come from simulation uncertainties such as the temperature profile in the heated channel, the follow-up reactions of PA radicals, and their reaction rates. The first plateau at 180 ∘C is caused by the recombination of PAs and NO2 after the pyrolysis of PAN, and the time for recombination from the end of the tube to the inlet is 297 ms. Therefore, recombination cannot be ignored when the heating temperature plateau period indicates that almost all PAN is transformed into NO2, which is due to the increase in the pyrolytic loss of PAs, and the pyrolysis of PAN is enhanced with increasing temperature.
The occurrence of the dual-plateau phenomenon is due to the competition of pyrolysis and recombination reactions. PAN will produce NO2 and PAs after thermal dissociation, but PAs will recombine with NO2 if PAs are not lost on the wall surface in time (Reactions R7–R8). Therefore, the thermal curve shows two plateaus as the heating temperature increases. The concentration of PAN source and wall loss rate of RO2 influence the fraction of related species. Figure 8a and c show that the gap between the two plateaus increases with PAN concentration and decreases as the wall loss rate coefficients of RO2 increase. The wall loss of RO2 competes with the recombination of PA radicals and NO2. Therefore, a high wall loss rate coefficient of RO2 reduces the recombination for PAN.
The consistency between the observed and simulated thermal efficiencies of PAN suggests that the model simulation is reliable. Without the AN source to quantify the thermal efficiency of ANs, we try to use the model simulation to determine the heating temperature of the AN channel. Based on the same parameter settings of the model, MeN (methyl nitrate, CH3NO3) is selected as the representative ANs to simulate the pyrolytic efficiency curve. Figure 8b and d show that MeN can be totally thermally dissociated when the temperature is over 380 ∘C, indicating that a temperature set to 380 ∘C for the AN channel is reasonable. The simulation also showed that the two factors have almost no effect on the pyrolysis of MeN, which is completely pyrolyzed to produce NO2 when the temperature is 380 ∘C. The simulation results agree with previous reports about the temperature setting of thermal dissociation of ANs, with a range from 350 to 450 ∘C (Day et al., 2002; Sadanaga et al., 2016; Sobanski et al., 2016; Thieser et al., 2016). Therefore, 180 and 380 ∘C are selected as the heating temperatures of the PN channel and AN channel, respectively. In addition, the interference of incomplete dissociation for PAN in the PN channel at 180 ∘C is considered in the lookup table for correction, which is detailed in Sect. 4.1.
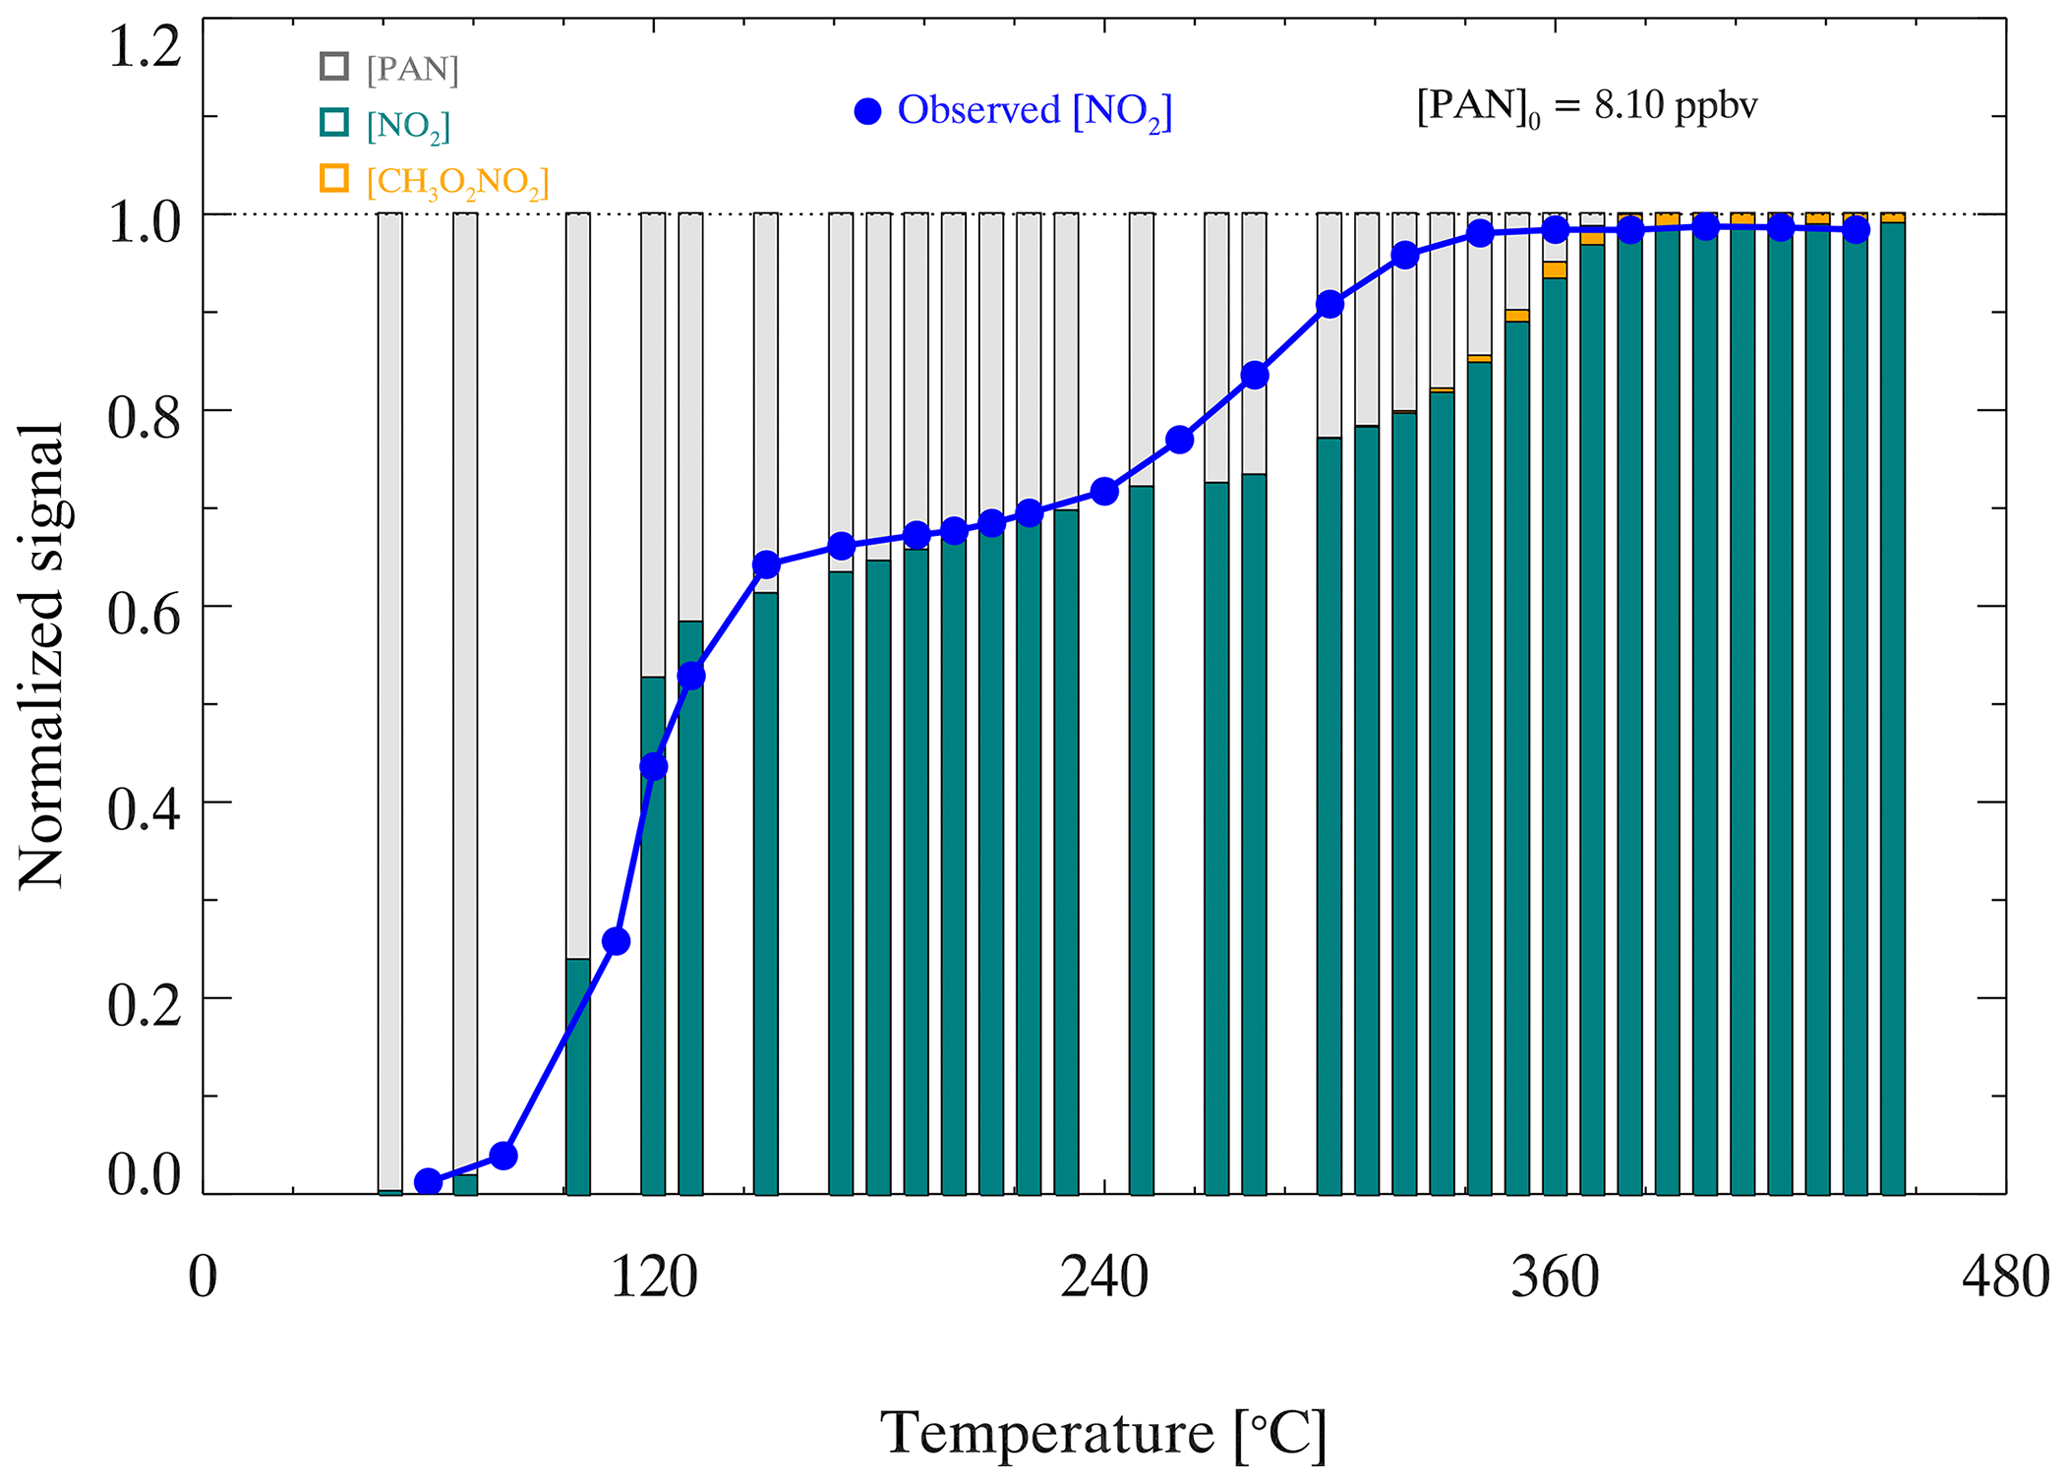
Figure 7Normalized signals of thermal dissociation of PAN. The blue points represent the normalized signal of the observed NO2 mixing ratio during thermal dissociation. The histogram represents the simulated distribution of thermal dissociation products at different temperatures, in which the gray, green, and orange columns represent PAN, NO2, and CH3O2NO2, respectively.

Figure 8Model-simulated thermal decomposition profiles of PAN and MeN with different amounts of PAN or MeN under different wall loss rate coefficients of RO2. Panels (a) and (b) show the NO2 signals of PAN and MeN when the wall loss rate coefficient of RO2 is 0.3 s−1. Panels (c) and (d) show the NO2 signals of PAN and MeN when the wall loss rate coefficient of RO2 is 5 s−1.
4.1 Measurement interference
Previous studies have shown that the filter losses and wall losses of NO2, PNs, and ANs are small when using Teflon tubes and Teflon filters (Paul et al., 2009; Thieser et al., 2016). As shown in Fig. S4, the response to concentration changes of PAN was nearly instantaneous under normal sampling, suggesting that the memory effects on the inlet and cavity tubing were insignificant. As shown in Figs. S5 and S6, the filter loss and sampling tube are negligible. The transmission efficiency for PAN is >97 % if there is a fresh filter membrane in the holder. We propose that changing the filter once a day can ensure a high transmission efficiency of the species to be detected. However, isoprene nitrates are prone to hydrolysis (Vasquez et al., 2020), which is more likely to be lost during sampling. We have no evaluation of the sampling loss of isoprene nitrates, and the wall loss of isoprene nitrates is likely to be reduced by increasing the frequency of filter changes. In the heated channels, organic nitrates will be thermally dissociated to produce NO2, but some simultaneous reactions will affect the NO2 mixing ratio. The potential interferences mainly come from the following reactions: formation of NO2 via NO and O3, pyrolysis of O3, reactions of organic radicals with NO and NO2, and pyrolysis of other reactive nitrogen oxides.
The formation of NO2 in a dark reaction between NO and O3 should be considered in NO2 measurements. If the reaction has continued for a certain time (t) during sampling, the amount of NO2 formed [NO2]t can be calculated: [NO2][NO] × [O3] × t, where k is the rate coefficient for Reaction (R4) and is given as cm3 molecule−1 s−1 (Atkinson et al., 2004). According to the temperature distribution and airflow temperature measurements changing with the distance after the heating quartz tube, the heated channel temperature profiles under normal sampling are shown in Fig. S7. Based on the temperature profile, the reaction of NO and O3 in the three channels can be calculated. As the residence time of airflow in the three channels is short and similar (0.806 s in the reference channel, 0.697 s in the AN channel, and 0.730 s in the PN channel), the simulation results show that the inference is small. For example, during an ozone pollution day with O3=100 ppbv, NO = 2 ppbv, and NO2=5 ppbv, the NO2 produced by the reaction of NO and O3 in the reference channel is 0.07 ppbv, corresponding to 1.3 % of atmospheric NO2. Similarly, the interferences in the AN channel and PN channel are 0.14 ppbv (2.7 % of NO2) and 0.10 ppbv (2.0 % of NO2), respectively. The interferences are within 3 % in the typical case, which is smaller than the uncertainty of the NO2 measurement. Therefore, the interference is ignored in the measurement correction.
Table 1Measurements of the NO2 mixing ratio in three channels of the TD-CEAS with different added amounts of NO2 and O3.
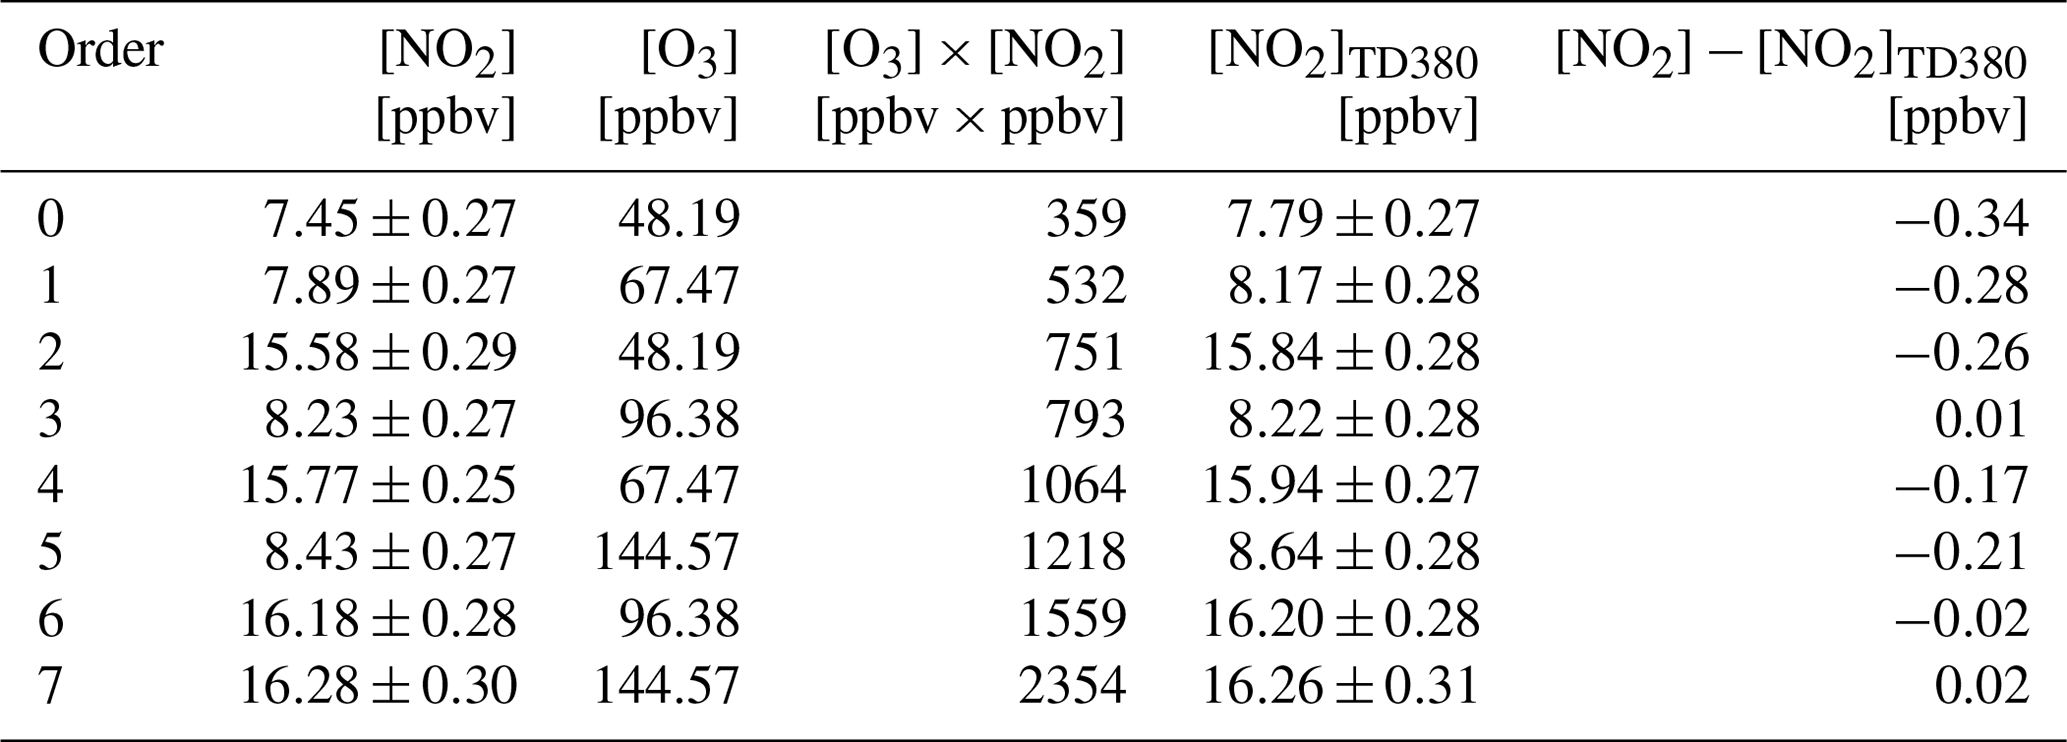
The thermal degradation of O3 occurs at high temperatures, which reduces NO2 to NO via O(3P) (Reactions R5–R7). Interference has been ignored before in the process of PN and AN pyrolysis (Day et al., 2002). However, subsequent studies have shown that the reaction can cause significant negative deviations in the measurements of NO2 at higher temperatures, and the degree of interference is closely related to the temperature change of the pyrolytic module (Lee et al., 2014; Thieser et al., 2016). To determine the reduction reaction effect, we performed experiments in which NO2 was detected in three different channels when various amounts of NO2 and O3 were added. The experimental results are shown in Table 1 with various amounts of NO2 and O3 added. No significant NO2 mixing ratio difference was observed between the reference and AN channels. We showed negligible interference here, which is different from previous reports (Lee et al., 2014; Thieser et al., 2016). This is likely caused by the much lower temperature setting of our AN measurement channel. Since the pyrolytic rate constant of O3 is highly temperature-dependent, the lower temperature would largely reduce the level of O atoms as well as this interference.
The RO2 recombines with NO2 or reacts with NO to interfere with the measurement of ANs and PNs. Taking PAN as an example, organic radicals may trigger interference, as described below (Reactions R8–R15). The PAs produced after thermal dissociation of PAN (Reaction R8) can recombine with NO2 (Reaction R9). PAs can oxidize NO to produce NO2 while generating another organic radical (Reaction R10). CH3O2 can further initiate a series of reactions that affect the distribution of NO2 (Reactions R11–R15). Therefore, the lifetime and fate of PAs generated by PAN pyrolysis will cause interference, and atmospheric NO and NO2 will affect the degree of measurement interference.
A set of laboratory experiments was conducted to measure the interference in PN channels with different NO, NO2, and PAN levels. Figure 9a shows the measured and simulated results of different PAN concentrations mixed with different concentrations of NO. With the increase in NO added, the detected PN mixing ratio (the signal difference between the PN channel and REF channel) also gradually increased. More NO reacted with PA radicals generated during thermal dissociation to produce additional NO2 within the residence time in the PN channel, which led to measurements higher than the PAN source level. In contrast, as shown in Fig. 9b, the measured PNs were lower than the PAN source level when NO2 was added to the source, and the bias increased with the increase in NO2 added. The addition of NO2 to the system improves the overall concentration of NO2 in the PN channel, promoting regeneration to PAN.

Figure 9Simulated (lines) and measured (points) differences between the NO2 signal in the PN channel and reference channel for different PAN samples with different added amounts of NO (a) and NO2 (b). The error bars show 1 standard deviation.
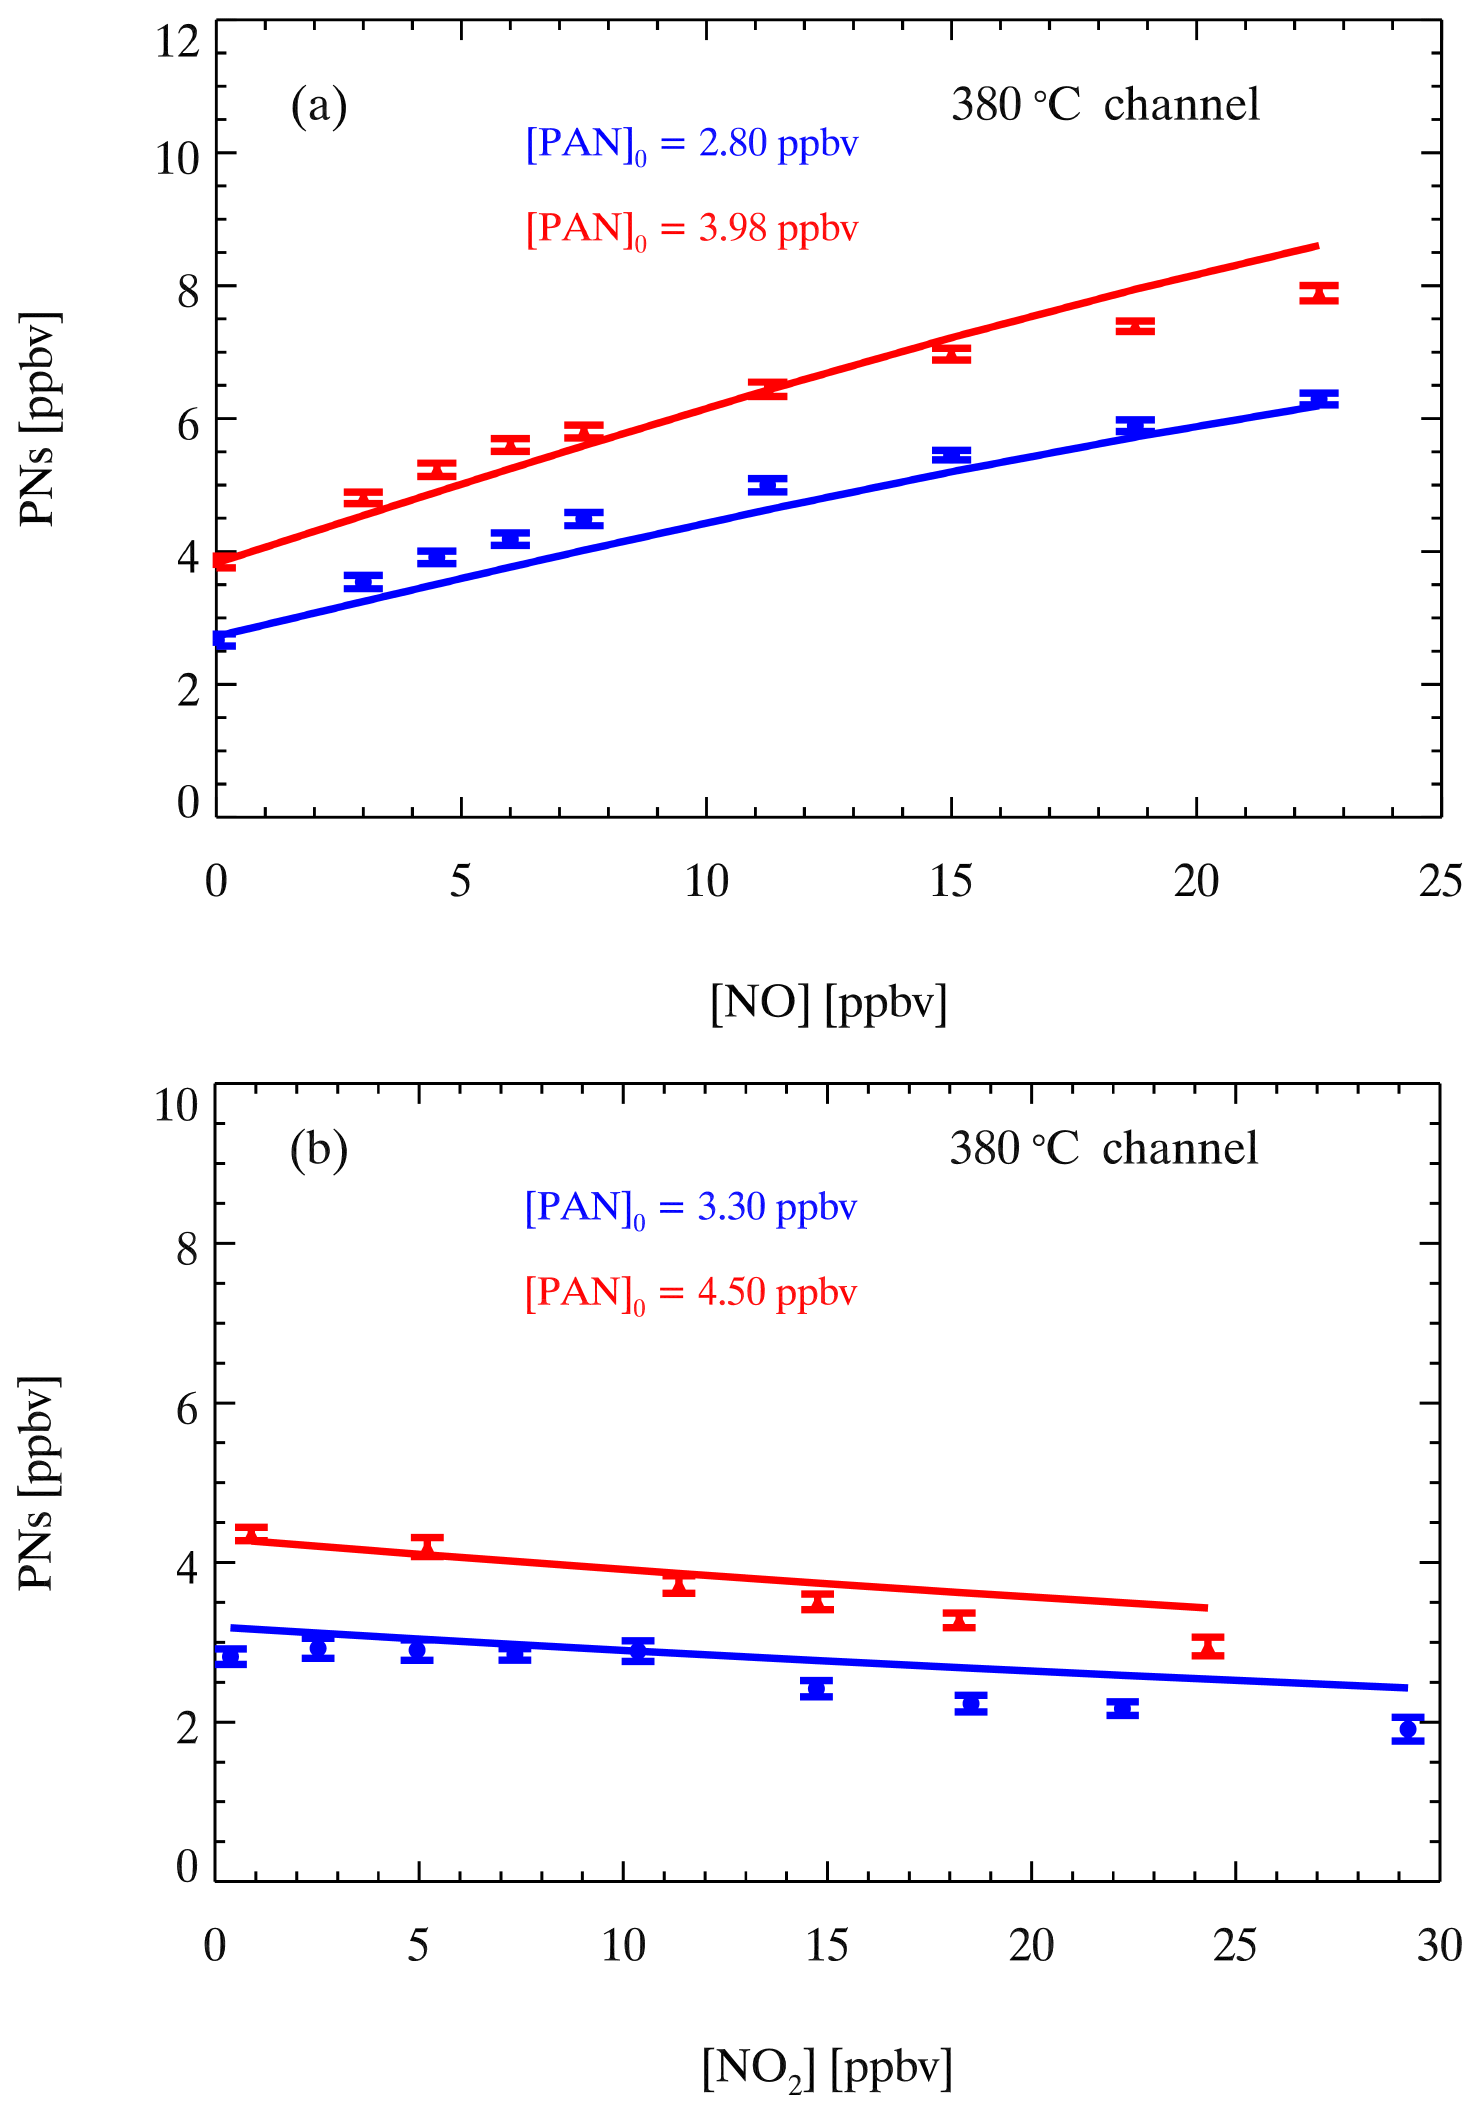
Figure 10Simulated (lines) and measured (points) differences between the NO2 signal in the AN channel and reference channel for different PAN sources with different amounts of NO (a) and NO2 (b). The error bars show 1 standard deviation.
We conducted numerical simulations by a box model to mimic observations and to check the chemical reactions in the PN channel. Figure 9a shows that the simulations have good consistency with the experimental results under different NO levels. Figure 9b shows that the model can capture the trend of experimental results on NO2 interferences, except in the case of a PAN source of 4.5 ppbv, which may be due to the reaction of small excess RO2 in the PAN source line and extra NO2 added to the instrument to generate additional PAN before sampling. Overall, these experiments proved that NO and NO2 interfere with the measurement of PNs. However, the agreement of the experimental and model results indicates that the interference of NO and NO2 for PN measurements can be corrected. In the field measurements, the correction factor refers to the ratio between the real value and the measured value of PNs. For example, in a typical case during field measurements where PNs = 3 ppbv, NO = 8 ppbv, and NO2 = 5 ppbv, the difference between the PN channel and reference channel is equal to 4.54 ppbv (equivalent to the measured PNs), which requires a correction factor of 0.66. Here, nearly 40 000 simulations are performed under various initial concentrations of NO (0–70 ppbv), NO2 (0–60 ppbv), and PAN (0–10 ppbv) to obtain the correction factor lookup table for our first field measurement (detailed in Sect. 4.3). The correction factor (C1) for PN measurements in the PN channel can be determined from the lookup table according to atmospheric NO and NO2 and the raw data of PN measurements using linear interpolation. According to Eq. (9), the corrected PN mixing ratios are derived by the raw PN measurements ([NO2_180]) and C1.
In the AN channel, the thermal dissociation of PA radicals is rapid, and the regeneration of PAN is also suppressed at higher temperatures. Therefore, there is a different relationship between PANs and ambient NOx in the AN channel. Similar to PNs, the measurement of ANs could be affected by NOx. We derived the PNs corrected by C1 and [NO2_180] as mentioned above. To determine the corrected concentrations of ANs as Eqs. (10)–(11) show, we need to apply another correction factor (C2) to determine the contribution of PNs to ONs, in which this is subtracted from the raw ON measurement ([NO2_380]), and finally the third correction factor (C3) is applied to obtain corrected AN measurements. Figure 10 displays the interference of NO and NO2 with the PAN measurements in the AN channel. The laboratory experiments showed that the measured signal difference increased with NO (Fig. 10a). Hence, the presence of NO still led to higher measurement results of ONs compared with the source value. However, the interference was weakened compared with the measured results in the PN channel at the same NO and PAN source levels (Fig. 9a). Similarly, the experiments with added NO2 showed underestimated measurements of ONs, and the interference was significantly weakened compared with that in the PN channel. We used the same box model except for updating the temperature distribution and the corresponding residence time in the AN channel to simulate the interference of NO or NO2 under different PAN source levels. However, there are still some uncertainties about the reaction mechanism and reaction rate for the thermal dissociation of PAN at these high temperatures. We performed sensitivity tests on the follow-up reactions of PAs, similar to the simulation results of Thieser et al. (2016), and found that the isomerization of PAs to CH2C(O)OOH has a great effect on the consistency of the experiments and simulation results. If the reaction rate of the branching reaction is set to zero, as shown in Fig. 10, the simulation results capture the trend well when NO2 or NO is added. Many factors affect the NO2 signal produced by the thermal dissociation of PAN; therefore, the mechanism scheme mentioned above provides a reasonable assumption for the interference process. Overall, the box model predicts the interference of PAN measurement caused by NO and NO2 in the AN channel. Next, the correction factors (C2) of different cases under various amounts of NO, NO2, and PAN added in the AN channel are simulated to form the second lookup table.
The raw ON mixing ratio ([NO2_380]) is determined by the difference between the AN channel and reference channel based on the SPEC method. According to Eq. (10), it is necessary to quantify the interference caused by ambient NO/NO2 for AN measurements. Due to the lack of AN sources, we use box models to study the interferences by setting MeN as the representative ANs. Methyl nitrate is pyrolyzed to produce NO2 and CH3O in the AN channel (Reaction R16), and CH3O is an important intermediate product of the reactions of PAs (Reactions R10–R12). Therefore, the mechanism scheme regarding PAN applies to interference simulations of NOx for AN measurements. Similarly, the different cases under various NO, NO2, and MeN additions were simulated to form the third lookup table for the corrections of AN measurements in the AN channel. According to Eq. (10), the raw concentration of ANs is the difference between the raw ON measurements ([NO2_380]) and the signal contribution of PNs ( in the AN channel. The correction factor (C3) is determined by the third lookup table and then multiplied by [ANs] to obtain the corrected AN mixing ratio ([ANs_C]) by Eq. (11).
In addition to the interference mentioned above, other nitrogen compounds may undergo pyrolysis to generate NO2 in the heated channels, such as N2O5 and ClNO2 (Li et al., 2018; Thaler et al., 2011; H. Wang et al., 2017; Womack et al., 2017), which may be a source of uncertainty for measurements of organic nitrates at night and early morning. Interferences can be extracted if the simultaneous measurements of N2O5 and ClNO2 are available.
4.2 Uncertainty and detection limit
The uncertainty of the CEAS measurement of NO2 is contributed by the absorption cross section, mirror reflectivity, effective cavity length, and spectral fitting. The absorption cross section of NO2 is taken from Voigt et al. (2002), whose uncertainty is approximately 4 % (Voigt et al., 2002); the uncertainty of mirror reflectivity is approximately 5 %, determined by the error of the scattering cross section of N2; the uncertainty of effective cavity length is approximately 4.5 %; and the uncertainty of spectral fitting when omitting the cross section of glyoxal is 4 %. According to Gaussian error propagation, the associated uncertainty of the ambient NO2 measurement is ±9 % based on the above parameters. The precision of the CEAS can be assessed by the Allan deviation and standard deviation (Duan et al., 2018; Langridge et al., 2008; H. Wang et al., 2017). Figure 11 shows the variance analysis of 21077 continuously measured N2 spectra when the cavity was filled with N2 under purge. The integration time was 3 s, and the sampling time was 6 s, as every two spectra were averaged before saving. The first 100 N2 spectra collected were averaged as I0, and all spectra were analyzed based on I0. The dataset was divided into 300 gradients for Gaussian fitting, and 1σ was 97 pptv, as shown in Fig. 11a. The 21 077 N2 spectra mentioned above were averaged at different time intervals (from 6 to 11 400 s), and then the Allan deviations at different time intervals were calculated. As shown in Fig. 11b, the Allan deviation decreases as the sampling time increases when the sampling time is smaller than 1300 s, and the minimum is 5 pptv. When the sampling time is 6 s, the Allan variance can reach 90 pptv, close to 1σ. ANs and PNs are detected by the same CEAS system and calculated by the dynamic I0 (SPEC) method; therefore, their precision is identical to the NO2 measurement. The uncertainty of [ANs] and [PNs] mainly comes from spectral fitting to derive the concentration of NO2 and the interference correction in heated channels, which should be larger than 9 %.
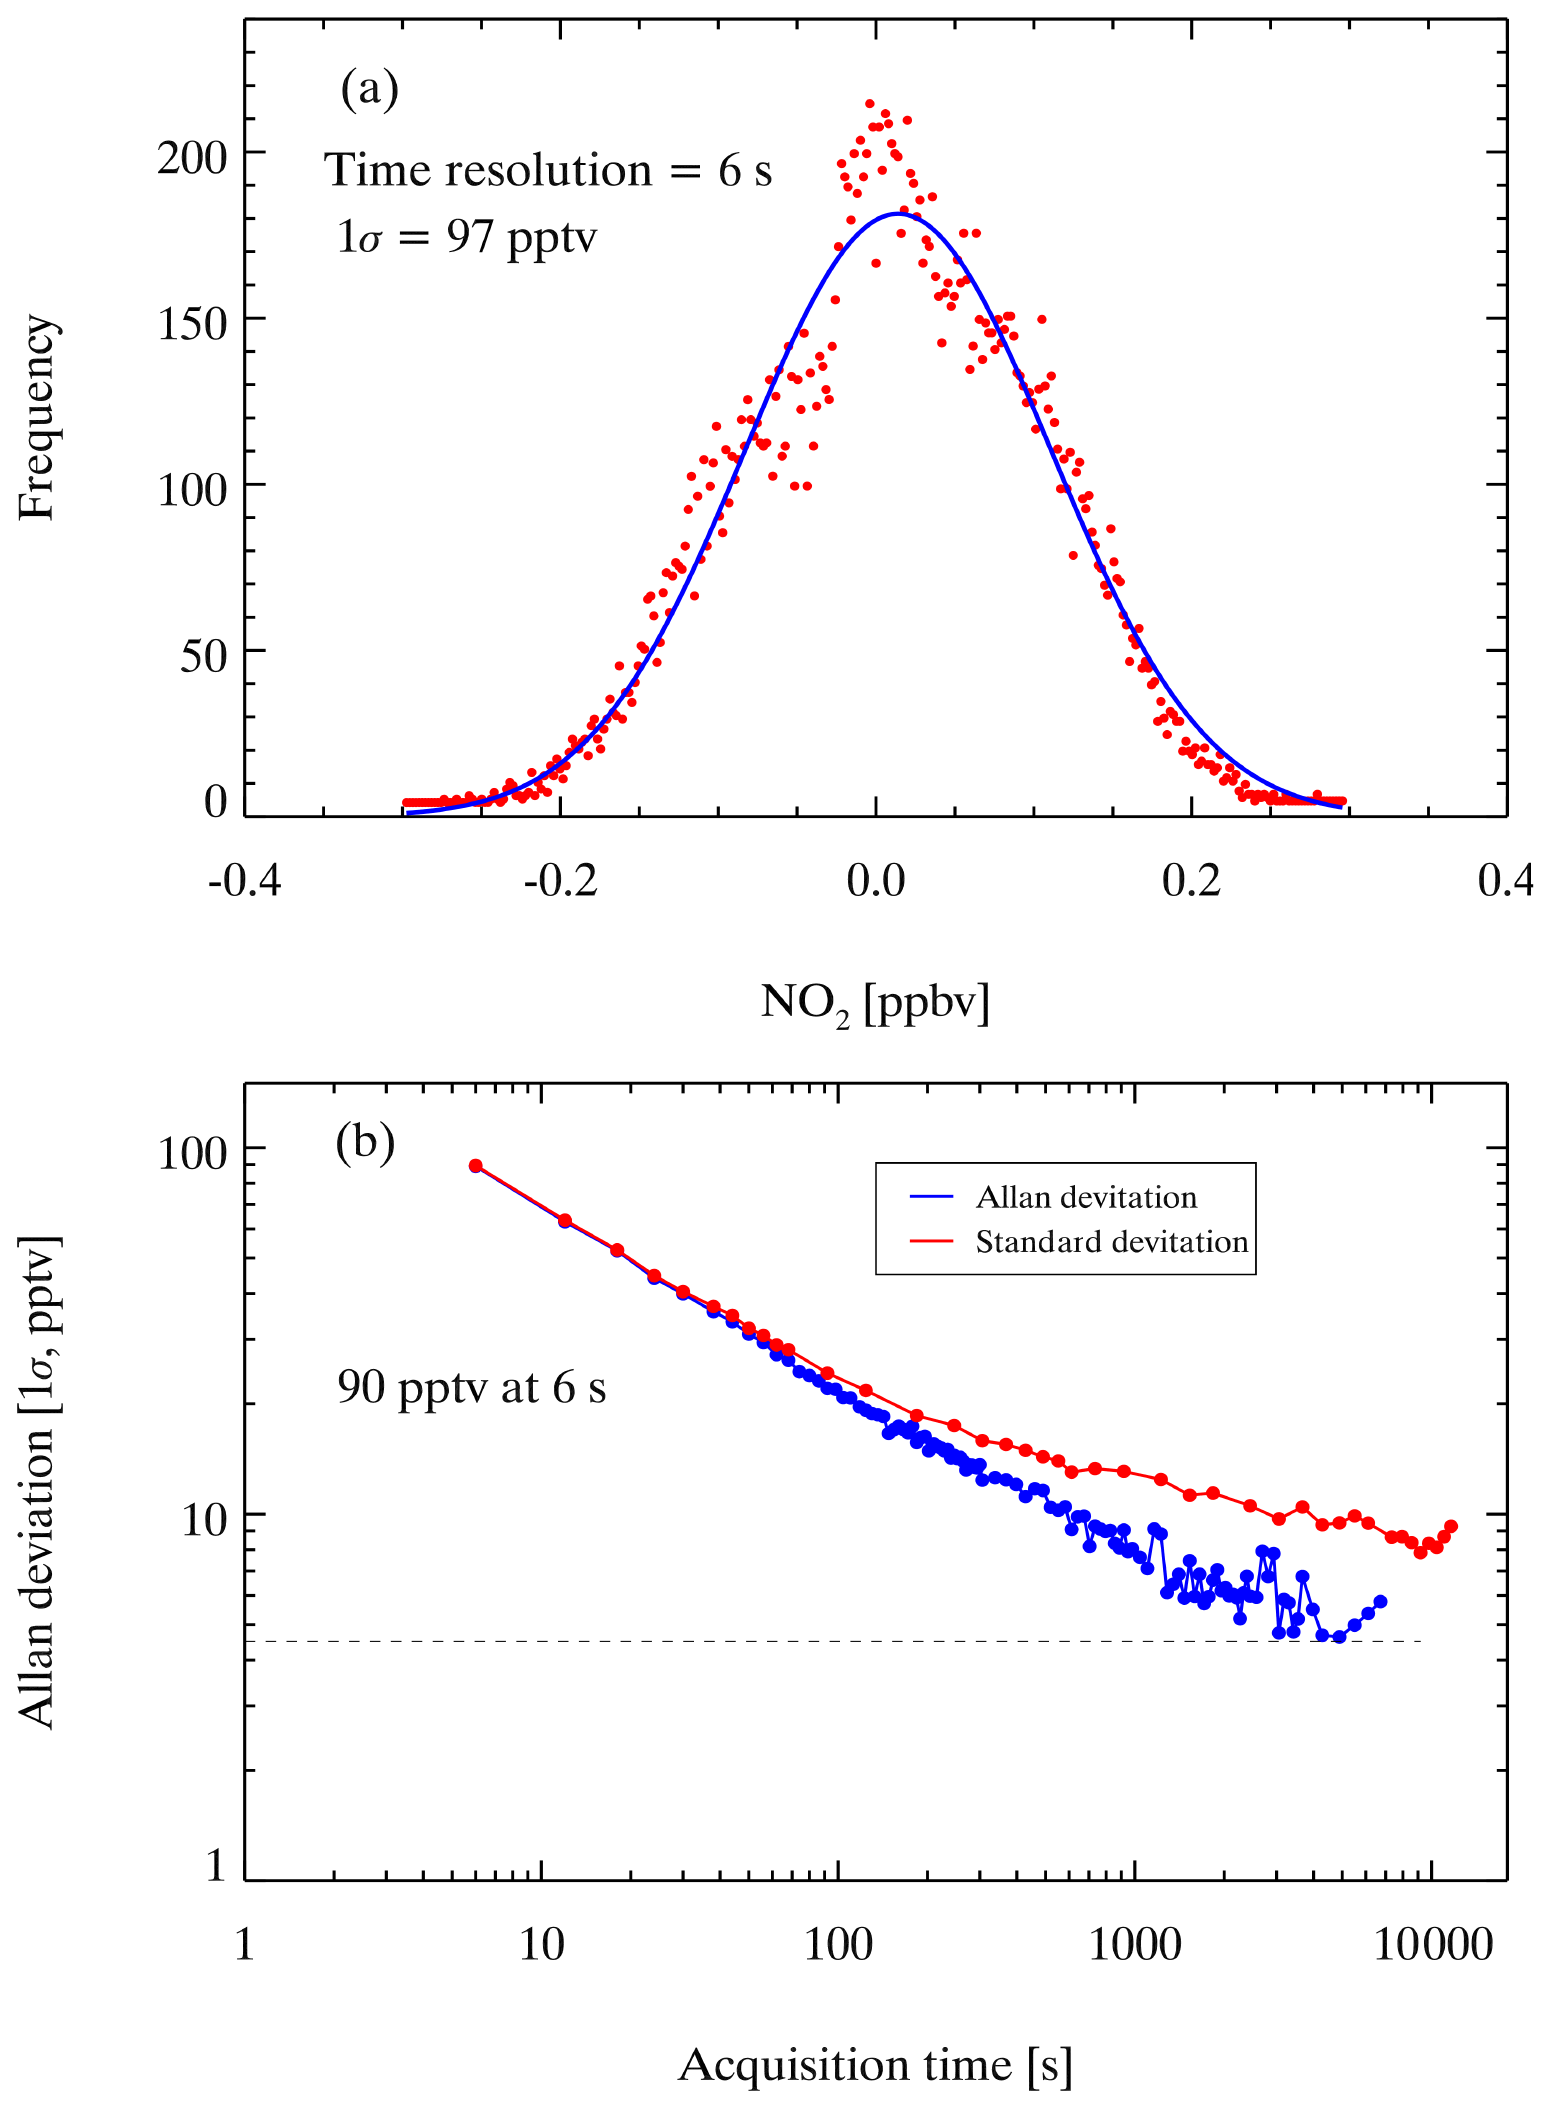
Figure 11Instrument performance with different integration times. (a) The standard deviation of the measurements of NO2 with a 6 s integration time. (b) Allan deviation plots for measurements of NO2 with a 6 s integration time.
As summarized in Table 2, there are several typical technologies to measure organic nitrates based on the thermal dissociation method. TD-LIF is the pioneer to determine organic nitrates by measuring NO2 produced through pyrolysis (Day et al., 2002), and the technology has been developed well and deployed in considerable campaigns (Di Carlo et al., 2013; Farmer et al., 2006). TD-LIF has a high time resolution and low detection limit, but the determination of NO2 has to rely on extra calibration. TD-CIMS has a similar limitation to TD-LIF, and the method can measure some individual species of PNs, which need corresponding standards to be calibrated one by one (Slusher et al., 2004). CRDS, CAPS, and CEAS are all cavity-enhanced techniques with high sensitivity and time resolution, of which CRDS and CAPS have been applied to detect NO2 after ON pyrolysis. Specifically, in this study, the ONs and PNs are determined directly through broadband absorption measurement by CEAS, which can avoid the uncertainty caused by multiple spectral fitting and subsequent differential calculations. Overall, TD-CEAS has a detection capacity similar to that of TD-LIF and others. Recently, thermal dissociation peroxy radical chemical amplification (TD-PERCA)-CRDS was developed to indirectly determine PNs by measuring NO2 through chemical amplification, which also showed high sensitivity, but the technology for atmospheric measurements needs to be studied further.
Table 2Typical thermal dissociation methods to measure organic nitrates.


Figure 12Time series of the observed mixing ratios of PNs, ANs, and NO2 during ozone pollution from the CHOOSE campaign in 2019. The yellow regions indicate the daytime period. (a) The black lines represent the raw measurements of PNs, and the red lines are the corrected measurements of PNs according to the lookup table. (b) The blue lines represent the raw measurements of ANs, and the orange lines are the corrected measurements of ANs according to the lookup tables. (c) Measurements of NO2 in the reference channel.
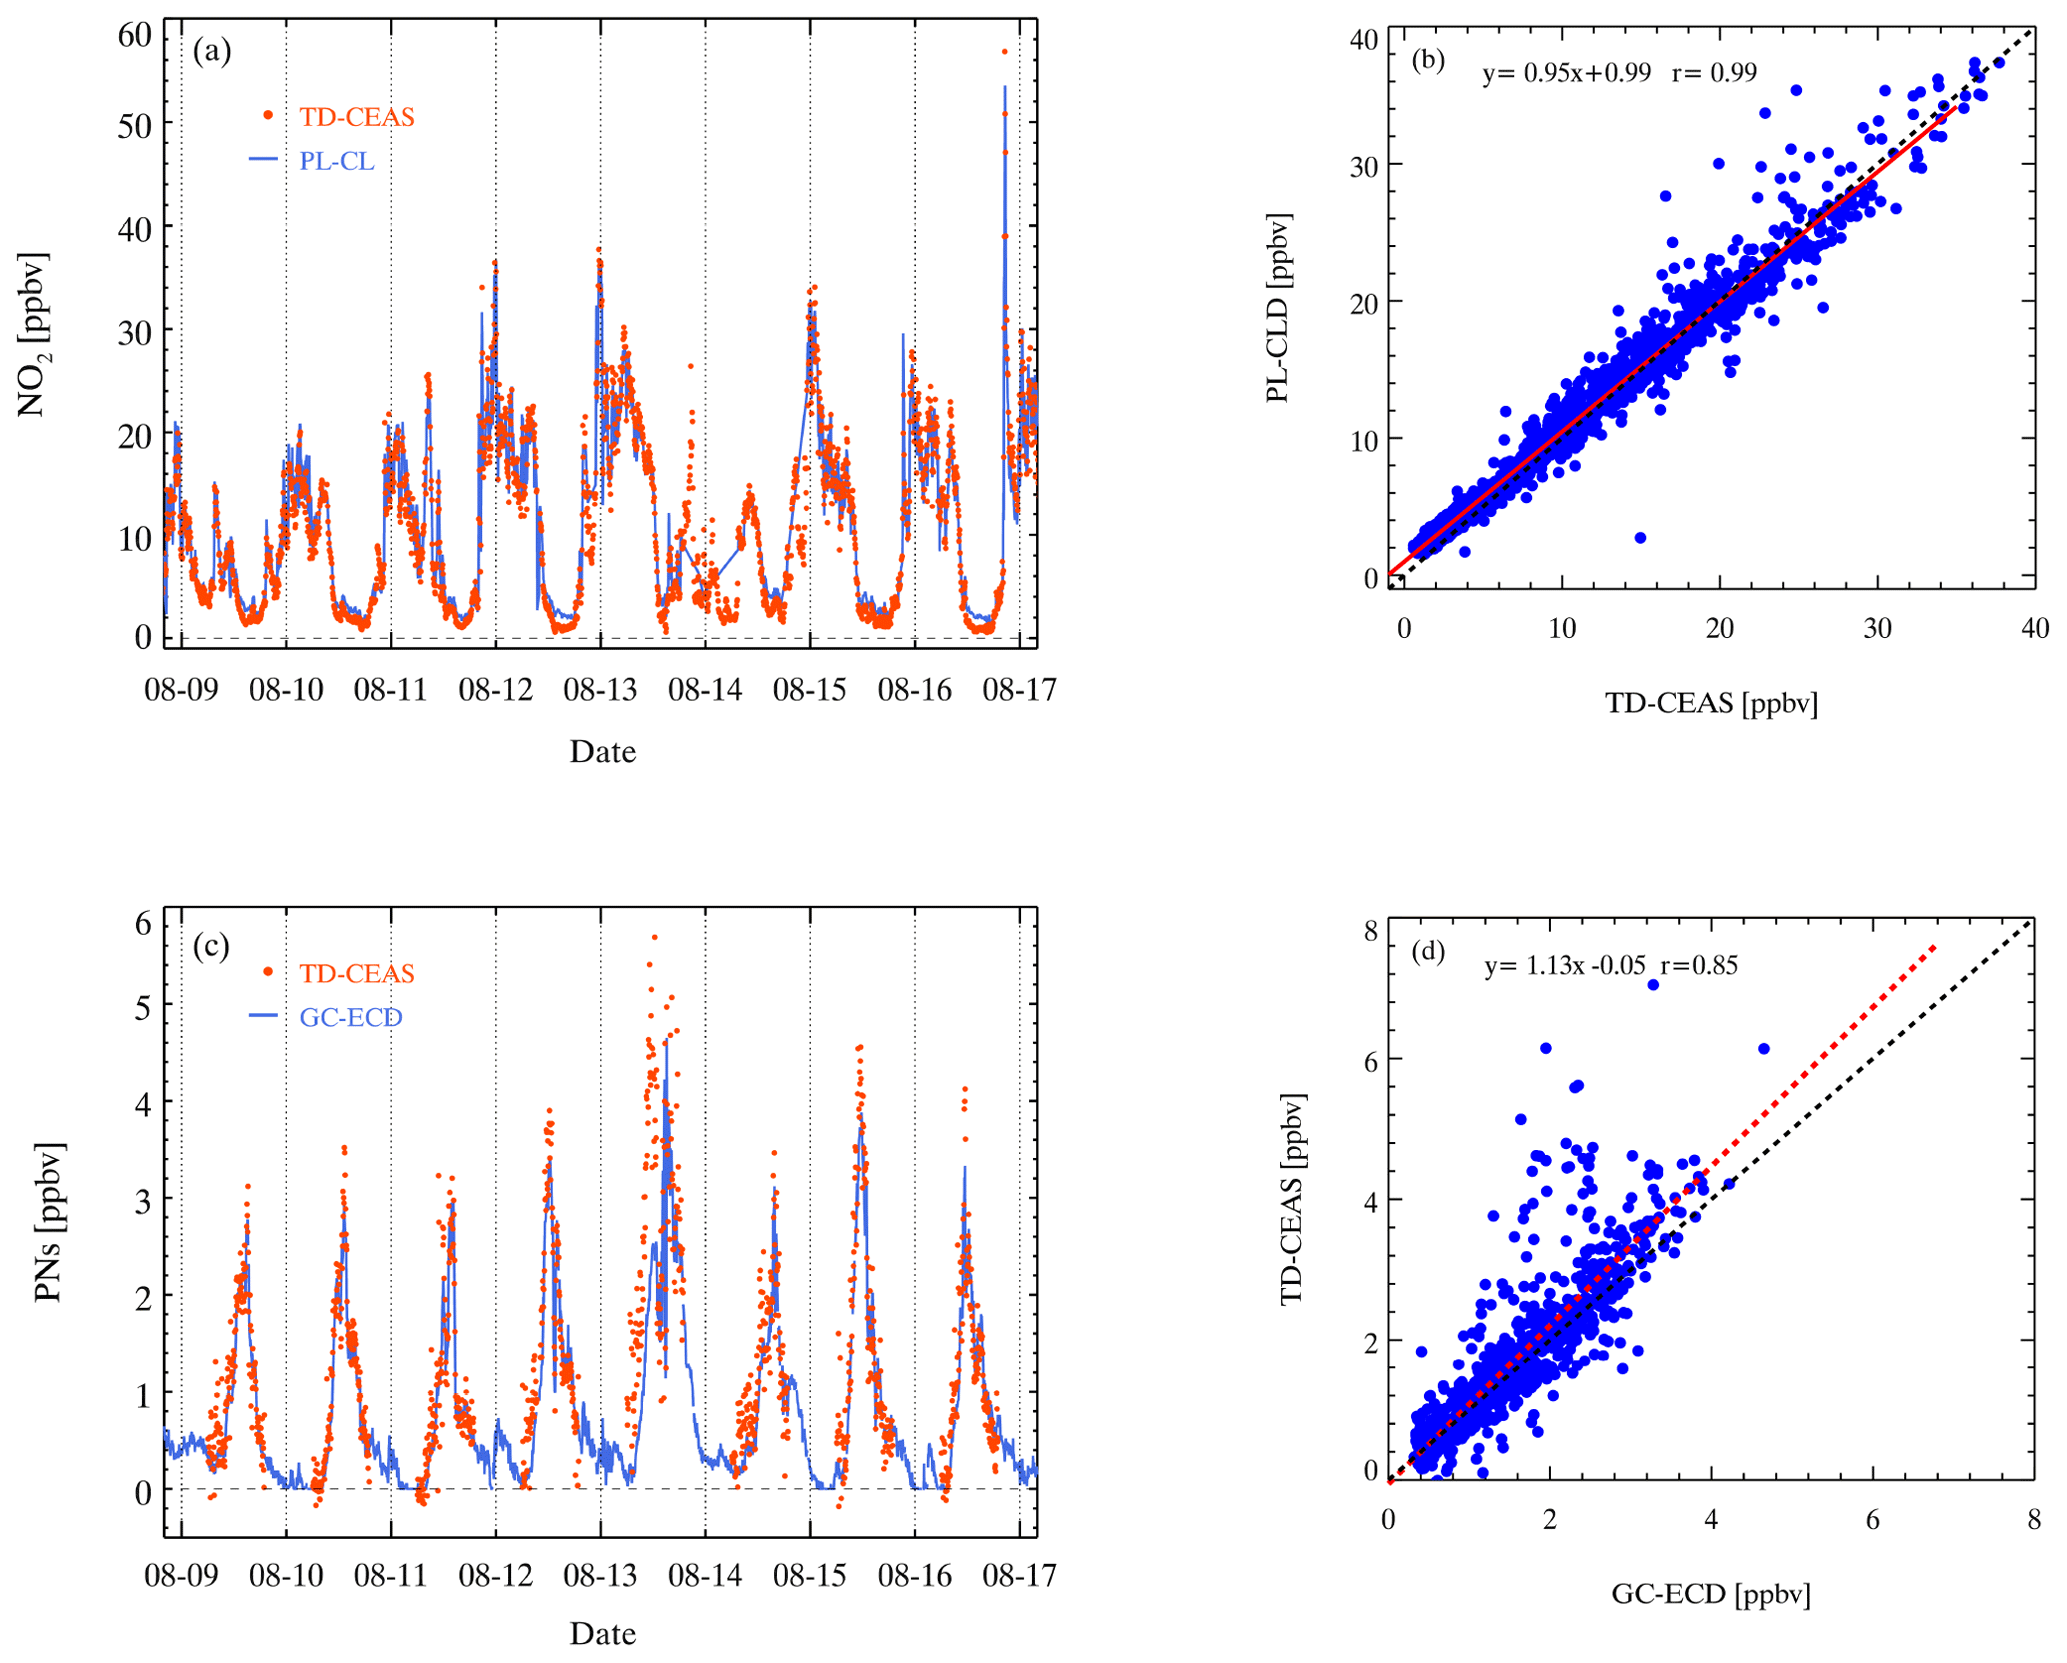
Figure 13Comparison of the TD-CEAS and PL-CLD in the CHOOSE campaign. Panel (a) shows the time series of NO2 measurements. Orange points represent the results from the TD-CEAS, and the blue line represents the results from the PL-CLD. Panel (b) shows the NO2 correlation between the two instruments. Comparison of the PNs measured by the TD-CEAS and the PAN measured by the GC-ECD. Panel (c) shows the time series of PNs and PAN, orange points represent the results from the TD-CEAS, and blue line represents the results from the GC-ECD. Panel (d) shows the PN correlation of the two instruments.
4.3 Performance in field observations
TD-CEAS deployed the first field observations in Xinjin County, Chengdu, China, in 2019, referred to as the CHOOSE campaign (Yang et al., 2020). As shown in Fig. S8, there is a residential area 5 km northwest of the site; the surrounding area is lush with trees and is close to a forest park and a national wetland park; and there is an industrial park approximately 12 km to the west and 8 km to the south. During the CHOOSE campaign, TD-CEAS was deployed in a container. The sampling inlet protruded from the container top and was supported by a bracket with a height of 4 m above the ground. We determined the raw data of PNs and ONs during the observation period, and then the raw data were corrected as mentioned above. Figure 12a shows the time series of raw data and the corrected data of PNs from 9 to 18 August during the CHOOSE campaign, and Fig. 12b shows the time series of AN measurements before and after correction. The correction factors are shown in Fig. S9. The value of C1 was generally greater than 1.0 (except during the morning), suggesting that the role of NO2 was more significant than that of NO at this site. The tendency of C2 and C3 was consistent with C1 during measurements, but the daily changes of C2 and C3 were relatively smaller as the sensitivity of interferences in the AN channel decreased, as mentioned above. Figure 12c shows that NO2 constantly increased at night, reaching a peak near the early morning and maintaining a high value to approximately 11:00 (UTC+8) local time. High mixing ratios of PNs were observed during the measurement, and the diurnal variation of PNs was clear. The peak of ANs appeared in the noontime and several hours before that of PNs. However, when the ambient NO2 changed drastically at night during the campaign, the difference in NO2 between adjacent measurement phases in a cycle was great, resulting in unfeasible measurements (Fig. S10). Simultaneous measurements showed that the N2O5 mixing ratio during nighttime was low and zero during the daytime. Therefore, the interferences of N2O5 were negligible for the ON measurements during the daytime during the CHOOSE campaign. Nevertheless, the observed ANs may have been subject to the interference from ClNO2.
A photolytic conversion chemiluminescence detector (PC-CLD) was used to measure NO and NO2 during the campaign. The time series of NO2 measured by the TD-CEAS and PL-CLD with a 5 min average is shown in Fig. 13a, which were from 9 to 16 August. The trend of NO2 measured by the two instruments agrees well, but the results of the PL-CLD are higher when the mixing ratio of NO2 was low at noon. Figure 13b shows that the correlation coefficient of the NO2 concentration measured by the two instruments is 0.99. The results of the TD-CEAS are slightly higher than the results of the PL-CLD, as the slope is 0.95, which is reasonable when considering instrument uncertainties. The time series of PNs (TD-CEAS) and PAN (GC-ECD) is shown in Fig. 13c, and the trends are relatively consistent, but the results of PNs are higher than the results of PANs measured by the GC-ECD, especially at noon. This result is reasonable since PAN concentration is the highest but is not equal to the total concentration of PNs. The correlation between the two instruments is good, as the correction coefficient is up to 0.85 (Fig. 13d), suggesting our instrument's feasibility in PN measurement.
We developed a new and robust TD-CEAS instrument to measure PNs, ANs, and NO2 in the atmosphere with high accuracy and sensitivity. The advantage of this equipment is that only one detector is used for measuring NO2 at 435–455 nm, which reduces the potential for cross interference caused by multiple detectors and has a lower cost and simpler operation. One measurement cycle of the instrument is 3 min, with an LOD of 97 pptv (1σ) at 6 s. The short cycle period meets the atmospheric lifetime requirements of organic nitrates and NO2 in general. The measurement interferences are characterized under different NO, NO2, and organic nitrates (PAN or MeN) by laboratory experiments and model simulations. A lookup table method was established to correct the PN and AN concentrations.
The instrument was first deployed for field measurements in Chengdu, China, and the PNs measured by the TD-CEAS showed good consistency with PAN measured by a GC-ECD during the daytime. However, when the ambient NO2 in the sampled air masses changes drastically, there will be great errors for the measurement of ANs and PNs, as the NO2 mixing ratio between adjacent measurement phases in a cycle will be definitely different. Adding another NO2 CEAS in parallel in the instrument for continuous NO2 measurement will avoid this limitation. In addition, the observed PNs and ANs may be subject to interference from other reactive nitrogen species, such as N2O5 and ClNO2, which can be corrected with simultaneous measurements in the future. Overall, this instrument is suitable for measuring NO2, PNs, and ANs in chamber studies or ambient measurements with relatively stable air masses free of intensive NOx emissions. We highlight the impact of interference reactions in heated channels for accurately measuring PNs and ANs. Although the lookup table can correct the interferences, the best way to reduce them is to quench RO2 during the sampling process by improving the instrument design, such as by increasing the wall loss of RO2 in the heated channel.
The datasets used in this study are available from the corresponding author Keding Lu upon request (k.lu@pku.edu.cn).
The supplement related to this article is available online at: https://doi.org/10.5194/amt-14-4033-2021-supplement.
KL and HW designed the study. CL and HW set up and characterized the instrument, analyzed the data, and wrote the paper with input from KL. All authors contributed to the field measurements and discussed and improved the paper.
The authors declare that they have no conflict of interest.
The authors thank the CHOOSE team for establishing and maintaining the Xinjin site and the synchronized data used in the article.
This project is supported by the Beijing Municipal Natural Science Foundation for Distinguished Young Scholars (grant no. JQ19031), the special fund of the State Key Joint Laboratory of Environment Simulation and Pollution Control (grant no. 21K02ESPCP), the National Natural Science Foundation of China (grant no. 21976006), and the National Research Program for Key Issue in Air Pollution Control (grant no. DQGG0103-01).
This paper was edited by Bin Yuan and reviewed by three anonymous referees.
Arey, J., Aschmann, S. M., Kwok, E. S. C., and Atkinson, R.: Alkyl nitrate, hydroxyalkyl nitrate, and hydroxycarbonyl formation from the NOx-air photooxidations of C5C8 n-alkanes, J. Phys. Chem. A, 105, 1020–1027, 2001.
Atkinson, R., Baulch, D. L., Cox, R. A., Crowley, J. N., Hampson, R. F., Hynes, R. G., Jenkin, M. E., Rossi, M. J., and Troe, J.: Evaluated kinetic and photochemical data for atmospheric chemistry: Volume I – gas phase reactions of Ox, HOx, NOx and SOx species, Atmos. Chem. Phys., 4, 1461–1738, https://doi.org/10.5194/acp-4-1461-2004, 2004.
Atlas, E.: Evidence for greater-than-or-equal-to-C3 alkyl nitrates in rural and remote atmospheres, Nature, 331, 426–428, 1988.
Atlas, E., Pollock, W., Greenberg, J., Heidt, L., and Thompson, A. M.: Alkyl nitrates, nonmethane hydrocarbons, and halocarbon gases over the equatorial pacific-ocean during SAGA-3, J. Geophys. Res.-Atmos., 98, 16933–16947, 1993.
Ball, S. M., Langridge, J. M., and Jones, R. L.: Broadband cavity enhanced absorption spectroscopy using light emitting diodes, Chem. Phys. Lett., 398, 68–74, 2004.
Barbero, A., Blouzon, C., Savarino, J., Caillon, N., Dommergue, A., and Grilli, R.: A compact incoherent broadband cavity-enhanced absorption spectrometer for trace detection of nitrogen oxides, iodine oxide and glyoxal at levels below parts per billion for field applications, Atmos. Meas. Tech., 13, 4317–4331, https://doi.org/10.5194/amt-13-4317-2020, 2020.
Berkemeier, T., Ammann, M., Mentel, T. F., Poschl, U., and Shiraiwa, M.: Organic Nitrate Contribution to New Particle Formation and Growth in Secondary Organic Aerosols from alpha-Pinene Ozonolysis, Environ. Sci. Technol., 50, 6334–6342, 2016.
Blanchard, P., Shepson, P. B., Schiff, H. I., and Drummond, J. W.: Development of a gas chromatograph for trace level measurement of peroxyacetyl nitrate using chemical amplification, Anal. Chem., 65, 2472–2477, 1993.
Chen, J. and Venables, D. S.: A broadband optical cavity spectrometer for measuring weak near-ultraviolet absorption spectra of gases, Atmos. Meas. Tech., 4, 425–436, https://doi.org/10.5194/amt-4-425-2011, 2011.
Chen, J., Wu, H., Liu, A. W., Hu, S. M., and Zhang, J.: Field Measurement of NO2 and RNO2 by Two-Channel Thermal Dissociation Cavity Ring Down Spectrometer, Chinese J. Chem. Phys., 30, 493–498, 2017.
Chen, X., Wang, H., and Lu, K.: Simulation of organic nitrates in Pearl River Delta in 2006 and the chemical impact on ozone production, Sci. China-Earth Sci., 61, 228–238, 2018.
Chuck, A. L., Turner, S. M., and Liss, P. S.: Direct evidence for a marine source of C1 and C2 alkyl nitrates, Science, 297, 1151–1154, 2002.
Day, D. A., Wooldridge, P. J., Dillon, M. B., Thornton, J. A., and Cohen, R. C.: A thermal dissociation laser-induced fluorescence instrument for in situ detection of NO2, peroxy nitrates, alkyl nitrates, and HNO3, J. Geophys. Res.-Atmos., 107, ACH 4-1–ACH 4-14, https://doi.org/10.1029/2001jd000779, 2002.
Di Carlo, P., Aruffo, E., Busilacchio, M., Giammaria, F., Dari-Salisburgo, C., Biancofiore, F., Visconti, G., Lee, J., Moller, S., Reeves, C. E., Bauguitte, S., Forster, G., Jones, R. L., and Ouyang, B.: Aircraft based four-channel thermal dissociation laser induced fluorescence instrument for simultaneous measurements of NO2, total peroxy nitrate, total alkyl nitrate, and HNO3, Atmos. Meas. Tech., 6, 971–980, https://doi.org/10.5194/amt-6-971-2013, 2013.
Duan, J., Qin, M., Ouyang, B., Fang, W., Li, X., Lu, K., Tang, K., Liang, S., Meng, F., Hu, Z., Xie, P., Liu, W., and Häsler, R.: Development of an incoherent broadband cavity-enhanced absorption spectrometer for in situ measurements of HONO and NO2, Atmos. Meas. Tech., 11, 4531–4543, https://doi.org/10.5194/amt-11-4531-2018, 2018.
Farmer, D. K., Wooldridge, P. J., and Cohen, R. C.: Application of thermal-dissociation laser induced fluorescence (TD-LIF) to measurement of HNO3, Σalkyl nitrates, Σperoxy nitrates, and NO2 fluxes using eddy covariance, Atmos. Chem. Phys., 6, 3471–3486, https://doi.org/10.5194/acp-6-3471-2006, 2006.
Fiedler, S. E., Hese, A., and Ruth, A. A.: Incoherent broad-band cavity-enhanced absorption spectroscopy, Chem. Phys. Lett., 371, 284–294, 2003.
Fischer, R. G., Kastler, J., and Ballschmiter, K.: Levels and pattern of alkyl nitrates, multifunctional alkyl nitrates, and halocarbons in the air over the Atlantic Ocean, J. Geophys. Res.-Atmos., 105, 14473–14494, 2000.
Flocke, F. M., Weinheimer, A. J., Swanson, A. L., Roberts, J. M., Schmitt, R., and Shertz, S.: On the measurement of PANs by gas chromatography and electron capture detection, J. Atmos. Chem., 52, 19–43, 2005.
Friedrich, N., Tadic, I., Schuladen, J., Brooks, J., Darbyshire, E., Drewnick, F., Fischer, H., Lelieveld, J., and Crowley, J. N.: Measurement of NOx and NOy with a thermal dissociation cavity ring-down spectrometer (TD-CRDS): instrument characterisation and first deployment, Atmos. Meas. Tech., 13, 5739–5761, https://doi.org/10.5194/amt-13-5739-2020, 2020.
Fuchs, H., Holland, F., and Hofzumahaus, A.: Measurement of tropospheric RO2 and HO2 radicals by a laser-induced fluorescence instrument, Rev. Sci. Instrum., 79, 1–12, 2008.
Gaffney, J. S., Bornick, R. M., Chen, Y. H., and Marley, N. A.: Capillary gas chromatographic analysis of nitrogen dioxide and PANs with luminol chemiluminescent detection, Atmos. Environ., 32, 1445–1454, 1998.
Gherman, T., Venables, D. S., Vaughan, S., Orphal, J., and Ruth, A. A.: Incoherent broadband cavity-enhanced absorption spectroscopy in the near-ultraviolet: Application to HONO and NO2, Environ. Sci. Technol., 42, 890–895, 2008.
Glavas, S. and Moschonas, N.: Determination of PAN, PPN, PnBN and selected pentyl nitrates in Athens, Greece, Atmos. Environ., 35, 5467–5475, 2001.
Hao, C. S., Shepson, P. B., Drummond, J. W., and Muthuramu, K.: Gas-chromatographic detector for selective and sensitive detection of atmospheric organic nitrates, Anal. Chem., 66, 3737–3743, 1994.
Horowitz, L. W., Fiore, A. M., Milly, G. P., Cohen, R. C., Perring, A., Wooldridge, P. J., Hess, P. G., Emmons, L. K., and Lamarque, J. F.: Observational constraints on the chemistry of isoprene nitrates over the eastern United States, J. Geophys. Res.-Atmos., 112, 13, https://doi.org/10.1029/2006JD007747, 2007.
Jenkin, M. E., Saunders, S. M., and Pilling, M. J.: The tropospheric degradation of volatile organic compounds: A protocol for mechanism development, Atmos. Environ., 31, 81–104, 1997.
Jordan, N. and Osthoff, H. D.: Quantification of nitrous acid (HONO) and nitrogen dioxide (NO2) in ambient air by broadband cavity-enhanced absorption spectroscopy (IBBCEAS) between 361 and 388 nm, Atmos. Meas. Tech., 13, 273–285, https://doi.org/10.5194/amt-13-273-2020, 2020.
Jordan, N., Ye, C. Z., Ghosh, S., Washenfelder, R. A., Brown, S. S., and Osthoff, H. D.: A broadband cavity-enhanced spectrometer for atmospheric trace gas measurements and Rayleigh scattering cross sections in the cyan region (470–540 nm), Atmos. Meas. Tech., 12, 1277–1293, https://doi.org/10.5194/amt-12-1277-2019, 2019.
Kahan, T. F., Washenfelder, R. A., Vaida, V., and Brown, S. S.: Cavity-Enhanced Measurements of Hydrogen Peroxide Absorption Cross Sections from 353 to 410 nm, J. Phys. Chem. A, 116, 5941–5947, 2012.
Kastler, J. and Ballschmiter, K.: Identification of alkyl dinitrates in ambient air of Central Europe, Fresenius J. Anal. Chem., 363, 1–4, 1999.
Kirchner, F., Mayer-Figge, A., Zabel, F., and Becker, K. H.: Thermal stability of peroxynitrates, Int. J. Chem. Kinet., 31, 127–144, 1999.
Langridge, J. M., Ball, S. M., and Jones, R. L.: A compact broadband cavity enhanced absorption spectrometer for detection of atmospheric NO2 using light emitting diodes, Analyst, 131, 916–922, 2006.
Langridge, J. M., Ball, S. M., Shillings, A. J. L., and Jones, R. L.: A broadband absorption spectrometer using light emitting diodes for ultrasensitive, in situ trace gas detection, Rev. Sci. Instrum., 79, 1–14, 2008.
Lechevallier, L., Grilli, R., Kerstel, E., Romanini, D., and Chappellaz, J.: Simultaneous detection of C2H6, CH4, and δ13C-CH4 using optical feedback cavity-enhanced absorption spectroscopy in the mid-infrared region: towards application for dissolved gas measurements, Atmos. Meas. Tech., 12, 3101–3109, https://doi.org/10.5194/amt-12-3101-2019, 2019.
Lee, B. H., Mohr, C., Lopez-Hilfiker, F. D., Lutz, A., Hallquist, M., Lee, L., Romer, P., Cohen, R. C., Iyer, S., Kurten, T., Hu, W., Day, D. A., Campuzano-Jost, P., Jimenez, J. L., Xu, L., Ng, N. L., Guo, H., Weber, R. J., Wild, R. J., Brown, S. S., Koss, A., de Gouw, J., Olson, K., Goldstein, A. H., Seco, R., Kim, S., McAvey, K., Shepson, P. B., Starn, T., Baumann, K., Edgerton, E. S., Liu, J., Shilling, J. E., Miller, D. O., Brune, W., Schobesberger, S., D'Ambro, E. L., and Thornton, J. A.: Highly functionalized organic nitrates in the southeast United States: Contribution to secondary organic aerosol and reactive nitrogen budgets, P. Natl. Acad. Sci. USA, 113, 1516–1521, 2016.
Lee, L., Wooldridge, P. J., Gilman, J. B., Warneke, C., de Gouw, J., and Cohen, R. C.: Low temperatures enhance organic nitrate formation: evidence from observations in the 2012 Uintah Basin Winter Ozone Study, Atmos. Chem. Phys., 14, 12441–12454, https://doi.org/10.5194/acp-14-12441-2014, 2014.
Li, Z., Hu, R., Xie, P., Chen, H., Wu, S., Wang, F., Wang, Y., Ling, L., Liu, J., and Liu, W.: Development of a portable cavity ring down spectroscopy instrument for simultaneous, in situ measurement of NO3 and N2O5, Opt. Express, 26, A433–A449, 2018.
Liang, S., Qin, M., Xie, P., Duan, J., Fang, W., He, Y., Xu, J., Liu, J., Li, X., Tang, K., Meng, F., Ye, K., Liu, J., and Liu, W.: Development of an incoherent broadband cavity-enhanced absorption spectrometer for measurements of ambient glyoxal and NO2 in a polluted urban environment, Atmos. Meas. Tech., 12, 2499–2512, https://doi.org/10.5194/amt-12-2499-2019, 2019.
Ling, Z., Guo, H., Simpson, I. J., Saunders, S. M., Lam, S. H. M., Lyu, X., and Blake, D. R.: New insight into the spatiotemporal variability and source apportionments of C1–C4 alkyl nitrates in Hong Kong, Atmos. Chem. Phys., 16, 8141–8156, https://doi.org/10.5194/acp-16-8141-2016, 2016.
Liu, J., Li, X., Yang, Y., Wang, H., Wu, Y., Lu, X., Chen, M., Hu, J., Fan, X., Zeng, L., and Zhang, Y.: An IBBCEAS system for atmospheric measurements of glyoxal and methylglyoxal in the presence of high NO2 concentrations, Atmos. Meas. Tech., 12, 4439–4453, https://doi.org/10.5194/amt-12-4439-2019, 2019.
Liu, L., Wang, X., Chen, J., Xue, L., Wang, W., Wen, L., Li, D., and Chen, T.: Understanding unusually high levels of peroxyacetyl nitrate (PAN) in winter in Urban Jinan, China, J. Environ. Sci., 71, 249–260, 2018.
Liu, Z., Wang, Y., Gu, D., Zhao, C., Huey, L. G., Stickel, R., Liao, J., Shao, M., Zhu, T., Zeng, L., Liu, S.-C., Chang, C.-C., Amoroso, A., and Costabile, F.: Evidence of Reactive Aromatics As a Major Source of Peroxy Acetyl Nitrate over China, Environ. Sci. Technol., 44, 7017–7022, 2010.
Liu, Z., Wang, Y., Gu, D., Zhao, C., Huey, L. G., Stickel, R., Liao, J., Shao, M., Zhu, T., Zeng, L., Amoroso, A., Costabile, F., Chang, C.-C., and Liu, S.-C.: Summertime photochemistry during CAREBeijing-2007: ROx budgets and O3 formation, Atmos. Chem. Phys., 12, 7737–7752, https://doi.org/10.5194/acp-12-7737-2012, 2012.
Luxenhofer, O., Schneider, E., and Ballschmiter, K.: Separation, detextion and occurrence of (C2–C8)-alkyl nitrates and phenyl-alkyl nitrates as trace compounds in clean and polluted air, Fresenius J. Anal. Chem., 350, 384–394, 1994.
Ma, M., Gao, Y., Wang, Y., Zhang, S., Leung, L. R., Liu, C., Wang, S., Zhao, B., Chang, X., Su, H., Zhang, T., Sheng, L., Yao, X., and Gao, H.: Substantial ozone enhancement over the North China Plain from increased biogenic emissions due to heat waves and land cover in summer 2017, Atmos. Chem. Phys., 19, 12195–12207, https://doi.org/10.5194/acp-19-12195-2019, 2019.
Mellouki, A., Wallington, T. J., and Chen, J.: Atmospheric Chemistry of Oxygenated Volatile Organic Compounds: Impacts on Air Quality and Climate, Chem. Rev., 115, 3984–4014, 2015.
Min, K.-E., Washenfelder, R. A., Dubé, W. P., Langford, A. O., Edwards, P. M., Zarzana, K. J., Stutz, J., Lu, K., Rohrer, F., Zhang, Y., and Brown, S. S.: A broadband cavity enhanced absorption spectrometer for aircraft measurements of glyoxal, methylglyoxal, nitrous acid, nitrogen dioxide, and water vapor, Atmos. Meas. Tech., 9, 423–440, https://doi.org/10.5194/amt-9-423-2016, 2016.
Ng, N. L., Brown, S. S., Archibald, A. T., Atlas, E., Cohen, R. C., Crowley, J. N., Day, D. A., Donahue, N. M., Fry, J. L., Fuchs, H., Griffin, R. J., Guzman, M. I., Herrmann, H., Hodzic, A., Iinuma, Y., Jimenez, J. L., Kiendler-Scharr, A., Lee, B. H., Luecken, D. J., Mao, J., McLaren, R., Mutzel, A., Osthoff, H. D., Ouyang, B., Picquet-Varrault, B., Platt, U., Pye, H. O. T., Rudich, Y., Schwantes, R. H., Shiraiwa, M., Stutz, J., Thornton, J. A., Tilgner, A., Williams, B. J., and Zaveri, R. A.: Nitrate radicals and biogenic volatile organic compounds: oxidation, mechanisms, and organic aerosol, Atmos. Chem. Phys., 17, 2103–2162, https://doi.org/10.5194/acp-17-2103-2017, 2017.
Paul, D. and Osthoff, H. D.: Absolute Measurements of Total Peroxy Nitrate Mixing Ratios by Thermal Dissociation Blue Diode Laser Cavity Ring-Down Spectroscopy, Anal. Chem., 82, 6695–6703, 2010.
Paul, D., Furgeson, A., and Osthoff, H. D.: Measurements of total peroxy and alkyl nitrate abundances in laboratory-generated gas samples by thermal dissociation cavity ring-down spectroscopy, Rev. Sci. Instrum., 80, 1–8, 2009.
Perring, A. E., Bertram, T. H., Wooldridge, P. J., Fried, A., Heikes, B. G., Dibb, J., Crounse, J. D., Wennberg, P. O., Blake, N. J., Blake, D. R., Brune, W. H., Singh, H. B., and Cohen, R. C.: Airborne observations of total RONO2: new constraints on the yield and lifetime of isoprene nitrates, Atmos. Chem. Phys., 9, 1451–1463, https://doi.org/10.5194/acp-9-1451-2009, 2009.
Perring, A. E., Pusede, S. E., and Cohen, R. C.: An Observational Perspective on the Atmospheric Impacts of Alkyl and Multifunctional Nitrates on Ozone and Secondary Organic Aerosol, Chem. Rev., 113, 5848–5870, 2013.
Reisen, F., Aschmann, S. M., Atkinson, R., and Arey, J.: 1,4-hydroxycarbonyl products of the OH radical initiated reactions of C5–C8 n-alkanes in the presence of N0, Environ. Sci. Technol., 39, 4447–4453, 2005.
Roberts, J. M.: The atmospheric chemistry of organic nitrates, Atmos. Environ. A-Gen. Top., 24, 243–287, 1990.
Roberts, J. M., Bertman, S. B., Parrish, D. D., Fehsenfeld, F. C., Jobson, B. T., and Niki, H.: Measurement of alkyl nitrates at Chebogue Point, Nova Scotia during the 1993 North Atlantic Regional Experiment (NARE) intensive, J. Geophys. Res.-Atmos., 103, 13569–13580, 1998a.
Roberts, J. M., Williams, J., Baumann, K., Buhr, M. P., Goldan, P. D., Holloway, J., Hubler, G., Kuster, W. C., McKeen, S. A., Ryerson, T. B., Trainer, M., Williams, E. J., Fehsenfeld, F. C., Bertman, S. B., Nouaime, G., Seaver, C., Grodzinsky, G., Rodgers, M., and Young, V. L.: Measurements of PAN, PPN, and MPAN made during the 1994 and 1995 Nashville Intensives of the Southern Oxidant Study: Implications for regional ozone production from biogenic hydrocarbons, J. Geophys. Res.-Atmos., 103, 22473–22490, 1998b.
Roberts, J. M., Jobson, B. T., Kuster, W., Goldan, P., Murphy, P., Williams, E., Frost, G., Riemer, D., Apel, E., Stroud, C., Wiedinmyer, C., and Fehsenfeld, F.: An examination of the chemistry of peroxycarboxylic nitric anhydrides and related volatile organic compounds during Texas Air Quality Study 2000 using ground-based measurements, J. Geophys. Res.-Atmos., 108, 4495, https://doi.org/10.1029/2003JD003383, 2003.
Rollins, A. W., Browne, E. C., Min, K. E., Pusede, S. E., Wooldridge, P. J., Gentner, D. R., Goldstein, A. H., Liu, S., Day, D. A., Russell, L. M., and Cohen, R. C.: Evidence for NOx Control over Nighttime SOA Formation, Science, 337, 1210–1212, 2012.
Russell, M. and Allen, D. T.: Predicting secondary organic aerosol formation rates in southeast Texas, J. Geophys. Res.-Atmos., 110, D07S17, https://doi.org/10.1029/2004JD004722, 2005.
Sadanaga, Y., Takaji, R., Ishiyama, A., Nakajima, K., Matsuki, A., and Bandow, H.: Thermal dissociation cavity attenuated phase shift spectroscopy for continuous measurement of total peroxy and organic nitrates in the clean atmosphere, Rev. Sci. Instrum., 87, 1–6, 2016.
Saunders, S. M., Jenkin, M. E., Derwent, R. G., and Pilling, M. J.: Protocol for the development of the Master Chemical Mechanism, MCM v3 (Part A): tropospheric degradation of non-aromatic volatile organic compounds, Atmos. Chem. Phys., 3, 161–180, https://doi.org/10.5194/acp-3-161-2003, 2003.
Shardanand, S. A. R. A. D. P.: Absolute Rayleigh scattering cross sections of gases and freons of stratospheric interest in the visible and ultraviolet regions, NASA Technical Note, National Aeronautics and Space Administration, Washington, 1977.
Shu, L., Wang, T., Han, H., Xie, M., Chen, P., Li, M., and Wu, H.: Summertime ozone pollution in the Yangtze River Delta of eastern China during 2013-2017: Synoptic impacts and source apportionment, Environ. Pollut. (Barking, Essex, 1987), 113631–113631, https://doi.org/10.1016/j.envpol.2019.113631, 2019.
Simpson, I. J., Wang, T., Guo, H., Kwok, Y. H., Flocke, F., Atlas, E., Meinardi, S., Rowland, F. S., and Blake, D. R.: Long-term atmospheric measurements of C1–C5 alkyl nitrates in the pearl river delta region of southeast China, Atmos. Environ., 40, 1619–1632, 2006.
Slusher, D. L., Huey, L. G., Tanner, D. J., Flocke, F. M., and Roberts, J. M.: A thermal dissociation-chemical ionization mass spectrometry (TD-CIMS) technique for the simultaneous measurement of peroxyacyl nitrates and dinitrogen pentoxide, J. Geophys. Res.-Atmos., 109, D19315, https://doi.org/10.1029/2004JD004670, 2004.
Sneep, M. and Ubachs, W.: Direct measurement of the Rayleigh scattering cross section in various gases, J. Quant. Spectrosc. Ra., 92, 293–310, 2005.
Sobanski, N., Schuladen, J., Schuster, G., Lelieveld, J., and Crowley, J. N.: A five-channel cavity ring-down spectrometer for the detection of NO2, NO3, N2O5, total peroxy nitrates and total alkyl nitrates, Atmos. Meas. Tech., 9, 5103–5118, https://doi.org/10.5194/amt-9-5103-2016, 2016.
Sobanski, N., Thieser, J., Schuladen, J., Sauvage, C., Song, W., Williams, J., Lelieveld, J., and Crowley, J. N.: Day and night-time formation of organic nitrates at a forested mountain site in south-west Germany, Atmos. Chem. Phys., 17, 4115–4130, https://doi.org/10.5194/acp-17-4115-2017, 2017.
Song, J., Zhang, Y., Huang, Y., Ho, K. F., Yuan, Z., Ling, Z., Niu, X., Gao, Y., Cui, L., Louie, P. K. K., Lee, S.-C., and Lai, S.: Seasonal variations of C1–C4 alkyl nitrates at a coastal site in Hong Kong: Influence of photochemical formation and oceanic emissions, Chemosphere, 194, 275–284, 2018.
Sun, J., Li, Z., Xue, L., Wang, T., Wang, X., Gao, J., Nie, W., Simpson, I. J., Gao, R., Blake, D. R., Chai, F., and Wang, W.: Summertime C1–C5 alkyl nitrates over Beijing, northern China: Spatial distribution, regional transport, and formation mechanisms, Atmos. Res., 204, 102–109, 2018.
Taha, Y. M., Saowapon, M. T., Assad, F. V., Ye, C. Z., Chen, X., Garner, N. M., and Osthoff, H. D.: Quantification of peroxynitric acid and peroxyacyl nitrates using an ethane-based thermal dissociation peroxy radical chemical amplification cavity ring-down spectrometer, Atmos. Meas. Tech., 11, 4109–4127, https://doi.org/10.5194/amt-11-4109-2018, 2018.
Talbot, R. W., Dibb, J. E., Scheuer, E. M., Bradshaw, J. D., Sandholm, S. T., Singh, H. B., Blake, D. R., Blake, N. J., Atlas, E., and Flocke, F.: Tropospheric reactive odd nitrogen over the South Pacific in austral springtime, J. Geophys. Res.-Atmos., 105, 6681–6694, 2000.
Tang, K., Qin, M., Fang, W., Duan, J., Meng, F., Ye, K., Zhang, H., Xie, P., He, Y., Xu, W., Liu, J., and Liu, W.: Simultaneous detection of atmospheric HONO and NO2 utilising an IBBCEAS system based on an iterative algorithm, Atmos. Meas. Tech., 13, 6487–6499, https://doi.org/10.5194/amt-13-6487-2020, 2020.
Tanimoto, H., Hirokawa, J., Kajii, Y., and Akimoto, H.: A new measurement technique of peroxyacetyl nitrate at parts per trillion by volume levels: Gas chromatography/negative ion chemical ionization mass spectrometry, J. Geophys. Res.-Atmos., 104, 21343–21354, 1999.
Thaler, R. D., Mielke, L. H., and Osthoff, H. D.: Quantification of Nitryl Chloride at Part Per Trillion Mixing Ratios by Thermal Dissociation Cavity Ring-Down Spectroscopy, Anal. Chem., 83, 2761–2766, 2011.
Thalman, R. and Volkamer, R.: Inherent calibration of a blue LED-CE-DOAS instrument to measure iodine oxide, glyoxal, methyl glyoxal, nitrogen dioxide, water vapour and aerosol extinction in open cavity mode, Atmos. Meas. Tech., 3, 1797–1814, https://doi.org/10.5194/amt-3-1797-2010, 2010.
Thalman, R., Baeza-Romero, M. T., Ball, S. M., Borrás, E., Daniels, M. J. S., Goodall, I. C. A., Henry, S. B., Karl, T., Keutsch, F. N., Kim, S., Mak, J., Monks, P. S., Muñoz, A., Orlando, J., Peppe, S., Rickard, A. R., Ródenas, M., Sánchez, P., Seco, R., Su, L., Tyndall, G., Vázquez, M., Vera, T., Waxman, E., and Volkamer, R.: Instrument intercomparison of glyoxal, methyl glyoxal and NO2 under simulated atmospheric conditions, Atmos. Meas. Tech., 8, 1835–1862, https://doi.org/10.5194/amt-8-1835-2015, 2015.
Thieser, J., Schuster, G., Schuladen, J., Phillips, G. J., Reiffs, A., Parchatka, U., Pöhler, D., Lelieveld, J., and Crowley, J. N.: A two-channel thermal dissociation cavity ring-down spectrometer for the detection of ambient NO2, RO2NO2 and RONO2, Atmos. Meas. Tech., 9, 553–576, https://doi.org/10.5194/amt-9-553-2016, 2016.
Vandaele, A. C., Hermans, C., Fally, S., Carleer, M., Colin, R., Merienne, M. F., Jenouvrier, A., and Coquart, B.: High-resolution Fourier transform measurement of the NO2 visible and near-infrared absorption cross sections: Temperature and pressure effects, J. Geophys. Res.-Atmos., 107, 13, https://doi.org/10.1029/2001JD000971, 2002.
Vasquez, K. T., Crounse, J. D., Schulze, B. C., Bates, K. H., Teng, A. P., Xu, L., Allen, H. M., and Wennberg, P. O.: Rapid hydrolysis of tertiary isoprene nitrate efficiently removes NOx from the atmosphere, P. Natl. Acad. Sci. USA, 117, 33011–33016, 2020.
Vaughan, S., Gherman, T., Ruth, A. A., and Orphal, J.: Incoherent broad-band cavity-enhanced absorption spectroscopy of the marine boundary layer species I2, IO and OIO, Phys. Chem. Chem. Phys., 10, 4471–4477, 2008.
Venables, D. S., Gherman, T., Orphal, J., Wenger, J. C., and Ruth, A. A.: High sensitivity in situ monitoring of NO3 in an atmospheric simulation chamber using incoherent broadband cavity-enhanced absorption spectroscopy, Environ. Sci. Technol., 40, 6758–6763, 2006.
Ventrillard-Courtillot, I., O'Brien, E. S., Kassi, S., Mejean, G., and Romanini, D.: Incoherent broad-band cavity-enhanced absorption spectroscopy for simultaneous trace measurements of NO2 and NO3 with a LED source, Appl. Phys. B-Lasers Opt., 101, 661–669, 2010.
Ventrillard, I., Xueref-Remy, I., Schmidt, M., Yver Kwok, C., Faïn, X., and Romanini, D.: Comparison of optical-feedback cavity-enhanced absorption spectroscopy and gas chromatography for ground-based and airborne measurements of atmospheric CO concentration, Atmos. Meas. Tech., 10, 1803–1812, https://doi.org/10.5194/amt-10-1803-2017, 2017.
Voigt, S., Orphal, J., and Burrows, J. P.: The temperature and pressure dependence of the absorption cross-sections of NO2 in the 250–800 nm region measured by Fourier-transform spectroscopy, J. Photoch. Photobio. A, 149, 1–7, 2002.
Wang, H., Chen, J., and Lu, K.: Development of a portable cavity-enhanced absorption spectrometer for the measurement of ambient NO3 and N2O5: experimental setup, lab characterizations, and field applications in a polluted urban environment, Atmos. Meas. Tech., 10, 1465–1479, https://doi.org/10.5194/amt-10-1465-2017, 2017.
Wang, T., Poon, C. N., Kwok, Y. H., and Li, Y. S.: Characterizing the temporal variability and emission patterns of pollution plumes in the Pearl River Delta of China, Atmos. Environ., 37, 3539–3550, 2003.
Wang, T., Wei, X. L., Ding, A. J., Poon, C. N., Lam, K. S., Li, Y. S., Chan, L. Y., and Anson, M.: Increasing surface ozone concentrations in the background atmosphere of Southern China, 1994–2007, Atmos. Chem. Phys., 9, 6217–6227, https://doi.org/10.5194/acp-9-6217-2009, 2009.
Wang, T., Xue, L., Brimblecombe, P., Lam, Y. F., Li, L., and Zhang, L.: Ozone pollution in China: A review of concentrations, meteorological influences, chemical precursors, and effects, Sci. Total Environ., 575, 1582–1596, 2017.
Washenfelder, R. A., Langford, A. O., Fuchs, H., and Brown, S. S.: Measurement of glyoxal using an incoherent broadband cavity enhanced absorption spectrometer, Atmos. Chem. Phys., 8, 7779–7793, https://doi.org/10.5194/acp-8-7779-2008, 2008.
Washenfelder, R. A., Attwood, A. R., Flores, J. M., Zarzana, K. J., Rudich, Y., and Brown, S. S.: Broadband cavity-enhanced absorption spectroscopy in the ultraviolet spectral region for measurements of nitrogen dioxide and formaldehyde, Atmos. Meas. Tech., 9, 41–52, https://doi.org/10.5194/amt-9-41-2016, 2016.
Watt, R. S., Laurila, T., Kaminski, C. F., and Hult, J.: Cavity Enhanced Spectroscopy of High-Temperature H2O in the Near-Infrared Using a Supercontinuum Light Source, Appl. Spectrosc., 63, 1389–1395, 2009.
Wennberg, P. O., Bates, K. H., Crounse, J. D., Dodson, L. G., McVay, R. C., Mertens, L. A., Nguyen, T. B., Praske, E., Schwantes, R. H., Smarte, M. D., St Clair, J. M., Teng, A. P., Zhang, X., and Seinfeld, J. H.: Gas-Phase Reactions of Isoprene and Its Major Oxidation Products, Chem. Rev., 118, 3337–3390, 2018.
Wild, R. J., Edwards, P. M., Dube, W. P., Baumann, K., Edgerton, E. S., Quinn, P. K., Roberts, J. M., Rollins, A. W., Veres, P. R., Warneke, C., Williams, E. J., Yuan, B., and Brown, S. S.: A Measurement of Total Reactive Nitrogen, NOy, together with NO2, NO, and O3 via Cavity Ring-down Spectroscopy, Environ. Sci. Technol., 48, 9609–9615, 2014.
Womack, C. C., Neuman, J. A., Veres, P. R., Eilerman, S. J., Brock, C. A., Decker, Z. C. J., Zarzana, K. J., Dube, W. P., Wild, R. J., Wooldridge, P. J., Cohen, R. C., and Brown, S. S.: Evaluation of the accuracy of thermal dissociation CRDS and LIF techniques for atmospheric measurement of reactive nitrogen species, Atmos. Meas. Tech., 10, 1911–1926, https://doi.org/10.5194/amt-10-1911-2017, 2017.
Wooldridge, P. J., Perring, A. E., Bertram, T. H., Flocke, F. M., Roberts, J. M., Singh, H. B., Huey, L. G., Thornton, J. A., Wolfe, G. M., Murphy, J. G., Fry, J. L., Rollins, A. W., LaFranchi, B. W., and Cohen, R. C.: Total Peroxy Nitrates (ΣPNs) in the atmosphere: the Thermal Dissociation-Laser Induced Fluorescence (TD-LIF) technique and comparisons to speciated PAN measurements, Atmos. Meas. Tech., 3, 593–607, https://doi.org/10.5194/amt-3-593-2010, 2010.
Yang, Y., Li, X., Zu, K., Lian, C., Chen, S., Dong, H., Feng, M., Liu, H., Liu, J., Lu, K., Lu, S., Ma, X., Song, D., Wang, W., Yang, S., Yang, X., Yu, X., Zhu, Y., Zeng, L., Tan, Q., and Zhang, Y.: Elucidating the effect of HONO on O3 pollution by a case study in southwest China, Sci. Total Environ., 756, 144127–144127, https://doi.org/10.1016/j.scitotenv.2020.144127, 2020.
Yi, H. M., Wu, T., Wang, G. S., Zhao, W. X., Fertein, E., Coeur, C., Gao, X. M., Zhang, W. J., and Chen, W. D.: Sensing atmospheric reactive species using light emitting diode by incoherent broadband cavity enhanced absorption spectroscopy, Opt. Express, 24, 10, https://doi.org/10.1364/OE.24.00A781, 2016.
Yin, C., Deng, X., Zou, Y., Solmon, F., Li, F., and Deng, T.: Trend analysis of surface ozone at suburban Guangzhou, China, Sci. Total Environ., 695, 1–7, 2019.
Zare, A., Romer, P. S., Nguyen, T., Keutsch, F. N., Skog, K., and Cohen, R. C.: A comprehensive organic nitrate chemistry: insights into the lifetime of atmospheric organic nitrates, Atmos. Chem. Phys., 18, 15419–15436, https://doi.org/10.5194/acp-18-15419-2018, 2018.
Zeng, L., Fan, G.-J., Lyu, X., Guo, H., Wang, J.-L., and Yao, D.: Atmospheric fate of peroxyacetyl nitrate in suburban Hong Kong and its impact on local ozone pollution, Environ. Pollut., 252, 1910–1919, 2019.
Zhang, H., Xu, X., Lin, W., and Wang, Y.: Wintertime peroxyacetyl nitrate (PAN) in the megacity Beijing: Role of photochemical and meteorological processes, J. Environ. Sci., 26, 83–96, 2014.
Zhang, Y., Sun, J., Zheng, P., Chen, T., Liu, Y., Han, G., Simpson, I. J., Wang, X., Blake, D. R., Li, Z., Yang, X., Qi, Y., Wang, Q., Wang, W., and Xue, L.: Observations of C1–C5 alkyl nitrates in the Yellow River Delta, northern China: Effects of biomass burning and oil field emissions, Sci. Total Environ., 656, 129–139, 2018.