the Creative Commons Attribution 4.0 License.
the Creative Commons Attribution 4.0 License.
 | 07 Jun 2021
Quality assessment of Dobson spectrophotometers for ozone column measurements before and after automation at Arosa and Davos
Herbert Schill
Eliane Maillard Barras
Jörg Klausen
Alexander Haefele
The longest ozone column measurement series are based on the Dobson sun spectrophotometers developed in the 1920s by Gordon B. W. Dobson. These instruments still constitute an important part of the World Meteorological Organization's global network due to their optical qualities and ruggedness. The primary drawback of this instrument is the effort needed for its manual operation. In industrialized and some less developed countries, most stations have made the choice to replace the Dobson by the automated Brewer sun spectrophotometers, but some are still relying on the Dobson instrument. One of them is the Arosa station where both instrument types are run in parallel. Here, an automated version of the Dobson instrument was developed and implemented recently. In the present paper, the results of the analysis of simultaneous measurements from pairs of Dobson instruments that were either collocated at Arosa or Davos or operated one at each location are presented for four distinct time periods:
-
1992–2012 – manual vs. manual operation of collocated Dobson instruments (MMC);
-
2012–2013 – manual vs. automated operation of collocated Dobson instruments (MAC);
-
2012–2019 – automated vs. automated operation of collocated Dobson instruments (AAC);
-
2016–2019 – automated vs. automated operation of distant Dobson instruments (AAD).
The direct comparison of two instruments using the standard operation procedure during the MMC period gives a metric necessary to validate the automated version of Dobson instruments. The direct comparison of two collocated instruments using the standard manual operation procedure reveals random differences of coincident observations with a standard deviation of ∼ 0.45 % and monthly mean differences between −1.0 % and +0.8 %. In most cases the observed biases are not statistically significant. The same analysis of two automated Dobson instruments yields significantly smaller standard deviation of ∼ 0.25 % and biases of between −0.7 % and 0.8 %. This demonstrates that the repeatability has improved with the automation, while the systematic differences are only marginally smaller. The analysis of the AAD period of coincident measurements from the distant sites Arosa and Davos reveals a small positive bias (not significant) compatible with the 250 m altitude difference.
The description of the automated data acquisition and control of the Dobson instrument is presented in a separate paper (Stübi et al., 2020).
- Article
(2497 KB) - Full-text XML
- BibTeX
- EndNote


In 2017, the celebration of 30 years of the Montreal Protocol (Albrecht and Parker, 2019) was a reminder of this important worldwide agreement to ban the use and the production of substances harmful for the ozone layer in industrial processes as well as their release to the atmosphere (Solomon, 1999). Present monitoring activities show the effectiveness of the protocol in the stabilization and the decrease in their abundance in the atmosphere. However, while ozone layer depletion seems to have stopped since the beginning of the 21st century, the expected recovery of the ozone layer to the pre-1980 level has still not been observed in most parts of the atmosphere. Hence it remains important to continue with the monitoring at the global scale. The anxiety about the ozone hole has favored the development of well organized dedicated monitoring networks based in particular on the Dobson and Brewer instruments. In these networks, the Light Climatic Observatory (LKO for German “Licht Klimatisches Observatorium”) at Arosa has a special renown since it provides the longest continuous total ozone column measurement series whose first measurements date back to 1926 as illustrated in Fig. 1. While the ozone column decline of the 1970s–1980s is clearly seen, followed by a leveling off since the mid-1990s, the expected recovery of the ozone layer is not evident up to now, neither in the LKO total column ozone time series nor at other ground-based stations (Ball et al., 2019). The trend analysis of the ozone abundance at different altitude ranges is still the subject of research and publications (e.g., Pawson et al., 2014; WMO, 2018; SPARC/IO3C/GAW, 2019). A clear sign of recovery is presently observed at mid-latitude in the upper stratosphere (∼ 40 km), driven by chemical changes in accordance with numerical models forecast. This is interpreted as a positive consequence of the Montreal Protocol. In contrast, another publication (Ball et al., 2018) still revealed a negative ozone trend in the lower stratosphere (∼ 10 km) probably linked to dynamical changes or atmospheric variability and reminded the public that the rhetoric of the ozone problem being already solved was overly optimistic.

Figure 1Arosa ozone column time series: yearly mean values in Dobson Units [DU]. The shaded area depicts the standard deviation of the monthly means of each year.
The history of the LKO and the essential role of ozone pioneers in keeping a measurement site active over such a long period of time was detailed in two publications (Staehelin et al., 2018; Staehelin and Viatte, 2019). The link between the LKO activities and societal concerns was highlighted in particular with the tuberculosis treatment in the earlier years and the ozone hole more recently. The LKO ozone column measurement series and the succession of instruments in operation has been analyzed before (Perl and Dütsch, 1958; Dütsch, 1984; Brönnimann et al., 2003). Staehelin et al. (1998) described 4 decades of use of Dobson D015 at Arosa from 1948 until 1992 and the arrival of Dobson D101 in 1966 as a redundant instrument. With the decommissioning of D015 in 1992, D101 became the reference instrument, and the newly arrived Dobson D062 took the role of the redundant instrument. The instruments were upgraded with a digital recording of the R-dial position at the end of the 1980s (Hoegger et al., 1992) but continued to be manually operated in a dedicated convenient-to-use rotating cabin.
Dütsch, the responsible scientist for LKO, made first attempts to automate the Dobson instrument in the 1970s (Räber, 1973). For technical reasons, the project was suspended for the direct sun measurements but was continued for the zenith measurements. The latter do not require precise sun pointing and are used to determine the ozone profile with altitude at low solar zenith angle (Umkehr method, Petropavlovskikh et al., 2009). The implementation of a fully automated version of the Dobson instrument developed at MeteoSwiss between 2012 and 2014 motivated the new analysis of the data as presented here. More technical aspects of the automation are described in a separate paper (Stübi et al., 2020). The automated Dobson instruments require only occasional presence on-site essentially for lamps tests. Following this transition to automated operation, the comparison of the two sites Arosa and Davos started, with a view to continue the world's longest total column ozone series based on Dobson observations in Davos. Principles for climate monitoring systems have been adopted by the World Meteorological Organization (WMO). Known as the Global Climate Observing System (GCOS) principles, they assure the continuity of the Essential Climate Variable (ECV) records like the Arosa total ozone series. GCOS principle 1 requires that “The impact of new systems or changes to existing systems should be assessed prior to implementation” and GCOS principle 2 that “A suitable period of overlap for new and old observing systems is required”. The present analysis is a response to the GCOS principles for the change of Dobson measuring technique (manual to automated) followed by a change of instrument location (Arosa to Davos). The adherence to these principles assures the continuity of the Arosa series with measurements at Davos and the homogeneity of the combined record.
The present study is centered on the analysis of Dobson instruments data and is a follow-up of two previous analyses of the LKO Brewer triad measurements (Stübi et al., 2017a, b).
The paper is organized as follows: in Sect. 2, the measurement principles are presented, followed in Sect. 3 by a description of the data sets and of the data quality control procedures applied. The results of the analysis are presented in Sect. 4 and the discussion of the results in Sect. 5.
The principle of the Dobson instrument is described in many publications (Dobson, 1968; Komhyr, 1980; Evans, 2008; Scarnato et al., 2009, 2010; Moeini et al., 2019). The intensity of the sun's radiation in the UV range at ground level is modulated by the amount of ozone in the atmosphere. The sun spectrophotometers of type Dobson and Brewer measure the intensity at a few specific wavelengths in the range 305–340 nm. In the Dobson instrument, the sunlight is diffracted by a prism and two narrow slits allow to select the different pairs of wavelength commonly referred to as A (305.5/325.4 nm), C (311.45/332.4 nm) and D (317.6/339.8 nm). These pairs are combined to form the double pairs AD and CD used to calculate the ozone column while eliminating atmospheric interferences (Evans, 2008; Basher, 1982). Following Evans (2008) notation, the ozone column is retrieved with the following formula:
where the superscripts s (l) refer to the short (long) wavelength within each pair, αλ is the absorption coefficient of ozone, βλ and δλ are respectively the Rayleigh and Mie scattering coefficients, and m and μ refer to the air masses for Rayleigh and ozone respectively. The ratio is a correction for the mean station pressure, and SZA is the solar zenith angle. The measured N values are the logarithmic differences of the solar radiation intensity ratios at the top of the atmosphere and at the surface:
The wavelength dependence of the Mie scattering is much smaller than the dependence of ozone and Raleigh scatterings; therefore, the last term of Eq. (1) is negligible for the double pairs. In the Brewer instruments, a diffraction grating selects four wavelengths (310.1, 313.5, 316.8, 320.0 nm), which are then combined in a similar way as for the Dobson instrument to extract the ozone column (Kerr et al., 1981; Kerr and McElroy, 1995). All Dobson instruments are of the same design, and the optical alignment of the prisms, lenses and the slits is standardized for all instruments. Consequently, the Dobson ozone column retrieval algorithm is fairly simple and assumes similar characteristics for all instruments – characteristics based on the optical properties of the primary reference Dobson instrument D083 (Komhyr et al., 1989). In the past 10 years, the EMRP-ATMOZ project has contributed to an improved understanding of the sun spectrophotometer's measurement principle (ATMOZ Project, 2018). Thus, measurements of the Dobson slit functions (Köhler et al., 2018), of the ozone cross sections and their temperature dependencies (Bass and Paur, 1985; Serdyuchenko et al., 2014; Malicet et al., 1995; Janssen et al., 2018), of the stray-light effect (Christodoulakis et al., 2015; Karppinen et al., 2015; Moeini et al., 2019), and their implications on the ozone column retrieval for different instruments (Redondas et al., 2014) are now available. An adaptation of the processing algorithm with these recent findings would certainly improve the absolute accuracy of future ozone observations. However, it is harder to apply these findings consistently to the historical records of Dobson measurements because some essential instrument characteristics (slit functions, wavelengths in use, etc.) are not available for older instruments and data sets.
The Dobson network calibration is organized by the World Meteorological Organization's (WMO) Global Atmosphere Watch program. It consists of the World Dobson Calibration Center (WDCC; with one primary standard Dobson and one traveling primary standard Dobson instrument) and five Regional Dobson Calibrations Centers (RDCCs; with six secondary standard Dobson instruments). Calibrations of the primary standard Dobson by the Langley method are regularly performed at the Mauna Loa Observatory, Hawaii. Dobson instrument of the network are calibrated either directly or indirectly relative to the primary standard scale to maintain the homogeneity of the network (Komhyr et al., 1989). For Europe, two regional secondary standard Dobson instruments are in use: D064 from the Hohenpeissenberg Observatory (MOHp, Germany) and D074 from the Solar and Ozone Observatory in Hradec Králové (SOO-HK, Czech Republic). These calibrations were carried out regularly at LKO as indicated in Fig. 3 by the black arrows.
The Dobson automation and relocation from LKO to the Physikalisch-Meteorologisches Observatorium Davos/World Radiation Center (PMOD/WRC) was considered by MeteoSwiss with the prospect of perpetuating the measurements in the long term under optimal conditions. Factors considered in the analysis included the availability of operators for a year-round 24/7 monitoring program, data quality improvements (repeatability, reproducibility, increased frequency of measurements) and reduction of operational cost due to institutional synergies. Great care was taken to avoid a fundamental change of the Dobson measurements and hence to support the continuity of the LKO ozone column time series.
Table 1Chronology of the interventions and calibrations of the three Dobson instruments over the transition period 2010–2015 from manual to automated Dobson operation.

A description of the technical details of the automated system is found in a separate publication (Stübi et al., 2020). Table 1 lists the dates of the main changes that have the potential to introduce changes in the measurements of the three LKO Dobson instruments. By the end of 2015, all three Dobson instruments were automated and had reached the same configuration.
The automation of the Dobson spectrophotometers D062 and D051 was performed between the intercomparisons of summer 2010 and summer 2012, while D101 was automated at the beginning of 2014. Until early 2016, the three Dobson instruments were at LKO as illustrated by the red and blue color bars in the upper panel of Fig. 2. Then, Dobson D101 was moved to the PMOD/WRC. Stübi et al. (2017b) have described the stations and have analyzed the similar relocation from Arosa to Davos of Brewer instruments in terms of differing environmental factors with a potential to break the LKO ozone column series.
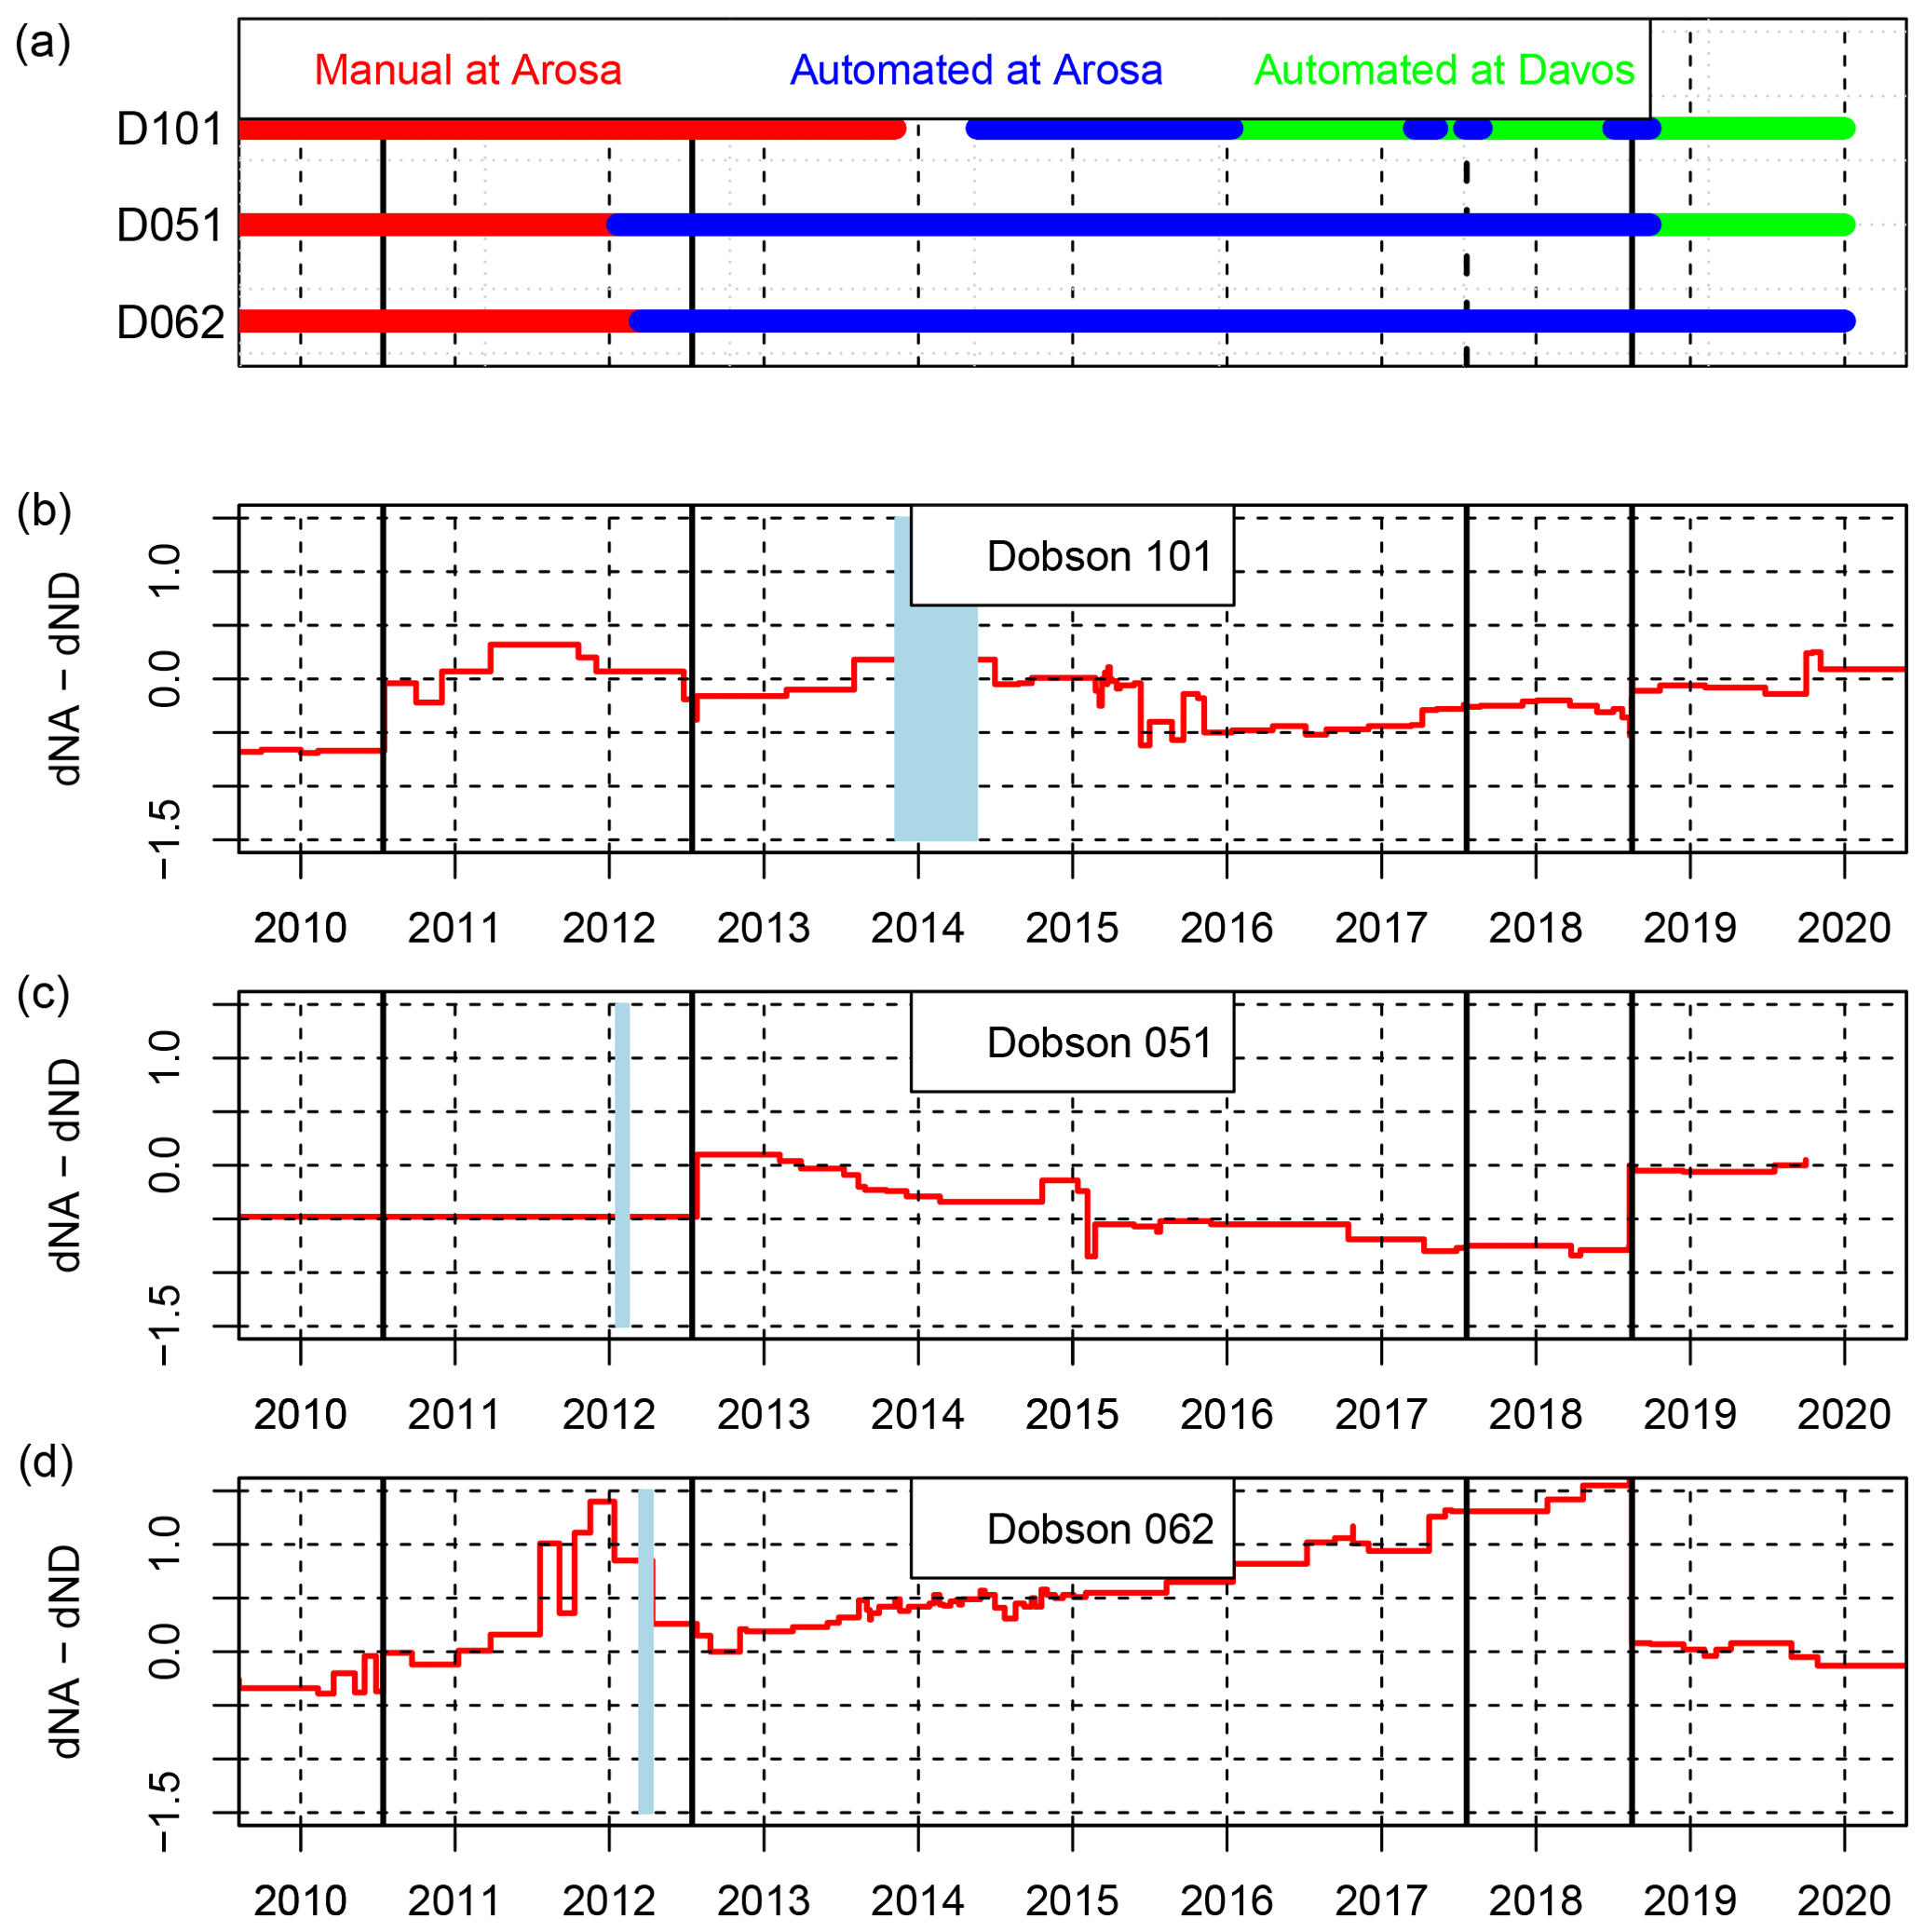
Figure 2(a) Historical changes of the Dobson operation as well as of the instrument locations. (b–d) Time series 2010–2020 of the lamp corrections δNA–δND for the three LKO Dobson instruments. The vertical yellow bars denote the intercomparisons with the European regional standard. The blue bands mark the unavailability of each Dobson instrument during the process of automation.
The lower three panels of Fig. 2 show the last 10 years of the standard lamps corrections applied for the AD pairs for the three Dobson instruments. A variation of the difference δNA-δND of 0.5 corresponds to ≃ 1 % of the ozone column variation at air mass μ=1, decreasing as that is ≃ 0.5 % at μ=2. These panels illustrate the stability of the instruments resulting from regular lamp tests and the adjustments from the maintenance and calibration campaigns (yellow lines). Dobson D101 drifted slowly between 2010–2018, while D051 and D062 were particularly stable besides the 2011 increase in D062. The weather during the 2017 calibration campaign was not fair enough for a good evaluation of the calibration status of the LKO Dobson instruments. Therefore the 2017 calibration is not taken into account in this study.
Since the Dobson intercomparison in July 2012, D051 (previously dedicated to ozone profile measurements with the Umkehr method) has also been used for total ozone measurements. Regular D051 direct sun measurements began however only in March 2013. Therefore the overlap with the reference instrument D101 lasted only 9 months before D101 went to the workshop for the automation.
For the present analysis, measurements from a pair of Dobson instruments were defined as coincident if the following criteria were met: time difference δt<300 s, air mass difference δμ<0.05 and air mass μ≤4. At LKO, the manual operation was facilitated by having the two instruments side by side on a turntable, which resulted in a systematic time difference δt between 45 and 75 s. For the automated operation, the mean δt is close to 0 s.
Data quality control
Until end of 2011, all manual measurements underwent a data quality control on a daily basis. The individual measurements were flagged based on a visual comparison of all Dobson (AD, CD wavelengths double pairs) and Brewer instruments. The meteorological parameters (e.g., global radiation, sunshine duration and rain) were also considered in this process. This approach involved subjective flagging by an experienced scientist. With the increase in the number of measurements by a factor ∼ 10 following the automation in the course of 2012, a different approach was developed. Since then, each Dobson instrument has been treated separately for the single wavelength pairs C, D, and A and for the double pairs AD and CD. In a first step, the sun duration for 10 min periods is used as additional information, and measurements in periods with less than 4 min of sun are flagged. Then the standard deviation of the 20 s R-dial records (δR) is used as a quality criterion. In the next step, an algorithm based on consecutive elimination of bad or doubtful measurements is applied for flagging. A fourth-order polynomial function of time is calculated as a proxy of the daily variation. Outliers are eliminated (flagged) one by one, with the polynomial function being recalculated after each elimination until all measurements of a day fulfill the wavelength and instrument-dependent empirically determined criteria (e.g., for D062 |poly–O3| <0.8 %, <2.0 % and <1.0 % for respectively the C, D and A pair). The 2 min measurement cycle that was adopted helps to identify these outliers based on the assumption that the total ozone abundance changes slowly over time. Therefore, two consecutive measurements must also agree within a given limit. Once these limits and convergence criteria are established, the flagging is done automatically without human intervention. However the measurements of the different instruments are still compared by visual control in order to detect malfunctions or drifts in an individual Dobson, which would then be flagged manually.
In Fig. 3, the time series 1992–2019 of the differences between coincident measurements from Dobson D062 and D101 is shown. We can observe the generally good agreement between these two sets of independent measurements. The transition period 2011–2014 from manual to automated Dobson operations stands out with larger discrepancies and variability in the differences due to the adaptations of the data acquisition system and of the measuring program. Regular calibration campaigns in conformity with the Dobson network procedures which state a 4–5-year calibration cycle are marked in Fig. 3 by the black arrows.
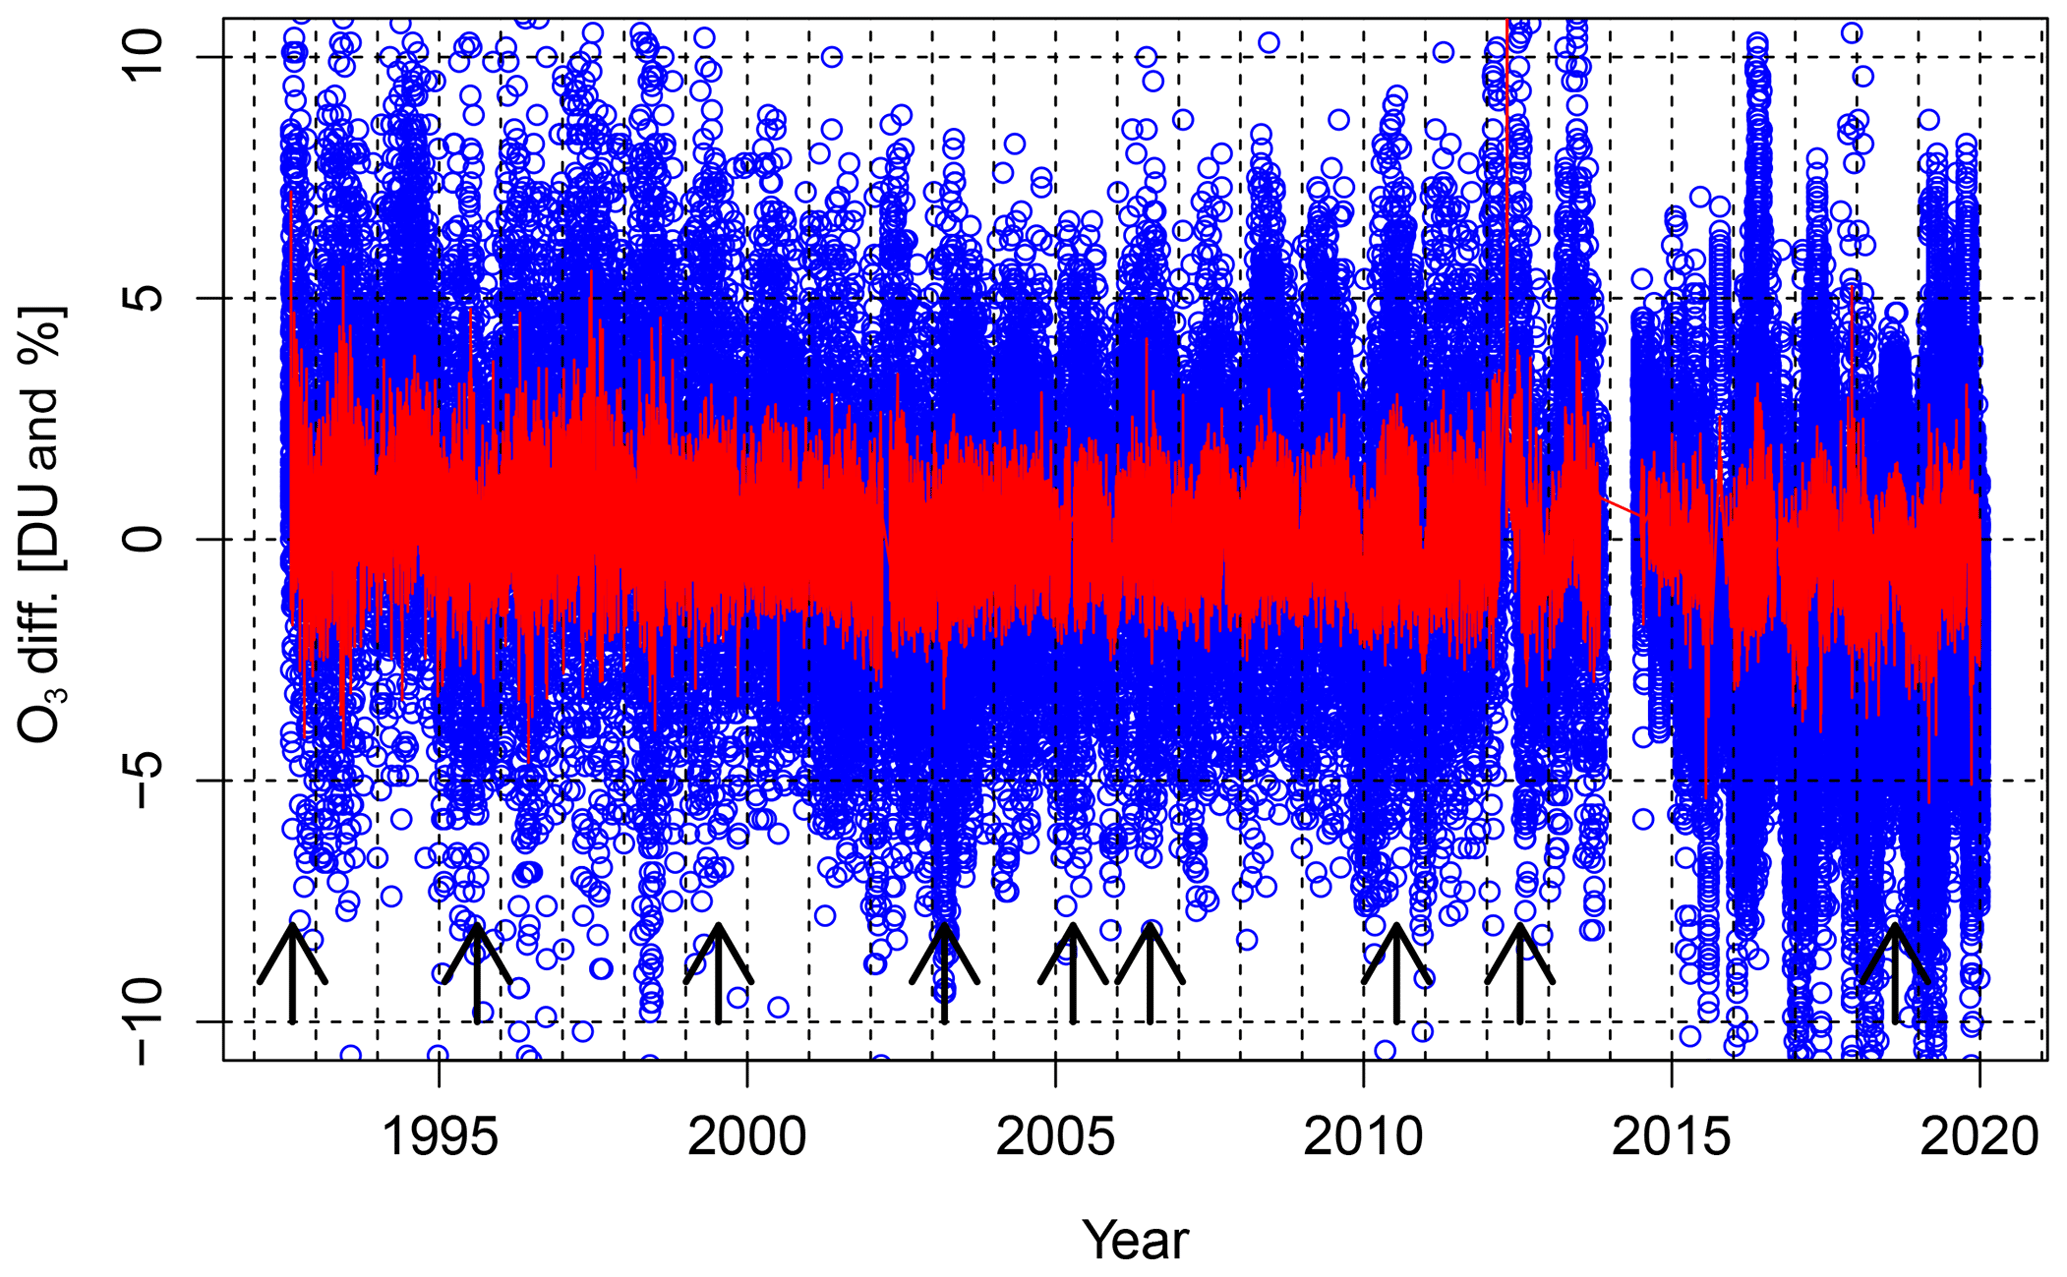
Figure 3Time series of the differences between individual coincident measurements of the Dobson instruments D062 and D101 over the period 1992–2019. Blue: difference D062 − D101 in Dobson units [DU]. Red: difference D062 − D101 D101 in percent. Black arrows indicate the calibration and maintenance campaigns.
Different time periods are considered as defined by the type of operation (manual vs. automated) and the location of the instruments (Arosa vs. Davos):
-
1992–2012 – manual vs. manual operation of collocated Dobson instruments (MMC) at LKO;
-
2012–2013 – manual vs. automated operation of collocated Dobson instruments (MAC) at LKO;
-
2013–2019 – automated vs. automated operation of collocated Dobson instruments (AAC) at LKO or Davos;
-
2016–2019 – automated vs. automated operation of distant Dobson instruments (AAD).
Table 2Median differences of coincident data averaged over the whole data set for the four subperiods. P2.5th and P97.5th are respectively the 2.5th and 97.5th percentiles of the sample, and IPR is the range between them.
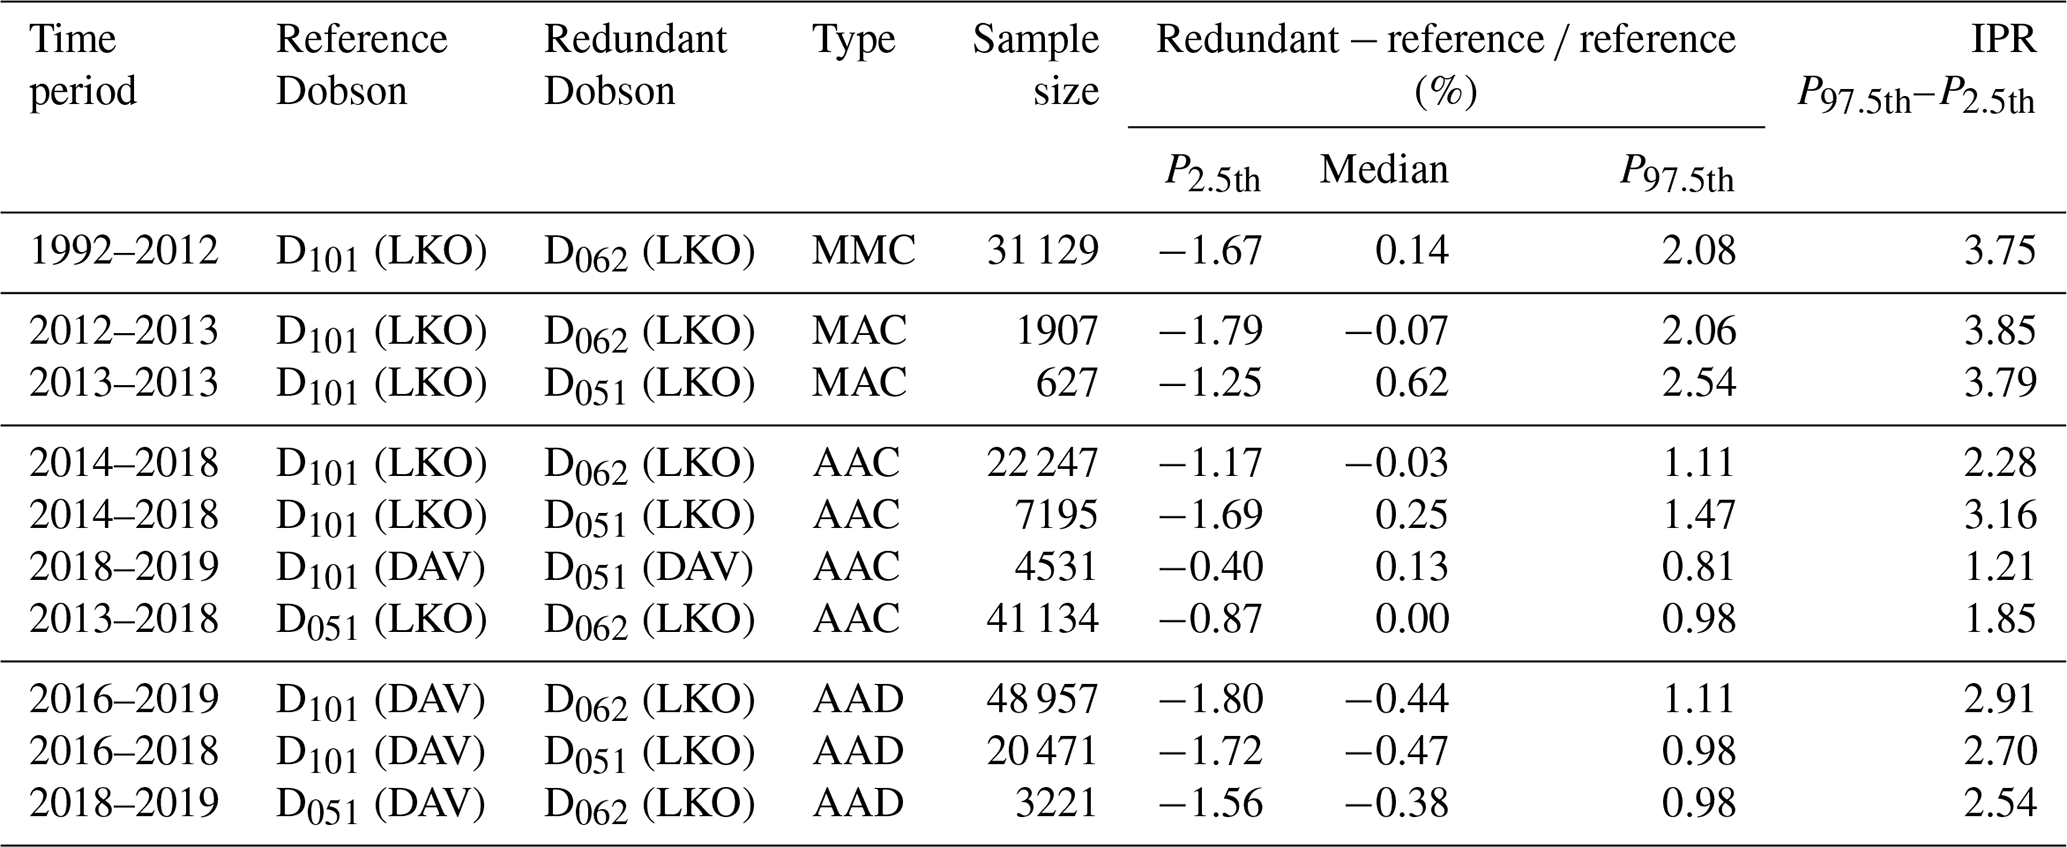
Table 2 shows the statistics of the observed differences for these different periods of operation of the Dobson instruments. Since there are three instruments and two locations, different cases for a given period are present in Table 2. In the MMC 20-year period, only D101 and D062 were used for total ozone measurements. The median difference is 0.14 % with a 97.5th–2.5th inter-percentile range (IPR97.5th–2.5th) slightly below 4 %. The two instruments were in very good agreement with no significant difference. Considering an average of 250 sunny days a year in Arosa, the 31 129 data points correspond to six to seven coincident observations per day. On the relatively short MAC transition period, automated D062 and D051 were compared to manual D101. For the pair D101–D062 the results are very similar to the MMC case, but for the pair D101–D051 a non significant bias of ∼ 0.6 % is observed. The AAC comparison period shows an increase in the sample sizes by a factor of ∼ 10 together with a reduced IPR97.5th–2.5th and no significant differences. Finally for the AAD period, an intermediate IPR97.5th–2.5th and a non significant bias ∼ 0.4 % were found.
In Stübi et al. (2017a), an analysis of the daily Brewer data to discern the mid-to-long-term variations of the differences and the short-term random fluctuations of coincident measurements was introduced. This was an alternative method to the one introduced by Fioletov et al. (2005) to study the stability of the Toronto Brewer reference triad. Recently León-Luis et al. (2018) published an analysis of the Izaña Brewer triad using both approaches, and they concluded that results are similar for the two analysis methods. As illustrated in Fig. 4, the analysis of Stübi et al. (2017a) involves fitting one single fourth-order polynomial function of time to both sets of measurements for the day considered. This function simulates the mean behavior of the ozone column during that day. For each instrument two parameters are calculated: first, the bias δ (in [DU]) between the polynomial function and the data subset and, second, the standard deviation σ of the measurements around the fit. The difference of the two δi, , corresponds to the mean bias between the two instruments for that day, and it is positive if values from instrument 1 are larger than those of instrument 2 (see Fig. 4). σi is a measure of the random fluctuations of each instrument, i.e., its repeatability. This approach works best with the numerous daily data available from the automated system, but it can also be applied to the manual operation. The results of the daily analysis for the different periods mentioned above are presented in the next subsections.
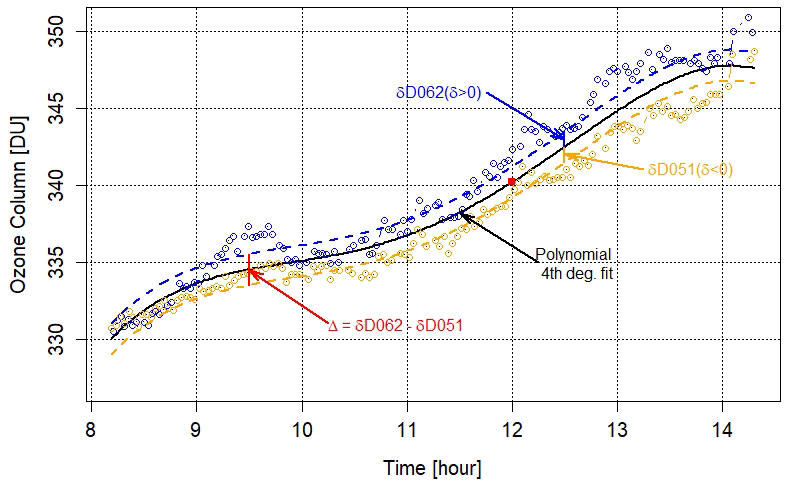
Figure 4Illustration of the daily values of coincident D062 and D051 automated Dobson measurements for 27 March 2016. The black line is the polynomial fit, and the dashed lines correspond to the bias δ062 of D062 data (blue) and the bias δ051 of D051 data (orange). The difference, Δ062–051 (red), is the bias between D062 and D051 instruments evaluated from the coincident measurements of that day.
4.1 Period of manual operation 1992–2012 (MMC period)
Figure 5 illustrates the results of the daily analysis applied to the period 1992–2012 for the coincident Dobson D101 and D062 data. In the earlier years of parallel measurements, Dobson D062 was between 0.5 % and 1 % higher than D101, but this bias has gradually decreased, and the two data sets have agreed within ±0.5 % since about the year 2000. We note a shallow seasonal cycle in the difference since 2005. The regular maintenance and calibration campaigns (black lines) did not induce noticeable breaks in the time series of differences. We also observe that the differences during the periods following calibrations are not always zero as expected. This is because each instrument was calibrated independently against the traveling standard, and differences of ±0.5 % are within the uncertainty of the calibration procedure itself and were therefore not compensated for. The repeatability σi is shown separately in the lower panel of Fig. 5. Values between 0.3 % and 0.6 % were observed for both instruments. The MMC sections of Table 3 and of Table 4 respectively summarize the statistics of the parameters Δ and σ resulting from the daily analysis. The mean monthly median differences Δ are not significantly different from zero, and the IPR97.5th–2.5th is 1.7 %. The repeatability around ∼ 0.4 % (0.3 %–0.7 %) for these two manually operated Dobson instruments is similar and probably varied depending on the operator's experience and skill. These numbers are our reference metrics for comparing results of manual and automated observations of the Dobson instruments in the next sections.
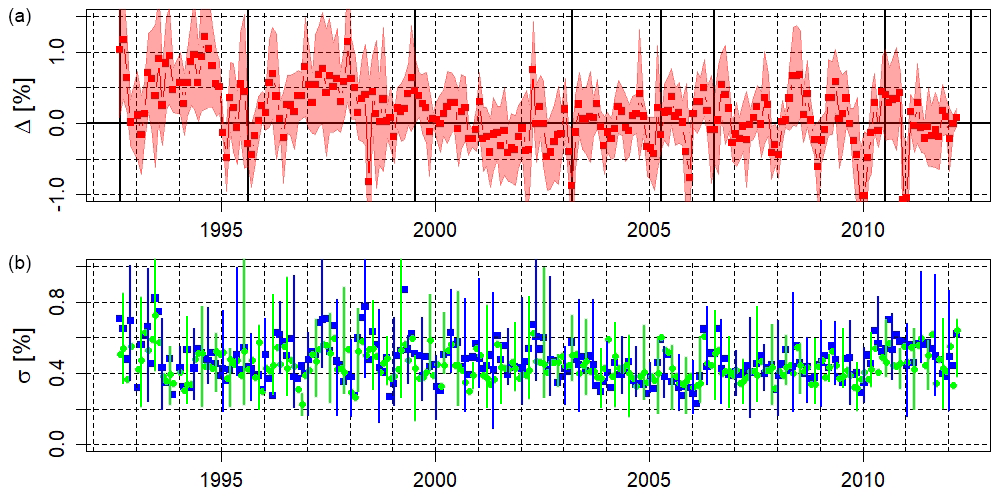
Figure 5Daily analysis results: time series of the monthly median of the relative difference (a) and the individual σ (b) between coincident measurements of the Dobson instruments D062 and D101 over the period 1992–2012. Calibration campaigns are denoted by the black lines. The shading and the error bars are for the IPR97.5th–2.5th interval.
Table 3Mean monthly medians of parameters Δ for the four subperiods.
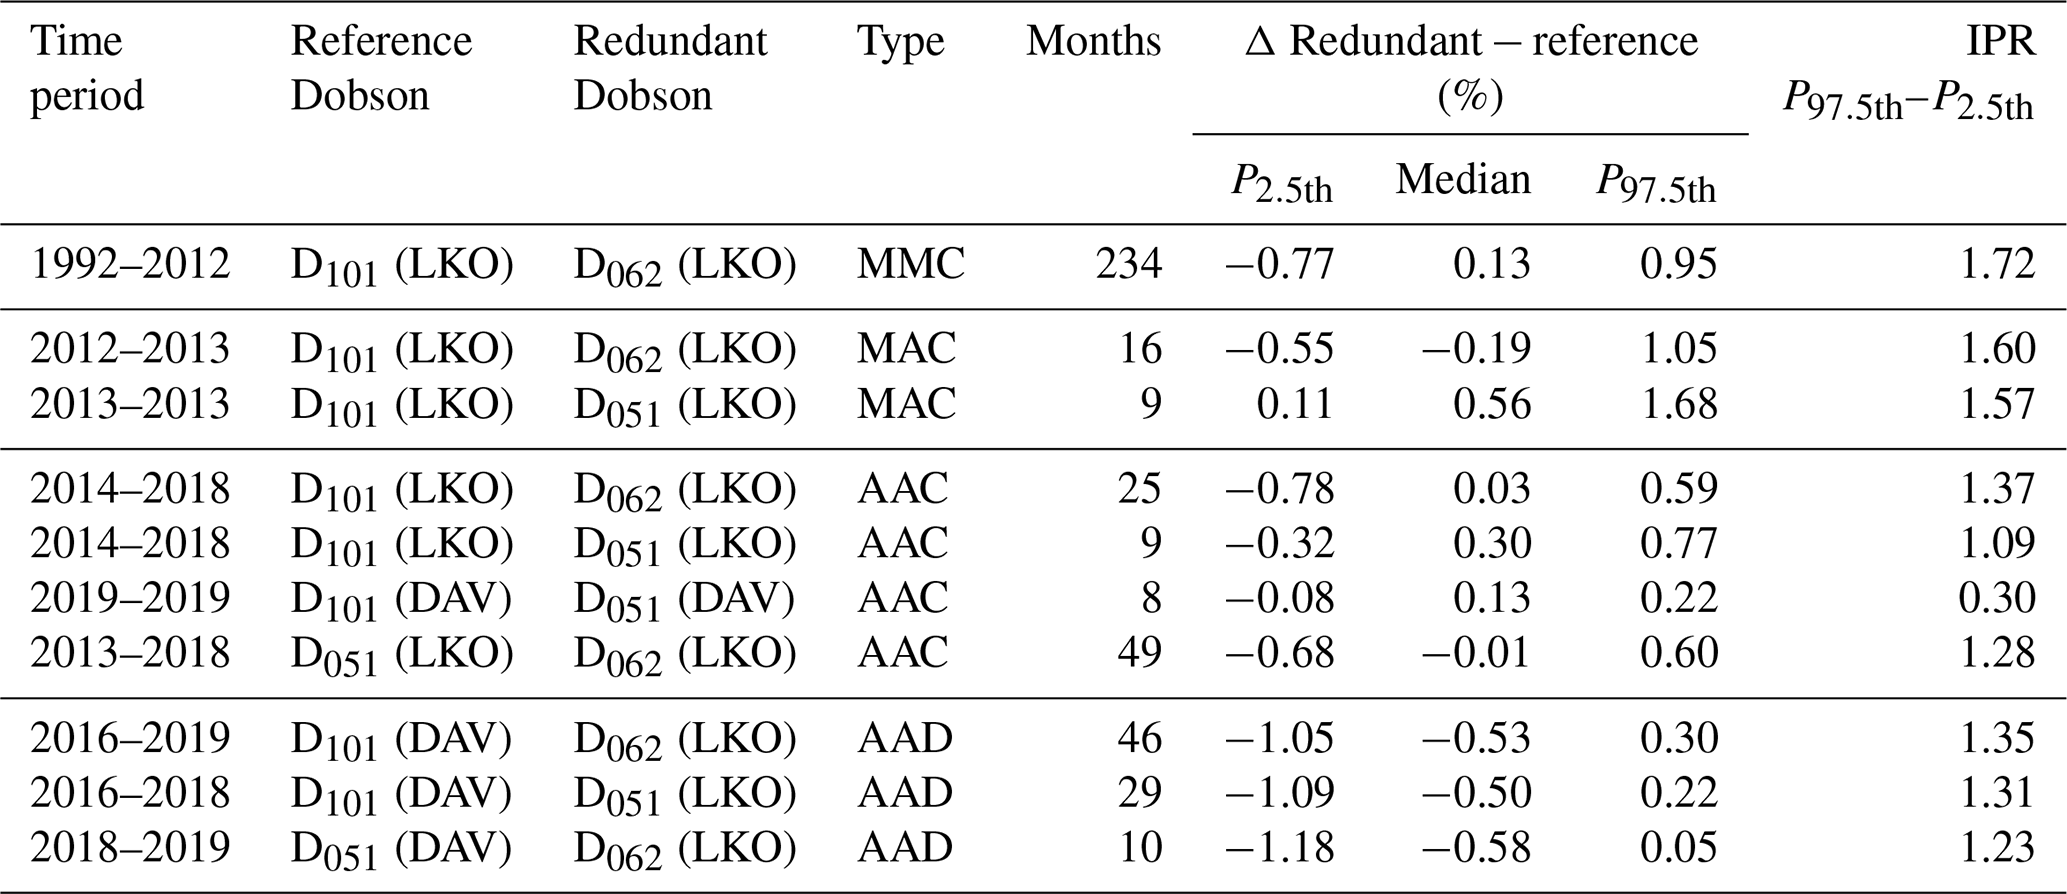
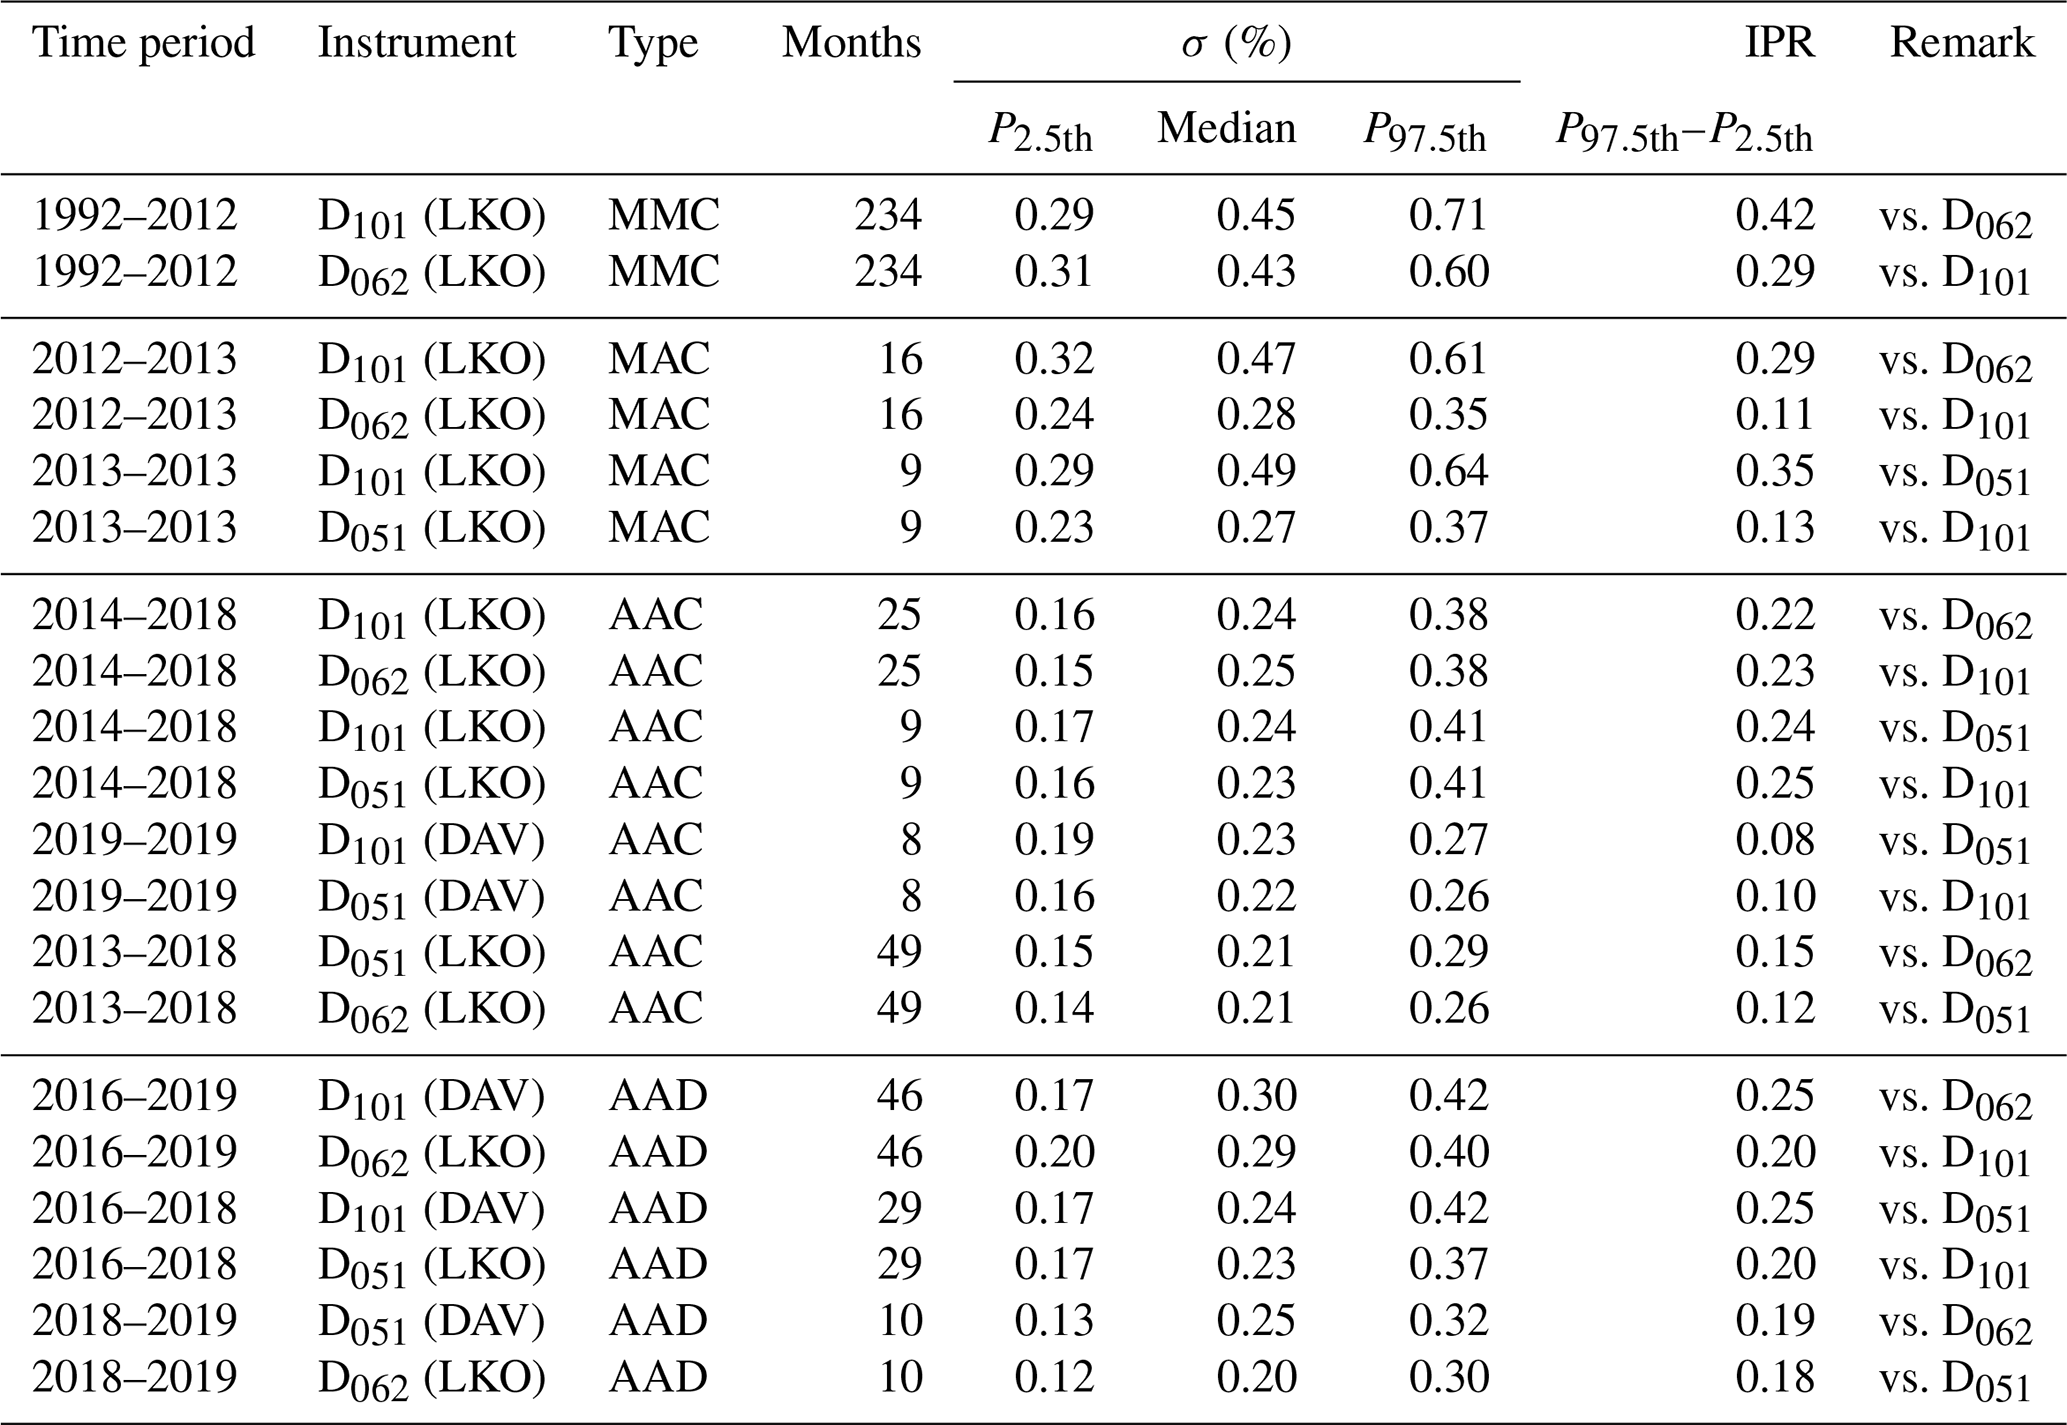
Table 4Mean monthly median of the parameters σi for the four subperiods.
4.2 Period of manual vs. automated Dobson operation (MAC period)
Over the 1.5-year period, while the data acquisition and measurement program for automatic operation were developed, different interventions interrupted and perturbed the measurements repeatedly. Changes in the automated operating procedures, their timing and improvements of hardware components make the comparison between the systems challenging. It was also demanding for the operators to measure continuously to get a sufficiently large data set of coincident measurements between the manual and automated instruments. During the Dobson intercomparison campaign in July 2012, D051 was also calibrated for ozone column measurements. Since March 2013, weather permitting, D051 direct sun measurements have been recorded outside the higher-priority Umkehr measurement periods. Therefore fewer coincident ozone column measurements of instruments D051 and D101 were recorded. Figure 6 presents the daily values for the period 2012–2013 of Δ062–101 (red) and Δ051–101 (black) in the upper panel and the σi values in the lower panel. The increase in the differences in summer 2013 suggests a drift of the Dobson D101 instrument since the bias is similar for the two other instruments. However in March 2013, a change of the azimuth control system was introduced, and interference generated by this new system affected the measurements negatively. This problem was brought to light and solved in July 2013. In the first half of this MAC period, D101 was ∼ 0.5 % higher than D062, and by mid-2013 the three instruments agree. The lower panel shows the improvement of the data quality with a significant decrease in the random fluctuations: the automated instruments (D062 green and D051 orange) yield values around ∼ 0.3 %, while the manually operated instrument (D101 blue and light blue) is closer to ∼ 0.6 %. In Fig. 7, the monthly medians of Δ062–101, Δ051–101 and the σi are shown. With the exception of the period April–June 2013, the mean bias between the manual and automated instruments is within ±0.6 %, and the repeatability of the automated Dobson is significantly reduced in comparison to the manually operated instrument.
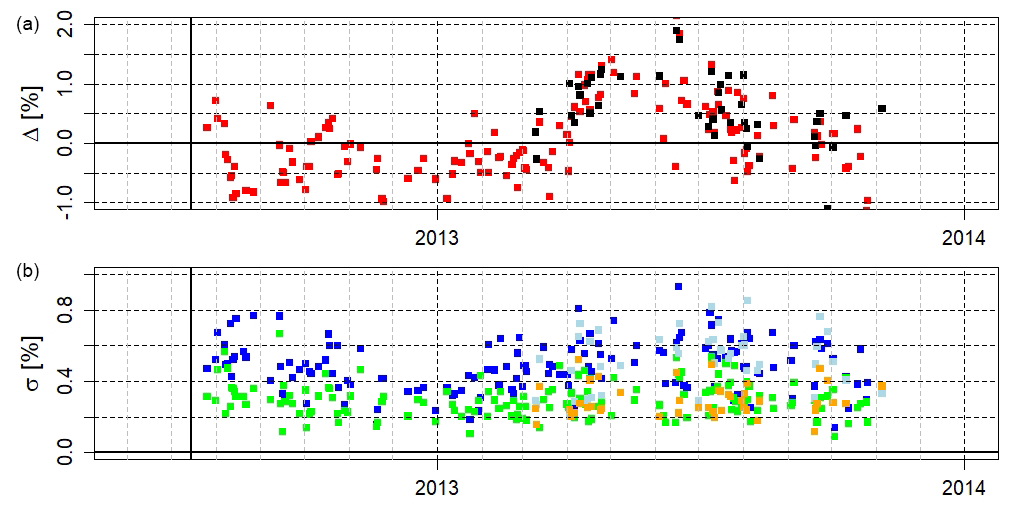
Figure 6(a) 2012–2013 time series of Δ062–101 (red) derived from coincident measurements of D101 (manual) and D062 (automated) and Δ051–101 derived from coincident measurements of D101 (manual) and D051 (automated) for 2013 (black). (b) Time series of σi of D101 (blue and light blue), D062 (green) and D051 (orange).
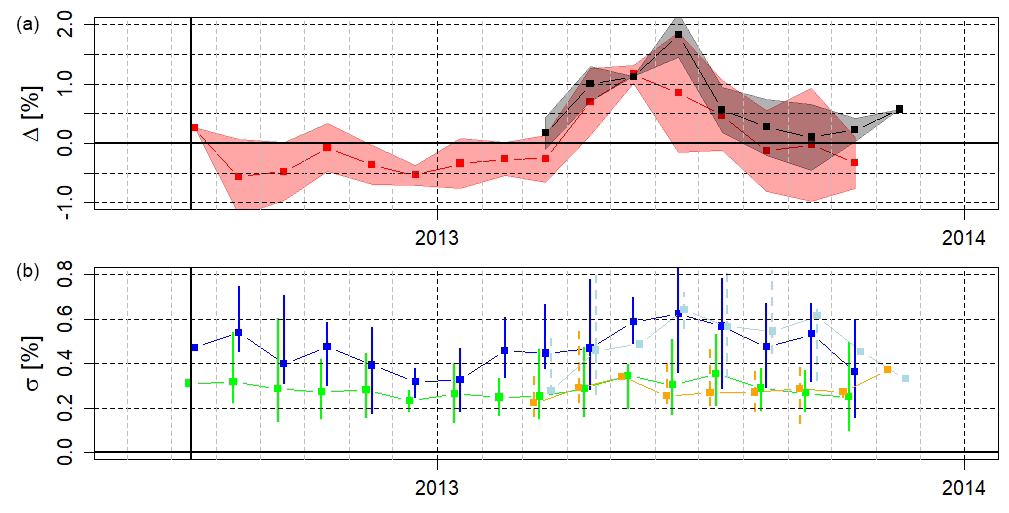
Figure 7(a) Time series of the monthly median of Δ062–101 (red) and Δ051–101 (black). (b) Time series of the monthly median of σi of D101 (blue and light blue), D062 (green) and D051(orange). The shading and the error bars correspond to the inter-percentile range IPR97.5th–2.5th of the various parameters.
Lines 2 and 3 in Table 3 show that D101 data are on average 0.19 % larger than D062 data. However, we are looking at a bimodal distribution due to the April–June 2013 period and the unevenly distributed measurements over the relatively short time period considered. Similarly, the positive value of Δ051–101=0.56 % is dominated by the spring 2013 period and the reduced sample of coincident measurements.
The 2012–2013 MAC comparison period shows that the agreement between manual and automated Dobson instruments is consistent and reproducible. Improved repeatability and the larger number of daily data are two of the prominent advantages of the automation.
4.3 Period of automated vs. automated collocated Dobson operation (AAC period)
D101 automation was achieved by July 2014, and the period of intensive comparison between collocated automated Dobson instruments started. The data set for the pair of instruments D101 and D062 covers the period July 2014–December 2015 and short periods in 2017 and in 2018. The second data set for the pair D051 and D062 covers the years 2013–2018. Since the relocation of D051 to Davos at the end of 2018, D101 and D051 have been collocated there for a new AAC period. Similar to Fig. 7, Fig. 8 compares the automated measurements of the three pairs of collocated Dobson instruments: D062–D101, D051–D101 and D062–D051. In March 2017, D101 was back to Arosa after a transfer to Germany to characterize its slit function (Köhler et al., 2018; Stübi et al., 2020). Again for the July–August periods 2017 and 2018, D101 was collocated with D062 and D051 in Arosa for two calibration and maintenance campaigns. These transfers could have altered the instrument response, but this is difficult to assess from these relatively short comparison periods. The monthly averages for these periods are also less representative since the sample is limited to only a few days in some cases. Notwithstanding, most data points lie within a ±1 % interval with periods of lesser agreement. Overall, the period 2016–2018 shows a convergence of the differences in the ±0.5 % range associated with the improvement and tuning of the Dobson instruments' control system. The time series of Δ062–101 (red strip in Fig. 8) is mostly within the ±0.5 % range except at the end of 2015 where D062 seems to be slightly lower. The Δ062–051 (blue strip) shows also a deviation at the beginning of 2016 but converges to the ±0.5 % range afterwards. The 2013–2014 period of the Δ062–051 time series indicates that the automated systems were not yet fully stable and that the bias could change by ±0.5 % over a year time period. As shown in the AAC section of Table 3, the Δ for the difference pair comparisons are not significantly different from zero except for the pair D051–D101 at LKO. As evidenced in Fig. 8, the 9 months between 2014–2018 mentioned in the table were not from a contiguous time period but typically reflect observations after D101 displacements. In contrast, in the 2019 period of collocation at Davos and after the 2018 calibration campaign, both instruments agree very well with an IPR97.5th–2.5th of ∼ 0.3 %. The lower panel of Fig. 8 suggests a repeatability of the three Dobson instruments of around 0.2 % with an IPR97.5th–2.5th between 0.08 % and 0.25 %. The values of σi summarized in Table 4 (lines 7–14) are surprisingly similar for the lower 2.5th percentiles (0.15 %–0.19 %) and the medians (0.20–0.25 %) of total ozone values. The 97.5th percentiles are on the order of 0.3 %–0.4 %.
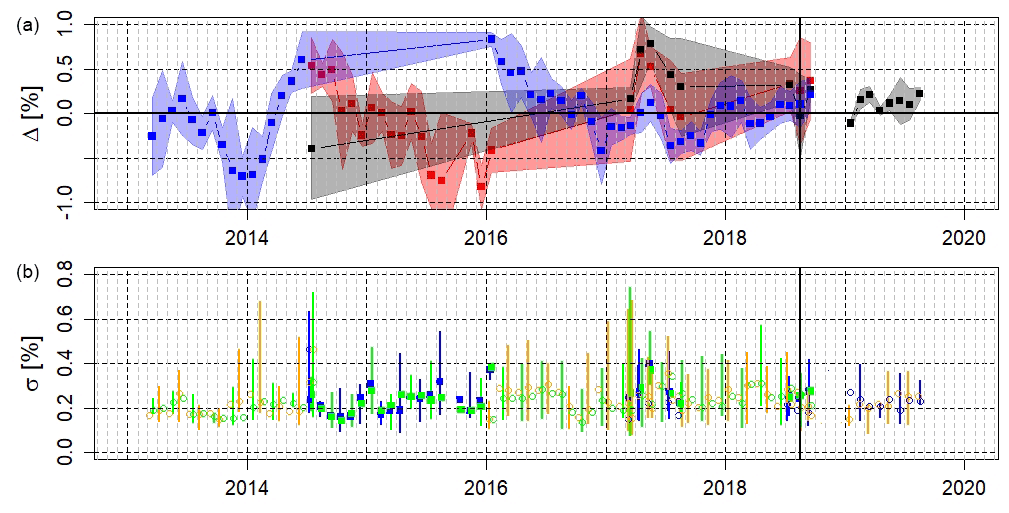
Figure 8(a) Time series of the monthly median differences (%) between pairs of collocated Dobson instruments at Arosa over the period 2013–2019: Δ062–101 (red), Δ062–051 (blue) and Δ051–101 (black). (b) Time series of σi monthly medians: σ101 (blue), σ062 (green) and σ051 (orange). The shading and the error bars (plot every 2 months for clarity) denote the inter-percentile range IPR97.5th–2.5th.
The results presented up to this point underline the stability and repeatability of the automated Dobson measurements.
4.4 Period of automated vs. automated distant Dobson operation 2016–2019 (AAD period)
In January 2016, the D101 instrument was relocated to Davos with a setup similar to the one at Arosa. Since September 2018, the D051 instrument has also been relocated to Davos. The line-of-sight distance between Arosa and Davos is 11 km. The sites are sufficiently close to suggest a similar large-scale stratospheric ozone regime. However, the altitude difference between the two observatories is 250 m, which could translate into a slightly different total ozone column. Thus, total column ozone values at Davos are expected to be comparable or slightly larger than at Arosa. Since 2016, the data acquisition and computer-controlled operation have had minimal changes compared to the previous period of developments. Similar to the previous figures, Fig. 9 compares the Dobson pairs in terms of Δ and σ for the distant instruments. The Δ062–101 time series (red strip) is now mostly within −0.5 %±0.5 %, which could be an indication of an average offset between the two stations of the order of ∼ 0.5 %. The most recent data of 2019 tend to exhibit a smaller offset as also indicated by the Δ062–051 time series (blue strip). The Δ051–101 time series (black strip) has a very similar pattern which corroborates the agreement seen in Fig. 8 between D062 and D051. Table 3 (lines 8–10) shows that the mean ozone column difference between Davos and Arosa is −0.53 % ∈ [−1.05 %, 0.30 %] for the D062–D101 pair, −0.50 % ∈ [−1.09 %, 0.22 %] for D051–D101 pair and −0.58 % ∈ [−1.18 %, 0.05 %] for the D062–D051 pair. In the lower panel of Fig. 9, the variations of σi appear substantially larger than for the collocated cases. This is not too surprising since the two stations could certainly have different atmospheric conditions which influence the daily variations of the ozone column measured by the two distant instruments. In some cases, a time delay can be observed in the ozone variations at the two sites for example when a front is passing over the area (not shown). Attempts to systematically correct these time shifts did not improve the results significantly so they were not implemented. The 97.5th percentiles of the σ of the Dobson instruments at different locations reached 0.6 %–0.8 % mostly in winter. Such values were less frequent in the case of collocated instruments (Fig. 8). However, these observed larger σi variations do not significantly affect the monthly averages in Table 4 for the AAD cases, which were in the range of 0.1 %–0.4 %.
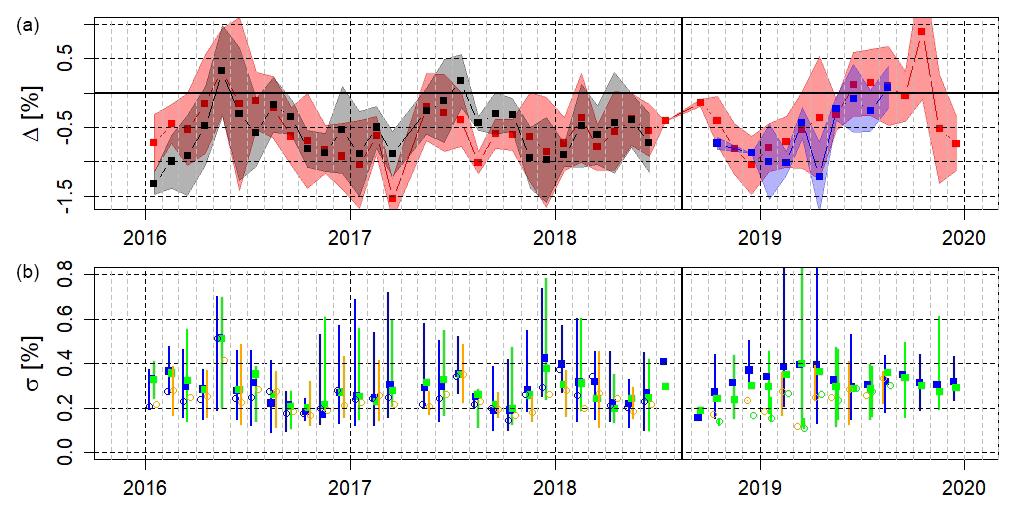
Figure 9(a) Time series of the monthly median differences (%) between pairs of Dobson measurements at two different sites over the period 2016–2019 with D062 at Arosa, D101 at Davos, and D051 at Arosa before September 2018 and at Davos after: Δ062–101 (red), Δ051–101 (black) and Δ062–051 (blue). Lower panel: time series of monthly medians of σi: σ101 (blue), σ062 (green) and σ051 (orange). The shading and the error bars indicate the inter-percentile range IPR97.5th–2.5th.
4.5 Seasonal cycle
For almost all optical measuring systems, a stray light effect is present with more or less influence on the measured values. The Dobson and Brewer sun spectrophotometers are no exception to this problem. The double-monochromator Brewer instruments are known to be free of a major stray light bias, but the single-monochromator Brewer as well as the Dobson instruments are affected (Moeini et al., 2019; Karppinen et al., 2015). The larger the ozone slant path (OSP = ozone amount * air mass) the larger the stray light effect, because the signal at the shorter wavelengths decreases more rapidly and gets to the noise level. As the OSP is naturally seasonally dependent and the stray light effect is instrument dependent, it is of interest to analyze a possible bias due to the OSP. As noted in Sect. 4.1, a seasonal cycle was observed in the 2005–2010 period, and the upper panel of Fig. 9 also shows a similar tendency. The result of the seasonal analysis of the Δ differences is presented in Fig. 10. The colored strips denoting the IPR97.5th–2.5th largely cover the zero line, but the lines of medians show a curvature with negative values in winter and positive values in summer. This is more pronounced for the AAD cases of the D062–D101 pair (in blue), where the amplitude of ∼ 0.8 % is twice as large as for the MMC cases (in red). The D051–D101 pair exhibits monthly differences that are more random. The 2018 intercomparison revealed an OSP-dependent bias between the European Dobson traveling standard D064 and both D101 and D051 but showed no such bias between D064 and D062. Without being firmly conclusive, the seasonal analysis suggests a possible contribution of a stray-light-induced bias caused by the D101 and/or D051 instrument.
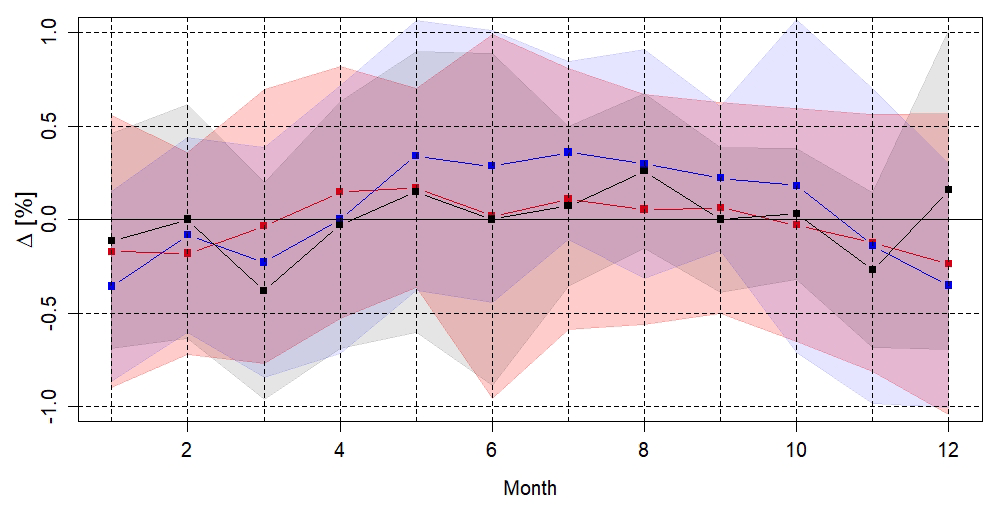
Figure 10Annual cycle of the median differences of Δ (%): Δ062–101 in red for subperiods MMC and in blue for subperiod AAD; Δ051–101 in black for subperiod AAD.
In Sect. 4, the analysis of coincident measurements of three Dobson instruments from Arosa LKO is presented for four different configurations named MMC, MAC, AAC and AAD that refer to manual (M), automatic (A), collocated (C) or distant (D) operation of the instruments. The method used to separate the mid- to long-term systematic biases between instruments and the short-term random variations associated with each instrument were first presented in Stübi et al. (2017a). This method allowed us to reduce by half the overall global bias range from typically IPR97.5th–2.5th∼ 3 % (Table 2) down to IPR97.5th–2.5th∼ 1.5 % (Table 3).
The multiple calibration and maintenance campaigns over the 20-year MMC period result in the good agreement between Dobson instruments D101 and D062 independently calibrated against the regional secondary standard Dobson instruments. No significant biases were observed within the uncertainty associated with manual operations and the rather limited number of daily observations. Dobson instrument D051 was dedicated to automated Umkehr measurements which made direct sun observations very difficult.
The development of the Dobson automation from scratch took a few years with periods of hardware and software changes that impacted on the measurement stability. For backup measurements, D101 continued to be manually operated in parallel to the automated D062 and D051 over the 2012–2013 period. The analysis of the relatively short (1.5-year) MAC period shows an overall good agreement albeit with subperiods of biased measurements due to a malfunctioning of the automated system. Notwithstanding, the automated instruments proved to perform equally well or even better than a manually operated instrument. Dobson D051, which was newly used also for direct sun observations of the ozone column during the MAC period, yields larger ozone values compared to the manual Dobson D101 instrument. As shown in Fig. 6 and Fig. 7, the Δ values of the D062–D101 and D051–D101 instrument pairs are similar, as are the σi values. In Table 2, the mean differences for the MAC cases are not significant considering the large IPR97.5th–2.5th∼3.8 % for the coincident D062–D101 and D051–D101 values. From the refined daily analysis, the IPR97.5th–2.5th values have been reduced to ∼1.6 % (Table 3). Even though the values of the differences for the two pairs appear to be quite different ( % vs. Δ051–101=0.56 %), they still remain close to ±0.5 %. Moreover, they represent averages of different time periods and sample lengths and should be compared with caution.
Beginning in 2014, all three Dobson instruments were ready for automated and collocated (AAC) operation. For a while, as shown in Table 1, the operating environment was still changing from time to time, and the system was subject to occasional technical glitches. Table 2 shows that the direct comparison differences for the AAC case are not significant with 10-times-larger sample sizes than in the MAC case. The daily analysis results from Table 3 confirm the excellent agreement between D062 and both D101 and D051, while the pair D101 and D051 presents a barely significant value of Δ051–101=0.30 % ∈ [−0.32 %, 0.77 %]. As mentioned in Sect. 4.3, the D051–D101 coincident data sets were recorded for three distinct periods (black symbols in Fig. 8) with reduced sample sizes and are therefore less representative. The recent 2018–2019 period of coincident measurements at Davos with a value of Δ051–101=0.13 % ∈ [−0.08 %, 0.22 %] confirms the excellent agreement between the D101 and D051 instruments. In summary, the automated Dobson systems were very reliable and reproducible during this AAC comparison period.
Considering the homogeneity and continuity of the Arosa–Davos ozone column time series, the comparison of coincident data obtained independently at the two stations is an essential part of this study. A similar analysis by Stübi et al. (2017b) considering the long-term stability and random uncertainties of the Brewer instruments found no significant differences between the Arosa and Davos sites. The analysis of the AAD period presented in Sect. 4.4 arrives at the same conclusion. Notwithstanding, the last three lines in Table 2 may indicate the possibility of a ≃ 0.4 % systematic high bias within an IPR97.5th–2.5th of 2.5–2.9 for the instruments located at Davos. The daily analysis results in Table 3 confirm these numbers with Δi values of ≃ 0.5 % but with a reduced IPR97.5th–2.5th of ∼ 1.3 %. In Stübi et al. (2017b), the authors estimated that the Arosa–Davos altitude difference of 260 m could contribute 0.25 % ± 0.15 % to the ozone column. Therefore half of the observed difference could be attributed to the longer ozone column measured from Davos. The σi values reported in Table 4 are consistent and demonstrate the benefits of automation. Manual operation of the Dobson instrument yields values of σ≃0.40 % ∈ [0.3 %, 0.7 %] on average. The automation of the operations reduced these values to σ≃0.25 % ∈ [0.15 %, 0.40 %]. These numbers are slightly lower than the corresponding Brewer values of around 0.3 %–0.4 % reported in Stübi et al. (2017a) (Table 3) and León-Luis et al. (2018) (Table 4). These values further confirm the good quality of the automated Dobson measurements.
The slight seasonal component presented in Sect. 4.5 is probably responsible for the ripples observed in Figs. 8 and 9. Even though all Dobson instruments are based on a similar design, the stray light bias is instrument dependent. An improved processing algorithm including stray light correction as presented in Moeini et al. (2019) could be applied for the Arosa–Davos data since Brewer double monochromator instruments are collocated. Recent slit function measurements of the Arosa Dobson instruments are now available from the ATMOZ project (ATMOZ Project, 2018). However, such improvements were beyond the scope of the present analysis. Similarly, the characterization of the first few kilometers of the ozone profile and its seasonal cycle in the Arosa and Davos valleys, to more accurately assess potential differences of the free troposphere ozone column above these two sites, needs to be referred to future research.
The present results based on Dobson data confirm the conclusion reported in Stübi et al. (2017b) based on Brewer data. Biases found are not statistically significant at the IPR97.5th–2.5th level and, therefore, could not be systematically compensated for. A reprocessing of the Dobson and Brewer data sets with an improved algorithm based on recent ozone cross-section values and improved stray-light correction based on better slit functions as described in Gröbner et al. (2021) could perhaps reduce the uncertainties on the biases found but would most certainly not change our conclusions. The results presented in this study are unique since no other station of the Dobson network has operated fully automated collocated Dobson instruments over a multiyear time period. Considering the importance of the Arosa time series, research will continue with a focus on trend analyses and break detection of the series both on data from Arosa (continued until February 2021) and data based on the combined Arosa–Davos time series.
The data used for this analysis are available at the WOUDC for the Dobson D101 (1992–2014) and D062 (2014–2020) instruments. The complete data sets can be requested by direct contact with the corresponding author.
RS was mainly responsible for the data analysis and the first version of the manuscript. HS was in charge of the quality control and the preparation of the data sets. JK, EMB and AH contributed to the data interpretation and revisions of the manuscript.
The authors declare that they have no conflict of interest.
We would like to thank the PMOD/WRC staff for their great support in running our instruments in their premises and for the excellent collaboration.
This paper was edited by Alexander Kokhanovsky and reviewed by two anonymous referees.
Albrecht, F. and Parker, C. F.: Healing the Ozone Layer: The Montreal Protocol and the Lessons and Limits of a Global Governance Success Story, Oxford Scholarship Online Book, Great Policy Successes, edited by: Hart, P. and Compton, M., https://doi.org/10.1093/oso/9780198843719.003.0016, 2019. a
ATMOZ Project: Traceability for Atmospheric Total Column Ozone, final report ENV59, available at: https://www.euramet.org/research-innovation/search-research-projects/ (last access: 31 May 2021)), 2018. a, b
Ball, W. T., Alsing, J., Mortlock, D. J., Staehelin, J., Haigh, J. D., Peter, T., Tummon, F., Stübi, R., Stenke, A., Anderson, J., Bourassa, A., Davis, S. M., Degenstein, D., Frith, S., Froidevaux, L., Roth, C., Sofieva, V., Wang, R., Wild, J., Yu, P., Ziemke, J. R., and Rozanov, E. V.: Evidence for a continuous decline in lower stratospheric ozone offsetting ozone layer recovery, Atmos. Chem. Phys., 18, 1379–1394, https://doi.org/10.5194/acp-18-1379-2018, 2018. a
Ball, W. T., Alsing, J., Staehelin, J., Davis, S. M., Froidevaux, L., and Peter, T.: Stratospheric ozone trends for 1985–2018: sensitivity to recent large variability, Atmos. Chem. Phys., 19, 12731–12748, https://doi.org/10.5194/acp-19-12731-2019, 2019. a
Basher, R. E.: Review of the Dobson spectrophotometer and its accuracy, WMO Global Ozone Research and Monitoring, Project, Report No. 13, Geneva, Switzerland, 1982. a
Bass, A. M. and Paur, R. J.: The ultraviolet cross-sections of ozone: I. The measurements, in: Atmospheric Ozone, Proceedings of the Quadrennial Ozone Symposium, held in Halkidiki, Greece, 3–7 September 1984, edited by: Zerefos, C. S. and Ghazi, A., D. Reidel, Norwell, Mass., USA, 606–610, https://doi.org/10.1007/978-94-009-5313-0_120, 1985. a
Brönnimann, S., Staehelin, J., Farmer, S. F. G., Cain, J. C., Svendry, T., and Svenøe, T.: Total ozone observations prior to the IGY. I: A history, Q. J. Roy. Meteor. Soc., 129, 2797–2817, 2003. a
Christodoulakis, J., Varotsos, C., Cracknell, A. P., Tzanis, C., and Neofytos, A.: An assessment of the stray light in 25 years of Dobson total ozone data at Athens, Greece, Atmos. Meas. Tech., 8, 3037–3046, https://doi.org/10.5194/amt-8-3037-2015, 2015. a
Dobson, G. M. B.: Forty Years' Research on Atmospheric Ozone at Oxford: a History, Appl. Optics, 7, 387–405, 1968. a
Dütsch, H. U.: An update of the Arosa ozone series to the present using a statistical instrument calibration, Q. J. Roy. Meteor. Soc., 110, 1079–1096, 1984. a
Evans, R. D.: Operations Handbook–Ozone Observations with a Dobson Spectrophotometer, rev. ed., Rep. 183, Global Atmosphere Watch, World Meteorological Organization, Geneva, Switzerland, 2008. a, b, c
Fioletov, V. E., Kerr, J. B., McElroy, C. T., Wardle, D. I., Savastiouk, V., and Grajnar, T. S.: The Brewer reference triad, Geophys. Res. Lett., 32, L20805, https://doi.org/10.1029/2005GL024244, 2005. a
Gröbner, J., Schill, H., Egli, L., and Stübi, R.: Consistency of total column ozone measurements between the Brewer and Dobson spectroradiometers of the LKO Arosa and PMOD/WRC Davos, Atmos. Meas. Tech., 14, 3319–3331, https://doi.org/10.5194/amt-14-3319-2021, 2021. a
Hoegger, B., Levrat, D., Staehelin, J., Schill, H., and Ribordy, P.: Recent developments of the Light Climatic Observatory–Ozone measuring station of the Swiss Meteorological Institute (LKO) at Arosa, J. Atmos. Terr. Phys., 54, 497–498, 1992. a
Janssen, C., Elandaloussi, H., and Gröbner, J.: A new photometric ozone reference in the Huggins bands: the absolute ozone absorption cross section at the 325 nm HeCd laser wavelength, Atmos. Meas. Tech., 11, 1707–1723, https://doi.org/10.5194/amt-11-1707-2018, 2018. a
Karppinen, T., Redondas, A., García, R. D., Lakkala, K., McElroy, C. T., and Kyrö, E.: Compensating for the Effects of Stray Light in Single-Monochromator Brewer Spectrophotometer Ozone Retrieval, Atmos.-Ocean, 53, 66–73, https://doi.org/10.1080/07055900.2013.871499, 2015. a, b
Kerr, J. B. and McElroy C. T.: Total ozone measurements made with the Brewer ozone spectrophotometer during STOIC, J. Geophys. Res., 100, 9225–9230, https://doi.org/10.1029/94JD02147, 1995. a
Kerr, J. B., McElroy, C. T., Olafson, R. A.: Measurements of total ozone with the Brewer spectrophotometer, Proc. of the Quadr. Ozone Symp., 4–9 August, 1980, Boulder, CO, USA, edited by: London, J., Natl. Cent. for Atmos. Res., 74–79, 1981. a
Köhler, U., Nevas, S., McConville, G., Evans, R., Smid, M., Stanek, M., Redondas, A., and Schönenborn, F.: Optical characterisation of three reference Dobsons in the ATMOZ Project – verification of G. M. B. Dobson's original specifications, Atmos. Meas. Tech., 11, 1989–1999, https://doi.org/10.5194/amt-11-1989-2018, 2018. a, b
Komhyr, W. D.: Operations handbook – Ozone observations with a Dobson spectrophotometer, Global Ozone Research and Monitoring, Project Report 6, WMO, Geneva, Switzerland, 1980. a
Komhyr, W. D., Grass, R. D., and Leonard, R. K.: Dobson spectrophotometer 83: A standard for total ozone measurements, J. Geophys. Res., 94, 9847–9861, 1989. a, b
León-Luis, S. F., Redondas, A., Carreño, V., López-Solano, J., Berjón, A., Hernández-Cruz, B., and Santana-Díaz, D.: Internal consistency of the Regional Brewer Calibration Centre for Europe triad during the period 2005–2016, Atmos. Meas. Tech., 11, 4059–4072, https://doi.org/10.5194/amt-11-4059-2018, 2018. a, b
Malicet, J., Daumont, D., Charbonnier, J., Parisse, C., Chakir, A., and Brion, J.: Ozone UV spectroscopy. II. Absorption crosssections and temperature dependence, J. Atmos. Chem., 21, 263–273, https://doi.org/10.1007/BF00696758, 1995. a
Moeini, O., Vaziri Zanjani, Z., McElroy, C. T., Tarasick, D. W., Evans, R. D., Petropavlovskikh, I., and Feng, K.-H.: The effect of instrumental stray light on Brewer and Dobson total ozone measurements, Atmos. Meas. Tech., 12, 327–343, https://doi.org/10.5194/amt-12-327-2019, 2019. a, b, c, d
Pawson, S., Steinbrecht, W., Charlton-Perez, A. J., Fujiwara, M., Karpechko, A. Y., Petropavlovskikh, I., Urban, J., and Weber, M.: Update on global ozone: Past, present, and future, chap. 2, in: Scientific Assessment of Ozone Depletion: 2014, Global Ozone Research and Monitoring Project – Report No. 55, World Meteorological Organization, Geneva, Switzerland, 2014. a
Perl, G. and Dütsch, H. U.: Die 30-jährige Aroser Ozonmessreihe, Ann. Schweiz. Meteor. Zentralanstalt, 8, p. 10, 1958. a
Petropavlovskikh, I., Evans, R., McConville, G., Miyagawa, K., and Oltmans, S.: Effect of the outof-band stray light on the retrieval of the Umkehr Dobson ozone profiles, Int. J. Remote Sens., 30, 6461–6482, https://doi.org/10.1080/01431160902865806, 2009. a
Räber, J. A.: An Automated Dobson Spectrophotometer, Pure Appl. Geophys., (1973/V-VII), 106–108, 1973. a
Redondas, A., Evans, R., Stuebi, R., Köhler, U., and Weber, M.: Evaluation of the use of five laboratory-determined ozone absorption cross sections in Brewer and Dobson retrieval algorithms, Atmos. Chem. Phys., 14, 1635–1648, https://doi.org/10.5194/acp-14-1635-2014, 2014. a
Scarnato, B., Staehelin, J., Peter, T., Gröbner, J., and Stübi, R.: Temperature and slant path effects in Dobson and Brewer total ozone measurements, J. Geophys. Res., 114, D24303, https://doi.org/10.1029/2009JD012349, 2009. a
Scarnato, B., Staehelin, J., Stübi, R., and Schill, H.: Long-term total ozone observations at Arosa (Switzerland) with Dobson and Brewer instruments (1988–2007), J. Geophys. Res., 115, D13306, https://doi.org/10.1029/2009JD011908, 2010. a
Serdyuchenko, A., Gorshelev, V., Weber, M., Chehade, W., and Burrows, J. P.: High spectral resolution ozone absorption cross-sections – Part 2: Temperature dependence, Atmos. Meas. Tech., 7, 625–636, https://doi.org/10.5194/amt-7-625-2014, 2014. a
Solomon, S.: Stratospheric ozone depletion: A review of concepts and history, Rev. Geophys., 37, 275–316, 1999. a
SPARC/IO3C/GAW: SPARC/IO3C/GAW Report on Long-term Ozone Trends and Uncertainties in the Stratosphere, edited by: Petropavloskick, I., Godin-Beekmann, S., Hubert, D., Damadeo, R., Hassler, B., and Sofieva, V., SPARC Report No. 9, GAW Report No. 241, WCRP-17/2018, https://doi.org/10.17874/f899e57a20b, 2019. a
Staehelin, J. and Viatte, P.: The Light Climatic Observatory Arosa: The story of the world's longest atmospheric ozone measurements, Scientific Report MeteoSwiss and Institute of Atmospheric and Climate Science, 104, 243 pp., https://doi.org/10.18751/PMCH/SR/104.Ozon/1.0, 2019. a
Staehelin, J., Renaud, A., Bader, J., McPeters, R., Viatte, P., Hoegger, B., Bugnion, V., Giroud, M., and Schill, H.: Total ozone series at Arosa (Switzerland): Homogenization and data comparison, J. Geophys. Res., 103, 5827–5842, https://doi.org/10.1029/97JD02402, 1998. a
Staehelin, J., Viatte, P., Stübi, R., Tummon, F., and Peter, T.: Stratospheric ozone measurements at Arosa (Switzerland): history and scientific relevance, Atmos. Chem. Phys., 18, 6567–6584, https://doi.org/10.5194/acp-18-6567-2018, 2018. a
Stübi, R., Schill, H., Klausen, J., Vuilleumier, L., and Ruffieux, D.: Reproducibility of total ozone column monitoring by the Arosa Brewer spectrophotometer triad, J. Geophys. Res.-Atmos., 122, 4735–4745, https://doi.org/10.1002/2016JD025735, 2017a. a, b, c, d, e
Stübi, R., Schill, H., Klausen, J., Vuilleumier, L., Gröbner, J., Egli, L., and Ruffieux, D.: On the compatibility of Brewer total column ozone measurements in two adjacent valleys (Arosa and Davos) in the Swiss Alps, Atmos. Meas. Tech., 10, 4479–4490, https://doi.org/10.5194/amt-10-4479-2017, 2017b. a, b, c, d, e
Stübi, R., Schill, H., Klausen, J., Maillard Barras, E., and Haefele, A.: A fully Automated Dobson Sun Spectrophotometer for total column ozone and Umkehr measurements, Atmos. Meas. Tech. Discuss. [preprint], https://doi.org/10.5194/amt-2020-391, in review, 2020. a, b, c, d
WMO (World Meteorological Organization): Scientific Assessment of Ozone Depletion: 2018, Global Ozone Research and Monitoring, Project-Report No. 58, Geneva, Switzerland, 588 pp., 2018. a