the Creative Commons Attribution 4.0 License.
the Creative Commons Attribution 4.0 License.
 | 09 Jun 2021
Comparison of formaldehyde measurements by Hantzsch, CRDS and DOAS in the SAPHIR chamber
Marvin Glowania
Franz Rohrer
Hans-Peter Dorn
Andreas Hofzumahaus
Frank Holland
Astrid Kiendler-Scharr
Andreas Wahner
Three instruments that use different techniques to measure gaseous formaldehyde (HCHO) concentrations were compared in experiments in the atmospheric simulation chamber SAPHIR at Forschungszentrum Jülich. One instrument (AL4021, Aero-Laser GmbH) detects HCHO using the wet-chemical Hantzsch reaction (for efficient gas-phase stripping), chemical conversion and fluorescence measurement. An internal HCHO permeation source allows for daily calibrations. This instrument was characterized by sulfuric acid titration (overall accuracy 8.6 %) and yields measurements with a time resolution of 90 s and a limit of detection (3σ) of 0.3 ppbv. In addition, a new commercial instrument that makes use of cavity ring-down spectroscopy (CRDS) determined the concentrations of HCHO, water vapour, and methane (G2307, Picarro, Inc.). Its limit of detection (3σ) is specified as 0.3 ppbv for an integration time of 300 s, and its accuracy is limited by the drift of the zero signal (manufacturer specification 1.5 ppbv). A custom-built high-resolution laser differential optical absorption spectroscopy (DOAS) instrument provided HCHO measurements with a limit of detection (3σ) of 0.9 ppbv and an accuracy of 7 % using an optical multiple reflection cell. The measurements were conducted from June to December 2019 in experiments in which either ambient air flowed through the chamber or the photochemical degradation of organic compounds in synthetic air was investigated. Measured HCHO concentrations were up to 8 ppbv. Various mixtures of organic compounds, water vapour, nitrogen oxides and ozone were present in these experiments. Results demonstrate the need to correct the baseline in measurements performed by the Hantzsch instrument to compensate for drifting background signals. Corrections were equivalent to HCHO mixing ratios in the range of 0.5–1.5 ppbv. The baseline of the CRDS instrument showed a linear dependence on the water vapour mixing ratio with a slope of () ppbv %−1 below and () ppbv %−1 above a water vapour mixing ratio of 0.2 %. In addition, the intercepts of these linear relationships drifted within the specification of the instrument (1.5 ppbv) over time but appeared to be equal for all water mixing ratios. Regular zero measurements are needed to account for the changes in the instrument zero. After correcting for the baselines of measurements by the Hantzsch and the CRDS instruments, linear regression analysis of measurements from all three instruments in experiments with ambient air indicated good agreement, with slopes of between 0.98 and 1.08 and negligible intercepts (linear correlation coefficients R2>0.96). The new small CRDS instrument measures HCHO with good precision and is accurate if the instrument zero is taken into account. Therefore, it can provide measurements with similar accuracy to the DOAS instrument but with slightly reduced precision compared to the Hantzsch instrument.
- Article
(3397 KB) - Full-text XML
- BibTeX
- EndNote


Formaldehyde (HCHO) is a pollutant that is present in ambient air but also indoors. It affects human health by irritating the respiratory system and by being carcinogenic (Gupta et al., 1982; Casset et al., 2005; World Health Organization, 2010; Fortems-Cheiney et al., 2012; Liu et al., 2015; Salthammer, 2019; Qin et al., 2020). It is formed in the atmosphere as a product of the oxidation of volatile organic compounds (VOCs) and in combustion processes, including biomass burning. HCHO is also directly emitted during anthropogenic activities (Parrish et al., 2012). Globally, the largest contributions to HCHO production come from the oxidation of methane (CH4) (∼ 970 Tg yr−1) and the oxidation of nonmethane volatile organic compounds (NMVOCs) such as terpenes and other hydrocarbons (∼ 250 Tg yr−1) from biogenic sources (Anderson et al., 2017; Zhang et al., 2019). HCHO is mainly removed from the troposphere through photolysis and oxidation by hydroxyl radicals (OH), forming hydroperoxy radicals (HO2) and carbon monoxide. Therefore, the photolysis of HCHO is a significant source of radicals in the troposphere and contributes to the oxidation capacity of the troposphere. Subsequent radical–radical recombination reactions can be an important source of hydroperoxides in the troposphere. This is of particular importance if the reaction of HO2 with nitric oxide (NO) cannot compete, as is typically the case in remote marine regions. HCHO can also be removed by dry and wet surface deposition. The efficiency of these processes depends on the nature of the surface, but they represent a small sink for HCHO globally (Anderson et al., 2017; Alvarado et al., 2020; Wolfe et al., 2019). Overall, HCHO has a typical chemical lifetime in the troposphere of a few hours during the day and up to 2 d during the night, when photolysis and the reaction with OH do not play a big role (Lowe and Schmidt, 1983; Seinfeld and Pandis, 2016).
Formaldehyde mixing ratios in the lower troposphere range between 200 and 500 parts per trillion by volume (pptv) in marine and remote areas, but they can be up to multiple parts per billion by volume (ppbv) in urban environments, where HCHO sources are more common (Still et al., 2005; Nogueira et al., 2014; Li et al., 2014).
The total yield of HCHO in the oxidation of complex organic compounds is often uncertain because HCHO can be produced in numerous chemical reactions (Kuhn et al., 2007; Salthammer, 2019). Chemical models are often not capable of reproducing actual HCHO concentrations in the atmosphere or HCHO columns derived from satellite observations. For example, a comparison exercise, the Chemistry Climate Model Initiative (Anderson et al., 2017), showed that current global models underestimate HCHO columns by 4–50 %. Chamber and laboratory experiments contribute greatly to the development of chemical oxidation mechanisms under controlled conditions (Xiong et al., 2011; He et al., 2019; Novelli et al., 2020). In order to determine the HCHO yields in these experiments, accurate and precise measurements of HCHO are needed.
Strong absorption lines in the UV region allow the sensitive detection of formaldehyde by differential absorption (DOAS) instruments with either high or low spectral resolution (Dorn et al., 1995; Platt and Stutz, 2008) and cavity-based absorption spectroscopy (Washenfelder et al., 2016; Liu et al., 2019). Detection by absorption in the IR region is also possible by either Fourier transformation infrared spectroscopy (FTIR), tunable diode laser spectroscopy (TDLS) (Weibring et al., 2007; Shutter et al., 2019), quantum cascade laser spectroscopy (QCLS) (McManus et al., 2010), photoacoustic spectroscopy (Dugheri et al., 2021) or cavity ring-down spectroscopy (Picarro, Inc.). Absorption spectroscopy has the advantage that it does not need regular calibrations with a gas standard, but it does require knowledge of absorption cross-sections and careful characterization of instrument properties to avoid or correct for possible spectral interferences and signal offsets. The absorption cross-sections of HCHO are high enough to reach a limit of detection corresponding to a mixing ratio of a few hundred parts per trillion per volume (pptv), which is sufficiently low for many applications. In the past, most instruments were custom-built and effective operation required a good understanding of the instrument, but commercial instruments based on absorption spectroscopic methods have recently become available (CRDS instruments from Picarro, Inc., TDLS instruments from Aeros Technology and Aerodyne Research, and photoacoustic spectroscopy technology from Gasera).
Laser-induced fluorescence (LIF) detection after excitation at 353 nm yields a lower limit of detection (less than 35 pptv at 1 Hz) compared to instruments that make use of absorption spectroscopy (Hottle et al., 2009; Kaiser et al., 2014; Cazorla, 2015). Calibration is achieved by using a gas standard or a portable permeation source that is regularly checked by FTIR spectroscopy. LIF instruments are also custom-built and often make use of a fibre laser to provide the excitation.
Wet chemistry methods are widely used to detect formaldehyde. Sampling with cartridges for derivatization with 2,4-dinitrophenylhydrazine (DNPH) and subsequent offline analysis with high-performance liquid chromatography (HPLC) has a low limit of detection (40 pptv) but requires comparatively high experimental effort (Winberry et al., 1999). Due to the long sampling time (typically 1 h), the time resolution is less than that achieved with spectroscopic methods. Another online wet-chemical method is based on the Hantzsch reaction, in which aqueous formaldehyde reacts with acetylacetone (Kelly and Fortune, 1994). The concentration of the product (3,5-diacetyl-1,4-dihydrolutidine) is then measured by fluorescence after excitation at 410 nm. This type of instrument is currently commercially available from Aero-Laser GmbH. A low limit of detection of 100 pptv is reached along with a high time resolution of minutes. Disadvantages compared to spectroscopic methods are the need for regular maintenance work and calibrations with liquid and gaseous standards (see below) and the consumption of hazardous liquids.
Proton-transfer mass spectrometry (PTR-MS) can also detect formaldehyde; however, due to the low proton affinity of formaldehyde, the sensitivity of PTR-MS is too low and exhibits a strong dependence on the water vapour mixing ratio (Vlasenko et al., 2010; Warneke et al., 2011; Yuan et al., 2017). Therefore, PTR-MS measurements of formaldehyde concentrations have not become standard. A direct comparison of measurements obtained with instruments that use different techniques and calibration and data evaluation procedures is a widely approved way to evaluate the quality of the data and to identify possible instrumental artefacts, gauge the inaccuracy of calibration procedures or discern instrumental interferences (Grossmann, 2003; Inomata et al., 2008; Warneke et al., 2011).
Several comparison exercises have been performed so far. Eleven comparisons that were done before 2005 are summarized and discussed in Hak et al. (2005). They were performed during field and chamber experiments utilizing different techniques. Most often, an absorption spectrometer and Hantzsch instruments were involved. Hak et al. (2005) concluded that there is high variability in the level of agreement between measurements obtained using different instruments, but no specific pattern in that variability. Instrument calibration was most often assumed to be the likely reason for disagreement. The authors report the comparison of four different techniques (broadband DOAS, FTIR, Hantzsch and chromatography after cartridge sampling) during measurements at an urban site. Results showed agreement between the measurements provided by the DOAS, Hantzsch and FTIR instruments to within 11 % but also strong variations in the agreement between the Hantzsch measurements and those from other instruments. Differences between Hantzsch instruments were attributed to insufficiently effective scrubbers that were used to zero the instruments and differences in the calibration results. For absorption instruments, Hak et al. (2005) pointed out that the use of different recommendations for (differential) absorption cross-sections can lead to disagreement. In addition, the spectrometer resolution needs to be correctly taken into account to determine the effective cross-section.
In another comparison study by Wisthaler et al. (2008) that was done in the atmospheric simulation chamber SAPHIR at Forschungszentrum Jülich, measurements provided by DOAS, DNPH-HPLC, PTR-MS and two Hantzsch instruments in three experiments performed under controlled atmospheric conditions were compared. The measurements from different instruments differed by up to 50 %. Several analytical problems were identified: (1) measurements showed that the derivatization efficiency in the DNPH-HPLC method was significantly lowered in dry air; (2) as in previous comparisons, zeroing uncertainties led to a bias in the measurements from the Hantzsch instrument; and (3) measurements provided by the Hantzsch instrument in the presence of ozone (45 ppbv) were lower than DOAS measurements, which are likely to be less affected by ozone if the formaldehyde concentration is high compared to the ozone concentration. However, deviations varied among the experiments, so the connection to ozone was uncertain.
Formaldehyde measurements by a LIF instrument were compared to Hantzsch measurements in the SAPHIR chamber in 2014 (Kaiser et al., 2014), and to those provided by a recently developed commercial TDLAS system from Aeris Technology in ambient air (Shutter et al., 2019). The agreement between the measurements from the LIF and TDLAS instruments was better than 8 % for formaldehyde mixing ratios higher than 1 ppbv. The comparison of the LIF and Hantzsch instruments in SAPHIR enabled a systematic investigation of whether the measurements were affected by ozone or water. No systematic deviations were found in the presence of water or ozone, so observations by Wisthaler et al. (2008) of potential interference by ozone in measurements provided by a Hantzsch instrument could not be confirmed. Measurements given by Hantzsch and LIF instruments agreed within the combined calibration uncertainty (13 %).
Reports of instrument comparisons concluded that the measurement of formaldehyde remains challenging for atmospheric concentrations in the low- and sub-ppbv range, in particular for commercial instruments. Calibration and instrument zeros were identified as the major sources of systematic uncertainty in the data. In the present work, formaldehyde measurements from three different instruments in experiments performed in the SAPHIR chamber located at Forschungszentrum Jülich were compared. One instrument made use of the Hantzsch technique, which was also usually applied in previous comparisons. A high-resolution DOAS system (308 nm) for the detection of hydroxyl radical concentrations also provided formaldehyde concentrations. In addition, formaldehyde was detected by a CRDS instrument from Picarro, Inc. that has recently become commercially available. Experiments included investigations of the photochemical oxidation of specific organic compounds as well as those in which ambient air flowed through the chamber. These experiments enabled the performance of the instruments under controlled conditions to be investigated, which allowed the systematic variations in parameters over a long period of time to be assessed for realistic ambient conditions and concentrations.
2.1 Atmospheric simulation chamber: SAPHIR
Measurements were performed from June to December 2019 in experiments carried out in the outdoor atmospheric simulation chamber SAPHIR at Forschungszentrum Jülich, Germany. Detailed descriptions of this chamber and its properties can be found elsewhere (Rohrer et al., 2005).
The SAPHIR chamber consists of a double-walled cylinder of Teflon (FEP) film with a length and diameter of 18 and 5 m, respectively, and an effective volume of 270 m3. The film is mounted in a metal frame, with a shutter regulating the penetration of natural sunlight. Two fans ensure that trace gases are mixed within 2 min. The transmittance of solar radiation through the Teflon film of the chamber is regularly determined by actinometric experiments (Bohn and Zilken, 2005). The volume between the two Teflon films is continuously flushed with pure nitrogen (Linde, purity >99.9999 %), and the chamber is held at slightly above atmospheric pressure (∼ 30 Pa) to prevent any contamination from the ambient air. Air that is consumed by instruments or lost through small leakages is permanently replenished with dry synthetic air. This leads to a trace gas dilution of 3 % h−1 to 5 % h−1.
The Teflon film releases small amounts of nitrous acid (HONO) and small hydrocarbons such as formaldehyde and acetaldehyde when it is exposed to solar radiation. The source strength depends on the temperature, illumination and humidity (Rohrer et al., 2005). For formaldehyde, the source strength is approximately (20 ± 10) pptv min−1 (30 % RH at 298 K) for clear-sky summer conditions ( s−1). This value was determined in the present work in experiments where the chamber contained only humidified clean synthetic air that was exposed to sunlight. Similar values were obtained in the past.
Some of the experiments carried out in 2019 and included in this work were part of the Jülich Atmospheric Chemistry Project (JULIAC), which was designed to investigate the seasonal and diurnal variations in atmospheric trace gases, radicals and particles in air under the influence of anthropogenic and biogenic emissions. Ambient air was continuously sampled for 4 weeks during each season of the year through an inlet line made of Silconert-coated stainless steel that was mounted on a 50 m high tower. Large particles (> 10 µm) were removed in a cyclone before the air was transported into the chamber. A blower compressed the air before entering the chamber (pressure difference: 15 hPa). Only a fraction (250–260 m3 h−1) of the total flow (660 m3 h−1) controlled by a three-way valve flowed into the chamber. This flow rate resulted in a residence time of air in the chamber of approximately 1 h. Temperature, pressure, relative humidity, and solar radiation were constantly monitored inside and outside the SAPHIR chamber. During strong wind or heavy rain, the louvre system of SAPHIR was closed to prevent damage to the Teflon film.
In addition to measurements in ambient air (JULIAC), the analysis includes data from experiments in which the photooxidation of anthropogenic and biogenic volatile organic compounds (e.g. isoprenoids, terpenes and derivatives of acetone) were investigated under controlled conditions. Before the start of a typical experiment, the chamber was flushed with a mixture of ultrapure nitrogen and oxygen (Linde, purity >99.99990 %) to remove any remaining trace gases or contaminations. In most of the experiments, the chamber air was humidified by evaporating Milli-Q® water that was flushed into the chamber with a high flow of synthetic air. Organic or inorganic compounds (e.g. alkenes, nitrogen oxides or ozone) or particles were injected to generate various conditions in which the oxidation and degradation of organic compounds were investigated, either in the dark or under solar irradiation. Emissions from up to six trees housed in a plant-chamber (Hohaus et al., 2016) were occasionally transferred to the chamber in order to study their photooxidation. Reference experiments performed under similar conditions and with no injections of the analytes provided background data that were used to determine the strength of chamber sources (e.g. of HCHO).
2.2 HCHO detection by the wet-chemical method using the Hantzsch reaction
One of the instruments used to detect HCHO in this work was a commercial instrument (AL4021, Aero-Laser GmbH, 2020) that employed the Hantzsch wet chemistry method. In this method, air is sampled at a flow rate of 1 L min−1 (Fgas) through a 5 m long O.D. PFA Teflon tube. Any loss or production of HCHO during the contact time (≈4 s) of the air with the Teflon surface is expected to be negligible (Sumner et al., 2001). A stripping coil is used to transfer the HCHO from the gas phase to a 50 mM sulfuric acid solution. The stripping efficiency (α) describes the percentage of formaldehyde that is physically separated from the gaseous phase into the liquid phase within a coil installed inside a box. The stripping is nearly quantitative, with an efficiency of stated by the manufacturer (Aero-Laser GmbH, 2020). A liquid flow rate of approximately 40) µL min−1 is maintained by a peristaltic pump. The actual measurement of the HCHO concentration in the aqueous solution is then performed using a liquid-phase chemical reaction in a reactor. The aqueous HCHO reacts with acetylacetone (2,4-pentadione) and ammonia, forming the pyridine dye 3,5-diactyl-1,4-dihydrolutidine (DDL) in the Hantzsch reaction. The pyridine dye is detected by fluorescence at 510 nm after excitation by 410 nm radiation from a UV LED. The time response of the instrument is about 90 s (10 % to 90 %), with an additional time delay of 5–6 min due to the time required to transport the liquid from the coil to the fluorimeter. The 3σ limit of detection is stated as 300 pptv by the manufacturer (Aero-Laser GmbH, 2020).
For the experiments in this work, the instrument was placed in an air-conditioned sea container next to the chamber. Parts of the instrument were temperature stabilized: the stripping coil at 283 K, the reaction volume at 341 K and the fluorimeter at 308 K. This ensured that the reaction efficiency and fluorescence detection sensitivity remained approximately constant (Rurack and Spieles, 2011; Resch-Genger and Rurack, 2013). The tubing of the peristaltic pumps was exchanged every 2 weeks due to tube degradation and in order to prevent occlusions or a major loss of pumping performance, which could cause the instrument sensitivity to change by up to 10 % within this time span (Sect. 3.1). To prevent chemical degradation and ageing, all chemicals were stored in a box at a controlled temperature of 277 K. The chemicals had to be refilled every 1–2 weeks. Stopping the liquid flow or switching the instrument off for regular tubing exchange, cleaning or maintenance required an additional warm-up time (30–120 min) to ensure that the instrument was in thermal equilibrium and to stabilize the flow rates of liquids in order to achieve a stable response signal.
The instrument presented a significant zero signal (S0) that had to be subtracted from the total measured signal (S) in order to derive the signal caused by HCHO. Automated zero measurements were performed for about 20 min every 2–3 h by removing HCHO from the sampled air by means of a scrubber. This scrubber consisted of a glass cylinder filled with a brown rod-shaped material that – according to the manufacturer – provides reliable and sufficient HCHO scavenging. However, the exact scavenging material was not specified by the manufacturer. The internal software of the instrument used the last zero measurement to evaluate the current measurement.
The HCHO mixing ratio in the sampled gas (with flow rate Fgas) was derived from the instrument sensitivity ECal. The signals were normalized to the inverse of the flow rate of the liquid solution (Fliq). Additional parameters such as the molar volume Vmol under standard ambient temperature and pressure (SATP) conditions (298.15 K; 1 bar), the molar mass of formaldehyde MHCHO and the stripping efficiency α were necessary to calculate the HCHO mixing ratio from the measured signal:
The instrument sensitivity (ECal) was determined in daily calibration measurements using a temperature-controlled (T=318 K) internal HCHO permeation source that provided a constant mass flow of HCHO (). The sensitivity was calculated from the liquid flow rate Fliq and the measured signal SCal during calibration using
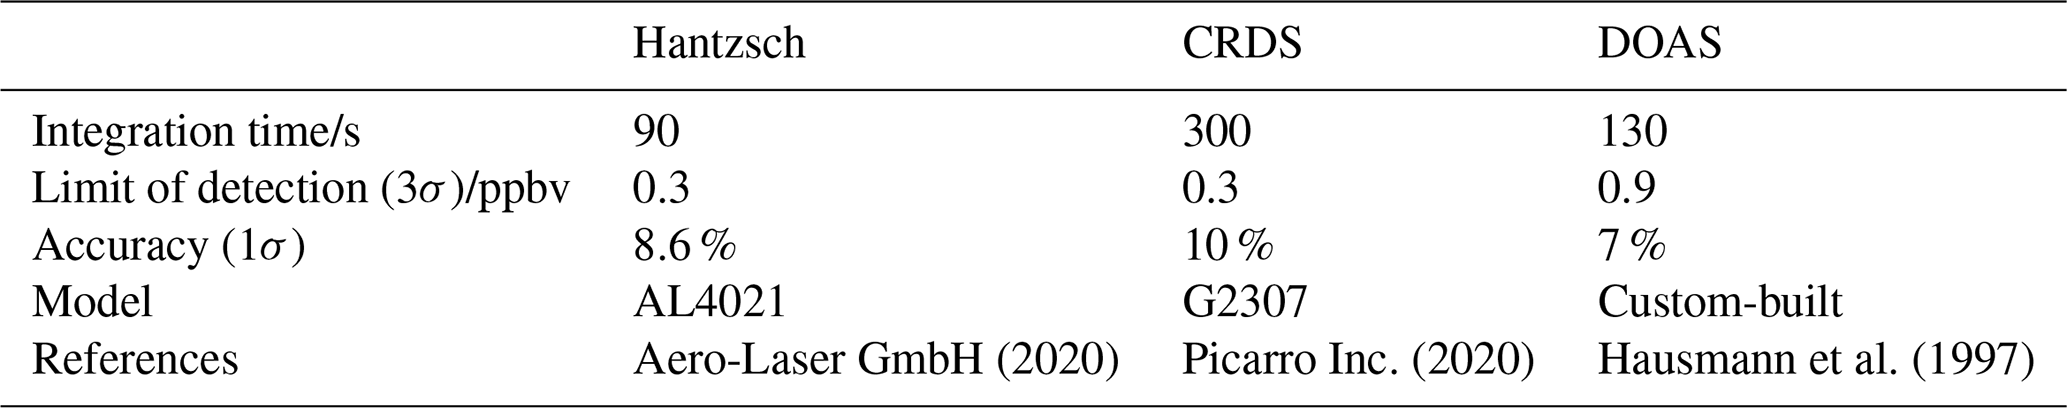
Table 1Specifications of the Hantzsch, CRDS and DOAS instruments used in this work, as stated by the manufacturer or reported in previous literature.
Because the instrument can also measure liquid formaldehyde concentrations, the permeation source strength () was regularly compared to a liquid formaldehyde standard solution (∼ 0.1 mM HCHO) in 50 mM aqueous H2SO4 (the stripping solution). Preparation of this standard required an intermediate dilution step (∼ 10 mM HCHO in water) from a commercial standard solution of formaldehyde (37 % HCHO , Sigma–Aldrich). This stock solution was stored for multiple use in a refrigerator in order to reduce polymerization and evaporation (Golden and Valentini, 2014). Before each use, the concentration of the stock solution was determined titrimetrically: 10 mL of the stock solution and 30 mL of a freshly prepared 0.1 M aqueous sodium sulfite solution were automatically titrated to pH = 7 with a 1 N sulfuric acid solution using a semiautomated titration unit (716 DMS Titrino by Metrohm). The result was automatically calculated and used for the source strength calibration. The reproducibility of this procedure was 2 %. The uncertainty of the titration method is mainly due to the uncertainty in the liquid flow measurements (3 %). Error propagation results in a total uncertainty in the HCHO concentration of 3.6 %, which is added to the reproducibility of the calibration procedure: 5 % (Sect. 3.1). Therefore, the combined accuracy of the Hantzsch method in this work was 8.6 % (Table 1).
2.3 Cavity ring-down spectroscopy (CRDS)
The second instrument employed for the detection of HCHO in this work used cavity ring-down spectroscopy (CRDS) for the simultaneous detection and quantification of HCHO, CH4 and H2O (G2307, Picarro, Inc.) (Hoffnagle et al., 2017). This instrument uses the same principles as other CRDS instruments from Picarro (Crosson, 2008). The gas concentration analyser was placed in an air-conditioned container. Air flowing at 4–6 L min−1 through the chamber was sampled with a 4 m long, O.D. Teflon tube, leading to an air flow of 0.28 L min−1 to the CRDS instrument. The tip of the inlet in the chamber was approximately 0.5 m from the inlet line of the Hantzsch instrument.
Cavity ring-down spectroscopy provides a very sensitive absorption measurement. The instrument consists of a cavity with three high-reflectivity mirrors arranged in a triangle. Light from a narrow-bandwidth infrared laser is coupled into the cavity. Light leaking through one of the mirrors is recorded by a photodetector. The signal received from the photodetector decays exponentially after the laser has been switched off. The decay rate depends on the light loss in the cavity, which is partly due to the presence of absorbers such as HCHO. Due to the high reflectivity of the mirrors, an effective optical path length of several kilometres is achieved. The wavelength of the laser is tuned to be within the range from 5625.5 to 5626.5 cm−1 at a repetition rate of 100 Hz in order to simultaneously detect HCHO, CH4 and H2O using their specific narrowband rotational-vibrational absorption lines. The overall accuracy of formaldehyde measurements is specified as 10 % (Picarro Inc., 2020). The instrument automatically calculates the concentrations of trace gases taking into account the fractional absorption of the laser light by water and methane due to the partial overlap of their absorption lines with the absorption line of formaldehyde (Barry et al., 2002; Hoffnagle et al., 2017).
Data are internally averaged to 1 Hz by the instrument but are then averaged to a time resolution of 60 s for further analysis to improve the precision of the data. The instrumental precision and accuracy decrease if the humidity changes rapidly because of the overlap of the centre of the weak absorption line of HCHO with the long-wavelength wing of the very much stronger absorption line of water (Hoffnagle et al., 2017). Peak shapes also vary with temperature and pressure, which can impact the result of the peak-fitting procedure (Picarro, Inc., personal communication, September 2019). Therefore, the cavity is pressure and temperature stabilized (Picarro Inc., 2020).
To determine the instrumental zero in this work, measurements were performed in the chamber when no formaldehyde was present. Humidification of the air in the chamber allowed the characterization of the dependence of the instrumental zero on water vapour (Sect. 3.2).
2.4 Differential optical absorption spectroscopy (DOAS)
A high-resolution laser differential optical absorption spectroscopy (DOAS) instrument provided absolute HCHO measurements (Dorn et al., 1995; Schlosser et al., 2007, 2009). In this system, a subpicosecond pulsed and frequency-doubled dye laser provides UV (around 308.04 nm) radiation with a bandwidth of 0.41 nm. The dye laser is synchronously pumped by a frequency-doubled mode-locked Nd:YAG laser. The light passes through the central axis of the chamber in a White-type multireflection cell. Mirrors are installed at each end of the chamber at a distance of 20 m, resulting in a total absorption path length of (2240±2) m. The light intensity transmitted through the chamber is spectrally analysed by a high-resolution echelle grating spectrograph (Δλ=2.7 pm, , f = 1.5 m) and detected by a linear photodiode array detector.
The DOAS method relies on the separation of narrow absorption lines due to specific absorbers from light attenuation, which does not vary much with wavelength. In the evaluation, the wavelength-dependent intensity of the transmitted light is fitted to a polynomial to account for broadband extinctions and the superposition of differential absorption spectra from specific absorbers. The Lambert–Beer law can be applied to calculate the absorber concentrations, but the differential absorption cross-section (σdiff) needs to be used instead of the total absorption cross-section (Platt and Stutz, 2008). Similar to the analysis of the transmitted spectrum, the differential absorption cross-section only contains the narrow absorption lines. The high-resolution differential cross-section of the selected formaldehyde absorption line at 308.1034 nm is cm2. The value of the absorption cross-section was derived from a comparison between measurements from the DOAS and Hantzsch instruments. This comparison was achieved by comparing HCHO measurements obtained in all chamber experiments in SAPHIR using both instruments between 2011 and 2018. The slope (1.100±0.0017, R2: 0.978, n: 4139) from a regression between both sets of measurements was used to scale the differential absorption cross-section applied in the evaluation procedure for the DOAS signal. It is worth noting that measurements used in the cross-calibration were not part of the comparison performed in this work. In addition, the Hantzsch instrument that delivered HCHO concentrations between 2011 and 2018 was different from the one used in this work.
The accuracy of the DOAS formaldehyde data is estimated to be 7 %. This is mainly determined by the accuracy of the calibration procedure of the Hantzsch instrument used for the comparison with the DOAS, but also takes into account the uncertainty in the absorption cross-section from the regression between the DOAS and Hantzsch data, which was 0.16 %. The derived high-resolution absorption cross-section is valid for the given spectral resolution of 0.0027 nm. Under ambient conditions, the pressure and temperature dependence of the cross-section is very small (Cantrell et al., 1990) and does not affect the accuracy of the DOAS measurements. The high-resolution cross-section determined in this work compares very well with the value inferred by Brauers et al. (2007) from concurrent chamber measurements using a low-resolution DOAS instrument and a high-resolution DOAS instrument: cm2, a value which is well within the stated accuracy of 7 %. Therefore, DOAS measurements in the comparison performed here can be regarded as independent from Hantzsch measurements.
High selectivity is possible due to the high resolution of the measured spectrum, which allows the separation of overlapping narrowband spectral structures. The DOAS system used in this work can simultaneously detect hydroxyl radicals (OH), HCHO, SO2 and naphthalene. OH radicals are measured with very high spectral resolution in the same spectral range as for HCHO, making it an ideal component for a spectral reference. This OH reference spectrum can be monitored and periodically compared to the actual OH measurements to evaluate the stability of the spectral resolving power and the repeatability of the spectral wavelength scanning mechanism (Dorn et al., 1995; Hausmann et al., 1997). Both are important for ensuring that repeatable and accurate measurements are recorded by the echelle spectrometer.
3.1 Stability of the instrument zero and sensitivity of the Hantzsch instrument
The instrument zero of the Hantzsch instrument exhibits fluctuations and drifts. This is likely caused by temperature changes in parts of the instrument that are not temperature controlled. Therefore, the Hantzsch instrument determines the instrument zero from regular automated measurements in which formaldehyde is removed from the sampled air. HCHO concentrations automatically provided by the instrument are calculated according to Eq. (1). By default, the last zero measurement for S0 is used until the next zero measurement is done. As a consequence, the time series of HCHO concentrations can show artificial jumps after a new zero reading if the zero value has changed (Fig. 1).

Figure 1Plots showing 2 d of instrument zero measurements. In each plot, the variation in the instrument zero over time is plotted using a step function (i.e. only the most recent zero measurement is considered) and using the linear interpolation between two successive zero measurements. Each error bar represents the 1σ error in the zero measurement. The change in the raw signal, 0.2 mV, corresponds to a HCHO mixing ratio of 1.2 ppbv.
In order to smooth the fluctuations caused by changes in the zero signal, the data obtained in this work were reprocessed by applying the linear interpolation between the zero measurements before and after the actual HCHO measurement. In addition, the time interval between two zero measurements was reduced from 4 h to 2 h after the significant changes in the instrument zero were first noticed. Figure 1 shows that the change in the instrument zero can be as high as 0.2 mV, which is equivalent to an HCHO mixing ratio of up to 1.2 ppbv. The exact value depends on the current sensitivity of the instrument. By performing more frequent zero measurements and interpolating between zero measurements, the uncertainty in the HCHO measurements was significantly reduced (by at least a factor of 10), so that the accuracy of measurements accounting for the uncertainty in the zero was well below 100 pptv.
The Hantzsch instrument was operated in the SAPHIR chamber for nearly half a year. During experiments, calibration measurements were done once a day, which allowed the stability of the instrument's sensitivity to be analysed. Figure 2 shows the deviation from the mean sensitivity for 116 calibration measurements. The mean sensitivity of the instrument was 75 L mV µg−1. The 1σ reproducibility of the calibration measurements was 5 %, and this was included in the HCHO measurement accuracy of 8.6 % (Table 1). The record of calibration measurements indicates that the long-term stability of the instrument's sensitivity was good. Day-to-day changes are most likely due to real changes in the sensitivity because the sensitivity is expected to decrease as the tubing ages. This is also clearly demonstrated by the increase in sensitivity after each exchange of the tubing (Fig. 2). Therefore, the calibration value measured closest to the time of the actual measurement was applied for the evaluation of measurements in this work.
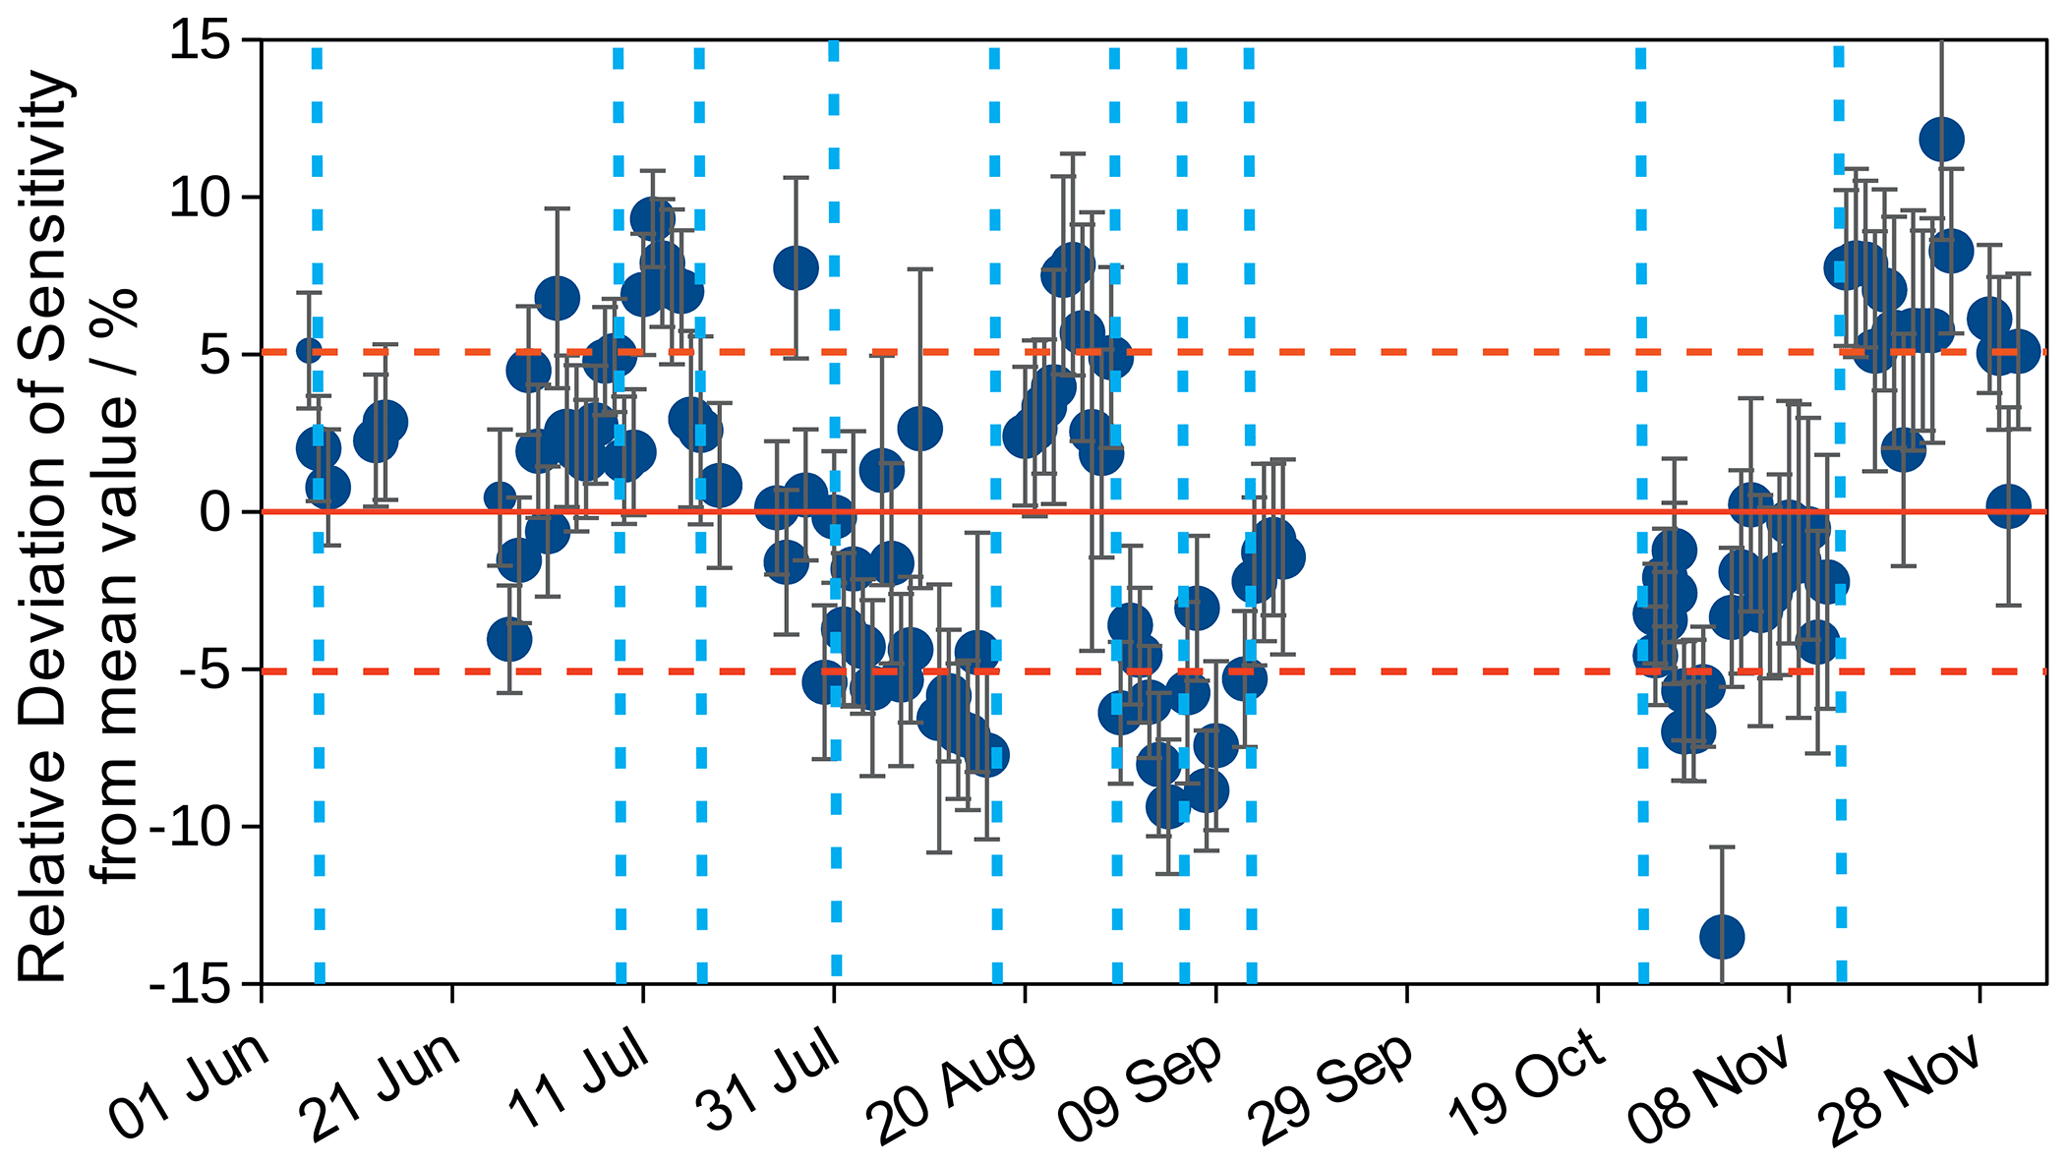
Figure 2The Hantzsch instrument was calibrated on 116 d over the period from June to December 2020. Each point shows the relative deviation of the mean measured sensitivity. Error bars are standard deviations from the mean value of all data points acquired during one calibration measurement. Dashed red lines give the standard deviation of the sensitivity averaged over the entire period (5 %). Dashed vertical lines indicate times when work was done on the instrument, such as exchanging the tubes.
3.2 Water-vapour-dependent offset of HCHO measurements by the Picarro CRDS
Formaldehyde measurements by the CRDS instrument appeared to have a variable zero point. An offset was noticed for measurements performed in synthetic air in the clean chamber when no formaldehyde was present (Fig. 3). This offset was variable with time and depended on the presence of water vapour. As seen in Fig. 3, a significant offset was also seen for measurements by the instrument in clean dry air. The offset in dry air showed relatively small changes of typically less than 0.1 ppbv from day to day. In addition to the offset in dry air, changes in humidity caused additional variations in the instrument offset of up to 2 ppbv. The exact value scaled linearly with the water vapour mixing ratio. The offset in dry air could therefore be derived by linearly extrapolating measurements without formaldehyde to dry conditions. This was done based on experimental measurements obtained when the clean air in the chamber was humidified. Figure 4 shows the resulting offset values in dry air for all experiments. During this period, the bias in the measurements changed significantly over time, varying between 1.3 and 1.75 ppbv. All measurements obtained in this work were corrected for this bias by using the same value for dry conditions on each day. When no measurements without HCHO were available, a linearly interpolated value from experiments performed the day before and the day after was taken. The variability of the bias is within the range of the typical zero drift of 0.3 ppbv, and the absolute value of the offset is within the range of the specified zero drift of 1.5 ppbv (Picarro Inc., 2020).
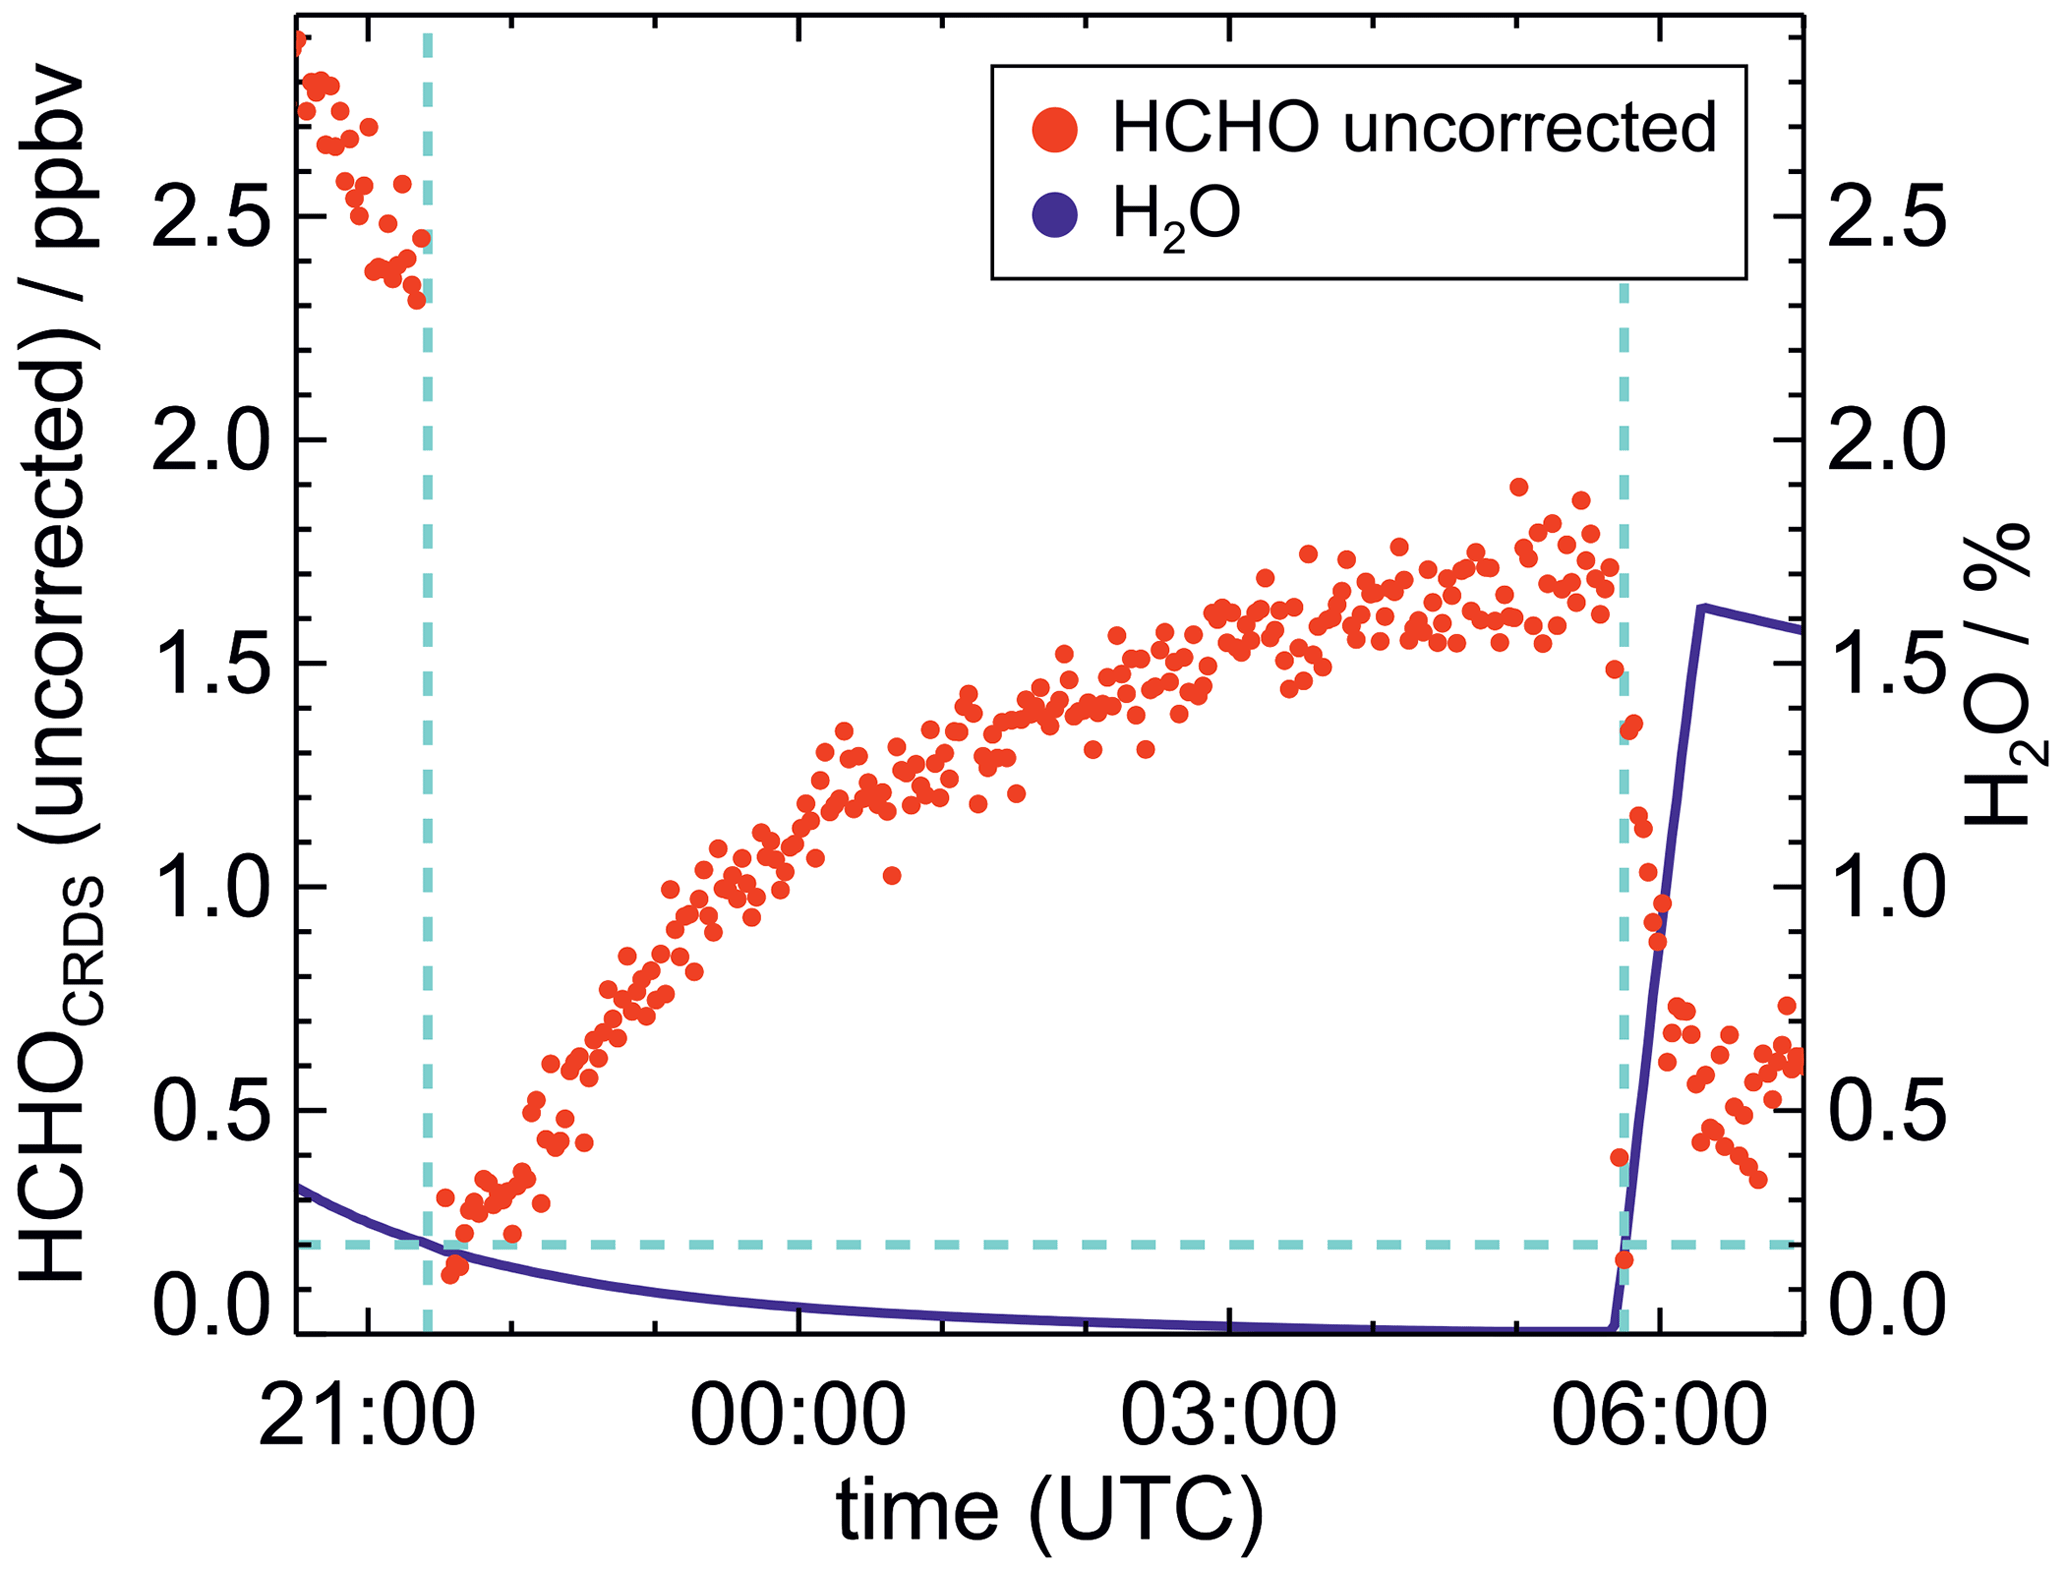
Figure 3Time series of HCHO measurements by the CRDS instrument without offset correction and with varying water mixing ratios in the chamber. Measurements by the Hantzsch instrument (not shown) indicated that mixing ratios were much smaller than the Picarro measurements, with values that continuously decreased from 200 pptv to zero until midnight due to the flushing of the chamber with zero air. They also remained close to zero during the humidification starting at 05:45 UTC in the morning. In contrast, the uncorrected CRDS measurements showed fast changes when the water vapour mixing ratio became lower or higher than 0.2 % (blue dashed line). They also showed slow changes that (anti)correlated with the water vapour mixing ratios. Before humidification, an offset value of 1.7 ppbv was measured in dry air.
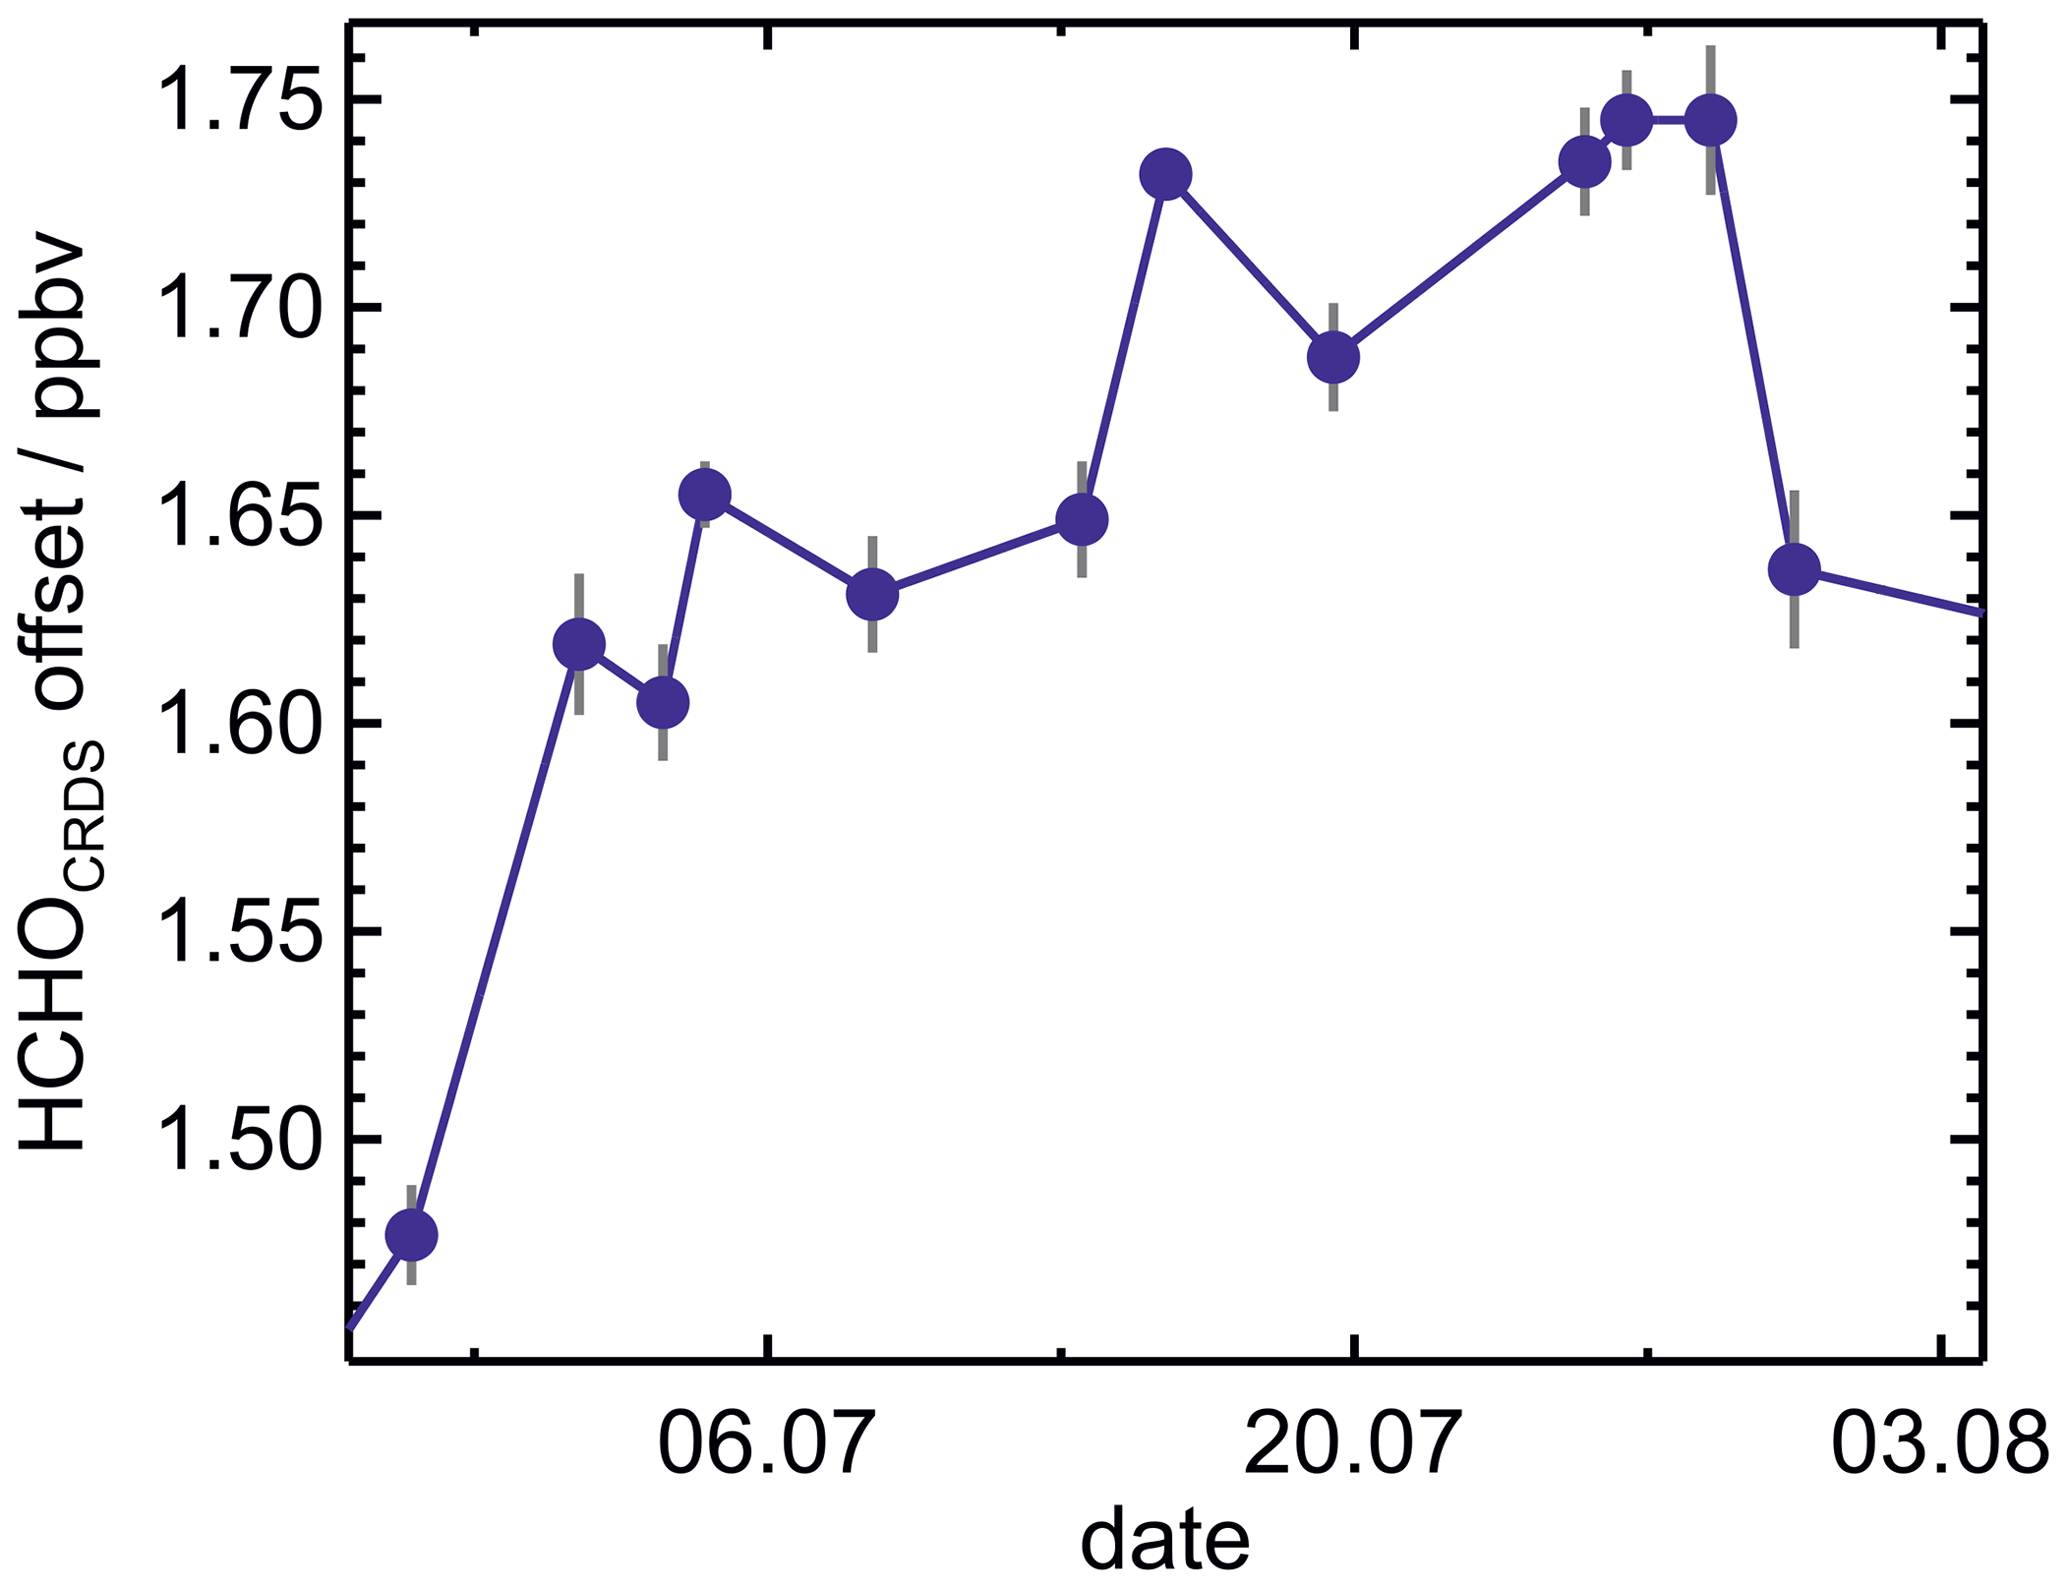
Figure 4Measured offsets of the HCHO measurements obtained by the CRDS instrument in dry air during the period from 26 June to 3 August 2019. Values were determined on 12 d by sampling air without HCHO and extrapolating the linear water-vapour-dependent bias of the instrument to dry conditions.
Figure 5 shows the water vapour dependence of the bias in the CRDS measurements, which is added to the offset in dry air. In order to make data from different days comparable, all measurements were corrected for the variability of the day-specific offset in dry air. Again, data from the experiments performed in the SAPHIR chamber between 26 June and 3 August 2019, when no HCHO was present, were used. In the figure, there are two easily distinguishable groups of measurements: one at water vapour mixing ratios lower than 0.2 % and the other at water vapour mixing ratios higher than 0.2 %. The intercept corresponding to dry conditions is the same for both groups of data on a particular day. Both subsets of data exhibit a bias that decreases linearly with increasing water vapour mixing ratio. However, the slope of the linear relationship for lower water vapour mixing ratios (−11.20 ± 1.60) ppbv %−1) is approximately a factor of 15 higher than that for higher water vapour mixing ratios (−0.72 ± 0.08) ppbv %−1). The water vapour dependence is similar for all data. Therefore, slopes were determined from linear fits using all data. These values, along with the day-specific intercept, were used to correct all CRDS HCHO data in this work.

Figure 5Offsets of the CRDS measurements as a function of water vapour mixing ratio after removing the variability of the offset for dry conditions (Fig. 4). Data from 11 experiments are included, as indicated by different colours (number of data points: 1040 for H2O < 0.2 %, 541 for H2O > 0.2 %). Red lines show the results of linear regression analysis (R2=0.92 for H2O < 0.2 %, R2=0.83 for H2O > 0.2 %). Grey error bars represent the 1σ errors in measurements.
The observed changes in the offset are caused by the instrument's data processing algorithm, which takes into account the overlap between the infrared absorption lines of water and formaldehyde (Picarro, Inc., personal communication, September 2019). A very strong water line interferes with the absorption by formaldehyde. Above a water mixing ratio of 0.2 %, the water vapour absorption line is strong enough that its contribution can be accounted for in absorption line fitting with the amplitudes and line widths as free parameters. In contrast, below 0.2 %, the signal-to-noise is too poor to allow an independent fit of the line width. Therefore, a fixed value for the line width is used, which is derived from a spectrum acquired at a very low water concentration. This procedure has been improved in the new version of the instrument software (Picarro, Inc., personal communication, September 2019) – version 1.6.015, as implemented in the instrument used here. Therefore, the correction described here might not be applicable for all Picarro HCHO instruments. In experiments with exceptionally high nonatmospheric mixing ratios of methane, there is also an offset that depends on methane. However, for the atmospheric mixing ratios experienced in the present work, this additional offset was not significant and was therefore neglected.
3.3 Precision of measurements
In order to analyse the precision of the measurements, the Allan deviation was calculated from measurements in air that did not contain formaldehyde (Fig. 6). The DOAS instrument did not provide enough data points to enable an Allan deviation analysis to be performed. Corrections of the data from the Hantzsch and CRDS instruments were applied as described above.
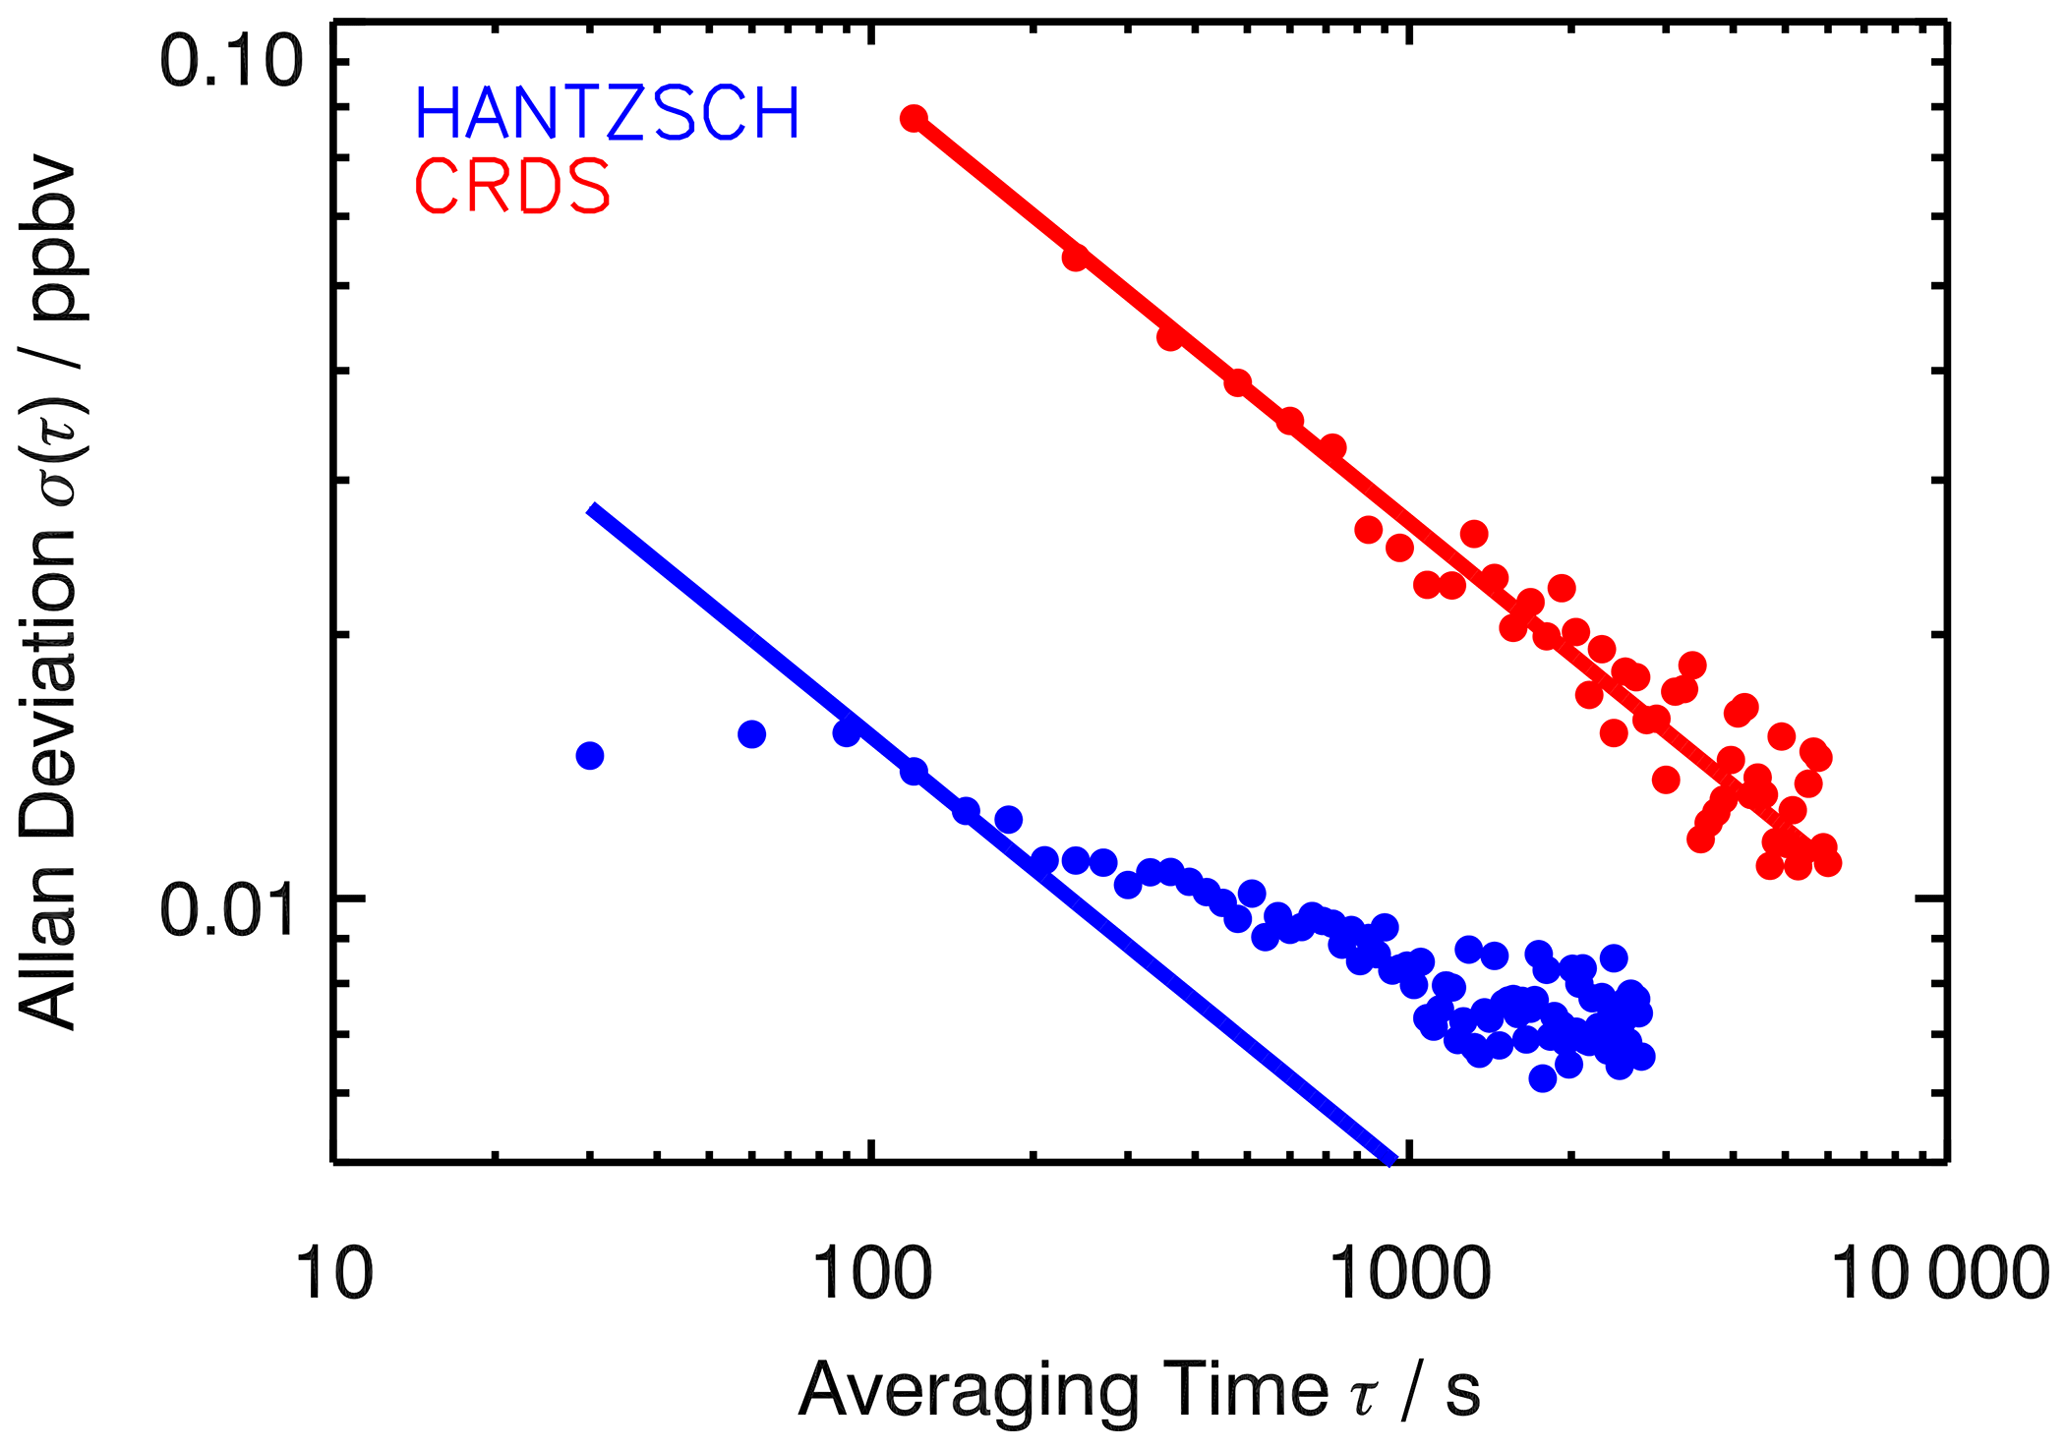
Figure 6Allan deviations (1σ precision) calculated from zero measurements in the clean, dark chamber. Straight lines represent the white noise ().
The Allan deviations for the CRDS and Hantzsch measurements resulted in 1σ precisions of 0.08 and 0.014 ppbv, respectively, for an averaging time of 2 min. Overall, the Hantzsch instrument provides a better signal-to-noise ratio and therefore a lower limit of detection compared to the CRDS instrument. Although the frequency with which data is provided by the Hantzsch instrument can be in the range of seconds, the slow transport of the solution inside the instrument results in a time resolution of 90 s, as specified by the manufacturer and demonstrated by the constant Allan deviation for averaging times of less than 90 s. Also, the Allan deviation does not decrease as expected from the white noise for longer averaging times. This indicates that the measurements are impacted by time-dependent systematic errors. These could be, for example, baseline drifts that are not fully taken into account, as seen in Fig. 4, but also short-term variability in instrument sensitivity. In contrast, the CRDS data follow the white noise up to an averaging time of 2 h. For example, the Allan deviation is approximately 50 pptv for an integration time of 5 min, which is consistent with the typical precision specified for the instrument (Picarro Inc., 2020).
3.4 Comparison of measurements
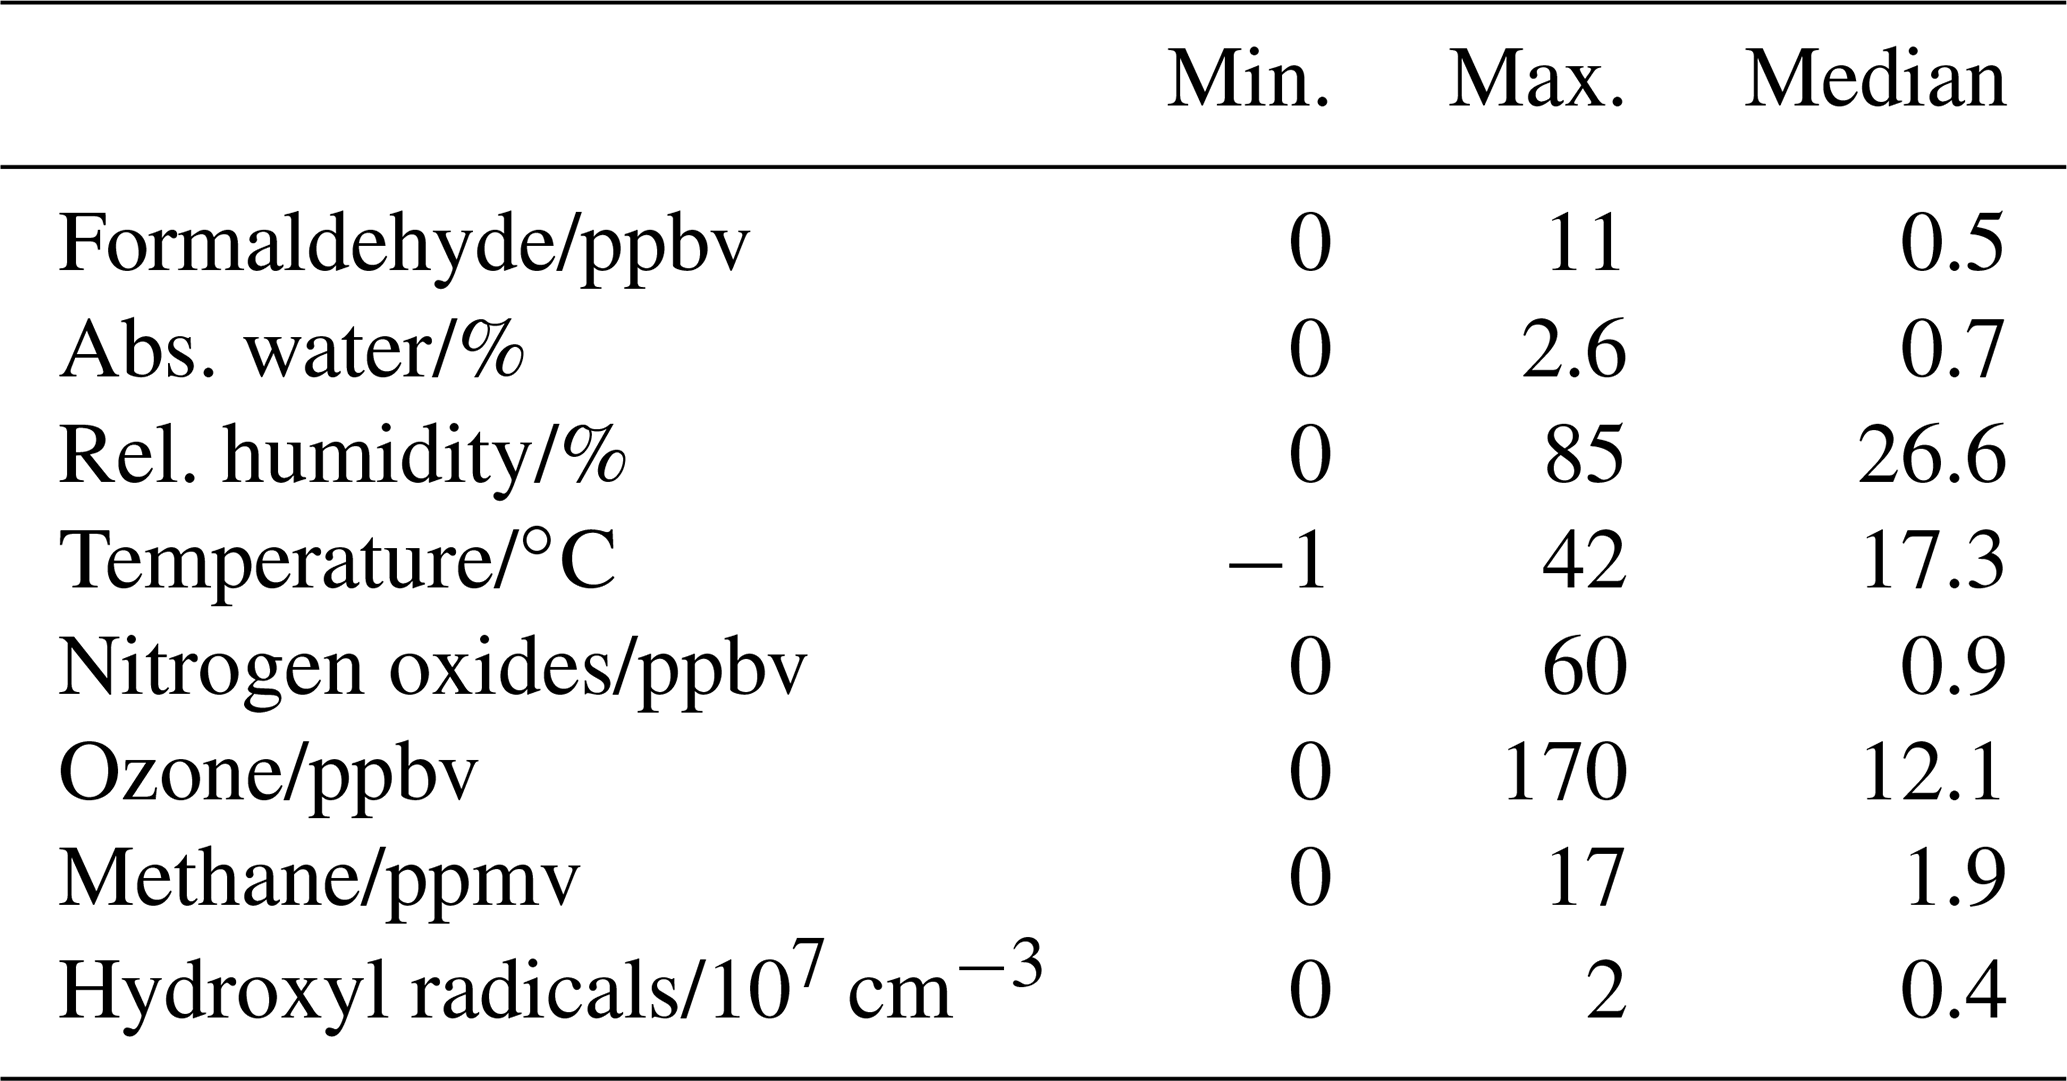
From June 2019 to December 2019, numerous experiments were performed in the SAPHIR chamber. In photochemical experiments studying the photodegradation of organic compounds, the chamber was operated with synthetic air, into which trace gases were injected. During the JULIAC campaign, the chamber was filled with ambient air. This diversity of experiments allowed HCHO to be measured under a wide range of conditions regarding temperature, relative humidity, and ozone, nitrogen oxide and methane concentrations (Table 2).
Table 2Range of conditions inside the SAPHIR chamber during the period between June 2019 and December 2019.
Regular flushing of the chamber with pure synthetic air provided a solid instrumental zero for most instruments, and specific oxidation experiments provided high nitrogen oxide and ozone levels of up to 60 and 600 ppbv, respectively. For instance, formaldehyde was monitored during the photooxidation of cyclic monoterpenes such as limonene, carene, α-pinene, β-pinene, isoprene and alkenes. In these batch experiments, the nitrogen oxide and ozone levels were varied to control the chemical oxidation and degradation process of aliphatic hydrocarbons and therefore the formation of formaldehyde.
The formaldehyde measurements obtained in the ambient air experiments by the three instruments described above are compared as time series in Fig. 7 and as correlation plots in Fig. 8. The Hantzsch measurements were regularly interrupted for instrumental maintenance or calibration. Following each exchange of peristaltic tubes or power off for maintenance, a long time was needed for the measurements to stabilize. The CRDS and DOAS instruments also needed maintenance, which explains the regular gaps in those measurements. Measurements by the Hantzsch and Picarro instruments were corrected for their variable offsets, as discussed in the previous sections.
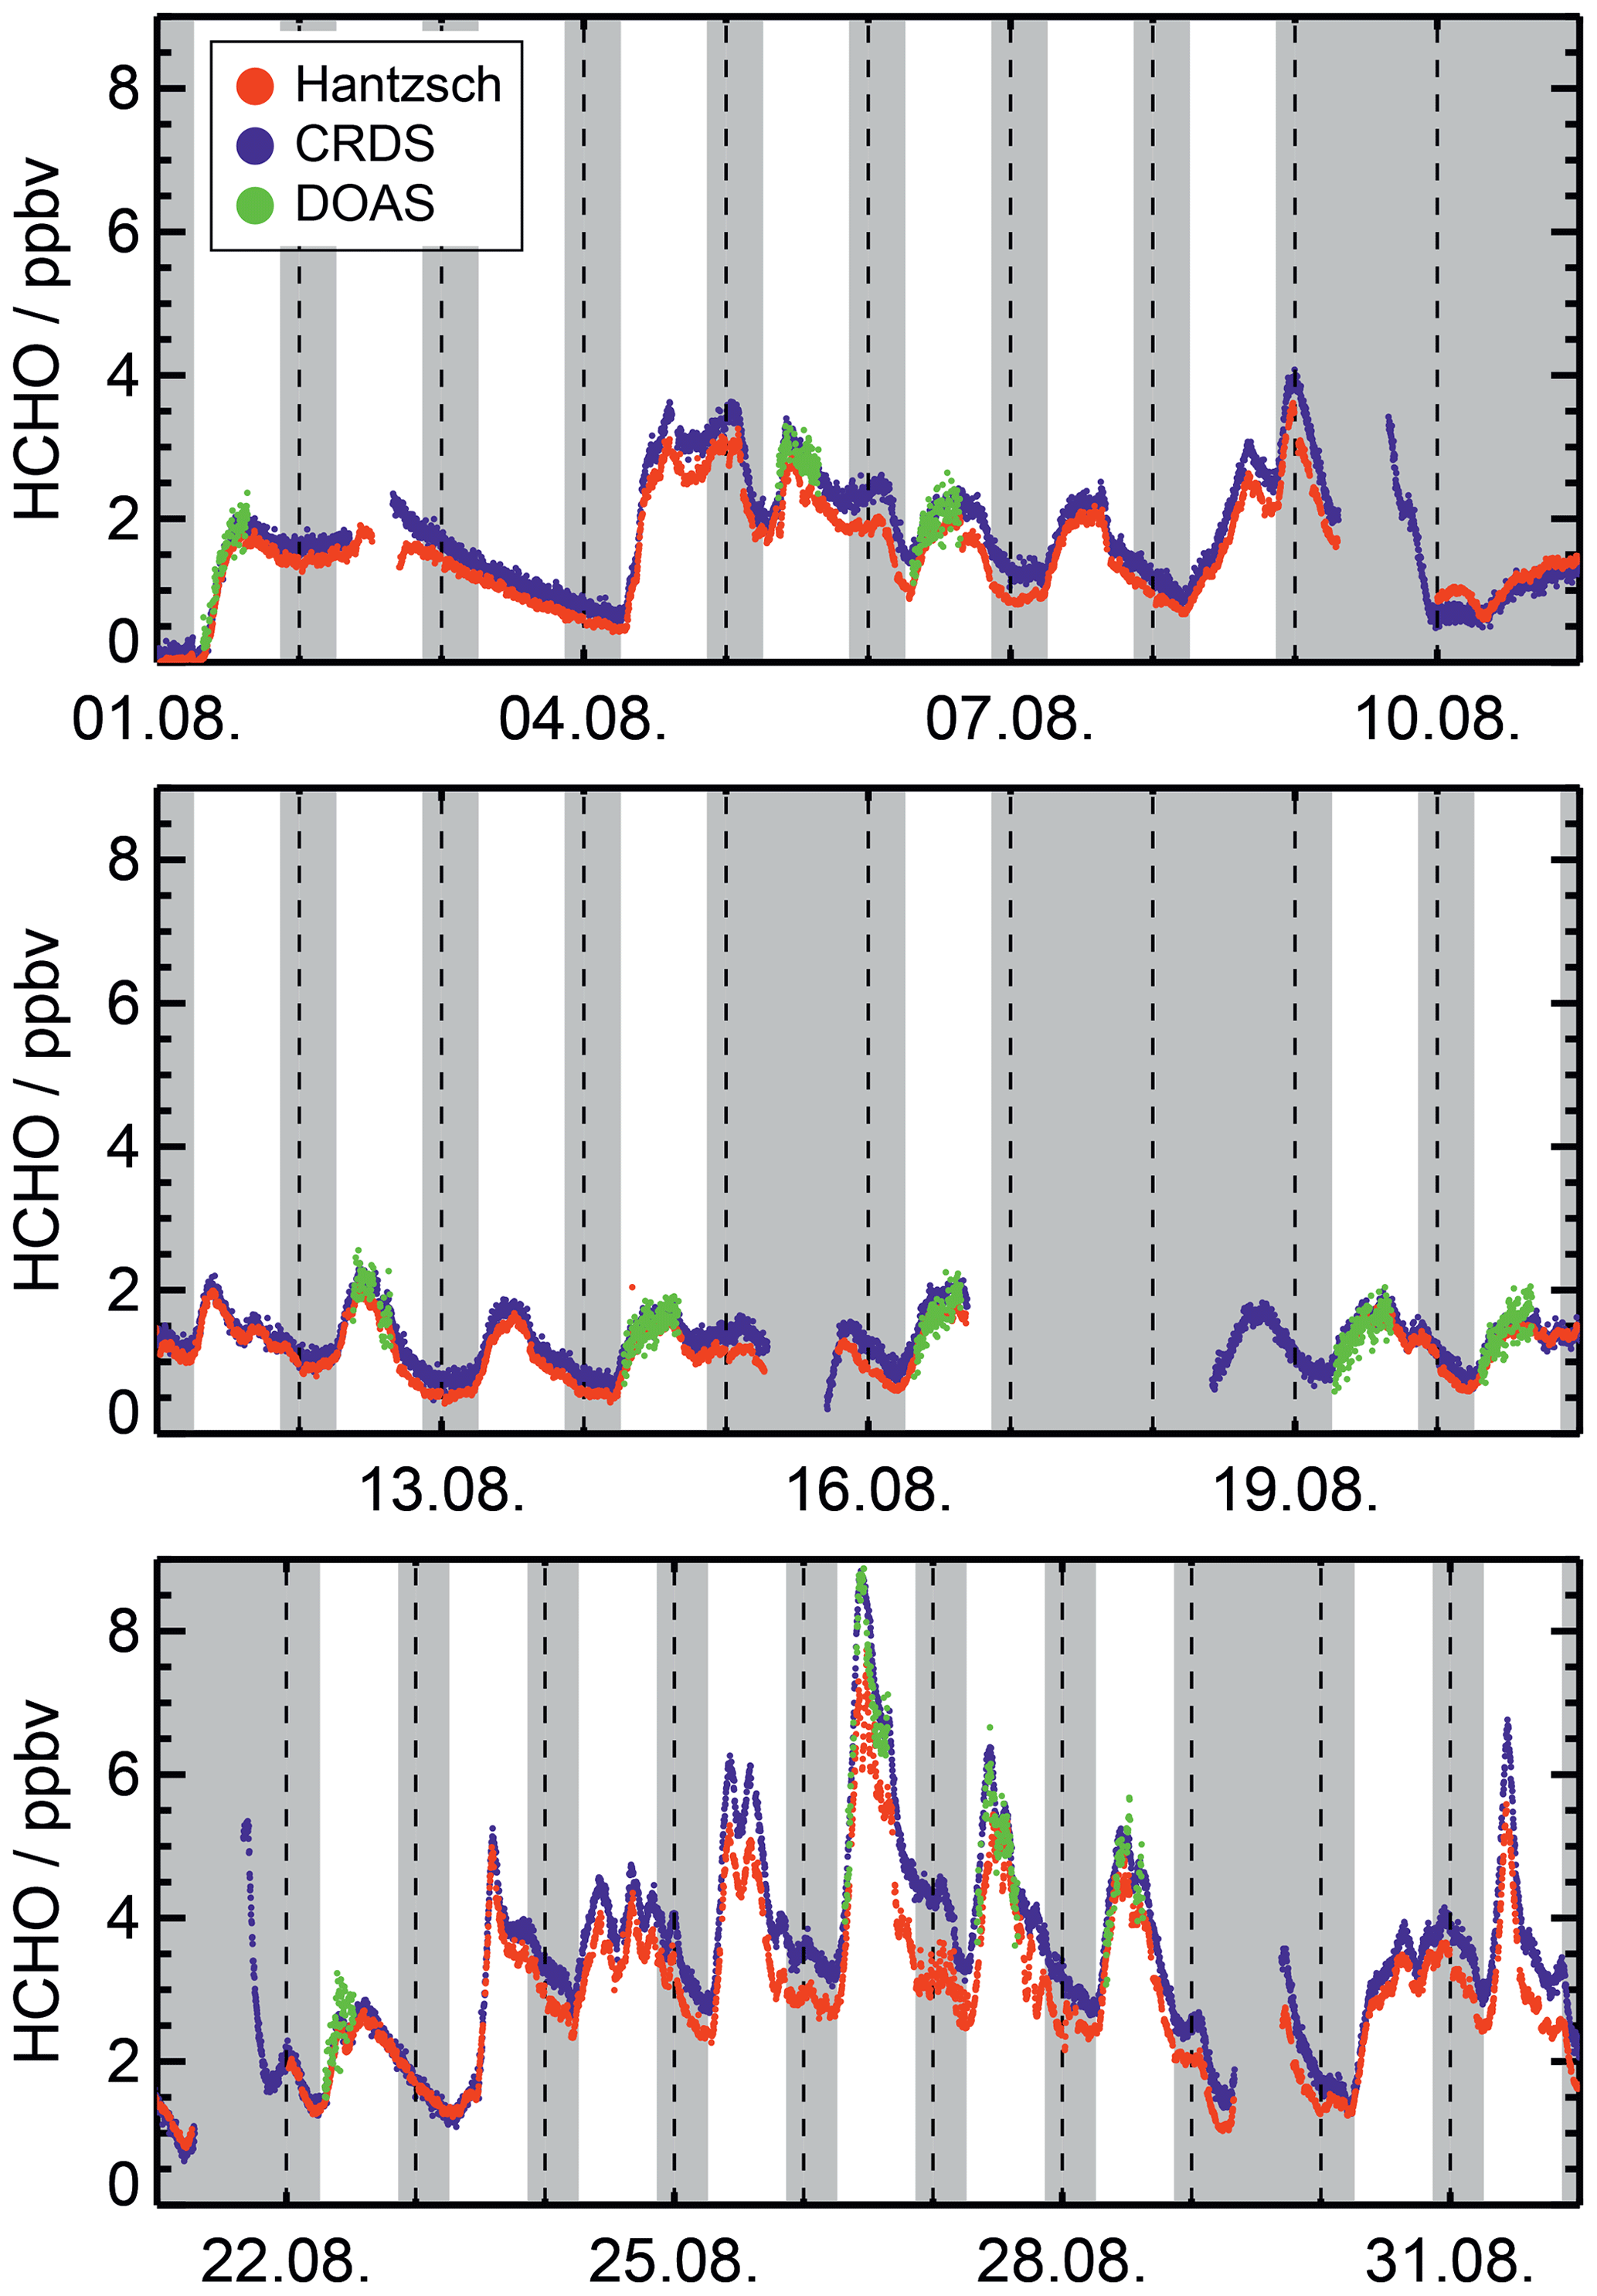
Figure 7Formaldehyde measurements obtained by the Hantzsch, CRDS and DOAS instruments in experiments performed in the SAPHIR chamber during August 2019, when the chamber was continuously flushed with ambient air (JULIAC campaign). Grey areas indicate nighttime or periods when the chamber roof was kept closed during the daytime, and dashed vertical lines indicate midnight.
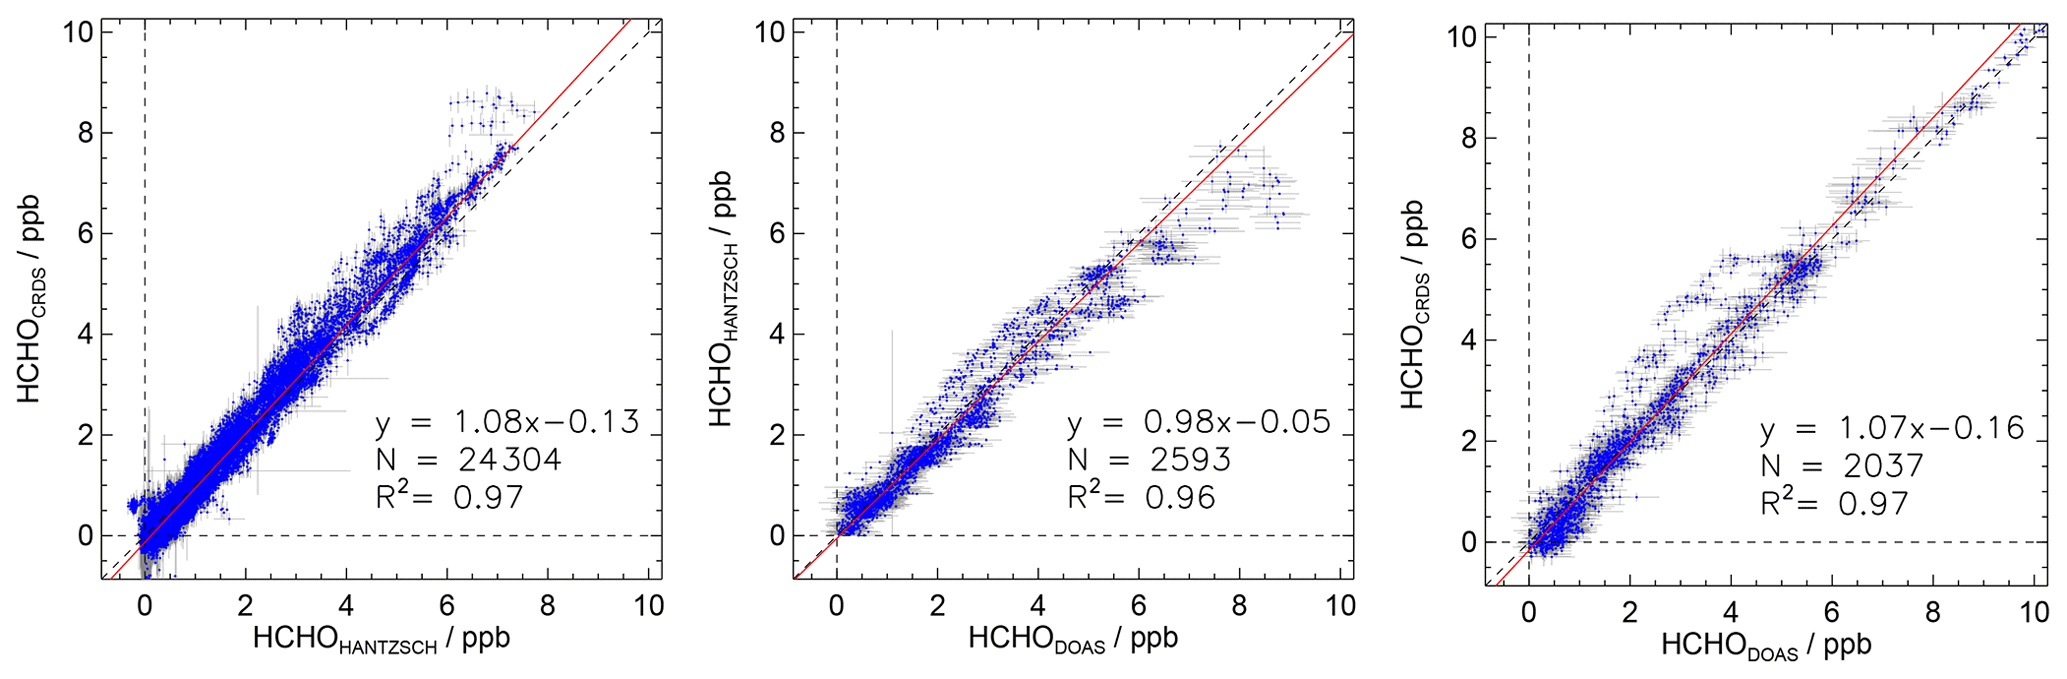
Figure 8Correlation plots of measurements obtained by the Hantzsch, CRDS and DOAS instruments during experiments performed in the SAPHIR chamber. Data were acquired between June to December 2019 (time resolution: 180 s). Red lines show results from regression analysis. Error bars represent 1σ errors in the measurements.
Figure 7 shows an example of a time series from the JULIAC campaign in August 2019. Formaldehyde varied from 0 to 8 ppbv. During the last week of August, the ambient temperatures and ozone levels were high: up to 40 ∘C and 100 ppbv, respectively. The production of formaldehyde is likely enhanced by a high oxidation rate of organic compounds. The three time series of measurements from the three instruments exhibit the same behaviour and show good overall agreement in measured concentrations. During several periods such as 23–31 August, systematic deviations within the range of a few hundred pptv are observed. It was not possible to identify a specific reason for these deviations. Most likely, unaccounted-for small changes in either the calibration or the offset values caused these differences.
Figure 8 shows the results of the correlation and regression analysis (time resolution: 180 s, weighted fit with errors in both coordinates) of the entire data set between 1 June and 3 December 2019 (total number of day-long experiments: 73). The CRDS and Hantzsch instruments provided more than 24 000 data points and the two data sets show very good agreement (R2>0.96). This confirms the applicability of the two methods for atmospheric formaldehyde measurements. Measurements from the CRDS instrument are on average 8 % higher compared to measurements from the Hantzsch instrument. The intercept of the regression line is −0.13 ppbv. A comparison of the Hantzsch and DOAS measurements (2593 data points) also resulted in a high linear correlation coefficient of R2=0.96. DOAS measurements are on average 2 % higher than those of the Hantzsch instrument. Linear regression between the CRDS and DOAS measurements (2037 data points) resulted in a slope of 1.07 and an intercept of −0.16 ppbv along with a linear correlation coefficient of R2=0.97. The statistical errors in the fit parameters for the linear regression are lower than 0.01 due to the small errors in individual data points. All deviations of the slopes from unity are within the combined accuracies of the instruments (Table 1). No systematic deviations in the measurements were identified, and no corrections other than those described above were applied. This also demonstrates that the determined zero-point corrections can be applied over a wide range of atmospheric HCHO concentrations.
Instruments for the detection of formaldehyde have been compared before. Hak et al. (2005) reported several comparisons of measurements obtained by a Hantzsch and a broadband-DOAS instrument. Comparisons gave various results, ranging from good agreement (within the measurement uncertainties) to significant over- or underestimations. However, no consistent explanation for these variable results could be found. In 2008, Wisthaler et al. (2008) reported a comparison of formaldehyde measurements from five instruments based on four different measurement techniques. Measurements were performed in the SAPHIR chamber during five day-long experiments in January 2005. Measurement techniques included Hantzsch, broadband DOAS, HPCL and PTR-MS. Overall, there was good agreement between all measurements, with one exception. Significantly lower formaldehyde concentrations were observed in the Hantzsch and HPLC instruments when ozone was present up to a mixing ratio of 45 ppbv (Wisthaler et al., 2008). Interferences from ozone, water or methane in the HCHO measurements by the Hantzsch instrument were also found in other comparisons (Grossmann, 2003; Warneke et al., 2011). The manufacturer of the Hantzsch instrument states that ozone can interfere with HCHO measurements. Artificial signals equivalent to 1 ppbv HCHO are possible in the presence of 800 ppbv O3 (Aero-Laser GmbH, 2020). For the conditions present in the experiments performed in this work, however, such interference would be negligible. A recent review of spectrophotometric methods for formaldehyde detection reported that the Hantzsch derivatization reaction had high sensitivity, negligible chemical interferences, and only minimal sensitivity to other aldehydes and ketones (Hladová et al., 2019). This agrees with our findings, which do not hint at systematic cross-sensitivities under atmospheric conditions.
More than 100 d of measurements were performed by instruments that detected formaldehyde in photochemical experiments in the SAPHIR chamber in 2019. Two commercial instruments (a CRDS instrument from Picarro and a Hantzsch instrument from Aero-Laser) and one custom-built high-resolution DOAS instrument performed simultaneous measurements. 56 day-long experiments during which ambient air flowed continuously through the chamber (residence time approximately 1 h) were carried out. Measurements were performed during the day and night. In addition, HCHO was measured in 17 experiments investigating the photooxidation of specific organic compounds. Physical and chemical conditions were variable. Formaldehyde mixing ratios were similar to those found in field campaigns, with values of between 0 and 11 ppbv (Inomata et al., 2008; Leuchner et al., 2016). A comparison of the measurements obtained by the three instruments included more than 24 000 data points for the Hantzsch and CRDS instruments and 2600 data points for the DOAS instrument.
Analysis of the measurements revealed that the instrument zeros of the Hantzsch and CRDS instruments need to be treated carefully. The background signal of the Hantzsch instrument can change significantly within a few hours. Therefore, regular (at least every 2 h) zero measurements are needed to avoid systematic errors that can be as high as several 100 pptv. In addition, postprocessing the data can reduce systematic errors. Zero values for individual data points can then be calculated through the linear interpolation of zero measurements. In contrast, the instrument takes only the most recent zero measurement into account before it outputs a measured value, so systematic errors can occur if the instrument zero changes between two consecutive zero measurements.
The CRDS instrument also presented an instrument zero that drifts over several days. Changes in the range of 100 pptv per day were observed in these experiments. This drift is within the specifications of the instrument, but could be relevant for measurements in environments with low formaldehyde mixing ratios. In addition, the background signal exhibits a significant water dependence. The value decreases linearly with increasing water vapour mixing ratio, but the slope of the linear relationship changes drastically for water mixing ratios higher than 0.2 %. The water dependence for those mixing ratios is a factor of 15 lower than the dependence seen for water mixing ratios lower than 0.2 %. The slopes for these two ranges of the water vapour mixing ratio appear to be similar for all measurements in this work. Daily measurement of the instrumental zero and regular characterization of its water vapour dependence are required to avoid systematic errors. In addition, the manufacturer stated that the mathematical procedure used for peak integration and internal data evaluation was changed in an updated version of the instrument (software version 1.6.015 was implemented in the instrument used in this work). Therefore, the water vapour dependence may be different in other Picarro HCHO analysers.
The large sets of formaldehyde data measured by the Hantzsch, CRDS and DOAS instruments showed good agreement (R2≥0.96). The maximum deviation of the slopes of the regression lines from unity was 0.08. The combination of wet-chemical conversion with sensitive fluorescence detection provided a very good limit of detection in the experiments performed in this work, which is consistent with the instrument specification and results found in other studies (Hak et al., 2005; Salmon et al., 2008). The limit of detection of the CRDS instrument was 200 pptv (3σ) at a time resolution of 180 s. This is sufficient for many applications of the instrument. The limit of detection of the CRDS instrument can be lowered further if the data are averaged over a longer period.
The results presented here show that the three instruments provide reliable and accurate formaldehyde measurements in ambient air if the instrument zeros of the CRDS and Hantzsch instruments are adequately taken into account. Observations made in this work suggest that zero measurements should be done once a day and that the water dependence of the zero point of the CRDS instrument is unlikely to significantly change, at least for a month-long deployment. Among the two commercially available instruments, the Hantzsch instrument provides higher sensitivity, which is beneficial for measurements in environments with low HCHO concentrations. On the other hand, the CRDS instrument has the advantage of being small. In addition, largely unattended operation is possible because regular calibration or maintenance work is not required. This is ideal when long-term measurements are needed in environments where the slightly higher detection limit does not pose a problem.
Data are available from the Jülich Data database (https://doi.org/10.26165/JUELICH-DATA/VE2KNS, Fuchs et al., 2021).
MG was responsible for the Hantzsch measurements and analysed the data. He wrote the paper together with HF. AH designed the JULIAC campaign and organized the campaign together with HF and FH. FR was responsible for the CRDS and HPD for DOAS measurements. All coauthors (MG, FR, HPD, AH, FH, AKS, AW, HF) developed together the interpretation of data in intensive discussions. All coauthors commented on the entire manuscript and thereby contributed to the writing.
The authors declare that they have no conflict of interest.
This article is part of the special issue “Simulation chambers as tools in atmospheric research (AMT/ACP/GMD inter-journal SI)”. It is not associated with a conference.
This project received funding from the European Research Council (ERC) under the European Union's Horizon 2020 research and innovation program (grant agreement no. 681529).).
This research has been supported by the Horizon 2020 Framework Programme, H2020 Excellent Science (SARLEP (grant no. 681529)).
The article processing charges for this open-access publication were covered by the Forschungszentrum Jülich.
This paper was edited by Mingjin Tang and reviewed by three anonymous referees.
Aero-Laser GmbH: AL4021 Formaldehyde Monitor – Manual, available at: https://www.aero-laser.de/fileadmin/downloads/IM_AL4021_Rev.2.2.pdf, last access: 10 September 2020. a, b, c, d, e
Alvarado, L. M. A., Richter, A., Vrekoussis, M., Hilboll, A., Kalisz Hedegaard, A. B., Schneising, O., and Burrows, J. P.: Unexpected long-range transport of glyoxal and formaldehyde observed from the Copernicus Sentinel-5 Precursor satellite during the 2018 Canadian wildfires, Atmos. Chem. Phys., 20, 2057–2072, https://doi.org/10.5194/acp-20-2057-2020, 2020. a
Anderson, D. C., Nicely, J. M., Wolfe, G. M., Hanisco, T. F., Salawitch, R. J., Canty, T. P., Dickerson, R. R., Apel, E. C., Baidar, S., Bannan, T. J., Blake, N. J., Chen, D., Dix, B., Fernandez, R. P., Hall, S. R., Hornbrook, R. S., Gregory Huey, L., Josse, B., Jöckel, P., Kinnison, D. E., Koenig, T. K., Le Breton, M., Marécal, V., Morgenstern, O., Oman, L. D., Pan, L. L., Percival, C., Plummer, D., Revell, L. E., Rozanov, E., Saiz-Lopez, A., Stenke, A., Sudo, K., Tilmes, S., Ullmann, K., Volkamer, R., Weinheimer, A. J., and Zeng, G.: Formaldehyde in the tropical western Pacific: Chemical sources and sinks, convective transport, and representation in CAM-Chem and the CCMI Models, J. Geophys. Res.-Atmos., 122, 11201–11226, https://doi.org/10.1002/2016JD026121, 2017. a, b, c
Barry, H., Corner, L., Hancock, G., Peverall, R., and Ritchie, G. A. D.: Cross sections in the 2ν5 band of formaldehyde studied by cavity enhanced absorption spectroscopy near 1.76 µm, Phys. Chem. Chem. Phys., 4, 445–450, https://doi.org/10.1039/b109300m, 2002. a
Bohn, B. and Zilken, H.: Model-aided radiometric determination of photolysis frequencies in a sunlit atmosphere simulation chamber, Atmos. Chem. Phys., 5, 191–206, https://doi.org/10.5194/acp-5-191-2005, 2005. a
Brauers, T., Bossmeyer, J., Dorn, H.-P., Schlosser, E., Tillmann, R., Wegener, R., and Wahner, A.: Investigation of the formaldehyde differential absorption cross section at high and low spectral resolution in the simulation chamber SAPHIR, Atmos. Chem. Phys., 7, 3579–3586, https://doi.org/10.5194/acp-7-3579-2007, 2007. a
Cantrell, C. A., Davidson, J. A., McDaniel, A. H., Shetter, R. E., and Calvert, J. G.: Temperature-dependent formaldehyde cross sections in the near-ultraviolet spectral region, J. Phys. Chem.-US, 94, 3902–3908, https://doi.org/10.1021/j100373a008, 1990. a
Casset, A., Marchand, C., Le Calvé, S., Mirabel, P., and de Blay, F.: Human Exposure chamber for known formaldehyde levels: Generation and validation, Indoor Built Environ., 14, 173–182, https://doi.org/10.1177/1420326X05052767, 2005. a
Cazorla, M., Wolfe, G. M., Bailey, S. A., Swanson, A. K., Arkinson, H. L., and Hanisco, T. F.: A new airborne laser-induced fluorescence instrument for in situ detection of formaldehyde throughout the troposphere and lower stratosphere, Atmos. Meas. Tech., 8, 541–552, https://doi.org/10.5194/amt-8-541-2015, 2015. a
Crosson, E.: A cavity ring-down analyzer for measuring atmospheric levels of methane, carbon dioxide, and water vapor, Appl. Phys. B-Lasers O., 92, 403–408, https://doi.org/10.1007/s00340-008-3135-y, 2008. a
Dorn, P., Brandenburger, U., Brauers, T., and Hausmann, M.: A new in-situ laser long-path absorption instrument for the Measurement of tropospheric OH radicals, J. Atmos. Sci., 52, 3373–3380, 1995. a, b, c
Dugheri, S., Massi, D., Mucci, N., Marrubini, G., Capelli, G., Speltini, A., Bonferoni, M. C., and Arcangeli, G.: Exposure to airborne formaldehyde: Sampling and analytical methods – A review, Trends Environ. Anal. Chem., 29, e00116, https://doi.org/10.1016/j.teac.2021.e00116, 2021. a
Fortems-Cheiney, A., Chevallier, F., Pison, I., Bousquet, P., Saunois, M., Szopa, S., Cressot, C., Kurosu, T. P., Chance, K., and Fried, A.: The formaldehyde budget as seen by a global-scale multi-constraint and multi-species inversion system, Atmos. Chem. Phys., 12, 6699–6721, https://doi.org/10.5194/acp-12-6699-2012, 2012. a
Fuchs, H., Glowania, M., Dorn, H.-P., and Rohrer, F.: Formaldehyde Comparison (CRDS, DOAS, Hantzsch) SAPHIR chamber 2019, Jülich DATA [data set], V1, https://doi.org/10.26165/JUELICH-DATA/VE2KNS, 2021. a
Golden, R. and Valentini, M.: Formaldehyde and methylene glycol equivalence: Critical assessment of chemical and toxicological aspects, Regul. Toxicol. Pharm., 69, 178–186, https://doi.org/10.1016/j.yrtph.2014.03.007, 2014. a
Grossmann, D.: Hydrogen peroxide, organic peroxides, carbonyl compounds, and organic acids measured at Pabstthum during BERLIOZ, J. Geophys. Res.-Atmos., 108, 8250, https://doi.org/10.1029/2001JD001096, 2003. a, b
Gupta, K., Ulsamer, A., and Preuss, P.: Formaldehyde in indoor air: Sources and toxicity, Environ. Int., 8, 349–358, https://doi.org/10.1016/0160-4120(82)90049-6, 1982. a
Hak, C., Pundt, I., Trick, S., Kern, C., Platt, U., Dommen, J., Ordóñez, C., Prévôt, A. S. H., Junkermann, W., Astorga-Lloréns, C., Larsen, B. R., Mellqvist, J., Strandberg, A., Yu, Y., Galle, B., Kleffmann, J., Lörzer, J. C., Braathen, G. O., and Volkamer, R.: Intercomparison of four different in-situ techniques for ambient formaldehyde measurements in urban air, Atmos. Chem. Phys., 5, 2881–2900, https://doi.org/10.5194/acp-5-2881-2005, 2005. a, b, c, d, e
Hausmann, M., Brandenburger, U., Brauers, T., and Dorn, H.-P.: Detection of tropospheric OH radicals by long-path differential-optical-absorption spectroscopy: Experimental setup, accuracy, and precision, J. Geophys. Res., 102, 16011–16022, 1997. a, b
He, Z., Xiong, J., Kumagai, K., and Chen, W.: An improved mechanism-based model for predicting the long-term formaldehyde emissions from composite wood products with exposed edges and seams, Environ. Int., 132, 105086, https://doi.org/10.1016/j.envint.2019.105086, 2019. a
Hladová, M., Martinka, J., Rantuch, P., and Nečas, A.: Review of spectrophotometric methods for determination of formaldehyde, Journal of Slovak University of Technology, 27, 105–120, https://doi.org/10.2478/rput-2019-0012, 2019. a
Hoffnagle, J., Fleck, D., Rella, C., and Kim-Hak, D.: Quantification of atmospheric formaldehyde by near-infrared cavity ring-down Spectroscopy, in: AGU Fall Meeting 2017, 11–15 December 2017, New Orleans, Louisiana, USA, Poster A43A-1385, 2017. a, b, c
Hohaus, T., Kuhn, U., Andres, S., Kaminski, M., Rohrer, F., Tillmann, R., Wahner, A., Wegener, R., Yu, Z., and Kiendler-Scharr, A.: A new plant chamber facility, PLUS, coupled to the atmosphere simulation chamber SAPHIR, Atmos. Meas. Tech., 9, 1247–1259, https://doi.org/10.5194/amt-9-1247-2016, 2016. a
Hottle, J. R., Huisman, A. J., DiGangi, J. P., Kammrath, A., Galloway, M. M., Coens, K. L., and Keutsch, F. N.: A laser induced fluorescence-based instrument for in-situ measurements of atmospheric formaldehyde, Environ Sci. Technol., 43, 790–795, https://doi.org/10.1021/es801621f, 2009. a
Inomata, S., Tanimoto, H., Kameyama, S., Tsunogai, U., Irie, H., Kanaya, Y., and Wang, Z.: Technical Note: Determination of formaldehyde mixing ratios in air with PTR-MS: laboratory experiments and field measurements, Atmos. Chem. Phys., 8, 273–284, https://doi.org/10.5194/acp-8-273-2008, 2008. a, b
Kaiser, J., Li, X., Tillmann, R., Acir, I., Holland, F., Rohrer, F., Wegener, R., and Keutsch, F. N.: Intercomparison of Hantzsch and fiber-laser-induced-fluorescence formaldehyde measurements, Atmos. Meas. Tech., 7, 1571–1580, https://doi.org/10.5194/amt-7-1571-2014, 2014. a, b
Kelly, T. J. and Fortune, C. R.: Continuous monitoring of gaseous formaldehyde using an improved fluorescence approach, Int. J. Environ. An. Ch., 54, 249–263, https://doi.org/10.1080/03067319408034093, 1994. a
Kuhn, U., Andreae, M. O., Ammann, C., Araújo, A. C., Brancaleoni, E., Ciccioli, P., Dindorf, T., Frattoni, M., Gatti, L. V., Ganzeveld, L., Kruijt, B., Lelieveld, J., Lloyd, J., Meixner, F. X., Nobre, A. D., Pöschl, U., Spirig, C., Stefani, P., Thielmann, A., Valentini, R., and Kesselmeier, J.: Isoprene and monoterpene fluxes from Central Amazonian rainforest inferred from tower-based and airborne measurements, and implications on the atmospheric chemistry and the local carbon budget, Atmos. Chem. Phys., 7, 2855–2879, https://doi.org/10.5194/acp-7-2855-2007, 2007. a
Leuchner, M., Ghasemifard, H., Lüpke, M., Ries, L., Schunk, C., and Menzel, A.: Seasonal and diurnal variation of formaldehyde and its meteorological drivers at the GAW site Zugspitze, Aerosol Air Qual. Res., 16, 801–815, https://doi.org/10.4209/aaqr.2015.05.0334, 2016. a
Li, X., Wang, S., Zhou, R., and Zhou, B.: Urban atmospheric formaldehyde concentrations measured by a differential optical absorption spectroscopy method, Environ. Sci., 16, 291–297, https://doi.org/10.1039/C3EM00545C, 2014. a
Liu, J., Li, X., Yang, Y., Wang, H., Wu, Y., Lu, X., Chen, M., Hu, J., Fan, X., Zeng, L., and Zhang, Y.: An IBBCEAS system for atmospheric measurements of glyoxal and methylglyoxal in the presence of high NO2 concentrations, Atmos. Meas. Tech., 12, 4439–4453, https://doi.org/10.5194/amt-12-4439-2019, 2019. a
Liu, X., Mason, M. A., Guo, Z., Krebs, K. A., and Roache, N. F.: Source emission and model evaluation of formaldehyde from composite and solid wood furniture in a full-scale chamber, Atmos. Environ., 122, 561–568, https://doi.org/10.1016/j.atmosenv.2015.09.062, 2015. a
Lowe, D. C. and Schmidt, U.: Formaldehyde (HCHO) measurements in the nonurban atmosphere, J. Geophys. Res.-Oceans, 88, 10844–10858, https://doi.org/10.1029/JC088iC15p10844, 1983. a
McManus, J. B., Zahniser, M., Nelson, D., Shorter, J., Herndon, S., Wood, E., and Wehr, R.: Application of quantum cascade lasers to high-precision atmospheric trace gas measurements, Opt. Eng., 49, 111124, https://doi.org/10.1117/1.3498782, 2010. a
Nogueira, T., Dominutti, P. A., de Carvalho, L. R. F., Fornaro, A., and Andrade, M. D. F.: Formaldehyde and acetaldehyde measurements in urban atmosphere impacted by the use of ethanol biofuel: Metropolitan area of Sao Paulo (MASP), Fuel, 134, 505–513, https://doi.org/10.1016/j.fuel.2014.05.091, 2014. a
Novelli, A., Vereecken, L., Bohn, B., Dorn, H.-P., Gkatzelis, G. I., Hofzumahaus, A., Holland, F., Reimer, D., Rohrer, F., Rosanka, S., Taraborrelli, D., Tillmann, R., Wegener, R., Yu, Z., Kiendler-Scharr, A., Wahner, A., and Fuchs, H.: Importance of isomerization reactions for OH radical regeneration from the photo-oxidation of isoprene investigated in the atmospheric simulation chamber SAPHIR, Atmos. Chem. Phys., 20, 3333–3355, https://doi.org/10.5194/acp-20-3333-2020, 2020. a
Parrish, D. D., Ryerson, T. B., Mellqvist, J., Johansson, J., Fried, A., Richter, D., Walega, J. G., Washenfelder, R. A., de Gouw, J. A., Peischl, J., Aikin, K. C., McKeen, S. A., Frost, G. J., Fehsenfeld, F. C., and Herndon, S. C.: Primary and secondary sources of formaldehyde in urban atmospheres: Houston Texas region, Atmos. Chem. Phys., 12, 3273–3288, https://doi.org/10.5194/acp-12-3273-2012, 2012. a
Picarro Inc.: H2CO gas concentration analyzer – datasheet, G2307-DS24-V1.1-180405, available at: https://www.picarro.com/sites/default/files/Picarro_G2307%20Datasheet_180328.pdf, last access: 10 September 2020. a, b, c, d, e
Platt, U. and Stutz, J.: Differential optical absorption spectroscopy, principles and applications, Springer, Berlin, Germany, ISBN: 978-3-540-21193-8, 2008. a, b
Qin, D., Guo, B., Zhou, J., Cheng, H., and Chen, X.: Indoor air formaldehyde (HCHO) pollution of urban coach cabins, Sci. Rep.-UK, 10, 332, https://doi.org/10.1038/s41598-019-57263-4, 2020. a
Resch-Genger, U. and Rurack, K.: Determination of the photoluminescence quantum yield of dilute dye solutions (IUPAC Technical Report), Pure Appl. Chem., 85, 2005–2013, https://doi.org/10.1351/pac-rep-12-03-03, 2013. a
Rohrer, F., Bohn, B., Brauers, T., Brüning, D., Johnen, F.-J., Wahner, A., and Kleffmann, J.: Characterisation of the photolytic HONO-source in the atmosphere simulation chamber SAPHIR, Atmos. Chem. Phys., 5, 2189–2201, https://doi.org/10.5194/acp-5-2189-2005, 2005. a, b
Rurack, K. and Spieles, M.: Fluorescence quantum yields of a series of red and near-infrared dyes emitting at 600–1000 nm, Anal. Chem., 83, 1232–1242, https://doi.org/10.1021/ac101329h, 2011. a
Salmon, R. A., Bauguitte, S. J.-B., Bloss, W., Hutterli, M. A., Jones, A. E., Read, K., and Wolff, E. W.: Measurement and interpretation of gas phase formaldehyde concentrations obtained during the CHABLIS campaign in coastal Antarctica, Atmos. Chem. Phys., 8, 4085–4093, https://doi.org/10.5194/acp-8-4085-2008, 2008. a
Salthammer, T.: Formaldehyde sources, formaldehyde concentrations and air exchange rates in European housings, Build. Environ., 150, 219–232, https://doi.org/10.1016/j.buildenv.2018.12.042, 2019. a, b
Schlosser, E., Bohn, B., Brauers, T., Dorn, H.-P., Fuchs, H., Häseler, R., Hofzumahaus, A., Holland, F., Rohrer, F., Rupp, L. O., Siese, M., Tillmann, R., and Wahner, A.: Intercomparison of two hydroxyl radical measurement techniques at the atmosphere simulation chamber SAPHIR, J. Atmos. Chem., 56, 187–205, https://doi.org/10.1007/s10874-006-9049-3, 2007. a
Schlosser, E., Brauers, T., Dorn, H.-P., Fuchs, H., Häseler, R., Hofzumahaus, A., Holland, F., Wahner, A., Kanaya, Y., Kajii, Y., Miyamoto, K., Nishida, S., Watanabe, K., Yoshino, A., Kubistin, D., Martinez, M., Rudolf, M., Harder, H., Berresheim, H., Elste, T., Plass-Dülmer, C., Stange, G., and Schurath, U.: Technical Note: Formal blind intercomparison of OH measurements: results from the international campaign HOxComp, Atmos. Chem. Phys., 9, 7923–7948, https://doi.org/10.5194/acp-9-7923-2009, 2009. a
Seinfeld, J. H. and Pandis, S. N.: Atmospheric Chemistry and Physics: From Air Pollution to Climate Change, edn. 3, John Wiley & Sons, Hoboken, New Jersey, USA, 1152 pp., ISBN 978-1-118-94740-1, 2016. a
Shutter, J. D., Allen, N. T., Hanisco, T. F., Wolfe, G. M., St. Clair, J. M., and Keutsch, F. N.: A new laser-based and ultra-portable gas sensor for indoor and outdoor formaldehyde (HCHO) monitoring, Atmos. Meas. Tech., 12, 6079–6089, https://doi.org/10.5194/amt-12-6079-2019, 2019. a, b
Still, T. J., Al-Haider, S., Seakins, P. W., Sommariva, R., Stanton, J. C., Mills, G., and Penkett, S. A.: Ambient formaldehyde measurements made at a remote marine boundary layer site during the NAMBLEX campaign – a comparison of data from chromatographic and modified Hantzsch techniques, Atmos. Chem. Phys., 6, 2711–2726, https://doi.org/10.5194/acp-6-2711-2006, 2006. a
Sumner, A. L., Shepson, P. B., Couch, T. L., Thornberry, T., Carroll, M. A., Sillman, S., Pippin, M., Bertman, S., Tan, D., Faloona, I., Brune, W., Young, V., Cooper, O., Moody, J., and Stockwell, W.: A study of formaldehyde chemistry above a forest canopy, J. Geophys. Res.-Atmos., 106, 24387–24405, https://doi.org/10.1029/2000JD900761, 2001. a
Vlasenko, A., Macdonald, A. M., Sjostedt, S. J., and Abbatt, J. P. D.: Formaldehyde measurements by Proton transfer reaction – Mass Spectrometry (PTR-MS): correction for humidity effects, Atmos. Meas. Tech., 3, 1055–1062, https://doi.org/10.5194/amt-3-1055-2010, 2010. a
Warneke, C., Veres, P., Holloway, J. S., Stutz, J., Tsai, C., Alvarez, S., Rappenglueck, B., Fehsenfeld, F. C., Graus, M., Gilman, J. B., and de Gouw, J. A.: Airborne formaldehyde measurements using PTR-MS: calibration, humidity dependence, inter-comparison and initial results, Atmos. Meas. Tech., 4, 2345–2358, https://doi.org/10.5194/amt-4-2345-2011, 2011. a, b, c
Washenfelder, R. A., Attwood, A. R., Flores, J. M., Zarzana, K. J., Rudich, Y., and Brown, S. S.: Broadband cavity-enhanced absorption spectroscopy in the ultraviolet spectral region for measurements of nitrogen dioxide and formaldehyde, Atmos. Meas. Tech., 9, 41–52, https://doi.org/10.5194/amt-9-41-2016, 2016. a
Weibring, P., Richter, D., Walega, J. G., and Fried, A.: First demonstration of a high performance difference frequency spectrometer on airborne platforms, Opt. Express, 15, 13476–13495, https://doi.org/10.1364/OE.15.013476, 2007. a
Winberry, W. T., Richter, D., Walega, J. G., and Fried, A.: Compendium of methods for the determination of toxic organic compounds in ambient air: Compendium method TO11A, edn. 2, U.S. Environmental Protection Agency, Cincinnati, Ohio, USA, 1999. a
Wisthaler, A., Apel, E. C., Bossmeyer, J., Hansel, A., Junkermann, W., Koppmann, R., Meier, R., Müller, K., Solomon, S. J., Steinbrecher, R., Tillmann, R., and Brauers, T.: Technical Note: Intercomparison of formaldehyde measurements at the atmosphere simulation chamber SAPHIR, Atmos. Chem. Phys., 8, 2189–2200, https://doi.org/10.5194/acp-8-2189-2008, 2008. a, b, c, d
Wolfe, G. M., Nicely, J. M., St. Clair, J. M., Hanisco, T. F., Liao, J., Oman, L. D., Brune, W. B., Miller, D., Thames, A., González Abad, G., Ryerson, T. B., Thompson, C. R., Peischl, J., McKain, K., Sweeney, C., Wennberg, P. O., Kim, M., Crounse, J. D., Hall, S. R., Ullmann, K., Diskin, G., Bui, P., Chang, C., and Dean-Day, J.: Mapping hydroxyl variability throughout the global remote troposphere via synthesis of airborne and satellite formaldehyde observations, P. Natl. Acad. Sci. USA, 116, 11171–11180, https://doi.org/10.1073/pnas.1821661116, 2019. a
World Health Organization: Who guidelines for indoor air quality: selected pollutants, World Health Organization (WHO), Copenhagen, Denmark, 103–142, 2010. a
Xiong, J., Zhang, Y., and Huang, S.: Characterisation of VOC and Formaldehyde Emission from building materials in a static environmental chamber: Model development and application, Indoor Built Environ., 20, 217–225, https://doi.org/10.1177/1420326X103874801, 2011. a
Yuan, B., Koss, A. R., Warneke, C., Coggon, M., Sekimoto, K., and de Gouw, J. A.: Proton-Transfer-Reaction Mass Spectrometry: Applications in atmospheric sciences, Chem. Rev., 117, 13187–13229, https://doi.org/10.1021/acs.chemrev.7b00325, 2017. a
Zhang, Y., Li, R., Min, Q., Bo, H., Fu, Y., Wang, Y., and Gao, Z.: The controlling factors of atmospheric formaldehyde (HCHO) in Amazon as seen from satellite, Earth Space Sci., 6, 959–971, https://doi.org/10.1029/2019EA000627, 2019. a