the Creative Commons Attribution 4.0 License.
the Creative Commons Attribution 4.0 License.
 | 17 Jun 2021
An automated system for trace gas flux measurements from plant foliage and other plant compartments
Markku Koskinen
Tatu Polvinen
Salla Tenhovirta
Kaisa Rissanen
Marjo Patama
Alessandro Zanetti
Mari Pihlatie
Plant shoots can act as sources or sinks of trace gases including methane and nitrous oxide. Accurate measurements of these trace gas fluxes require enclosing of shoots in closed non-steady-state chambers. Due to plant physiological activity, this type of enclosure, however, leads to CO2 depletion in the enclosed air volume, condensation of transpired water, and warming of the enclosures exposed to sunlight, all of which may bias the flux measurements. Here, we present ShoTGa-FluMS (SHOot Trace Gas FLUx Measurement System), a novel measurement system designed for continuous and automated measurements of trace gas and volatile organic compound (VOC) fluxes from plant shoots. The system uses transparent shoot enclosures equipped with Peltier cooling elements and automatically replaces fixated CO2 and removes transpired water from the enclosure. The system is designed for measuring trace gas fluxes over extended periods, capturing diurnal and seasonal variations, and linking trace gas exchange to plant physiological functioning and environmental drivers. Initial measurements show daytime CH4 emissions of two pine shoots of 0.056 and 0.089 nmol per gram of foliage dry weight (d.w.) per hour or 7.80 and 13.1 . Simultaneously measured CO2 uptake rates were 9.2 and 7.6 , and transpiration rates were 1.24 and 0.90 . Concurrent measurement of VOC emissions demonstrated that potential effects of spectral interferences on CH4 flux measurements were at least 10-fold smaller than the measured CH4 fluxes. Overall, this new system solves multiple technical problems that have so far prevented automated plant shoot trace gas flux measurements and holds the potential for providing important new insights into the role of plant foliage in the global CH4 and N2O cycles.
- Article
(3953 KB) - Full-text XML
- BibTeX
- EndNote


Plants have recently been recognized as potential sources and sinks of atmospheric trace gases including the greenhouse gases methane (CH4) and nitrous oxide (N2O) (e.g. Keppler et al., 2006; Machacova et al., 2016; Carmichael et al., 2014; Pangala et al., 2015; Machacova et al., 2019). Measurements of the CH4 and N2O exchange between plants and the atmosphere, however, so far remain mostly limited to stem surface fluxes (Barba et al., 2019a; Covey and Megonigal, 2019), where recent advances in measurement techniques have enabled continuous measurements of trace gas fluxes by automated chamber systems (Barba et al., 2019b). While the CO2 exchange from plant shoots has been measured for more than a century, few direct measurements of the CH4 and N2O exchange of plant shoots and/or foliage have been reported thus far (Machacova et al., 2016; Sundqvist et al., 2012; Takahashi et al., 2012). In particular, no continuous measurements of tree shoot CH4 or N2O exchange have yet been conducted. This lack of available shoot flux data stands in contrast to reports of CH4 and N2O emissions from plant foliage under laboratory conditions and widespread speculation about their role in the global CH4 and N2O cycles (e.g. Keppler et al., 2006; Lenhart et al., 2018).
This data gap likely results from the high degree of technical difficulty associated with leaf-level trace gas flux measurements. Due to the small CH4 and N2O exchange rates at leaf surfaces relative to their atmospheric background mixing ratio, fluxes of these gases can only be measured by static (i.e. non-flow-through, non-steady-state) chamber techniques. In such measurements, a plant shoot is enclosed and the change in the trace gas mixing ratio over time is monitored in the enclosed air (e.g. Pihlatie et al., 2005, 2013). Such non-steady-state measurements, however, are impeded by other changes to the chemical and physical properties of the enclosure air volume. Plant shoots transpire water (H2O), fixate carbon dioxide (CO2), and emit volatile organic compounds (VOCs) at rates much higher than trace gas fluxes (e.g. Seco et al., 2007). This leads to the rapid accumulation of H2O and VOCs and the depletion of CO2 in the enclosed air volume. In addition, solar irradiation heats the enclosed space and temperatures 10 ∘C above ambient conditions have been reported even in large soil surface enclosures (Koskinen et al., 2014).
When measured concurrently with trace gas, fluxes of CO2, H2O, and VOCs can provide additional information on the mechanisms that control plant trace gas emissions. Water and CO2 fluxes allow us to quantify the gas conductivity of the leaf surface (i.e. stomatal conductance), and leaf metabolic activities (photosynthesis and respiration rates), respectively. Simultaneous measurements of VOC fluxes allow us to assess the potential links between CH4 and co-produced reactive compounds in plant foliage and thus help identify the source process of CH4 emissions (Benzing et al., 2017). In addition, VOC emissions may cause spectral interferences in trace gas analysers (Kohl et al., 2019). Monitoring VOC fluxes concurrently with trace gas fluxes can therefore help ensure the validity of trace gas flux measurements.
Continuous, automated, and frequent measurements of plant shoot trace gas exchange will lead to important insights into the basic mechanisms of plant–atmosphere interactions and the role of vegetation in the global cycles of CH4, N2O, and other trace gases. Realizing this potential, however, requires a solution to the above-mentioned technical challenges as currently commercially available leaf-level trace gas exchange measurement systems (e.g. Li-Cor LI-6800) are limited to dynamic chamber measurements and provide insufficient leak tightness for static chamber measurements. Here, we present ShoTGa-FluMS (SHOot Trace Gas FLUx Measurement System), a measurement system capable of measuring trace gas exchange at plant shoots while regulating temperature, humidity, and CO2 mixing ratios in the shoot enclosure. We designed the system as a modular setup adaptable to different measurement projects and so far have constructed two implementations optimized for distinct measurement needs (Fig. 1). The first implementation, designated ShoTGa-clim2, is connected to two chambers placed inside a climate-controlled plant growth cabinet and is currently used to measure shoot CH4 emissions and root-to-shoot CH4 transport under controlled environmental conditions (Fig. 1a). The second implementation, named ShoTGa-gh7, fits up to seven shoot chambers and is currently used for treatment–control experiments with tree saplings in a greenhouse compartment (Fig. 1b).
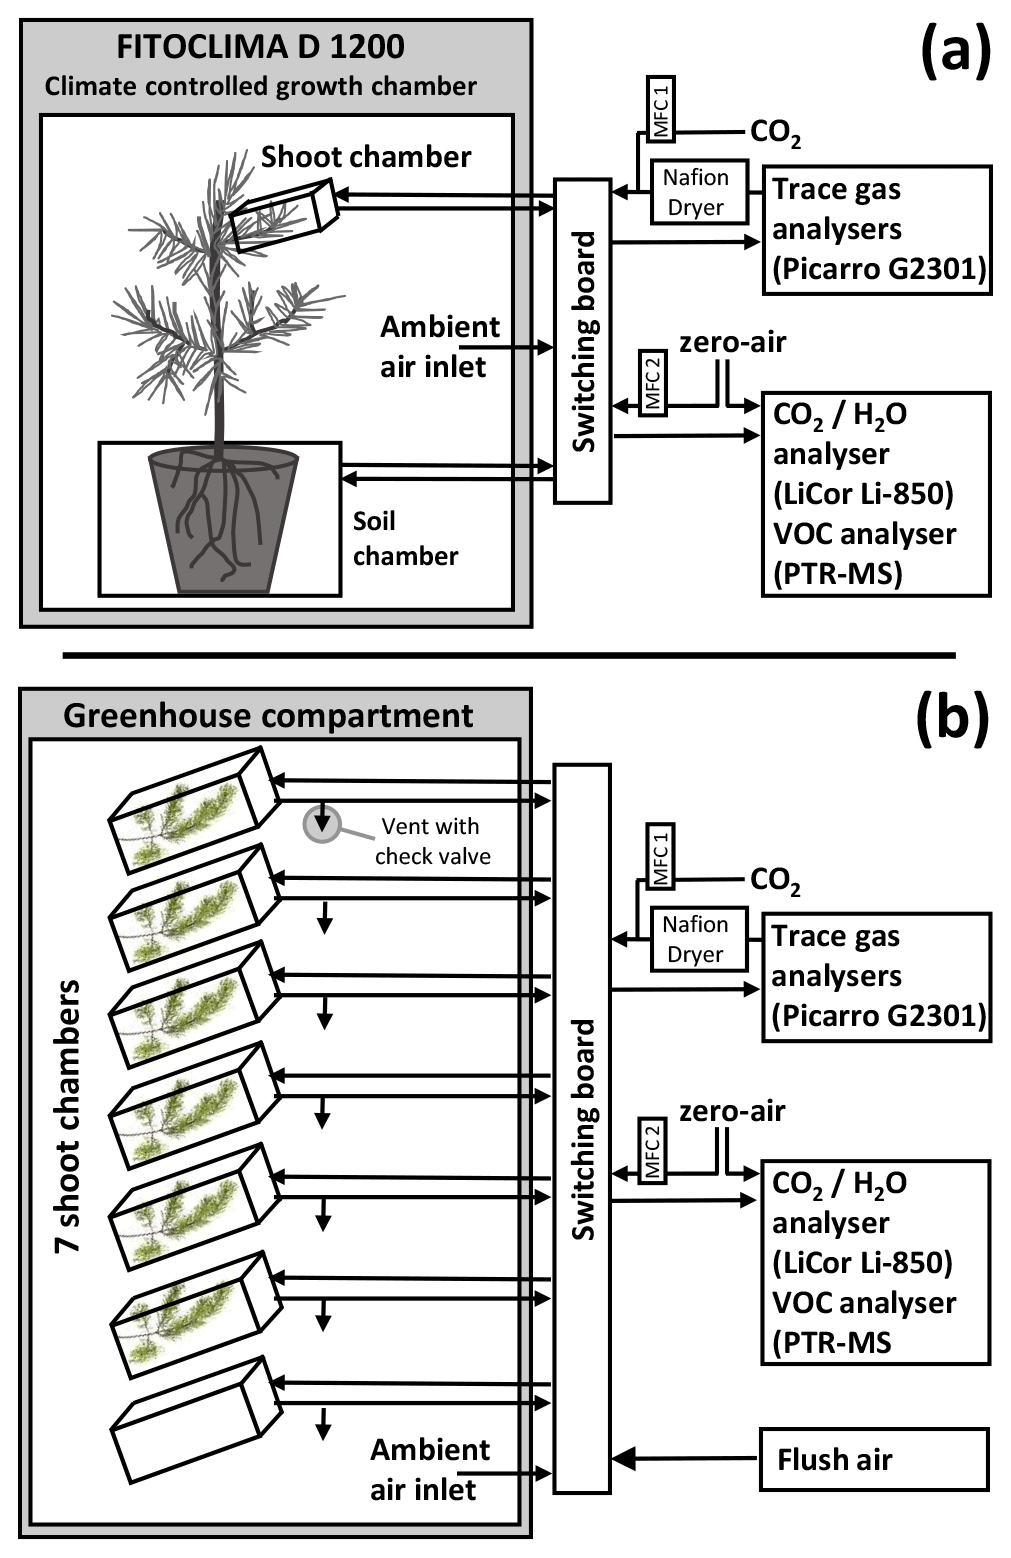
Figure 1Schematic of ShoTGa-FluMS, a measurement system to quantify trace gas exchange at plant shoots. We constructed two implementations of this system: ShoTGa-clim2 consists of one shoot and one soil chamber placed inside a climate-controlled cabinet (a), whereas ShoTGa-gh7 consists of seven shoot chambers and is located in a greenhouse compartment (b). Both systems allow measuring trace gas fluxes in a static chamber module and major gases and volatiles in a dynamic chamber module.
Both systems are capable of (1) temperature control (cooling) of each shoot chamber; (2) automated static chamber (i.e. closed-loop) trace gas exchange measurements of inert gases (e.g. CH4, N2O) with autonomous CO2 addition and removal of excess humidity; (3) dynamic chamber (i.e. flow-through, steady-state) measurements of CO2, H2O, and VOC fluxes; (4) flushing of the shoot chamber with ambient air between the measurements; and (5) recording of temperature and photosynthetically active radiation (PAR) from the chambers.
In this publication, we describe the setup of the two systems and provide results from initial tests and a validation experiment with two Scots pines (Pinus sylvestris) placed in ShoTGa-gh7. We focus on the overall system setup, environmental controls, and CH4 flux measurements. CO2, H2O, and VOC flux measurements follow routine dynamic chamber methods and are only discussed to the extent to which they are relevant for the overall system design.
2.1 System components
Both implementations of ShoTGa-FluMS consist of the following components (Fig. 1):
-
shoot and/or soil enclosure chambers (Sect. 2.1.1)
-
a static (closed-loop) chamber module for trace gas flux measurements (Sect. 2.1.2)
-
installations to ensure constant conditions during closed-loop measurements (Sect. 2.1.3)
-
a dynamic (flow-through) chamber module for water, CO2, and VOC flux measurements (Sect. 2.1.4)
-
installations to flush inactive chambers with ambient air (Sect. 2.1.5)
-
a switching board that directs gas flows to and from the different chambers, measurement modes, and analysers (Sect. 2.1.6)
-
the control software and a central data recording system (Sect. 2.1.7).
2.1.1 Plant and soil chambers
ShoTGa-FluMS follows a modular design, such that different types of static chambers can be connected to the measurement system. This allows the system to be adopted to plants with distinct shoot geometries (e.g. coniferous versus deciduous trees) and to include other surfaces (e.g. tree stems). Currently, ShoTGa-clim2 is equipped with one shoot chamber and one soil chamber, whereas ShoTGa-gh7 is equipped with up to seven shoot chambers.
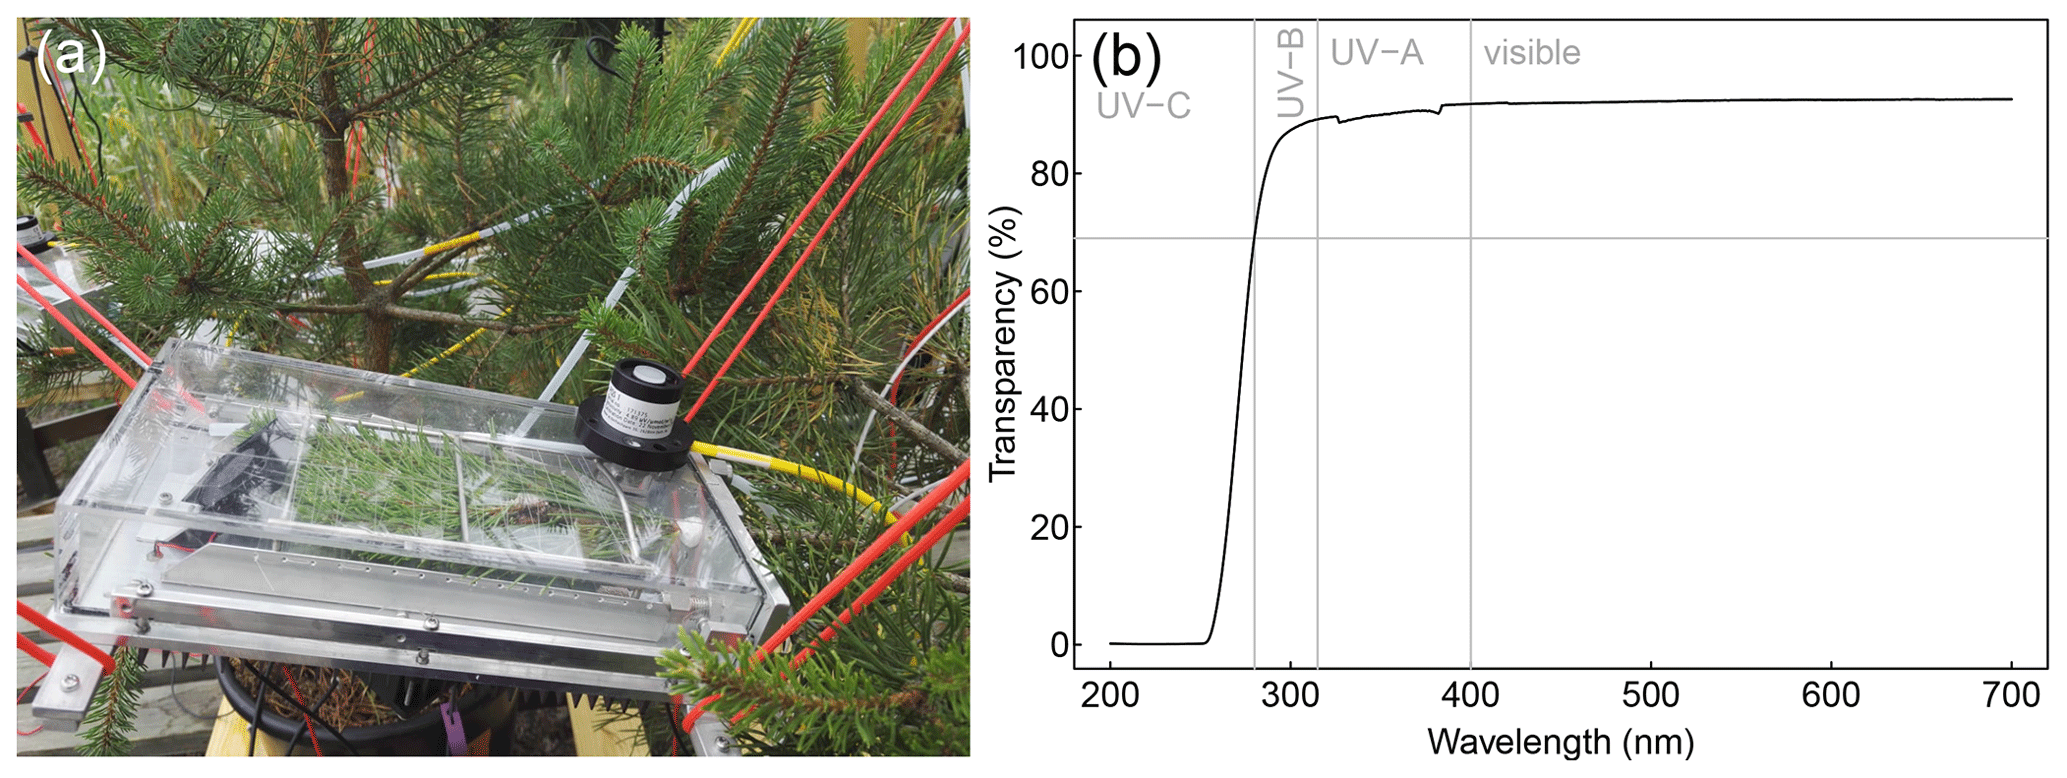
Figure 2Picture of the shoot enclosures used for ShoTGa-FluMS (a) and the UV–Vis transmission spectrum of the transparent chamber cover (b).
Shoot chambers (Fig. 2a) were custom built by Toivo Pohja Tmi (Juupajoki, Finland). The chambers' inner dimensions are 12 × 24 × 4 cm, and each chamber encloses a volume of 1.15 L. The bottom and the rear plate of the chamber are constructed from aluminium; the other sides are constructed from UV-transparent acrylic glass covered with FEP tape on the inside of the chamber. UV transparency of the cover was confirmed by UV–Vis spectroscopy (PerkinElmer Lambda 25; Fig. 2b). The connection between the removable cover and aluminium base of the chamber is sealed with a thin (1 mm) foam gasket placed in a groove in the cover against the bottom of the base and in a groove in the aluminium rear plate against the rear end of the cover. The seal can be further improved by applying vacuum grease (Sigma-Aldrich) to the gasket. The cover is attached to the base with eight screws: six against the bottom and two against the rear plate. To seal the opening for the shoot in the rear plate, the shoot is buffered with a pressure-sensitive adhesive (Blu Tack, Bostik SA) wrapped in PTFE tape at the chamber opening. The needles or leaves are held in place inside the chamber by means of a fishing-line bed.
The bottom of each chamber is equipped with a Peltier cooling element. One fan is located inside each chamber; a second fan was placed outside below each Peltier element on a finned radiator. Each chamber is further equipped with a Pt 100 temperature probe (SKS Automaatio Oy) placed inside the chamber and a PAR sensor (Kipp & Zonen PQS1) placed on top of the chamber.
The soil chamber consists of a custom-built aluminium container of 40 × 40 × 30 cm (volume 48 L) with a cover made of the same acrylic glass as the shoot enclosure chamber (Toivo Pohja Tmi, Juupajoki, Finland). The container is flushed between the measurements by opening two circular vents on the sides of the container by means of flaps that are moved by pneumatically operated linear actuators. Fans are placed in front of the vents, as well as on the floor of the container. The stem of the plant being measured goes through an opening in the cover, which is then also sealed with the pressure-sensitive adhesive described above.
The total enclosed volumes in chamber, tubing, analyser, and pump were approximately 1.6 L (ShoTGa-gh7), 1.4 L (ShoTGa-clim2 with shoot chamber), and 48.25 L (climate system with soil chamber).
2.1.2 Static chamber module for trace gas flux measurements
Trace gas fluxes are measured in a closed-loop setup where air is recirculated between a shoot or soil chamber and one or more online gas analysers. In principle, any flow-through trace gas analyser or combination of analysers can be used with this setup given that (a) it can completely recirculate the analysed air into the enclosure chambers and (b) the analyser does not emit the analysed trace gas or interfering volatile compounds (e.g. from pump membranes). At a minimum one analyser capable of measuring CO2 mixing ratios is required. Since our initial measurements were focused on CH4 fluxes, we used a Picarro G2301 (CH4, CO2, and H2O) or a Picarro G2201-i (12CH4, 13CH4, 12CO2, 13CO2, and H2O) cavity ring-down spectroscopic analyser equipped with a KNF oil-free membrane vacuum pump. Analysers with low flow rates (e.g. the Picarro G2201-i) require a bypass loop with a membrane pump (e.g. Nitto Kohki GmbH, model DP0140-A1111) to accelerate gas transport between a chamber and the analyser and thus reduce the lag between mixing-ratio change occurring in the chamber and that being observed by the analyser. Analysers without an internal pump require an external pump to circulate the air between a chamber and the analyser.
2.1.3 Temperature, CO2, and humidity control
Temperature control. The enclosure temperature is controlled through the Peltier elements located beneath each shoot chamber. The Peltier element is activated when the temperature inside the shoot chamber exceeds ambient temperature (measured through an additional temperature sensor) by 2 ∘C and deactivated when the temperature inside the chamber drops 1 ∘C below the ambient temperature. Homogeneous temperature inside the chamber is ensured by the fan directing the airflow straight onto the area where the Peltier element is connected. This also minimizes water condensation on the cooled area.
Humidity control. To avoid moisture build-up from transpired water during static chamber measurements, a membrane dryer (Nafion MD-050-12S-2) is placed in the return line from the analyser to the soil and shoot chambers. The dryer is either flushed with dry air in the counter-stream or evacuated with a vacuum pump (Gardner Denver Thomas, model 1410V).
CO2 control. To maintain CO2 mixing ratios in the closed-loop mode, CO2 removed due to photosynthesis is replaced by CO2 injections regulated by a mass flow control unit (MFC1; 0–50 mL min−1, Bürkert GmbH, type 8715). We initially injected a 1 % CO2-in-N2 gas mixture utilizing a PID algorithm to keep the CO2 level stable. These injections, however, diluted the chamber air and decreased the trace gas mixing ratios. CH4 mixing ratios in typical operation, for example, decreased by 100–300 ppb (5 %–15 %) below ambient mixing ratios. Under these circumstances, small diffusion leaks can lead to an increase in the trace gas mixing ratios over time during chamber closures, which can be mistaken for shoot emissions.
After initial tests, we therefore changed the system to inject pure CO2. In addition, we changed the injection algorithm to inject a fixed amount of CO2 (0.14 mL, corresponding to approximately 400 ppm of CO2 in a shoot chamber) whenever the CO2 mixing ratio falls below a configurable threshold value (set to 400 ppm). With this method, CO2 injections have only a minimal effect on trace gas mixing ratios (e.g. < 10 ppbv CH4), and injections can be easily identified and corrected for. To facilitate rapid mixing of the injected CO2 into the sample stream, we placed a handcrafted flap in the fitting that connects that MFC to the main sample loop to force the sample air to flow through the throat of the MFC controlling the injections.
2.1.4 Dynamic chamber module for water, CO2, and VOC flux measurements
Steady-state flow-through measurements are preferable over closed-loop measurement when the gas fluxes can be quantified by measuring the difference in their mixing ratios in air entering and leaving the chamber. In our current setup, we use a dynamic chamber module to measure fluxes of CO2 (photosynthesis rate), H2O (transpiration), and VOCs. To operate the chamber in dynamic chamber mode, pressured air (in-house) dried with a membrane dryer (SMC, model IDG1-C06) is pushed into the enclosure chamber cell at a controlled flow rate. When VOC fluxes are measured, this air is further purified by a zero-air generator (HPZA-3500-220, Parker Balston) prior to use. The flow rate is controlled by a second mass flow control unit (MFC2, 0–1000 mL min−1, Bürkert GmbH, type 8715) set to a constant flow rate (typically 850 mL min−1). A bypass valve allows direct analysis of the air pushed into the enclosure chamber.
CO2 and H2O mixing ratios during dynamic chamber closures are measured with a Li-Cor LI-850 gas analyser. A needle valve on the outlet of the LI-850 regulates the flow rate generated by its internal pump, such that the airflow pulled from the enclosure chamber by the analyser(s) matches the airflow pushed into the chamber via MFC2. In addition, VOC mixing ratios are measured by a proton transfer quadrupole mass spectrometer (PTR-QMS; Ionicon, Innsbruck, Austria).
2.1.5 Chamber flushing with ambient air
To keep the conditions in shoot chambers close to ambient between the flux measurements, shoot chambers are constantly flushed with ambient air. Initially, this was achieved by placing an opening to ambient air into the gas lines just upstream of the shoot chambers. This inlet is protected by a check valve that only allows air inflow into the shoot chamber when the pressure differential between the chamber and ambient air is more than −50 mbar. Shoot chambers were flushed by connecting separate membrane pumps (Nitto Kohki GmbH, model DP0140-A1111) to each shoot chamber via the switching board. This way, inactive shoot chambers are flushed with ambient air at a flow rate of 750–1000 mL min−1. Initial tests showed that the brushes in these flush pumps burn out easily. We therefore changed the systems such that the chambers were flushed by pressing pressurized air into the chambers. In this setup, the opening was moved downstream of the shoot chamber and a check valve was inverted, such that it allows air outflow but not inflow.
2.1.6 Switching board for connecting chambers to analysers
Each implementation contains a switching board that can connect each individual chamber to the static (trace gas analysers) and dynamic (CO2, H2O, VOC analysers) chamber modules. In ShoTGa-clim2, the switching board contains six electrically operated three-way solenoid valves (SMC VX3114K-01N-5G1-B) that direct the airflow from the desired outlets to the distinct analysers. In the case of ShoTGa-gh7, airstreams are directed by a total of 36 solenoid shut-off valves (SMC VDW13-5G-1-H-Q) located on 12 three-input–one-output manifolds (SMC VV2DW1-H03M5-F-Q). The inlet and outlet of each chamber can be directed to three different lines (static chamber module, dynamic chamber module, chamber flushing). An additional three-way solenoid valve (SMC VX3114K-01N-5G1-B) is used to switch between chambers and bypass air in the dynamic chamber module. Both setups allow the connection of one chamber to the static chamber module while another chamber can be connected to the dynamic chamber module; chambers not connected to either module are operated in flush mode. In addition, each system was equipped with a sampling inlet to analyse trace gas mixing ratios in ambient air.
2.1.7 Control software and data recording
Both measurement systems are operated by Koppi, custom-made software written in Python. The software allows for the automatic switching between chambers and the measurement modes, regulates the CO2 injections and Peltier coolers in response to CO2 and temperature data, and records the instrument configuration and all measurement data at a 0.2 Hz frequency. The volume of injected CO2 is recorded at 0.1 Hz due to the slow response time of the MFC, and it is interpolated to a 0.2 Hz frequency prior to data analysis. PTR-MS data are recorded separately and synchronized with the main measurement dataset during data processing.
2.2 Data analysis and calculations
Data were processed in four steps from raw data to a time series of flux and auxiliary measurements that have been scaled to shoot measures where appropriate. All data processing was conducted in R version 3.6.3 (R Development Core Team, 2015).
In step one, raw data from the main operating software and auxiliary datasets (e.g. raw data recorded by internal data loggers in the analysers) are imported, synchronized, and combined into a single dataset. In addition, individual closures are identified with their start and end times, and the volume of injected CO2 was interpolated to a 0.2 Hz frequency.
Step two comprises corrections conducted at the raw data level. Most importantly, measurements in closed-loop mode were corrected for the effects of CO2 injections. For this, we modelled the mixing of CO2 with chamber air after each injection. The model contained two elements, (a) mixing of injected CO2 with air returning to the shoot chamber and (b) mixing of air in the shoot chamber and air in the analyser loop.
For (a), mixing of air released by the MFC into the return airstream was described by an exponential decay function (Eq. 1):
where Jeffective(t) stands for the effective flux at time point t (t=0 at the start of the modelled chamber closure), a stands for an empirically fitted constant (2.5 for the test measurements presented in this study), fconv stands for the gas-specific conversion factor for thermal conductance based on mass flow measurements (0.7 for CO2), t′ stands for a time point prior to t during the same closure, JMFC(t′) stands for the injection flux recorded by the mass flow control unit at that time, and τ stands for a fitted exponential decay constant (90 s) for the data analysed in this study) that is empirically fitted to describe the data in a given setup. After installing the metal flap at the tee connector between the MFC and return airflow, this component was not necessary any more and instantaneous mixing (i.e. Qeffective(t)=QMFC(t)) could be assumed.
For (b), the system was conceptualized as the combination of the main chamber and a single tube with a volume equivalent to the total volume of all tubing and analysers in the system. The tube was further modelled as consisting of n elements, each holding a volume equivalent to the flow rate per time step (5 s). At each time step, air was moved from tube element n to tube element n+1, the first tube element was filled with chamber air, and the last tube element was emptied into the chamber. Measurements were assumed to be conducted in tube element ; injections were assumed to be in tube element . The flow rate was assumed based on the specifications of the analyser (400 mL min−1), while the number of tube elements (n=5) was fitted to the data.
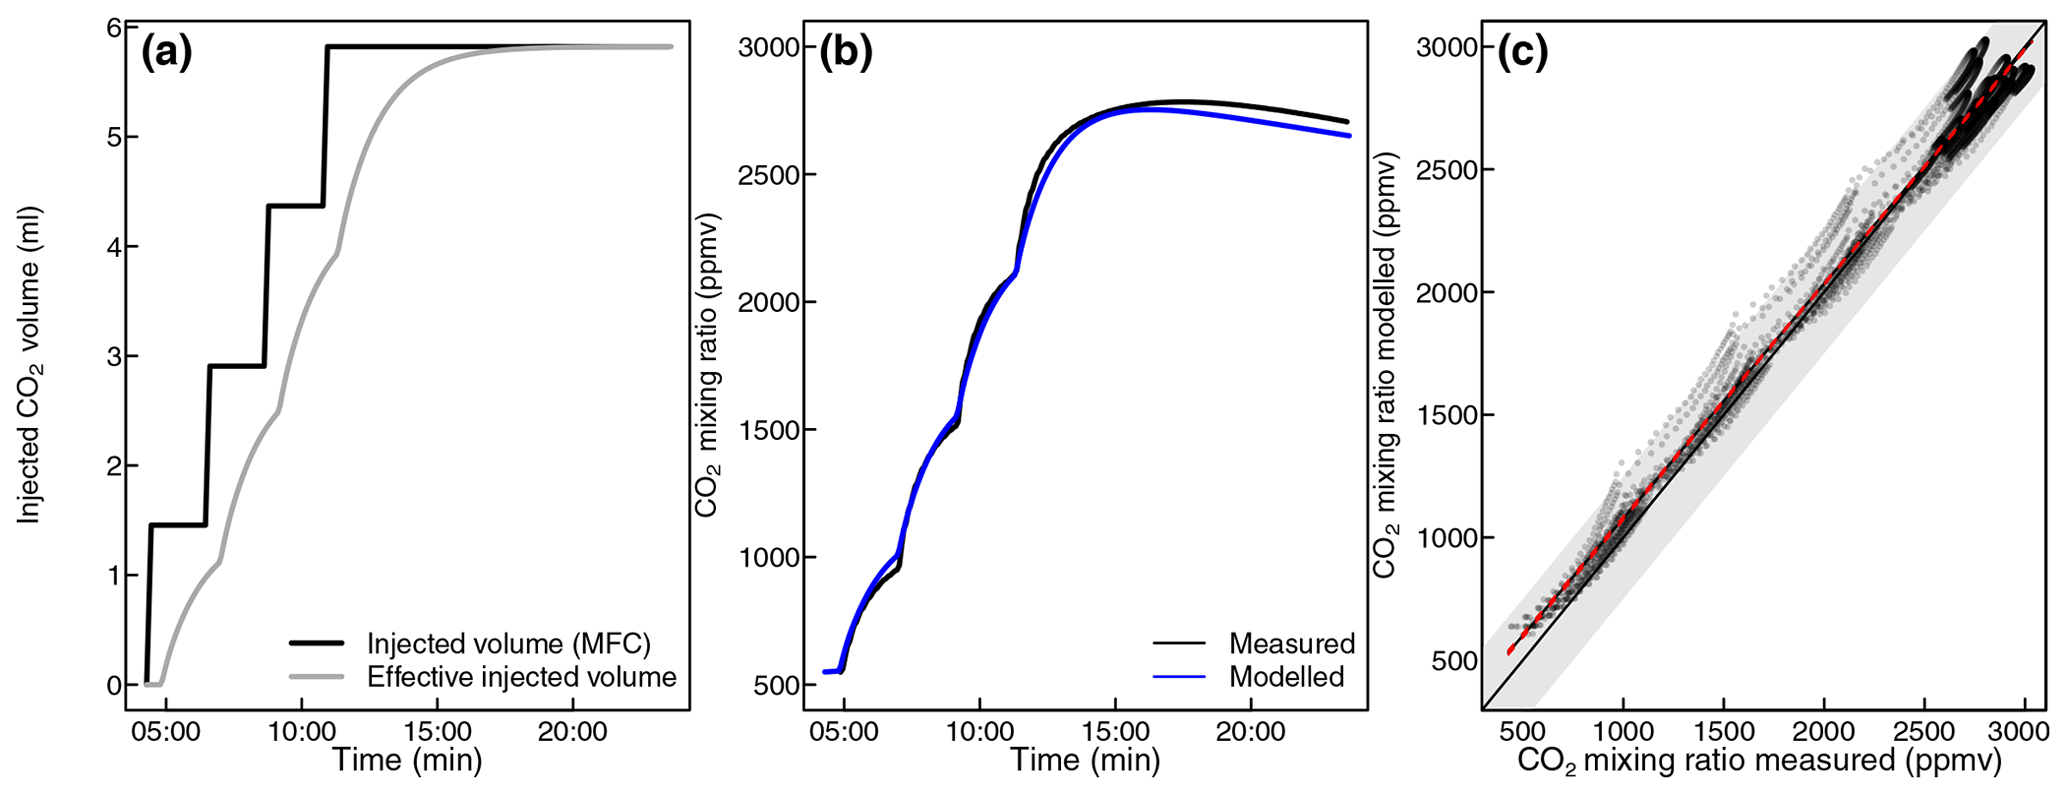
Figure 3Injected CO2 volume (quantified by mass flow controller) and effective injected CO2 volume during a leak check test of an empty chamber (a). The effective volume takes into account delays due to mixing in different parts of the system. Further, measured and modelled CO2 mixing ratios during the same closure (b). Moreover, comparison of measured against modelled CO2 mixing ratios during all 20 leak checks performed during the test measurements (c). The solid black line indicates the equal measured and modelled mixing ratios, and the dashed red line indicates a linear regression between measured and modelled data. The shaded grey area indicates that the difference between measured and modelled values was less than 250 ppmv.
We confirmed the validity of this model by applying it to CO2 injections during nocturnal leakage tests (see below), when CO2 injections were conducted at set intervals rather than triggered by a mixing-ratio threshold and when the CO2 emissions from foliar respiration were well characterized (Fig. 3). We then calculated the corrected CO2 and CH4 mixing ratios according to Eqs. (2) and (3):
where [CO2]corr(t) and [CH4]corr(t) stand for the corrected dry CO2 and CH4 mixing ratios at time point t, [CO2]raw(t) and [CH4]raw(t) stand for the measured dry mixing ratios, and [CO2]inj(t) stands for the mixing ratio of injected CO2 at time point t.
This correction could be avoided when analysing data from ShoTGa-clim2 and when flux rates were sufficiently high to reduce the effective time of static chamber closures. Instead of correcting for the effect of CO2 injections, we identified such injections as local maximums of the CO2 mixing ratio), and time periods during which the CO2 mixing-ratio change was affected by the injection were removed. We then treated the time periods between the injections as separate sub-closures (see below). This approach was not possible in ShoTGa-gh7 due to the relatively long tube length between chambers and switching board (2 × 10 m) which caused a relatively long delay until full mixing was reached after each injection.
Other corrections during this processing step included converting CO2 mixing ratios conducted by the LI-850 to mixing ratios in dry air. In the test experiments presented herein, we also had to apply a 6 min running average filter on CO2 mixing ratios to remove an oscillation of measured values due to an instrument malfunction. Raw data from PAR measurements (in mV) were converted to PAR (in ) using the calibration equations provided by the manufacturer.
Step three consisted of data reduction by calculations of derived values for each closure. For static chamber closures, this was conducted differently depending on whether gas mixing ratios had to be corrected for CO2 injections or not. In both cases, data measured during the first 180 s after the closure start and the last 60 s before the end of the closure were removed to exclude minor artefacts resulting from pressure effects (visible for example in Fig. 5c) and the mixing of distinct air volumes. For data measured by ShoTGa-gh7 with CO2-injection-corrected gas mixing ratios, we calculated the slope of each measured gas's mixing ratio over time () as the simple linear regression between mixing ratio and time. For data measured by ShoTGa-clim2 with identified sub-closures between injections, a function with a single slope () for all sub-closures but distinct intercepts for each sub-closure was fitted onto each main closure.
For dynamic chamber closures, the mixing ratio in air leaving the chamber (Cout) was calculated as the average mixing ratio measured from 180 s after closure start to 60 s before closure end. Similarly, the mixing ratio in air entering the chamber (Cin) was calculated as the average mixing ratio from 180 s after closure start to 60 s before closure during bypass periods. Auxiliary measurements (PAR, temperature) were averaged over the entire closure time.
Step four consisted of calculating gas fluxes and normalizing them to sample size (e.g. foliage dry weight or leaf area). For static chamber closures, was then used to calculate the flux rate per leaf area (QA) or leaf dry weight (Qm) according to Eqs. (4) and (5):
where A and m stand for the leaf area and leaf dry weight of the enclosed branch; V stands for the chamber volume including the analyser loop; and Vmol is the molar volume, which is calculated from pressure p, temperature T, and ideal gas constant R.
For dynamic chamber closures, CO2, H2O, and VOC fluxes were calculated as described in Eqs. (6) and (7):
where flow rate stands for the airflow rate (850 mL min−1) and Cout and Cin stand for the measured gas's mixing ratio in air leaving the chamber and air entering the chamber, respectively.
To calculate stomatal conductance, we first calculated the saturation partial pressure water vapour (pw,s) at the temperature T measured in the chamber according to Buck (1981) as shown in Eq. (8):
We then calculated the vapour pressure deficit (VPD) in the shoot chamber according to Eq. (9):
where pa stands for the ambient pressure (assumed to be 101 325 Pa) and pw stands for the measured partial pressure of water vapour in pa. Finally, we calculated stomatal conductance (gs) from the VPD and evaporation rate per leaf area () as
2.3 System validation tests
2.3.1 Leakage
The leakage rate (L) of each chamber was quantified by injecting CO2 until its mixing ratio reached approximately 3000 ppmv and monitoring the decline in the CO2 mixing ratio due to gas exchange between the chamber and ambient air. These measurements were conducted automatically once per night for each chamber and corrected for nighttime respiration rates (Resp) measured prior to each leak test.
During initial tests, we also quantified L, taking advantage of the initial measurements where a 1 % CO2-in-N2 mixture was used to replace the photosynthesized CO2. These injections decreased the mixing ratio inside the shoot chamber (Cchamber) by 5 %–10 % (to 1.8–1.9 ppmv), while the Cambient remained constant (∼2.0 ppm). We used these variations in chamber CH4 mixing ratios to calculate L as the regression between the change in the mixing ratio of CH4 over time () and Cambient−Cchamber, assuming that any CH4 exchange between shoot and chamber air is not affected by Cchamber.
2.3.2 Blank tests
Our initial tests were focused on the ability of the chamber systems to accurately measure shoot CH4 emissions. We therefore evaluated the system blank for CH4 exchange from the shoot chamber but not for other greenhouse gases or the soil chamber. To quantify the system blank, all openings of the shoot chamber were closed and the systems were operated in the same way as for plant shoot measurements. These measurements were conducted either before and after each experiment (ShoTGa-clim2) or during the experiment with chambers left empty for blank control (ShoTGa-gh7). We furthermore calculated the system detection limits for individual chamber closures as equal to 3 times the standard deviation of the blank measurements.
2.3.3 Test measurements with Scots pine shoots
Test measurements were conducted with the ShoTGa-gh7 system and a 2-year-old Scots pine (Pinus sylvestris L.) sapling. The sapling was obtained from a commercial grower in autumn 2019, potted in a 20 L pot, and stored outdoors in the University of Helsinki's Viikki greenhouse facility over the winter. In late January 2020, the tree was transferred into a greenhouse compartment and allowed to acclimatize for 3 weeks prior to the measurement campaign (22–25 February). The ambient temperature in the compartment was between 15 and 18 ∘C during the nighttime and warmed to 22 to 32 ∘C during the daytime, depending on weather conditions. The trees were watered weekly and received additional light from a high-pressure sodium lamp resulting in 250–400 photosynthetically active radiation (PAR). In addition, we placed six UV-A lamps (Q-Lab UVA-340) approximately 20 cm above the measured shoot to stimulate aerobic CH4 production. Both PAR and UV lighting followed 12 h day–night cycles (07:00 to 19:00; all time is given as local time, i.e., eastern European time, EET).
We installed a total of four automated shoot chambers into the system. Chambers 1 and 4 were kept empty as blank controls, while chambers 2 and 3 were placed on separate branches of the sapling. As exposure to sunlight was low, we decided not to cool the chambers with the Peltier cooling system to keep the experiment more simple. The system was programmed to connect each shoot chamber to a Picarro G2301 analysis via the static chamber module for 24 min followed by measuring ambient air for 3 min. To explore the effects of CO2 injections on CH4 flux measurements, CO2 injections were deactivated during every second closure cycle (Fig. 5). This cycle was restarted every 2 h. Only “daytime” measurements (i.e. artificial lighting on; 07:00–19:00) were included in the presented data, while the results of the temporal trends (e.g. diurnal cycles) will be published separately. We obtained a total of 25–26 measurements per chamber.
Concurrent with each static chamber closure, a different chamber was connected for 12 min to the LI-850 and PTR-QMS analysers, followed by analysing the ingoing pressurized air for 15 min (Fig. 6). For simplicity, only three molecular mass-to-charge ratios were monitored: 33 (methanol), 59 (acetone), and 137 (monoterpenes). The PTR-QMS was calibrated with a gas standard containing methanol, acetone, and α-pinene, as well as other VOCs not measured in this study. Data processing was conducted as described previously (Taipale et al., 2008).
After the experiment, the enclosed shoots were cut from the tree and the (projected) needle leaf area was quantified by scanning a subset of the needles and scaling to the whole branch by weight. The needle dry weight was quantified after drying for 72 h at 65 ∘C.
We state our main measurement result – CH4 fluxes – as means and 95 % confidence intervals because our focus here is the overall uncertainty associated with the average flux found in these measurement. Results from auxiliary measurements – temperature, PAR, CO2, and water fluxes – are presented as means and standard deviations because we primarily present these results to document the conditions under which the trace gas measurements were conducted.
The measurements of CH4 fluxes were close to the detection limit, and measurements of both empty and pine shoot chambers had long-tailed distributions (i.e. contained likely outliers). To test for differences in apparent CH4 fluxes between the shoot chambers, we therefore applied the non-parametric Kruskal–Wallis test and Dunn post hoc tests as normal distribution could not be assumed.
2.4 Assessment of measurement uncertainties
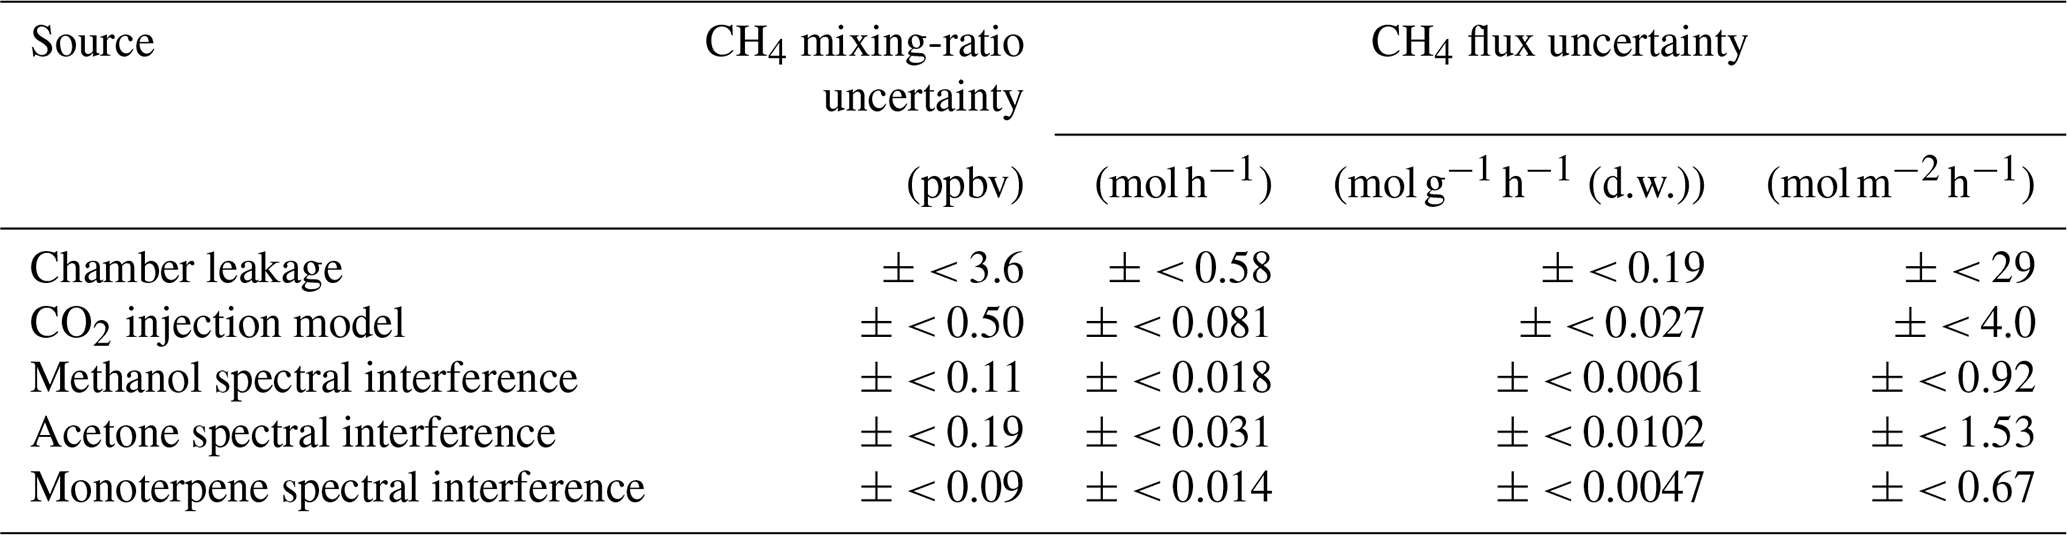
We identified three potential sources of inaccuracy in the measurements: chamber leakage, CO2 injection modelling, and spectral interference by volatile organic compounds. We assessed the impact of these potential errors by propagating the uncertainty caused by these processes onto measured CH4 fluxes. All estimates were scaled based on chamber closure times (24 min), leaf areas (0.02 m2), and foliar dry weights (3 g) in this study. To evaluate the impact of gas exchange with ambient air due to chamber leakage, we assumed a mixing-ratio difference between chamber and ambient air of 10 ppbv and a chamber leakage rate L of 1.5 %. For the effect of inaccuracy of the CO2 injection model, we assumed a 250 ppmv inaccuracy in the mixing ratio of CO2 in the injection model and a CH4 mixing ratio of 2 ppmv. Finally, to evaluate the potential effect for spectral interferences by co-emitted VOCs, we assumed methanol, acetone, and monoterpene emission rates based on the average emission rates found in this study (1.54, 2.55, and 2.33 nmol per gram dry weight (d.w.) per hour, respectively). Based on these emission rates, we estimated the mixing ratio of plant-emitted methanol, acetone, and monoterpenes reached at the end of static chamber closures as 28.5, 47.4, and 43.3 ppbv, respectively. We note that this approach likely overestimates the final VOC mixing ratios as increasing headspace VOC mixing ratios often lead to a decrease in emission rates and even net uptake of VOCs by foliage (Cojocariu et al., 2004; Cappellin et al., 2017). Nevertheless, we consider them a good conservative estimate for assessing the potential impact of VOC emissions on CH4 flux measurements. We converted these VOC mixing ratios to apparent CH4 mixing ratios based on our recent quantification of upper limits to the spectral interference of various VOC in methane mixing-ratio measurements with the Picarro G2301 and other methane analysers (Kohl et al., 2019), using conservative uncertainty limits (±0.4 ppbv apparent CH4 ppmv−1 for methanol and ±0.2 ppbv apparent CH4 ppmv−1 for monoterpenes). Since the spectral interference of acetone was not quantified by Kohl et al. (2019), we applied the higher value derived from methanol.
3.1 Temperature control
Initial tests of ShoTGa-clim2 showed that cooling was not necessary as the enclosure chambers do not warm significantly compared to the ambient (cabinet) temperature due to the low thermal energy emitted by the LED-based lighting system. In a test consisting of 1311 closures with pine saplings in the chamber, the mean difference in temperatures between lights on and lights off was found to be 1.06 ± 0.03 ∘C, and the median change in chamber temperature during measurement was 6 × 10⁻⁶ ∘C s−1.
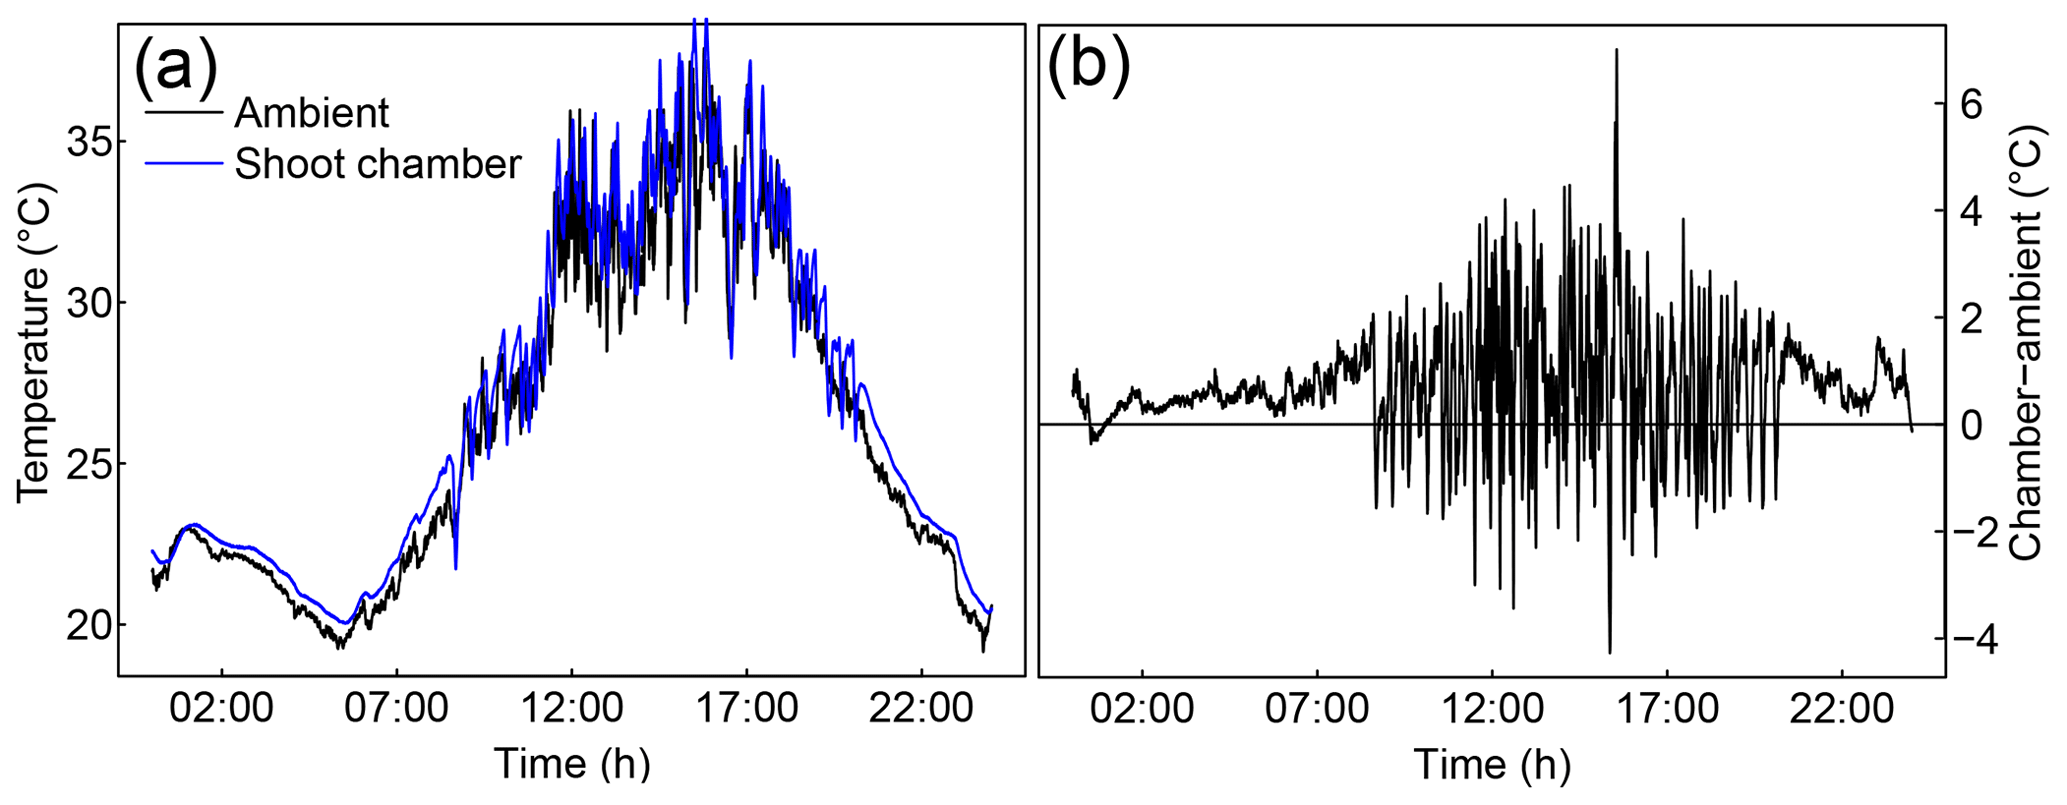
Figure 4Example of the temperature control used with ShoTGa-gh7: ambient temperature and temperature in a shoot chamber in the greenhouse compartment (a) and the temperature difference between shoot chamber and ambient air (b). Data were measured on 1 August 2019.
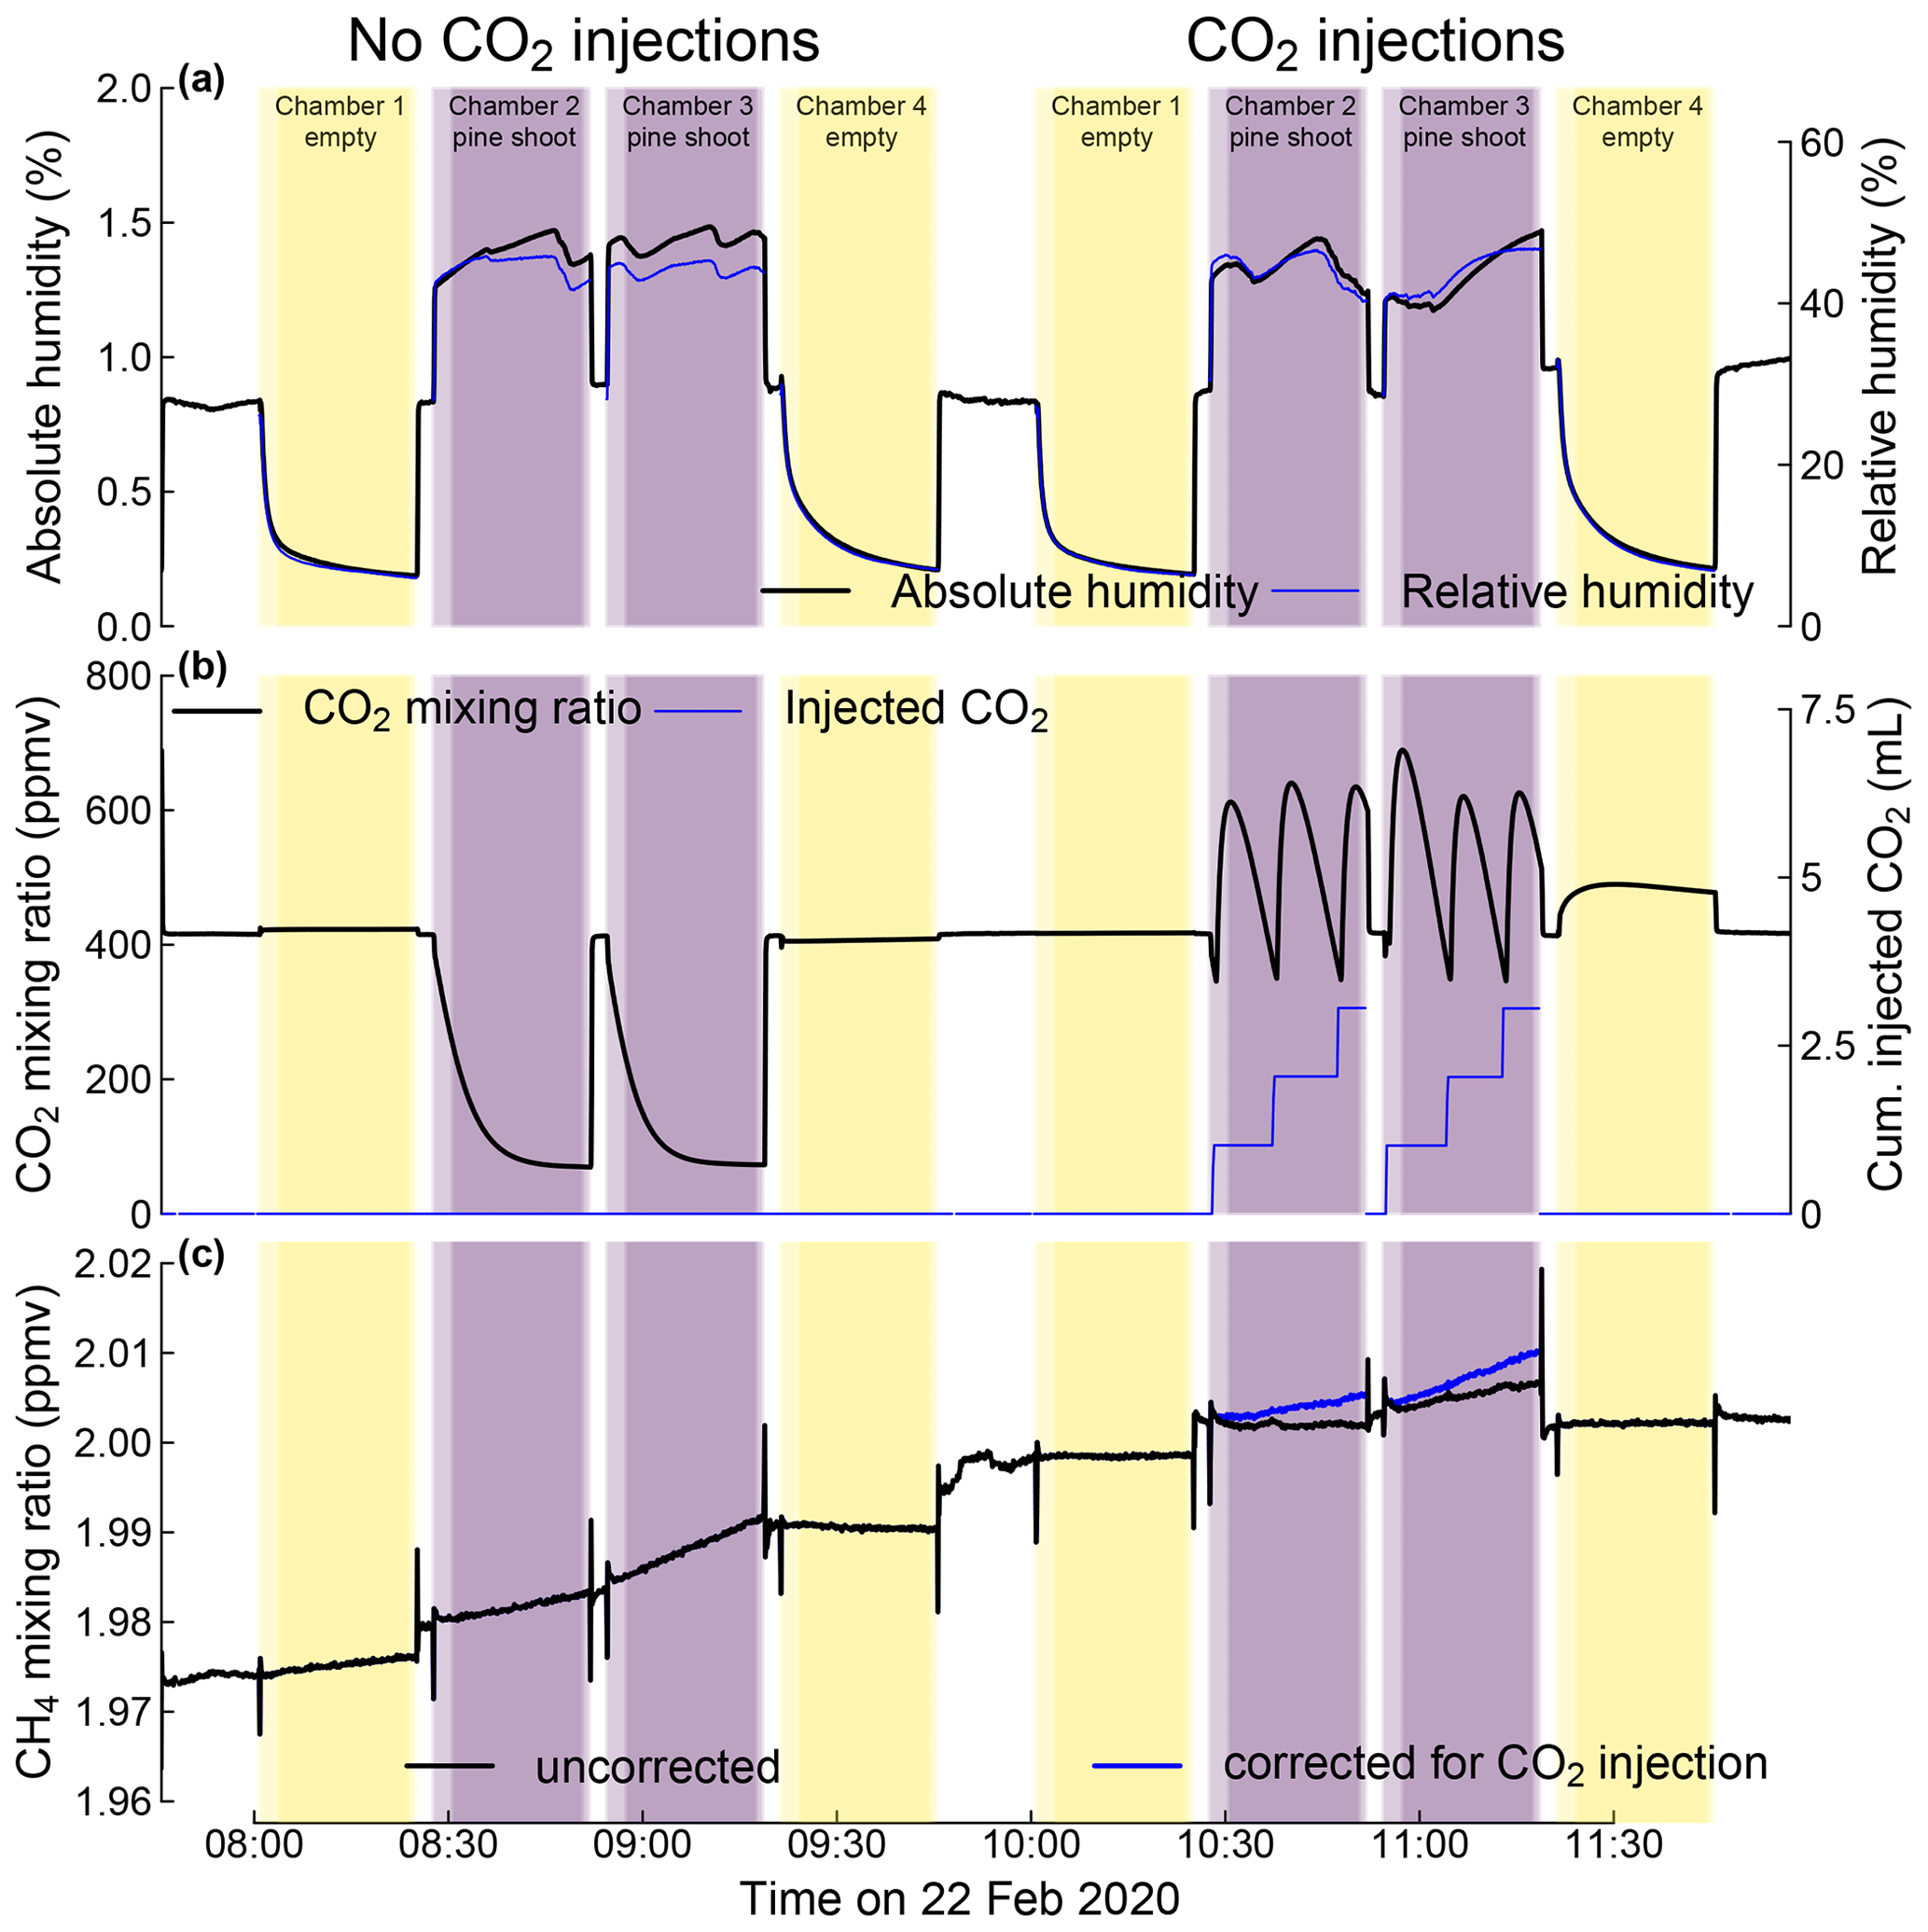
Figure 5Mixing ratios of water (a), CO2 (b), and methane (c) during static chamber closures of four shoot chambers in the greenhouse system. Chambers 2 and 3 each contained a shoot of a 2-year-old pine sapling; chambers 1 and 4 were kept empty as blank controls. The figure depicts two sets of chamber closures that were conducted without and with CO2 injections to compensate for plant CO2 uptake. Black lines in panels (a) to (c) represent the measured mixing ratios of water (a), CO2 (b), and methane (c), respectively. The blue line in panel (b) indicates the cumulative amount of CO2 injected since the beginning of the chamber closure, expressed as the equivalent mixing ratio in the chamber (right-hand axis). The blue line in panel (c) indicates the methane mixing ratio after correcting for dilution by the injected CO2 (see text). Shaded areas indicate times when chambers with or without shoots were connected to the static chamber module with darker colours indicating times used to calculate flux rates. The analyser was connected to an ambient air inlet between these closure times. The depicted data were measured on 22 February 2020.
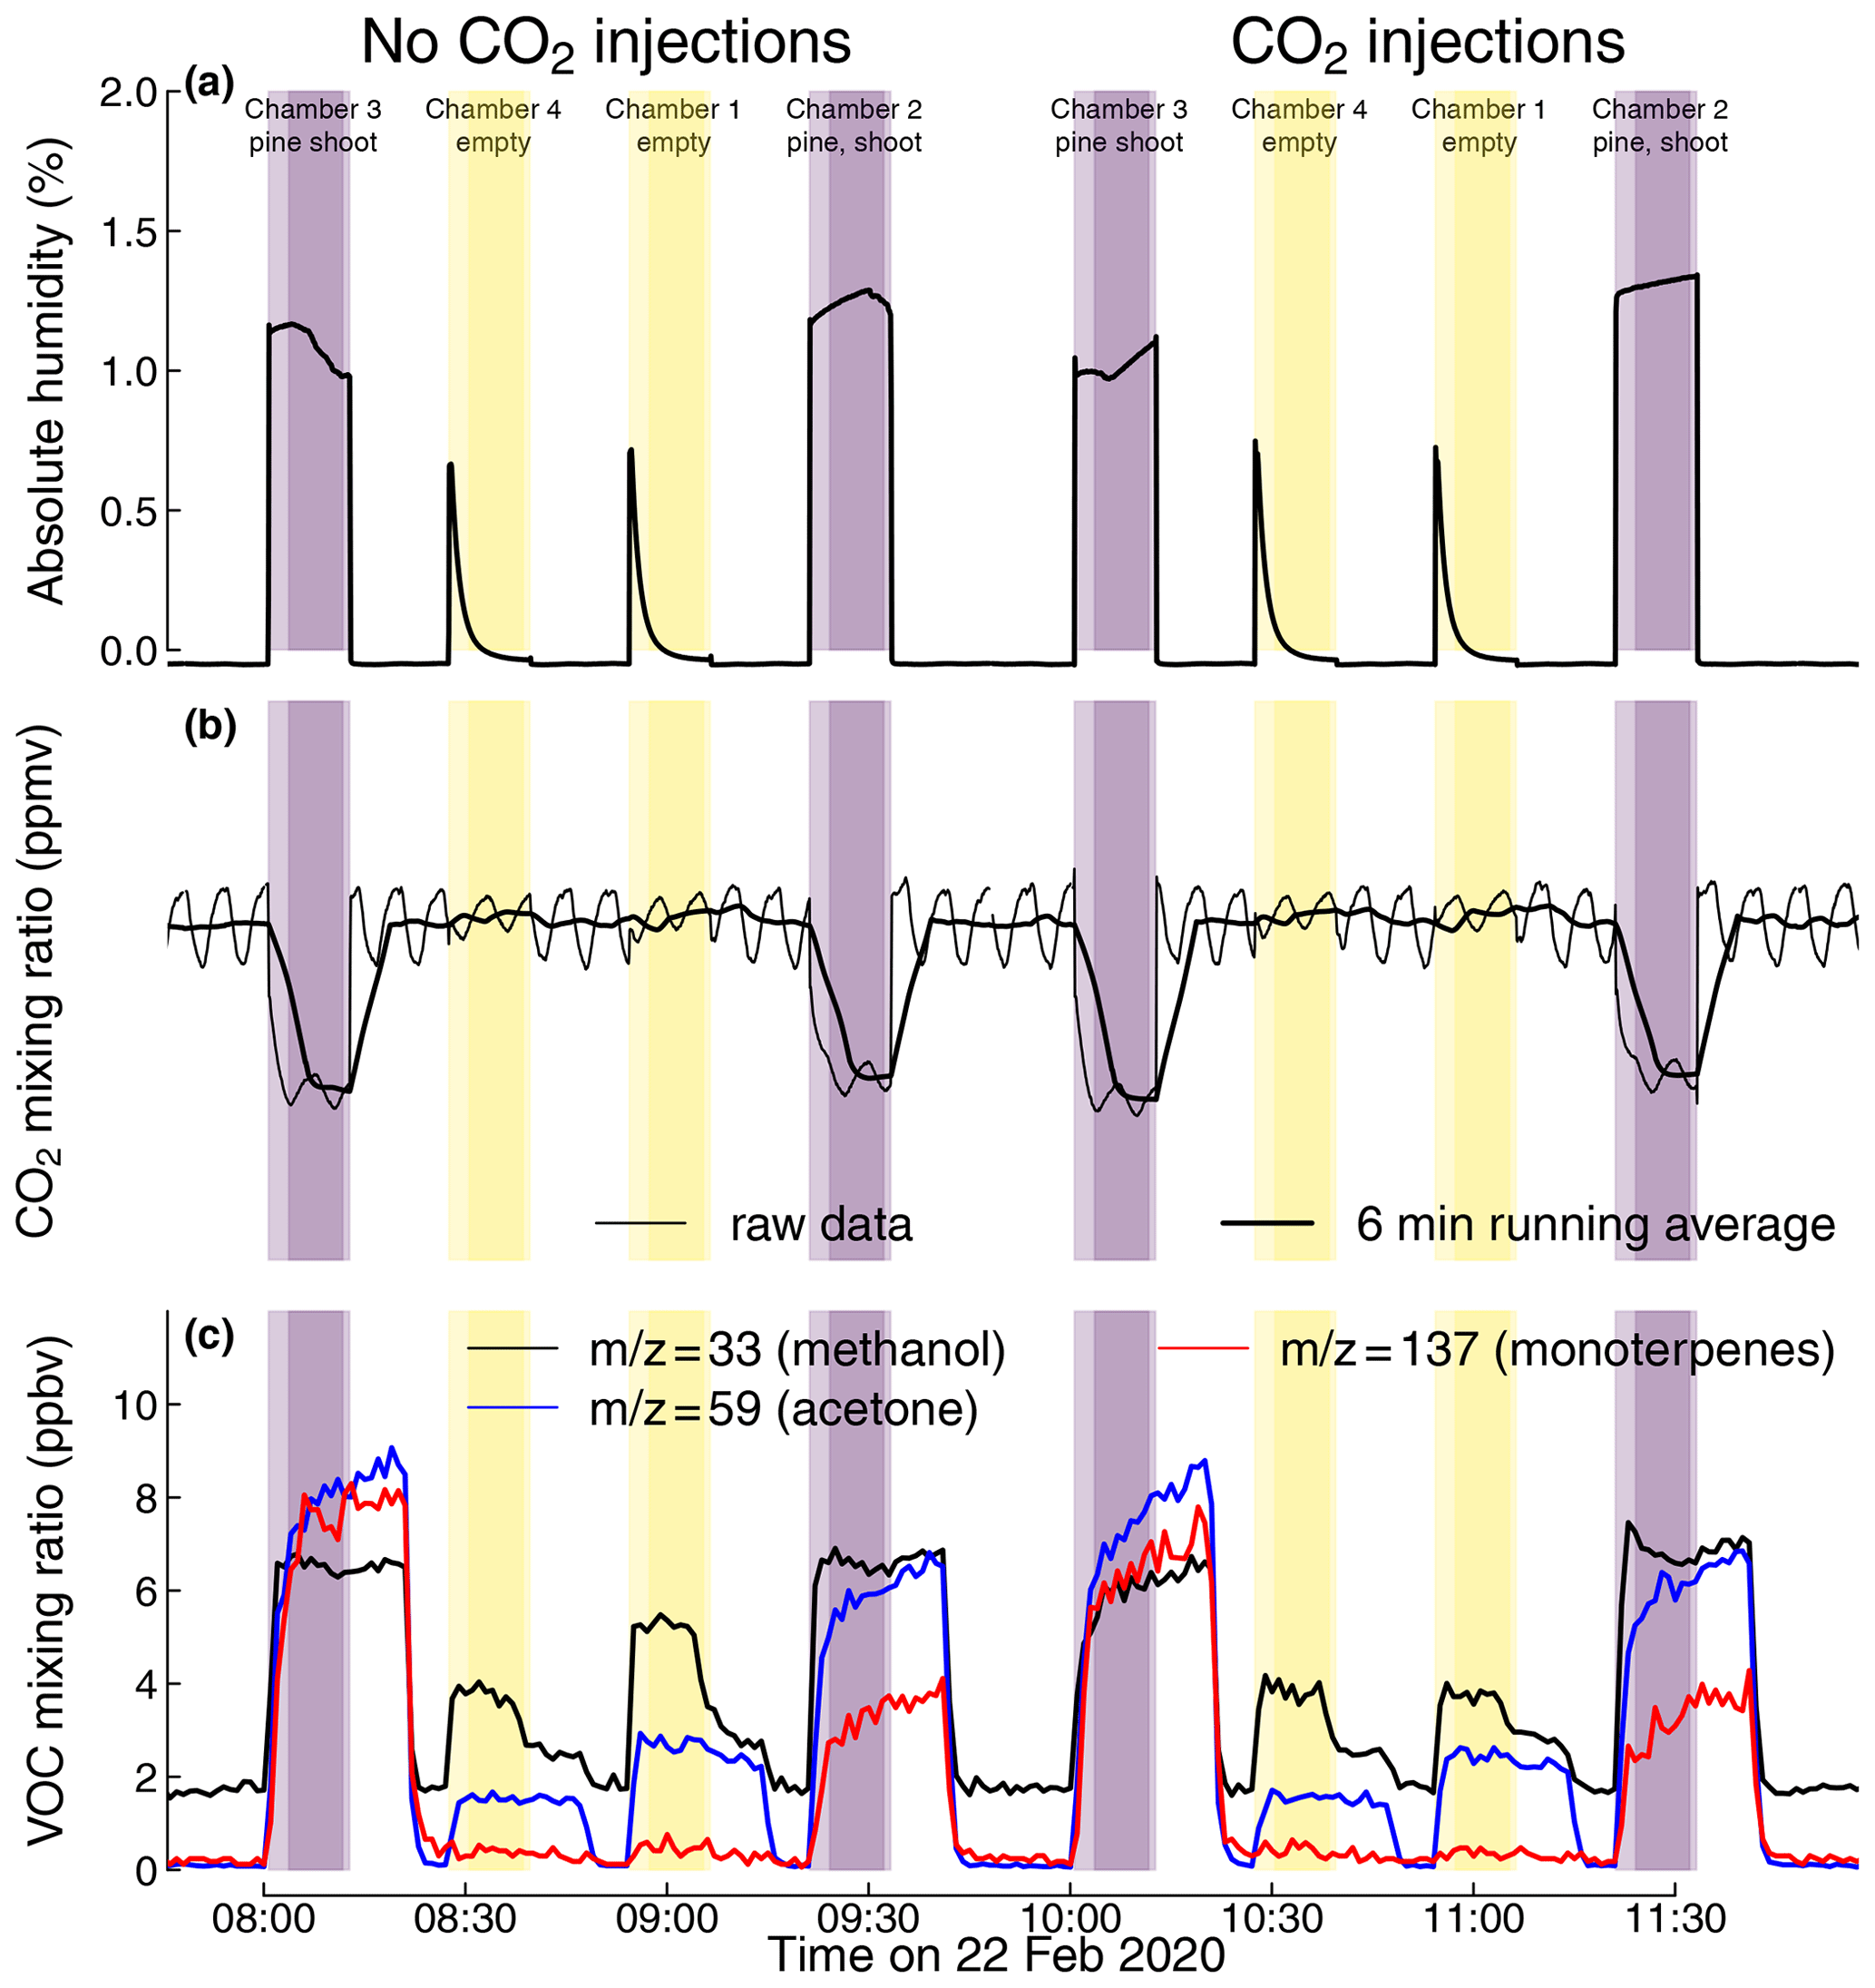
Figure 6Mixing ratios of water (a), CO2 (b), and volatile organic compounds (c) during dynamic chamber closures of four shoot chambers in the greenhouse system. Chambers 2 and 3 each contained a shoot of a 2-year-old pine sapling; chambers 1 and 4 were kept empty as blank controls. Black lines represent the measured mixing ratios of water (a) and CO2 (b). In panel (b), the thin black line represents the raw measured CO2 mixing ratio, while the thick black line represents its 6 min running average, calculated to compensate for an oscillation in the analyser signal. Shaded areas indicate periods when chamber air was analysed, with darker colours indicating time periods used to calculate Cout; non-shaded areas indicate periods when the ingoing air was measured bypassing the chamber. The depicted data were measured on 22 February 2020.
Temperature measurements with ShoTGa-gh7 conducted in August 2019 showed that uncooled shoot chambers can heat to 10 ∘C and more above ambient temperature during summer conditions in northern Europe. Cooling allowed us to keep the difference between ambient and chamber temperature below 2 ∘C (Fig. 4). In the test measurements with pine shoots conducted in the greenhouse in February 2020, uncooled chambers warmed to 3–4 ∘C above the ambient temperature when the room lighting was on (Table 1), indicating that moderate cooling is required for experiments under greenhouse conditions even during winter months.
3.2 H2O control
The membrane dryer was capable of reducing the moisture in an empty shoot chamber connected to the static chamber module to < 10 % relative humidity within 5 min (Fig. 5a). During the measurements with pine shoots in the chamber, the membrane dryer removed sufficient water from the chamber to prevent condensation of transpired water in the system and hold the relative humidity in the shoot chamber between 40 % and 50 %.
3.3 CO2 control
Photosynthesis by the enclosed pine shoots depleted CO2 in the enclosed volume to < 100 ppm within 2–3 min. In the test experiments with pine shoots, an injection corresponding to approx. 400 ppm CO2 was triggered once every 10 min. These injections allowed us to sustain the CO2 between 400 and 700 ppm (Fig. 7) for extended periods of time (tested for up to 2 h). While maintaining more constant CO2 mixing ratios is possible with this system, pulsed injections make it easier to correct trace gas mixing ratios for dilution by the injected CO2.
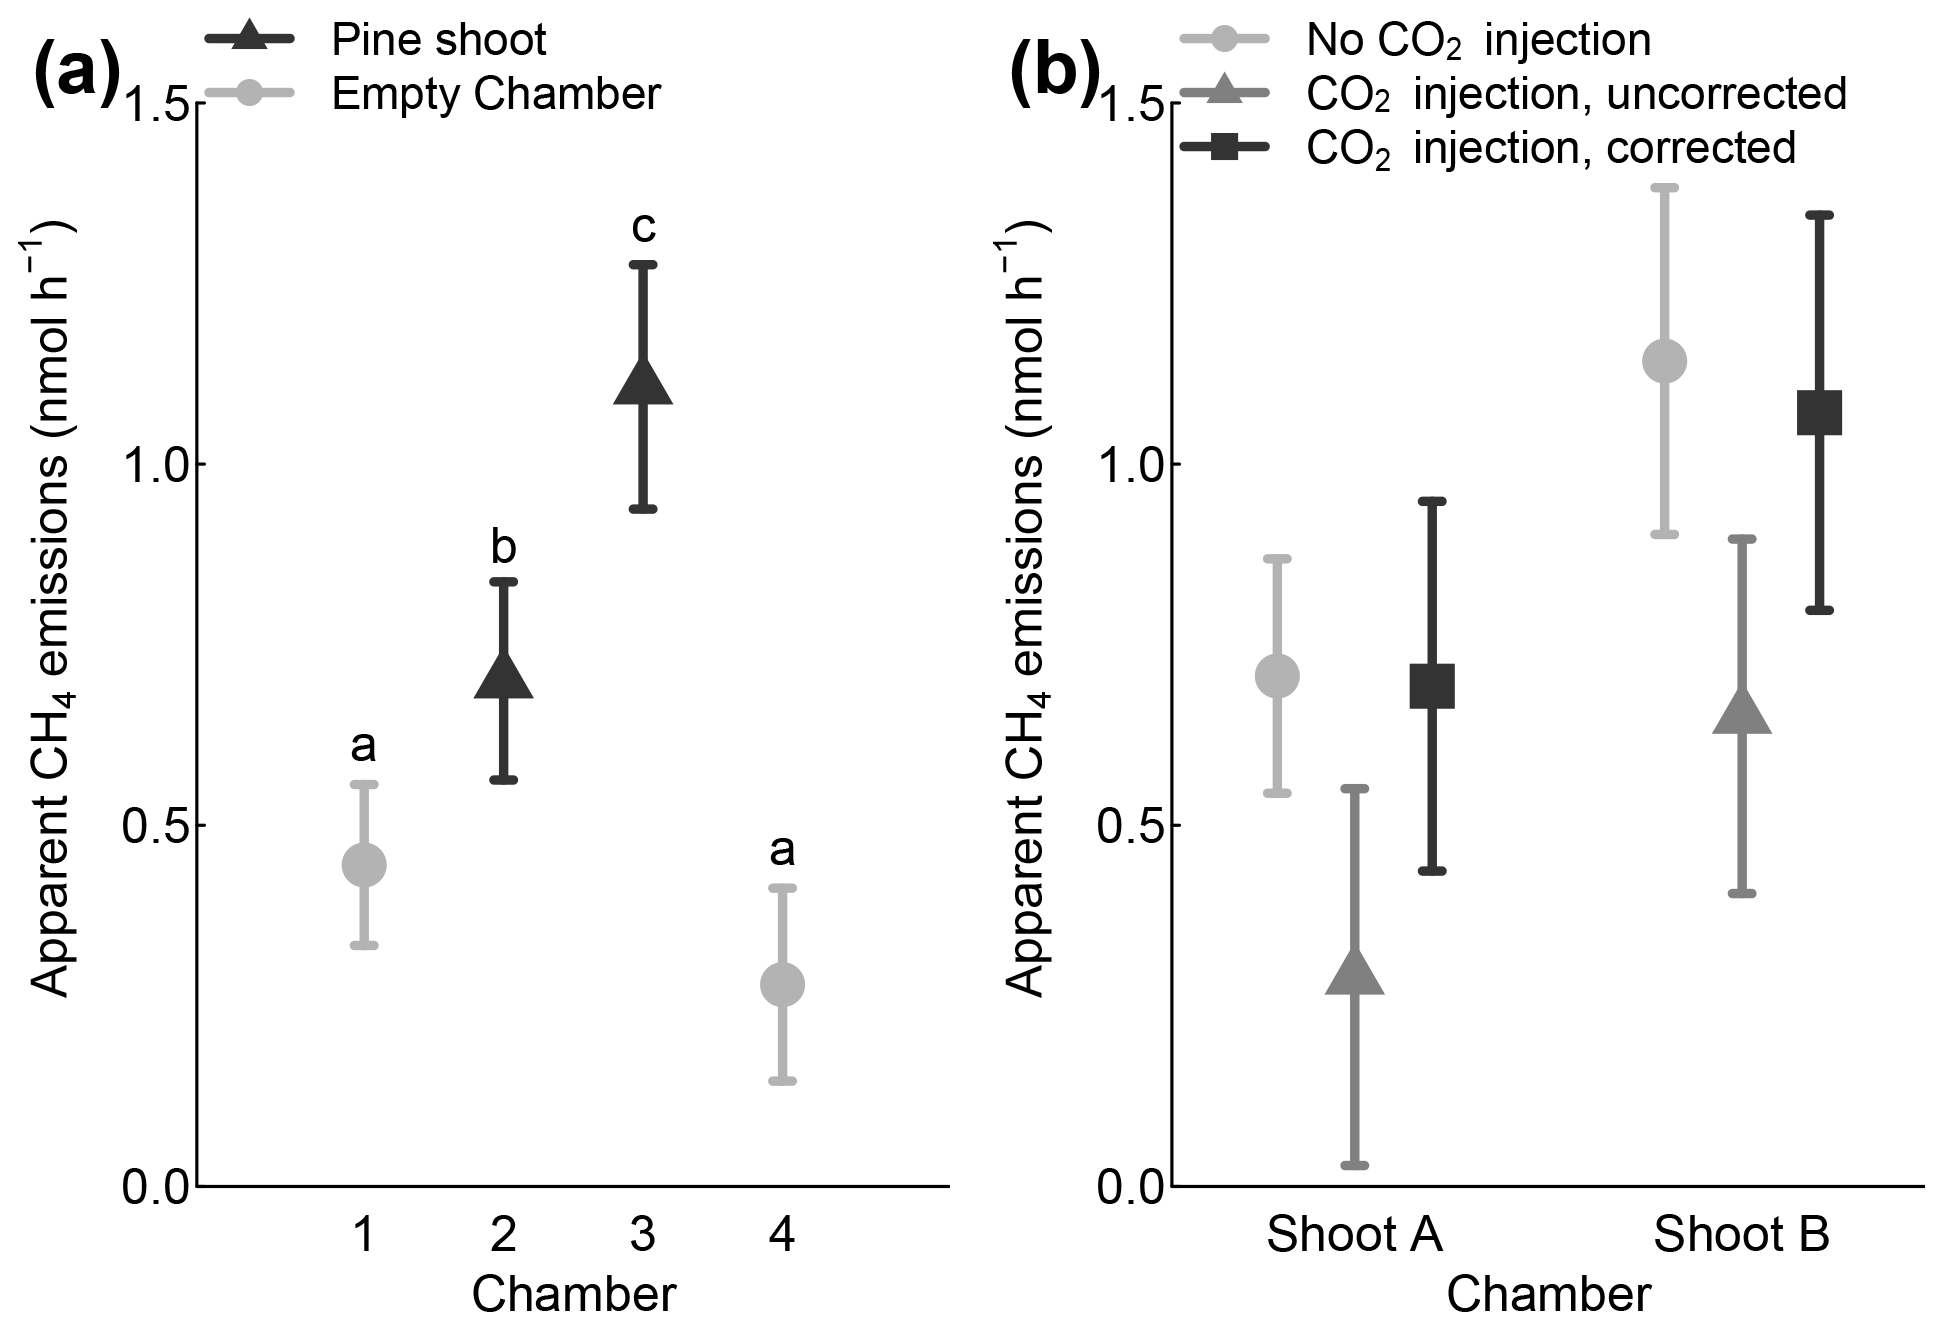
Figure 7Observed apparent CH4 fluxes in two empty shoot chambers and two shoot chambers with pine shoots (a). Furthermore, comparison of CH4 fluxes during chamber closures without and with CO2 injections (b). Only daytime (illuminated) measurements are included in the figure. Error bars indicate 95 % confidence intervals.
To evaluate the performance of the CO2 injection model, we evaluated 20 leak test measurements. In these nighttime measurements, shoot CO2 emissions and leakage were well characterized, such that the effect of CO2 injections on measured CO2 mixing ratios could be studied in isolation from other processes (Fig. 3). The model generally predicted CO2 mixing ratios within 250 ppmv. Assuming a CH4 mixing ratio of 2 ppmv, the propagated error in CH4 mixing ratios due to this uncertainty is < 0.5 ppbv.
3.4 Chamber leakage
Initial tests showed relatively high leakage rates of up to 1 % min−1–2 % min−1 (2). Over time, we made improvements to the chamber seal (e.g. application of vacuum grease to contact surfaces, testing seal with a handheld pressure meter while closing the shoot chamber). This resulted in lower leakage rates, < 0.15 % min−1 in the climate chamber system and < 0.5 % min−1 in the greenhouse system. This leakage rate has negligible effects on flux measurements when the analyte gas's initial mixing ratio in the shoot chamber is close to its mixing ratio in the ambient air surrounding the shoot chamber (cabinet air in the case of the climate chamber). It is currently not common to report leakage rates in static chamber studies, and we are therefore unable to compare these rates with literature values. However, we hope that this reporting becomes more common to allow for such a comparison in the future.
Chamber leakage becomes a more serious issue when the analyte gas's mixing ratio inside the chamber (Cc) differs significantly from its mixing ratio in ambient air (Ca). This is relevant in two cases: (a) when the CO2 injections strongly dilute the analyte gas inside the shoot chamber or (b) when the analyte gas's mixing ratio inside the climate chamber cabinet increases due to strong emissions from the plant or soil. We observed, for example, elevated CH4 mixing ratios in the cabinet air when a Betula nana plant growing in water-saturated peat was placed in the cabinet. In these cases, an apparent flux of occurs and needs to be corrected for during data analysis.
3.5 System blank and method detection limit
Average system blanks, that is, the apparent CH4 flux in an empty control chamber, were < 0.3 nmol h−1 in both systems, corresponding to a mixing-ratio change of < 1.8 ppbv CH4 during a 24 min chamber closure. Method detection limits (MDLs) for CH4 emissions from plant shoots were < 0.15 (d.w.) in the climate chamber system and < 1.5 (d.w.) in the greenhouse system (assuming 3 g d.w. foliar biomass per chamber; Table 2). This method detection limit is defined for a single closure measurement and further decreases with in the case of repeated measurements. It is thus easy to reach a MDL well below reported plant methane emissions rates (e.g. 0.75–55 (d.w.); Keppler et al., 2006).
Table 2Observed chamber leakage rates, system blanks, and method detection limits.

a Diffusive air exchange between chamber and ambient air. Measured by comparing the nighttime CO2 trend at ambient mixing ratios and after injecting CO2 at a mixing ratio of 2000–3000 ppmv. b Flux observed in empty control chambers. c Method detection limit for a single measurement, defined as 3 times the standard deviation of the system blank, and normalized to the foliage dry weight of a typical shoot (3 g). The detection limit for repeated measurements decreases with .
3.6 Test measurements with Scots pine shoots
3.6.1 Auxiliary measurements
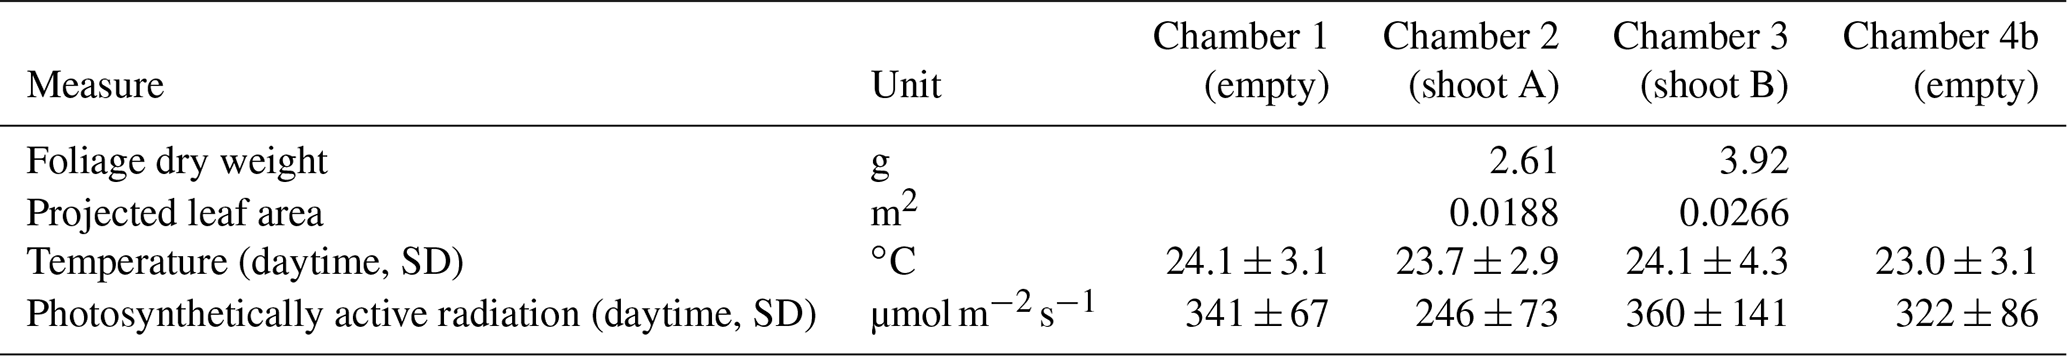
The two enclosed shoots contained needles with a total dry weight of 2.61 and 3.92 g and leaf areas of 0.019 and 0.027 m2. During the included test (i.e. daytime) measurements, average temperature and PAR were 24.1 ∘C (SD 3.4; range 16.5 to 31.8) and 328 (SD 104; range 62 to 620). As mentioned above, the measured temperatures inside the shoot chambers were higher than ambient temperature, on average by 3.3 ∘C (SD 1.8; range −2.6 to 10.3). Temperature and PAR values of individual chambers are summarized in Table 1.
Table 3Shoot fluxes and stomatal conductance measured in this study scaled to foliar dry weight and leaf area after subtracting empty-chamber fluxes. All uncertainties include the uncertainties in shoot and blank (empty-chamber) measurements and are stated as standard deviations (SDs) or 95 % confidence intervals (CIs).
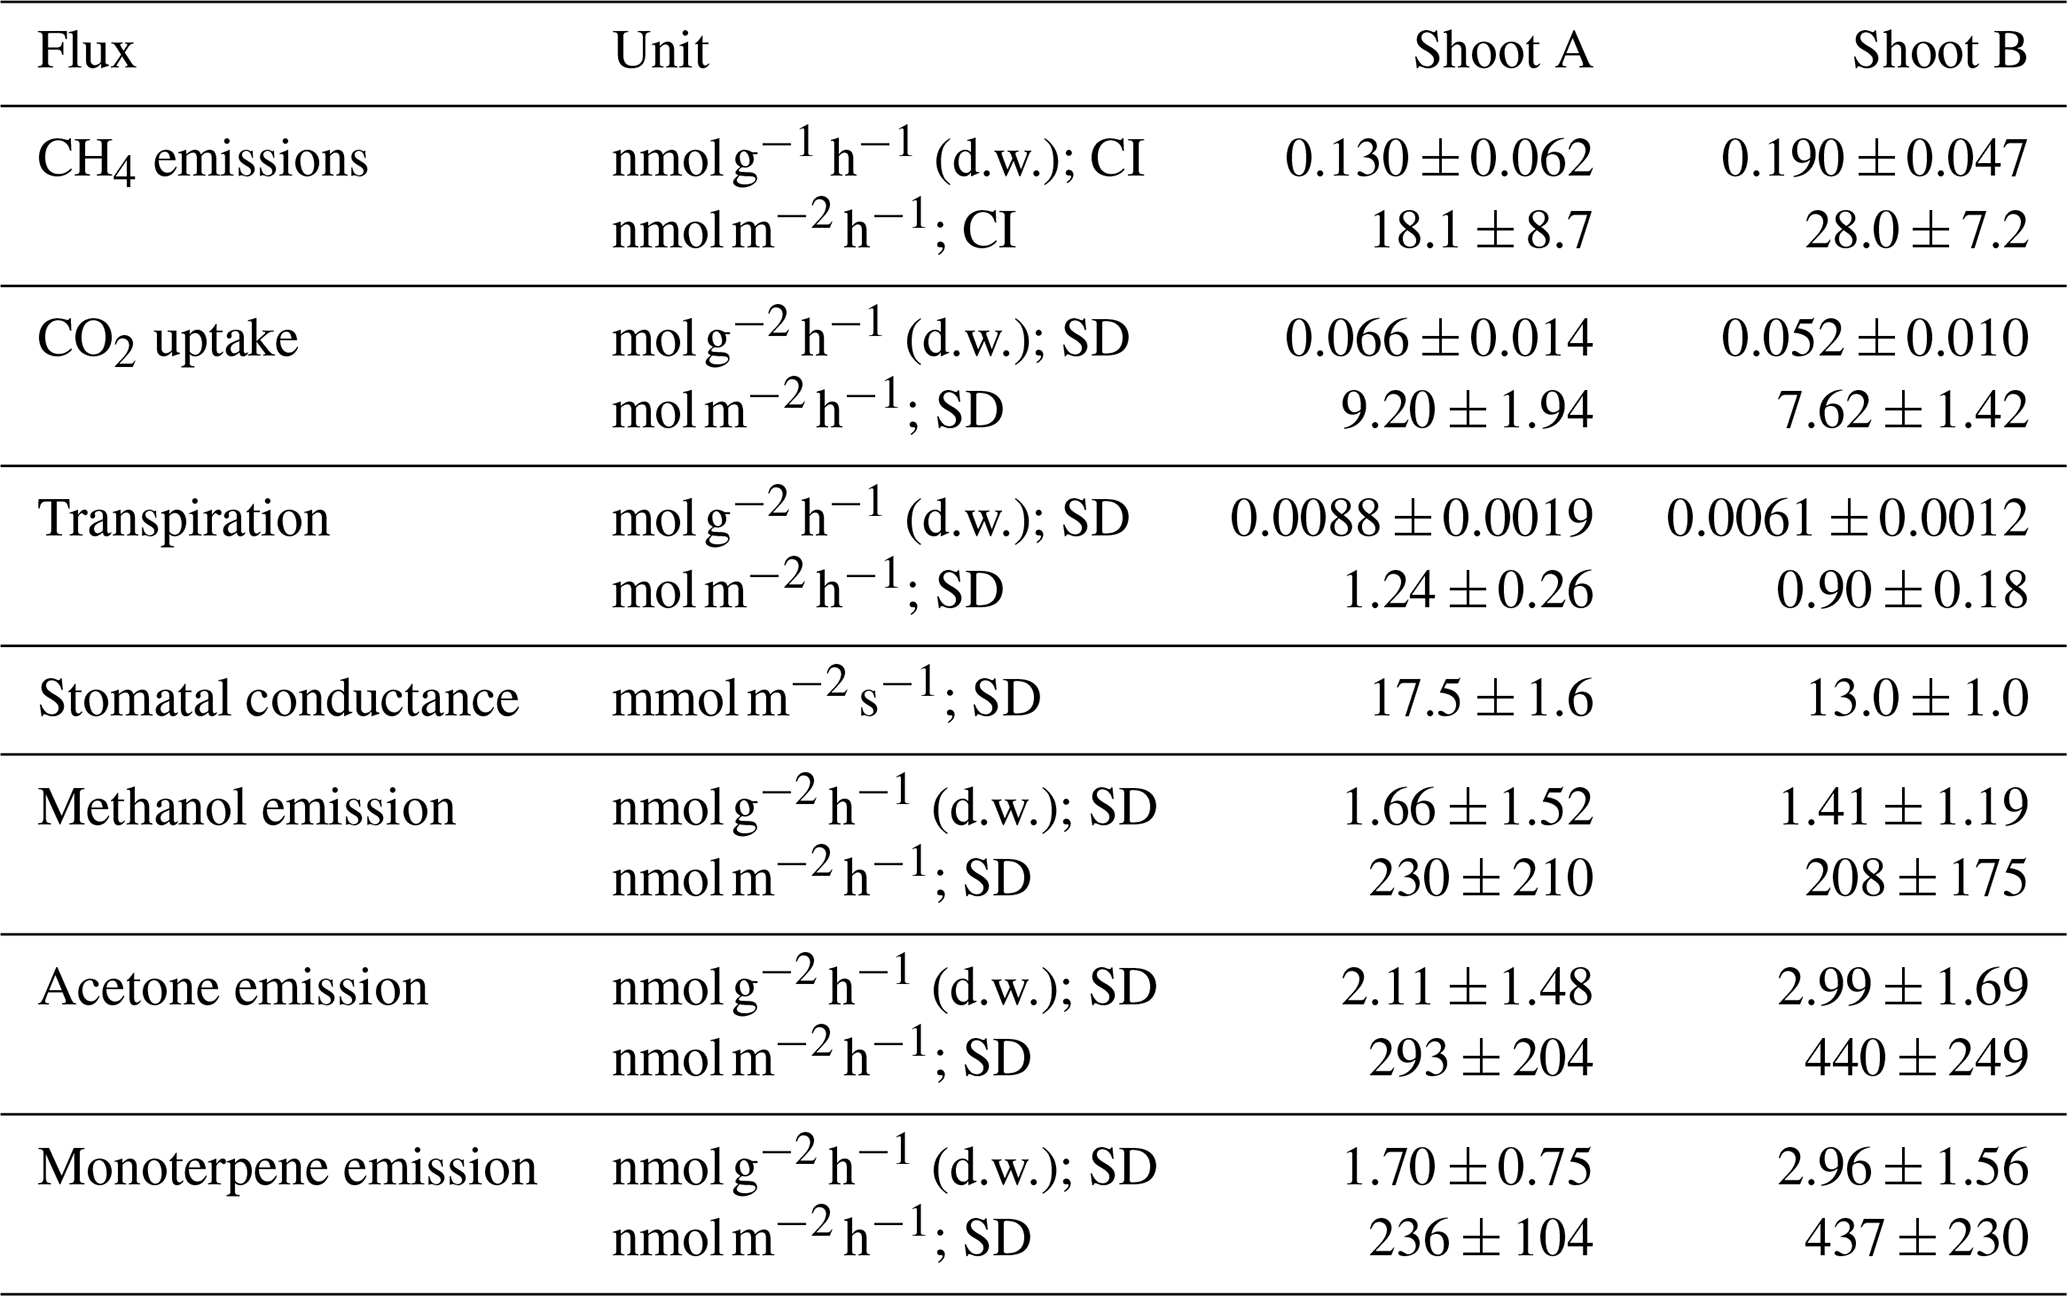
The average measured CO2 mixing ratio (1 SD) of air entering the shoot enclosure in dynamic chamber mode was 384.8 ± 5.5 ppmv (Fig. 8). After passing through empty chambers, CO2 mixing ratios were on average slightly elevated (390.6 ± 5.8 and 391.1 ± 5.7 ppmv), whereas CO2 was significantly depleted after air passed through shoot chambers (295.9 ± 18.3 and 308.6 ± 17.3 ppmv). The average carbon uptake by pine shoots, calculated as the difference between the shoot and empty chamber, was 7.63 ± 1.39 and 9.16 ± 1.93 mmol CO2 per square metre of leaf area per hour (Table 3).
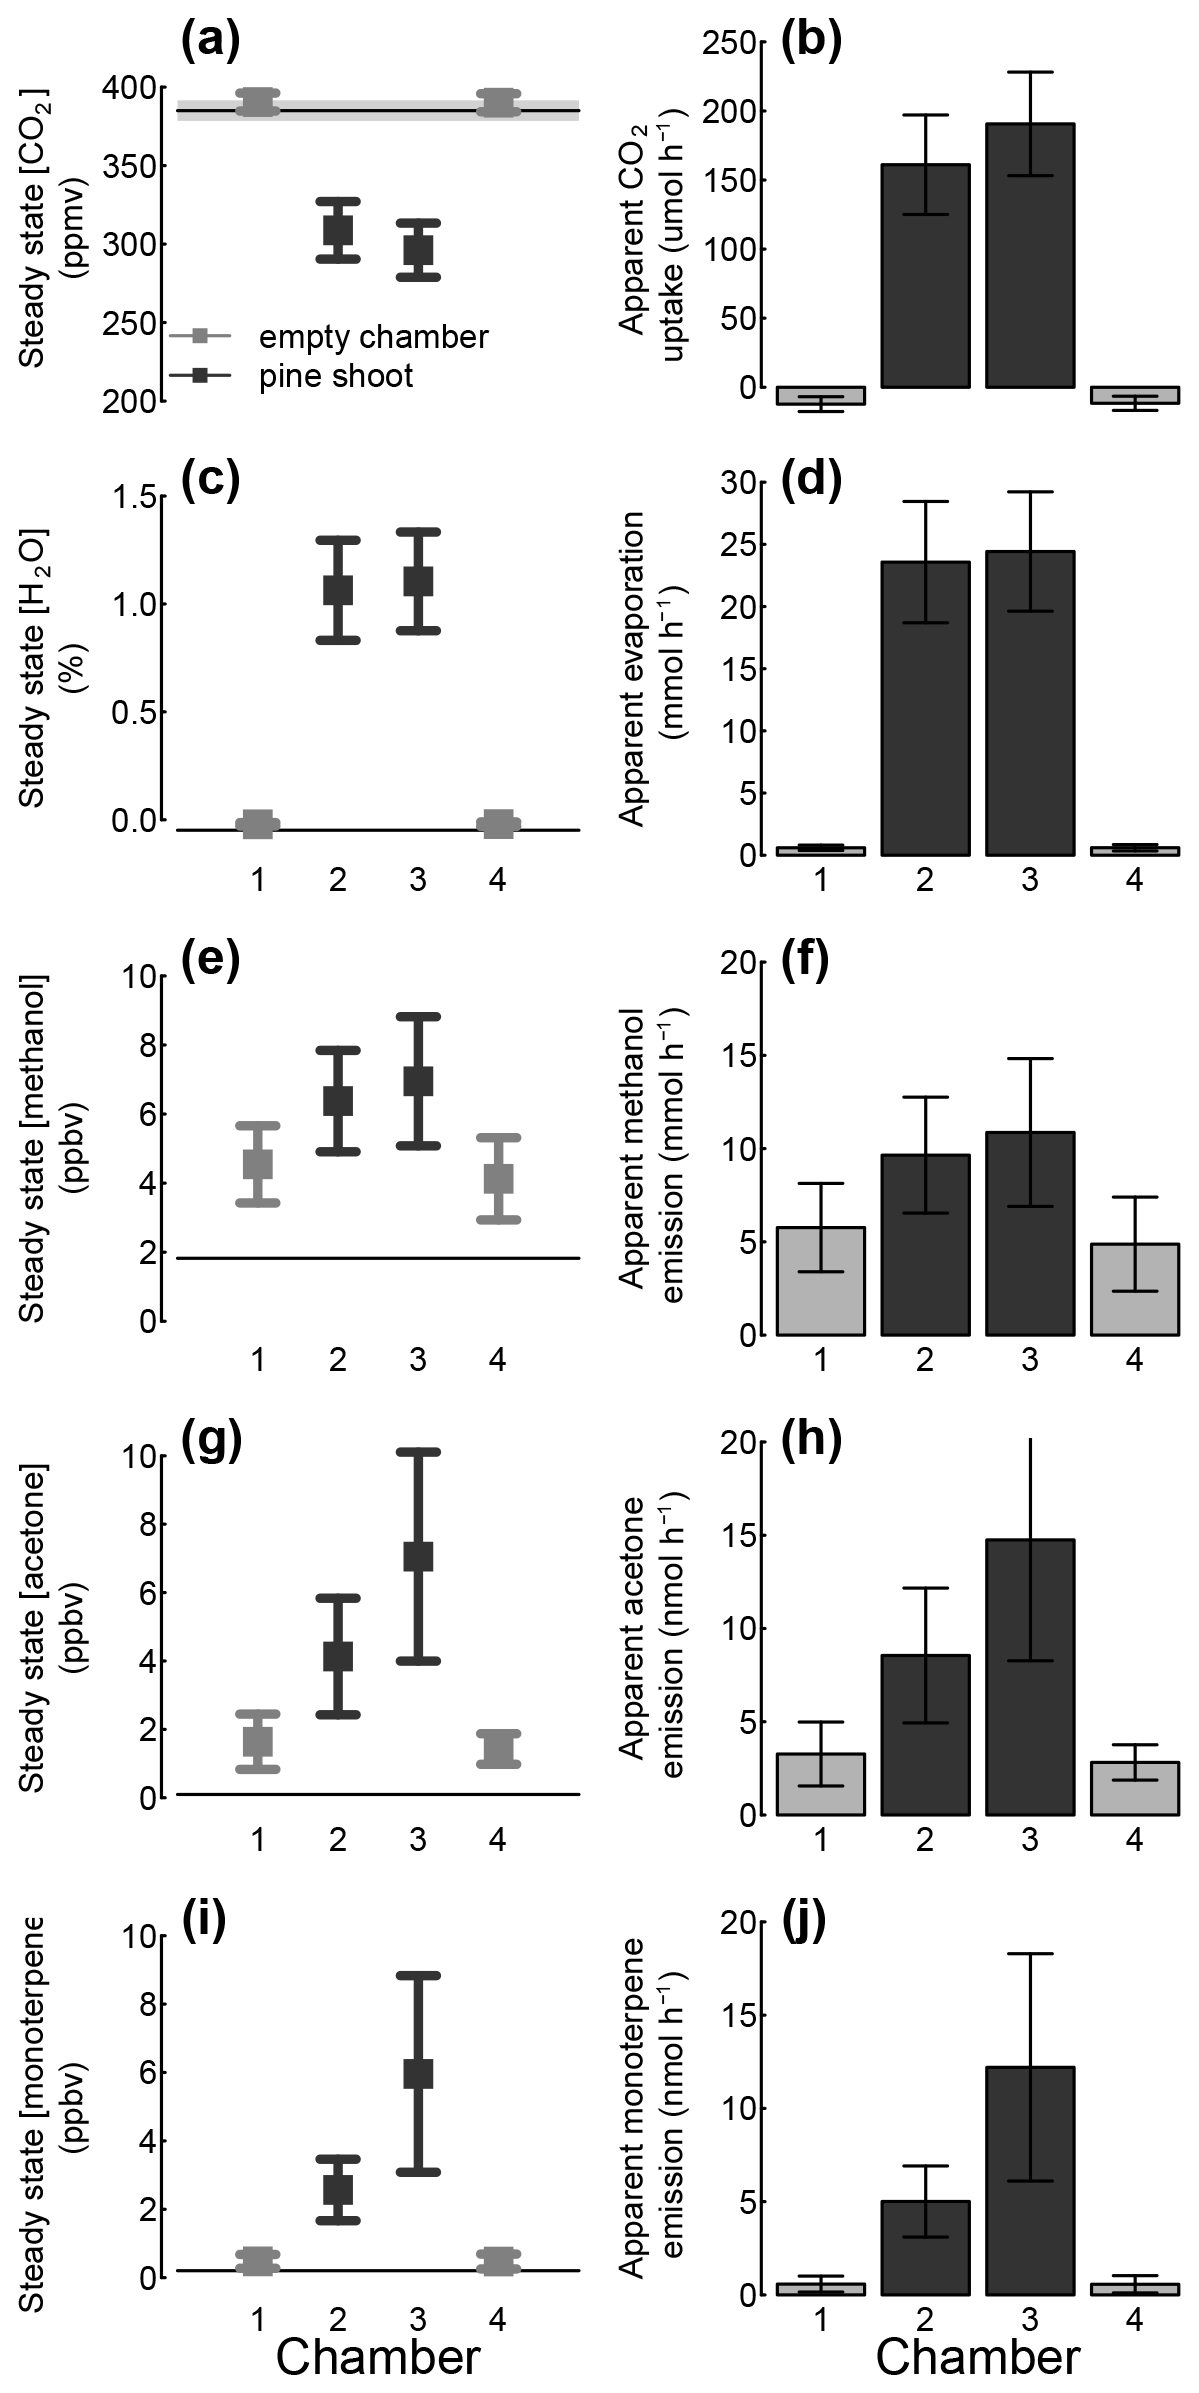
Figure 8Observed steady-state mixing ratio of CO2 (a), water (c), and VOCs (e, g, i) in outgoing air (Cout) during dynamic chamber measurements of two empty chambers (grey) and two chambers with pine shoots (black). The mixing ratios of CO2 water in ingoing air (Cin) are indicated by the horizontal lines in each plot. Further, apparent CO2 uptake (b), transpiration (d), and VOC emission (f, h, j) rates calculated from these mixing ratios. Error bars and the shaded area around the horizontal lines indicate 1 standard deviation.
The average measured absolute humidity air entering the chamber was −0.048 ± 0.005 %; the slightly negative values likely resulted from a miscalibration of the instrument (Fig. 8c). The humidity after passing through empty chambers was slightly elevated (measured values −0.030 ± 0.007 % and −0.031 ± 0.005 %), and significantly elevated after air passed through shoot chambers (1.105 ± 0.232 % and 1.1064 ± 0.230 %). The average transpiration by pine shoots, calculated as the difference between the shoot and empty chamber, were 1.24 ± 0.26 and 0.90 ± 0.18 mol per square metre of leaf area per hour (Table 3). The stomatal conductance values calculated from these evaporation rates were 17.5 ± 1.6 and 13.0 ± 1.0 .
The mixing ratios of three volatile compounds (classes) monitored in this study – methanol, acetone, and monoterpenes – in the air entering the chambers were 1.82 ± 0.01, 0.10 ± 0.01, and 0.20 ± 0.04 ppbv, respectively (Fig. 8e, g, i). The mixing ratios of these compounds in air leaving empty chambers were 4.12 and 4.54, 1.43 and 1.64, and 0.47 and 0.48 ppbv; their mixing ratios in air leaving chambers with pine shoots were 6.38 and 6.95, 4.13 and 7.05, and 2.56 and 5.96 ppbv. The emission rates of methanol, acetone, and monoterpenes, calculated as the difference between the shoot and empty chamber, were therefore 0.11 ± 0.05 and 0.21 ± 0.11, 0.29 ± 0.20 and 0.44 ± 0.25, and 0.24 ± 0.10 and 0.44 ± 0.23 nmol per square metre of leaf area per hour (Table 3). These emission rates are comparable to field measurements (e.g. Tarvainen et al., 2005).
3.6.2 Methane flux measurements
The apparent CH4 emission rates and their 95 % confidence intervals were 0.700 ± 0.137 and 1.106 ± 0.170 nmol h−1 in chambers with pine shoots and 0.279 ± 0.134 and 0.445 ± 0.111 nmol h−1 in empty chambers (Fig. 7a). Apparent emission rates in chambers with pine shoots were significantly different from the empty chambers and from each other, whereas fluxes from the two empty chambers were not significantly different from each other (Kruskal–Wallis χ2=52.8; p < 0.001). Apparent CH4 production rates of pine shoots were significantly lower for closures with CO2 injections compared to closures without injections (Fig. 7b), representing the dilution of CH4 by the injected CO2. However, apparent CH4 production rates were near identical to those measured from the same shoot without CO2 injections when CH4 mixing ratios were corrected for this dilution. This demonstrates the correction of CH4 mixing ratios successfully compensated for effects of CO2 injections. It also indicates that there was not a short-term response of CH4 emissions rates to the inhibition of CO2 fixation rates due to low CO2 mixing ratios.
Table 4Additional sources of uncertainty in CH4 fluxes.
Scaled and blank-corrected CH4 fluxes were 0.130 ± 0.062 and 0.190 ± 0.047 nmol per gram of foliage d.w. per hour or 18.1 ± 8.7 and 28.0 ± 7.2 nmol g−1 per square metre of leaf area per hour (Table 3). These values are approximately 5-fold below the lowest values reported by Keppler et al. (2006) for living plant tissues but 5–10 times higher than fluxes measured from shoots of mature Scots pine trees (Machacova et al., 2016) (median 3.13 nmol per square metre of leaf area per hour). A number of reasons may have led to these relatively low emissions rates compared to experiments by Keppler et al. (2006), including the timing of our measurements during the early growing season and the relatively low PAR provided in our experiments. Conversely, the higher emissions in our experiment compared to field measurements of the same species might have resulted from the augmented UVA irradiation or the fact that Machacova et al. (2016) conducted measurements during cloudy days only to avoid the overheating of their manual shoot enclosure. Regardless, these measurements demonstrate that our system is capable of detecting and quantifying CH4 emissions at or below the levels observed in many laboratory and field conditions.
Our evaluation of potential sources of measurement uncertainty (Table 4) indicated that chamber leakage was the main source of error in CH4 flux measurements. Measurement errors due to leakage were of a similar size to the observed fluxes, which explains the relatively large variability in empty-chamber CH4 fluxes. Chamber leakage, however, equally affected chambers with pine shoots and empty chambers (Fig. 7a) and should therefore not lead to biased results if measurements from a sufficient number of chamber closures are averaged and corrected for apparent fluxes observed in empty chambers. It is, however, possible that during longer experiments the sealing around the shoot inlet deteriorates due to physical stress, leading to larger leakage in shoots with tree branches compared to empty controls. It is therefore important to continuously monitor the tightness of each chamber throughout such experiments, as is currently done with automatic nightly measurements. These results further indicate that better chamber tightness will lead to an improvement in the detection limit of the method. In contrast, the effects of inaccuracies in the CO2 injection model and spectral interferences by VOCs were 5 and 10 times smaller than the observed fluxes, respectively, indicating that there mechanisms had only minor impacts upon measurement accuracy.
We developed an automated system to measure trace gas fluxes from plant shoots and other plant compartments while controlling the temperature, CO2 mixing ratio, and humidity in the plant chamber. Initial tests demonstrated that the system can detect CH4 fluxes at the scale reported for plant shoots. The system also allows the monitoring of water, CO2, and VOC fluxes. It is built in a modular way that is easy to customize and/or expand to different chamber types. We have constructed two implementations of this setup that are designed to measure trace gas fluxes from a single plant under controlled environmental conditions in a growth chamber and from multiple plants in a greenhouse compartment. Future development will aim to adapt the system to allow its deployment under field conditions, e.g. at long-term monitoring sites.
Raw measurement data and the analysis script are available at Zenodo (https://doi.org/10.5281/zenodo.4609836; Kohl et al., 2021). The software used to operate both systems is available online at https://bitbucket.org/makoskinen/koppismear/ (Koskinen, 2021).
MPi developed the initial concept. MK, LK, and MPi set out the design goals. MK, TP, LK, and KR came up with engineering solutions. TP was the main engineer responsible for building the systems with help from MK, LK, ST, and KR. MK wrote the control software for the systems; LK wrote the data analysis pipeline. LK, MK, MPa, and AZ analysed data from validation experiments. ST conducted the validation experiments with help from MK, LK, TP, and MPa. LK wrote the first draft of the manuscript with inputs from MK. All co-authors contributed to the final paper.
The author declares that there is no conflict of interest.
We would like to thank Juho Aalto and Heikki Laakso for advice while designing the system and Olli-Pekka Tikkasalo for help with parameterizing the CO2 injection model.
This research has been supported by the H2020 European Research Council (grant no. 757695), the Academy of Finland (grant nos. 319329 and 2884941), the H2020 Marie Skłodowska-Curie Actions (grant no. 843511), and the Maj ja Tor Nesslingin Säätiö.
Open-access funding was provided by the Helsinki University Library.
This paper was edited by Hendrik Fuchs and reviewed by two anonymous referees.
Barba, J., Bradford, M. A., Brewer, P. E., Bruhn, D., Covey, K., van Haren, J., Megonigal, J. P., Mikkelsen, T. N., Pangala, S. R., Pihlatie, M., Poulter, B., Rivas-Ubach, A., Schadt, C. W., Terazawa, K., Warner, D. L., Zhang, Z., and Vargas, R.: Methane emissions from tree stems: a new frontier in the global carbon cycle, New Phytol., 222, 18–28, https://doi.org/10.1111/nph.15582, 2019a. a
Barba, J., Poyatos, R., and Vargas, R.: Automated measurements of greenhouse gases fluxes from tree stems and soils: magnitudes, patterns and drivers, Sci. Rep., 9, 4005, https://doi.org/10.1038/s41598-019-39663-8, 2019b. a
Benzing, K., Comba, P., Martin, B., Pokrandt, B., and Keppler, F.: Nonheme Iron-Oxo-Catalyzed Methane Formation from Methyl Thioethers: Scope, Mechanism, and Relevance for Natural Systems, Chemistry, 23, 10465–10472, https://doi.org/10.1002/chem.201701986, 2017. a
Buck, A. L.: New equations for computing vapour pressure and enhancement factor, J. Appl. Meteorol., 20, 1527–1532, https://doi.org/10.1175/1520-0450(1981)020<1527:nefcvp>2.0.co;2, 1981. a
Cappellin, L., Algarra Alarcon, A., Herdlinger-Blatt, I., Sanchez, J., Biasioli, F., Martin, S. T., Loreto, F., and McKinney, K. A.: Field observations of volatile organic compound (VOC) exchange in red oaks, Atmos. Chem. Phys., 17, 4189–4207, https://doi.org/10.5194/acp-17-4189-2017, 2017. a
Carmichael, S. L., Yang, W., Roberts, E., Kegley, S. E., Padula, A. M., English, P. B., Lammer, E. J., and Shaw, G. M.: Residential agricultural pesticide exposures and risk of selected congenital heart defects among offspring in the San Joaquin Valley of California, Environ. Res., 135, 133–138, https://doi.org/10.1016/j.envres.2014.08.030, 2014. a
Cojocariu, C., Kreuzwieser, J., and Rennenberg, H.: Correlation of short-chained carbonyls emitted from Picea abies with physiological and environmental parameters, New Phytol., 162, 717–727, https://doi.org/10.1111/j.1469-8137.2004.01061.x, 2004. a
Covey, K. R. and Megonigal, J. P.: Methane production and emissions in trees and forests, New Phytol., 222, 35–51, https://doi.org/10.1111/nph.15624, 2019. a
Keppler, F., Hamilton, J. T. G., Braß, M., and Röckmann, T.: Methane emissions from terrestrial plants under aerobic conditions, Nature, 439, 187–191, https://doi.org/10.1038/nature04420, 2006. a, b, c, d, e
Kohl, L., Koskinen, M., Rissanen, K., Haikarainen, I., Polvinen, T., Hellén, H., and Pihlatie, M.: Technical note: Interferences of volatile organic compounds (VOCs) on methane concentration measurements, Biogeosciences, 16, 3319–3332, https://doi.org/10.5194/bg-16-3319-2019, 2019. a, b, c
Kohl, L., Koskinen, M., Polvinen, T., Tenhovirta, S., Rissanen, K., Patama, M., Zanetti, A., and Pihlatie, M.: An automated system for trace gas flux measurements from plantfoliage and other plant compartments (Version 1), Zenodo [data set], https://doi.org/10.5281/zenodo.4609836, 2021. a
Koskinen, M.: koppismear: a programming platform for operating automatized trace gas flux measurement systems, Bitbucket [program code], available at: https://bitbucket.org/makoskinen/koppismear/, last access: 12 June 2021. a
Koskinen, M., Minkkinen, K., Ojanen, P., Kämäräinen, M., Laurila, T., and Lohila, A.: Measurements of CO2 exchange with an automated chamber system throughout the year: challenges in measuring night-time respiration on porous peat soil, Biogeosciences, 11, 347–363, https://doi.org/10.5194/bg-11-347-2014, 2014. a
Lenhart, K., Behrendt, T., Greiner, S., Steinkamp, J., Well, R., Giesemann, A., and Keppler, F.: Nitrous oxide effluxes from plants as a potentially important source to the atmosphere, New Phytol., 221, 1398–1408, https://doi.org/10.1111/nph.15455, 2018. a
Machacova, K., Bäck, J., Vanhatalo, A., Halmeenmäki, E., Kolari, P., Mammarella, I., Pumpanen, J., Acosta, M., Urban, O., and Pihlatie, M.: Pinus sylvestris as a missing source of nitrous oxide and methane in boreal forest, Sci. Rep., 6, 1–8, https://doi.org/10.1038/srep23410, 2016. a, b, c, d
Machacova, K., Vainio, E., Urban, O., and Pihlatie, M.: Seasonal dynamics of stem N2O exchange follow the physiological activity of boreal trees, Nat. Commun., 10, 4989, https://doi.org/10.1038/s41467-019-12976-y, 2019. a
Pangala, S. R., Hornibrook, E. R., Gowing, D. J., and Gauci, V.: The contribution of trees to ecosystem methane emissions in a temperate forested wetland, Glob. Change Biol., 21, 2642–2654, https://doi.org/10.1111/gcb.12891, 2015. a
Pihlatie, M., Ambus, P., Rinne, J., Pilegaard, K., and Vesala, T.: Plant-mediated nitrous oxide emissions from beech (Fagus sylvatica) leaves, New Phytol., 168, 93–98, https://doi.org/10.1111/j.1469-8137.2005.01542.x, 2005. a
Pihlatie, M. K., Christiansen, J. R., Aaltonen, H., Korhonen, J. F., Nordbo, A., Rasilo, T., Benanti, G., Giebels, M., Helmy, M., Sheehy, J., Jones, S., Juszczak, R., Klefoth, R., Lobo-do Vale, R., Rosa, A. P., Schreiber, P., Serça, D., Vicca, S., Wolf, B., and Pumpanen, J.: Comparison of static chambers to measure CH4 emissions from soils, Agr. Forest Meteorol., 171–172, 124–136, https://doi.org/10.1016/j.agrformet.2012.11.008, 2013. a
R Development Core Team: R: A Language and Environment for Statistical Computing, available at: http://www.r-project.org (last access: 13 June 2021), 2015. a
Seco, R., Peñuelas, J., and Filella, I.: Short-chain oxygenated VOCs: Emission and uptake by plants and atmospheric sources, sinks, and concentrations, Atmos. Environ., 41, 2477,,2499, https://doi.org/10.1016/j.atmosenv.2006.11.029, 2007. a
Sundqvist, E., Crill, P., Mlder, M., Vestin, P., and Lindroth, A.: Atmospheric methane removal by boreal plants, Geophys. Res. Lett., 39, L21806, https://doi.org/10.1029/2012GL053592, 2012. a
Taipale, R., Ruuskanen, T. M., Rinne, J., Kajos, M. K., Hakola, H., Pohja, T., and Kulmala, M.: Technical Note: Quantitative long-term measurements of VOC concentrations by PTR-MS – measurement, calibration, and volume mixing ratio calculation methods, Atmos. Chem. Phys., 8, 6681–6698, https://doi.org/10.5194/acp-8-6681-2008, 2008. a
Takahashi, K., Kosugi, Y., Kanazawa, A., and Sakabe, A.: Automated closed-chamber measurements of methane fluxes from intact leaves and trunk of Japanese cypress, Atmos. Environ., 51, 329–332, https://doi.org/10.1016/j.atmosenv.2012.01.033, 2012. a
Tarvainen, V., Hakola, H., Hellén, H., Bäck, J., Hari, P., and Kulmala, M.: Temperature and light dependence of the VOC emissions of Scots pine, Atmos. Chem. Phys., 5, 989–998, https://doi.org/10.5194/acp-5-989-2005, 2005. a