the Creative Commons Attribution 4.0 License.
the Creative Commons Attribution 4.0 License.
 | 17 Jun 2021
Characterization of aerosol size properties from measurements of spectral optical depth: a global validation of the GRASP-AOD code using long-term AERONET data
Benjamin Torres
David Fuertes
A validation study is conducted regarding aerosol optical size property retrievals from measurements of the direct sun beam only (without the aid of diffuse radiation). The study focuses on using real data to test the new GRASP-AOD application, which uses only spectral optical depth measurements to retrieve the total column aerosol size distributions, assumed to be bimodal lognormal. In addition, a set of secondary integral parameters of aerosol size distribution and optical properties are provided: effective radius, total volume concentration and fine-mode fraction of aerosol optical depth (AOD). The GRASP-AOD code is applied to almost 3 million observations acquired over 20 years (1997–2016) at 30 AERONET (Aerosol Robotic Network) sites. These validation sites have been selected based on known availability of an extensive data record, significant aerosol load variability throughout the year, wide worldwide coverage and diverse aerosol types and source regions. The output parameters are compared to those coming from the operational AERONET retrievals. The retrieved fine-mode fractions at 500 nm (τf(500)) obtained by the GRASP-AOD application are compared to those retrieved by the spectral deconvolution algorithm (SDA) and by the AERONET aerosol retrieval algorithm. The size distribution properties obtained by the GRASP-AOD are compared to their equivalent values from the AERONET aerosol retrieval algorithm. The analysis showed the convincing capacity of the GRASP-AOD approach to successfully discriminate between fine- and coarse-mode extinction to robustly retrieve τf(500). The comparisons of 2 million results of τf(500) retrieval by the GRASP-AOD and SDA showed high correlation with a root mean square error (RMSE) of 0.015. Also, the analysis showed that the τf(500) values computed by the AERONET aerosol retrieval algorithm agree slightly better with the GRASP-AOD (RMSE = 0.018, from 148 526 comparisons) than with the SDA (RMSE = 0.022, from 127 203 comparisons). The comparisons of the size distribution retrieval showed agreement for the fine-mode median radius between the GRASP-AOD and AERONET aerosol retrieval algorithm results with an RMSE of 0.032 µm (or 18.7 % in relative terms) for the situations when τ(440)>0.2 occur for more than 80 000 pairs of the study. For the cases where the fine mode is dominant (i.e., α>1.2), the RMSE is only of 0.023 µm (or 13.9 % in relative terms). Major limitations in the retrieval were found for the characterization of the coarse-mode details. For example, the analysis revealed that the GRASP-AOD retrieval is not sensitive to the small variations of the coarse-mode volume median radius for different aerosol types observed at different locations. Nonetheless the GRASP-AOD retrieval provides reasonable agreement with the AERONET aerosol retrieval algorithm for overall coarse-mode properties with with RMSE = 0.500 µm (RMSRE = 20 %) when τ(440)>0.2. The values of effective radius and total volume concentration computed from the GRASP-AOD retrieval have been compared to those estimated by the AERONET aerosol retrieval algorithm. The RMSE values of the correlations were 30 % for the effective radius and 25 % for the total volume concentration when τ(440)>0.2. Finally, the study discusses the importance of employing the assumption of bimodal lognormal size distribution. It also evaluates the potential of using ancillary data, in particular aureole measurements, for improving the characterization of the aerosol coarse-mode properties.
- Article
(11040 KB) - Full-text XML
- BibTeX
- EndNote


Information regarding aerosol properties has an important role in several atmospheric activities such as weather prediction, air quality analyses, solar energy, aviation safety and climate studies (see recent IPCC reports; Solomon et al., 2007; Stocker et al., 2014). Given its impact, both real-time and near real-time global aerosol forecasting products are distributed by several operational centers (e.g., the ECMWF Copernicus Atmosphere Monitoring Service (CAMS), the Finnish Meteorological Institute (FMI), the NOAA National Centers for Environmental Prediction (NCEP), Météo France and the Barcelona Supercomputing Center (BSC)). These products are generated by sophisticated numerical models that use aerosol-related observations (satellite or ground-based) for data assimilation and model evaluation. However, the size distribution of the aerosol particles, which is one of the key parameters of aerosol properties, is not provided by most of these operational models or it presents difficulties in its prediction in their current version (Benedetti et al., 2018). Nevertheless, the purpose of the aerosol prediction community is to offer a more complete description of the aerosol population, outputting both mass and number density concentration, in the next generation of aerosol model forecasts.
The main difficulty for a global characterization of the aerosol size distribution can be found in the lack of quality information with enough temporal and spacial resolution coming from real observations. In the case of satellite measurements, apart from the typical time coverage limitation, we find that the retrieval of the size distribution is just an intermediate step for most of the traditional satellite operational algorithms (which are based on lookup tables). The quality of the derived size distributions is rarely analyzed; most attention is paid to the optical thickness outcome and other aerosol optical properties (Dubovik et al., 2011). The new sophisticated multi-angular, multi-wavelength and polarimetric sensors and the progress in the performance of computer systems that will allow the operational use of new-generation retrieval algorithms (based on a statistically optimized search in a continuous space of solutions instead of lookup tables) are expected to improve the reliability of aerosol retrievals by giving a more detailed representation of aerosol properties (Dubovik et al., 2019). Therefore, the new generation of satellites will provide quality long data series of aerosol properties, including a better description of the aerosol size information, that will be used as the main tool for global aerosol monitoring and characterization.
Aerosol prediction models typically use ground-based radiometer measurements to complete the information coming from satellite sensors (Randles et al., 2017; Rubin et al., 2017). It is rare to see examples of aerosol models (even in regional models) where the input data exclusively come from ground-based measurements. The reason is based on the fact that ground-based systems do not by themselves represent the spatial variation in aerosol properties (Holben et al., 2018). However, ground-based measurements are an essential tool for satellite and aerosol model validation purposes (to cite some: Chu et al., 2002; Liu et al., 2004; Remer et al., 2002, 2005; Kahn et al., 2005; Bréon et al., 2011; Sayer et al., 2013; Levy et al., 2013; Chen et al., 2018, 2020) since: (a) the spectral aerosol optical extinction is obtained from direct observations, which confer a high accuracy to the value and (b) the aerosol properties are better described and characterized compared to satellite retrievals, given the larger information contained in their measurements (the aforementioned aerosol extinction plus aerosol scattering information in larger angular ranges).
The latter statement accounts especially for the representation of the size distribution. Several ground-based operational retrievals use binned distribution (where the values of the particle concentration are defined for several radii) instead of using the superposition of lognormal functions typically preferred in satellite retrievals (Nakajima et al., 1996; Dubovik and King, 2000). For instance, the AERONET (AErosol RObotic NETwork Holben et al., 1998) aerosol retrieval algorithm (Dubovik and King, 2000; Dubovik et al., 2000, 2002b, 2006; Sinyuk et al., 2020) uses 22 bins logarithmically equidistant (from 0.05 to 15 µm) to characterize the aerosol size distribution from aerosol optical depth (AOD) measurements and cloud-free sky radiances. With such level of detail, the binned size distribution can represent nearly any possible shape of size distribution, and even very minor features in the size distribution shape have been successfully described by the AERONET aerosol retrieval algorithm. This ability allows one to describe with great precision various aerosol related phenomena: coagulation, hygroscopy, aging, cloud processing, description of particular events such as volcanic plumes and dust storms, etc. (Dubovik et al., 2002a; Eck et al., 2005, 2010). Nevertheless, the needs for global validation proposes (either satellite or aerosol model products) are typically restricted to a more basic description of the microphysical parameters (effective radius and/or total volume concentration). However, they demand better time resolution information.
Recent studies in the field of aerosol property retrieval have been conducted to satisfy this demand. The basis consists of reducing the high requirements of current ground-based operational retrievals (almost cloudless conditions and large solar zenith angles to assure full aerosol scattering information) to provide information about aerosol microphysical properties. One of the most recurrent attempts has been the analysis of using only spectral aerosol optical depth (τ) for characterizing aerosol properties (to cite some: King et al., 1978; O'Neill et al., 2003; Schuster et al., 2006; Kazadzis et al., 2014; Pérez-Ramírez et al., 2015; Torres et al., 2017). These studies are encouraged by the relative high frequency of aerosol optical depth compared to the occurrence of a full set of measurements (including radiances). For instance, in the AERONET algorithm the number of valid clear-sky radiance retrievals can reach about 16 per day (new instruments with hybrid scans), while the number of τ measurements can reach up to 200 per day. Moreover, many AERONET sites are plagued by several months of partial cloudiness. In these situations, there are no angular measurements of sky radiance suitable for the retrieval of detailed aerosol properties and only a few direct sun measurements are available at best. In addition, there are some other networks that only provide measurements of aerosol optical depth that could potentially make use of such techniques (Maritime Aerosol Network (Smirnov et al., 2009) or the the Global Atmospheric Watch GAW-PFR (Wehrli, 2005)). Another motivation to analyze the potential of using aerosol optical depth only is the development of night measurements (star photometry (Herber et al., 2002; Pérez-Ramírez et al., 2008, 2011; Baibakov et al., 2015) and lunar photometry (Barreto et al., 2013, 2016)) where τ data are typically the only information available. In polar regions, these night spectral aerosol optical depth are the main information that can be used to infer aerosol properties during winter months.
The studies analyzing the spectral aerosol optical depth can be divided according to the information derived in the retrieval. Thus, the applications based on the linear estimation techniques (LETs; for more information see Veselovskii et al., 2012; Kazadzis et al., 2014; Pérez-Ramírez et al., 2015) give a simplified description of the volume aerosol size distribution approximated by the effective radius and the total volume aerosol concentration. On the other hand, the spectral deconvolution algorithm (SDA; O'Neill et al., 2003), which is part of the AERONET processing chain, successfully discriminates fine- and coarse-mode extinction at 500 nm assuming a bimodal particle size distribution, although it does not infer information related to the microphysical properties of the assumed bimodal column volume size distribution. Finally, the GRASP-AOD application (Torres et al., 2017) also assumes the volume size distribution as bimodal lognormal and retrieves as primary output the six parameters characterizing the function: volume median radii (RVi [µm]), geometric standard deviations (σVi) and particle volume concentration (CVi [µm3/µm2]), with for the fine and coarse mode, respectively. Once this characterization is achieved, a set of secondary aerosol properties are estimated straightway including the total effective radius (Reff [µm])), the total volume concentration ( [µm3/µm2]) and the discrimination between the fine- and coarse-mode aerosol optical depth at 500 nm (τf,τc). This strategy allows the GRASP-AOD application to offer a more complete description in terms of aerosol properties compared to the other approaches.
The GRASP-AOD application has been identified as a promising advance to derive aerosol properties with enough frequency for model validation and forecasting, specifically to infer interesting information related to aerosol speciation (Benedetti et al., 2018). However, the application of the code has been restricted to specific studies so far (Boichu et al., 2016; Román et al., 2017; Popovici et al., 2018). For instance, Boichu et al. (2016) analyzed the volcanic plumes reaching France several times in September 2014, which were emitted by the Holuhraun eruption (a massive eruption in terms of sulfur emissions that has caused repeated episodes of air pollution on a continental scale) of the Icelandic volcano Bárðarbunga. Regarding size distribution properties, the description of these plumes was quite fragmented due to the persistent cloudy conditions that allowed only a few retrievals from the AERONET aerosol algorithm in the whole month. The analyses of only direct sun measurements with the GRASP-AOD application has been revealed to be quite relevant to complete the aerosol size information dataset during the study.
Beyond the aforementioned specific studies, the purpose of the present work is to show that the GRASP-AOD application has the potential to be used for large-scale datasets either for climate studies or for near real-time modeler needs. In the study by Torres et al. (2017), the GRASP-AOD application was deeply described and positioned within the development of the GRASP (Generalized Retrieval of Atmosphere and Surface Properties; see Dubovik et al., 2014) algorithm and software (more information and a free version of the code in its entirety can be obtained at http://www.grasp-open.com/, last access: 1 June 2021). To prove the robustness in the retrieval, the work by Torres et al. (2017) presented a validation of the application though it is mainly focused on simulated tests (multiple variations of the initial guess, effects of errors in the aerosol optical depth measurements and sensitivity to the refractive index assumptions). A first real data validation was also provided by comparing the aerosol properties obtained from 744 AERONET observations using the GRASP-AOD application to those obtained through the retrievals from the AERONET aerosol algorithm from almucantar measurements at 8 different AERONET sites from several pre-selected days. However, this first validation based on daily averages was considered to be insufficient if the GRASP-AOD application aims to be operationally applied. Here we present a larger real data validation based on 2.8 million GRASP-AOD retrievals using AERONET aerosol optical depth observations from 30 AERONET sites for 20 years (1997–2016).
This paper is organized as follows: section 2 explains the methodology followed to do the validation (data selection and comparisons). Section 3 describes the results of the global validation. In Sect. 4 we discuss some of the main results obtained here and we point out new retrieval ideas and possible improvements for future reprocessings. Finally, in Sect. 5 the main conclusions are presented.
As mentioned in the introduction, the objective of this work is to offer a large-scale validation of the GRASP-AOD application by using AERONET τ measurements and operational retrievals. Thus, the aerosol properties obtained by the GRASP-AOD application (with only AERONET aerosol optical depth measurements from 340–1020 nm as input) will be compared to those provided by AERONET retrievals, which come from the spectral deconvolution algorithm (SDA; O'Neill et al., 2003, only input aerosol optical depth from 380–870 nm) and the AERONET aerosol retrieval algorithm (Dubovik and King, 2000; Dubovik et al., 2000, 2002b, 2006; Sinyuk et al., 2020, which uses both sky-radiances and sun-direct measurements from 440–1020 nm).
2.1 Data source
The only data source used in the analysis belongs to AERONET Level 2.0 from Version 3 (Giles et al., 2019; Sinyuk et al., 2020), which can be found in the public AERONET database (http://aeronet.gsfc.nasa.gov, last access: 1 June 2021):
-
The τ measurements used as inputs in the GRASP-AOD application have first passed a cloud screening criteria to obtain the AERONET Level 1.5 and then automated quality control algorithms to achieve Level 2.0 (Giles et al., 2019). The accuracy of the Level 2.0 spectral τ measurements is ∼0.01 in the visible and NIR wavelengths and ∼0.02 in the UV (Eck et al., 1999).
-
The AERONET retrievals used for the comparisons: (a) τf(500) obtained from the SDA (O'Neill et al., 2003) and (b) size distribution standard parameters and τf(500) computed from the AERONET aerosol retrieval algorithm (general description in Dubovik and King, 2000; Dubovik et al., 2006 with some updates for Version 3 described in Sinyuk et al., 2020).
As mentioned in the introduction, we have carried out the comparison with the data acquired at thirty AERONET sites for 20 years (1997–2016). The thirty AERONET sites were selected based on the availability of an extensive data record (i.e., at least 10 years of τ measurements on the AERONET website) and accounting for the geographic distribution among the different aerosol source regions (see Fig. 1). We have chosen to limit from 340 to 1020 nm the spectral range of the GRASP-AOD data input, which is common to all the photometers in the AERONET network (1640 nm was exclusive to extended wavelength versions). The use of the 1640 nm channel did not suppose any substantial change in the study by Torres et al. (2017), and we have prioritized the use of a homogenized spectral range in this analysis, regardless of the photometer type.1
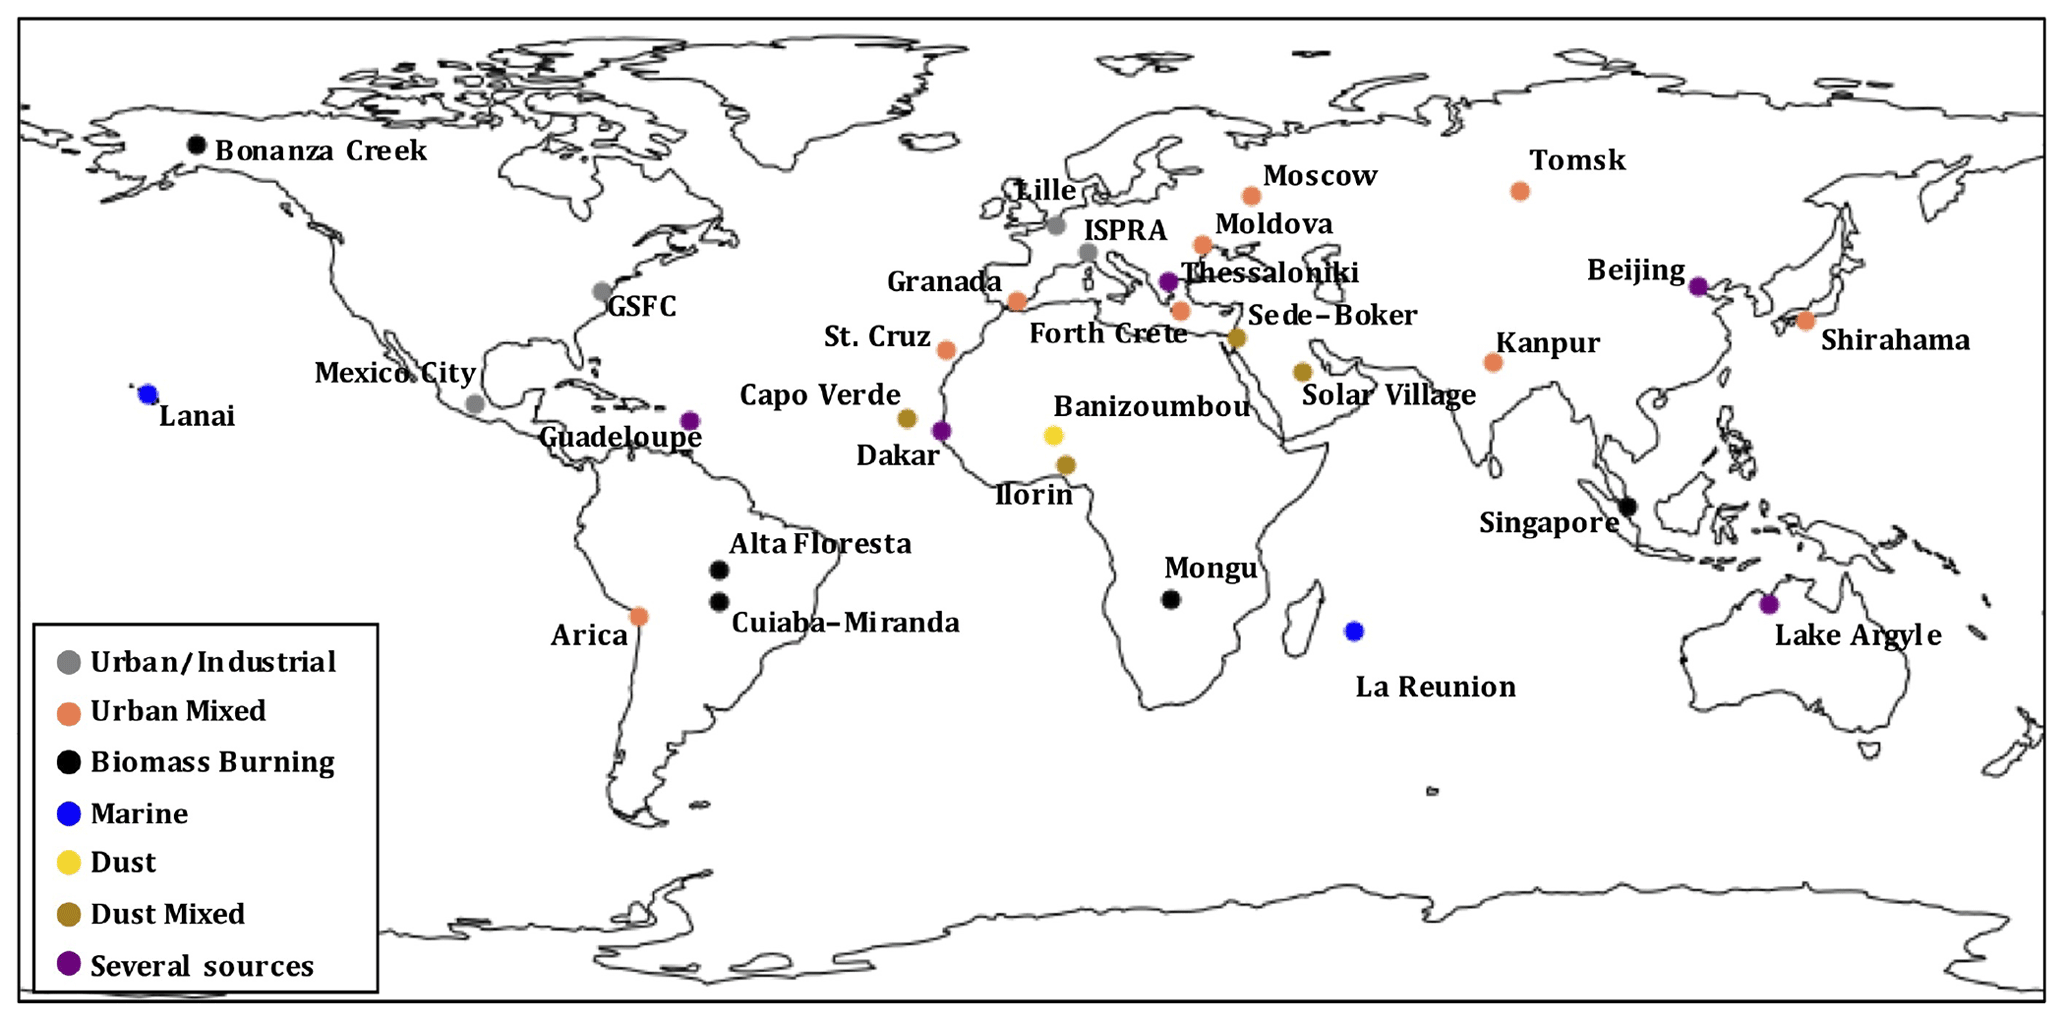
Figure 1Geographical distribution of the AERONET sites considered in the analyses. The color of each site locator is assigned according to the aerosol type of the site (see sixth column in Table 1).
Table 1 shows the information regarding the selected sites. The five first columns contain the name of the site, the period with measurements, the total number of τ measurements, the average aerosol optical depth values at 440 nm and the Ångström exponent (Ångström, 1961) registered between 1997–2016. The sixth column presents the dominant aerosol type. Note here that the purpose of the study is to carry out a validation of the GRASP-AOD application and not to re-do aerosol climatologies for the different sites. In this regard, the average of τ(440), the Ångström exponent and the aerosol type labels are given here just to briefly describe the site characteristics. The aerosol type labels are similar to those used in AERONET climatologies (Dubovik et al., 2002a; Giles et al., 2012), and the classification is based on the existing literature, which is indicated in the seventh column. Four categories represent the sites with a dominant aerosol type (although episodic aerosol incursions outside of their classification category may have occurred at these sites during the analysis period): biomass burning, urban/industrial, dust and marine. We have also considered three mix aerosol categories to represent those sites presenting recurrently more than one aerosol type: (a) urban mixed (urban/industrial predominance with some dust or biomass burning events throughout the year), (b) dust mixed (desert dust predominance in urban backgrounds or with biomass burning episodes) and, finally, (c) several sources for the sites with the presence of at least three different types of aerosols (e.g., the Beijing site in an urban background with seasonal episodes of desert dust and biomass burning). The color of each site locator in Fig. 1 is assigned according to the aerosol type of the site.
Dubovik et al. (2002a); Eck et al. (2003)Eck et al. (2012); Carn et al. (2007)Holben et al. (2001)Eck et al. (2005)Eck et al. (2009)Holben et al. (2001); Dubovik et al. (2002a)Holben et al. (2001); Tanré et al. (2001)Holben et al. (2001); Mortier et al. (2016)Bergamo et al. (2008)Dubovik et al. (2002a)Lyamani et al. (2005, 2010)Prospero et al. (2014)Eck et al. (2010)Mélin and Zibordi (2005)Eck et al. (2012)Mitchell et al. (2013)Dubovik et al. (2002a)Mortier (2013)Dubovik et al. (2002a)Kabashnikov et al. (2014)Holben et al. (2001); Dubovik et al. (2002a)Chubarova et al. (2011a, b)Mallet et al. (2018)Derimian et al. (2006)Gonzalez Ramos and Rodriguez (2013)Eck et al. (2005)Chew et al. (2013)Dubovik et al. (2002a)Giannakaki et al. (2010)Panchenko et al. (2012)Table 1General description of the data used in the validation study. The first two columns present the name of the site and the period with τ measurements. The third column shows the total number of τ measurements. The two following columns contain the average values of τ(440) and the Ångström exponent. The last two columns illustrate the aerosol type and the main references analyzing the site characteristics.
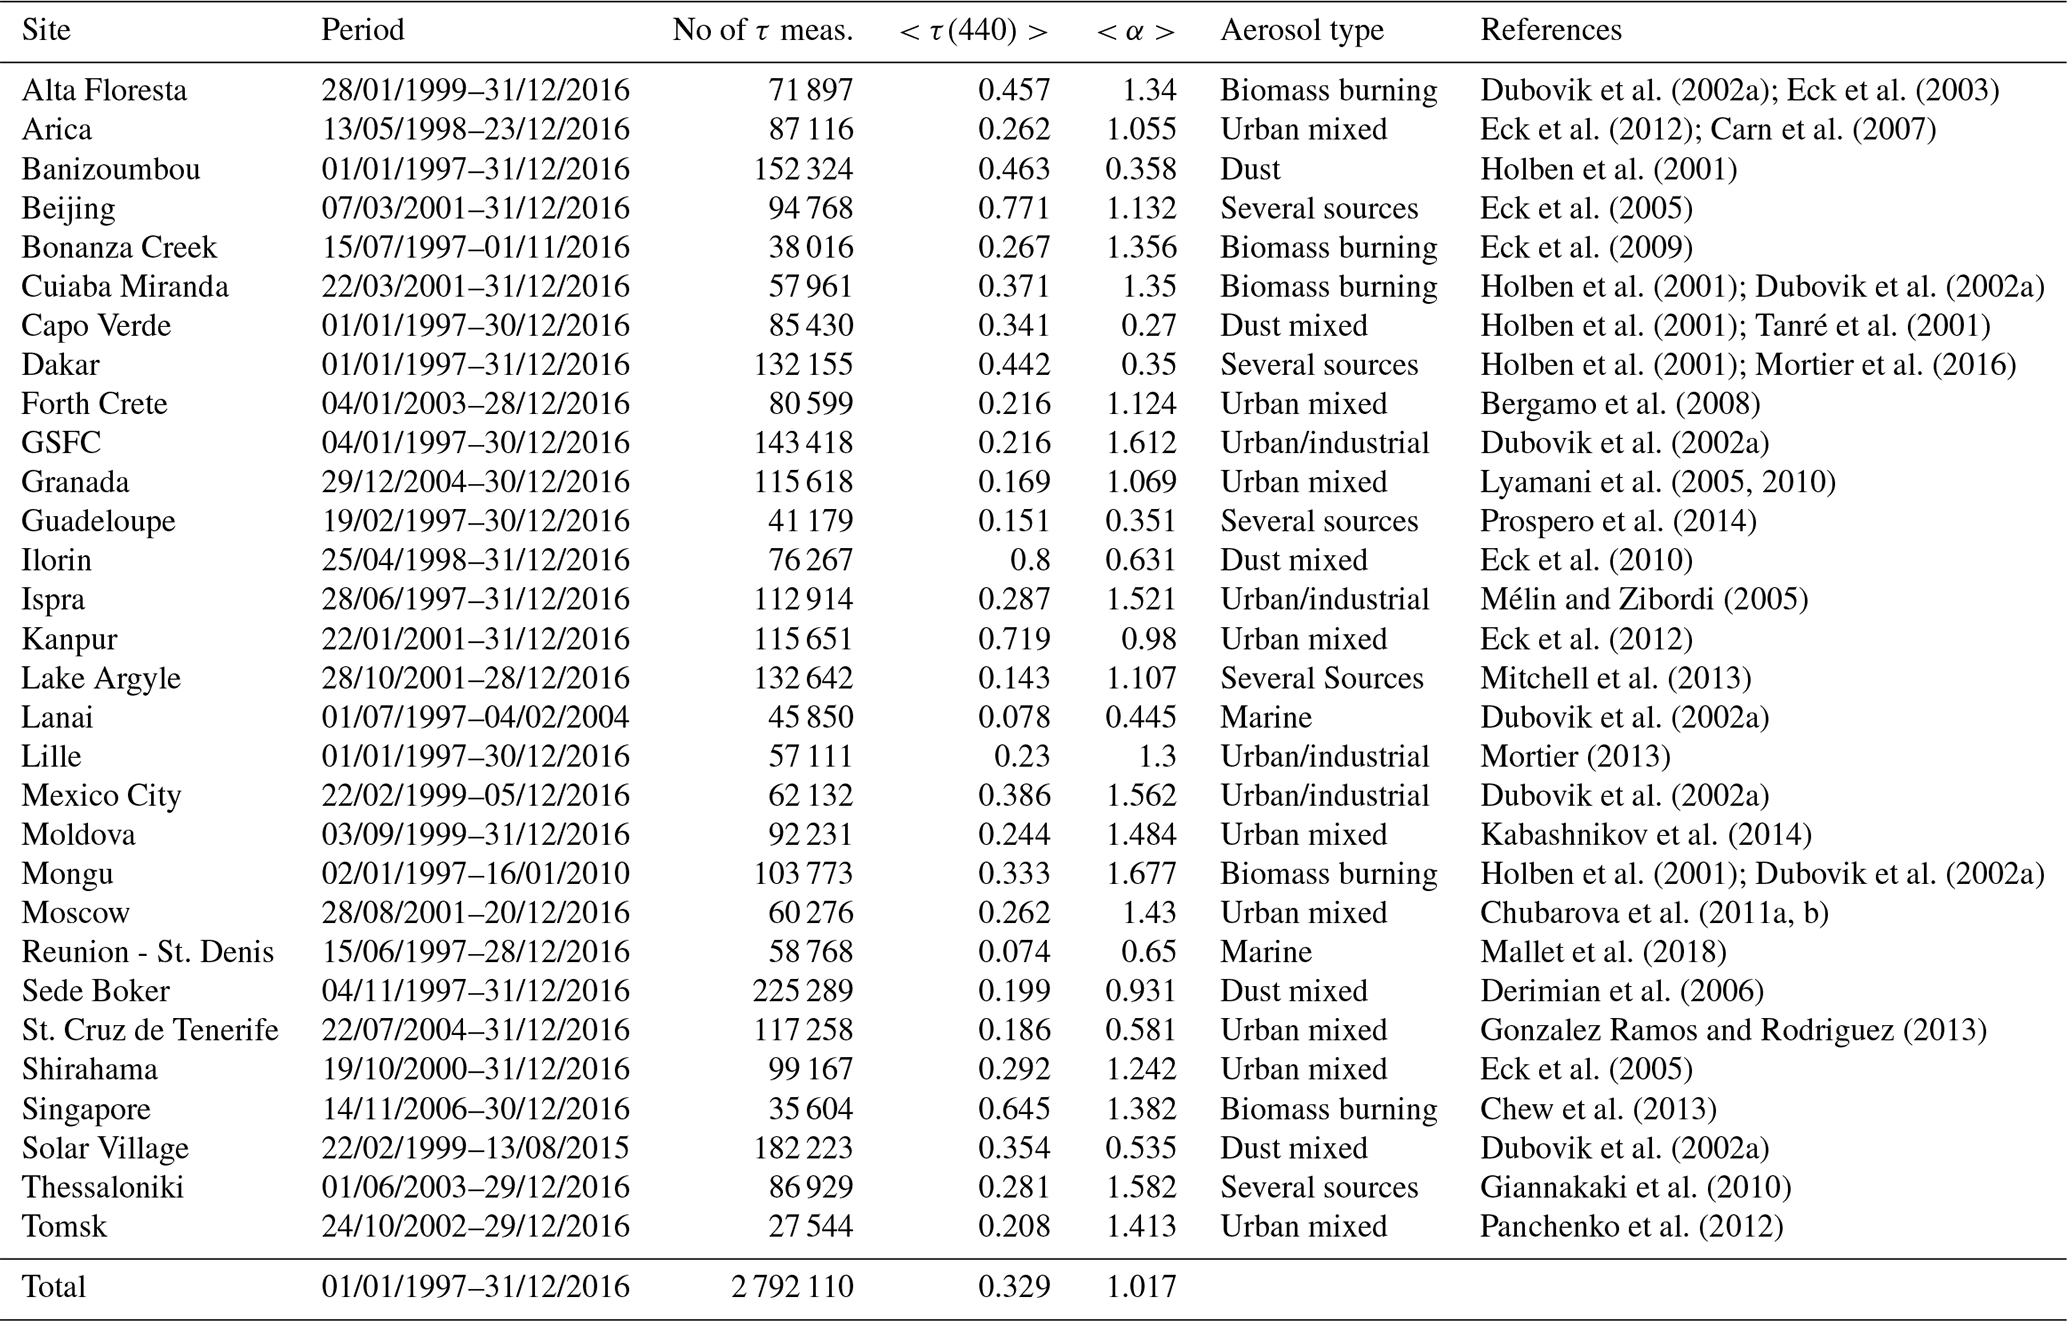
The relative high average values of τ(440) in the third column are due to the fact that we have prioritized the selection of sites with significant aerosol load throughout the year of the study. The only exceptions are the two sites that we have categorized as influenced by marine aerosols: Reunion–St. Dennis and Lanai. The relative low average values of τ(440) for these two sites are in agreement with the studies by Smirnov et al. (2002a, 2009), which indicate that the values of τ(500) are typically less than 0.1 for pure maritime environments. As shown in Torres et al. (2017), the retrieval quality of some aerosol products derived by the GRASP-AOD do not depend on the aerosol load. This fact and the interest in including all aerosol species in the study justify the presence of these two sites in the analysis.
2.2 GRASP-AOD inversion
As mentioned in the introduction, the GRASP-AOD application retrieves aerosol size properties only from τ measurements (Torres et al., 2017). The lack of scattering information containing essential information to derive a detailed characterization of aerosols obliges us to do a series of approximations and simplifications in order to adjust the aerosol model used in the retrieval to the actual information content. The GRASP algorithm has a highly flexible forward model that makes this possible. In this regard, the retrieval size distributions are approximated as bimodal lognormals that are described by only six parameters: volume median radius (), standard deviation () and volume concentration () for the fine and coarse mode (instead of more detailed binned size distributions as in the case of AERONET standard inversion). The application assumes the complex refractive index as in the retrieval procedure. Full inversion details of the GRASP-AOD and the consequences of the different assumptions can be obtained from Torres et al. (2017) and the references therein.
The purpose of this subsection is to describe the particular use made of the GRASP-AOD in this validation study. As mentioned before, the primary input are the almost 2.8 millions τ measurements belonging to AERONET Level 2.0 of Version 3 between 1997–2016 in the 30 sites selected for the analysis (see Table 1). Regarding the assumption of the refractive index, we have created a database of moving monthly means (two adjacent months) for all sites using Version 3 of the AERONET aerosol retrieval algorithm (considering the entire historical database, beyond the period analyzed here). We have prioritized the use of Level 2.0 refractive index data (quality assured data; Holben et al., 2006). When there was not enough data for this calculation, we have increased the moving average to 5 or 7 months. When even the use of a 7 months average was not enough to produce a climatological value, Level 1.5 was used. This happened for Lanai, which does not have Level 2.0 refractive index data in the whole archive.
Given the speed of the GRASP-AOD application (just a few seconds for an entire day), we have adopted a multiple choice strategy for the initial guess values. Thus, the GRASP-AOD has been run with different initial guesses and among the obtained results we have selected the one with the smallest fitting error. The different combinations for fine- and coarse-mode volume median radius initial guesses can be found in Table 2. They are inspired by the experience and the initial guess analysis proposed in Sect. 3.3 of Torres et al. (2017). Depending on the Ångström exponent value, we give more options to the dominant mode since we expect to have larger sensitivity to characterize its volume radius. The interval for the retrieved radii is independent of the Ångström exponent value and goes from 0.07 to 0.7 µm for the fine mode and from 0.7 to 5 µm for the coarse mode.
Table 2Multiple initial guess values for the volume mode radii used in the GRASP-AOD application. The choices depend on the Ångström exponent, which characterizes the dominant mode.
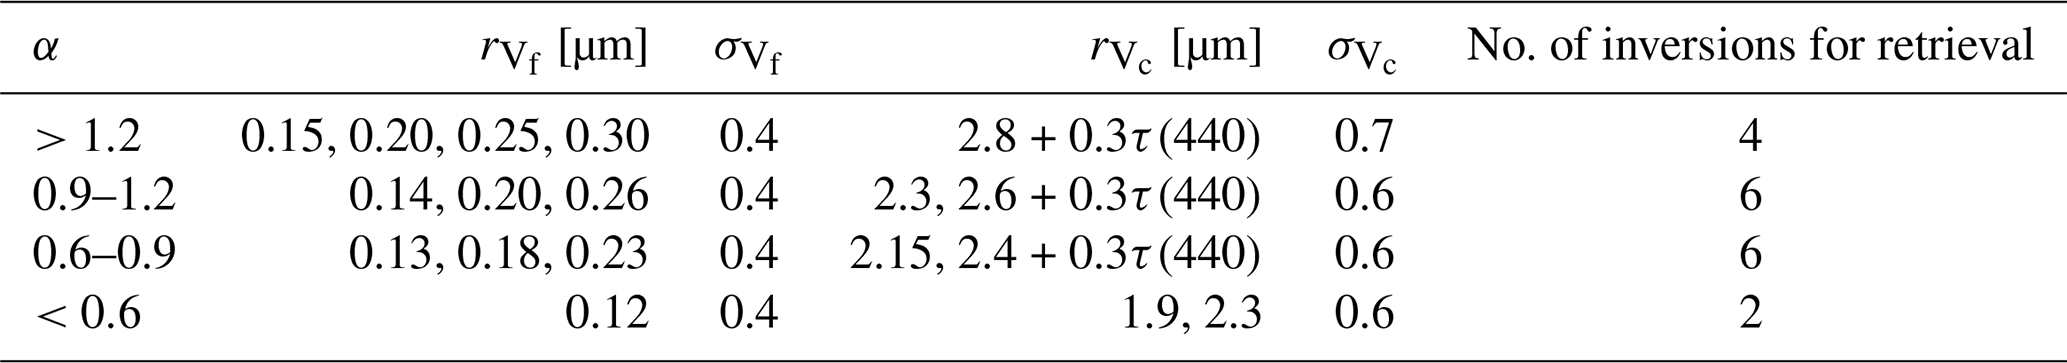
Regarding the concentrations and standard deviations of both modes, only one choice has been used and the values are the same as in Table 4 of Torres et al. (2017). Due to the low sensitivity of the GRASP-AOD to the shape of the modes (more details in Torres et al., 2017), we have used strong a priori constraints on the actual values for the standard deviation of both modes (see Eq. 1 in Torres et al., 2017). Although the standard deviations are still retrieved by the GRASP-AOD in practice, their values are very similar to the given initial guess values. That is the reason why their retrieval will not be discussed in the comparison analysis with AERONET retrievals in Sect. 3.
The second column in Table 3 contains the total number of GRASP-AOD inversions for each site. We have added the data percentage with respect to the total τ measurements presented in Table 1. There is a high percentage with valid GRASP-AOD retrievals: 95 % of the total τ measurements. The absence of one-to-one correspondence is due to the criteria defined to filter the GRASP-AOD retrievals. These criteria are based mostly on the analyst's experience and are as follows:
-
At least four valid spectral τ measurements, i.e., four different wavelengths with τ measurements in Level 2.0 in the spectral range 340–1020 nm.
-
The set of τ measurements should contain at least one between 440 and 500 nm, and another between 870 and 1020 nm.
-
A value of τ(440) (or interpolated if does not exist) over 0.02.
-
Absolute total fitting under 0.015 for measurements with τ(440)<0.5 and under for measurements with τ(440)>0.5. The fitting is obtained by the difference between the spectral τ measurements and the computed spectral τ values (which are estimated from the retrieved size distribution and the assumed refractive indices).
-
Absolute fitting of τ(500) (or interpolated if does not exist) under .
Table 3Total number of GRASP-AOD inversions, SDA retrievals and AERONET aerosol retrievals for each site. The percentage with respect to the total number of τ measurements is indicated in parentheses.

If we now analyze the data percentage by site, all sites except Ilorin present more than 85 % of GRASP-AOD valid retrievals with respect to the total number of τ measurements. In general, higher percentages are observed for sites with fine-mode predominance (between 94 %–100 %, with some exceptions) than for sites with coarse-mode predominance (between 85 %–95 %). The relatively small number of valid GRASP-AOD retrievals at the Ilorin site (76 %) is related to the assumption of a bimodality in the size distribution. This issue will be deeply analyzed in Sect. 4.1.1
2.3 AERONET retrievals
2.3.1 SDA retrieval
O'Neill et al. (2003) developed the spectral deconvolution algorithm (SDA) to discriminate fine- and coarse-mode extinction at 500 nm (τf(500) and τc(500)) with the input of τ measurements only between 380–870 nm. The algorithm is part of the AERONET processing chain: the value of the fine- and coarse-mode τ at 500 nm is retrieved from every measured τ spectrum and provided as a standard product of the network (full description at http://aeronet.gsfc.nasa.gov/new_web/PDF/tauf_tauc_technical_memo1.pdf, last access: 1 June 2021). However, as previously indicated, only the SDA Level 2.0 retrievals have been considered in the study. Note here that neither the GRASP-AOD nor AERONET aerosol retrieval algorithm provide τf(500) and τc(500) as primary outputs. In both cases, the discrimination between fine- and coarse-mode extinction is estimated from their main outputs (more details can be obtained in the following subsection).
The third column in Table 3 shows the number of SDA retrievals in Level 2.0. The percentage with respect to the total τ measurements in Level 2.0 is 76 % for the 30 sites considered for the period 1997–2016. The absence of one-to-one correspondence is due to the criteria to reach SDA Level 2.0. Details on the SDA Level 2.0 criteria can be obtained from the AERONET website (https://aeronet.gsfc.nasa.gov/new_web/data_description_AOD_V2.html, last access: 1 June 2021). They are a little stricter than those of the GRASP-AOD, which may justify the significantly lower number of retrievals with respect to the GRASP-AOD application. Certainly, the most critical is that the spectral range must be bounded by 380 and 870 nm with at least two additional wavelengths between the bounds. Five of the 30 selected sites (Dakar, Capo Verde, Banizoumbou, Guadeloupe and Beijing) have installed polarized photometers for most of the years of this analysis. The polarized photometers only have four spectral channels from 440 to 1020 nm and, therefore, they do not provide τ measurements at 380 nm. This implies, for instance, that there are no SDA Level 2.0 data at Banizoumbou in the whole period and that the SDA Level 2.0 data represents only 11 % and 7 % at the Capo Verde and Beijing sites, respectively.
2.3.2 AERONET aerosol retrieval algorithm
The AERONET aerosol retrieval algorithm uses τ measurements combined with spectral sky radiances to obtain detailed aerosol volume size distribution (22 bins logarithmically equidistant between 0.05 and 15 µm), complex refractive index and the sphericity parameter as main outputs (Dubovik and King, 2000; Dubovik et al., 2006). Other aerosol properties such as the single scattering albedo (SSA), aerosol absorption and the asymmetry factor are estimated afterwards from the primary outputs.
In addition, the detailed 22-bin size distributions are approximated as bimodal lognormal distributions to derive their equivalent parameters: volume median radii, standard deviations and particle volume concentrations for fine and coarse mode (details and exact formulation can be obtained from Dubovik et al., 2002a and https://aeronet.gsfc.nasa.gov/new_web/Documents/Inversion_products_for_V3.pdf, last access: 1 June 2021). To perform these calculations, the contribution of fine and coarse mode in each 22-bin size distribution should be known beforehand. From AERONET Version 2, an automatic process finds the minimum of the volume size distribution within the size interval from 0.439 to 0.992 µm; this minimum is used to settle the separation point. This process has been kept in the current AERONET Version 3 (our data source). These so-called standard parameters of the volume size distributions can be directly compared with the GRASP-AOD retrievals since they are the primary outputs of this inversion. Furthermore, the AERONET aerosol retrieval algorithm estimates the effective radius Reff and the total volume concentration for each mode as well as for the entire size distribution. Both parameters have also been computed for all GRASP-AOD retrievals.
The separation between the fine and coarse mode in the detailed size distribution is used as well to estimate the optical thickness for fine and coarse mode at 440, 675, 870 and 1020 nm from the AERONET aerosol retrieval algorithm outputs. The particular values at 500 nm, τf(500), have been interpolated for our validation study. Note that the way that the two modes are separated by the AERONET aerosol retrieval algorithm itself represents an inherent source of difference from other methods to estimate the fine- or coarse-mode optical thickness. In fact, the distribution of fine and coarse particles are continuous entities that overlap and they spread beyond the border established by the separation point or cutoff. As explained by O'Neill et al. (2003), a simple analysis of Mie kernels would show that the optical depth due to coarse particles for radii smaller than the cutoff (wrongly included in τf calculations) is larger than the optical depth due to fine particles for radii larger than the cutoff (wrongly excluded from τf calculations). Therefore, the fine-mode optical depth is generally overestimated while the coarse-mode optical depth is generally underestimated. This effect is typically small and it is more significant if the coarse mode dominates. Neither the SDA nor GRASP-AOD application present this issue since the two modes can overlap in both algorithms. In the case of the GRASP-AOD, the primary outputs are two independent lognormal functions that separately represent the fine and coarse mode as aforementioned. The values of τf(500) and τc(500) are derived from the aerosol optical depth values calculated individually for each lognormal function.
The last column in Table 3 contains the total number of AERONET aerosol retrievals for each site during the period 1997–2016 in Level 2.0. These numbers are much smaller than the number of τ measurements for several reasons. First, the AERONET standardized sequence of measurements includes around 40 direct sun measurements per day (this number can vary depending on the site latitude and the type of instrument), but only about eight of these sequences are coincident with sky radiance almucantar measurements2 (suitable as input to the AERONET aerosol retrieval algorithm). Secondly, the AERONET aerosol retrieval algorithm requires that most sky radiances be cloud-free and homogeneous in addition to the sun being unobscured. Finally, the Level 2.0 criteria for size distribution parameters requires solar zenith angle greater than 50∘ and τ(440)>0.02 to assure the robustness of the retrievals.3
2.4 Match-up methodology
The dataset in which the GRASP-AOD and SDA can be applied is the same: every single τ measurement. Therefore, we can compare the results between the two methods one by one when both retrievals pass the criteria previously described. Comparisons of the results obtained for τf(500) (which will be the subject of the first analysis in Sect. 3) between the GRASP-AOD and SDA correspond to same τ measurement as input.
Values of τf(500) computed using the retrieved parameters from the AERONET aerosol algorithm will also be compared with the results obtained by the GRASP-AOD and SDA retrievals. However, the primary dataset of the AERONET aerosol retrieval algorithm is restricted to scenarios including sky radiance passing the aforementioned criteria. To homogenize the different datasets (spectral aerosol optical depth measurements with or without the almucantar), we have performed averages of the τf(500) results obtained by the GRASP-AOD and SDA within ±16 min of each almucantar measurement. Note here that we have chosen that interval since it is the one used by the AERONET aerosol retrieval algorithm to average the τ measurements around each almucantar to be used as input in the retrieval (this and more information can be found at https://aeronet.gsfc.nasa.gov/new_web/Documents/AERONETcriteria_final1_excerpt.pdf, last access: 1 June 2021).
Aerosol size parameter results can be only compared between the GRASP-AOD and AERONET aerosol retrieval algorithm. As for the τf(500) comparison, we have averaged the aerosol size parameters retrieved by the GRASP-AOD in a ±16 interval centered on each almucantar measurement.
2.5 Considered metrics for comparison statistics
To evaluate the comparisons between the GRASP-AOD and AERONET retrievals we make use of standard statistical parameters, including slope and offset of linear regression, Pearson’s linear correlation coefficient (R), root mean square error (RMSE), root mean square relative error (RMSRE) and bias. The last three are defined as follows:
where N is the number of matched data points i, aAERONET represents the value retrieved of a given parameter obtained by AERONET, aGRASP−AOD represents the same value but obtained by the GRASP-AOD, and and are the mean values for the AERONET and GRASP-AOD retrievals for a given parameter.
The comparison between the GRASP-AOD retrievals and AERONET retrievals has been divided into two main subsections in the analysis of the results. First, we compare the values of the fine-mode aerosol optical depth τf(500) given by the GRASP-AOD, SDA and the AERONET aerosol retrieval algorithm. Secondly, we compare the so-called standard parameters of the volume size distributions from the aerosol size distributions obtained by the GRASP-AOD and AERONET aerosol retrieval algorithm.
3.1 Separation fine/coarse mode: τf(500)
Tables 4 and 5 contain the most relevant parameters in the comparisons of the τf(500) values obtained by the GRASP-AOD, SDA and the AERONET aerosol retrieval algorithm. The number of coincident data points following the criteria given in Sect. 2.4), values of the correlation coefficients, root mean square error (RMSE) and root mean square relative error (RMSRE; enclosed in parentheses) are represented in Table 4 for each site. Slopes and the intercepts of the linear regressions are shown in Table 5. In both tables, we have added the analysis for all sites in the last row. We have also interspersed a sub-total row with the general results but excluding from the analysis the five sites with less than 60 % of the SDA retrievals with respect to the total number of τ measurements (as explained in Sect. 2.3.1 these are the sites with long periods of polarized photometers: Banizoumbou, Beijing, Capo Verde, Dakar and Guadeloupe). Figure 2 illustrates the RMSE values from Table 4: red bars for comparisons between the SDA and GRASP-AOD, green bars between the AERONET aerosol retrieval algorithm and GRASP-AOD, and blue bars between the AERONET aerosol retrieval algorithm and SDA. The sites have been ordered on the x axis according to the RMSE values obtained in the comparisons between the AERONET aerosol retrieval algorithm and GRASP-AOD (common to all sites).
Table 4Comparisons of τf(500) values computed with three different algorithms (AERONET, GRASP-AOD and SDA) for sites and periods indicated in Table 1. The first column depicts the site name, and the rest of the columns indicate the number of coincident data points and the values of the correlation coefficients and RMSE (and RMSRE enclosed in parentheses) of the comparisons between the methods.
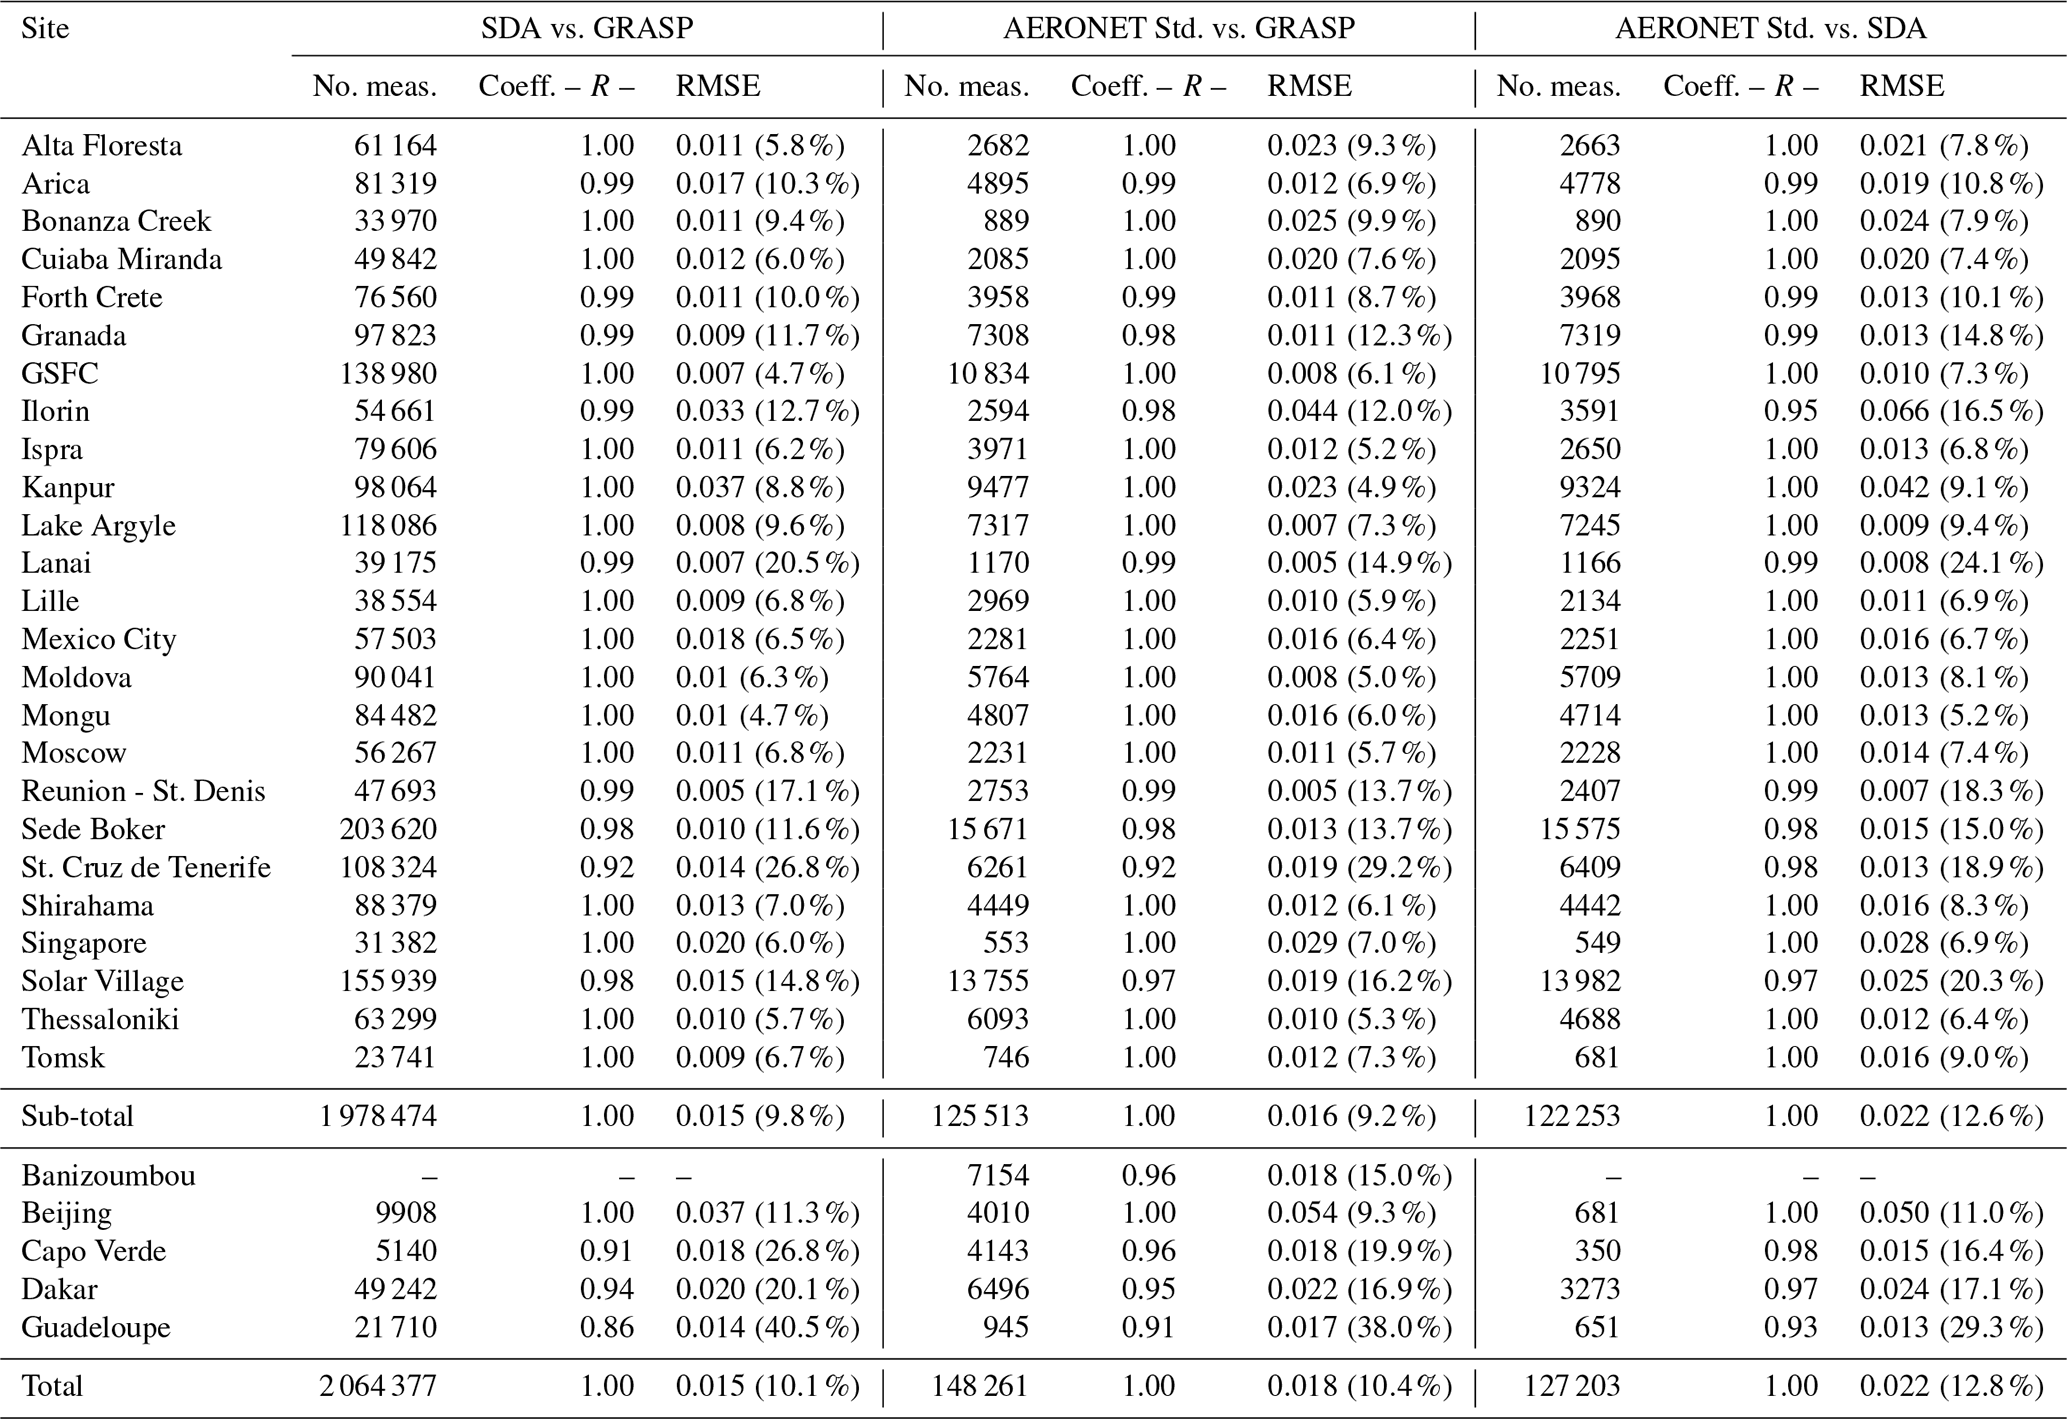
Table 5Continuation of Table 4, which describes the comparisons of τf(500). Here, we represent the slopes and the intercepts obtained by the linear regressions between the τf(500) values retrieved by the three different algorithms (AERONET, GRASP-AOD and SDA).
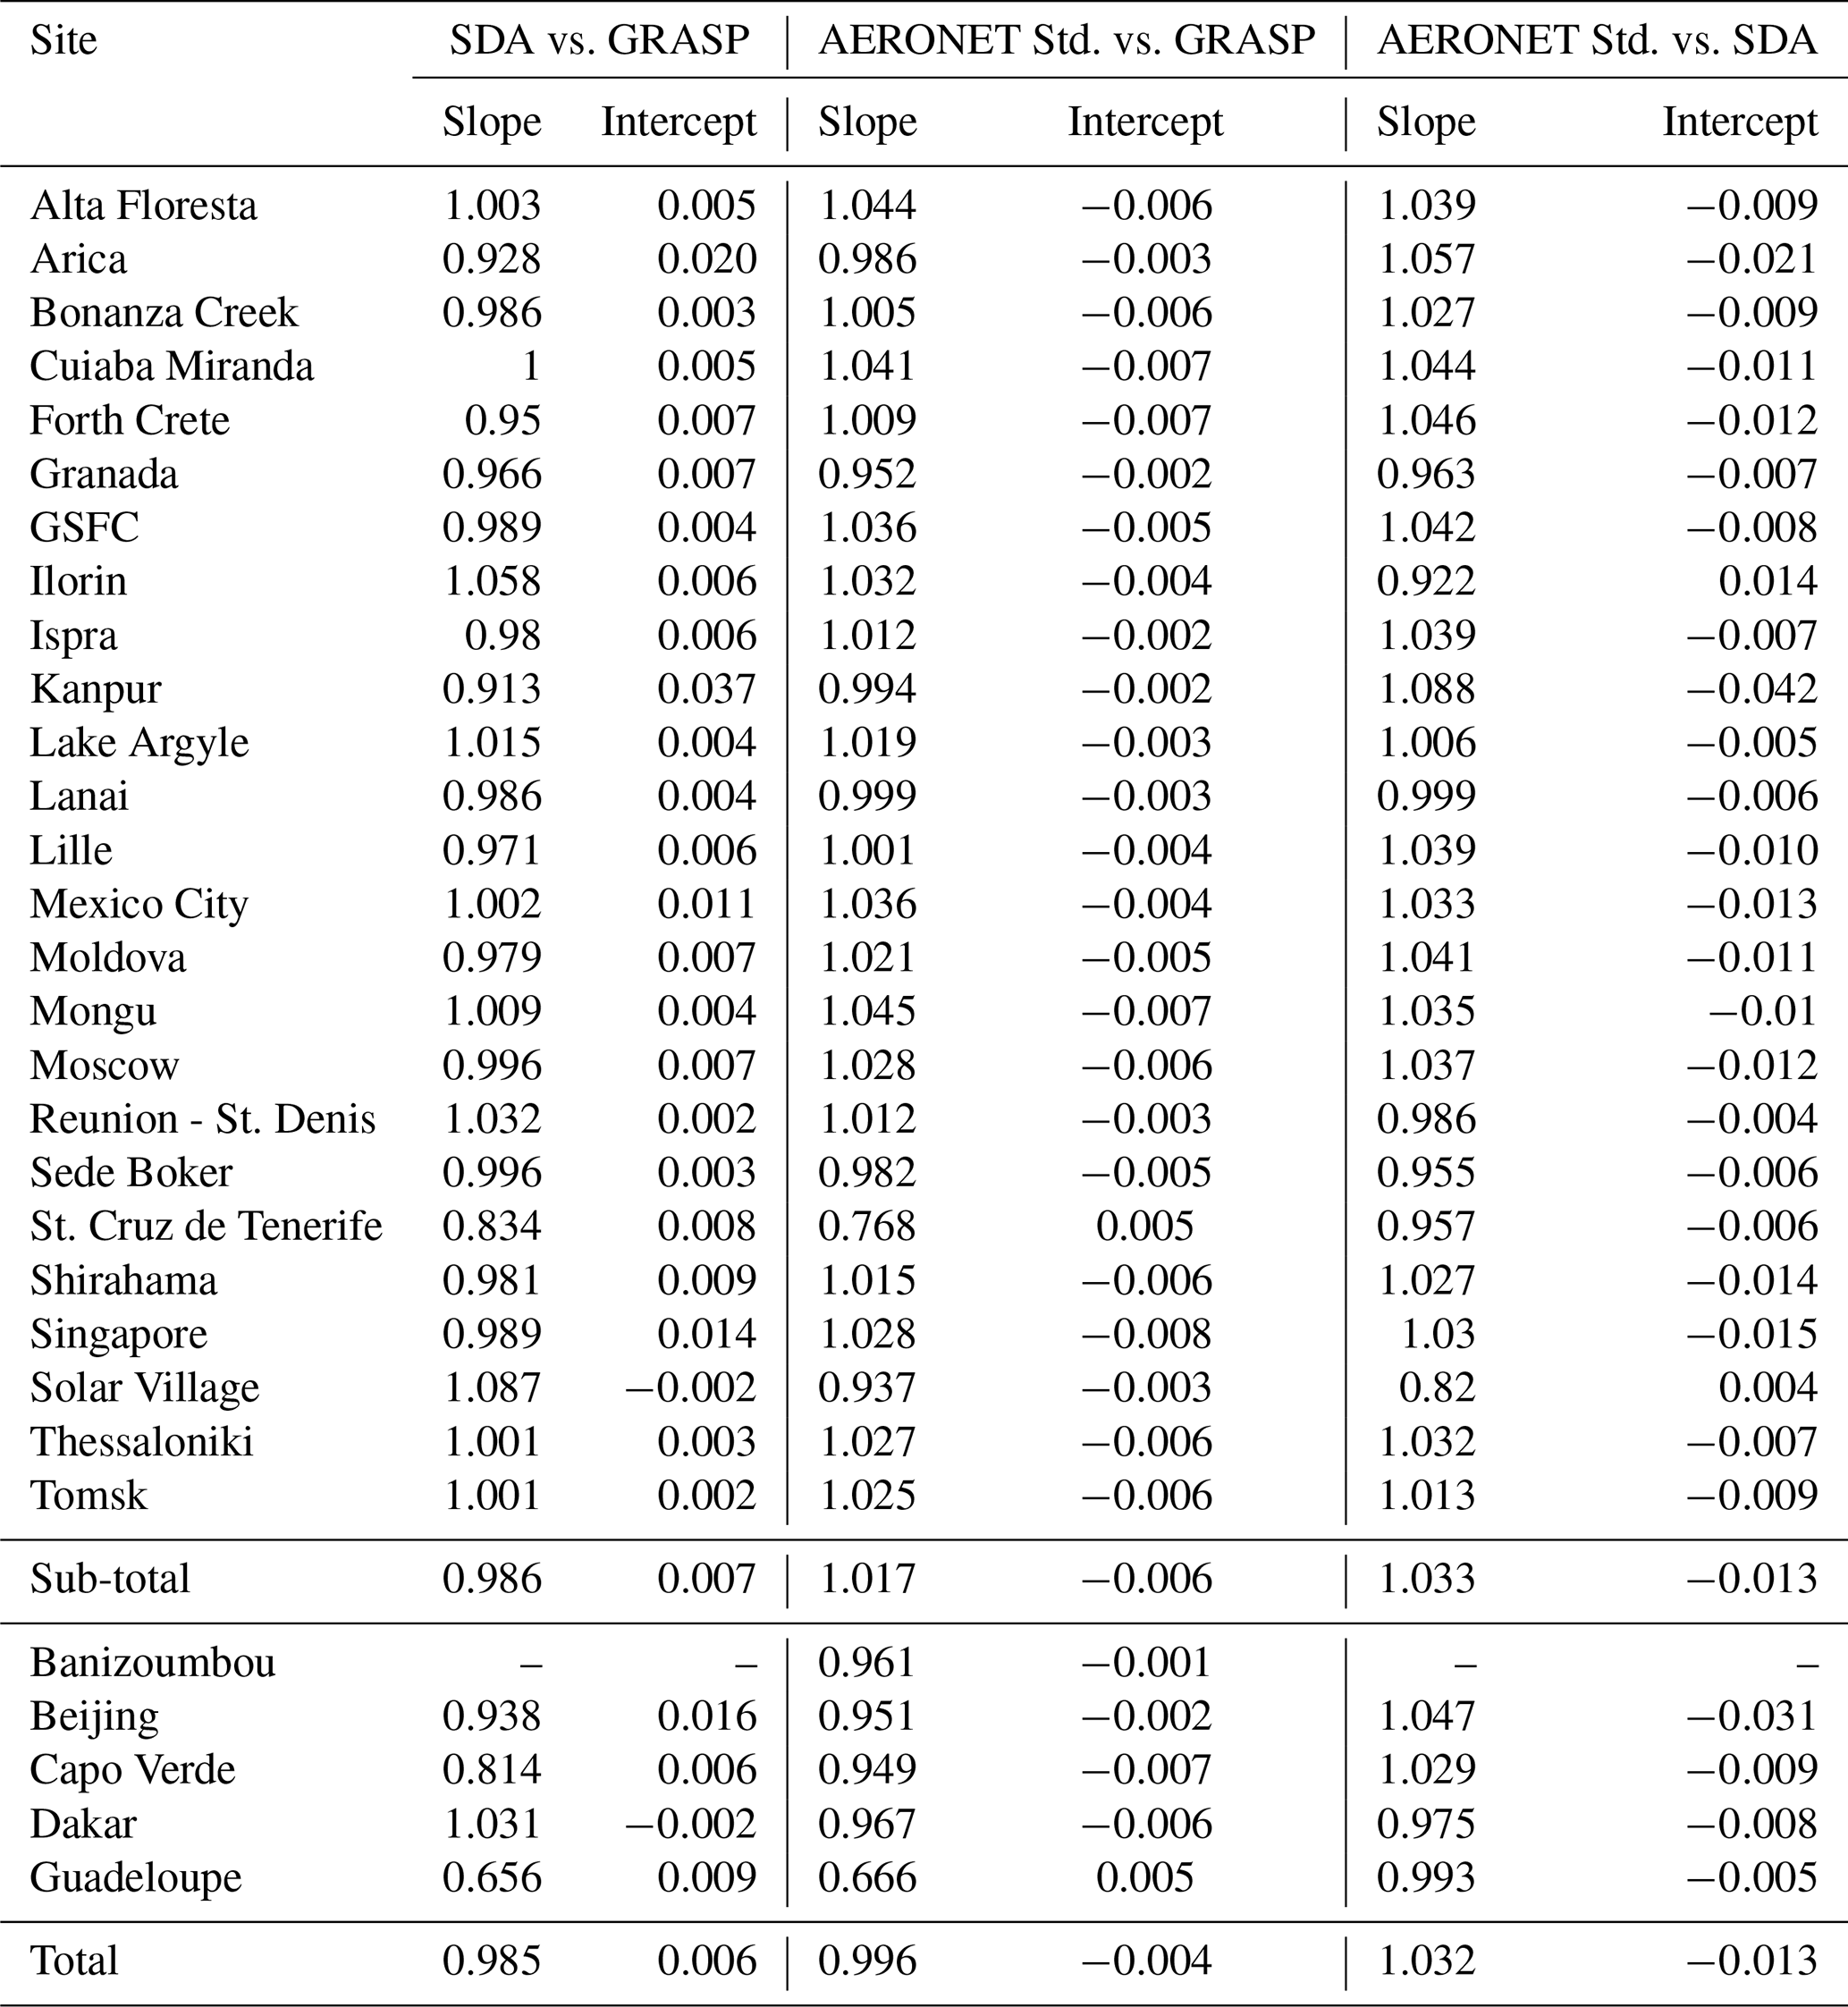
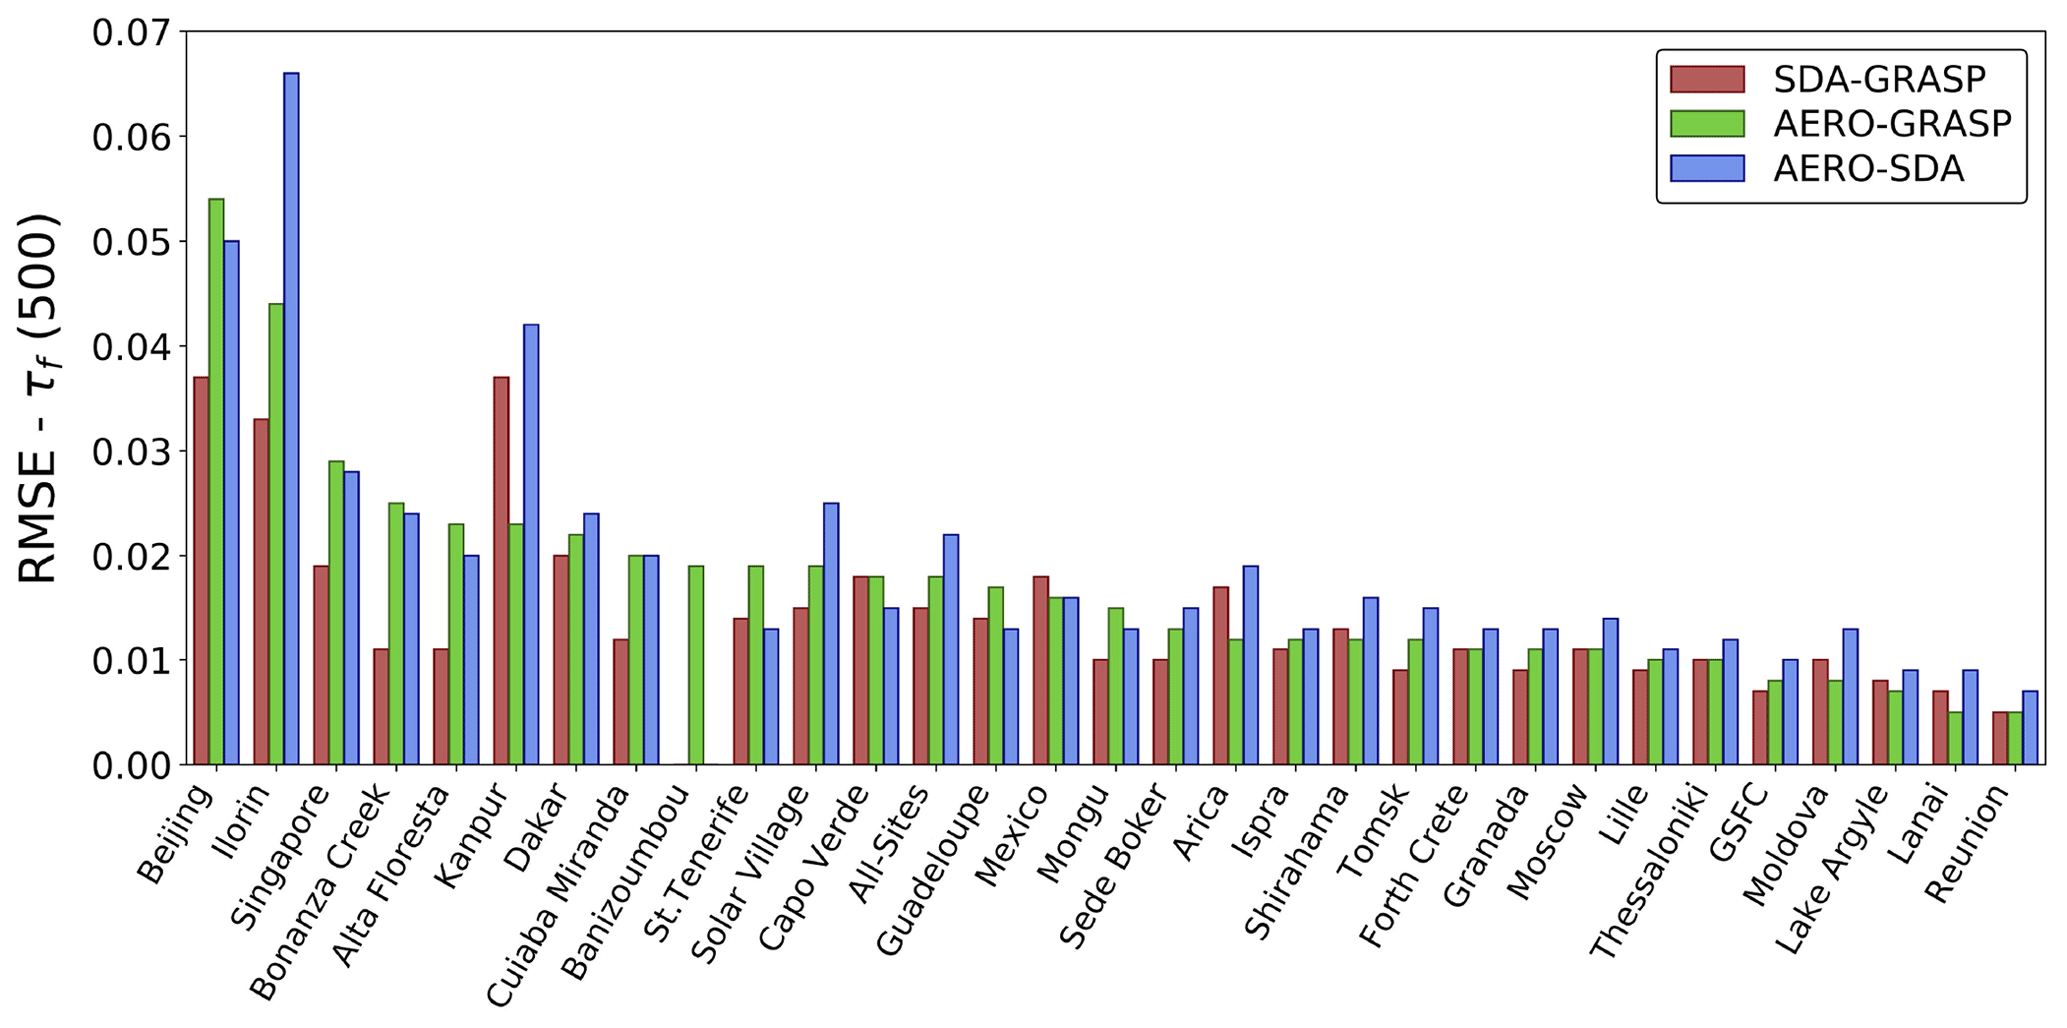
Figure 2RMSE between τf(500) retrieved by the SDA and GRASP-AOD (red bars), AERONET aerosol retrieval algorithm and GRASP-AOD (green bars) and AERONET aerosol retrieval algorithm and SDA (blue bars) (values can be found in Table 4) for all sites considered in the analysis (Table 1) from 1997–2016. The sites have been ordered according to the RMSE values between the AERONET aerosol retrieval algorithm and GRASP-AOD (green bars).
If we analyze Fig. 2, we do not observe large differences between the three RMSE values for the same site. The lowest RMSE values are typically obtained in the comparison between the SDA and GRASP-AOD (red bars in Fig. 2). This fact is confirmed in the comparison for all sites (the Total row from Table 4 or in the middle of Fig. 2), where the RMSE for 2 million common retrievals between the SDA and GRASP-AOD is the lowest at 0.015. In the same row, we observe that the τf(500) computed by the AERONET aerosol retrieval algorithm for all sites agrees slightly better with the GRASP-AOD (RMSE = 0.018, from 148 526 comparisons) than with the SDA (RMSE = 0.022, from 127 203 comparisons). This better agreement is more pronounced if we exclude from the analysis the sites with less than 60 % of the SDA retrievals (the sub-total row in Table 4): RMSE = 0.016 between the AERONET aerosol retrieval algorithm and GRASP-AOD, RMSE = 0.022 for the comparison between the AERONET aerosol retrieval algorithm and SDA. The analysis by site shows that the largest RMSE between the different methods are obtained at: Beijing for the comparison between the AERONET aerosol retrieval algorithm and GRASP-AOD (RMSE = 0.054), Ilorin for the comparison between the AERONET aerosol retrieval algorithm and SDA (RMSE = 0.037), and Kanpur for the comparison between the SDA and GRASP-AOD (RMSE = 0.066). The smallest RMSE between the three methodologies are observed at La Reunion (RMSE values between 0.005 and 0.007), which was expected since aerosol optical depth values were the lowest for this site.
In Fig. 3 we show several examples of the τf(500) correlations retrieved by the different methodologies: (a) the top panels represent the comparisons for all sites for the period 1997–2016; (b) the middle panels present the results for GSFC, which is the site with the largest number of τ measurements and comparisons from all the fine-mode-predominant sites; and (c) the bottom panels contain the comparisons for Solar Village, which is the site with the highest number of τ measurement and comparisons from all the coarse-mode-predominant sites. From left to right, we illustrate the τf(500) correlations between the SDA and GRASP-AOD, AERONET aerosol retrieval algorithm and GRASP-AOD, and AERONET aerosol retrieval algorithm and SDA. In all the examples represented, we can observe that correlation coefficients are close to 1 (as for most of the sites in Table 4). Regarding the slopes, we observe that for GSFC they are almost 1 in all the correlations (values between 0.99–1.04), while for Solar Village we observe small divergences with slopes ranging from 0.82–1.09. Moreover, the analysis of the figures shows much greater data dispersion in the Solar Village comparisons. Thus, RMSE values are twice as high for Solar Village (0.015–0.025) as for GSFC (0.007–0.010). These differences are even higher in relative terms: the RMSRE (from Table 4) are between 3 and 4 times times as large for Solar Village (15 %–20 %) as for GSFC (4 %–7 %).
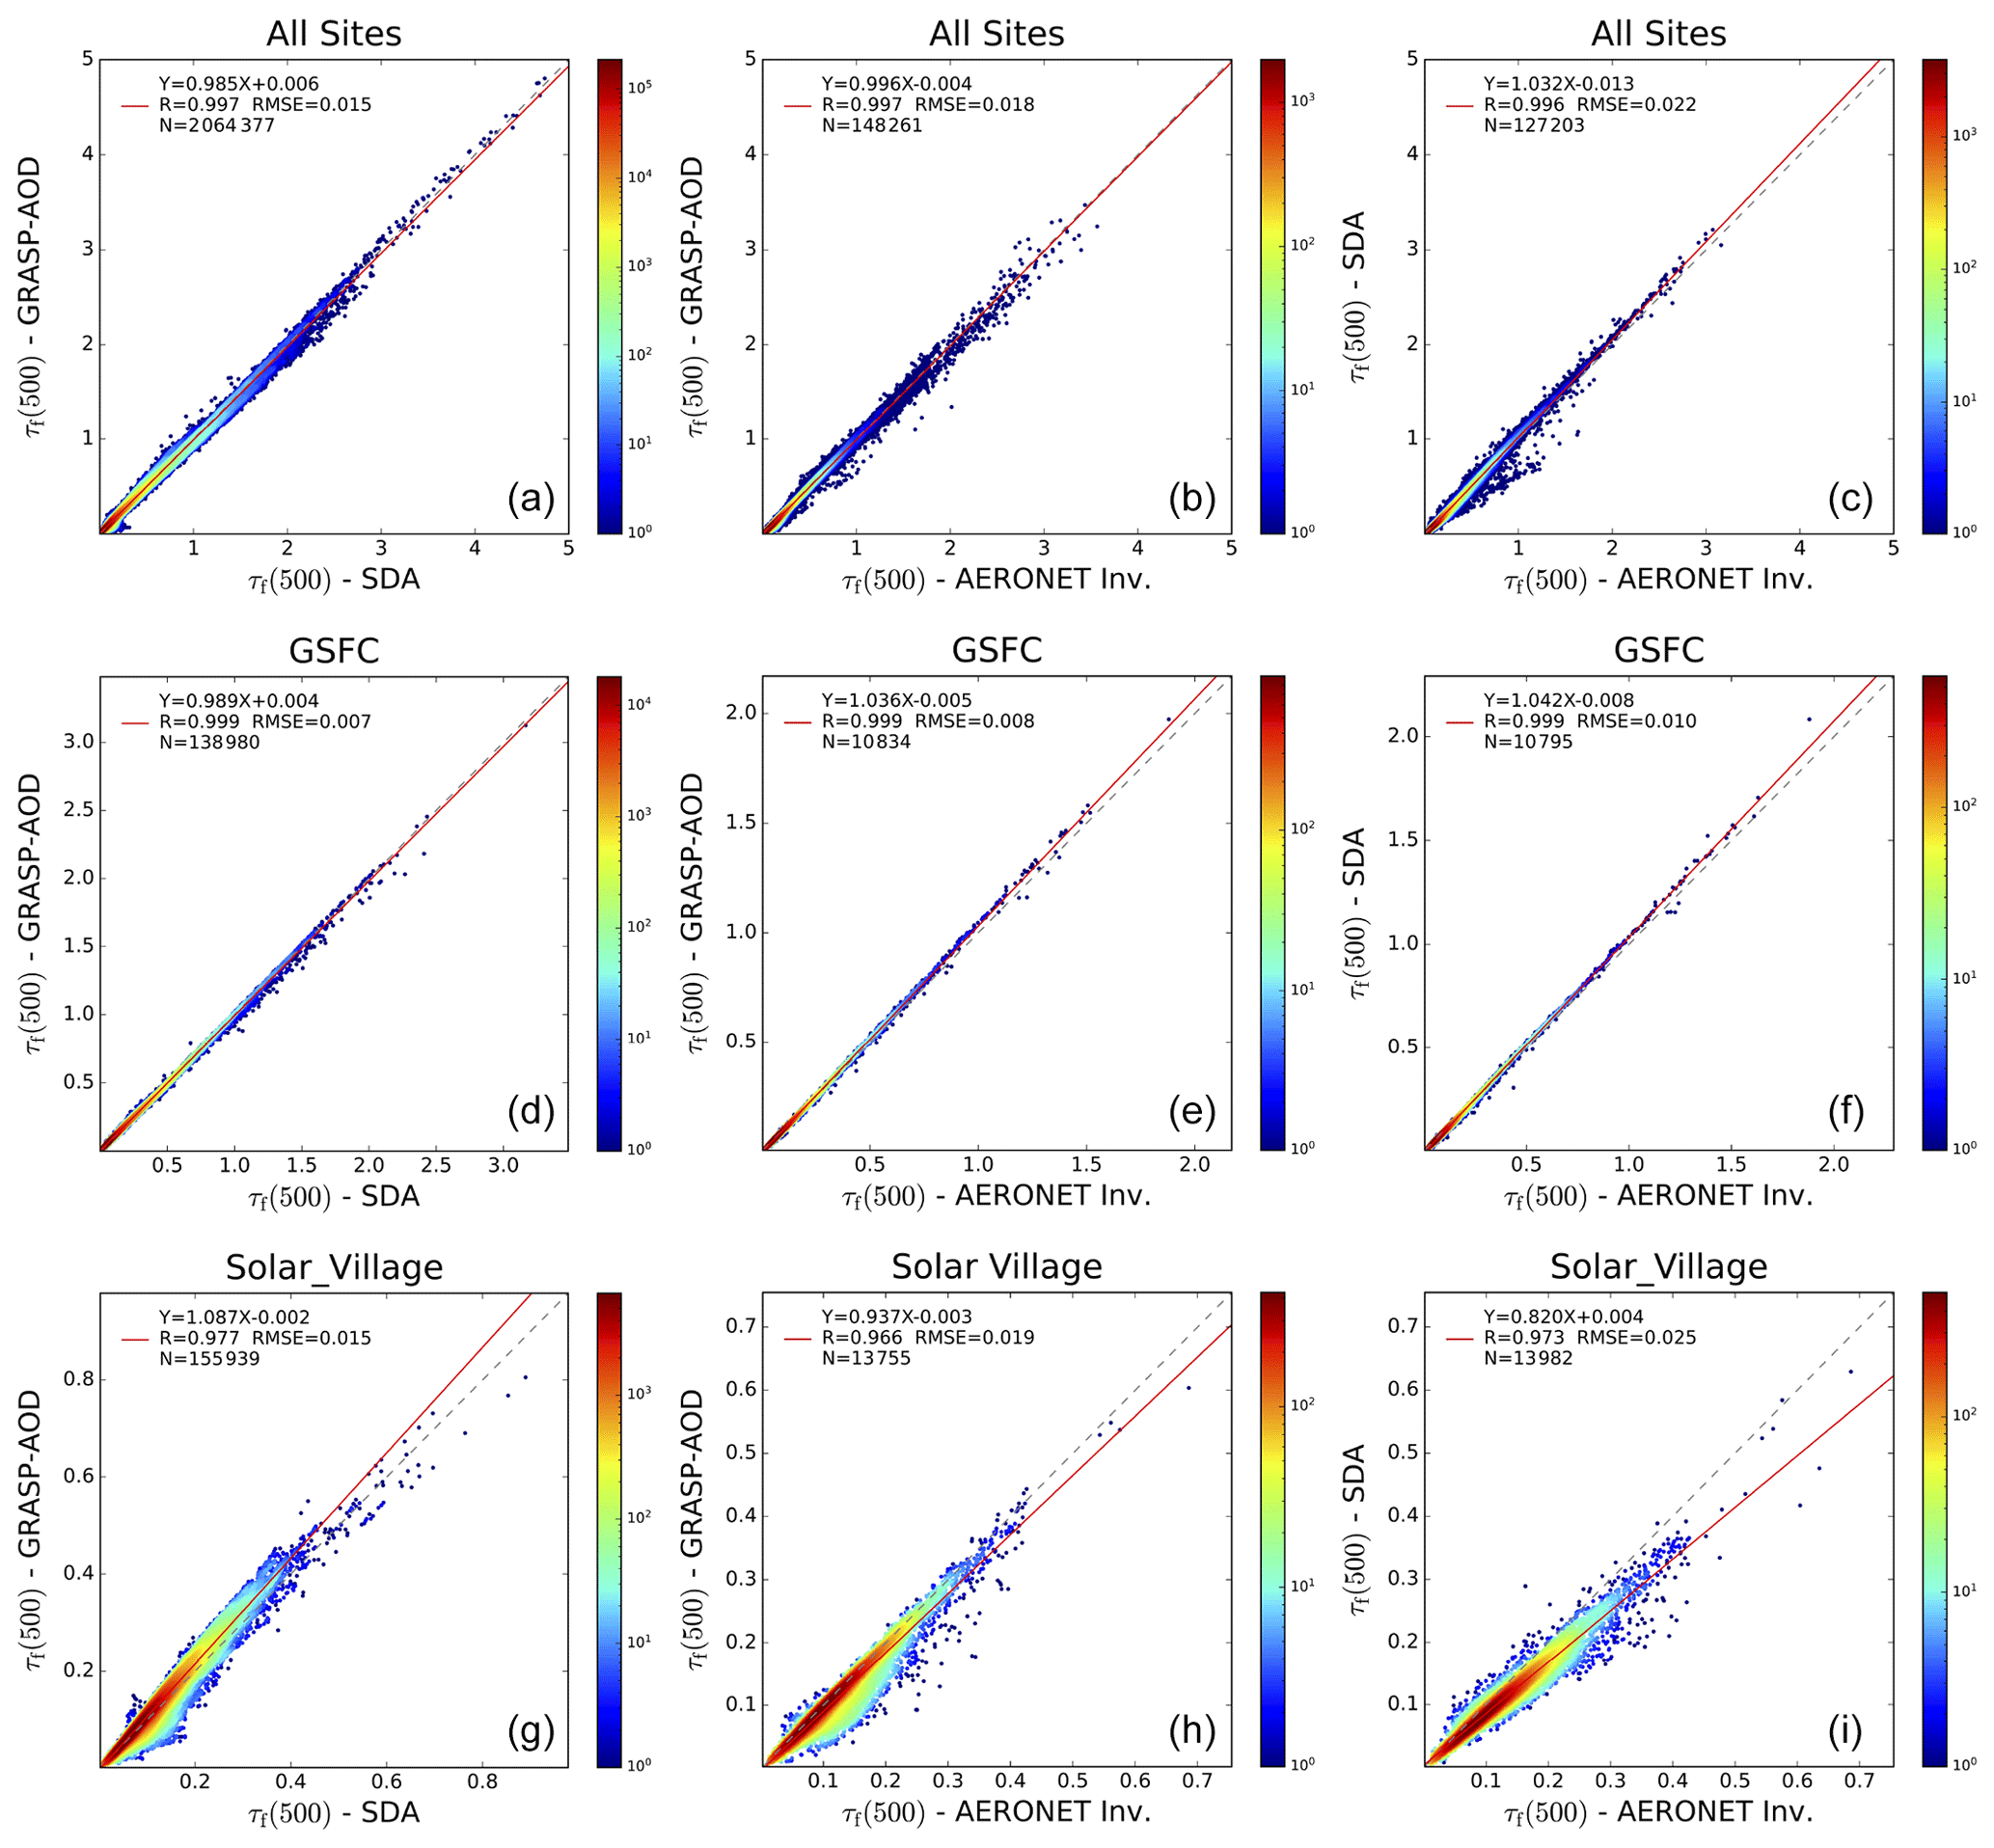
Figure 3Comparisons of τf(500) retrieved from the GRASP-AOD, SDA and AERONET: all sites (a)–(c), GSFC site (d)–(f) and Solar Village site (g)–(i). From left to right the comparisons are made between the SDA and GRASP-AOD, AERONET aerosol retrieval algorithm and GRASP-AOD, and AERONET aerosol retrieval algorithm and SDA. Color bars represent data density in a 0.01×0.01 grid. A logarithmic scale has been chosen given the strong data density at low values.
The larger uncertainties observed for Solar Village compared to GSFC can be extrapolated to all sites with coarse-mode predominance with respect to the sites with fine-mode predominance. To better illustrate this idea, we have represented in Fig. 4 the RMSRE (from Table 4) against the averaged Ångström exponent () for each site (Table 1). We can observe that the RMSRE increases as decreases: RMSRE values are between 5 %–10 % when values are larger than 1.2 (fine-mode-predominant sites) and between 5 %–20 % for values between 0.6–1.2 (mixed cases). When values are smaller than 0.6 (coarse-mode-predominant sites), the RMSRE typically range between 10 %–30 %. The only exception is the Guadeloupe site, which shows the largest RMSRE values observed (between 30 %–40 %). This site together with Dakar and Capo Verde has one of the lowest values of , but it also presents the smallest averaged fine-mode optical depth at 500 nm from all the AERONET aerosol retrievals: . This value is 3 times lower than that observed at Dakar or Capo Verde, which may justify these extreme values of the RMSRE, even if the RMSE values only oscillate between 0.014–0.017.

Figure 4RMSRE from the comparisons of τf(500) retrieved by the different methods against the averaged Ångström exponent () for all sites (values can be found in Table 4). RMSRE values between the SDA and GRASP-AOD are represented by red circles, between the AERONET aerosol retrieval algorithm and GRASP-AOD by green crosses, and between the AERONET aerosol retrieval algorithm and SDA by blue stars.
Figure 5 shows the correlations of τf(500) from all the retrievals but separately for different ranges of the Ångström exponent values: α<0.6 (top panels), α between 0.6 and 1.2 (middle panels) and α>1.2 (bottom panels). As in previous figures, the comparisons are presented from left to right for the SDA and GRASP-AOD, AERONET aerosol retrieval algorithm and GRASP-AOD, and AERONET aerosol retrieval algorithm and SDA. Figure 5 confirms that the correlation indices, RMSE and slopes improve as the Ångström exponent increases. All panels for α>0.6 (middle panels α between 0.6–1.2, and bottom panels α>1.2) show an almost perfect agreement between the different methods if we analyze both correlation coefficients and the slopes.

Figure 5Comparisons of τf(500) retrieved from all sites for different ranges of the Ångström exponent values: α<0.6 (a)–(c), α between 0.6 and 1.2 (d)–(f) and α>1.2 (g)–(i). From left to right the comparisons are made between the SDA and GRASP-AOD, AERONET aerosol retrieval algorithm and GRASP-AOD, and AERONET aerosol retrieval algorithm and SDA. Color bars represent data density in a 0.01×0.01 grid.
Significant discrepancies appear only for the cases with α<0.6 (top panels). The three panels show a much greater data dispersion compared to their equivalents for larger alpha values. The analysis of the figures shows that retrievals of τf(500) from the AERONET aerosol retrieval algorithm are higher on average than from the SDA and GRASP-AOD. This result was also found in previous studies (O'Neill et al., 2003; Eck et al., 2010; Torres et al., 2017), and the main explanation is related to the cutoff process used to define the two modes in the AERONET aerosol retrieval algorithm (more details in Sect. 2.3.2 or in O'Neill et al., 2003). The uncertainties caused by the variations in the aerosol refractive index, which are not accounted for by the SDA and GRASP-AOD, could also be an error source and explain the discrepancies at some retrievals. Additionally, we observe a second branch for comparisons of the GRASP-AOD versus AERONET aerosol retrieval algorithm and the SDA versus AERONET aerosol retrieval algorithm (more visible at high τf(500) of the AERONET aerosol retrieval algorithm). The reason is related to the three mode structures observed in some desert dust retrievals. In some cases, the cutoff used by the AERONET aerosol retrieval algorithm assigns the third midsize mode entirely to the fine mode, which causes high discrepancies with the other two methods, giving rise to this second branch. This effect will be further detailed in Sect. 4.1.2.
The underestimation of the GRASP-AOD with respect to AERONET aerosol retrieval is mainly located at low τf(500) values while the underestimation of the SDA is smoother but also present at higher τf(500) values. This behavior justifies that at coarse-mode-predominant sites presenting low averaged values of τf(500), the comparisons between the GRASP-AOD and AERONET aerosol retrieval have a larger RMSE than between the SDA and AERONET aerosol retrieval (Guadeloupe or St. Cruz de Tenerife). At sites with averaged values of greater than 0.1 (Ilorin, Solar Village or Sede Boker), the trend is the opposite and the RMSE values for the comparison between the GRASP-AOD and AERONET aerosol retrieval are smaller than those found in the comparisons between the SDA and AERONET aerosol retrieval.
Finally, we would like to comment on the results obtained at Banizoumbou (a site without τf(500) retrievals from the SDA) and Beijing (a site with only 11 % of τf(500) retrievals from the SDA) with respect to the total number of τ measurements (see the end of Sect. 2.3.1 for more details). Regarding Banizoumbou, the comparison between the GRASP-AOD and AERONET aerosol retrieval show similar results to those obtained at other sites with coarse-mode predominance: RMSE = 0.019, which is equivalent to RMSRE = 15 % (from more than 7 000 comparisons). For Beijing, the RMSE values obtained between the GRASP-AOD and AERONET aerosol retrieval are the highest but is mainly due to the fact that the Beijing site presents the highest averaged τf(500) values from all sites: <τf(500)>=0.6. Thus, the RMSRE between the GRASP-AOD and AERONET aerosol retrieval at Beijing is only 9.3 %. This value is similar to those obtained from other sites with values around 1 (see Fig. 4). At the same time, it is smaller than the one obtained from the existing comparisons between the SDA and AERONET aerosol retrieval (11.0 %). The results obtained at both sites, Beijing and Banizoumbou, indicate that the conditions required in Sect. 2.2 assure a robust retrieval of τf(500) from the GRASP-AOD, even if τ measurements at 380 and 500 nm are not available (polarized photometers).
3.2 Characterization of size parameters
The purpose of this subsection is to validate the volume size distribution parameters obtained from the GRASP-AOD through comparisons with the retrievals from the AERONET aerosol algorithm. We will first analyze the standard parameters of the fine mode and then those of the coarse mode. At the end, we will show the comparisons for total volume concentration and effective radius.
3.2.1 Fine mode
One of the main conclusions from Torres et al. (2017) was the capacity of the GRASP-AOD to accurately characterize the aerosol fine-mode size properties, in particular for the cases with a predominant fine mode. Nevertheless, the characterization of fine-mode size properties, especially for the fine-mode median radius, would depend on (a) reliable a priori information about the real refractive indices and (b) accurate measurements of aerosol optical depths. The use of a monthly climatological refractive index (described in Sect. 2.2) seems a reasonable strategy, although it gives rise to errors in the retrieval of RVf, especially at sites with a strong variability in the aerosol characteristics (the use of standard refractive index values as an alternative of climatological values is discussed in Sect. 4.2). On the other hand, simulation tests in Torres et al. (2017), including aerosol optical errors, showed that the uncertainty of the bimodal lognormal size distribution parameters dramatically increases as the aerosol load decreases. In this regard, a lower limit of τ(440)>0.2 was suggested to assure quality retrievals of all aerosol size distribution parameters. It should be noted here that the lower limit of τ(440)>0.2 was not identified as necessary in the retrieval of τf(500) in Torres et al. (2017). Further tests carried out during this validation study (partially shown in Sect. 3.1) have confirmed this result, indicating that the uncertainty of τf(500) is mainly associated with the Ångström exponent as illustrated in Fig. 4. Therefore, the value τ(440)>0.02, which is the general limit already established in Sect. 2.2, also stands as a quality assurance threshold for τf(500).
The top panels in Fig. 6 illustrate the comparisons between the fine-mode volume median radius obtained by the GRASP-AOD and AERONET aerosol retrieval algorithm using three different lower limits on the aerosol load (from left to right): τ(440)>0.02 (threshold established for all GRASP-AOD retrievals), τ(440)>0.2 and τ(440)>0.4. Analysis of the three panels indicates that correlation parameters improve as the τ(440) lower limit increases. The RMSE diminishes from 0.040 µm (RMSRE = 25.6 %), for the case with all retrievals, to 0.032 µm (19.8 %) when we include τ(440)>0.2 as the lower limit. The most restrictive limit τ(440)>0.4 hardly improves the RMSE (0.030 µm or RMSRE = 18.3 %) or the rest of the correlation parameters, while it does eliminate more than half of the data with respect to the limit τ(440)>0.2. Therefore, the lower limit of τ(440)=0.2 suggested in Torres et al. (2017) seems a good compromise.
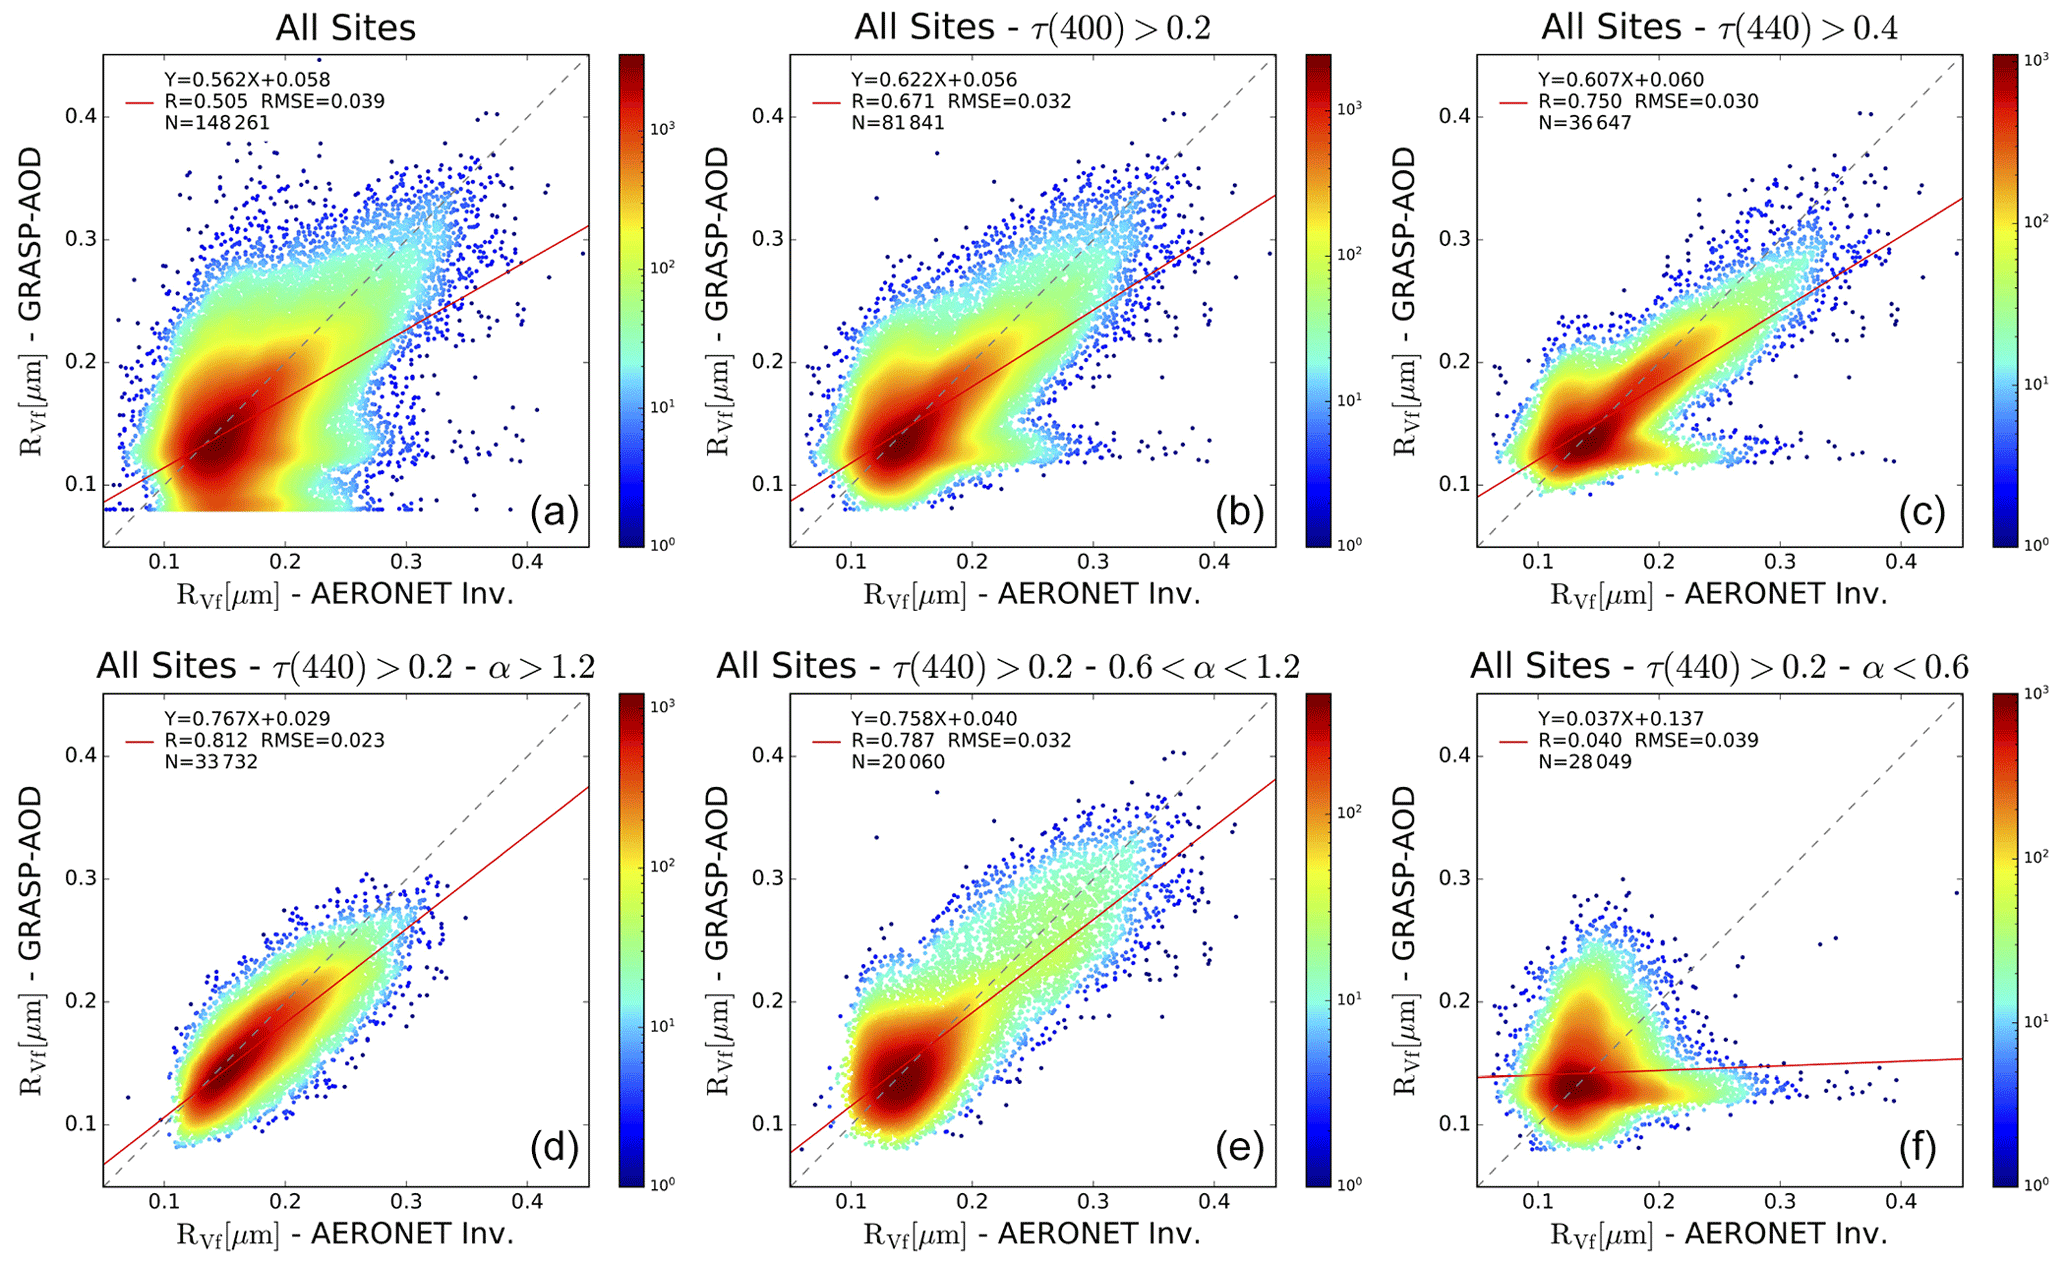
Figure 6Comparisons between the fine-mode volume median radius (RVf [µm]) obtained by the GRASP-AOD and AERONET aerosol retrieval algorithm for all sites considered in the analysis (Table 1) for the period 1997–2016 using different thresholds for τ(440) and Ångström exponent values. (a)–(c) analyze the effect of different lower limits of τ(440) (from left to right): all retrievals (τ(440)>0.02), retrievals with τ(440)>0.2 and retrievals with τ(440)>0.4. (d)–(f) analyze the results for the retrievals with τ(440)>0.2 and for different ranges of the Ångström exponent (from left to right): retrievals with α>1.2, retrievals with α between 0.6 and 1.2, and finally, retrievals with α<0.6. Color bars represent data density in a 0.01×0.01 µm grid. A logarithmic scale has been chosen given the strong data density between 0.12–0.16 µm.
The bottom panels in Fig. 6 represent the comparisons for the retrievals with τ(440)>0.2 separately for different ranges of the Ångström exponent (from left to right): retrievals with α>1.2, retrievals with α between 0.6 and 1.2 and, finally, retrievals with α<0.6. We observe that the range with α>1.2 shows the best retrievals with an RMSE = 0.023 µm (13.9 %) and a correlation coefficient of 0.81. The comparison for the cases with α between 0.6–1.2 also presents a reasonable agreement with an RMSE = 0.032 µm (18.7 %) and a correlation coefficient of 0.787. The results for α<0.6 indicates a much lower sensitivity when there is a coarse-mode predominance. In these conditions, the correlation coefficient is practically zero4 and the RMSE = 0.039 µm (29.8 %).
As previously indicated, Torres et al. (2017) identified fine-mode predominance as a key factor to accurately describe RVf from the GRASP-AOD inversion. However, the authors did not suggest any limits to assure the quality in the retrievals. Here, we observe that if α>1.2 the characterization of RVf becomes much more reliable. In such conditions, the uncertainty of RVf, with a relative error under 15 %, is the lowest found for all size volume aerosol parameters. Note that for the other size parameters the relative errors typically range between 20 %–30 %, when τ(440)>0.2 (presented in the next subsections). If no conditions on α values are required, the characterization of RVf presents similar results to the other size parameters (see top-middle panel in Fig. 6 with a relative error of almost 20 % when τ(440)>0.2).
Given the excellence of the results obtained in the characterization of RVf when τ(440)>0.2 and α>1.2, we consider the interest of presenting the comparison results individually by site under such conditions. Thus, the first part of Table 6 depicts the parameters obtained from the comparison of RVf between the AERONET aerosol retrieval algorithm and GRASP-AOD. The first two columns contain the name of the site5 and the number of coincident measurements accomplishing the quality assured conditions (the percentage with respect to the total number of coincident retrievals is indicated in parentheses). The third column shows the RMSE obtained from the two retrievals with the RMSRE in parentheses. Columns four to six present the values of the correlation coefficients, slopes and intercepts. Apart from the results by site, we include a final row summarizing the results for all sites together. Note that the results of this last row, all sites when τ(440)>0.2 and α>1.2, were illustrated in the bottom-left panel in Fig. 6.
Analyzing the results of Table 6, sites with fine-mode domination and significant aerosol load throughout the year present the largest data percentage (over 40 %) accomplishing the aforementioned criteria (e.g., Kanpur, Lille, Ispra, Mexico City or Mongu), as expected. These sites generally show the lowest RMSRE values (between 9 %–13 %) for the comparison of RVf obtained by the GRASP-AOD and AERONET aerosol retrieval algorithm. The correlation coefficients are typically larger than 0.75 and the slopes are between 0.6–0.85. The top panels in Fig. 7 illustrate the comparisons for the three sites with these characteristics (Ispra, Lille and Kanpur).
Table 6Comparison between fine-mode size parameters obtained from the AERONET standard inversion and GRASP-AOD. The first column presents the site and the second column the number of coincident retrievals accomplishing τ(440)>0.2 and α>1.2. The percentage with respect to the total number of coincident retrievals is indicated in parentheses. Columns three to six show the comparison results for volume median radius, while columns 7 to 10 present the results for the fine volume concentration. In both cases, RMSE (and RMSRE enclosed in parentheses) correlation coefficients, slopes and intercepts from linear regressions are shown.
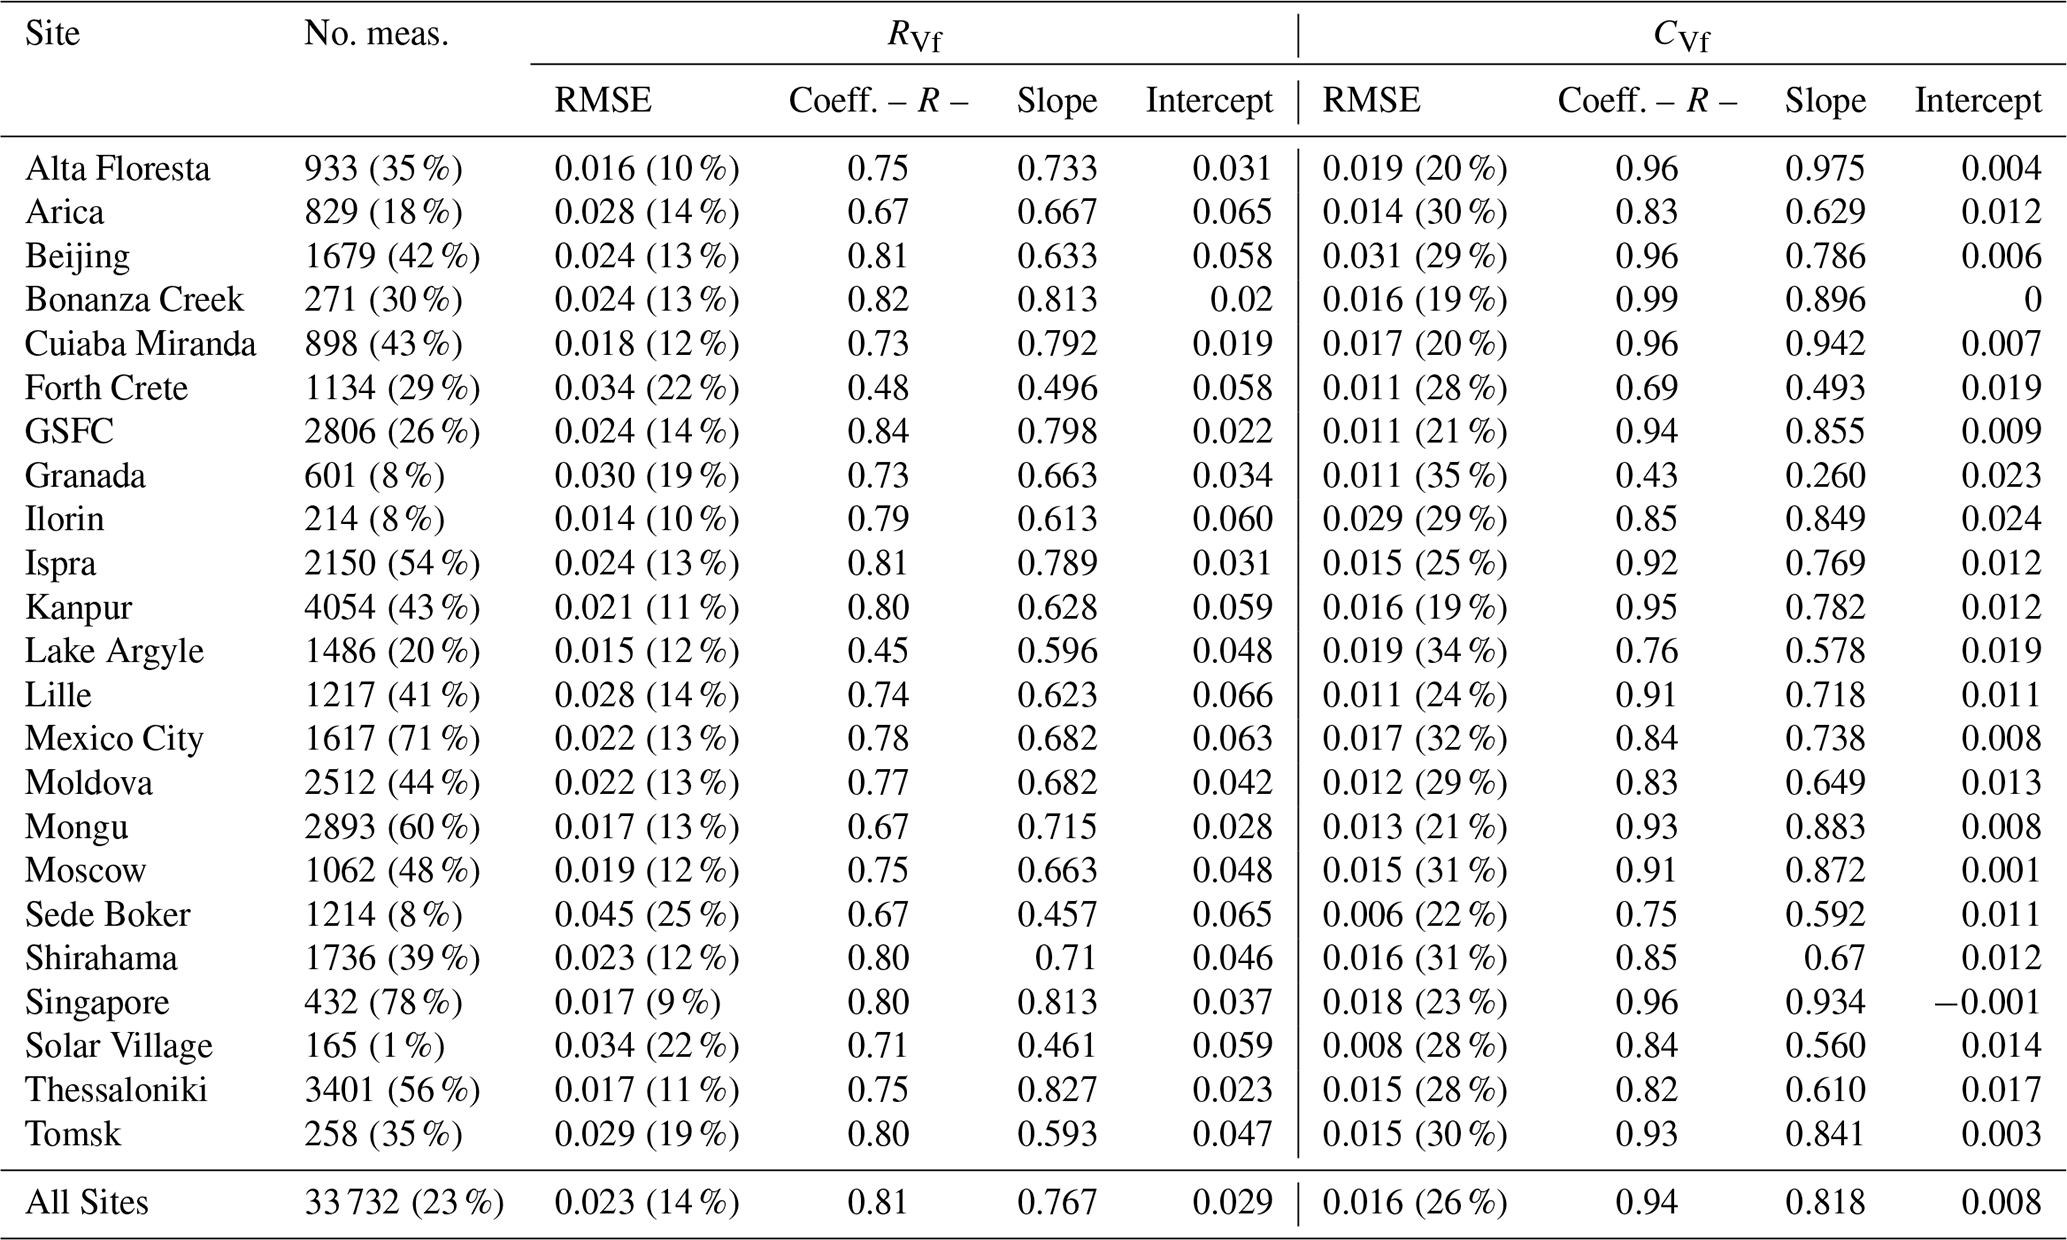
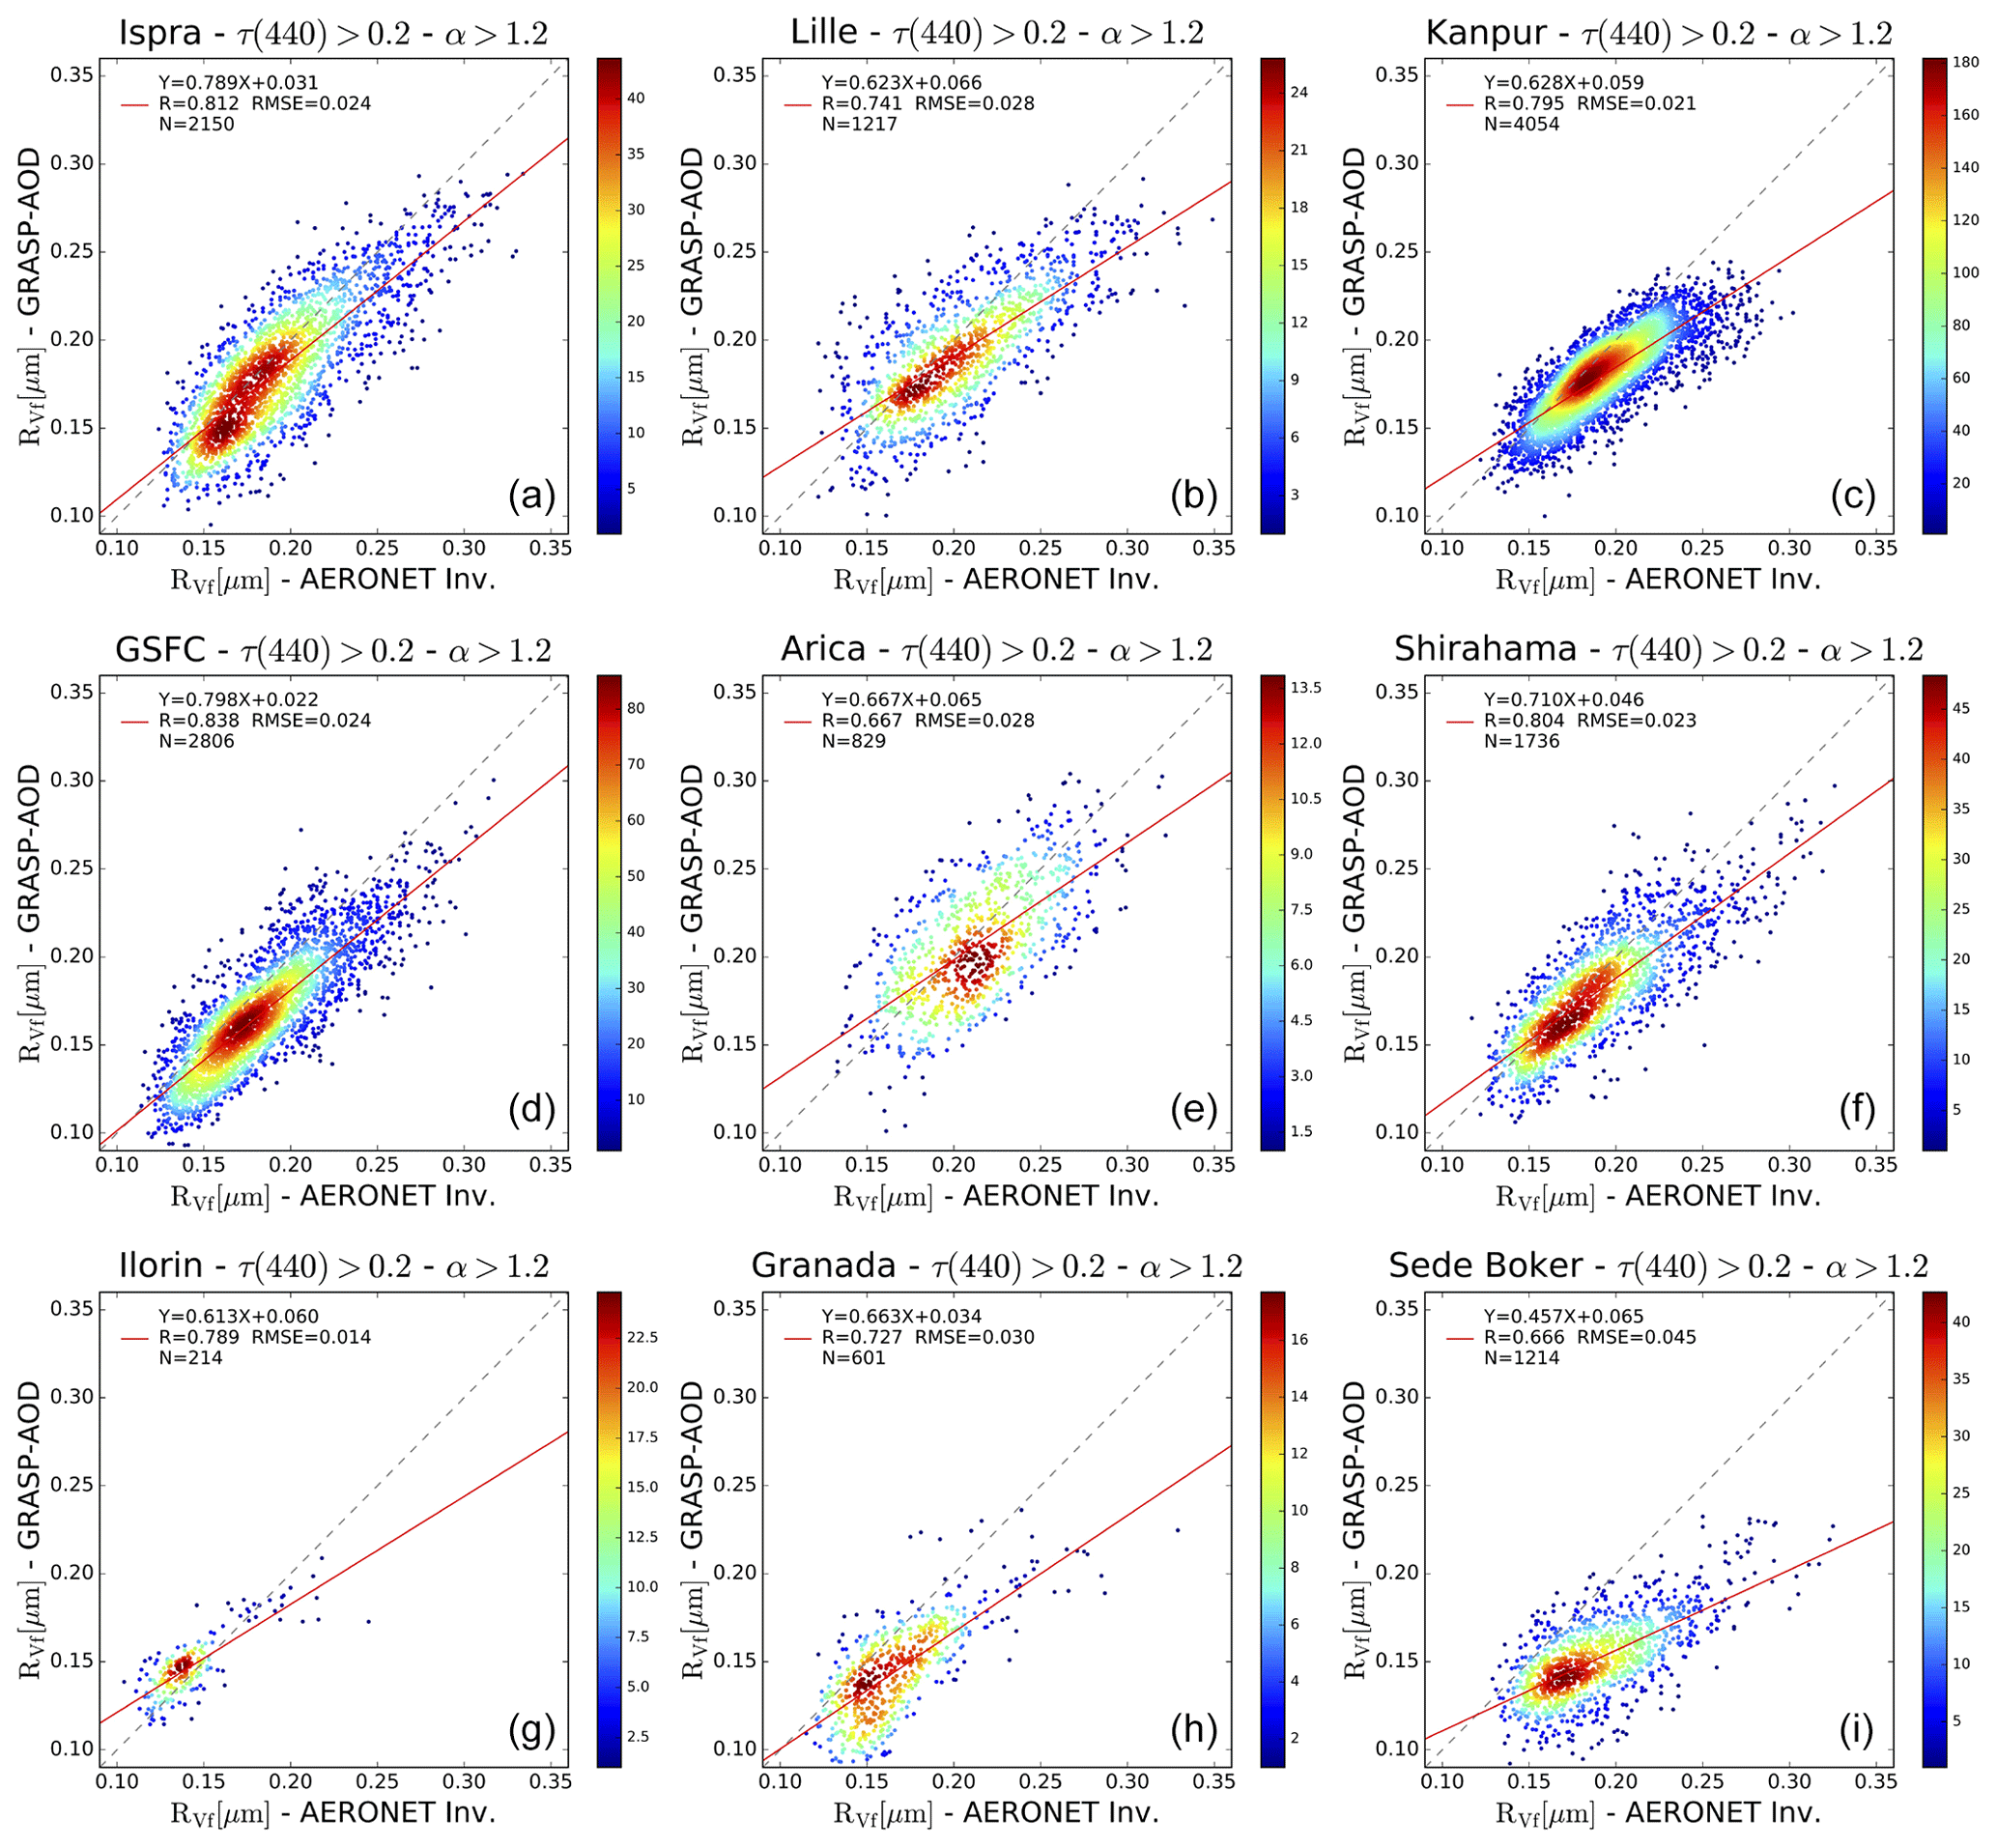
Figure 7Comparisons between the fine-mode volume median radius (RVf [µm]) obtained by the GRASP-AOD and AERONET aerosol retrieval algorithm during the period 1997–2016 for some selected sites (a–i Ispra, Lille, Kanpur, GSFC, Arica, Shirahama, Ilorin, Granada and Sede Boker). Note that the comparisons include only the data accomplishing the thresholds τ(440)>0.2 and α>1.2 (the same as in Table 6). Color bars represent data density in a 0.01×0.01 µm grid. We have intentionally kept the same X−Y scale in all figures.
Lower data percentages (between 18 %–40 %) are presented at sites with fine-mode predominance but with lower aerosol load throughout the year than at the earlier sites (e.g., Arica, GSFC or Tomsk). The RMSRE of RVf comparisons at this group are a bit higher (between 12 %–19 %) than at the previous group. However, correlation coefficients and slopes show similar values (0.6–0.8). Three examples of this group (GSFC, Arica and Shirahama) are shown at middle panels of Fig. 7.
The lowest data percentages (under 20 %) are obtained for those sites regularly affected by desert dust episodes: Granada, Ilorin, Lake Argyle, Sede Boker and Solar Village. The only exception is Forth Crete, which should be included in this group even though it shows a higher data percentage (29 %). The correlation and slope values are significantly lower compared to the precedent groups (from 0.45 to 0.75). Correlations for Ilorin, Granada and Sede Boker are shown in the bottom panels of Fig. 7. Note that data variation of RVf is considerably narrower at these last sites compared to the previous group (as can be seen in Fig. 7) and the values of RVf rarely exceed 0.25 µm. This fact justifies that, even if the correlation coefficients are quite small (for instance, 0.45 in Lake Argyle), the RMSRE values are still quite low (between 12 % and 25 %). On the other hand, the use of climatological values for the refractive index may induce a larger error in the retrieval of RVf at this group compared to previous groups. Thus, the monthly averages of real refractive index, estimated from Level 2.0 of Version 3 of the AERONET aerosol retrieval algorithm, are dominated by the frequent desert dust episodes occurring at these sites. These values may significantly differ from typical real refractive index values of the data selected here (τ(440)>0.2 and α>1.2). Future reprocessings using more developed climatologies (e.g., considering different values for different Ångström exponents) may improve the results obtained in this study.
Finally, we would like to mention that there is a certain bias between the GRASP-AOD and AERONET in RVf retrievals. The total bias is −0.011 µm (−5.7 % in relative terms) though we observe that it increases for higher values of RVf: from only −0.002 µm (or −1.4 %) when RVf<0.14 to −0.029 µm (or −12.7 %) when RVf>0.26 µm. That explains why all the slopes in Table 6 (or in Fig. 7) are under 1. A possible explanation could be related to a general loss of sensitivity in the GRASP-AOD retrieval as RVf increases. Thus, if we analyze the variation of the extinction coefficient as a function of the size parameter (), we observe that there is a strong variation from χ=0.5–2.5 which becomes smoother for χ>2.5 since the extinction coefficient arrives to its maximum (see, for instance, Fig. 3 from Tonna et al. (1995) or Fig. 2.10 from Lenoble et al. (2013)). For radii around 0.14 µm, the size parameters for all the considered wavelengths in this study are between 0.6 and 2.2. At RVf=0.23 µm, half of the channels are already out of the so-called maximum sensitivity interval (). Nevertheless, the retrieval is still quite sensitive even if we limit the analysis to RVf>0.23 µm; under these conditions, the RMSE value is 0.039 µm (or 17 % in relative terms) and the correlation coefficient is larger than 0.6.
Figure 8 shows the comparison of the fine-mode volume concentration (CVf) obtained by the GRASP-AOD and AERONET aerosol retrieval algorithm. Similarly as in Fig. 6, three different lower limits on the aerosol load are used in the top panels (from left to right): τ(440)>0.02, τ(440)>0.2 and τ(440)>0.4. Correlation coefficients are over 0.91 in the three graphics, which is significantly better than for RVf comparisons. This is mainly due to the much larger variability for the concentration values. The slope (between 0.78–0.79) and intercept values (0.004–0.005) are similar between the three cases regardless of the τ(440) limit. Significant differences can be observed only in the RMSE value, which increases as the lower limit rises: 0.013 µm3/µm2 for all the retrievals, 0.017 µm3/µm2 when τ(440)>0.2 and 0.023 µm3/µm2 if τ(440)>0.4. However, the relative value (RMSRE) decreases as the lower limit increases: 42.6 % for all the retrievals, 36.8 % for τ(440)>0.2 and 34.5 % when τ(440)>0.4. Once again, we observe that the most restrictive limit τ(440)>0.4 hardly improves the RMSRE with respect to the limit τ(440)>0.2 while it eliminates half of the data. Therefore, the threshold τ(440)=0.2 proposed by Torres et al. (2017) seems to also be adequate here.
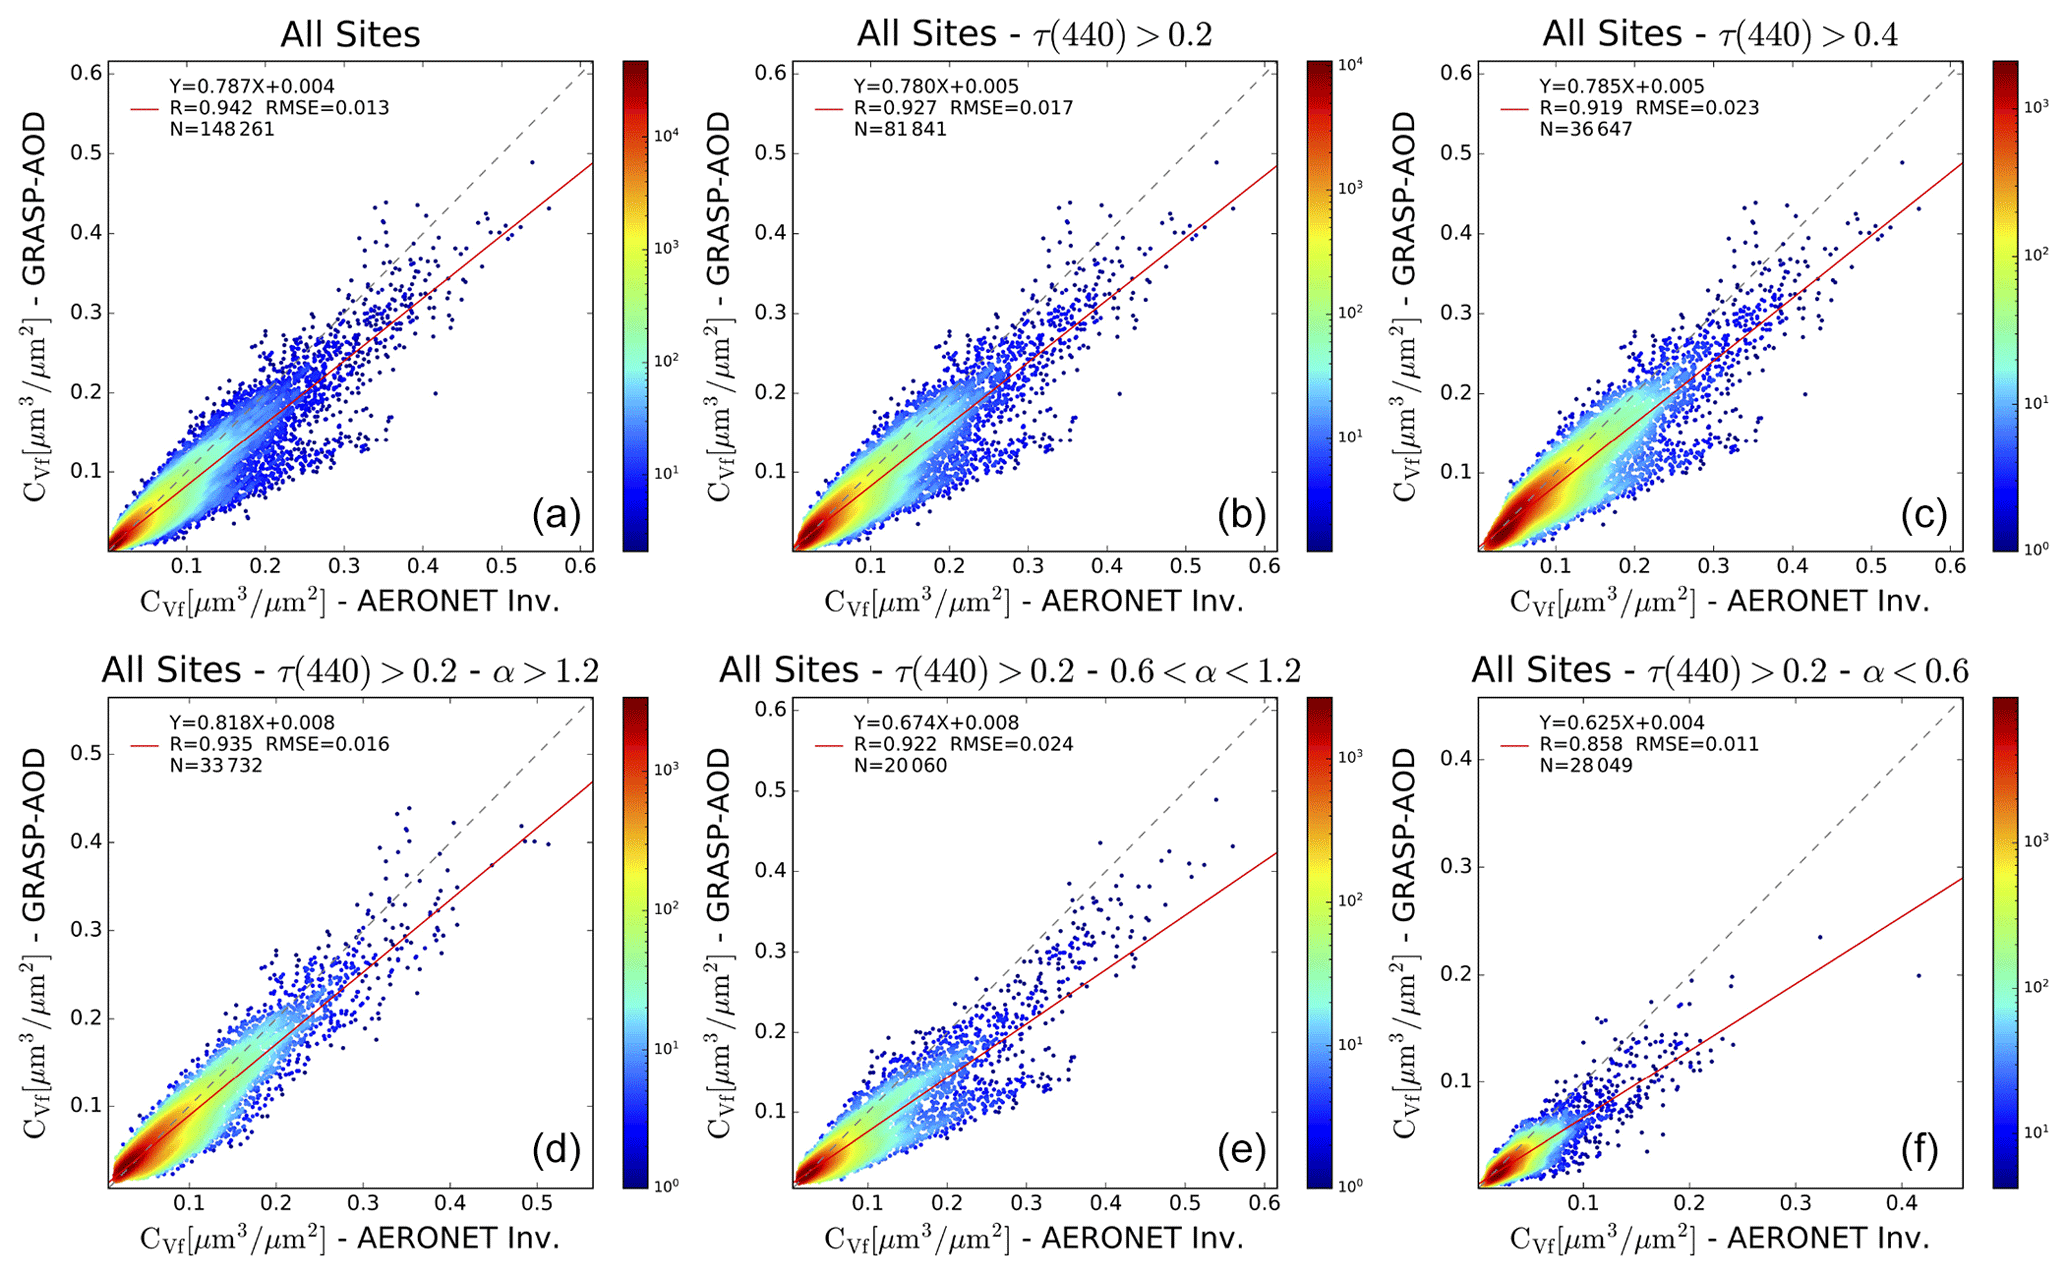
Figure 8Comparisons between the fine-mode volume concentration (CVf [µm3/µm2]) obtained by the GRASP-AOD and AERONET aerosol retrieval algorithm for all sites considered in the analysis (Table 1) for the period 1997–2016 using different thresholds for τ(440) and Ångström exponent values. Panels (a)–(c) analyze the effect of different lower limits of τ(440) (from left to right): all retrievals (τ(440)>0.02), retrievals with τ(440)>0.2, and retrievals with τ(440)>0.4. Panels (d)–(f) analyze the results for the retrievals with τ(440)>0.2 and for different ranges of Ångström exponent from (d) to (f): retrievals with α>1.2, retrievals with α between 0.6 and 1.2 and, finally, retrievals with α<0.6. Color bars represent data density in a 0.01×0.01 µm3/µm2 grid. A logarithmic scale has been chosen given the strong data density at low values.
The bottom panels in Fig. 8 represent the CVf comparisons when τ(440)>0.2 for different ranges of the Ångström exponent: retrievals with α>1.2, retrievals with α between 0.6 and 1.2, and retrievals with α<0.6. The best results are obtained for the case when α>1.2 with a slope of 0.82, a correlation coefficient of 0.94 and RMSE = 0.016 µm3/µm2, which is equivalent to RMSRE = 26 %. Although the lowest RMSE is observed for the case when α<0.6, the RMSRE = 42 % is the largest in relative terms. The comparison for the cases with α between 0.6–1.2 presents an RMSE = 0.024 µm3/µm2 (RMSRE = 40 %).
The second part of Table 6 presents the comparisons by site for CVf when τ(440)>0.2 and α>1.2. The correlation coefficients and the slopes are between 0.8–1.0 for most of the sites, which indicates a good correlation by site in general terms. In addition, all RMSRE values are between 19 %–35 %. The lowest values (around 20 %) are mainly obtained for the sites with a predominant fine mode (e.g., Kanpur, Bonanza Cree, Mongu and GSFC). On the other hand, sites with regular presence of desert dust depict the highest RMSRE values (see Granada or Lake Argyle). Nevertheless, there are some exceptions to both statements; see, for instance, the relatively low RMSRE value of 22 % found at Sede Boker or the relatively high value found at Moscow and Shirahama (RMSRE = 31 % in both cases).
3.2.2 Coarse mode
The study by Torres et al. (2017) pointed out that the characterization of coarse-mode size properties by the GRASP-AOD is less accurate compared to the characterization of fine mode. This is mainly due to the much lower sensitivity of the spectral τ measurements (in the spectral range between 340–1020 nm) to the coarse-mode size distribution. In this regard, the study by Torres et al. (2017) recommended the use of moderate a priori information about coarse-mode parameters to significantly improve the characterization. The values of the multiple initial guess approach (values in Table 2) used in this first validation analysis are certainly inspired by typical AERONET climatological values, for example, RVc=1.9–2.3 µm for desert cases (typically α<0.6). However, they do not account for possible peculiarities of a particular site. A discussion with ideas about how to improve the coarse-mode characterization is presented in Sect. 4.3. Here, we limit the analysis to the general results based on the methodology described in Sect. 2.2 (which includes the multiple initial guess approach shown in Table 2).
The top panels of Fig. 9 show the comparisons between the coarse-mode volume median radius obtained by the GRASP-AOD and AERONET aerosol retrieval algorithm for all sites considered in the analysis during the period 1997–2016 and using three different lower limits on the aerosol load (from left to right): τ(440)>0.02 (threshold established for all GRASP-AOD retrievals), τ(440)>0.2 and τ(440)>0.4. We can observe how the correlation coefficients and the slopes improve as the τ(440) lower limit increases. The same happens with RMSE and RMSRE: 0.583 µm (23.2 %) when τ(440)>0.02, 0.500 µm (20 %) when τ(440)> 0.2 and 0.472 µm (18.8 %) when τ(440)>0.4. Analyzing those values, the threshold of τ(440)> 0.2 suggested by Torres et al. (2017) to derive aerosol size properties seems a good compromise for the retrieval of RVc as well. Unlike the retrieval of RVf, filtering the retrievals by the Ångström exponent do not present any improvements in the characterization of RVc: the analysis results in similar RMSRE values at different Ångström exponent ranges (not shown in the figure).
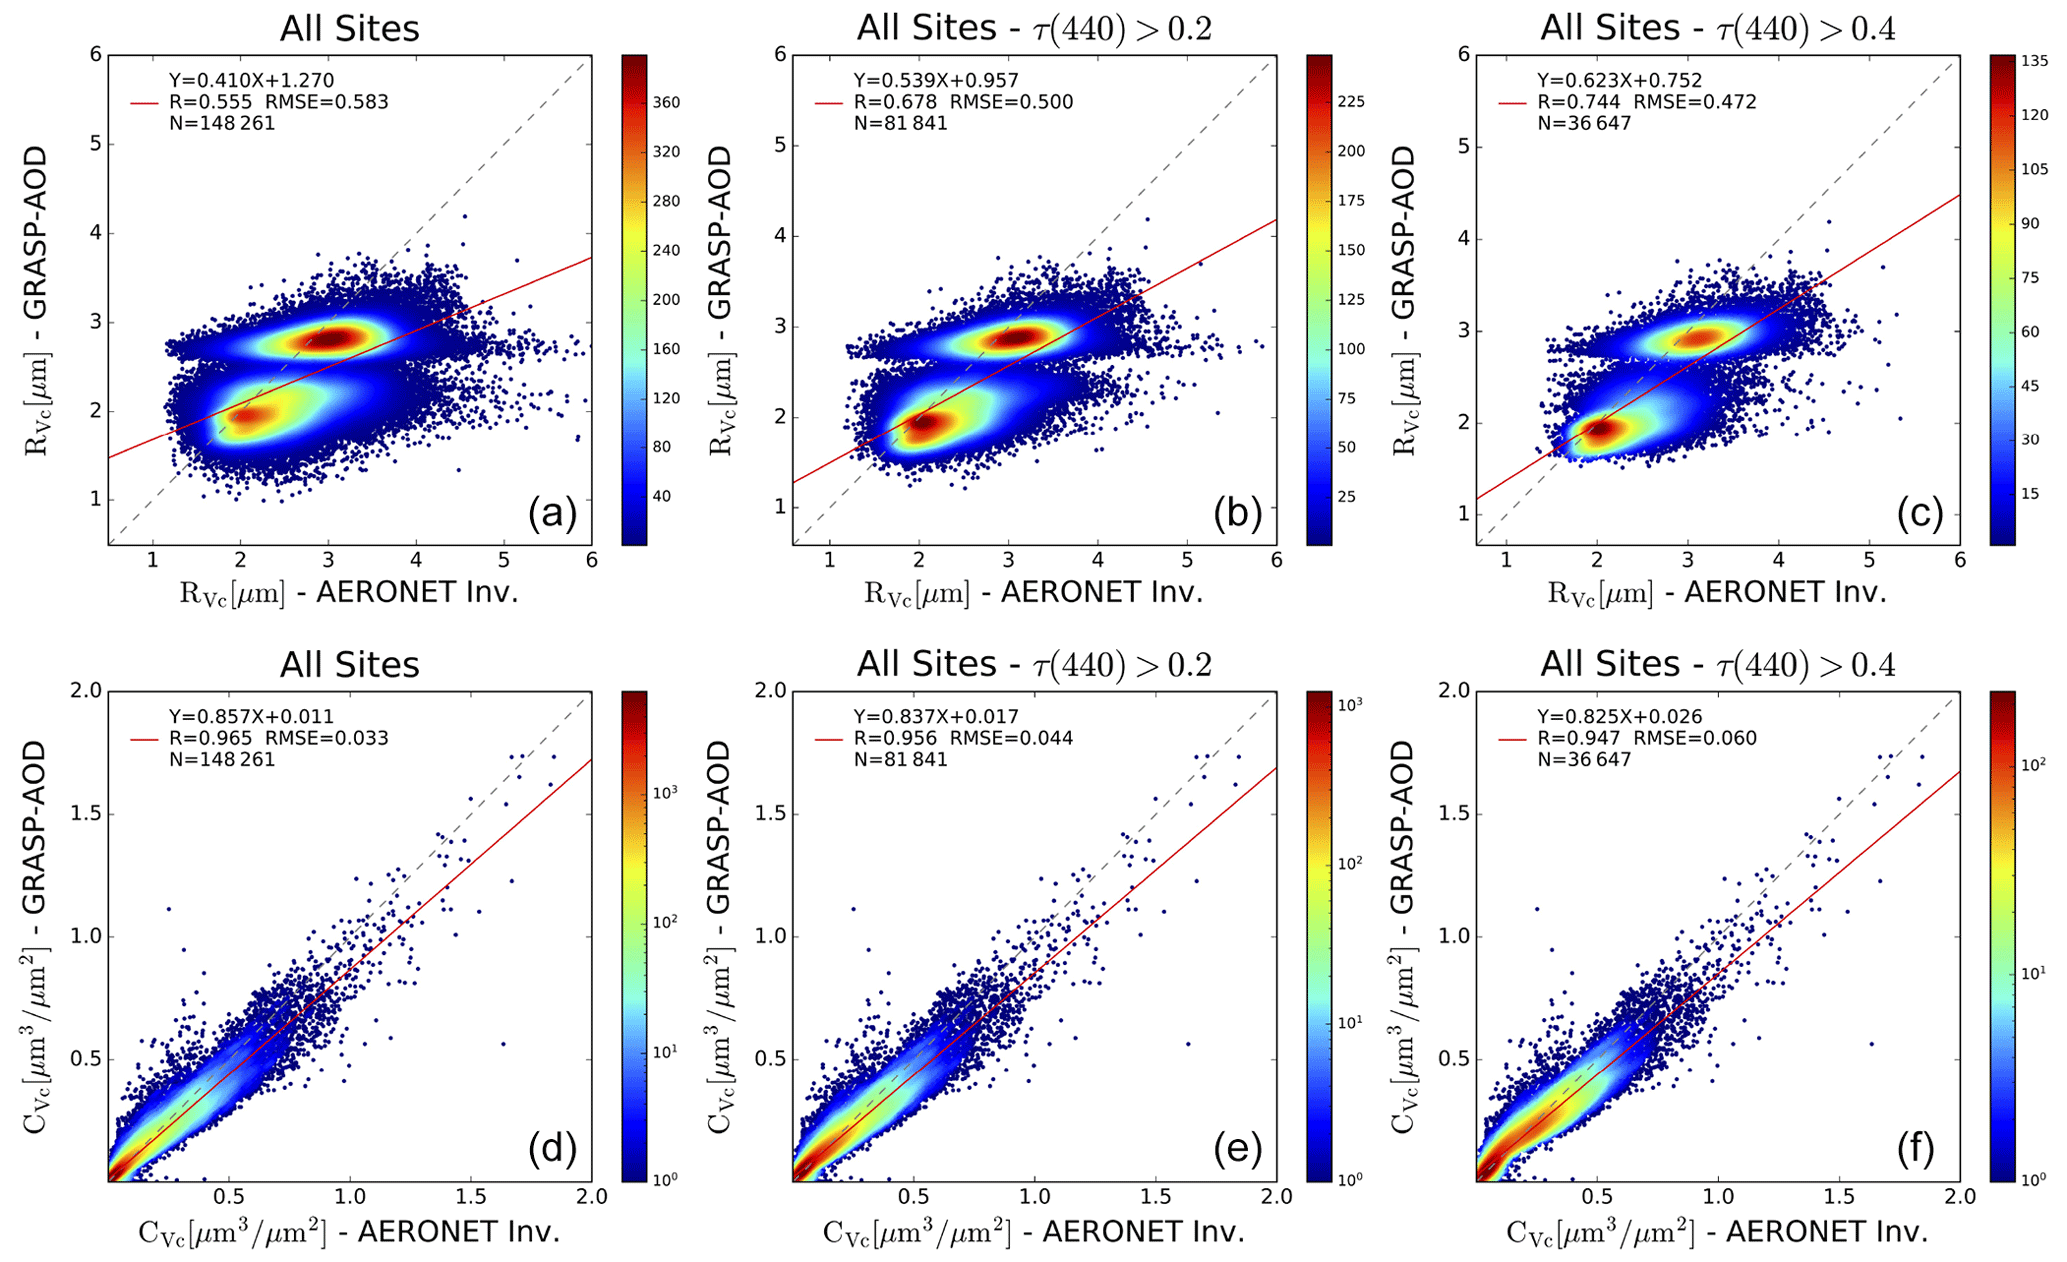
Figure 9Comparisons between the coarse-mode volume properties obtained by the GRASP-AOD and AERONET aerosol retrieval algorithm for all sites considered in the analysis (Table 1) during the period 1997–2016. Comparisons for the coarse-mode volume median radius (RVc [µm]) are represented in (a)–(c), while comparisons for the coarse-mode volume concentration (CVc [µm3/µm2]) are shown in (d)–(f). Different thresholds for τ(440) have been applied in the comparisons from (a) to (f): all the retrievals (τ(440)>0.02), retrievals with τ(440)>0.2 and retrievals with τ(440)>0.4. Color bars represent data density in a 0.05×0.05 µm grid for RVc and in 0.01×0.01 µm3/µm2 grid for CVc. For the volume concentration, a logarithmic scale has been chosen given the strong data density at low values.
On the other hand, we observe the presence of two main clusters in the comparison between the retrievals of RVc for the three different thresholds. The main reason for the appearance of these clusters is related to the limited sensitivity of the GRASP-AOD to coarse-mode retrieval. As a matter of fact, the retrieved RVc does not typically present strong variation with respect to the considered initial guess value (given in Table 2). In this regard, the first cluster around 1.7–2.1 µm is associated with the initial guess choice for low α values. The second cluster, which is centered on 3.0 µm, corresponds to the choice for the GRASP-AOD retrievals with larger α values. As pointed out in the introduction, a good selection of these initial guess values is key for a correct characterization if only optical depth values are considered. This aspect is revisited in Sect. 4.3.
The first part of Table 7 shows the main parameters of the comparison between RVc retrievals obtained from the AERONET aerosol algorithm and GRASP-AOD when τ(440)>0.2 by site. We notice that the RMSRE values for almost all sites are between 15 %–25 % without a clear tendency regarding the aerosol type of the sites. This result was expected since, as previously mentioned, we have not observed a clear dependence of the errors on the value of the Ångström exponent. On the other hand, the values of the correlation coefficients by site are mostly between 0.25–0.5, which is significantly lower than the value of 0.68 found when analyzing the retrievals from all sites together (final row in Table 7 or top-middle panel in Fig. 9). A similar result is obtained in the characterization of the slopes. This can be partly explained by the fact that RVc does not present strong variations for a same aerosol type that typically predominates in a given site. However, there is a significant variation when all sites are considered. The result indicates that the GRASP-AOD is not sensitive to the small oscillations of RVc that occurred for individual aerosol types at the different sites but it gives a reasonable characterization overall, which is mainly due to an optimal choice of the initial guess.
Table 7Comparison between coarse-mode size parameters obtained from the AERONET standard inversion and GRASP-AOD. The first column presents the site and the second column the number of coincident retrievals accomplishing τ(440)>0.2. The percentage with respect to the total number of coincident retrievals is indicated in parentheses. Columns three to six show the comparison results for coarse-mode volume median radius, while columns 7 to 10 present the results for the coarse volume concentration. In both cases, RMSE (and RMSRE enclosed in parentheses) correlation coefficients, slopes and intercepts from linear regressions are shown.
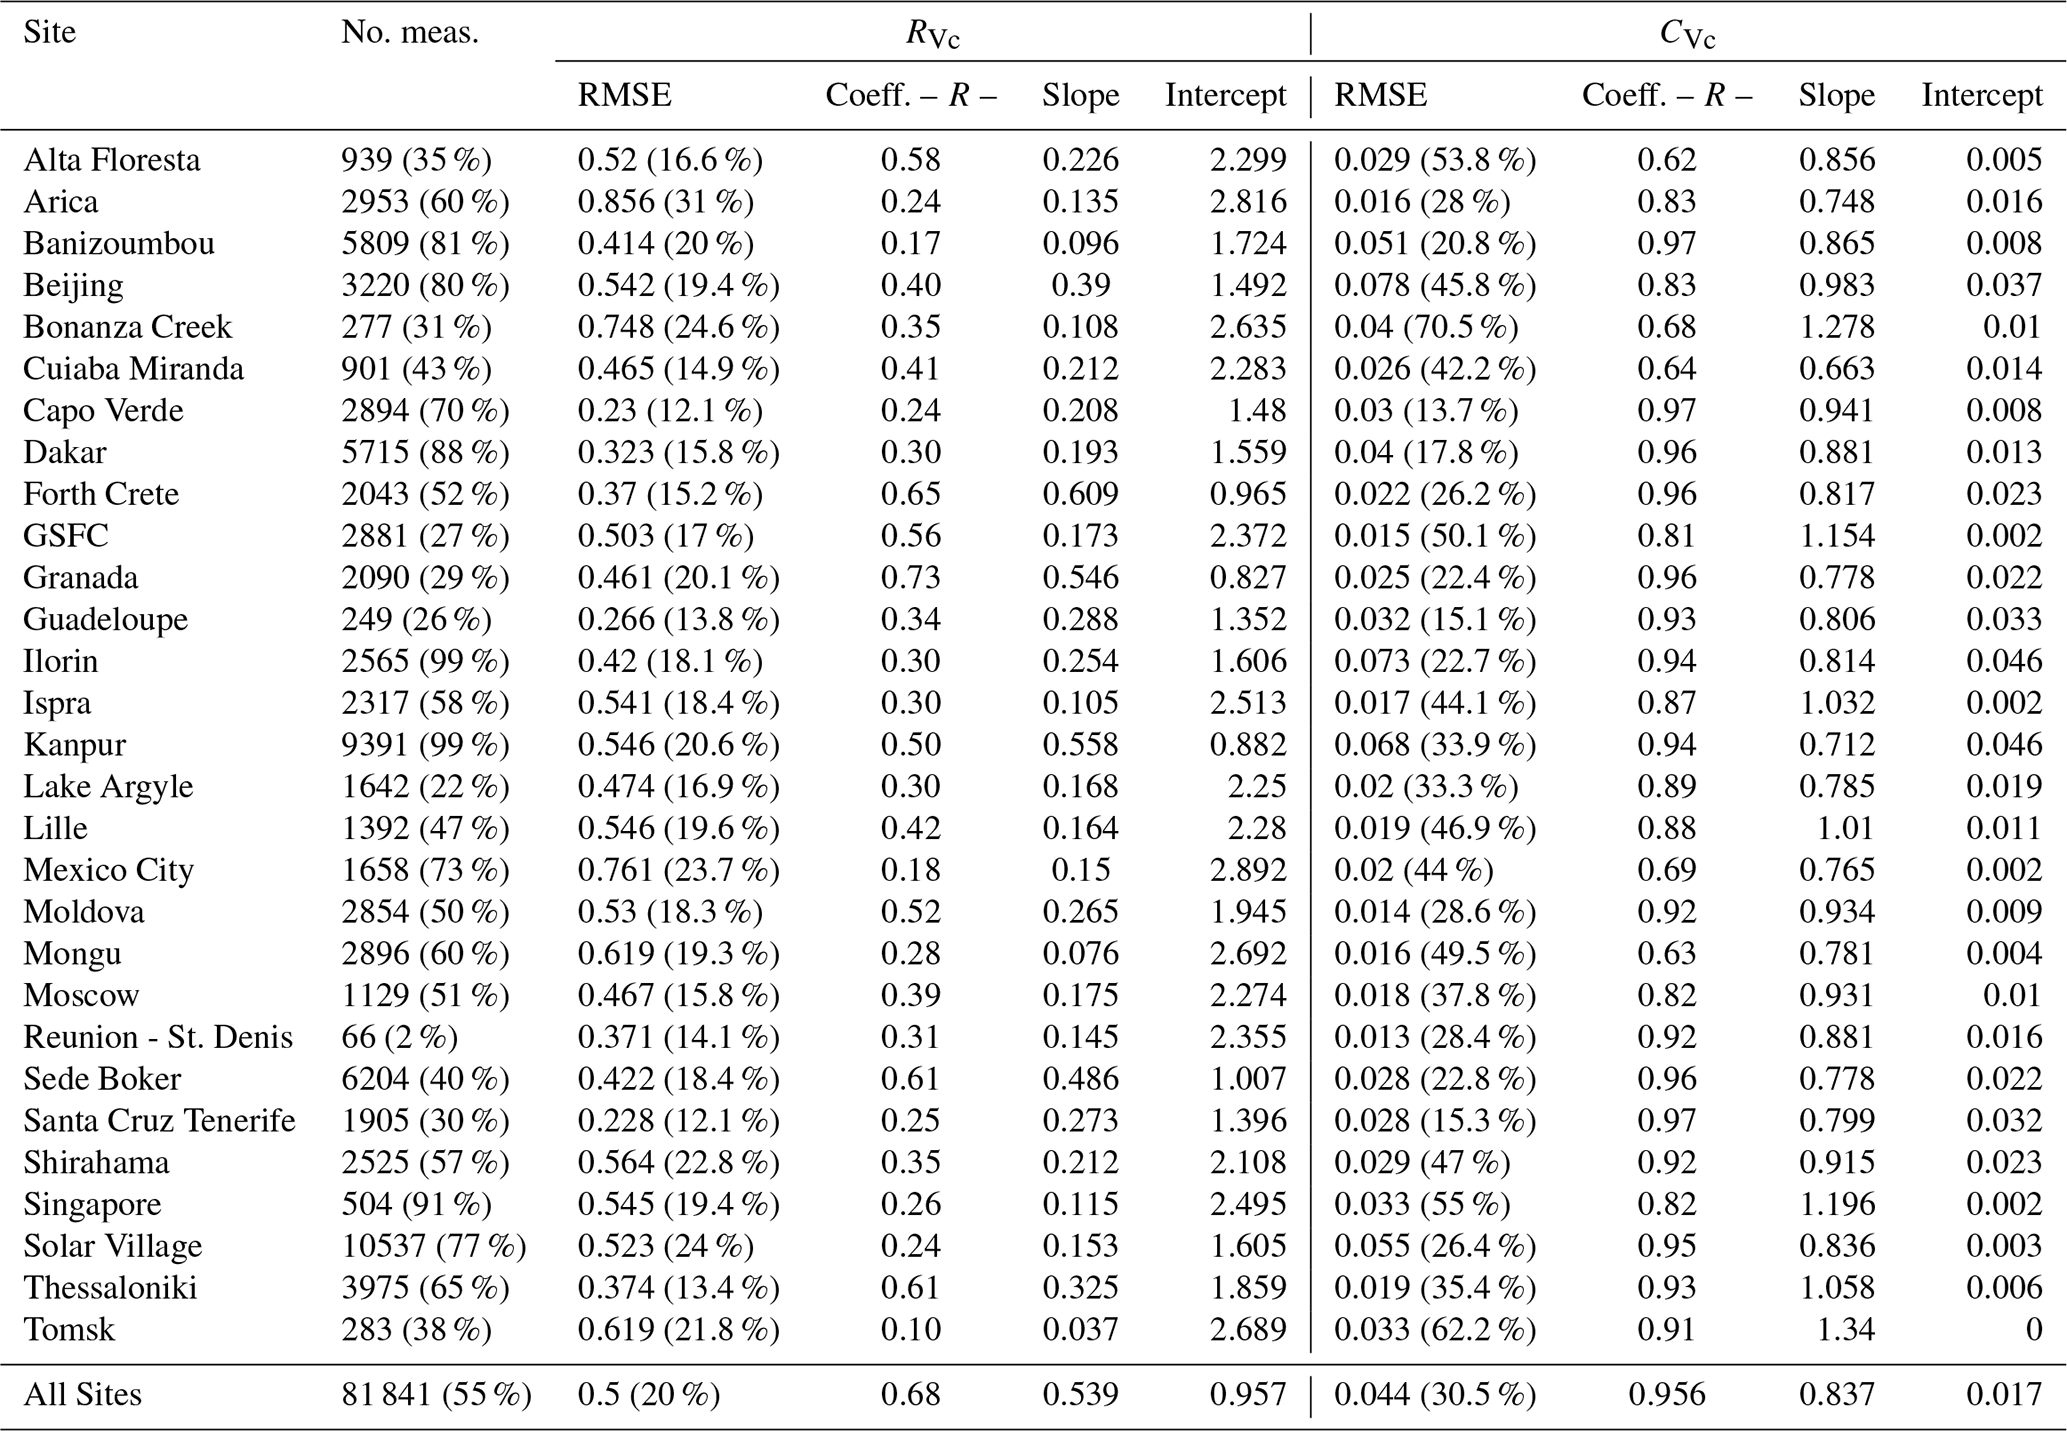
The bottom panels in Fig. 9 present the comparison for the coarse-mode volume concentration (CVc) for three different thresholds of the aerosol load (from left to right): τ(440)>0.02, τ(440)>0.2 and τ(440)>0.4. As in the characterization of CVf, the three correlation coefficients are greater than 0.9, and the three slopes are close to 0.8. We observe that as the τ(440) lower limit increases the RMSE value increases. However, it decreases in relative terms: 0.033 µm (35.7 %) when τ(440)>0.02, 0.044 µm (30.5 %) when τ(440)> 0.2 and 0.060 µm (28.8 %) when τ(440)>0.4. The τ(440)>0.4 threshold eliminates half of the data but it only improves the RMSRE by 1.7 % with respect to the limit τ(440)> 0.2. In this regard, the latter also seems a good compromise for the retrieval of CVc. If we filter the retrievals by the Ångström exponent, the RMSRE diminishes for lower α values. For instance, if we consider the threshold τ(440)> 0.2, we obtain: RMSRE = 24 % (RMSE = 0.06 µm3/µm2) when α<0.6, RMSRE = 28 % (RMSE = 0.04 µm3/µm2) when and RMSRE = 46 % (RMSE = 0.03 µm3/µm2) when α>1.2. The main reason for this result is the much higher CVc values as a consequence of the larger coarse-mode contribution when Ångström exponent values are smaller.
The comparison of results by site can be found in the second part of Table 7. The analysis of RMSRE values shows lower relative errors for sites with a predominant coarse mode, which is in line with the result obtained by filtering the Ångström exponent values. Thus, the RMSRE values for the sites with a predominance of coarse mode go from 13 % to 26 %, while the values for the rest of the sites go from 30 % up to 70 %. The analysis of the correlation coefficients shows values between 0.8 and 1.0 for the sites with a predominant coarse mode, while lower values are found for the rest of sites (down to 0.6). Similar results are obtained for the analysis of the slopes. All these results may suggest the possibility of adding the threshold α<1.2 to assure quality in CVc retrievals. In such conditions, τ(440)> 0.2 and α<1.2, the RMSRE = 25.7 % and R=0.95 for a total of 48 109 retrievals.
3.2.3 Effective radius and total volume concentration
Finally, we will comment on the comparison results obtained between the GRASP-AOD and AERONET aerosol retrieval algorithm for the effective radius (Reff) and the total volume concentration (). It should be recalled here that neither of the two parameters are primary outputs of the two codes. They are computed from the retrieved values of the bimodal lognormal size distribution for the GRASP-AOD and from the 22-bin detailed size distribution for the AERONET aerosol retrieval algorithm (more information at http://aeronet.gsfc.nasa.gov/new_web/Documents/Inversion_products_V2.pdf, last access: 1 June 2021). Therefore, their accuracy is conditioned by the accuracy of the retrieved parameters.
The comparison of the effective radius for all sites can be found in the top panels of Fig. 10. As in previous figures, we have imposed three different thresholds for aerosol load at 440 nm (from left to right): τ(440)>0.02, τ(440)>0.2 and τ(440)>0.4. We can see how all the relevant parameters in the comparison improve as the lower limit increases, although the greatest improvement occurs between the first two thresholds. Thus, the correlation coefficient and the slope are around 0.7 for all points, and they are around 0.8 when τ(440)> 0.2. For the case when τ(440)>0.4, the slope is 0.82 and the correlation coefficient is 0.85. The same applies to the values of RMSE and RMSRE: 0.185 µm (38 %) when τ(440)>0.02, 0.160 µm (31 %) when τ(440)> 0.2 and 0.151 µm (29 %) when τ(440)>0.4.
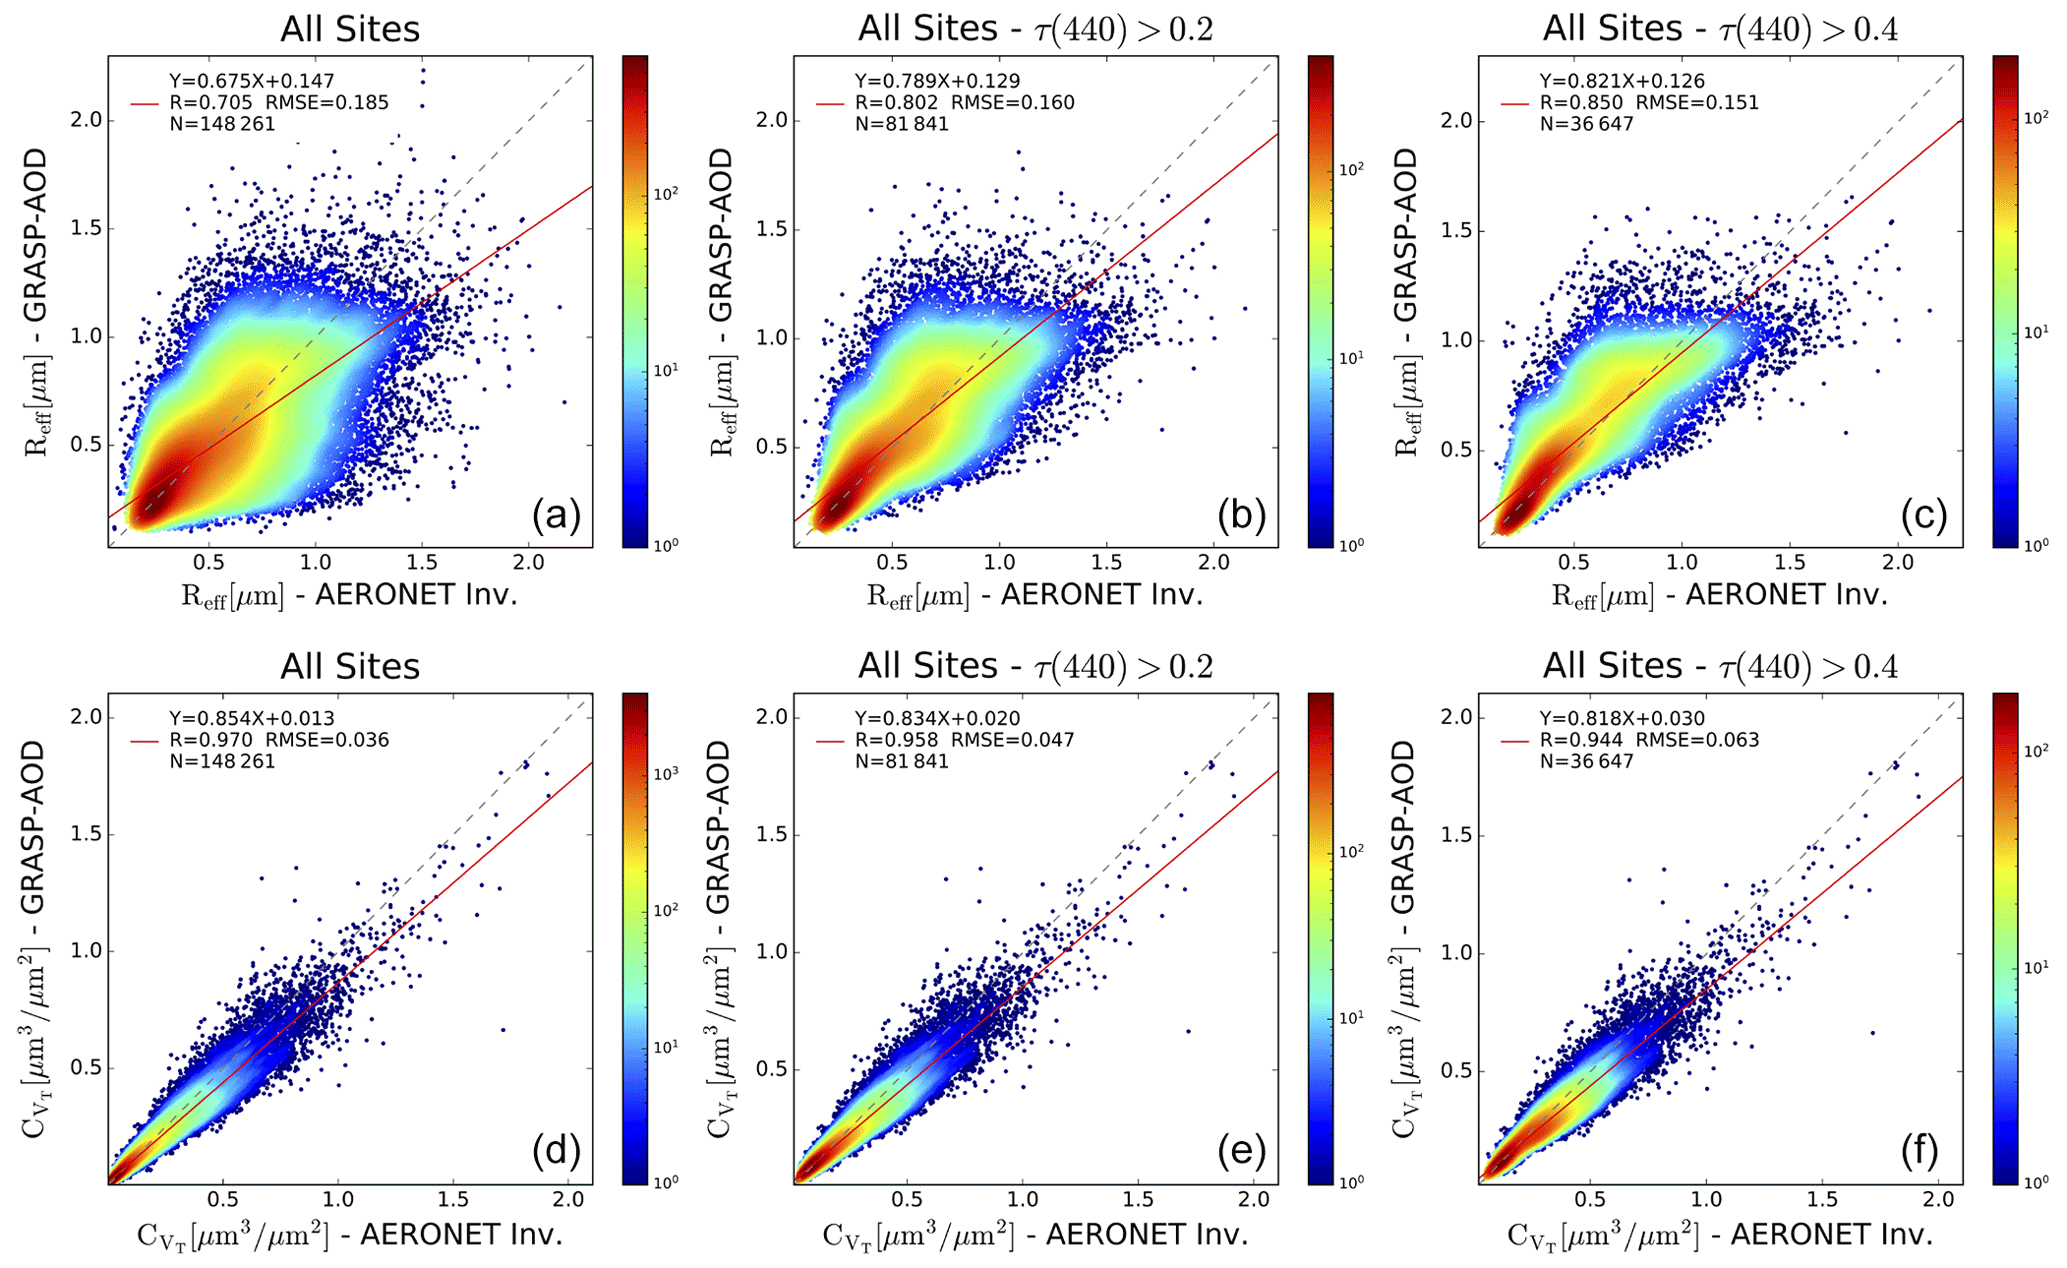
Figure 10Comparisons between the effective radius and the total volume concentration obtained by the GRASP-AOD and AERONET aerosol retrieval algorithm for all sites considered in the analysis (Table 1) for the period 1997–2016. Comparisons for the effective radius (Reff [µm]) are represented in (a)–(c), while comparisons for the coarse-mode volume concentration ( [µm3/µm2]) are shown in (d)–(f). Different thresholds for τ(440) have been applied in the comparisons from (a) to (c) and from (d) to (f): all the retrievals (τ(440)>0.02), retrievals with τ(440)>0.2 and retrievals with τ(440)>0.4. Color bars represent data density in a 0.02×0.02 µm grid for Reff and in 0.01×0.01 µm3/µm2 grid for . For both parameters, a logarithmic scale has been chosen given the strong data density at low values.
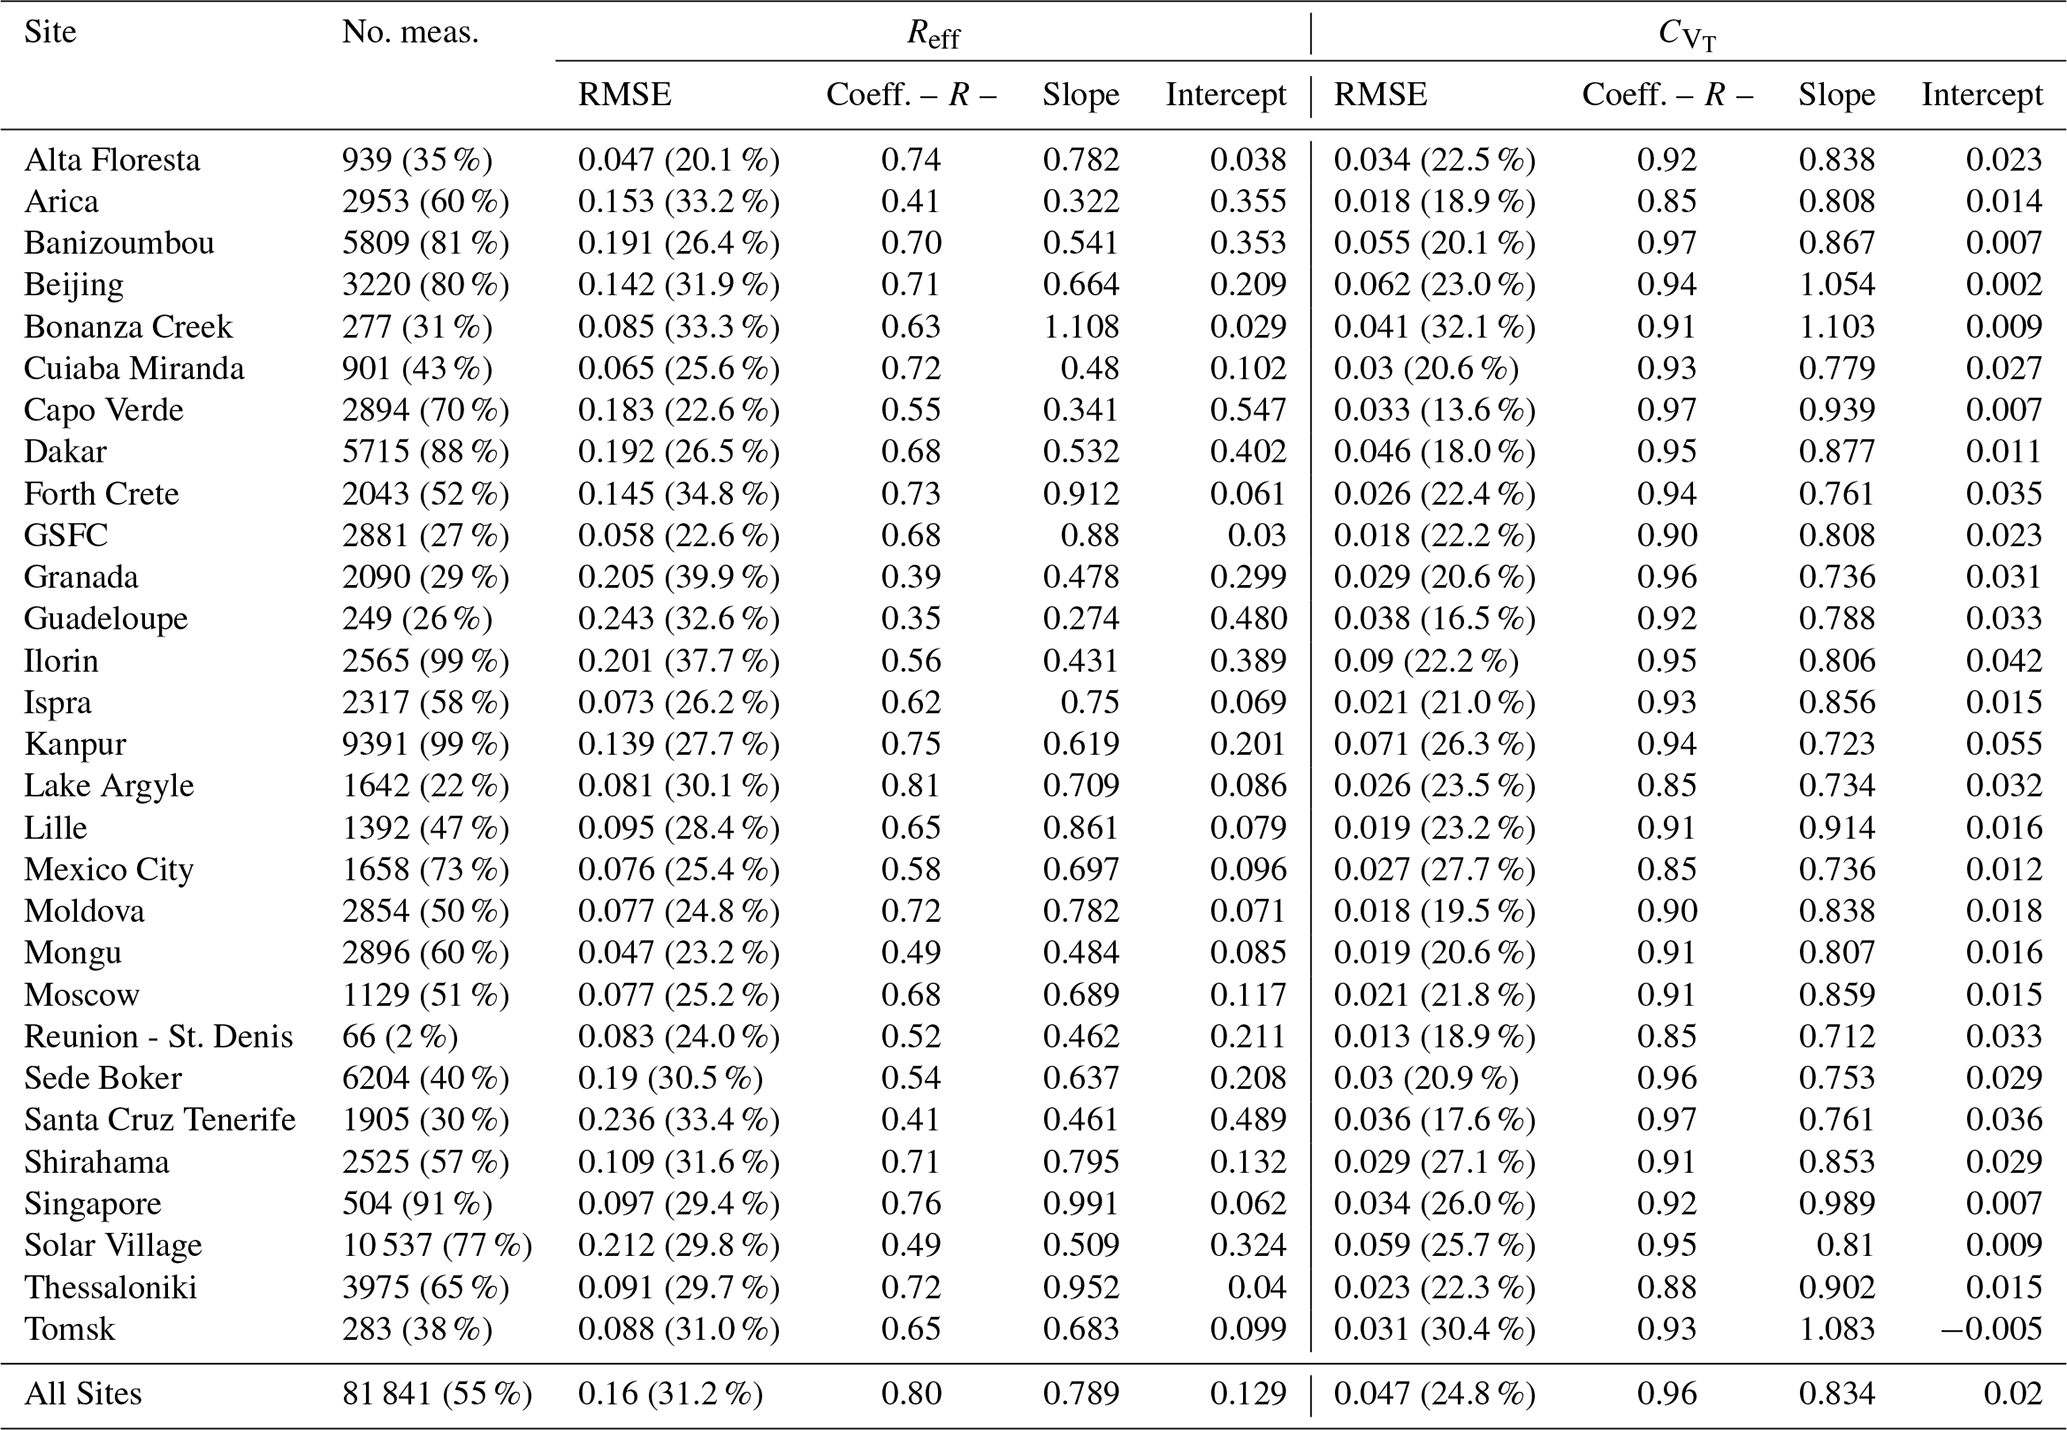
The first part of Table 8 presents the results by sites for the effective radius when τ(440)>0.2. The correlation coefficients and the slopes are significantly worse for most of the sites than when computing all sites together, with values typically between 0.5–0.7. The larger variation in the effective radius when all sites are analyzed together with respect to performing the analysis one by one is the main reason for this result. Regarding the values of RMSE, we observe that they are the highest for the sites with a coarse-mode predominance. At these sites, the differences are between 0.18–0.24 µm. Coarse-mode sites also present the largest differences in relative terms with RMSRE values between 30 %–40 %. On the other hand, the sites with a fine-mode predominance present RMSRE values between 20 %–30 %.
Table 8Comparison between effective radius and total concentration obtained from the AERONET standard inversion and GRASP-AOD. The first column presents the site and the second column the number of coincident retrievals accomplishing τ(440)>0.2. The percentage with respect to the total number of coincident retrievals is indicated in parentheses. Columns three to six show the comparison results for effective radius, while columns 7 to 10 present the results for the total volume concentration. In both cases, RMSE (and RMSRE enclosed in parentheses) correlation coefficients, slopes and intercepts from linear regressions are shown.
The bottom panels of Fig. 10 illustrate the comparison for the total volume concentration. The correlation coefficients, the slopes and RMSE are slightly better for the study including all the retrievals (left panel) compared to the other two analyses with τ(440)>0.2 and τ(440)>0.4. The only parameter that improves as the lower limit increases is the RMSRE: 29 % when τ(440)>0.02, 25 % when τ(440)> 0.2 and 23 % when τ(440)>0.4.
The analysis by sites with τ(440)> 0.2, shown in the second part of Table 8, exhibits the second best results from the size parameters analyzed in the present study (just after the characterization of RVf). The correlation coefficients are larger than 0.85 for all sites and larger than 0.92 for most of the sites. The slopes are between 0.7 and 1.1, with most of the sites between 0.8 and 1.0. The relative differences do not depend on the aerosol type of the site, with most of the values around 25 % (±5 %), which is the averaged value found in the analysis of all sites together.
As mentioned in the introduction, the study by Pérez-Ramírez et al. (2015) (based on linear estimation techniques (LET) described by Veselovskii et al., 2012) proposed to derive the effective radius and the total volume aerosol concentration only from spectral τ measurements. In the same work, the authors proposed a validation study using AERONET τ measurements as input from 18 sites during 1 year (around 75 000 τ measurements). Afterwards, they compared LET retrievals of Reff and to the coincident values obtained by the AERONET aerosol retrieval algorithm, similarly to this study. The characterization obtained for effective radius is comparable to the one obtained here, with relative errors with respect to AERONET around 30 % in both cases. On the other hand, the characterization of the total volume concentration computed for the GRASP-AOD agrees better with the AERONET aerosol retrieval algorithm (25 % RMSRE) compared to LET retrievals (40 % relative differences).
4.1 Bimodal assumption and three mode size distributions
During the analysis of Table 3 in Sect. 2.2 we indicated that all sites except Ilorin presented more than 85 % of the GRASP-AOD valid retrievals with respect to the total number of τ measurements. The relatively small number of valid GRASP-AOD retrievals at the Ilorin site (76 %) is the focus of analysis in this section. We are particularly confident that the main reason for the low number of valid retrievals is related to the bimodal lognormal assumption regarding the size distribution. This assumption, which is one of the main bases of the GRASP-AOD application, would not be true for many aerosol retrievals found at the Ilorin site, which causes a high residual fitting in those retrievals.
4.1.1 Low data percentage at the Ilorin site
The study by Eck et al. (2010) pointed out that a midsize aerosol mode at 0.6 µm was recurrently present in the dust and mixed fine- or coarse-mode aerosol retrievals at Ilorin. The origin of this mode is related to the desert dust from Bodélé Depression of central Chad (in the Southern Sahara), typically transported over Ilorin during the winter and spring period (Washington et al., 2006). The dust from the Bodélé Depression, which is a unique source for aerosols and sometimes described as the single largest individual desert dust source on Earth, was deeply analyzed during the Bodélé Dust Experiment (BoDEx) in 2005. The study by Todd et al. (2007) showed that the dust consists predominantly of fragments of diatomite sediment. The particle size distribution of this diatomite dust estimated from AERONET aerosol retrievals indicated a dominant coarse mode (radius centered on 1–2 µm) similar to other Saharan dust observations. However, they also observed a minor but noticeable presence of particles with radii <1 µm, which is unusual for desert dust, that gives rise to the aforementioned midsize mode.
Precisely, this midsize mode is the origin of the high percentage of retrievals at the Ilorin site that does not pass the criteria of the GRASP-AOD application. To support this idea, we illustrate in Fig. 11a the average of the normalized size distributions (normalization done by the maximum value) retrieved by the AERONET aerosol algorithm at the Ilorin site for the whole analyzed period (in the case of Ilorin between 1998–2016). The retrievals have been divided into two groups depending on whether the coincident GRASP-AOD retrievals (at least one in the 32 min interval around each almucantar measurement defined in Sect. 2.4) meet the quality criteria defined in Sect. 2.2: gray dashed line when the coincident GRASP-AOD retrievals pass the quality criteria (2594 inversions) and black solid line for the cases when the coincident GRASP-AOD retrievals do not pass the quality criteria (1014 inversions). On one hand, we observe a clearly defined bimodal structure for the size distributions with coincident GRASP-AOD valid retrievals. On the other hand, a third mode centered at 0.6 µm appears in the average of the size distributions without a corresponding GRASP-AOD valid retrieval.

Figure 11(a) Average of normalized (by maximum value) size distributions retrieved by the AERONET aerosol algorithm at the Ilorin site. They have been divided into two groups depending on whether the coincident GRASP-AOD retrievals meet the quality criteria defined in Sect. 2.2: gray dashed line when the coincident GRASP-AOD retrievals pass the quality criteria (2594 inversions) and black solid line for the cases when the coincident GRASP-AOD retrievals do not pass the quality criteria (1014 inversions). (b) Averages of normalized (by the value at 0.992 µm) size distributions at several AERONET sites when the coincident GRASP-AOD retrievals do not meet the quality criteria: Ilorin (black solid line), Banizoumbou (gray solid line), Dakar (silver solid line), Sede Boker (gray dashed line) and Solar Village (silver dashed line). Only the interval with radii from 0.439 to 0.992 µm is plotted.
The averages shown in Fig. 11a represent tendencies in the two types of retrievals. However, the GRASP-AOD filter criteria can not be considered a perfect detector of three mode structures. In fact, by analyzing the size distribution retrieved by AERONET one by one, there are several with a noticeable third mode and with a corresponding GRASP-AOD valid retrieval. At the same time, there are some perfectly bimodal AERONET size distributions without a valid GRASP-AOD retrieval. Nevertheless, it should be noted here that the cross section of extinction at 0.6 µm (or kernels for the extinction; see Eqs. 2 and 3 of Torres et al. (2017)) is quite high for all the wavelengths considered at the present study. Neglecting the third mode (since a bimodal structure is assumed) is a significant source of error in the estimation of the spectral aerosol optical depth. Indeed, errors associated with a deficient aerosol model can be treated as other error sources (for instance, intrinsic to the measurements; see Dubovik, 2004) to estimate the uncertainty of the retrieval. Therefore, the recurrently third mode structure at Ilorin produces a systematic error that affects the retrieval fitting or residual for the GRASP-AOD. It may not be determinant but is added to the rest of the errors. The fact that some of the quality filters used for GRASP-AOD retrievals refer to the fitting or residual (specifically the last two in Sect. 2.2) justifies that at the Ilorin site the percentage of valid GRASP-AOD retrievals is the lowest.
To put the results at Ilorin into perspective, Fig. 11b analyzes the averages of the normalized size distributions when the coincident GRASP-AOD retrievals do not meet the filtering criteria at several AERONET sites with a desert dust predominance: Ilorin (black solid line), Banizoumbou (gray solid line), Dakar (silver solid line), Sede Boker (gray dashed line) and Solar Village (silver dashed line). Since we are interested in the presence of the third mode at 0.6 µm, the size distributions are normalized to the value at 0.992 µm, and in the figure only the section of radii from 0.439 to 0.992 µm is plotted. We observe that Ilorin has the highest values for the size distribution at 0.576 and 0.756 µm, with both values approximately 1 (i.e., to the size distribution value at 0.992 µm). The other two sub-Saharan sites also present high values at 0.576 and 0.756 µm, especially at Banizoumbou, though significantly lower than at Ilorin. The two Middle East sites present the lowest value at 0.576 and 0.756 µm, with the size distributions perfectly decreasing from 0.992 µm to lower radii.
In fact, at the Ilorin site, the recurrently third mode is reported from climatologies, but this third mode is not present at the climatologies of the other four dust-affected sites analyzed here (Dubovik et al., 2002a; Eck et al., 2008). Note at this point that we have only averaged the size distributions without a valid GRASP-AOD retrieval, and the percentage of non-valid retrievals is shown in the legend for each site. So, even if at Banizoumbou or Dakar we can observe an incipient third mode, the size distributions illustrated here only represent 14 % and the 9 % of the retrievals, while at Ilorin they represent 24 %. It should also be highlighted that the percentage of GRASP-AOD retrievals that do not meet the criteria at Sede Boker and Solar Village is 1 % and 5 %, respectively. These values are on the same order as those found at the sites with a predominant fine mode.
4.1.2 Large discrepancies in the estimation of τf(500)
We suggested at the end of Sect. 3.1 that the three mode structures analyzed in this section were the reason for the second branch observed in Fig. 5 while comparing τf(500) retrieved by the AERONET aerosol retrieval algorithm versus the GRASP-AOD and SDA (when α>0.6). Thus, for some retrievals there is a significant overestimation of the τf(500) from the AERONET aerosol retrieval algorithm compared to the other two methods. We have observed that most of these retrievals are at the Ilorin site (though a few examples can be found at Banizoumbou and Dakar) and for all of them the midsize mode is relatively high. This means that the minimum value of the volume size distribution in the cutoff radius range (from 0.439 to 0.992 µm) is found either at 0.992 µm or at 0.756 µm. That is why the AERONET retrieval assigns the midsize mode completely (or mostly) to the fine mode while the other two methods do not. This fact creates the aforementioned overestimation.
To present an example of these retrievals, the left panel of Fig. 12 illustrates with solid lines the four aerosol volume size distributions retrieved by AERONET (Level 2) at the Ilorin site on 1 February 2000. The right panel of Fig. 12 contains these same four size distributions but only from 0.439 to 0.992 µm (cutoff radius range) and normalized by the minimum value at this interval. We can see that the first two size distributions (07:32 and 08:18 UTC plotted with blue and green lines, respectively) present their minimum value at 0.992 µm while the other two (08:46 and 15:10 UTC plotted with orange and red lines, respectively) at 0.756 µm.
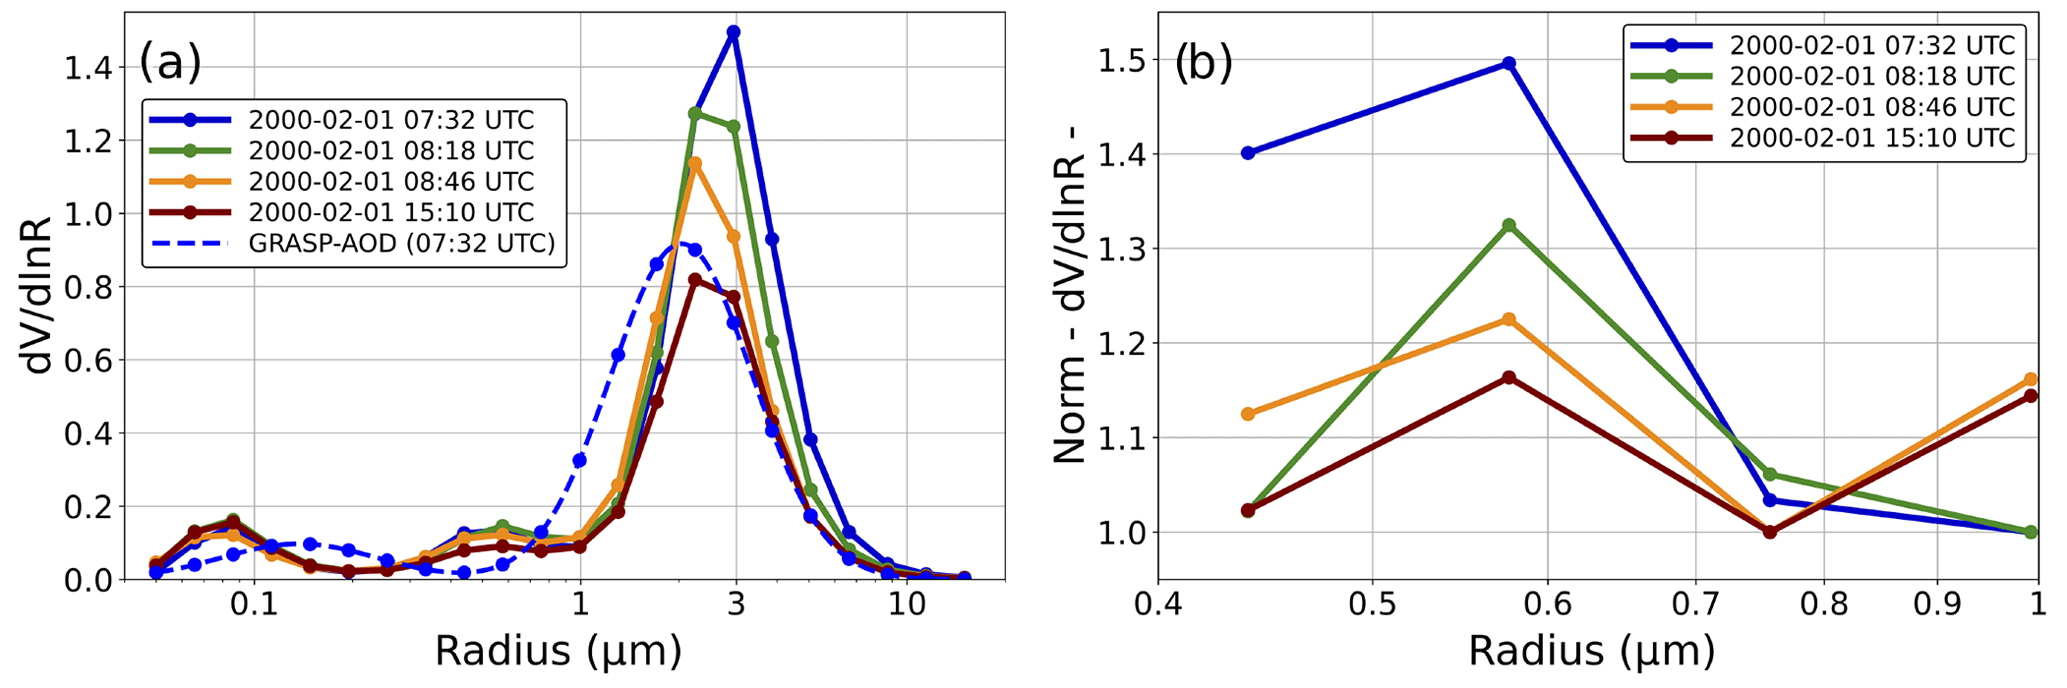
Figure 12(a) Volume size distributions retrieved by the AERONET aerosol algorithm at the Ilorin site on 1 February 2000. The only valid retrieval from the GRASP-AOD, which corresponds to the τ measurement at 07:32 UTC, is also plotted with a dash blue line. (b) The same volume size distributions retrieved by AERONET but only from 0.439 to 0.992 µm (cutoff radius range used to separate modes in AERONET) and normalized by the minimum value at this interval.
The values of τf(500) estimated by the AERONET aerosol retrieval algorithm and SDA are shown in Table 9. The first two retrievals (with AERONET cutoff at 0.992 µm) present differences around 0.4 between the two methods. The last two (with AERONET cutoff at 0.756 µm) present differences of 0.34 and 0.26. To better interpret these differences, the second part of Table 9 depicts τf(500) values estimated by the GRASP forward code using as input the aerosol properties retrieved by AERONET considering different cutoffs. We note that the values obtained at 0.992 µm for the first two retrievals and at 0.756 µm for the last two are almost identical to those given by the AERONET aerosol retrieval. This result was expected since the radiative transfer codes used by the GRASP and AERONET are quite similar and the cutoff established by AERONET correspond to these radii. We observe that to find the values retrieved by the SDA the cutoff should be established between 0.335 to 0.439 µm for the four retrievals. Nevertheless, the mode separation in three-mode structures is not immediate for the SDA algorithm nor for the GRASP-AOD, which base their functioning on the existence of two well-defined aerosol modes. Therefore, the values obtained by these two algorithms can not be considered the truth in these circumstances. Actually, if the midsize mode, which is caused by dust particles, was completely assigned to the coarse mode (see values for cutoff at 0.255 µm) the values of τf(500) would be much smaller than the values obtained by the SDA.
Table 9Values of τf(500) retrieved at the Ilorin site on 1 February 2000. The first two columns contain the values obtained by the AERONET aerosol retrieval algorithm and SDA. The rest of the columns correspond to simulated τf(500) values estimated by the GRASP forward code using as input the aerosol properties retrieved by the AERONET and considering different cutoffs.

Finally, we would like to point out that there is only one GRASP-AOD valid retrieval from the 25 τ measurements in AERONET level 2 available on that day. The valid retrieval corresponds to the first τ measurement in the morning, which was taken just before the almucantar at 07:32 UTC. The corresponding size distribution retrieved by the GRASP-AOD is represented with a dashed blue line in Fig. 12a. It can be observed how the midsize mode is not detected by the GRASP-AOD since a bimodal size distribution is imposed. As mentioned before, the midsize mode is situated in a radius range with relatively high values of the extinction cross sections and also presents a quite defined spectral dependency. Therefore, neglecting this mode can not be correctly compensated for by adding extra particles in the two assumed modes. As a matter of fact, the valid retrieval has an absolute residual fitting of 0.029 (relative 1.7 %), which is quite high compared to typical residual fitting values that are lower than 0.01. The other 24 retrievals presented residual fittings higher than 0.04 % and they did not fulfill the filtering criteria defined in Sect. 2.2 (point 4 although most of them also did not fulfill point 5). The τf(500) obtained by the GRASP-AOD valid retrieval was 0.642, which is much closer to the value given by the SDA than the one obtained by the AERONET aerosol retrieval.
4.2 Use of standard refractive index values
As largely described in Torres et al. (2017), the information contained exclusively in the spectral aerosol optical depth measurements is not enough to retrieve the aerosol refractive indices. Consequently, this parameter needs to be assumed to run the GRASP-AOD application. The use of monthly climatological values has been proposed in the present validation study, as explained in Sect. 2.2. These values have been obtained by averaging the retrievals of AERONET aerosol standard algorithm (which includes full sky radiances and τ measurements) available for each site on the AERONET website (https://aeronet.gsfc.nasa.gov/cgi-bin/webtool_inv_v3, last access: 1 June 2021). It should be noted here that all sites chosen for this study were selected based on the availability of an extensive data record of at least 10 years of τ measurements on the AERONET website. Although this requirement was primarily established to have a large number of τ measurements at each site, our strategy regarding the refractive index has certainly benefited from this fact. Thus, all the analyzed sites counted on robust datasets of aerosol optical properties, which have been used to generate the refractive indices for the GRASP-AOD retrievals (more details in Sect. 2.2).
At this point, we wish to discuss the methodology to run the GRASP-AOD in new sites or in sites with only few years of existing data. A reasonable strategy would be the use of standard refractive index values of the dominant aerosol type expected at the new site. For example, in sites with a predominant fine mode (mainly urban sites) the values suggested would be around 1.45–0.005i (spectrally independent). In sites with frequent desert dust episodes the real part would be higher (up to 1.56) and the imaginary part would count for a larger absorption in UV channels. It should be noted that we do not intend to detail the rules about how the selection of refractive index values for new sites should be made. Our proposals are just to underline that assumptions would need to be made in new sites and to estimate the impact that these assumptions may have on the retrieved parameters by comparing these results to the optimum case when a robust dataset is available.
Before beginning the description of the tests performed in this study, we would like to briefly summarize the main outcomes obtained in previous work concerning this topic to avoid repeating previous analysis. Thus, one of the main results derived from the study by Torres et al. (2017) was that the retrieved parameters by the GRASP-AOD application were much more sensitive to a variation in real refractive index than to a variation in the imaginary part. The same result was also found by earlier studies of only aerosol optical depth retrievals, such as King et al. (1978) and Yamamoto and Tanaka (1969). Moreover, from all the retrieved parameters, the mean radius and the volume concentration of the fine mode were the most affected by a variation in the real part of the refractive index. This result is illustrated in Fig. 9 of the study by Torres et al. (2017). The figure shows a decrease in the mean radius and the volume concentration of the modes when the real part of the refractive index increases, while for negative variations both parameters increase their values. A similar result was previously obtained in King et al. (1978), where it was pointed out that the shape of the size distribution remains the same but shifts with a varying real part. Both results are derived from the anomalous diffraction theory by Van de Hulst (Van de Hulst, 1957). The other main interesting result from Torres et al. (2017) was that the fine and coarse separation of the aerosol optical depth as well as the characterization of the coarse-mode size parameters were practically unaffected by variations of the refractive index.
Considering these previous results, we have reprocessed the data from the Mongu site (same τ measurements as described in Table 1), although instead of using the climatological values as in the general analysis of Sect. 3, we have assumed standard values of 1.45–0.005i. The Mongu site has been chosen principally for two reasons. (a) It has one of the largest datasets from all the predominant fine-mode sites for the period 1997–2016. The interest here in fine-mode-dominant sites is due to the fact that we expect RVf and CVf to be the most affected parameters by the variation of the refractive index. At the same time, the characterization of RVf showed the lowest differences with AERONET from all the size volume aerosol parameters analyzed in Sect. 3.2, especially if τ(440)>0.2 and α>1.2. Therefore, the main analysis of this section focuses on describing how the characterization of RVf is affected by the selection of standard refractive index in the aforementioned best retrieval conditions. (b) The monthly climatological refractive index values at Mongu are around 1.51–0.021i (similar to the results found at Dubovik et al., 2002a). These values are some of the most different compared to the standard values proposed here (1.45–0.005i) from all sites with a predominant fine mode. Actually, the monthly climatological averages found at several sites (e.g., GSFC, Ispra, Lille and Shirahama) are quite close to 1.45–0.005i and, logically, the assumption of this so-called standard value would have a little impact on the retrievals.
Figure 13 illustrates the comparisons of fine-mode volume median radius (RVf [µm], at left panels), fine-mode volume concentration (CVf [µm3/µm2], at central panels) and fine-mode optical depth (τf(500), at right panels) retrieved by the GRASP code and AERONET aerosol retrieval algorithm for the Mongu site during the whole analyzed period (measurements from 1997–2010 in the case of the Mongu site). In the top panels, the GRASP-AOD retrievals have been processed assuming a standard value for the refractive index of 1.45–0.005i, while at bottom panels, the retrievals correspond to the general processing (Sect. 3) where monthly climatological values were used. The first thing that we can observe is that the amount of data in the comparisons, both for size parameters and τf(500), is almost the same regardless of the refractive index used. This is due to the fact that the number of τ retrievals that pass the quality criteria with standard values of refractive index (90 129) is almost the same as the one obtained with climatological values (90 005).
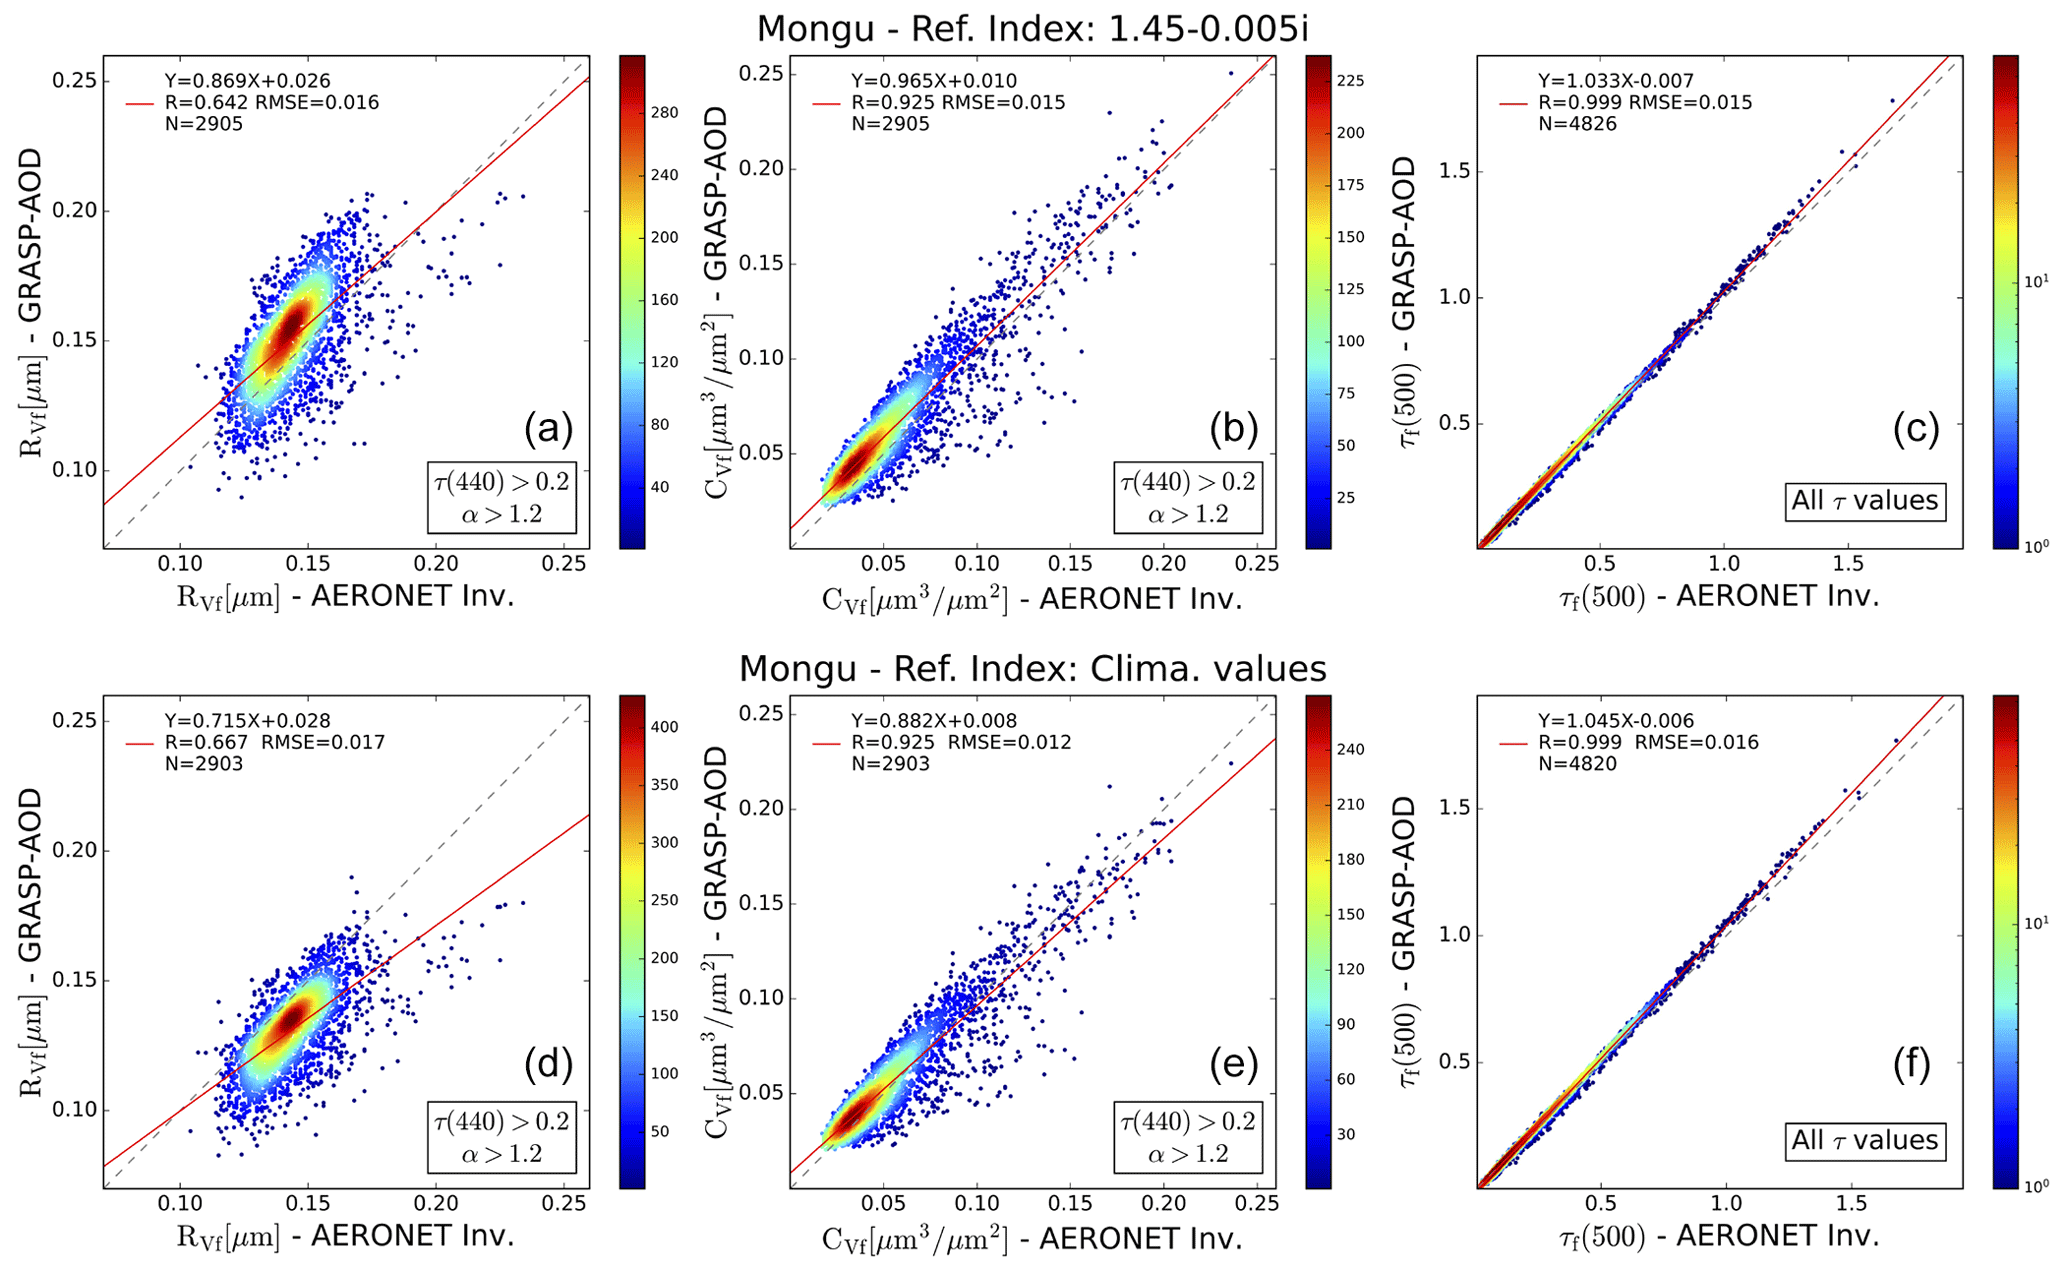
Figure 13Comparisons between the fine-mode volume median radius (RVf [µm]; a, d), the fine-mode volume concentration (CVf [µm3/µm2]; b, e) and τf(500) (c, f) obtained by the GRASP code and AERONET aerosol retrieval algorithm for the Mongu site during the whole analyzed period (measurements from 1997–2010 in the case of the Mongu site). In the retrievals in (a)–(c), we have assumed standard values of the refractive index (1.45–0.005i) to run the GRASP-AOD. The retrievals in (d)–(f) correspond to the results of general analysis from Sect. 3 where monthly climatological values were used for the assumption of the refractive index.
Concerning the retrieval of the size parameters, we observe that GRASP-AOD retrievals of RVf and CVf show larger values with the use of standard refractive index values. This result was expected, since as previously pointed out, for negative variations of the real refractive index the fine-mode median radius and the volume concentration increase their values (Fig. 9 of Torres et al., 2017). Thus, the mean value of the GRASP-AOD retrievals of fine-mode median radius () in Fig. 13 is 0.131 µm when the refractive index from climatological values are used, while is 0.151 µm when the standard values are used. Note here that Torres et al. (2017) pointed out that the variation of RVf due to a variation of the real refractive index (Δn) do not depend on the aerosol load and that this variation could by roughly approximated by . In this regard, the variation of 0.02 µm (14 % in relative terms) obtained here fits this estimate since the Δn (standard values minus climatological values) is on average −0.06. On the other hand, the obtained by AERONET retrievals corresponds to 0.143 µm, which is an intermediate value between the two averages obtained by the two GRASP-AOD processings. This fact justifies that the RMSE of RVf comparison with AERONET retrieval does not vary when using standard values for the refractive index (0.016–0.017 µm or between 10 %–12 % in relative terms). This is a particular result for the Mongu processings, although overall we might expect the RMSE with respect to AERONET retrievals to be affected to some extent. Other correlation parameters for RVf comparisons present some variations but they are not quite significant either. For instance, the correlation coefficient is a bit better with the use of climatological values (0.67 versus 0.64) though the slope is a bit worse (0.72 versus 0.87).
We observe similar patterns for the fine volume concentration comparisons. The mean values of the GRASP-AOD retrievals of fine-mode volume concentration () are 0.059 with the use of climatological values and 0.066 with standard values of the refractive index. This variation of −0.007 fits into the approximation given by Torres et al. (2017) for the fine-mode concentration, , which would foresee a variation of −0.008 considering that <τ(440)>=0.499. In this case, the of AERONET retrievals is 0.056, which may justify that the RMSE is better, 0.012 (20 %) versus 0.015 (25 %), when climatological values are used. On the other hand, the correlation coefficients are the same for both processings and the slope improves (0.97 versus 0.88) with the use of standard values for the refractive index.
Finally, the right panels in Fig. 13 represent the comparisons of τf(500) for the two reprocessings with respect to AERONET. As mentioned before, one of the main conclusions from Torres et al. (2017) established that the characterization of this parameter was independent from the assumption of the refractive index. This result is confirmed by the analysis of the correlation parameters of both panels. We observe that the correlation coefficients, slopes and RMSE do present negligible differences between the two processings. The average values () are also very close: 0.259 obtained with climatological values and 0.262 with the proposed standard values (relative difference of 1 %). For the AERONET retrievals is 0.257, which is also similar to both the GRASP-AOD averaged values.
4.3 Advanced characterization of the aerosol coarse mode
The low sensitivity to the coarse-mode properties of τ measurements in the spectral range between 340–1020 nm was one of the main conclusions in the study by Torres et al. (2017). In this respect, an optimal selection of the initial guess was pointed out as a key factor to improve the characterization of coarse mode. These results have been confirmed throughout Sect. 3.2.2 of this work. Specifically, we have indicated that the GRASP-AOD was not sensitive to the small oscillations of coarse-mode median volume radius that occurred for individual aerosol types at the different sites, though we have obtained reasonable characterization overall. This has been possible mainly due to an optimal choice of the initial guess. Nevertheless, there is still a wide scope for improving this choice. For instance, the use of climatological values by site, or even the use of the retrieved value from the nearest AERONET aerosol retrieval, will certainly be attempted in future reprocessings. Note that the latter approach would probably show the best results. Moreover, it would improve not only the characterization of coarse mode but also the effective radius and the total volume concentration, especially in those sites with a predominant coarse mode. However, the current study is limited to the GRASP-AOD retrievals with a close AERONET aerosol retrieval whose products are used for validation proposes. The use of the AERONET aerosol retrieval at the same time as the initial guess and to validate the GRASP-AOD retrievals would show an excellent characterization that might be biased from the real performance in global processing.
Another idea to improve the characterization of the coarse mode would be to complement the τ measurements with aureole measurements. In fact, the angular distribution of scattered light is known to be strongly dependent on the coarse-mode particles, especially at the aureole region (Θ=3–10∘; see, for instance, Tonna et al., 1995). The main interest of this approach would be to obtain better aerosol information in the common situations of partial cloudiness. On such occasions, sky radiance measurements are not suitable for the retrieval of detailed aerosol properties (from almucantar or hybrid scenarios). However, the sky region around the sun could be cloud-free, which would allow us to use as input the available τ and aureole measurements. It should be noted that aureole measurements do not provide the necessary information to retrieve the aerosol optical properties. In this regard, the refractive index values, which are necessary to run the GRASP-AOD, would continue to be taken from the site's climatologies. The contribution of aureole measurements is restricted to improve the coarse-mode characterization and the derived products such as effective radius or total volume concentration.
To check this idea, we have selected the aureole measurements, between 3.5 and 10∘ azimuth angle, belonging to existing almucantar measurements at the Granada site from the period 2011–2012. These aureole measurements are at only four wavelengths: 440, 670, 870 and 1020 nm. We have run the GRASP code adding these aureole measurements to the coincident τ measurements (seven wavelengths in the range 340–1020 nm) using the same configuration as in the GRASP-AOD application (bimodal lognormal size distribution, refractive index pre-fixed, etc.). To distinguish this new use from the classic GRASP-AOD application, we will refer to it as the GRASP-AUR. Some comparisons between the aerosol properties obtained by the GRASP-AUR and those obtained by the AERONET aerosol retrieval algorithm (with the full almucantar) are presented in Fig. 14 (from left to right): coarse-mode volume median radius (RVc [µm]), effective radius (Reff [µm]) and the total volume concentration ( [µm3/µm2]). To put these results into perspective, in the bottom panels we present the comparison in the same period at the Granada site as for the GRASP-AOD retrievals (only τ measurements in the input) and the AERONET aerosol retrieval algorithm. In all the comparisons, we have selected the data with τ(440)>0.2 since this was the threshold identified in Sect. 3 to assure quality in the retrievals.
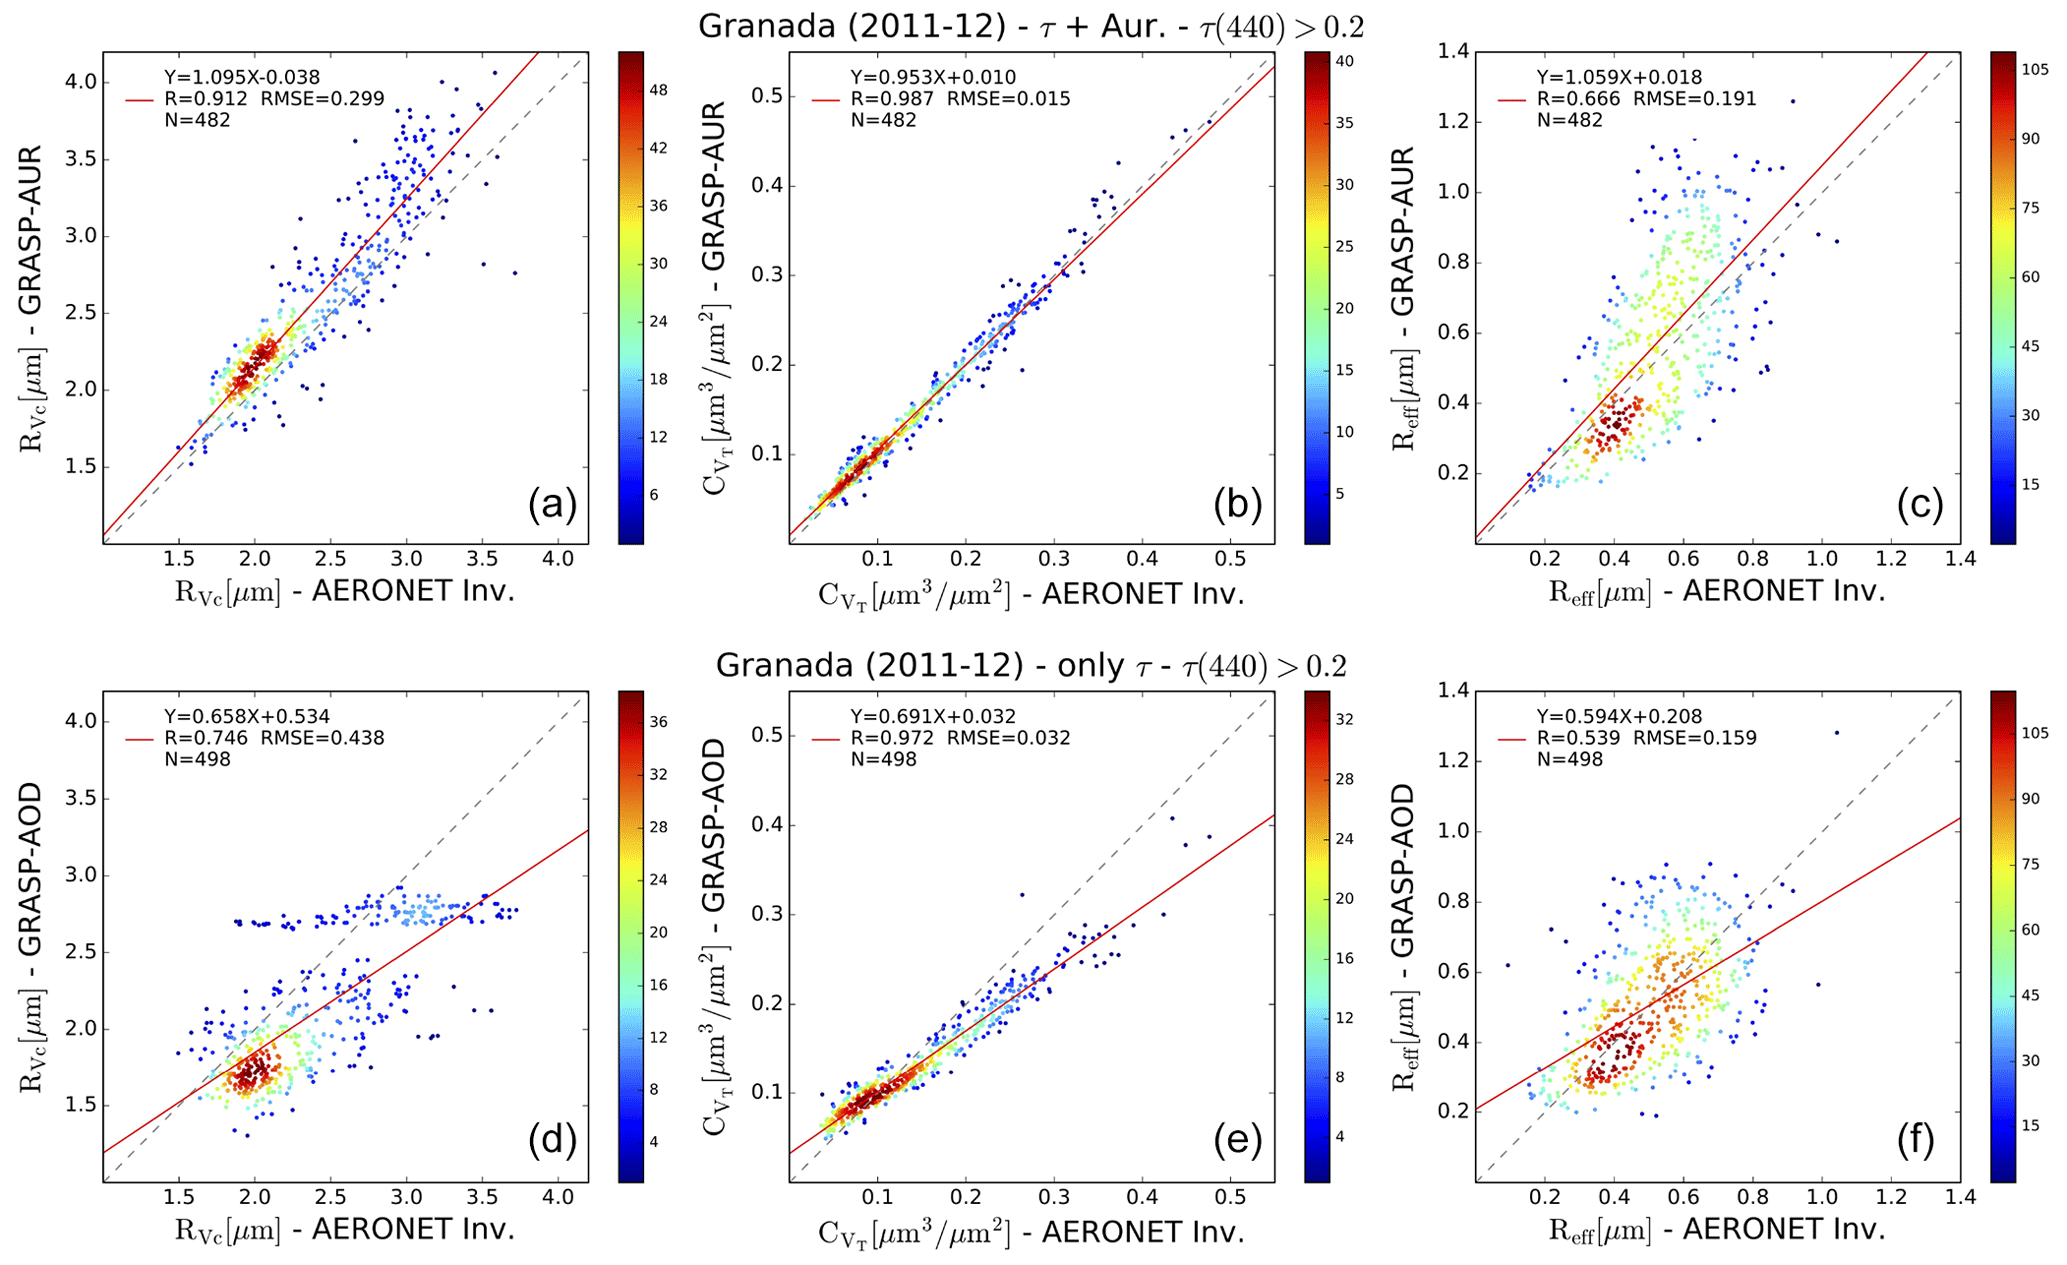
Figure 14Comparisons between the coarse-mode volume median radius (RVc [µm]; a, d), the total volume concentration ( [µm3/µm2]; b, e) and effective radius (Reff [µm]; c, f) obtained by the GRASP code and AERONET aerosol retrieval algorithm for the Granada site for the biennium 2011–2012. In the retrievals in (a)–(c), we have used τ measurements and aureole measurements between 3.5 and 10∘ azimuth angle as input (GRASP-AUR application). The retrievals in (d)–(f) only contain τ measurements as input (GRASP-AOD retrievals). In all the retrievals, we have added the filter τ(440)>0.2. Color bars represent data density in a 0.2×0.2 µm grid for RVc and Reff and in 0.02×0.02 µm3/µm2 grid for .
The first thing we observe in Fig. 14 is that there are less common retrievals between the AERONET aerosol retrieval algorithm and GRASP-AUR (when we add the aureole measurements) than between the AERONET and GRASP-AOD (without the aureole measurements). This small discrepancy in the common retrievals (16 retrievals out of almost 500) is due to the general increase in the retrieval fitting of τ measurements when we consider the aureole measurements.6 The loss of several valid retrievals of the GRASP-AUR with respect to the GRASP-AOD is justified since we have kept the same quality criteria regarding the fitting of τ measurements (defined in Sect. 2.2).
If we first analyze first the results for RVc (left panels), we observe that all the parameters in the comparison with the AERONET aerosol retrieval algorithm are improved when the aureole measurements are added. Thus, the correlation coefficient passes from 0.75 to 0.91 with aureole measurements. The slope rises from 0.66 to 1.1 and the intercept is reduced from 0.54 to only 0.04. The RMSE also decreases strongly from 0.438 to 0.299 µm, which in relative terms means a reduction from 19 % to 13 %. Visually, we observe a continuous correlation for all radii beyond the two clusters obtained for the GRASP-AOD; the overall reasonable characterization obtained by the smart choice of the initial guess evolves to an excellent correlation of RVc when aureole measurements are added.
The characterization of the derived properties, total volume concentration and effective radius also improves when adding aureole measurements. Thus, the slope passes from 0.6–0.7 to be around 1 in both characterizations. In the case of , the rest of parameters improve even though some of them were already excellent. For instance, the correlation coefficient passes from 0.97 to 0.99 and the RMSE is divided by 2 from 0.032 µm3/µm2 (22.7 %, in relative terms) to 0.015 µm3/µm2 (10.6 %). For Reff, we observe a better correlation when we introduce the aureole measurements; however, the RMSE increases from 0.159 to 0.191 µm (or from 32.1 % to 37.5 % in relative terms). This increase is justified by the general overestimation of RVc and especially at largest values (3.5–4 µm).
It should be noted that a comprehensive study on the use of aureole measures to improve the GRASP-AOD application is outside the scope of the present validation study. These first results presented here indicate the direction that may be taken in future analysis, especially to improve the characterization of the coarse mode. Finally, we would like to highlight the versatility of the GRASP code, which allows one to easily integrate the aureole measurements in a predefined inversion scheme such as the GRASP-AOD. Moreover, the GRASP multi-pixel approach, which is successfully used in satellite retrievals (Dubovik et al., 2014; Chen et al., 2020), will certainly be explored in future tests. Although some preliminary promising results have been obtained (not presented here), the choice of optimal constraints and a detailed analysis of the benefits (or disadvantages) of its use deserves to be the main subject of further studies.
The work presented here aimed to complement the study of Torres et al. (2017) by the demonstration of the applicability of the GRASP-AOD approach to large aerosol optical depth observation datasets. In this regard, the study has proposed a real data validation based on 2.8 million GRASP-AOD retrievals using the AERONET aerosol optical depth observations from 30 AERONET sites for 20 years (1997–2016) in the range between 340–1020 nm. The study has also provided (see Sect. 2.2) several recommendations for applying the GRASP-AOD in operational processings. Specifically, we have proposed the assumption of climatological values for the refractive index in the retrieval and the criteria for quality control of the results.
The validation study has had two main points. First, the values of τf(500) obtained by the GRASP-AOD have been compared with the results obtained by the AERONET aerosol retrieval algorithm and SDA retrievals. We have also compared the retrievals between the AERONET aerosol retrieval algorithm and SDA. Second, the results of the aerosol size parameter retrieval by the GRASP-AOD have been compared with the AERONET aerosol retrieval algorithm.
The analysis of τf(500) has shown the robustness of the GRASP-AOD algorithm to discriminate between fine and coarse-mode extinction with a performance comparable to that obtained by the SDA. The comparison, with more than 2 million common retrievals between both methods, has shown a correlation coefficient of 0.997, a slope of 0.985 and an intercept of 0.006. The RMSE found was equal to 0.015, or 10 % in relative terms. The comparisons of the SDA and GRASP-AOD results with those obtained by the AERONET aerosol retrieval algorithm showed similar tendencies. The comparisons showed an excellent agreement for sites dominated by fine-mode aerosol with the slopes and correlation coefficients very close to 1. For those sites, the RMSRE among the three retrievals is between 5 %–10 %. Larger discrepancies for the retrievals of τf(500) appeared for sites with a predominant coarse mode, typically ranging between 10 % and 30 %. Moreover, filtering the retrievals by α<0.6, we have found that values of τf(500) estimated from AERONET aerosol retrievals are higher on average than from the SDA and GRASP-AOD, as observed in previous studies (see Eck et al., 2010 and Torres et al., 2017). This result is mainly related to the cutoff process used to define the two modes in the AERONET aerosol retrieval algorithm as explained by O'Neill et al. (2003) or in this study in Sect. 2.3.2. Furthermore, we have observed a second branch for comparisons of the GRASP-AOD versus AERONET aerosol retrieval algorithm and SDA versus AERONET aerosol retrieval algorithm when α<0.6, where values of the AERONET aerosol retrieval algorithm are much higher than for the other two retrievals. The reason has been associated with the three mode structures observed in some desert dust retrievals at sub-Saharan sites, as described in Sect. 4.1.2.
The validation of the aerosol size parameters has been carried out through the comparison of almost 150 000 common retrievals from the GRASP-AOD and AERONET aerosol algorithm. The analysis has confirmed the good capacity of the GRASP-AOD to accurately characterize the aerosol fine-mode size properties as indicated earlier by Torres et al. (2017). The utilization of a lower limit of τ(440)>0.2 was suggested for the GRASP-AOD application to assure the quality in the retrievals at Torres et al. (2017) and this limit has been confirmed here. A higher limit of τ(440)>0.4 hardly improved the results obtained, while it erased an enormous amount of data. In agreement with the study by Torres et al. (2017), the characterization of fine-mode size properties was better when fine mode was predominant. The threshold of α>1.2 has been identified for assuring the highest quality of the retrieval. In such conditions (τ(440)>0.2 and α>1.2), the comparison between the GRASP-AOD and AERONET aerosol retrieval algorithm showed an RMSE = 0.023 µm (equivalent to 13.9 % in relative terms) for RVf and an RMSE = 0.016 µm3/µm2 (equivalent to 26 % in relative terms) for CVf. Evidently, the characterization of fine mode would improve if radiance measurements (containing scattering information) were added in the retrieval process. For instance, the study by Sinyuk et al. (2020) recently showed that the uncertainty in RVf by the AERONET aerosol retrieval algorithm is less than 0.006 µm when similar thresholds as the ones imposed here are applied (τ(440)>0.2 and fine-mode-dominated sites). In this regard, the characterization of fine-mode properties by the GRASP-AOD application becomes useful when only aerosol optical depth observations are available.
In agreement with the analysis of Torres et al. (2017), the GRASP-AOD retrievals of the coarse-mode size distribution were less accurate. The analysis has shown very low sensitivity of the GRASP-AOD results to the small oscillations of RVc that occurred for individual observations of different aerosol types in different locations. Nonetheless, the general characterization of coarse-mode size distribution parameters was reasonable. The latter has been achieved using multiple initial guesses (based on climatological values) and choosing the results with the best fitting. Thus, the achieved agreement of the GRASP-AOD retrieval with the AERONET aerosol retrieval algorithm for the coarse mode showed an RMSE = 0.500 µm (RMSRE = 20 %) when τ(440)> 0.2. No improvement was found for lower values of Ångström exponent. Therefore, the site-by-site analysis has showed the RMSRE values mostly between 15 %–25 % regardless the dominant type of aerosol over the site. On the other hand, the comparison of CVc has given an RMSE = 0.044 µm (RMSRE = 30.5 %) when τ(440)>0.2. A clear decrease of the RMSRE to 24 % was observed in the situation with an Ångström exponent under 0.6 (coarse mode dominant).
The effective radius and total volume concentration computed from the GRASP-AOD retrievals have well agreed with the values provided by the AERONET aerosol retrieval algorithm. The RMSRE values for the effective radius and for the total volume concentration were 30 % and 25 %, respectively, when τ(440)>0.2. The analysis for different sites showed quite similar values of the relative errors around 25 % for the total volume concentration. On the other hand, the characterization of the effective radius at coarse-mode sites has presented slightly higher RMSRE values (between 30 %–40 %) than at sites with dominant fine mode (RMSRE values between 20 %–30 %).
Thus, the conducted studies showed that the GRASP-AOD performs similarly and somewhat better compares to established codes conventionally used for the analysis of only τ measurements. For example, comparisons to the AERONET aerosol retrieval algorithm show similar results for τf(500) than the ones exhibited by the SDA. The characterization of effective radius by the GRASP-AOD approach is comparable to that obtained by linear estimation techniques (relative errors around 30 % in both cases). However, the characterization of the total volume concentration by the GRASP-AOD approach is significantly better with a relative error of only 25 % for the GRASP-AOD compared to the 40 % obtained by linear estimation techniques (see Pérez-Ramírez et al., 2015). Moreover, the GRASP-AOD has provided an excellent characterization of the fine-mode size properties, especially in those cases when there is a sufficient aerosol load (τ(440)>0.2) and the fine mode is dominant (α>1.2). In addition, the GRASP-AOD application retrieves all the parameters at the same time, which can be considered an additional strength. Therefore, the description of the GRASP-AOD retrieval and all comparisons with other approaches discussed above demonstrate both the efficiency of the proposed methodology and an important novelty compared to previous algorithms.
Finally, Sect. 4.3 showed a promising perspective of improving the characterization of the coarse mode by adding available aureole measurements. In should be noted that a straightforward integration of such measurements into the GRASP-AOD established scheme is only possible given the flexibility of the GRASP code. The detailed consideration of adding aureole data into the GRASP-AOD retrieval as well as other innovative retrieval configurations possible with the GRASP algorithm, such as the utilization of the multi-pixel approach, are to be explored in future studies.
More detailed information and a free version of the GRASP code can be obtained at http://www.grasp-open.com/ (last access: 1 June 2021). The website also provides access to all products derived by GRASP activities. This includes all the data processed by the GRASP-AOD application, which goes beyond the data used in this work. Specifically, the GRASP-AOD data products analyzed in this study (30 AERONET sites in the period 1997–2016) have been saved and stored at https://doi.org/10.5281/zenodo.4010385 (Torres and Fuertes, 2020). These data have been processed with version v1.0.0 of the GRASP algorithm.
BT and DF carried out this study and the analysis. The results were discussed with other GRASP team members, especially with Oleg Dubovik. The manuscript was mainly written by BT with contributions by DF.
The authors declare that they have no conflict of interest.
The authors are grateful to Oleg Dubovik for valuable discussions and his help in improving the manuscript. Additional thanks to the rest of GRASP team, especially to Tatsiana Lapionak for her constant help concerning the use of the GRASP code. We would like to thank the Cloud Flight GmbH staff involved in the GRASP code activities and especially Daniel Marth for his guidance related to data processing.
This research has mainly been performed within the ESA funded project DIVA (Demonstration of an Integrated approach for the Validation and exploitation of Atmospheric missions). The authors also acknowledge the funding provided by the European Union (H2020-INFRAIA-2014-2015) under Grant Agreement No. 654109 (ACTRIS-2). We acknowledge the project Labex CaPPA (Chemical and Physical Properties of the Atmosphere), which is funded by the French National Research Agency (ANR) through the PIA (Programme d'Investissement d'Avenir) under contract “ANR-11-LABX-0005-01” and by the Regional Council “Nord Pas de Calais - Picardie” and the European Funds for Regional Economic Development (FEDER).
We thank the AERONET, Service National d’Observation PHOTONS/AERONET, INSU/CNRS, RIMA and WRC staff for their scientific and technical support. We acknowledge AERONET team members for calibrating and maintaining instrumentation and processing data. We would also like to thank the following principal investigators and their staff for maintaining the following sites: Brent Holben (Alta Floresta, Arica, GSFC, Kanpur, Lanai, Mexico City, Moldova, Mongu, Moscow, Solar Village), Didier Tanre (Banizoumbou, Dakar), Hong-Bin Chen (Beijing), John Vande Castle (Bonanza Creek), Paulo Artaxo (Cuiaba Miranda), Philippe Goloub (Beijing, Capo Verde, Lille), Andrew Clive Banks (Forth Crete), Lucas Alados-Arboledas (Granada), Jack Molinie (Guadeloupe), Rachel T. Pinker (Ilorin), Giuseppe Zibordi (Ispra), Sachchida Nand Tripathi (Kanpur), Ian Lau (Lake Argyle), Robert Frouin (Lanai) Valentin Duflot (Reunion - St. Denis), Arnon Karnieli (Sede Boker), Emilio Cuevas-Agullo (St. Cruz de Tenerife), Itaru Sano (Shirahama), Soo-Chin Liew (Singapore), Alkiviadis Bais (Thessaloniki) and Mikhail Panchenko (Tomsk).
This research has been funded by the ESA funded project DIVA (Demonstration of an Integrated approach for the Validation and exploitation of Atmospheric missions), the European Union, H2020-INFRAIA-2014-2015 (ACTRIS-2 (grant no. 654109)), and the project Labex CaPPA (Chemical and Physical Properties of the Atmosphere), which is funded by the French National Research Agency (ANR) through the PIA (Programme d'Investissement d'Avenir, grant no. ANR-11-LABX-0005-01) and by the Regional Council “Nord Pas de Calais – Picardie”, and the European Funds for Regional Economic Development (FEDER).
This paper was edited by Daniel Perez-Ramirez and reviewed by four anonymous referees.
Ångström, A.: Techniques of determining the turbidity of the atmosphere., Tellus, 13, 214–223, https://doi.org/10.1111/j.2153-3490.1961.tb00078.x, 1961. a
Baibakov, K., O'Neill, N. T., Ivanescu, L., Duck, T. J., Perro, C., Herber, A., Schulz, K.-H., and Schrems, O.: Synchronous polar winter starphotometry and lidar measurements at a High Arctic station, Atmos. Meas. Tech., 8, 3789–3809, https://doi.org/10.5194/amt-8-3789-2015, 2015. a
Barreto, A., Cuevas, E., Damiri, B., Guirado, C., Berkoff, T., Berjón, A. J., Hernández, Y., Almansa, F., and Gil, M.: A new method for nocturnal aerosol measurements with a lunar photometer prototype, Atmos. Meas. Tech., 6, 585–598, https://doi.org/10.5194/amt-6-585-2013, 2013. a
Barreto, Á., Cuevas, E., Granados-Muñoz, M.-J., Alados-Arboledas, L., Romero, P. M., Gröbner, J., Kouremeti, N., Almansa, A. F., Stone, T., Toledano, C., Román, R., Sorokin, M., Holben, B., Canini, M., and Yela, M.: The new sun-sky-lunar Cimel CE318-T multiband photometer – a comprehensive performance evaluation, Atmos. Meas. Tech., 9, 631–654, https://doi.org/10.5194/amt-9-631-2016, 2016. a
Benedetti, A., Reid, J. S., Knippertz, P., Marsham, J. H., Di Giuseppe, F., Rémy, S., Basart, S., Boucher, O., Brooks, I. M., Menut, L., Mona, L., Laj, P., Pappalardo, G., Wiedensohler, A., Baklanov, A., Brooks, M., Colarco, P. R., Cuevas, E., da Silva, A., Escribano, J., Flemming, J., Huneeus, N., Jorba, O., Kazadzis, S., Kinne, S., Popp, T., Quinn, P. K., Sekiyama, T. T., Tanaka, T., and Terradellas, E.: Status and future of numerical atmospheric aerosol prediction with a focus on data requirements, Atmos. Chem. Phys., 18, 10615–10643, https://doi.org/10.5194/acp-18-10615-2018, 2018. a, b
Bergamo, A., Tafuro, A. M., Kinne, S., De Tomasi, F., and Perrone, M. R.: Monthly-averaged anthropogenic aerosol direct radiative forcing over the Mediterranean based on AERONET aerosol properties, Atmos. Chem. Phys., 8, 6995–7014, https://doi.org/10.5194/acp-8-6995-2008, 2008. a
Boichu, M., Chiapello, I., Brogniez, C., Péré, J.-C., Thieuleux, F., Torres, B., Blarel, L., Mortier, A., Podvin, T., Goloub, P., Söhne, N., Clarisse, L., Bauduin, S., Hendrick, F., Theys, N., Van Roozendael, M., and Tanré, D.: Current challenges in modelling far-range air pollution induced by the 2014–2015 Bárðarbunga fissure eruption (Iceland), Atmos. Chem. Phys., 16, 10831–10845, https://doi.org/10.5194/acp-16-10831-2016, 2016. a, b
Bréon, F., Vermeulen, A., and Descloitres, J.: An evaluation of satellite aerosol products against Sunphotometer measurements, Remote Sens. Environ., 115, 3102–3111, https://doi.org/10.1016/J.RSE.2011.06.017, 2011. a
Carn, S. A., Krueger, A. J., Krotkov, N. A., Yang, K., and Levelt, P. F.: Sulfur dioxide emissions from Peruvian copper smelters detected by the Ozone Monitoring Instrument, Geophys. Res. Lett., 34, L09801, https://doi.org/10.1029/2006GL029020, 2007. a
Chen, C., Dubovik, O., Henze, D. K., Lapyonak, T., Chin, M., Ducos, F., Litvinov, P., Huang, X., and Li, L.: Retrieval of desert dust and carbonaceous aerosol emissions over Africa from POLDER/PARASOL products generated by the GRASP algorithm, Atmos. Chem. Phys., 18, 12551–12580, https://doi.org/10.5194/acp-18-12551-2018, 2018. a
Chen, C., Dubovik, O., Fuertes, D., Litvinov, P., Lapyonok, T., Lopatin, A., Ducos, F., Derimian, Y., Herman, M., Tanré, D., Remer, L. A., Lyapustin, A., Sayer, A. M., Levy, R. C., Hsu, N. C., Descloitres, J., Li, L., Torres, B., Karol, Y., Herrera, M., Herreras, M., Aspetsberger, M., Wanzenboeck, M., Bindreiter, L., Marth, D., Hangler, A., and Federspiel, C.: Validation of GRASP algorithm product from POLDER/PARASOL data and assessment of multi-angular polarimetry potential for aerosol monitoring, Earth Syst. Sci. Data, 12, 3573–3620, https://doi.org/10.5194/essd-12-3573-2020, 2020. a, b
Chew, B. N., Campbell, J. R., Salinas, S. V., Chang, C. W., Reid, J. S., Welton, E. J., Holben, B. N., and Liew, S. C.: Aerosol particle vertical distributions and optical properties over Singapore, Atmos. Environ., 79, 599–613, https://doi.org/10.1016/j.atmosenv.2013.06.026, 2013. a
Chu, D. A., Kaufman, Y. J., Ichoku, C., Remer, L. A., Tanré, D., and Holben, B. N.: Validation of MODIS aerosol optical depth retrieval over land, Geophys. Res. Lett., 29, MOD2-1–MOD2-4, https://doi.org/10.1029/2001GL013205, 2002. a
Chubarova, N. Y., Smirnov, A., and Holben, B. N.: Aerosol properties in Moscow according to 10 years of AERONET measurements at the meteorological observatory of Moscow state University, Geogr. Environ. Sustain, 4, 19–32, https://doi.org/10.24057/2071-9388-2011-4-1-19-32, 2011a. a
Chubarova, N. Y., Sviridenkov, M. A., Smirnov, A., and Holben, B. N.: Assessments of urban aerosol pollution in Moscow and its radiative effects, Atmos. Meas. Tech., 4, 367–378, https://doi.org/10.5194/amt-4-367-2011, 2011b. a
Derimian, Y., Karnieli, A., Kaufman, Y. J., Andreae, M. O., Andreae, T. W., Dubovik, O., Maenhaut, W., Koren, I., and Holben, B. N.: Dust and pollution aerosols over the Negev desert, Israel: Properties, transport, and radiative effect, J. Geophys. Res.-Atmos., 111, D05205, https://doi.org/10.1029/2005JD006549, 2006. a
Dubovik, O.: Optimization of Numerical Inversion in Photopolarimetric Remote Sensing, in: Photopolarimetry in Remote Sensing, edited by: Videen, G. Yatskiv, Y., and Mishchenko M., Kluwer Academic Publishers, Dordrecht, the Netherlands, 65–106, 2004. a
Dubovik, O. and King, M. D.: A flexible inversion algorithm for retrieval of aerosol optical properties from Sun and sky radiance measurements, J. Geophys. Res.-Atmos., 105, 20673–20696, https://doi.org/10.1029/2000JD900282, 2000. a, b, c, d, e
Dubovik, O., Smirnov, A., Holben, B. N., King, M. D., Kaufman, Y. J., Eck, T. F., and Slutsker, I.: Accuracy assessments of aerosol optical properties retrieved from Aerosol Robotic Network (AERONET) Sun and sky radiance measurements, J. Geophys. Res.-Atmos., 105, 9791–9806, https://doi.org/10.1029/2000JD900040, 2000. a, b
Dubovik, O., Holben, B., Eck, T. F., Smirnov, A., Kaufman, Y. J., King, M., Tanré, D., and Slutsker, I.: Variability of absorption and optical properties of key aerosol types observed in worldwide locations, J. Atmos. Sci., 59, 590–608, https://doi.org/10.1175/1520-0469(2002)059<0590:VOAAOP>2.0.CO;2, 2002a. a, b, c, d, e, f, g, h, i, j, k, l
Dubovik, O., Holben, B. N., Lapyonok, T., Sinyuk, A., Mishchenko, M., Yang, P., and Slutsker, I.: Non-spherical aerosol retrieval method employing light scattering by spheroids, Geophys. Res. Lett., 29, 1415, https://doi.org/10.1029/2001GL014506, 2002b. a, b
Dubovik, O., Sinyuk, A., Lapyonok, T., Holben, B. N., Mishchenko, M., Yang, P., Eck, T. F., Volten, H., Munoz, O., Veihelmann, B., Van Der Zande, W. J., Leon, J. F., Sorokin, M., and Slutsker, I.: Application of spheroid models to account for aerosol particle nonsphericity in remote sensing of desert dust, J. Geophys. Res.-Atmos., 111, D11208, https://doi.org/10.1029/2005JD006619, 2006. a, b, c, d
Dubovik, O., Herman, M., Holdak, A., Lapyonok, T., Tanré, D., Deuzé, J. L., Ducos, F., Sinyuk, A., and Lopatin, A.: Statistically optimized inversion algorithm for enhanced retrieval of aerosol properties from spectral multi-angle polarimetric satellite observations, Atmos. Meas. Tech., 4, 975–1018, https://doi.org/10.5194/amt-4-975-2011, 2011. a
Dubovik, O., Lapyonok, T., Litvinov, P., Herman, M., Fuertes, D., Ducos, F., Torres, B., Derimian, Y., Huang, X., Lopatin, A., Chaikovsky, A., Aspetsberger, M., and Federspiel, C.: GRASP: a versatile algorithm for characterizing the atmosphere, in: SPIE, vol. Newsroom, https://doi.org/10.1117/2.1201408.005558, 2014. a, b
Dubovik, O., Li, Z., Mishchenko, M. I., Tanré, D., Karol, Y., Bojkov, B., Cairns, B., Diner, D. J., Espinosa, W. R., Goloub, P., Gu, X., Hasekamp, O., Hong, J., Hou, W., Knobelspiesse, K. D., Landgraf, J., Li, L., Litvinov, P., Liu, Y., Lopatin, A., Marbach, T., Maring, H., Martins, V., Meijer, Y., Milinevsky, G., Mukai, S., Parol, F., Qiao, Y., Remer, L., Rietjens, J., Sano, I., Stammes, P., Stamnes, S., Sun, X., Tabary, P., Travis, L. D., Waquet, F., Xu, F., Yan, C., and Yin, D.: Polarimetric remote sensing of atmospheric aerosols: Instruments, methodologies, results, and perspectives, J. Quant. Spectrosc. Radiat. Transf., 224, 474–511, https://doi.org/10.1016/j.jqsrt.2018.11.024, 2019. a
Eck, T. F., Holben, B. N., Reid, J. S., Dubovik, O., Smirnov, A., O'Neill, N., Slutsker, I., and Kinne, S.: Wavelength dependence of the optical depth of biomass burning, urban, and desert dust aerosols, J. Geophys. Res.-Atmos., 104, 31333–31349, https://doi.org/10.1029/1999JD900923, 1999. a
Eck, T. F., Holben, B. N., Reid, J. S., O'Neill, N. T., Schafer, J. S., Dubovik, O., Smirnov, A., Yamasoe, M. A., and Artaxo, P.: High aerosol optical depth biomass burning events: A comparison of optical properties for different source regions, Geophys. Res. Lett., 30, 2035, https://doi.org/10.1029/2003GL017861, 2003. a
Eck, T. F., Holben, B. N., Dubovik, O., Smirnov, A., Goloub, P., Chen, H. B., Chatenet, B., Gomes, L., Zhang, X. Y., Tsay, S. C., Ji, Q., Giles, D., and Slutsker, I.: Columnar aerosol optical properties at AERONET sites in central eastern Asia and aerosol transport to the tropical mid-Pacific, J. Geophys. Res.-Atmos., 110, D06202, https://doi.org/10.1029/2004JD005274, 2005. a, b, c
Eck, T. F., Holben, B. N., Reid, J. S., Sinyuk, A., Dubovik, O., Smirnov, A., Giles, D., O'Neill, N. T., Tsay, S.-C., Ji, Q., Al Mandoos, A., Ramzan Khan, M., Reid, E. A., Schafer, J. S., Sorokine, M., Newcomb, W., and Slutsker, I.: Spatial and temporal variability of column-integrated aerosol optical properties in the southern Arabian Gulf and United Arab Emirates in summer, J. Geophys. Res.-Atmos., 113, D01204, https://doi.org/10.1029/2007JD008944, 2008. a
Eck, T. F., Holben, B. N., Reid, J. S., Sinyuk, A., Hyer, E. J., O'Neill, N. T., Shaw, G. E., Vande Castle, J. R., Chapin, F. S., Dubovik, O., Smirnov, A., Vermote, E., Schafer, J. S., Giles, D., Slutsker, I., Sorokine, M., and Newcomb, W. W.: Optical properties of boreal region biomass burning aerosols in central Alaska and seasonal variation of aerosol optical depth at an Arctic coastal site, J. Geophys. Res.-Atmos., 114, D11201, https://doi.org/10.1029/2008JD010870, 2009. a
Eck, T. F., Holben, B. N., Sinyuk, A., Pinker, R. T., Goloub, P., Chen, H., Chatenet, B., Li, Z., Singh, R. P., Tripathi, S. N., Reid, J. S., Giles, D. M., Dubovik, O., O'Neill, N. T., Smirnov, A., Wang, P., and Xia, X.: Climatological aspects of the optical properties of fine/coarse mode aerosol mixtures, J. Geophys. Res.-Atmos., 115, D19205, https://doi.org/10.1029/2010JD014002, 2010. a, b, c, d, e
Eck, T. F., Holben, B. N., Reid, J. S., Giles, D. M., Rivas, M. A., Singh, R. P., Tripathi, S. N., Bruegge, C. J., Platnick, S., Arnold, G. T., Krotkov, N. A., Carn, S. A., Sinyuk, A., Dubovik, O., Arola, A., Schafer, J. S., Artaxo, P., Smirnov, A., Chen, H., and Goloub, P.: Fog and cloud-induced aerosol modification observed by the Aerosol Robotic Network (AERONET), J. Geophys. Res.-Atmos., 117, D07206, https://doi.org/10.1029/2011JD016839, 2012. a, b
Giannakaki, E., Balis, D. S., Amiridis, V., and Zerefos, C.: Optical properties of different aerosol types: seven years of combined Raman-elastic backscatter lidar measurements in Thessaloniki, Greece, Atmos. Meas. Tech., 3, 569–578, https://doi.org/10.5194/amt-3-569-2010, 2010. a
Giles, D. M., Holben, B. N., Eck, T. F., Sinyuk, A., Smirnov, A., Slutsker, I., Dickerson, R. R., Thompson, A. M., and Schafer, J. S.: An analysis of AERONET aerosol absorption properties and classifications representative of aerosol source regions, J. Geophys. Res.-Atmos., 117, D17203, https://doi.org/10.1029/2012JD018127, 2012. a
Giles, D. M., Sinyuk, A., Sorokin, M. G., Schafer, J. S., Smirnov, A., Slutsker, I., Eck, T. F., Holben, B. N., Lewis, J. R., Campbell, J. R., Welton, E. J., Korkin, S. V., and Lyapustin, A. I.: Advancements in the Aerosol Robotic Network (AERONET) Version 3 database – automated near-real-time quality control algorithm with improved cloud screening for Sun photometer aerosol optical depth (AOD) measurements, Atmos. Meas. Tech., 12, 169–209, https://doi.org/10.5194/amt-12-169-2019, 2019. a, b
Gonzalez Ramos, Y. and Rodriguez, S.: A comparative study on the ultrafine particle episodes induced by vehicle exhaust: A crude oil refinery and ship emissions, Atmos. Res., 120–121, 43–54, https://doi.org/10.1016/j.atmosres.2012.08.001, 2013. a
Herber, A., Thomason, L. W., Gernandt, H., Leiterer, U., Nagel, D., Schulz, K.-H., Kaptur, J., Albrecht, T., and Notholt, J.: Continuous day and night aerosol optical depth observations in the Arctic between 1991 and 1999, J. Geophys. Res.-Atmos., 107, AAC 6-1–AAC 6-13, https://doi.org/10.1029/2001JD000536, 2002. a
Holben, B. N., Eck, T. F., Slutsker, I., Tanré, D., Buis, J. P., Setzer, A., Vermote, E., Reagan, J. A., Kaufman, Y. J., Nakajima, T., Lavenu, F., Jankowiak, I., and Smirnov, A.: AERONET – A federated instrument network and data archive for aerosol characterization, Remote Sens. Environ., 66, 1–16, https://doi.org/10.1016/S0034-4257(98)00031-5, 1998. a
Holben, B. N., Tanré, D., Smirnov, A., Eck, T. F., Slutsker, I., Abuhassan, N., Newcomb, W. W., Schafer, J. S., Chatenet, B., Lavenu, F., Kaufman, Y. J., Castle, J. V., Setzer, A., Markham, B., Clark, D., Frouin, R., Halthore, R., Karneli, A., O'Neill, N. T., Pietras, C., Pinker, R. T., Voss, K., and Zibordi, G.: An emerging ground-based aerosol climatology: Aerosol optical depth from AERONET, J. Geophys. Res.-Atmos., 106, 12067–12097, https://doi.org/10.1029/2001JD900014, 2001. a, b, c, d, e
Holben, B. N., Eck, T. F., Slutsker, I., Smirnov, A., Sinyuk, A., Schafer, J., Giles, D., and Dubovik, O.: AERONET's Version 2.0 quality assurance criteria, in: Proc. SPIE 6408, Remote Sensing of the Atmosphere and Clouds, 6408Q, https://doi.org/10.1117/12.706524, 2006. a
Holben, B. N., Kim, J., Sano, I., Mukai, S., Eck, T. F., Giles, D. M., Schafer, J. S., Sinyuk, A., Slutsker, I., Smirnov, A., Sorokin, M., Anderson, B. E., Che, H., Choi, M., Crawford, J. H., Ferrare, R. A., Garay, M. J., Jeong, U., Kim, M., Kim, W., Knox, N., Li, Z., Lim, H. S., Liu, Y., Maring, H., Nakata, M., Pickering, K. E., Piketh, S., Redemann, J., Reid, J. S., Salinas, S., Seo, S., Tan, F., Tripathi, S. N., Toon, O. B., and Xiao, Q.: An overview of mesoscale aerosol processes, comparisons, and validation studies from DRAGON networks, Atmos. Chem. Phys., 18, 655–671, https://doi.org/10.5194/acp-18-655-2018, 2018. a
Kabashnikov, V., Milinevsky, G., Chaikovsky, A., Miatselskaya, N., Danylevsky, V., Aculinin, A., Kalinskaya, D., Korchemkina, E., Bovchaliuk, A., Pietruczuk, A., Sobolewsky, P., and Bovchaliuk, V.: Localization of aerosol sources in East-European region by back-trajectory statistics, Int. J. Remote Sens., 35, 6993–7006, https://doi.org/10.1080/01431161.2014.960621, 2014. a
Kahn, R. A., Gaitley, B. J., Martonchik, J. V., Diner, D. J., Crean, K. A., and Holben, B.: Multiangle Imaging Spectroradiometer (MISR) global aerosol optical depth validation based on 2 years of coincident Aerosol Robotic Network (AERONET) observations, J. Geophys. Res.-Atmos., 110, D10S04, https://doi.org/10.1029/2004JD004706, 2005. a
Kazadzis, S., Veselovskii, I., Amiridis, V., Gröbner, J., Suvorina, A., Nyeki, S., Gerasopoulos, E., Kouremeti, N., Taylor, M., Tsekeri, A., and Wehrli, C.: Aerosol microphysical retrievals from precision filter radiometer direct solar radiation measurements and comparison with AERONET, Atmos. Meas. Tech., 7, 2013–2025, https://doi.org/10.5194/amt-7-2013-2014, 2014. a, b
King, M. D., Byrne, D. M., Herman, B. M., and Reagan, J. A.: Aerosol size distributions obtained by the inversion of spectral optical depth measurements, J. Atmos. Sci., 35, 2153–2167, https://doi.org/10.1175/1520-0469(1978)035<2153:ASDOBI>2.0.CO;2, 1978. a, b, c
Lenoble, J., Mishchenko, M., and Herman, M.: Absorption and scattering by molecules and particles. Aerosol Remote Sensing, in: Aerosol Remote Sensing, edited by: Lenoble, J., Remer, L., and Tanré, D., Springer, Heidelberg New York Dordrecht London, pp. 13–51, 2013. a
Levy, R. C., Mattoo, S., Munchak, L. A., Remer, L. A., Sayer, A. M., Patadia, F., and Hsu, N. C.: The Collection 6 MODIS aerosol products over land and ocean, Atmos. Meas. Tech., 6, 2989–3034, https://doi.org/10.5194/amt-6-2989-2013, 2013. a
Liu, L., Mishchenko, M. I., Geogdzhayev, I., Smirnov, A., Sakerin, S. M., Kabanov, D. M., and Ershov, O. A.: Global validation of two-channel AVHRR aerosol optical thickness retrievals over the oceans, J. Quant. Spectrosc. Radiat. Transf., 88, 97–109, https://doi.org/10.1016/j.jqsrt.2004.03.031, 2004. a
Lyamani, H., Olmo, F., and Alados-Arboledas, L.: Saharan dust outbreak over southeastern Spain as detected by sun photometer, Atmos. Environ., 39, 7276–7284, https://doi.org/10.1016/j.atmosenv.2005.09.011, 2005. a
Lyamani, H., Olmo, F. J., and Alados-Arboledas, L.: Physical and optical properties of aerosols over an urban location in Spain: seasonal and diurnal variability, Atmos. Chem. Phys., 10, 239–254, https://doi.org/10.5194/acp-10-239-2010, 2010. a
Mallet, P.-E., Pujol, O., Brioude, J., Evan, S., and Jensen, A.: Marine aerosol distribution and variability over the pristine Southern Indian Ocean, Atmos. Environ., 182, 17–30, https://doi.org/10.1016/j.atmosenv.2018.03.016, 2018. a
Mélin, F. and Zibordi, G.: Aerosol variability in the Po Valley analyzed from automated optical measurements, Geophys. Res. Lett., 32, L03810, https://doi.org/10.1029/2004GL021787, 2005. a
Mitchell, R. M., Forgan, B. W., Campbell, S. K., and Qin, Y.: The climatology of Australian tropical aerosol: Evidence for regional correlation, Geophys. Res. Lett., 40, 2384–2389, https://doi.org/10.1002/grl.50403, 2013. a
Mortier, A.: Tendances et variabilités de l’aérosol atmosphérique á l’aide du couplage Lidar/Photometre sur les sites de Lille et Dakar, PhD thesis, Université des Sciences et Technologies de Lille, Lille, 2013. a
Mortier, A., Goloub, P., Derimian, Y., Tanré, D., Podvin, T., Blarel, L., Deroo, C., Marticorena, B., Diallo, A., and Ndiaye, T.: Climatology of aerosol properties and clear-sky shortwave radiative effects using Lidar and Sun photometer observations in the Dakar site, J. Geophys. Res.-Atmos., 121, 6489–6510, https://doi.org/10.1002/2015JD024588, 2016. a
Nakajima, T., Tonna, G., Rao, R., Boi, P., Kaufman, Y., and Holben, B.: Use of sky brightness measurements from ground for remote sensing of particulate polydispersions, Appl. Opt., 35, 2672–2686, https://doi.org/10.1364/AO.35.002672, 1996. a
O'Neill, N. T., Eck, T. F., Smirnov, A., Holben, B. N., and Thulasiraman, S.: Spectral discrimination of coarse and fine mode optical depth, J. Geophys. Res.-Atmos., 108, AAC-8-1–AAC-8-15, https://doi.org/10.1029/2002JD002975, 2003. a, b, c, d, e, f, g, h, i
Panchenko, M., Terpugova, S., A. Dokukina, T., V. Polakin, V., and P. Yausheva, E.: Multiyear variations in aerosol condensation activity in Tomsk, Atmos. Ocean. Opt., 25, 251–255, https://doi.org/10.1134/S1024856012040100, 2012. a
Pérez-Ramírez, D., Ruiz, B., Aceituno, J., Olmo, F. J., and Alados-Arboledas, L.: Application of Sun/star photometry to derive the aerosol optical depth, Int. J Remote Sens., 29, 5113–5132, https://doi.org/10.1080/01431160802036425, 2008. a
Pérez-Ramírez, D., Lyamani, H., Olmo, F., and Alados-Arboledas, L.: Improvements in star photometry for aerosol characterizations, J. Aerosol Sci., 42, 737–745, https://doi.org/10.1016/j.jaerosci.2011.06.010, 2011. a
Pérez-Ramírez, D., Veselovskii, I., Whiteman, D. N., Suvorina, A., Korenskiy, M., Kolgotin, A., Holben, B., Dubovik, O., Siniuk, A., and Alados-Arboledas, L.: High temporal resolution estimates of columnar aerosol microphysical parameters from spectrum of aerosol optical depth by linear estimation: application to long-term AERONET and star-photometry measurements, Atmos. Meas. Tech., 8, 3117–3133, https://doi.org/10.5194/amt-8-3117-2015, 2015. a, b, c, d
Popovici, I. E., Goloub, P., Podvin, T., Blarel, L., Loisil, R., Unga, F., Mortier, A., Deroo, C., Victori, S., Ducos, F., Torres, B., Delegove, C., Choël, M., Pujol-Söhne, N., and Pietras, C.: Description and applications of a mobile system performing on-road aerosol remote sensing and in situ measurements, Atmos. Meas. Tech., 11, 4671–4691, https://doi.org/10.5194/amt-11-4671-2018, 2018. a
Prospero, J. M., Collard, F.-X., Molinié, J., and Jeannot, A.: Characterizing the annual cycle of African dust transport to the Caribbean Basin and South America and its impact on the environment and air quality, Global Biogeochem. Cy., 28, 757–773, https://doi.org/10.1002/2013GB004802, 2014. a
Randles, C. A., da Silva, A. M., Buchard, V., Colarco, P. R., Darmenov, A., Govindaraju, R., Smirnov, A., Holben, B., Ferrare, R., Hair, J., Shinozuka, Y., and Flynn, C. J.: The MERRA-2 Aerosol Reanalysis, 1980 Onward. Part I: System Description and Data Assimilation Evaluation, J. Climate, 30, 6823–6850, https://doi.org/10.1175/JCLI-D-16-0609.1, 2017. a
Remer, L. A., Tanré, D., Kaufman, Y. J., Ichoku, C., Mattoo, S., Levy, R., Chu, D. A., Holben, B., Dubovik, O., Smirnov, A., Martins, J. V., Li, R.-R., and Ahmad, Z.: Validation of MODIS aerosol retrieval over ocean, Geophys. Res. Lett., 29, MOD3-1–MOD3-4, https://doi.org/10.1029/2001GL013204, 2002. a
Remer, L. A., Kaufman, Y. J., Tanré, D., Mattoo, S., Chu, D. A., Martins, J. V., Li, R.-R., Ichoku, C., Levy, R. C., Kleidman, R. G., Eck, T. F., Vermote, E., and Holben, B. N.: The MODIS Aerosol Algorithm, Products, and Validation, J. Atmos. Sci., 62, 947–973, https://doi.org/10.1175/JAS3385.1, 2005. a
Román, R., Torres, B., Fuertes, D., Cachorro, V., Dubovik, O., Toledano, C., Cazorla, A., Barreto, A., Bosch, J., Lapyonok, T., González, R., Goloub, P., Perrone, M., Olmo, F., de Frutos, A., and Alados-Arboledas, L.: Remote sensing of lunar aureole with a sky camera: Adding information in the nocturnal retrieval of aerosol properties with GRASP code, Remote Sens. Environ., 196, 238–252, https://doi.org/10.1016/j.rse.2017.05.013, 2017. a
Rubin, J. I., Reid, J. S., Hansen, J. A., Anderson, J. L., Holben, B. N., Xian, P., Westphal, D. L., and Zhang, J.: Assimilation of AERONET and MODIS AOT observations using variational and ensemble data assimilation methods and its impact on aerosol forecasting skill, J. Geophys. Res.-Atmos., 122, 4967–4992, https://doi.org/10.1002/2016JD026067, 2017. a
Sayer, A. M., Hsu, N. C., Bettenhausen, C., and Jeong, M.-J.: Validation and uncertainty estimates for MODIS Collection 6 “Deep Blue” aerosol data, J. Geophys. Res.-Atmos., 118, 7864–7872, https://doi.org/10.1002/jgrd.50600, 2013. a
Schuster, G. L., Dubovik, O., and Holben, B. N.: Ångström exponent and bimodal aerosol size distributions, J. Geophys. Res.-Atmos., 111, D07207, https://doi.org/10.1029/2005JD006328, 2006. a
Sinyuk, A., Holben, B. N., Eck, T. F., Giles, D. M., Slutsker, I., Korkin, S., Schafer, J. S., Smirnov, A., Sorokin, M., and Lyapustin, A.: The AERONET Version 3 aerosol retrieval algorithm, associated uncertainties and comparisons to Version 2, Atmos. Meas. Tech., 13, 3375–3411, https://doi.org/10.5194/amt-13-3375-2020, 2020. a, b, c, d, e, f, g, h
Smirnov, A., Holben, B. N., Kaufman, Y. J., Dubovik, O., Eck, T. F., Slutsker, I., Pietras, C., and Halthore, R.: Optical properties of atmospheric aerosol in maritime environments, J. Atmos. Sci., 59, 501–523, https://doi.org/10.1175/1520-0469(2002)059<0501:OPOAAI>2.0.CO;2, 2002a. a
Smirnov, A., Holben, B. N., Slutsker, I., Giles, D. M., McClain, C. R., Eck, T. F., Sakerin, S. M., Macke, A., Croot, P., Zibordi, G., Quinn, P. K., Sciare, J., Kinne, S., Harvey, M., Smyth, T. J., Piketh, S., Zielinski, T., Proshutinsky, A., Goes, J. I., Nelson, N. B., Larouche, P., Radionov, V. F., Goloub, P., Krishna Moorthy, K., Matarrese, R., Robertson, E. J., and Jourdin, F.: Maritime Aerosol Network as a component of Aerosol Robotic Network, J. Geophys. Res.-Atmos., 114, D06204, https://doi.org/10.1029/2008JD011257, 2009. a, b
Solomon, S., Qin, D., Manning, M., Chen, Z., Marquis, M., Averyt, K., M., T., and Miller, H.: Technical Summary, in: Climate Change 2007: The Physical Science Basis Contribution of Working Group I to the Fourth Assessment Report of the Intergovernmental Panel on Climate Change, Cambridge University Press, Cambridge, UK, 2007. a
Stocker, T., Qin, D., Plattner, G., Tignor, M., Allen, S., and Boschung, J.: Technical Summary. In Climate Change 2013: The Physical Science Basis: Working Group I Contribution to the Fifth Assessment Report of the Intergovernmental Panel on Climate Change, Cambridge University Press, Cambridge, UK, https://doi.org/10.1017/CBO9781107415324.005, 2014. a
Tanré, D., Kaufman, Y., Holben, B., Chatenet, B., Karnieli, A., Lavenu, F., Blarel, L., Dubovik, O., Remer, L., and Smirnov, A.: Climatology of dust aerosol size distribution and optical properties derived from remotely sensed data in the solar spectrum, J. Geophys. Res.-Atmos., 106, 18205–18217, https://doi.org/10.1029/2000JD900663, 2001. a
Todd, M. C., Washington, R., Martins, J. V., Dubovik, O., Lizcano, G., M'Bainayel, S., and Engelstaedter, S.: Mineral dust emission from the Bodélé Depression, Northern Chad, during BoDEx 2005, J. Geophys. Res.-Atmos., 112, D06207, https://doi.org/10.1029/2006JD007170, 2007. a
Tonna, G., Nakajima, T., and Rao, R.: Aerosol features retrieved from solar aureole data: a simulation study concerning a turbid atmosphere, Appl. Opt., 34, 4486–4499, https://doi.org/10.1364/AO.34.004486, 1995. a, b
Torres, B. and Fuertes, D.: Dataset used for evaluation of GRASP-AOD algorithm (Version v1.0.0), Zenodo [data set], https://doi.org/10.5281/zenodo.4010385, 2020. a
Torres, B., Dubovik, O., Fuertes, D., Schuster, G., Cachorro, V. E., Lapyonok, T., Goloub, P., Blarel, L., Barreto, A., Mallet, M., Toledano, C., and Tanré, D.: Advanced characterisation of aerosol size properties from measurements of spectral optical depth using the GRASP algorithm, Atmos. Meas. Tech., 10, 3743–3781, https://doi.org/10.5194/amt-10-3743-2017, 2017. a, b, c, d, e, f, g, h, i, j, k, l, m, n, o, p, q, r, s, t, u, v, w, x, y, z, aa, ab, ac, ad, ae, af, ag, ah, ai, aj, ak, al
Van de Hulst, H.: Light Scattering by Small Particles, Structure of Matter Series, John Wiley & Sons, New York, USA, 1957. a
Veselovskii, I., Dubovik, O., Kolgotin, A., Korenskiy, M., Whiteman, D. N., Allakhverdiev, K., and Huseyinoglu, F.: Linear estimation of particle bulk parameters from multi-wavelength lidar measurements, Atmos. Meas. Tech., 5, 1135–1145, https://doi.org/10.5194/amt-5-1135-2012, 2012. a, b
Washington, R., Todd, M. C., Engelstaedter, S., Mbainayel, S., and Mitchell, F.: Dust and the low-level circulation over the Bodélé Depression, Chad: Observations from BoDEx 2005, J. Geophys. Res.-Atmos., 111, D03201, https://doi.org/10.1029/2005JD006502, 2006. a
Wehrli, C.: GAW–PFR: A network of Aerosol Optical Depth observations with Precision Filter Radiometers, in: WMO/GAW Experts workshop on a global surface based network for long term observations of column aerosol optical properties, Tech. rep., GAW Report No. 162, WMO TD No. 1287, 2005. a
Yamamoto, G. and Tanaka, M.: Determination of Aerosol Size Distribution from Spectral Attenuation Measurements, Appl. Opt., 8, 447–453, https://doi.org/10.1364/AO.8.000447, 1969. a
Although new standard instrument of the AERONET network, the Cimel-318T sun photometer, includes the 1640 nm channel, the traditional standard version (which covers most of the period from 1997–2016) included only seven wavelengths in the spectral range from 340 to 1020 nm (340, 380, 440, 500, 670, 870 and 1020 nm).
Recently, these numbers have been increased with the incorporation of new hybrid sky radiance measurements, which are performed only by the newest instruments (Sinyuk et al., 2020). Nevertheless, we have limited our validation study to almucantar retrievals, since the results of the hybrid scans were still under validation at the time of this study, and its use is still relatively small in the AERONET network.
The use of hybrid scans would allow one to reduce the solar zenith angle requirement to only 25∘, since the scattering angular range provided by these measurements is the same as the one that the almucantar provides at 50∘ (Sinyuk et al., 2020).
We have largely underlined the low sensitivity in the retrieval of RVf by using the GRASP-AOD algorithm when the coarse mode dominates, which is certainly the main reason to explain the poor correlation found here when α<0.6. However, it should also be noted that in such conditions there is also a larger uncertainty in the retrieval of RVf by the AERONET aerosol retrieval algorithm as pointed out in Sinyuk et al. (2020).
The results for the sites with less than fifty points (which includes several with no points at all) are not considered in the table: Banizoumbou, Capo Verde, Dakar, Guadeloupe , Lanai, Reunion - St. Denis and St. Cruz de Tenerife.
This result is logical from the retrieval point of view. Generally, adding new measures, which should also be fitted, degrades the fitting of existing measurements.