the Creative Commons Attribution 4.0 License.
the Creative Commons Attribution 4.0 License.
 | 21 Jun 2021
Integration of GOCI and AHI Yonsei aerosol optical depth products during the 2016 KORUS-AQ and 2018 EMeRGe campaigns
Hyunkwang Lim
Sujung Go
Myungje Choi
Seoyoung Lee
Chang-Keun Song
Yasuko Kasai
The Yonsei Aerosol Retrieval (YAER) algorithm for the Geostationary Ocean Color Imager (GOCI) retrieves aerosol optical properties only over dark surfaces, so it is important to mask pixels with bright surfaces. The Advanced Himawari Imager (AHI) is equipped with three shortwave-infrared and nine infrared channels, which is advantageous for bright-pixel masking. In addition, multiple visible and near-infrared channels provide a great advantage in aerosol property retrieval from the AHI and GOCI. By applying the YAER algorithm to 10 min AHI or 1 h GOCI data at 6 km×6 km resolution, diurnal variations and aerosol transport can be observed, which has not previously been possible from low-Earth-orbit satellites. This study attempted to estimate the optimal aerosol optical depth (AOD) for East Asia by data fusion, taking into account satellite retrieval uncertainty. The data fusion involved two steps: (1) analysis of error characteristics of each retrieved result with respect to the ground-based Aerosol Robotic Network (AERONET), as well as bias correction based on normalized difference vegetation indexes, and (2) compilation of the fused product using ensemble-mean and maximum-likelihood estimation (MLE) methods. Fused results show a better statistics in terms of fraction within the expected error, correlation coefficient, root-mean-square error (RMSE), and median bias error than the retrieved result for each product. If the RMSE and mean AOD bias values used for MLE fusion are correct, the MLE fused products show better accuracy, but the ensemble-mean products can still be useful as MLE.
- Article
(6265 KB) - Full-text XML
- BibTeX
- EndNote


Aerosols are generated by human activities and natural processes on local to global scales, and they have a lifetime of several to tens of days. Aerosols affect Earth's radiative energy balance by scattering and absorption (e.g., Cho et al., 2003). High aerosol loadings are persistent in Northeast Asia, including diverse aerosol types from various sources. Interactions among aerosols, clouds, and radiation in the atmosphere cause significant uncertainties in climate-model calculations (IPCC, 2013). Datasets produced by satellites have been widely used to reduce such uncertainties (Saide et al., 2014; Pang et al., 2018), but the systems must be accurately calibrated, verified, and consistent. Satellite data have been used extensively to retrieve aerosol optical properties (AOPs) over broad areas, with several algorithms having been developed. Satellites in low Earth orbit (LEO), including Sun-synchronous orbit (SSO), cover the entire Earth over one to several days, depending on instrument and orbit characteristics. Most aerosol retrieval algorithms have been developed for LEO satellites (Kim et al., 2007; Lyapustin et al., 2011a, b; Lee et al., 2012; Fukuda et al., 2013; Hsu et al., 2013; Levy et al., 2013; Garay et al., 2017, 2020). LEO instruments currently on board satellites include the Moderate Resolution Imaging Spectrometer (MODIS), Visible Infrared Imaging Radiometer Suite (VIIRS), Multi-angle Imaging SpectroRadiometer (MISR), and Cloud and Aerosol Imager (CAI) (Remer et al., 2005; Lyapustin et al., 2011a, b, 2018; Fukuda et al., 2013; Hsu et al., 2013; Levy et al., 2013; Garay et al., 2017, 2020; Jackson et al., 2013; Lee et al., 2017).
Representative algorithms developed for MODIS data include the Dark-Target (DT; Remer et al., 2005; Levy et al., 2013), Deep Blue (DB; Hsu et al., 2013; Sayer et al., 2014), and Multi-Angle Implementation of Atmospheric Correction (MAIAC; Lyapustin et al., 2011a, b) systems, which are also applied for the succeeding VIIRS (Sayer et al., 2018). In the DT algorithm, the 2.1 µm channel is used to estimate land-surface reflectance in the visible (VIS) region using empirical equations based on the normalized difference vegetation index (NDVI). The DT algorithm has improved surface-reflectance modeling through consideration of the fractional area of urbanization (Gupta et al., 2016). Ocean-surface reflectance is estimated using the Cox and Munk method (Cox and Munk, 1954), and AOPs over land and ocean are provided at spatial resolutions of 10 km×10 km and 3 km×3 km (Remer et al., 2013), respectively. The DB algorithm has an advantage over the DT algorithm in allowing aerosol data retrieval over bright surfaces. By using a shorter-wavelength channel, accuracy is improved over bright surfaces such as urban and desert areas, where surface reflectance was previously estimated by the minimum-reflectance method (MRM; Herman and Celarier, 1997; Koelemeijer et al., 2003; Hsu et al., 2004). Furthermore, with the improvement to Collection 6.1, land-surface reflectance can be estimated similarly to the DT method over densely vegetated regions (Sayer et al., 2019). In the case of VIIRS DB, aerosol retrieval over the ocean is also applied by the Satellite Ocean Aerosol Retrieval (SOAR) algorithm (Sayer et al., 2018). In the MODIS MAIAC system, surface reflectance is estimated by considering various images based on time-series analysis, with multi-angle observations based on up to 16 d data, and by applying the bidirectional reflectance distribution function (BRDF). Ocean-surface reflectance is determined using a Cox and Munk BRDF model similar to DT and VIIRS DB (Lyapustin et al., 2011a, b, 2018). The MISR observes Earth at nine different angles, providing a high degree of freedom for signals; consequently, retrievals yield estimates of aerosol type and shape. As with the MAIAC, multiple observations are used, with the estimation of land-surface reflectance involving bidirectional reflectance factors. Zhang et al. (2016) developed an aerosol retrieval algorithm that allows aerosol data retrieval over bright land surfaces using surface-reflectance ratios from the VIIRS.
Aerosol retrieval algorithms for geosynchronous Earth orbit (GEO) satellites have been developed, including the Geostationary Operational Environmental Satellite (GOES) series in the USA (Knapp et al., 2005), Meteosat series in Europe (Bernard et al., 2011), Himawari series in Japan (Yoon et al., 2007; Kim et al., 2008; Lim et al., 2018; Kikuchi et al., 2018; Yoshida et al., 2018; Gupta et al., 2019), and the Geostationary Korea Multi-Purpose Satellite (GEO-KOMPSAT, GK) series in South Korea (Kim et al., 2014, 2016; Choi et al., 2016, 2018; Kim et al., 2020). However, previously launched geostationary meteorological satellites had only a single, broadband VIS channel, with which it is difficult to retrieve AOPs other than aerosol optical depth (AOD) (Wang et al., 2003; Knapp et al., 2005; Kim et al., 2008, 2014, 2016; Bernard et al., 2011). However, the Geostationary Ocean Color Imager (GOCI) on board the GK-1 satellite – also known as the Communication, Ocean, and Meteorological Satellite (COMS) – has six VIS and two near-infrared (NIR) channels, which is advantageous for retrieving AOPs (Lee et al., 2010; Choi et al., 2016, 2018; Kim et al., 2017). Next-generation meteorological GEO satellite instruments – including the Advanced Himawari Imager (AHI), Advanced Baseline Imager (ABI), and Advanced Meteorological Imager (AMI) – have three to four VIS and NIR channels, which enable aerosol property retrieval with high accuracy (Lim et al., 2016, 2018; Kikuchi et al., 2018; Yoshida et al., 2018; Gupta et al., 2019). Kikuchi et al. (2018) and Yoshida et al. (2018) performed aerosol retrievals using the MRM and corrected reflectance using empirical equations. Gupta et al. (2019) extended the MODIS DT algorithm to GEO satellites and estimated visible surface reflectance using shortwave IR (SWIR) reflectance. Lim et al. (2018) retrieved the AOPs using both MRM and estimated surface reflectance from SWIR data (ESR) and presented the two merged products: an L2-AOD merged product and a reprocessed AOD produced by merging MRM and ESR surface reflectances. The MRM gives better accuracy over brighter surfaces such as urban areas, while the ESR method gives better accuracy over areas of dense vegetation (Lim et al., 2018). However, there is a critical surface reflectance at which aerosol signals disappear, depending on the single-scattering albedo (Kim et al., 2016). Over the ocean, both the MRM and ESR methods give high accuracy, but ESR results are robust with the Cox and Munk model.
The MRM requires more computational time than the ESR method to estimate surface reflectance, as it requires data for the past 30 d, and Lambertian equivalent reflectance (LER) needs to be calculated using a radiative transfer model. The ESR method estimates surface reflectance from the observed top-of-atmosphere (TOA) reflectance at 1.6 µm wavelength using empirical equations including the NDVI. The advantage of MRM is that stable surface-reflectance values can be obtained regardless of surface type. However, due to the influence of background aerosol optical depth (BAOD), surface reflectance tends to be overestimated, with satellite-derived AOD data thus being underestimated (Kim et al., 2014). On the other hand, the ESR method uses TOA reflectance at 1.6 µm wavelength to detect surface signals, which is less sensitive to fine particles and BAOD. However, when aerosols such as yellow dust with coarse particles are transported from the Taklamakan and Gobi deserts, the BAOD effect also applies to the ESR method. The ESR method is also more likely to be affected by snow surfaces than the MRM, as snow reduces reflectivity around the 1.6 µm wavelength (Negi and Kokhanovsky, 2011). The ESR method also has the disadvantage of giving noisy results over bright surfaces such as desert. However, its fast surface-reflectance estimation enables near-real-time retrieval based on the AHI Yonsei Aerosol Retrieval (YAER) algorithm.
Algorithms developed to date for LEO and GEO satellites have both advantages and disadvantages, depending on algorithm characteristics. Therefore, the MODIS team provides combined DT and DB AOD products (Levy et al., 2013; Sayer et al., 2014). In addition, several studies of the fusion of L2 products have been conducted (Levy et al., 2013; Sayer et al., 2014; Wei et al., 2019), with Bilal et al. (2017) obtaining reliable results from merged DT and DB products, as indicated by the NDVI in East Asia, and also robust products by simply averaging DT and DB without consideration of the NDVI.
AOP data fusion in East Asia may also be achieved using aerosol products of AMI, GOCI-2, and the Geostationary Environment Monitoring Spectrometer (GEMS) on board the GK-2A and GK-2B satellites launched by South Korea in 2018 and 2020, respectively, with accuracy over bright surfaces being improved by the GEMS aerosol product. It is also possible to obtain accurate aerosol loading height and AOPs, such as single-scattering albedo and fine-mode fraction, which have been difficult to obtain by fusion of L2 data and/or surface-reflectance data. If the trace-gas dataset retrieved from GEMS is used, it is possible to improve the aerosol type, with the retrieval of high-quality AOD data (Go et al., 2020).
Several studies have considered AOD data fusion, for which methods can be broadly classified into two types. First, the fusion of more than one AOD product may involve optimal interpolation (Xue et al., 2012), linear or second-order polynomial functions (Mélin et al., 2007), arithmetic or weighted means (Gupta et al., 2008), or maximum-likelihood estimates (MLEs) (Nirala, 2008; Xu et al., 2015; Xie et al., 2018). Second, in the absence of satellite-derived AOD products for the day of fusion, the geostatistical fusion method, universal kriging method (Chatterjee et al., 2010; Li et al., 2014), geostatistical inverse modeling (Wang et al., 2013), or spatial statistical data fusion (Nguyen et al., 2012) may be applied. These have the advantage that AOD can be estimated by integrating the spatial autocorrelation of AOD data even for pixels missing from the AOD products, although there is a disadvantage in not considering temporal correlations. The Bayesian maximum entropy (BME) method, taking into account temporal autocorrelation, has also been developed (Tang et al., 2016). BME methodology can estimate gap-filling pixels that are difficult to retrieve due to clouds, albeit with somewhat reduced accuracy. Gap-filled AOD using the BME method and satellite-derived AOD discontinuity arise from insufficient temporal sampling being available with the use of LEO satellites, resulting in a low fusion synergy. Previous studies mentioned above include data fusion based on kriging, reproduction of spectral AOD, and the BME method. Most of them focus on gap filling and rebuild AOD in areas not observed by MISR, MODIS, SeaWiFS, and so on (Wang et al., 2013; Tang et al., 2016). However in this study, we focused on optimized AOD products with improved accuracy at the retrieved pixels by ensemble-mean and MLE fusion. We compared these two products, one very simple one and the other with more elaborated processes. As previous AOD fusion studies improved the retrieved results mainly based on MLE or NDVI-based fusion studies (Bilal et al., 2017; Levy et al., 2013; Wei et al., 2019; Go et al., 2020), we tried to further improve them with an efficient approach to save computation time considering the nature of satellite data file size and users' near-real-time demand for data assimilation.
In this study, the GEO satellite dataset was used to resolve the temporal sampling issue for data fusion, while maintaining the spatiotemporal resolution retrieved from GEO satellites. We also attempted to estimate fused AOD products at 550 nm with higher accuracy in East Asia. The ensemble-mean and MLE methods were applied. Section 2 describes the two algorithms used in this study for AHI and GOCI. Section 3 mentions methods of fusion and systematic bias correction, and Sect. 4 performs validation of the fused products with the Aerosol Robotic Network (AERONET) instruments during two field campaigns: the Korea–United States Air Quality Study (KORUS-AQ) and the Effect of Megacities on the Transport and Transformation of Pollutants on Regional and Global Scales Study (EMeRGe).
2.1 AHI aerosol algorithm
The Himawari-8 and Himawari-9 satellites were launched by the Japanese Meteorological Agency (JMA) on 7 October 2014 and 2 November 2016, respectively. The AHI on board these satellites has 16 channels covering wavelengths of 0.47–13.3 µm and performs full-disk and Japan-area observations every 10 and 2.5 min, respectively, from GEO at 140.7∘ E longitude (Bessho et al., 2016). Visible and NIR observations are also performed at high spatial resolutions of 0.5–1.0 km, with SWIR to IR at 2 km, which have advantages in aerosol property retrieval and cloud masking.
Lim et al. (2018) developed the AHI YAER algorithm and provided two retrieval results with 6 km×6 km resolution based on MRM and ESR using SWIR data. Aerosol property retrieval using VIS channels requires accurate surface reflectance, for which MRM and ESR are useful, with the main difference between the two lying in the surface-reflectance estimation method.
The MRM applies the minimum-reflectance technique over both land and ocean (Lim et al., 2018), with surface reflectance being estimated by finding the minimum reflectance in each pixel over the past 30 d window, giving the LER (Kim et al., 2016; Lim et al., 2018). This method takes the bidirectional characteristics of surface reflectance into consideration by obtaining surface reflectance at each observation time over the 30 d search window. However, the method assumes that there is more than one clear day during the search window and that surface reflectance does not change; otherwise, it is affected by clouds and/or the BAOD (Kim et al., 2014, 2021).
According to the ESR method, land-surface reflectance in the VIS region is constructed from the TOA reflectance at 1.6 µm wavelength, based on the NDVI for SWIR and the fraction of urbanization and cropland (Levy et al., 2013; Gupta et al., 2016; Zhong et al., 2016; Lim et al., 2018). Ocean-surface reflectance is estimated from the Cox and Munk BRDF model (Cox and Munk, 1954). Chlorophyll a concentrations are considered in addition to chlorophyll a concentration data (https://www.eorc.jaxa.jp/ptree/userguide.html, last access: 27 May 2021) from the Japan Aerospace Exploration Agency (JAXA) (Murakami, 2016) and interpolated for the 10 min AHI intervals. For unretrieved pixels, the less contaminated chlorophyll a concentration value of 0.02 mg m−3 is used. Details of the methodology can be found in Lim et al. (2018).
2.2 GOCI aerosol algorithm
GOCI is an ocean color imager in GEO launched on board COMS in 2010 and observes the East Asia region at an hourly interval with 500 m×500 m resolution (Choi et al., 2012). It has eight bands in the VIS and NIR regions, which is advantageous for aerosol retrieval. Two versions of GOCI Yonsei aerosol algorithms have been developed, referred to as V1 and V2 (Lee et al., 2010; Choi et al., 2016, 2018). In the case of V1, surface reflectance is estimated by the MRM using LER for the past 30 d over land and the Cox and Munk BRDF model over oceans. In V2, ocean-surface reflectance is estimated by the same method, but land-surface reflectance is improved by using an accumulated long-term database. To minimize the impact of BAOD (the weakness of the MRM), a monthly surface-reflectance database was constructed using all of the LERs over the past 5 years, but it cannot reflect unexpected changes in surface conditions. However, a well-established climatological database allows aerosol property retrieval in near-real time with reasonable accuracy.
Satellite-derived AODs have different error characteristics depending on NDVI, scattering angle, and so on (Choi et al., 2016, 2018; Lim et al., 2018). Over oceans, ESR AODs are more accurate than MRM AODs. However, the accuracy of GOCI AODs was dependent on the NDVI values, which represent surface condition in terms of vegetation. V1 has a negative bias, and V2 has a mostly a positive bias (Choi et al., 2018). In this study, we developed optimal AOD products at 550 nm in East Asia by fusing four individual retrievals, i.e., two AHI aerosol products from the MRM and ESR methods and the two GOCI products: V1 and V2.
3.1 Spatiotemporal matching
The AHI and GOCI have different spatial pixel locations and temporal resolutions, so it is necessary to match their spatiotemporal resolutions before data fusion. GOCI and AHI AODs have the same spatial resolution of 6 km×6 km, but the two satellites are located at 128.2 and 140.7∘ E, respectively, at the Equator. Spatial pixel matching is therefore required. However, satellite-derived AOD represents total-column extinction, so AOD retrieved by the two sensors is not significantly affected by satellite position. To merge the different satellite spatial pixel coverages, the GOCI pixel was re-gridded to match AHI pixels for full-disk observation, with up to four GOCI AOD pixels being used, with average values considered representative of pixel values. If more than half of the AHI AOD pixels did not exist out of the maximum six AHI data per hour, it is regarded as cloud-contaminated pixels, and an additional cloud removal process is performed. This process applies to both the MRM and ESR method, to remove the AHI's additional cloud-contaminated pixels in products of both GOCI V1 and V2, which have a disadvantage in cloud masking due to their lack of IR channels. When three or more pixels were available for generating AHI data at 1 h intervals, hourly AOD values were estimated as the medians of pixel values.
3.2 Ensemble-mean method
Here, AMR represents AHI MRM AOD, AES represents AHI ESR AOD, GV1 represents GOCI V1 AOD, and GV2 represents GOCI V2 AOD. We performed data fusion using AMR, AES, GV1, and GV2 data within 1 h intervals for which additional cloud masking was performed. The ensemble mean is the mean of the ensemble member over a specific time. The ensemble members are AMR, AES, GV1, and GV2 based on two satellite instruments and two different surface-estimation methodologies. Table 1 provides the satellite-derived AOD used for ensemble-mean and MLE fusion.
Table 1Satellite dataset used for the fusion products. Four entries F1–F4 and three entries FM1–FM3 represent ensemble-mean fusion and MLE fusion products.

a NRT: near-real time. b Maximum-likelihood estimation.
Fusion was performed only when a pixel of an ensemble member was used for all fusions. Fusion 1 (F1) included the two AHI products of AMR and AES, as well as two GOCI products of GV1 and GV2. Fusion 2 (F2) involved the calculation of the YAER algorithm by the fusion of AES and GV2, both of which have the advantage of producing data in near-real time. Fusion 3 (F3) merged AMR and AES to estimate AOD over a wide area. Fusion 4 (F4) involved a comparison with F1 to determine how accuracy varied with a decreasing number of ensemble members, as summarized in Table 1.
3.3 MLE method
Similarly, FM1, FM2, and FM3 are the result of MLE fusion, corresponding to F1, F2, and F3 as in ensemble mean, respectively (see Table 1).
The MLE method provides a means of weighting and averaging based on errors evaluated with AERONET ground-based measurements (Nirala, 2008; Xu et al., 2015; Xie et al., 2018).
This method employs the following equations:
where represents the fused AOD; τi,k represents the mean AOD at grid point i from the satellite-derived AOD product k, where k is the index for different satellite-derived AOD products for fusion; Ri,k represents the root-mean-square error (RMSE) at grid point i for the satellite-derived AOD product k; N is the number of all AOD data; gi represents the mean of ground-based AOD at grid point i from AERONET (collocated temporal mean); si,k represents the mean of satellite-derived AOD products (k) at grid points of AERONET (collocated spatial mean); and M is the number of pairs of si,k and gi.
For RMSE estimation, bias correction, validation, and error estimation (details in Sect. 5), AERONET Version 3 Level 2.0 aerosol products were used for ground truth (Giles et al., 2019; Smirnov et al., 2000; Holben et al., 2001). The RMSE and bias correction value for each satellite product (details in Sect. 3.4) required for MLE fusion were calculated through comparison with AERONET from April 2018 to March 2019 excluding the EMeRGe period. The number of AERONET sites used for validation and error estimation in this study was 35 during the KORUS-AQ campaign and 22 during the EMeRGe campaign for AHI and GOCI products.

Figure 1RMSE according to NDVI (color), observation time, and satellite AODs (squares and diamonds represent RMSE for AOD greater than 0.5 and less than or equal to 0.5, respectively) during April 2018 to March 2019 excluding the EMeRGe campaign. Colors represent different NDVI bins.
Satellite observation can cover wide areas, but the ground observation instrument cannot cover all satellite-observed areas. Therefore, a RMSE model was constructed for AOD, time, and NDVI through comparative validation with AERONET observation as shown in Fig. 1. For MLE over wide areas without ground measurements, the calculated RMSE from AOD, time, and NDVI bins was applied for every satellite pixel. We excluded points where AOD differences with respect to AERONET data (dAOD) were >2 standard deviations (SD) to remove outliers and to consider only the more stable RMSE values. According to Fig. 1, if the AOD is less than 0.5, RMSE is about 0.1 with respect to all NDVI bins, but if the AOD is greater than 0.5, the overall RMSE value becomes large. All products excluding AES show large variations for high NDVI and high AOD bins as shown as the red square in Fig. 1, especially for 02:00 and 05:00 UTC in two GOCI products and 00:00 UTC in the AMR product. This is because the two GOCI products and AMR are relatively less accurate for densely vegetated areas, along with sampling issues.
3.4 Bias correction
AOD follows a lognormal distribution (Sayer and Knobelspiesse, 2019), but dAOD for each satellite product follow a Gaussian distribution. The quantile–quantile (Q–Q) plot is a graphical statistical technique that compares two probability distributions with each other. The x axis represents the quantile value of the directly calculated sample, and the y axis represents the Z score. Here, the Z score is a dimensionless value that makes a statistically Gaussian distribution and shows where each sample is located on the standard deviation. That is, a Z score of 1 and 2 represents 1 and 2 SD, respectively. In addition, if the Q–Q plot shows a linear shape, the sample is regarded as following a Gaussian distribution.

Figure 2Q–Q plot for the difference between AERONET AOD and AMR (yellow), AES (orange), GV1 (purple), and GV2 (dark blue) AOD. The black solid line and dotted line represent 1 and 2σ, respectively.
Figure 2 shows dAOD divided by SD analyzed for each satellite product for the period from April 2018 to March 2019, excluding the EMeRGe campaign, which shows a similar pattern to the standard Gaussian distribution. However, if the theoretical quantile values are greater than 0.5, then the sample quantile values are smaller than the standard Gaussian values. Also, when the theoretical quantile is less than 0.5, the opposite results are shown. Thus, the sample quantiles are more skewed at both sides than the theoretical quantile, but the respective satellite product is assumed to follow the Gaussian distribution.
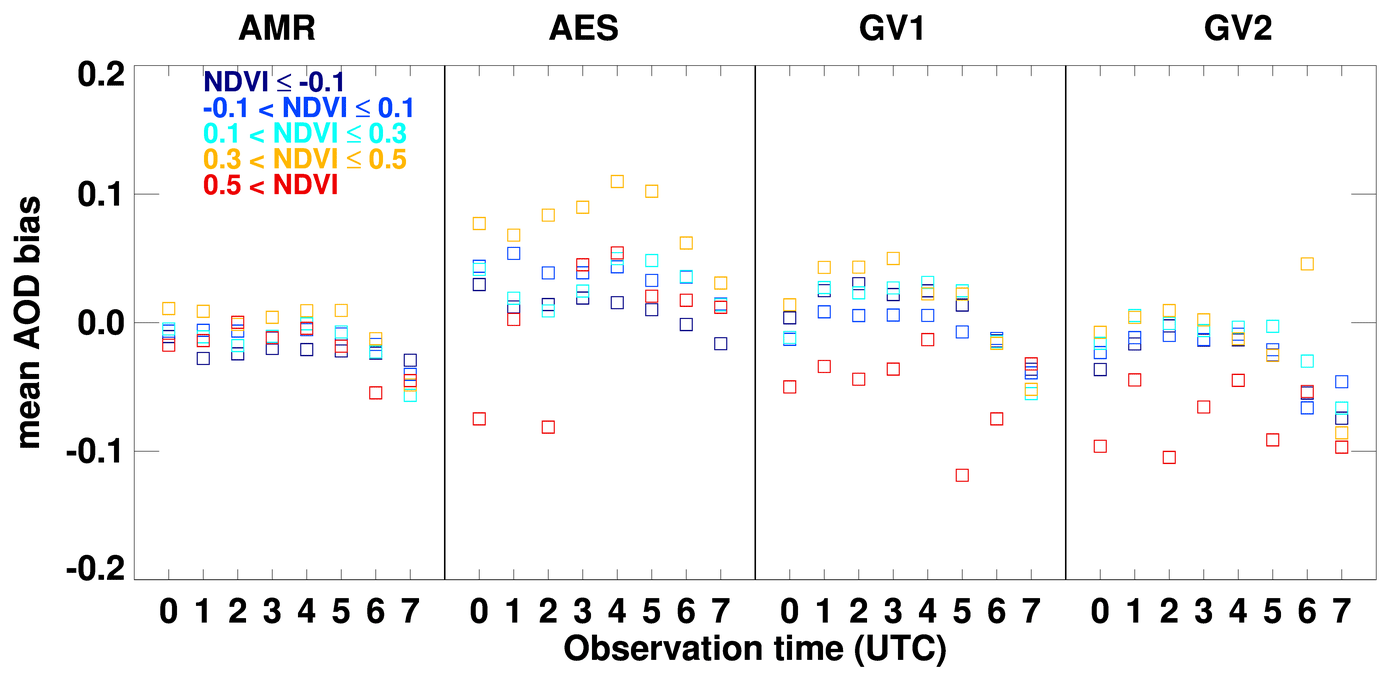
Figure 3Systematic bias-correction values for NDVI groups and temporal bins for each satellite product from Gaussian fitting analysis used in MLE fusion. Colors represent different NDVI bins.
The bias center for each satellite product was calculated differently for time and NDVI bins through Gaussian fitting in Fig. 3 of the dAOD divided by SD (except for 2 SD and higher), and it was subtracted from the respective product for correction. Data beyond 2 SD of dAOD were excluded to prevent a change in bias trends due to AOD errors caused by cloud shadows and cloud contamination. This process was performed before applying the MLE method, which allows compensation for systematic bias, which is difficult to obtain directly in MLE.
3.5 Evaluation of aerosol products during two field campaigns
The performance of the respective satellite product and fused products was analyzed in two field campaigns: the KORUS-AQ of 1 May 2016 to 12 June 2016 (https://www-air.larc.nasa.gov/missions/korus-aq/, last access: 27 May 2021) and the EMeRGe of 12 March 2018 to 8 April 2018 (https://www.halo.dlr.de/science/missions/emerge/emerge.html, last access: 27 May 2021). KORUS-AQ was an international multi-organization mission to observe air quality across the Korean Peninsula and surrounding waters, led by the US National Aeronautics and Space Administration (NASA) and the Korean National Institute of Environmental Research (NIER) (Crawford et al., 2021). EMeRGe aimed to investigate experimentally the patterns of atmospheric transport and transformation of pollution plumes originating from Eurasia, tropical and subtropical Asian megacities, and other major population centers. GEO satellite data played an important role in these campaigns, for example in data assimilation for chemical transport models and tracking aerosol plumes (Saide et al., 2014, 2010; Pang et al., 2018).
In this study, we used satellite-derived GOCI and AHI AODs, with a spatial resolution of 6 km×6 km and temporal resolutions of 1 h and 10 min, respectively. Spatiotemporal correlation between satellite-derived AOD and AERONET AOD involved data averaged over all satellite pixels within a 25 km radius of the AERONET site and AERONET AOD averaged over ±30 min from the satellite observation time. As validation metrics, Pearson's correlation coefficient, the median bias error (MBE), the fraction (percent) within the expected error of MODIS DT (EE), and the Global Climate Observing System requirement for AOD (GCOS; GCOS, 2011) were applied. The accuracy requirement of GCOS for satellite-derived AOD at 550 nm is 10 % or 0.03, whichever is larger. The EE provided by the MODIS DT algorithm (EE as AOD; Levy et al., 2010) was used for consistent comparison with previous studies.
Table 2Validation statistics of the respective satellite product during the KORUS-AQ and the EMeRGe campaign.
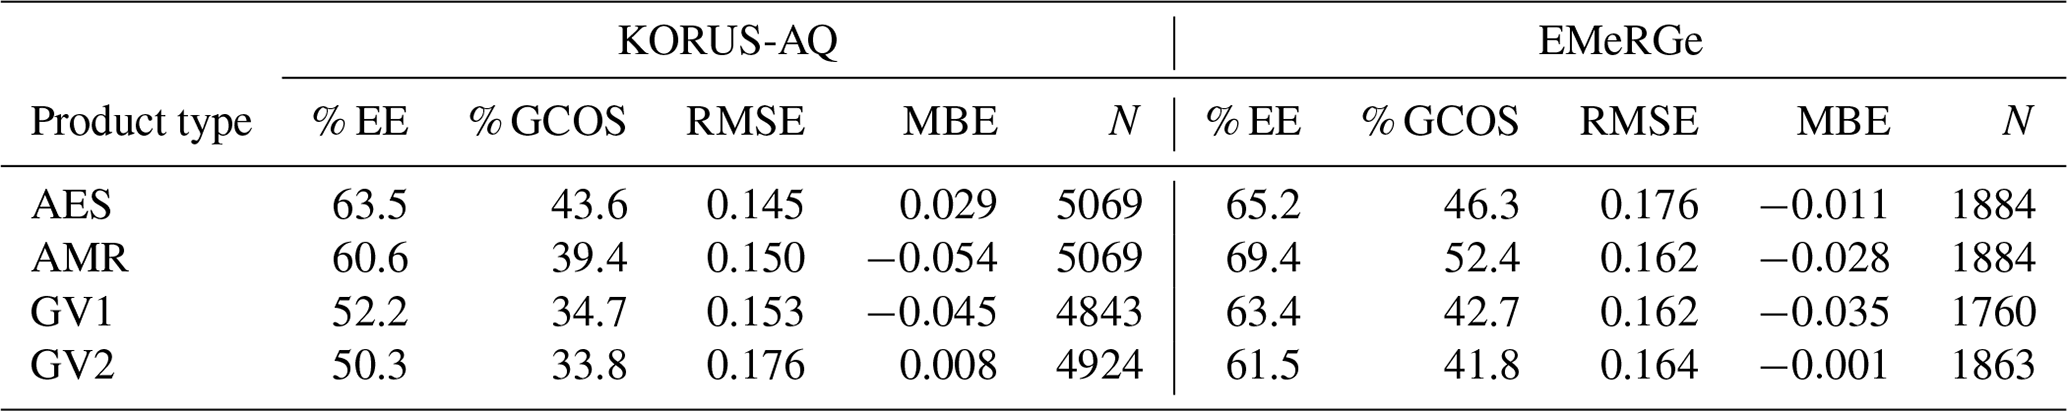
Table 2 shows the validation metrics of the respective product during the two field campaigns. The collocation points for validation with AERONET of two AHI and two GOCI products were not significantly different. Percent EE (% EE) and percent GCOS (% GCOS) of AES and AMR showed better accuracy than GV1 and GV2 during the KORUS and the EMeRGe periods. In terms of MBE, GV2 is 0.008 and −0.001, which shows during the KORUS-AQ and the EMeRGe periods close to zero. Additionally, further analyses of the respective satellite product are carried out along with fused products in Sect. 5.
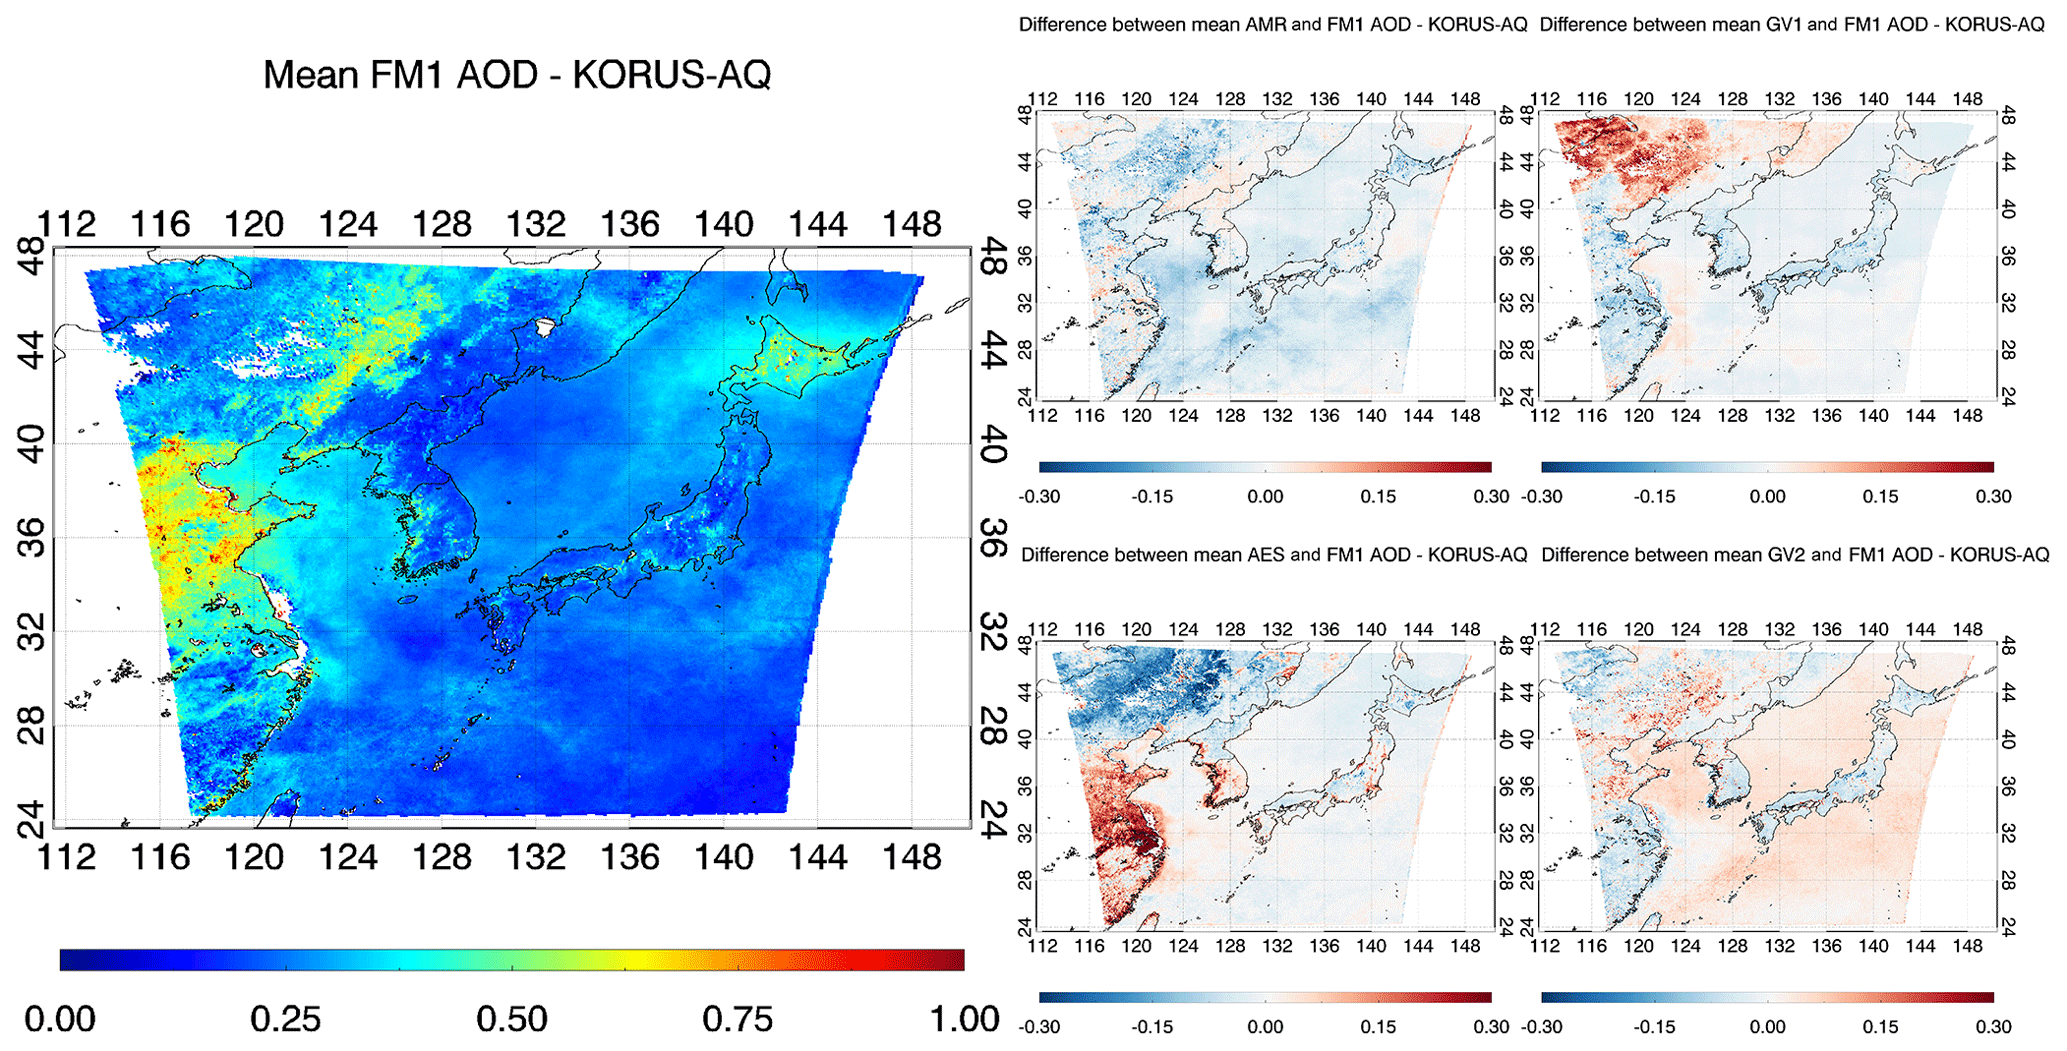
Figure 4The average AOD of (a) FM1 (AMR, AES, GV1, and GV2) during the KORUS-AQ. The difference of mean (b) AMR, (c) AES, (d) GV1, and (e) GV2 AODs with respect to mean representative (FM1) AOD. Figures generated with Interactive Data Language (IDL) version 8.8.0.
Figure 4a shows the average AOD of FM1 (MLE method with all products) during the KORUS-AQ period, and Fig. 4b–e show the respective difference of the average AOD of AMR, AES, GV1, and GV2 with respect to FM1. FM1 was selected as the representative fused product as FM1 used all four satellite-derived products for fusion with bias correction. The result of the comparison with the respective satellite product (Fig. 4b–e) shows different features. AMR shows a negative bias over the ocean but shows similar results to FM1 over land, while AES shows a different tendency in northern and southern China. GV1 tends to show the opposite pattern to AES, and GV2 shows a positive bias over the ocean and results in a similar pattern to FM1 over the land. In the west of the Korean Peninsula, AES AOD has a positive offset compared to FM1. Although the AES algorithm considers the fraction of urbanization, there is still a tendency to have positive AOD offsets. The main reason why AES results show different patterns is the different estimation process of the land surface reflectance from that of other products.
On the other hand, in GV1 the AOD over the Manchurian region has a positive offset compared to FM1. This is because the aerosol signal is small over bright surface, making it difficult to retrieve aerosol properties. These features tend to be alleviated in GV2, where the surface reflectance and cloud removal process were improved.

Figure 5Same as Fig. 4 but for the EMeRGe campaign.
Figure 5 shows the same result as Fig. 4 except for the EMeRGe period. The AMR and AES AODs appeared high in northern China, which is thought to be the snow-contaminated pixels. The EMeRGe period was in March–April, when northern China is more covered by snow compared to the KORUS-AQ period in May–June. On the other hand, for GV1 and GV2 the effect of overestimation with snow-contaminated pixels is relatively small, as their snow masking is performed well. However, for the KORUS-AQ period, it seems that the GV1's overestimation of AOD in northern China still remains. Since this analysis (Figs. 4 and 5) is for the fusion between the three MRM results and one ESR result, the average field difference is naturally the largest in AES which uses the ESR method.
For the characteristics of the average AOD for the two campaign periods, high AODs during the KORUS-AQ period were found in eastern China and Hokkaido as wildfires from Russia were transported to Hokkaido (Lee et al., 2019). Meanwhile, during the EMeRGe period, high AOD is shown over the Yellow Sea as aerosols were transported from China to the Korean Peninsula through the west coast, contrary to the KORUS-AQ period. Overall, the average AODs for the EMeRGe are less smooth than those of the KORUS-AQ period. This is because the EMeRGe period was shorter than the KORUS-AQ period, and the retrieval accuracy was lower due to the bright surface.
5.1 Validation for fused AOD products with AERONET
The spatiotemporal matching method between fused AOD and AERONET was performed as mentioned above in Sect. 3.5, and the statistics indices used for verification are also the same. Validation indices of fused products with AERONET AOD during the two campaign periods are summarized in Table 3. During the KORUS-AQ, fused AODs have better accuracy than the respective satellite product in terms of % EE and % GCOS. The % EE and % GCOS of AES, which showed the best accuracy among the respective products, are 63.5 % and 43.6 %, respectively, which are poorer than the worst accuracy of the fused AOD. All RMSE has been improved except for FM2. The RMSE of FM2 is higher than the RMSE of the respective satellite product by 0.001. Although all MBEs show different patterns, the deviation of the fused products tends to be smaller. GV2 and F2 show MBE of 0.008, close to zero.
Table 3Validation statistics of the ensemble-mean fusion (F1–F4) and MLE fusion (FM1–FM4) AOD during two field campaigns (left: KORUS-AQ; right: EMeRGe).
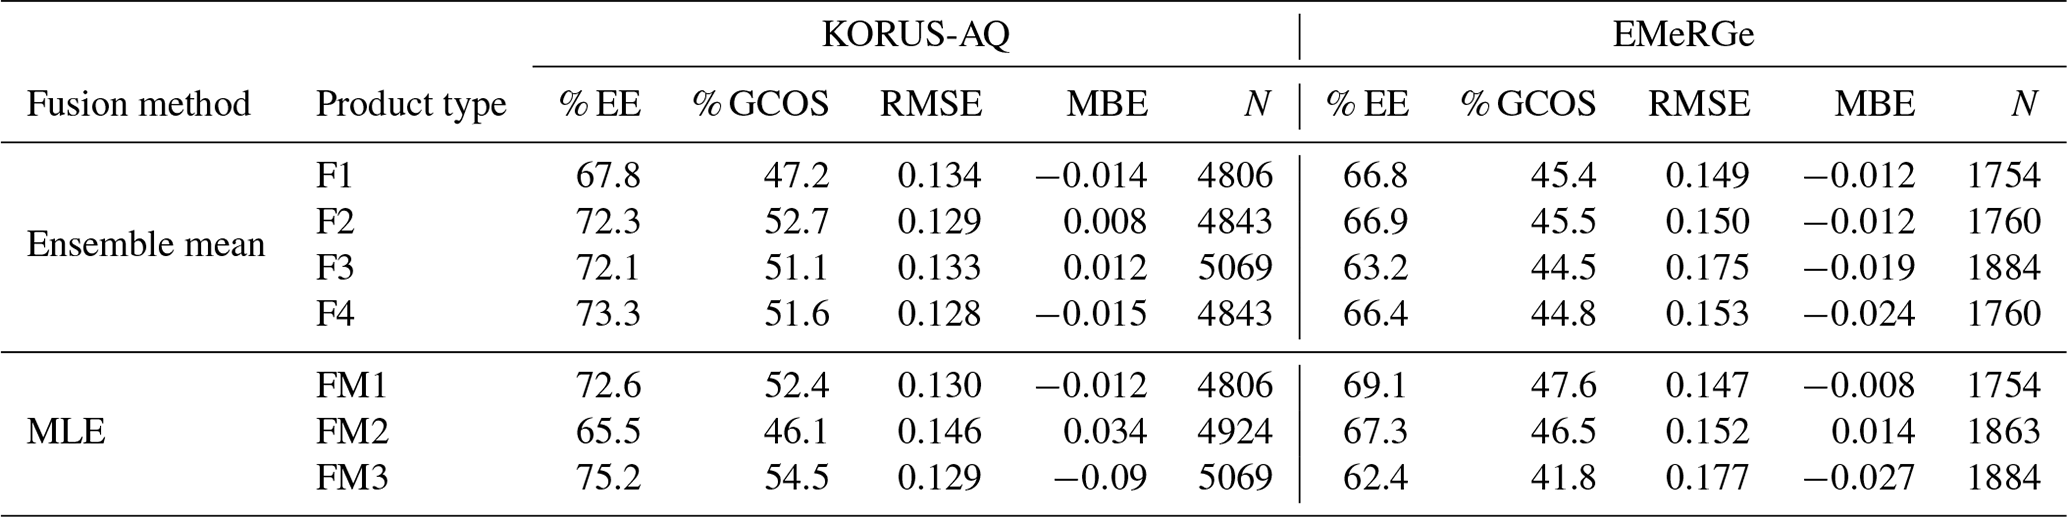
Next, % EE for the EMeRGe period exceeded 60.0, with AMR having the best accuracy of 69.4. Likewise, % GCOS was also the highest, with 52.4, which showed better accuracy than the fused product. In terms of MBE, GV2 was the best, with −0.001. The fused products did not have the best statistical values, but they show overall better statistical values.
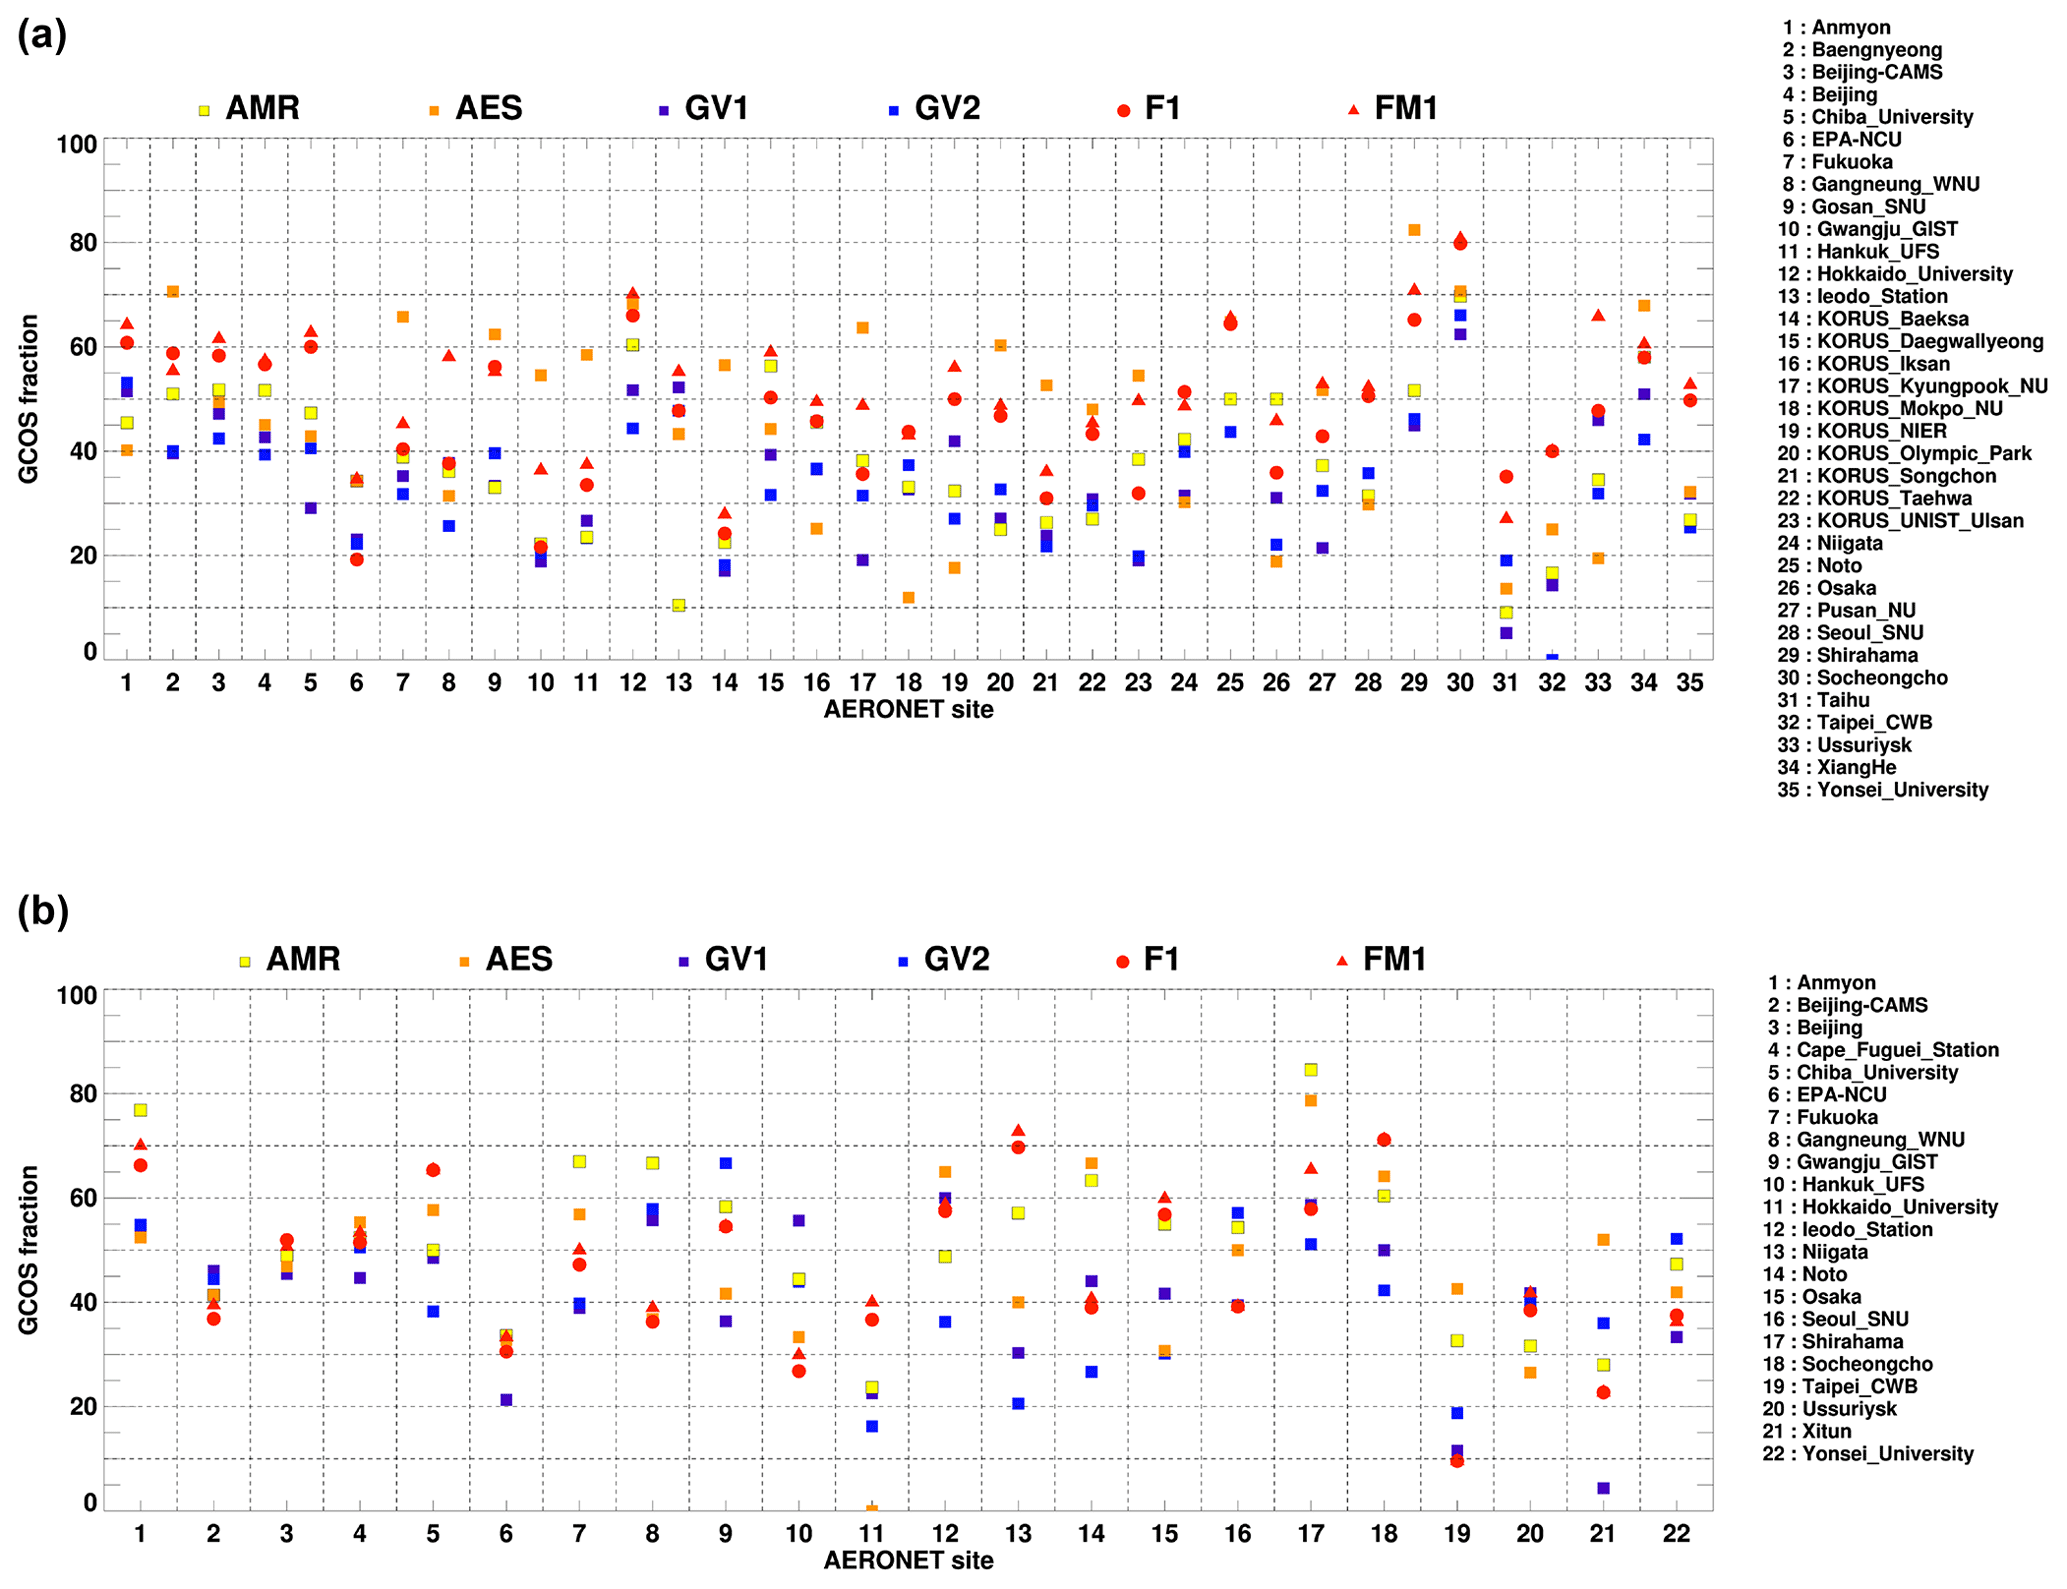
Figure 6Comparison of the GCOS fraction for the respective satellite (AMR, AES, GV1, and GV2), ensemble-mean fusion (F1), and MLE fusion (FM1) during the (a) KORUS-AQ and (b) EMeRGe campaign. Colors represent different aerosol products.
Figure 6 shows the % GCOS for the respective satellite product and fused products at each validation site during each campaign. In Fig. 6a, for the KORUS period, F1 and FM1 show the highest % GCOS at 20 sites out of 35. Other than the fused result, AES shows the highest % GCOS at 13 sites, which are mostly dense vegetation area and coastal sites. On the other hand, during the EMeRGe period the % GCOS of fused products was highest at 7 sites out of 22, while the respective satellite product showed similar proportions at the rest of the sites.
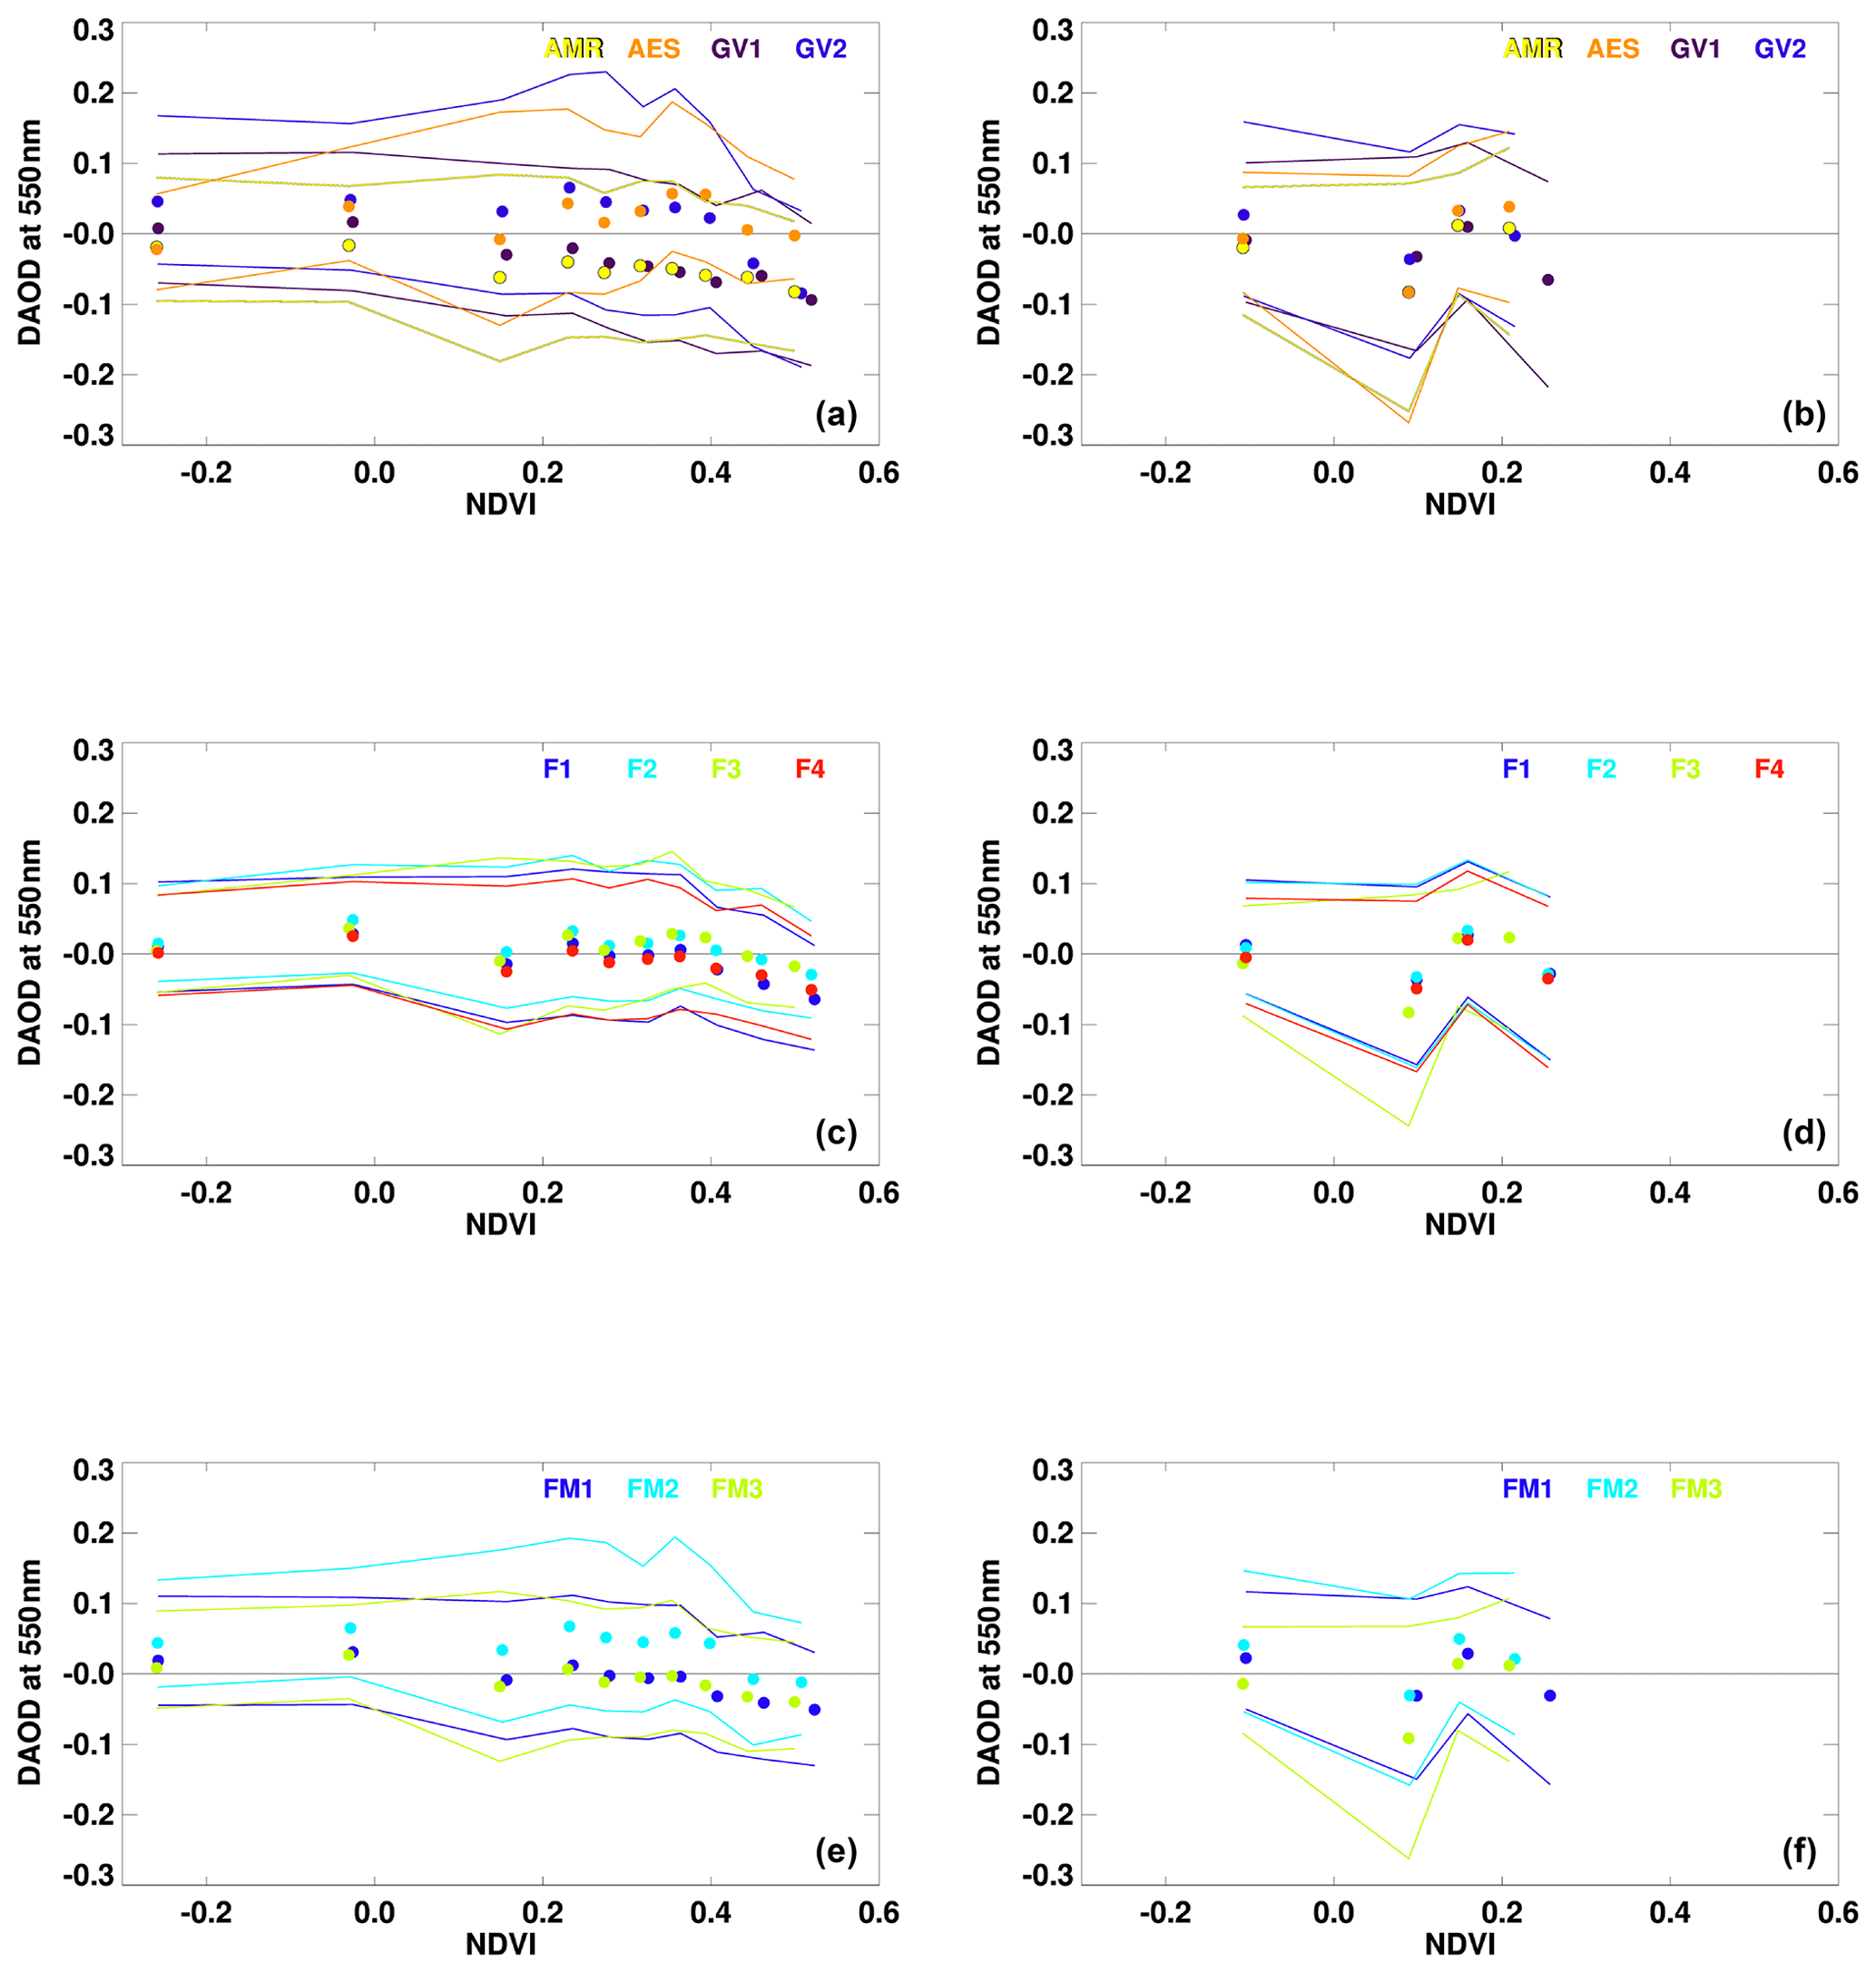
Figure 7Difference between the (a, b) respective satellite, (c, d) ensemble mean, and (e, f) MLE and AERONET AOD in terms of NDVI during the KORUS-AQ (a, c, e) and the EMeRGe (b, d, f) campaigns. Each point and solid line represents the median and 1σ (16th and 84th percentile) of 500 (for the KORUS-AQ) and 400 (for the EMeRGe) collocated data points in terms of NDVI values, respectively. Colors represent different aerosol products.
5.2 Error estimation
Differences between satellite products and dAOD values were analyzed in terms of NDVI and observation times (Fig. 7). Figure 7a and b show the respective satellite product, Fig. 7c and d the ensemble-mean product, and Fig. 7e and f the MLE fusion results, with each filled circle representing the mean of 500 and 400 collocated data points sorted in terms of NDVI for the KORUS-AQ and the EMeRGe campaigns, respectively. Figure 7a shows different biases for each satellite product, with AMR and GV1 being negative and AES and GV2 being positive. The errors are close to zero for both the ensemble-mean and MLE products except for FM2 as a result of the fusion process.
When the NDVI is small, the mean AOD bias for GV2 dAOD is close to zero, but when the NDVI is large, the mean AOD bias is negative as shown in Fig. 3. The bias correction effect of GV2 shows a small effect for small NDVI bins and a large effect for large NDVI bins. In fact, the collocated dAODs of FM2 are close to zero when the NDVI bins are greater than 0.4 (in Fig. 7a).
During the EMeRGe campaign (right column, Fig. 7), the two AHI and two GOCI products show negative biases, and even the ensemble-mean results have negative biases. The ensemble mean does not include any bias correction, meaning that the error characteristics of each original satellite product are intact. The MLE products display improved biases in terms of NDVI, which are close to zero because the bias was corrected for in the MLE process.
During the EMeRGe period, the collocated dAOD values at NDVI around 0.1 have a negative value for all satellite-derived products (especially AHI products), and GV1 has a negative value for bins where NDVI is greater than 0.2. The fused products tend to have error close to zero except for F3 and FM3. In terms of F3, the collocated dAOD value around 0.1 of the NDVI bin has negative values for both AMR and AES, so the collocated dAOD of F3 remain negative. The mean AOD bias values for FM3, AMR, and AES (in Fig. 3) are close to zero for NDVI at around 0.1, so the bias correction effect is small. This can be explained by the fact that the collocated dAOD for NDVI at around 0.2 during the EMeRGe period is closer to zero in FM3 than in F3.
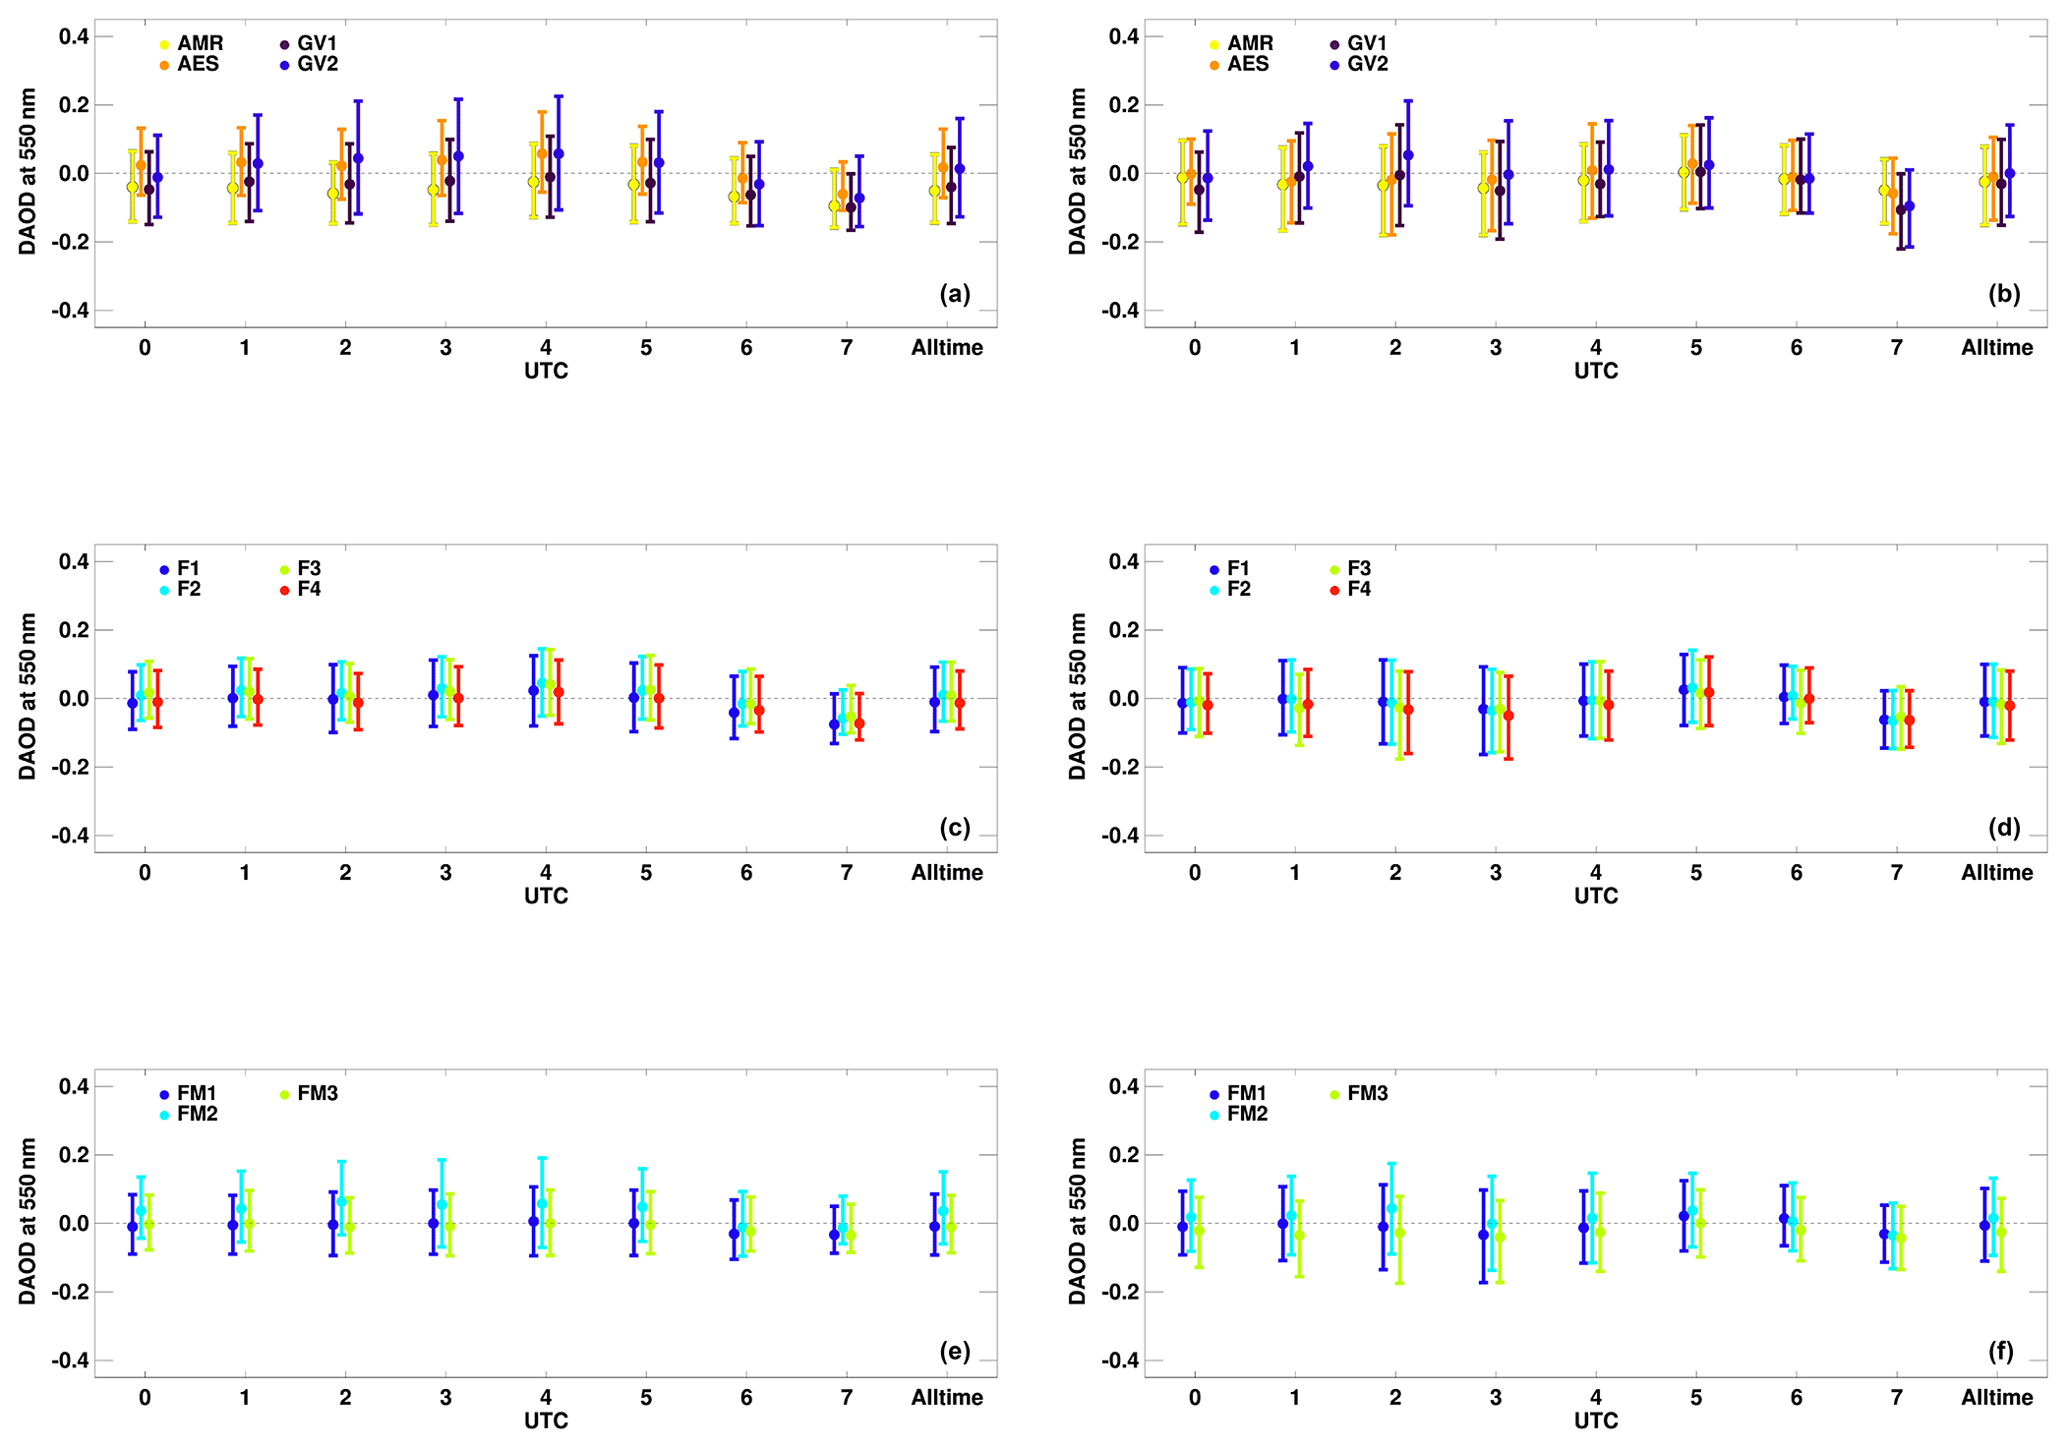
The median bias of the AOD products over the observation time was analyzed as shown in Fig. 8, where the left column represents the KORUS-AQ and the right column the EMeRGe campaign, with filled circles representing median values and the error bar being ±1 SD. As in the KORUS-AQ campaign, the AMR shows a generally negative bias, as in the all-time results, and a negative bias also exists in each time zone. In the AES, GV1, and GV2 case, positive and negative biases appear differently according to time zones. The ±1 SD of the respective satellite product is larger at local noon and smaller at 00:00 and 07:00 UTC when the solar zenith angle is large. Fused products as shown in Fig. 8c–f have a smaller ±1 SD, and the collocated dAOD over the observation time are also close to zero. Meanwhile, FM2 shows the same tendency of overestimation for the same reason as in the previous Fig. 7a.
For the EMeRGe period, the collocated dAOD values of the respective product appear closer to zero than KORUS-AQ. Similarly, the collocated dAOD of the fused products also show values close to zero.
The error analysis indicates that the results after fusion are more accurate than the results obtained using individual satellite products, and fused products' accuracy was slightly better during KORUS-AQ than EMeRGe because more data points were considered. Also, the surface was relatively dark during the KORUS-AQ period; thus retrieval errors for aerosol are reduced compared to the EMeRGe period.
5.3 Time-series analysis of daily mean and hourly AODs
The Gangneung–Wonju National University site (Gangneung-WNU; 37.77∘ N, 128.87∘ E) lies on the eastern side of the Korean Peninsula, and it is one of the regions with low aerosol loadings. The AOD frequency distribution generally follows a lognormal distribution, and it is important to evaluate accuracy for low AOD values. Therefore, we evaluated whether the fused products were improved at low AODs. A daily mean time-series and diurnal variation comparison of different satellite AOD products against AERONET (on a logarithmic scale) are shown in Fig. 9 for the Gangneung-WNU site without high-AOD events, where most point AERONET AODs at 550 nm were <1 during the KORUS-AQ campaign. Daily mean time-series data from the AERONET, ensemble-mean, and MLE products are shown in Fig. 9a, c, e, where black filled circles and black error bars represent AERONET AOD and ±1 SD of 1 d average AERONET AOD, respectively. Satellite-derived AODs represented in different colors show similar variabilities.
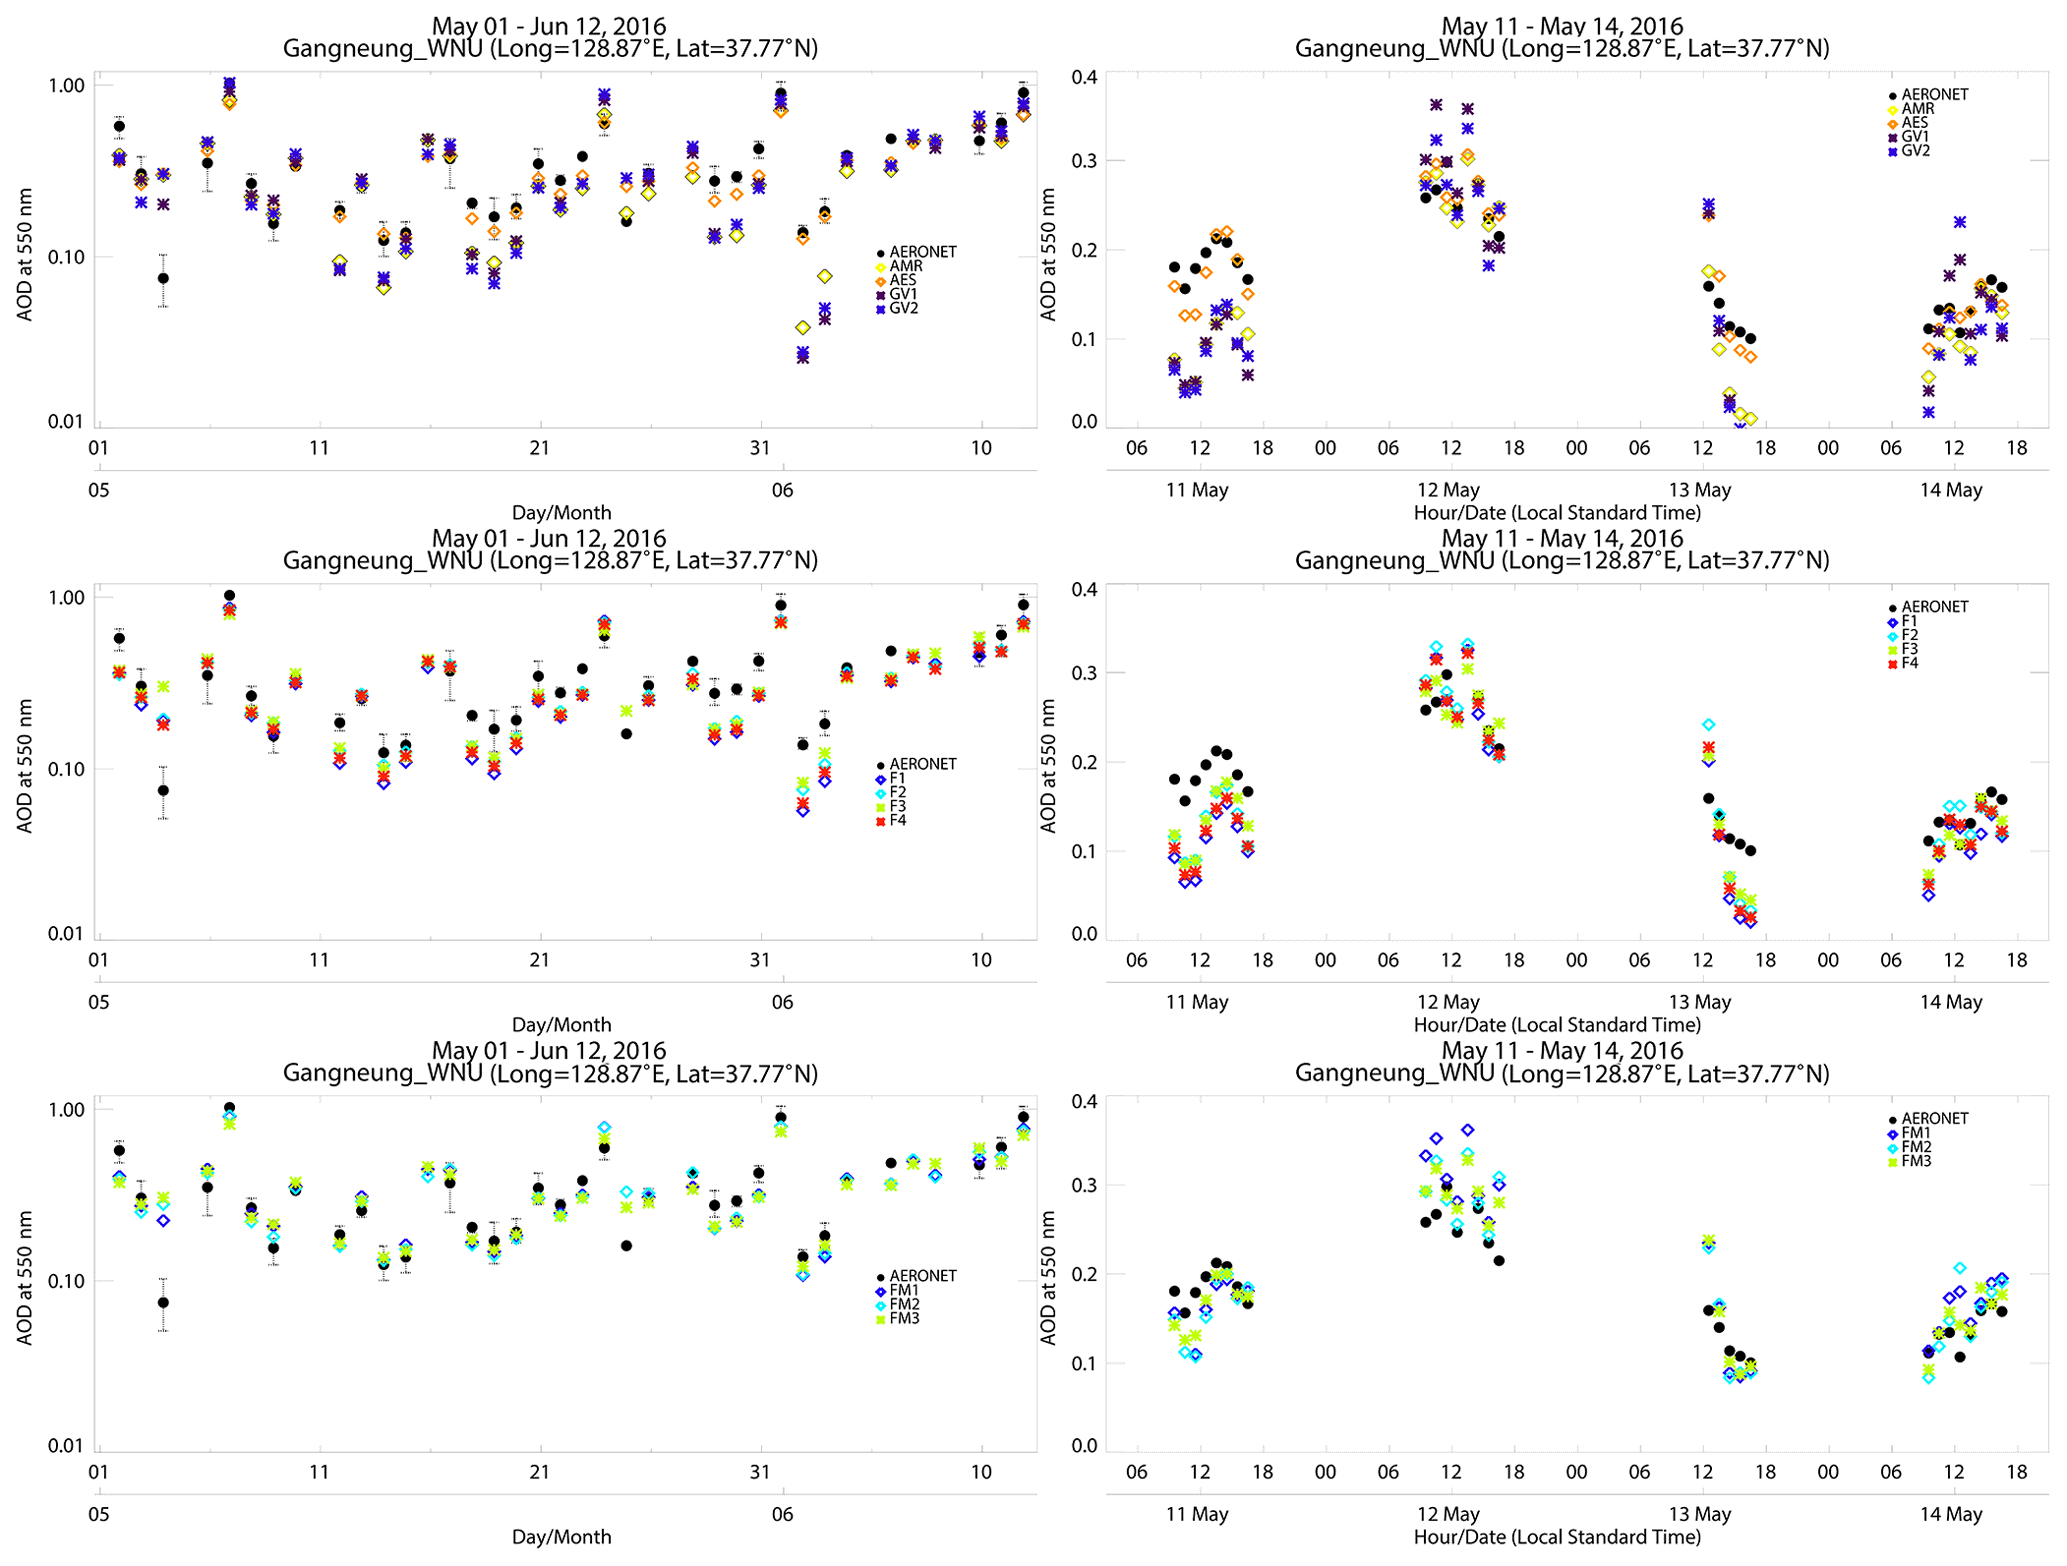
Figure 9Time series of the daily average AODs at the Gangneung-WNU site during the KORUS-AQ campaign from the (a) respective satellite, (c) ensemble mean, and (e) MLE fusion. The black-filled circles represent AERONET AOD, and the error bars represent 1 SD of daily AERONET AODs. The diurnal variation in AODs from 11 to 14 May 2016 is shown in panels (b), (d), (f), where panel (b) is the respective satellite, panel (d) is fused, and panel (f) is MLE products.
The respective satellite products generally show a similar daily mean AOD distribution to AERONET AOD. AMR, GV1, and GV2 using the MRM technique show similar patterns, and AES using SWIR for surface-reflectance estimation shows different patterns. The daily mean AOD of AES is closer to AERONET. On the other hand, Fig. 9c and e, representing fused AOD, show similar patterns overall, but the daily mean AODs on 11 May show different patterns. Here, ensemble-mean products (F1–4) are less accurate than an individual AES product, while MLE products (FM1–3) exhibit similar diurnal variation to daily mean AERONET AOD. To further analyze this, the daily mean AOD is shown in Fig. 9b, d, f instead of the hourly AOD for 11–14 May.
As in the previous daily mean AOD results, Fig. 9b shows the hourly AES AOD variations are close to hourly AERONET, while AMR, GV1, and GV2 tend to underestimate. Similarly, as shown in Fig. 9d, hourly AOD variation of the ensemble-mean products shows overall underestimation for 11 May. All ensemble-mean products use AES as an ensemble member but do not sufficiently compensate for the negative biases held by AMR, GV1, and GV2. Meanwhile, MLE fused products show similar patterns to the hourly AOD variation of AERONET, such as AES outputs. This can be explained in two ways: the effect of considering the weighted function based on pixel-level uncertainty (RMSE in this study) and the bias correction effects. Figure 1 shows similar RMSE values for all observation times when AOD ≤0.5. The Gangneung-WNU site is one of the densely vegetated areas, but if the AOD is less than or equal to 0.5, there is little sensitivity of RMSE according to NDVI bins. That is, regardless of the NDVI, each satellite-specific weighting function used for the MLE fusion has a similar value for all satellite-derived products. The difference between the ensemble-mean and the MLE fused products is due to the bias correction considered in the MLE fusion. For example, FM3 states that AMR has a large negative bias in the afternoon and AES has a negative bias in the morning. With the bias correction of AES and AMR respectively in the morning and afternoon, FM3 is calibrated in a direction to compensate the underestimated AOD. The effect of bias correction and MLE fusion agreement varies depending on the NDVI and AOD loading for each pixel. In the 11 May case, if no bias correction is performed, the MLE fusion output shows a very similar value to F3.
The MLE products were implemented so as to improve accuracy for the low-AOD region more critically than in the high-AOD region by systematic bias correction. In general surface reflectance estimated by the MRM is affected by BAOD, resulting in a negative bias in AOD. On the other hand, the AES uses TOA reflectance at 1.6 µm wavelength to estimate surface reflectance and is therefore less affected by BAOD, and it shows higher AOD than AMR and the two GOCI AODs. Furthermore, AOD retrieval over vegetated areas is more accurate with the ESR method. This result is consistent with previous studies of aerosol retrieval in the VIS region (Levy et al., 2013; Gupta et al., 2019; Hsu et al., 2019).
Table 4Accuracy evaluation of outside of GOCI area of AMR, AES, F3, and FM3 AODs.
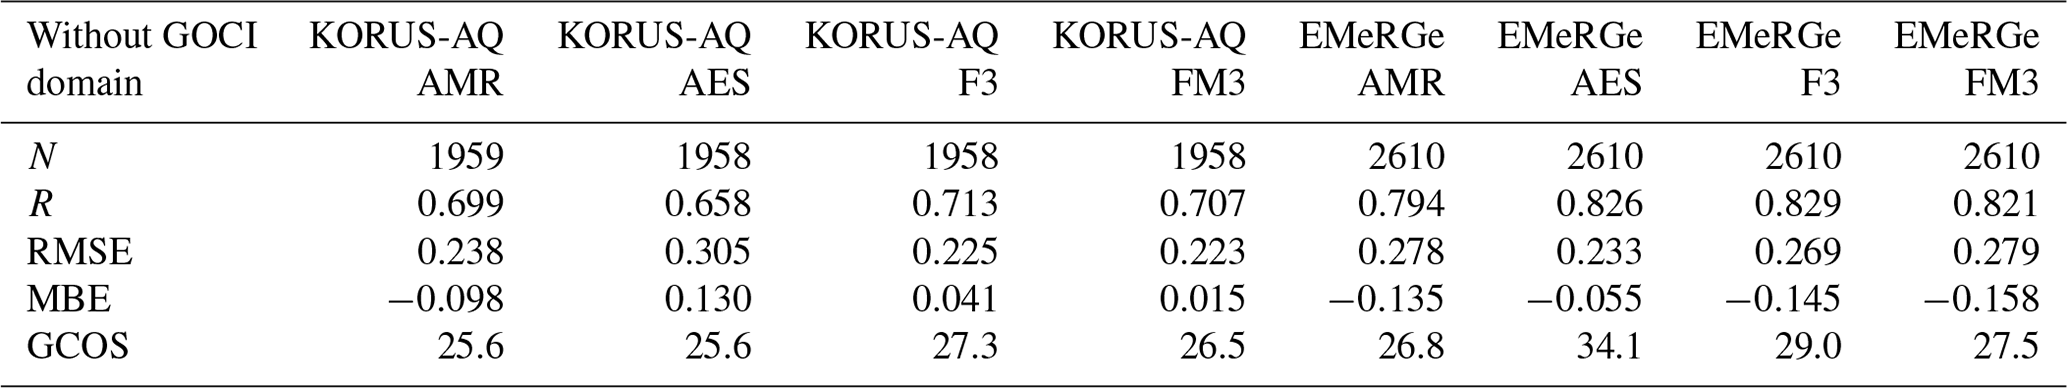
5.4 Accuracy evaluation for AHI products of the outside of GOCI domain
In this section, the AMR, AES, F3, and FM3 products were evaluated at 34 sites within the region of 0–50∘ N and 70–150∘ E except for the GOCI domain as shown in Figs. 4 and 5 (24–50∘ N, 112–148∘ E). The evaluation results are summarized in Table 4 in terms of N, R, RMSE, MBE, and GCOS fraction. The RMSE and mean AOD bias values within the GOCI domain were used in the MLE fusion in this section (see Figs. 1 and 3). Table 4 shows the % GCOS and RMSE values with poorer accuracy than the validation results for the GOCI coverage as listed in Table 4. In addition, MBE during the KORUS-AQ and the EMeRGe period was −0.098 and −0.135 for AMR and 0.130 and −0.055 for AES, respectively, which show very poor accuracy. This can be explained by the cloud contamination issue at sites near the Equator, including Thailand. In addition, AMR cannot collect enough clear pixels for the estimation of LER, which can cause errors. Furthermore, MRM does not work well over desert areas. On the other hand, AES has issues with poor accuracy over bright pixels such as desert and snow-contaminated areas. Second, there are many areas where the coastline is complex, as in Hong Kong, and the surface elevation is uneven, as in Himalayas. However, there is a bias of −0.055 during the EMeRGe period for AES, but the % GCOS was the highest, at 34.1, which is considered significant. F3 and FM3 show similar patterns for the KORUS-AQ and the EMeRGe period. The accuracy of F3 is better than that of FM3, because the previously mentioned issue for the bias correction has worked incorrectly, as the RMSE and bias correction values used were from the data in the untrained area.
Various aerosol algorithms have been developed for two different GEO satellites, AHI and GOCI. Retrieved AOD data have advantages and disadvantages, depending on the concept of the algorithm and surface-reflectance estimations. In this study, four aerosol products (GV1, GV2, AMR, and AES) were used to construct ensemble-mean and MLE products. For the ensemble mean, this study presented fusion products taking advantage of overlap region, accuracy, and near-real-time processing. For MLE products, bias corrections for different observation times and surface type were performed considering pixel-level errors, and the synergy of fusion between GEO satellites was successfully demonstrated.
Validation with AERONET confirmed that averaging ensemble members improved most of the statistical metrics for ensemble products, and consideration of pixel-level uncertainty further improved the accuracy of MLE products. For optimized AOD products in East Asia, NDVI and time-dependent errors have been reduced. The ensemble-mean and MLE fusion results show consistent results with better accuracy.
By comparing F1 and F4, we can see the accuracy changes depending on the number of members used in the ensemble mean. During the KORUS-AQ period, poor accuracy of each member for ensemble averaging made it difficult to find true features. The accuracy of F4 was higher than that of F1, which shows the effect of GV1's large bias during the KORUS-AQ period. On the other hand, for the EMeRGe period, the difference between F1 and F4 appears small because the respective ensemble member's accuracy was better. Both near-real-time products, F2 and FM2, show good accuracy, similar to other fused products. Interestingly, the accuracy of F1 was worse than that of F2, but the accuracy of FM1 was better than that of FM2. The reason for this appears to be that the long-term RMSE (in Fig. 1) and mean AOD bias value (in Fig. 3) was a better representation for the EMeRGe than for the KORUS-AQ period. To minimize such errors, overall results can be improved by binning the RMSE and mean AOD bias value for the bias correction with respect to month and season in addition to NDVI and time. Naturally, if we directly use the RMSE and mean AOD center value of each campaign, the accuracy can be improved.
In terms of % GCOS range, satellite-derived and fused products were 33 %–43 % and 46 %–54 %, respectively, during the KORUS-AQ, indicating that the fused products have a better or similar statistical score along with other validation scores such as RMSE and MBE. However, the % GCOS during the EMeRGe period shows better accuracy for AMR products, with 52.4 %, than for fused products, with a maximum of 47.6 %. In terms of other validation indices, however, such as RMSE and MBE, the fused product results represent a better validation score than the AMR. For the low-aerosol-loading case where RMSE is small and similar across different products, a bias correction effect was also analyzed at the Gangneung-WNU site by comparing F3 and FM3.
As a summary, to increase the accuracy of the fused products, it is required to have either high accuracy of the respective satellite product or consistent error characteristics with respect to different parameters, such as time and NDVI. If either each satellite-derived AOD is accurate or large numbers of ensemble members are available to compensate for the respective error, the ensemble mean shall be the better fusion technique. If the error characteristic is not random and can be expressed as a specific function, the fused product's accuracy through the MLE fusion will be increased.
The method applied in this study could be used for AOD fusion of GEO data, such as AMI on board GK-2A and GOCI-2 and GEMS on board GK-2B. Furthermore, it is possible to retrieve AOPs other than AOD using multi-angle and multi-channel (UV, VIS, and IR) observations with GK-2A and GK-2B.
The aerosol product data from AHI and GOCI are available on request from the corresponding author, Jhoon Kim (jkim2@yonsei.ac.kr).
HL, SG, and JK designed the experiment. HL and SG carried out the data processing. MC, SL, and YK provided support for satellite data. HL wrote the manuscript, with contributions from all co-authors. JK reviewed and edited the article. JK and CKS provided support and supervision. All authors analyzed the measurement data and prepared the article.
The authors declare that they have no conflict of interest.
This article is part of the special issue “Effect of Megacities on the Transport and Transformation of Pollutants at Regional and Global Scales (EMeRGe) (ACP/AMT inter-journal SI)”. It is not associated with a conference.
We thank all principal investigators and their staff for establishing and maintaining the AERONET sites used in this investigation. This subject is supported by the Korea Ministry of Environment (MOE) through the “Public Technology Program based on Environmental Policy (2017000160001)”. This work was also supported by a grant from the National Institute of Environment Research (NIER), funded by the MOE of the Republic of Korea (NIER-2021-01-02-071). This work was also supported by a grant from the NIER, funded by the MOE of the Republic of Korea (NIER-2021-04-02-056). This research was also supported by the FRIEND (Fine Particle Research Initiative in East Asia Considering National Differences) Project through the National Research Foundation of Korea (NRF), funded by the Ministry of Science and ICT (grant no.: 2020M3G1A1114615). We thank all members of the KORUS-AQ science team for their contributions to the field study and the data processing (https://doi.org/10.5067/Suborbital/KORUSAQ/DATA01).
This research was supported by the Korea Ministry of Environment (MOE) through the “Public Technology Program based on Environmental Policy” (grant no. 2017000160001). This work was also supported by a grant from the National Institute of Environment Research (NIER), funded by the MOE of the Republic of Korea (grant no. NIER-2021-01-02-071). This work was also supported by a grant from the NIER, funded by the MOE of the Republic of Korea (grant no. NIER-2021-04-02-056). This research was also supported by the FRIEND (Fine Particle Research Initiative in East Asia Considering National Differences) Project through the National Research Foundation of Korea (NRF), funded by the Ministry of Science and ICT (grant no. 2020M3G1A1114615).
This paper was edited by Manabu Shiraiwa and reviewed by two anonymous referees.
Bernard, E., Moulin, C., Ramon, D., Jolivet, D., Riedi, J., and Nicolas, J.-M.: Description and validation of an AOT product over land at the 0.6 µm channel of the SEVIRI sensor onboard MSG, Atmos. Meas. Tech., 4, 2543–2565, https://doi.org/10.5194/amt-4-2543-2011, 2011.
Bessho, K., Date, K., Hayashi, M., Ikeda, A., Imai, T., Inoue, H., Kumagai, Y., Miyakawa, T., Murata, H., Ohno, T., Okuyama, A., Oyama, R., Sasaki, Y., Shimazu, Y., Shimoji, K., Sumida, Y., Suzuki, M., Taniguchi, H., Tsuchiyama, H., Uesawa, D., Yokota, H., and Yoshida, R.: An Introduction to Himawari-8/9 – Japan's New-Generation Geostationary Meteorological Satellites, J. Meteorol. Soc. Japan Ser. II, 94, 151–183, 2016.
Bilal, M., Nichol, J. E., and Wang, L.: New customized methods for improvement of the MODIS C6 Dark Target and Deep Blue merged aerosol product, Remote Sens. Environ., 197, 115–124, 2017.
Chatterjee, A., Michalak, A. M., Kahn, R. A., Paradise, S. R., Braverman, A. J., and Miller, C. E.: A geostatistical data fusion technique for merging remote sensing and ground-based observations of aerosol optical thickness, J. Geophys. Res., 115, D20, https://doi.org/10.1029/2009JD013765, 2010.
Cho, H. K., Jeong, M. J., Kim, J., and Kim, Y. J.: Dependence of diffuse photosynthetically active solar irradiance on total optical depth, J. Geophys. Res., 108, 4267, https://doi.org/10.1029/2002JD002175, 2003.
Choi, J.-K., Park, Y. J., Ahn, J. H., Lim, H.-S., Eom, J., and Ryu, J.-H.: GOCI, the world's first geostationary ocean color observation satellite, for the monitoring of temporal variability in coastal water turbidity, J. Geophys. Res.-Oceans, 117, C9, https://doi.org/10.1029/2012JC008046, 2012.
Choi, M., Kim, J., Lee, J., Kim, M., Park, Y.-J., Jeong, U., Kim, W., Hong, H., Holben, B., Eck, T. F., Song, C. H., Lim, J.-H., and Song, C.-K.: GOCI Yonsei Aerosol Retrieval (YAER) algorithm and validation during the DRAGON-NE Asia 2012 campaign, Atmos. Meas. Tech., 9, 1377–1398, https://doi.org/10.5194/amt-9-1377-2016, 2016.
Choi, M., Kim, J., Lee, J., Kim, M., Park, Y.-J., Holben, B., Eck, T. F., Li, Z., and Song, C. H.: GOCI Yonsei aerosol retrieval version 2 products: an improved algorithm and error analysis with uncertainty estimation from 5-year validation over East Asia, Atmos. Meas. Tech., 11, 385–408, https://doi.org/10.5194/amt-11-385-2018, 2018.
Cox, C. and Munk, W.: Statistics of the sea surface derived from sun glitter, J. Mar. Res., 13, 198–227, 1954.
Crawford, J. H., Ahn, J.-Y., Al-Saadi, J., Chang, L., Emmons, L. K., Kim, J., Lee, G., Park, J.-H., Park, R. J., and Woo, J. H. J. E. S. A.: The Korea–United States Air Quality (KORUS-AQ) field study, Elementa, 9, 00163, https://doi.org/10.1525/elementa.2020.00163, 2021.
Fukuda, S., Nakajima, T., Takenaka, H., Higurashi, A., Kikuchi, N., Nakajima, T. Y., and Ishida, H.: New approaches to removing cloud shadows and evaluating the 380 nm surface reflectance for improved aerosol optical thickness retrievals from the GOSAT/TANSO-Cloud and Aerosol Imager, J. Geophys. Res.-Atmos., 118, 13520–13531, https://doi.org/10.1002/2013JD020090, 2013.
Garay, M. J., Kalashnikova, O. V., and Bull, M. A.: Development and assessment of a higher-spatial-resolution (4.4 km) MISR aerosol optical depth product using AERONET-DRAGON data, Atmos. Chem. Phys., 17, 5095–5106, https://doi.org/10.5194/acp-17-5095-2017, 2017.
Garay, M. J., Witek, M. L., Kahn, R. A., Seidel, F. C., Limbacher, J. A., Bull, M. A., Diner, D. J., Hansen, E. G., Kalashnikova, O. V., Lee, H., Nastan, A. M., and Yu, Y.: Introducing the 4.4 km spatial resolution Multi-Angle Imaging SpectroRadiometer (MISR) aerosol product, Atmos. Meas. Tech., 13, 593–628, https://doi.org/10.5194/amt-13-593-2020, 2020.
GCOS: Systematic Observation Requirements from Satellite-Based Data Products for Climate 2011 Update. Supplemental Details to the Satellite-Based Component of the “Implementation Plan for the Global Observing System for Climate in Support of the UNFCCC”, Technical report, No. 154, World Meteorological Organisation (WMO), Geneva, 2011.
Giles, D. M., Sinyuk, A., Sorokin, M. G., Schafer, J. S., Smirnov, A., Slutsker, I., Eck, T. F., Holben, B. N., Lewis, J. R., Campbell, J. R., Welton, E. J., Korkin, S. V., and Lyapustin, A. I.: Advancements in the Aerosol Robotic Network (AERONET) Version 3 database – automated near-real-time quality control algorithm with improved cloud screening for Sun photometer aerosol optical depth (AOD) measurements, Atmos. Meas. Tech., 12, 169–209, https://doi.org/10.5194/amt-12-169-2019, 2019.
Go, S., Kim, J., Park, S. S., Kim, M., Lim, H., Kim, J.-Y., Lee, D.-W., and Im, J.: Synergistic Use of Hyperspectral UV-Visible OMI and Broadband Meteorological Imager MODIS Data for a Merged Aerosol Product, Remote Sensing, 12, 3987–4021, 2020.
Gupta, P., Patadia, F., and Christopher, S. A.: Multisensor Data Product Fusion for Aerosol Research, IEEE T. Geosci. Remote, 46, 1407–1415, 2008.
Gupta, P., Levy, R. C., Mattoo, S., Remer, L. A., and Munchak, L. A.: A surface reflectance scheme for retrieving aerosol optical depth over urban surfaces in MODIS Dark Target retrieval algorithm, Atmos. Meas. Tech., 9, 3293–3308, https://doi.org/10.5194/amt-9-3293-2016, 2016.
Gupta, P., Levy, R. C., Mattoo, S., Remer, L. A., Holz, R. E., and Heidinger, A. K.: Applying the Dark Target aerosol algorithm with Advanced Himawari Imager observations during the KORUS-AQ field campaign, Atmos. Meas. Tech., 12, 6557–6577, https://doi.org/10.5194/amt-12-6557-2019, 2019.
Herman, J. R. and Celarier, E. A.: Earth surface reflectivity climatology at 340–380 nm from TOMS data, J. Geophys. Res.-Atmos., 102, 28003–28011, 1997.
Holben, B. N., Tanre, D., Smirnov, A., Eck, T., Slutsker, I., Abuhassan, N., Newcomb, W., Schafer, J., Chatenet, B., and Lavenu, F. J. J. O. G. R. A.: An emerging ground-based aerosol climatology: Aerosol optical depth from AERONET, J. Geophys. Res.-Atmos., 106, 12067–12097, 2001.
Hsu, N., Jeong, M. J., Bettenhausen, C., Sayer, A., Hansell, R., Seftor, C., Huang, J., and Tsay, S. C.: Enhanced Deep Blue aerosol retrieval algorithm: The second generation, J. Geophys. Res.-Atmos., 118, 9296–9315, 2013.
Hsu, N., Lee, J., Sayer, A., Kim, W., Bettenhausen, C., and Tsay, S. C. J. J. O. G. R. A.: VIIRS Deep Blue aerosol products over land: Extending the EOS long-term aerosol data records, J. Geophys. Res.-Atmos., 124, 4026–4053, 2019.
Hsu, N. C., Tsay, S.-C., King, M. D., Herman, J. R. J. I. T. O. G., and Sensing, R.: Aerosol properties over bright-reflecting source regions, IEEE T. Geosci. Remote, 42, 557–569, 2004.
IPCC: Climate Change 2013: The Physical Science Basis. Contribution of Working Group I to the Fifth Assessment Report of the Intergovernmental Panel on Climate Change, Cambridge University Press, Cambridge, UK and New York, NY, USA, 2013.
Jackson, J. M., Liu, H., Laszlo, I., Kondragunta, S., Remer, L. A., Huang, J., and Huang, H.-C.: Suomi-NPP VIIRS aerosol algorithms and data products, J. Geophys. Res.-Atmos., 118, 12673–12689, 2013.
Kikuchi, M., Murakami, H., Suzuki, K., Nagao, T. M., and Higurashi, A.: Improved Hourly Estimates of Aerosol Optical Thickness Using Spatiotemporal Variability Derived From Himawari-8 Geostationary Satellite, IEEE T. Geosci. Remote, 56, 3442–3455, 2018.
Kim, J., Lee, J., Lee, H. C., Higurashi, A., Takemura, T., and Song, C. H.: Consistency of the aerosol type classification from satellite remote sensing during the Atmospheric Brown Cloud–East Asia Regional Experiment campaign, J. Geophys. Res., 112, D22S33, https://doi.org/10.1029/2006JD008201, 2007.
Kim, J., Yoon, J. M., Ahn, M. H., Sohn, B. J., and Lim, H. S.: Retrieving aerosol optical depth using visible and mid-IR channels from geostationary satellite MTSAT-1R, Int. J. Remote Sens., 29, 6181–6192, 2008.
Kim, J., Kim, M., and Choi, M.: Monitoring aerosol properties in east Asia from geostationary orbit: GOCI, MI and GEMS, in: Air Pollution in Eastern Asia: An Integrated Perspective, Springer, Cham, 2017.
Kim, J., Jeong, U., Ahn, M.-H., Kim, J. H., Park, R. J., Lee, H., Song, C. H., Choi, Y.-S., Lee, K.-H., Yoo, J.-M., Jeong, M.-J., Park, S. K., Lee, K.-M., Song, C.-K., Kim, S.-W., Kim, Y. J., Kim, S.-W., Kim, M., Go, S., Liu, X., Chance, K., Chan Miller, C., Al-Saadi, J., Veihelmann, B., Bhartia, P. K., Torres, O., Abad, G. G., Haffner, D. P., Ko, D. H., Lee, S. H., Woo, J.-H., Chong, H., Park, S. S., Nicks, D., Choi, W. J., Moon, K.-J., Cho, A., Yoon, J., Kim, S.-k., Hong, H., Lee, K., Lee, H., Lee, S., Choi, M., Veefkind, P., Levelt, P. F., Edwards, D. P., Kang, M., Eo, M., Bak, J., Baek, K., Kwon, H.-A., Yang, J., Park, J., Han, K. M., Kim, B.-R., Shin, H.-W., Choi, H., Lee, E., Chong, J., Cha, Y., Koo, J.-H., Irie, H., Hayashida, S., Kasai, Y., Kanaya, Y., Liu, C., Lin, J., Crawford, J. H., Carmichael, G. R., Newchurch, M. J., Lefer, B. L., Herman, J. R., Swap, R. J., Lau, A. K. H., Kurosu, T. P., Jaross, G., Ahlers, B., Dobber, M., McElroy, C. T., and Choi, Y.: New Era of Air Quality Monitoring from Space: Geostationary Environment Monitoring Spectrometer (GEMS), B. Am. Meteorol. Soc., 101, E1–E22, 2020.
Kim, M., Kim, J., Wong, M. S., Yoon, J., Lee, J., Wu, D., Chan, P. W., Nichol, J. E., Chung, C.-Y., and Ou, M.-L.: Improvement of aerosol optical depth retrieval over Hong Kong from a geostationary meteorological satellite using critical reflectance with background optical depth correction, Remote Sens. Environ., 142, 176–187, 2014.
Kim, M., Kim, J., Jeong, U., Kim, W., Hong, H., Holben, B., Eck, T. F., Lim, J. H., Song, C. K., Lee, S., and Chung, C.-Y.: Aerosol optical properties derived from the DRAGON-NE Asia campaign, and implications for a single-channel algorithm to retrieve aerosol optical depth in spring from Meteorological Imager (MI) on-board the Communication, Ocean, and Meteorological Satellite (COMS), Atmos. Chem. Phys., 16, 1789–1808, https://doi.org/10.5194/acp-16-1789-2016, 2016.
Kim, M., Kim, S. H., Kim, W. V., Lee, Y. G., Kim, J., and Kafatos, M. C.: Assessment of Aerosol optical depth under background and polluted conditions using AERONET and VIIRS datasets, Atmos. Environm., 245, 117994–118009, 2021.
Knapp, K. R., Frouin, R., Kondragunta, S., and Prados, A. J. I. J. O. R. S.: Toward aerosol optical depth retrievals over land from GOES visible radiances: determining surface reflectance, Int. J. Remote S., 26, 4097–4116, 2005.
Koelemeijer, R. B. A., de Haan, J. F., and Stammes, P.: A database of spectral surface reflectivity in the range 335–772 nm derived from 5.5 years of GOME observations, J. Geophys. Res., 108, 4070, https://doi.org/10.1029/2002JD002429, 2003.
Lee, J., Kim, J., Song, C. H., Ryu, J.-H., Ahn, Y.-H., and Song, C.: Algorithm for retrieval of aerosol optical properties over the ocean from the Geostationary Ocean Color Imager, Remote Sens. Environ., 114, 1077–1088, 2010.
Lee, J., Kim, J., Yang, P., and Hsu, N. C.: Improvement of aerosol optical depth retrieval from MODIS spectral reflectance over the global ocean using new aerosol models archived from AERONET inversion data and tri-axial ellipsoidal dust database, Atmos. Chem. Phys., 12, 7087–7102, https://doi.org/10.5194/acp-12-7087-2012, 2012.
Lee, S., Kim, M., Choi, M., Go, S., Kim, J., Kim, J.-H., Lim, H.-K., Jeong, U., Goo, T.-Y., Kuze, A., Shiomi, K., and Tatsuya, Y.: Aerosol Property Retrieval Algorithm over Northeast Asia from TANSO-CAI Measurements Onboard GOSAT, Remote Sensing, 9, 687–711, 2017.
Lee, S., Kim, J., Choi, M., Hong, J., Lim, H., Eck, T. F., Holben, B. N., Ahn, J.-Y., Kim, J., and Koo, J.-H.: Analysis of long-range transboundary transport (LRTT) effect on Korean aerosol pollution during the KORUS-AQ campaign, Atmos. Environ., 204, 53–67, 2019.
Levy, R. C., Remer, L. A., Kleidman, R. G., Mattoo, S., Ichoku, C., Kahn, R., and Eck, T. F.: Global evaluation of the Collection 5 MODIS dark-target aerosol products over land, Atmos. Chem. Phys., 10, 10399–10420, https://doi.org/10.5194/acp-10-10399-2010, 2010.
Levy, R. C., Mattoo, S., Munchak, L. A., Remer, L. A., Sayer, A. M., Patadia, F., and Hsu, N. C.: The Collection 6 MODIS aerosol products over land and ocean, Atmos. Meas. Tech., 6, 2989–3034, https://doi.org/10.5194/amt-6-2989-2013, 2013.
Li, L., Shi, R., Zhang, L., Zhang, J., and Gao, W.: The data fusion of aerosol optical thickness using universal kriging and stepwise regression in East China, Remote Sensing and Modeling of Ecosystems for Sustainability XI, 9221, 922112–922124, 2014.
Lim, H., Choi, M., Kim, M., Kim, J., and Chan, P. W.: Retrieval and Validation of Aerosol Optical Properties Using Japanese Next Generation Meteorological Satellite, Himawari-8, Korean J. Remote Sens., 32, 681–691, 2016.
Lim, H., Choi, M., Kim, J., Kasai, Y., and Chan, P.: AHI/Himawari-8 Yonsei Aerosol Retrieval (YAER): Algorithm, Validation and Merged Products, Remote Sensing, 10, 699–724, 2018.
Lyapustin, A., Martonchik, J., Wang, Y., Laszlo, I., and Korkin, S.: Multiangle implementation of atmospheric correction (MAIAC): 1. Radiative transfer basis and look-up tables, J. Geophys. Res., 116, D03210, https://doi.org/10.1029/2010JD014985, 2011a.
Lyapustin, A., Wang, Y., Laszlo, I., Kahn, R., Korkin, S., Remer, L., Levy, R., and Reid, J. S.: Multiangle implementation of atmospheric correction (MAIAC): 2. Aerosol algorithm, J. Geophys. Res., 116, D03211, https://doi.org/10.1029/2010JD014986, 2011b.
Lyapustin, A., Wang, Y., Korkin, S., and Huang, D.: MODIS Collection 6 MAIAC algorithm, Atmos. Meas. Tech., 11, 5741–5765, https://doi.org/10.5194/amt-11-5741-2018, 2018.
Mélin, F., Zibordi, G., and Djavidnia, S.: Development and validation of a technique for merging satellite derived aerosol optical depth from SeaWiFS and MODIS, Remote Sens. Environ., 108, 436–450, 2007.
Murakami, H.: Ocean color estimation by Himawari-8/AHI, Remote Sensing of the Oceans and Inland Waters: Techniques, Applications, and Challenges, 9878, International Society for Optics and Photonics, 2016, 987810–987820, 2016.
Negi, H. S. and Kokhanovsky, A.: Retrieval of snow albedo and grain size using reflectance measurements in Himalayan basin, The Cryosphere, 5, 203–217, https://doi.org/10.5194/tc-5-203-2011, 2011.
Nguyen, H., Cressie, N., and Braverman, A.: Spatial Statistical Data Fusion for Remote Sensing Applications, J. Am. Stat. Assoc., 107, 1004–1018, 2012.
Nirala, M.: Technical Note: Multi-sensor data fusion of aerosol optical thickness, Int. J. Remote Sens., 29, 2127–2136, 2008.
Pang, J., Liu, Z., Wang, X., Bresch, J., Ban, J., Chen, D., and Kim, J.: Assimilating AOD retrievals from GOCI and VIIRS to forecast surface PM2.5 episodes over Eastern China, Atmos. Environ., 179, 288–304, 2018.
Remer, L. A., Kaufman, Y., Tanré, D., Mattoo, S., Chu, D., Martins, J. V., Li, R.-R., Ichoku, C., Levy, R., and Kleidman, R.: The MODIS aerosol algorithm, products, and validation, J. Atmos. Sci., 62, 947–973, 2005.
Remer, L. A., Mattoo, S., Levy, R. C., and Munchak, L. A.: MODIS 3 km aerosol product: algorithm and global perspective, Atmos. Meas. Tech., 6, 1829–1844, https://doi.org/10.5194/amt-6-1829-2013, 2013.
Saide, P. E., Kim, J., Song, C. H., Choi, M., Cheng, Y., and Carmichael, G. R.: Assimilation of next generation geostationary aerosol optical depth retrievals to improve air quality simulations, Geophys. Res. Lett., 41, 9188–9196, 2014.
Saide, P. E., Gao, M., Lu, Z., Goldberg, D. L., Streets, D. G., Woo, J.-H., Beyersdorf, A., Corr, C. A., Thornhill, K. L., Anderson, B., Hair, J. W., Nehrir, A. R., Diskin, G. S., Jimenez, J. L., Nault, B. A., Campuzano-Jost, P., Dibb, J., Heim, E., Lamb, K. D., Schwarz, J. P., Perring, A. E., Kim, J., Choi, M., Holben, B., Pfister, G., Hodzic, A., Carmichael, G. R., Emmons, L., and Crawford, J. H.: Understanding and improving model representation of aerosol optical properties for a Chinese haze event measured during KORUS-AQ, Atmos. Chem. Phys., 20, 6455–6478, https://doi.org/10.5194/acp-20-6455-2020, 2020.
Sayer, A. M. and Knobelspiesse, K. D.: How should we aggregate data? Methods accounting for the numerical distributions, with an assessment of aerosol optical depth, Atmos. Chem. Phys., 19, 15023–15048, https://doi.org/10.5194/acp-19-15023-2019, 2019.
Sayer, A., Munchak, L., Hsu, N., Levy, R., Bettenhausen, C., and Jeong, M. J.: MODIS Collection 6 aerosol products: Comparison between Aqua's e-Deep Blue, Dark Target, and “merged” data sets, and usage recommendations, J. Geophys. Res.-Atmos., 119, 13965–13989, 2014.
Sayer, A., Hsu, N., Lee, J., Bettenhausen, C., Kim, W., and Smirnov, A. J. J. O. G. R. A.: Satellite Ocean Aerosol Retrieval (SOAR) Algorithm Extension to S-NPP VIIRS as Part of the “Deep Blue” Aerosol Project, J. Geophys. Res.-Atmos., 123, 380–400, 2018.
Sayer, A. M., Hsu, N. C., Lee, J., Kim, W. V., and Dutcher, S. T.: Validation, Stability, and Consistency of MODIS Collection 6.1 and VIIRS Version 1 Deep Blue Aerosol Data Over Land, J. Geophys. Res.-Atmos. 124, 4658–4688, 2019.
Smirnov, A., Holben, B. N., Eck, T. F., Dubovik, O., and Slutsker, I.: Cloud screening and quality control algorithms for the AERONET data base, Remote Sens. Environ., 73, 337–349, 2000.
Tang, Q., Bo, Y., and Zhu, Y.: Spatiotemporal fusion of multiple-satellite aerosol optical depth (AOD) products using Bayesian maximum entropy method, J. Geophys. Res.-Atmos., 121, 4034–4048, 2016.
Wang, J., Christopher, S. A., Brechtel, F., Kim, J., Schmid, B., Redemann, J., Russell, P. B., Quinn, P., and Holben, B. N. J. J. O. G. R. A.: Geostationary satellite retrievals of aerosol optical thickness during ACE‐Asia, J. Geophys. Res.-Atmos., 108, D23, https://doi.org/10.1029/2003JD003580, 2003.
Wang, J., Brown, D. G., and Hammerling, D.: Geostatistical inverse modeling for super-resolution mapping of continuous spatial processes, Remote Sens. Environ., 139, 205–215, 2013.
Wei, J., Li, Z., Sun, L., Peng, Y., and Wang, L.: Improved merge schemes for MODIS Collection 6.1 Dark Target and Deep Blue combined aerosol products, Atmos. Environ., 202, 315–327, 2019.
Xie, Y., Xue, Y., Che, Y., Guang, J., Mei, L., Voorhis, D., Fan, C., She, L., Xu, H. J. I. T. O. G., and Sensing, R.: Ensemble of ESA/AATSR aerosol optical depth products based on the likelihood estimate method with uncertainties, IEEE T. Geosci. Remote, 56, 997–1007, 2018.
Xu, H., Guang, J., Xue, Y., De Leeuw, G., Che, Y., Guo, J., He, X., and Wang, T. J. A. E.: A consistent aerosol optical depth (AOD) dataset over mainland China by integration of several AOD products, Atmos. Environ., 114, 48–56, 2015.
Xue, Y., Xu, H., Mei, L., Guang, J., Guo, J., Li, Y., Hou, T., Li, C., Yang, L., and He, X.: Merging aerosol optical depth data from multiple satellite missions to view agricultural biomass burning in Central and East China, Atmos. Chem. Phys. Discuss., 12, 10461–10492, https://doi.org/10.5194/acpd-12-10461-2012, 2012.
Yoon, J. M., Kim, J., Lee, J. H., Cho, H. K., Sohn, B.-J., and Ahn, M.-H. J. A.-P. J. O. A. S.: Retrieval of aerosol optical depth over East Asia from a geostationary satellite, MTSAT-1R, 43, 49–58, 2007.
Yoshida, M., Kikuchi, M., Nagao, T. M., Murakami, H., Nomaki, T., and Higurashi, A.: Common Retrieval of Aerosol Properties for Imaging Satellite Sensors, Jo. Meteorol. Soc. Japan Ser. II, 96B, 193–209, 2018.
Zhang, H., Superczynski, S., Ciren, P., Holben, B. N., and Petrenko, M.: Validation and expected error estimation of Suomi-NPP VIIRS aerosol optical thickness and Angstrom exponent with AERONET, J. Geophys. Res.-Atmos., 121, 7139–7160, 2016.
Zhong, G., Wang, X., Tani, H., Guo, M., Chittenden, A., Yin, S., Sun, Z., and Matsumura, S.: A Modified Aerosol Free Vegetation Index Algorithm for Aerosol Optical Depth Retrieval Using GOSAT TANSO-CAI Data, Remote Sensing, 8, 998–1020, 2016.
- Abstract
- Introduction
- Descriptions of AHI, GOCI, and the YAER algorithm
- Data fusion methods
- Results
- Validation, comparison, and error estimation against AERONET
- Summary and conclusion
- Code and data availability
- Author contributions
- Competing interests
- Special issue statement
- Acknowledgements
- Financial support
- Review statement
- References