the Creative Commons Attribution 4.0 License.
the Creative Commons Attribution 4.0 License.
 | 22 Jan 2021
Ground-based validation of the Copernicus Sentinel-5P TROPOMI NO2 measurements with the NDACC ZSL-DOAS, MAX-DOAS and Pandonia global networks
Tijl Verhoelst
Steven Compernolle
Gaia Pinardi
Jean-Christopher Lambert
Henk J. Eskes
Kai-Uwe Eichmann
Ann Mari Fjæraa
José Granville
Sander Niemeijer
Alexander Cede
Martin Tiefengraber
François Hendrick
Andrea Pazmiño
Alkiviadis Bais
Ariane Bazureau
K. Folkert Boersma
Kristof Bognar
Angelika Dehn
Sebastian Donner
Aleksandr Elokhov
Manuel Gebetsberger
Florence Goutail
Michel Grutter de la Mora
Aleksandr Gruzdev
Myrto Gratsea
Georg H. Hansen
Hitoshi Irie
Nis Jepsen
Yugo Kanaya
Dimitris Karagkiozidis
Rigel Kivi
Karin Kreher
Pieternel F. Levelt
Cheng Liu
Moritz Müller
Monica Navarro Comas
Ankie J. M. Piters
Jean-Pierre Pommereau
Thierry Portafaix
Cristina Prados-Roman
Olga Puentedura
Richard Querel
Julia Remmers
Andreas Richter
John Rimmer
Claudia Rivera Cárdenas
Lidia Saavedra de Miguel
Valery P. Sinyakov
Wolfgang Stremme
Kimberly Strong
Michel Van Roozendael
J. Pepijn Veefkind
Thomas Wagner
Folkard Wittrock
Margarita Yela González
Claus Zehner
This paper reports on consolidated ground-based validation results of the atmospheric NO2 data produced operationally since April 2018 by the TROPOspheric Monitoring Instrument (TROPOMI) on board of the ESA/EU Copernicus Sentinel-5 Precursor (S5P) satellite. Tropospheric, stratospheric, and total NO2 column data from S5P are compared to correlative measurements collected from, respectively, 19 Multi-Axis Differential Optical Absorption Spectroscopy (MAX-DOAS), 26 Network for the Detection of Atmospheric Composition Change (NDACC) Zenith-Scattered-Light DOAS (ZSL-DOAS), and 25 Pandonia Global Network (PGN)/Pandora instruments distributed globally. The validation methodology gives special care to minimizing mismatch errors due to imperfect spatio-temporal co-location of the satellite and correlative data, e.g. by using tailored observation operators to account for differences in smoothing and in sampling of atmospheric structures and variability and photochemical modelling to reduce diurnal cycle effects. Compared to the ground-based measurements, S5P data show, on average, (i) a negative bias for the tropospheric column data, of typically −23 % to −37 % in clean to slightly polluted conditions but reaching values as high as −51 % over highly polluted areas; (ii) a slight negative median difference for the stratospheric column data, of about −0.2 Pmolec cm−2, i.e. approx. −2 % in summer to −15 % in winter; and (iii) a bias ranging from zero to −50 % for the total column data, found to depend on the amplitude of the total NO2 column, with small to slightly positive bias values for columns below 6 Pmolec cm−2 and negative values above. The dispersion between S5P and correlative measurements contains mostly random components, which remain within mission requirements for the stratospheric column data (0.5 Pmolec cm−2) but exceed those for the tropospheric column data (0.7 Pmolec cm−2). While a part of the biases and dispersion may be due to representativeness differences such as different area averaging and measurement times, it is known that errors in the S5P tropospheric columns exist due to shortcomings in the (horizontally coarse) a priori profile representation in the TM5-MP chemical transport model used in the S5P retrieval and, to a lesser extent, to the treatment of cloud effects and aerosols. Although considerable differences (up to 2 Pmolec cm−2 and more) are observed at single ground-pixel level, the near-real-time (NRTI) and offline (OFFL) versions of the S5P NO2 operational data processor provide similar NO2 column values and validation results when globally averaged, with the NRTI values being on average 0.79 % larger than the OFFL values.
- Article
(1287 KB) - Full-text XML
- BibTeX
- EndNote


Nitrogen oxides, and in particular the NOx (NO and NO2), are important trace gases both in the troposphere and the stratosphere. In the troposphere they are produced mainly by the combustion of fossil and other organic fuels and by the production and use of nitrogen fertilizers for agriculture. They can also have a natural origin, e.g. lightning, biological processes in soils, and biomass burning. The NO∕NO2 ratio varies with solar illumination primarily, from 0.2–0.5 during the day down to zero at night. NOx are converted to nitric acid and nitrates, which are removed by dry deposition and rain, resulting in a tropospheric lifetime of a few hours to days. Tropospheric NOx are pollutants as well as proxies for other pollutants resulting from the (high-temperature) combustion of organic fuels. They are precursors for tropospheric ozone and aerosols and contribute to acid rain and smog. Because of their adverse health effects, local to national regulations limiting boundary layer NOx concentrations are now in place in a long list of countries across the world. In the stratosphere, NOx are formed by the photolysis of tropospheric nitrous oxide (N2O) produced by biogenic and anthropogenic processes and going up through the troposphere and stratosphere. Stratospheric NOx control the abundance of ozone as a catalyst in ozone destruction processes but also by mitigating ozone losses caused by catalytic cycles involving anthropogenic halogens through the lock-up of these halogens in so-called long-lived reservoirs.
The global distribution, cycles, and trends of atmospheric NO2 have been measured from space by a large number of instruments on low Earth orbit (LEO) satellites. Since the late 1970s, its stratospheric and sometimes mesospheric abundance have been measured by limb-viewing and solar-occultation instruments working in the UV–visible and infrared spectral ranges: SME, LIMS, SAGE(-II), HALOE, and POAM-2/POAM-3, etc. and, in the last decade, OSIRIS, GOMOS, MIPAS, SCIAMACHY, Scisat ACE, and SAGE-III. Follow-on missions combining limb and occultation measurements are in development, like ALTIUS planned for the coming years. Pioneered in 1995 with ERS-2 GOME (Burrows et al., 1999), which for the first time brought NO2 column measurements into space by Differential Optical Absorption Spectroscopy (DOAS; Noxon et al., 1979; Platt and Perner, 1983), the global monitoring of tropospheric NO2 has continued uninterruptedly with a suite of UV–visible DOAS instruments with improving sensitivity and horizontal resolution: Envisat SCIAMACHY (Bovensmann et al., 1999), EOS-Aura OMI (Levelt et al., 2018), and the series of MetOp-A/B/C GOME-2 (Valks et al., 2011; Liu et al., 2019b).
Owing to its cardinal role in air quality, tropospheric chemistry, and stratospheric ozone, and as a precursor of essential climate variables (ECVs), the monitoring of atmospheric NO2 on a global scale has been given proper attention in the European Earth Observation programme Copernicus. The Copernicus Space Component (CSC) is developing a constellation of atmospheric composition Sentinel satellites with complementary NO2 measurement capabilities, consisting of Sentinel-4 geostationary missions (with hourly monitoring over Europe) and Sentinel-5 LEO missions (with daily monitoring globally), to be launched from 2023 onwards. A NO2 measurement channel is also planned for the Copernicus Carbon Dioxide Monitoring mission CO2M for better attribution of the atmospheric emissions. The first element in orbit of this LEO+GEO constellation, the TROPOspheric Monitoring Instrument (TROPOMI), was launched on board of ESA's Sentinel-5 Precursor (S5P) early-afternoon LEO satellite in October 2017. This hyperspectral imaging spectrometer measures the Earth's radiance, at 0.2–0.4 nm resolution in the visible absorption band of NO2, over ground pixels as small as 7.0×3.5 or 5.5×3.5 km (before and after the switch to smaller pixel size on 6 August 2019, respectively) and with an almost daily global coverage thanks to a swath width of 2600 km.
Pre-launch mission requirements for the Copernicus Sentinel NO2 data are, for the tropospheric NO2 column, a bias lower than 50 % and an uncertainty lower than 0.7 Pmolec cm−2, and for the stratospheric NO2 column, a bias lower than 10 % and an uncertainty lower than 0.5 Pmolec cm−2 (ESA, 2017a, b). Since the beginning of its nominal operation in April 2018, in-flight compliance of S5P TROPOMI with these mission requirements has been monitored routinely by means of comparisons to ground-based reference measurements in the Validation Data Analysis Facility (VDAF) of the S5P Mission Performance Centre (MPC) and by comparison with similar satellite data from OMI and GOME-2. The Copernicus S5P MPC routine operations validation service is complemented with ground-based validation studies carried out in the framework of ESA's S5P Validation Team (S5PVT) through research projects funded nationally like NIDFORVAL (see details in the Acknowledgements). Ground-based validation of satellite NO2 data (e.g. Petritoli et al., 2003; Brinksma et al., 2008; Celarier et al., 2008; Ionov et al., 2008; Valks et al., 2011; Compernolle et al., 2020b; Pinardi et al., 2020) relies classically on three types of UV–visible DOAS instruments, which, thanks to complementary measurement techniques, provide correlative observations sensitive to the three components of the S5P data product: Multi-Axis Differential Optical Absorption Spectroscopy (MAX-DOAS) measures the tropospheric column during the day, Zenith-Scattered-Light DOAS (ZSL-DOAS) the stratospheric column at dawn and dusk, and Pandora direct Sun instruments the total column during the day, respectively. Currently, these three types of instruments contribute to global monitoring networks. Figure 1 shows the geographical distribution of instruments contributing data to the reported S5P validation study.
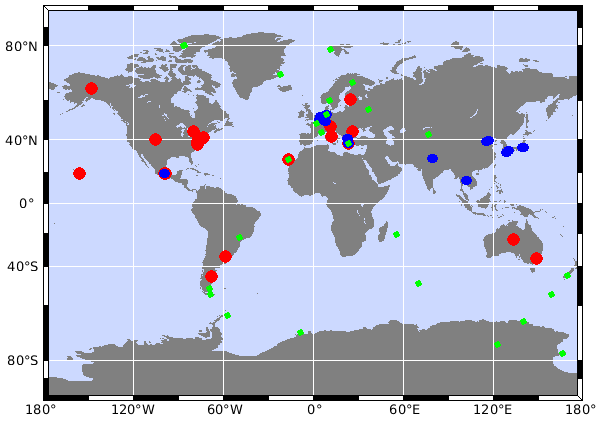
Figure 1Geographical distribution of the UV–visible DOAS spectrometers contributing the ground-based correlative measurements: 26 NDACC ZSL-DOAS instruments in green, 19 MAX-DOAS instruments in blue, and 25 PGN instruments in red.
In this paper, we report on the consolidated results of the S5P NO2 ground-based validation activities for the first 2 years of nominal operation. The TROPOMI tropospheric, stratospheric, and total column data products under investigation, together with the corresponding ground-based reference data, are described in Sect. 2. This is followed by a brief assessment of the coherence between the data generated by the near-real-time (NRTI) and offline (OFFL) channels of the operational processors. For clarity, in separate sections we present results for the stratospheric (Sect. 4), tropospheric (Sect. 5), and total (Sect. 6) NO2 columns. These three sections include a description of the preparation of the filtered, co-located, and harmonized data pairs to be compared and the comparison results. Robust, harmonized statistical estimators are derived from the comparisons consistently throughout the paper: the median difference as a proxy for the bias and half of the 68 % interpercentile (IP68/2) as a measure of the comparison spread (equivalent to a standard deviation for a normal distribution but much less sensitive to unavoidable outliers). Thereafter, in Sect. 7, these individual results are assembled and discussed all together, to derive conclusions on their mutual coherence, on the fitness for purpose of the S5P data, and on remaining challenges for the accurate validation of NO2 observations from space.
2.1 S5P TROPOMI data
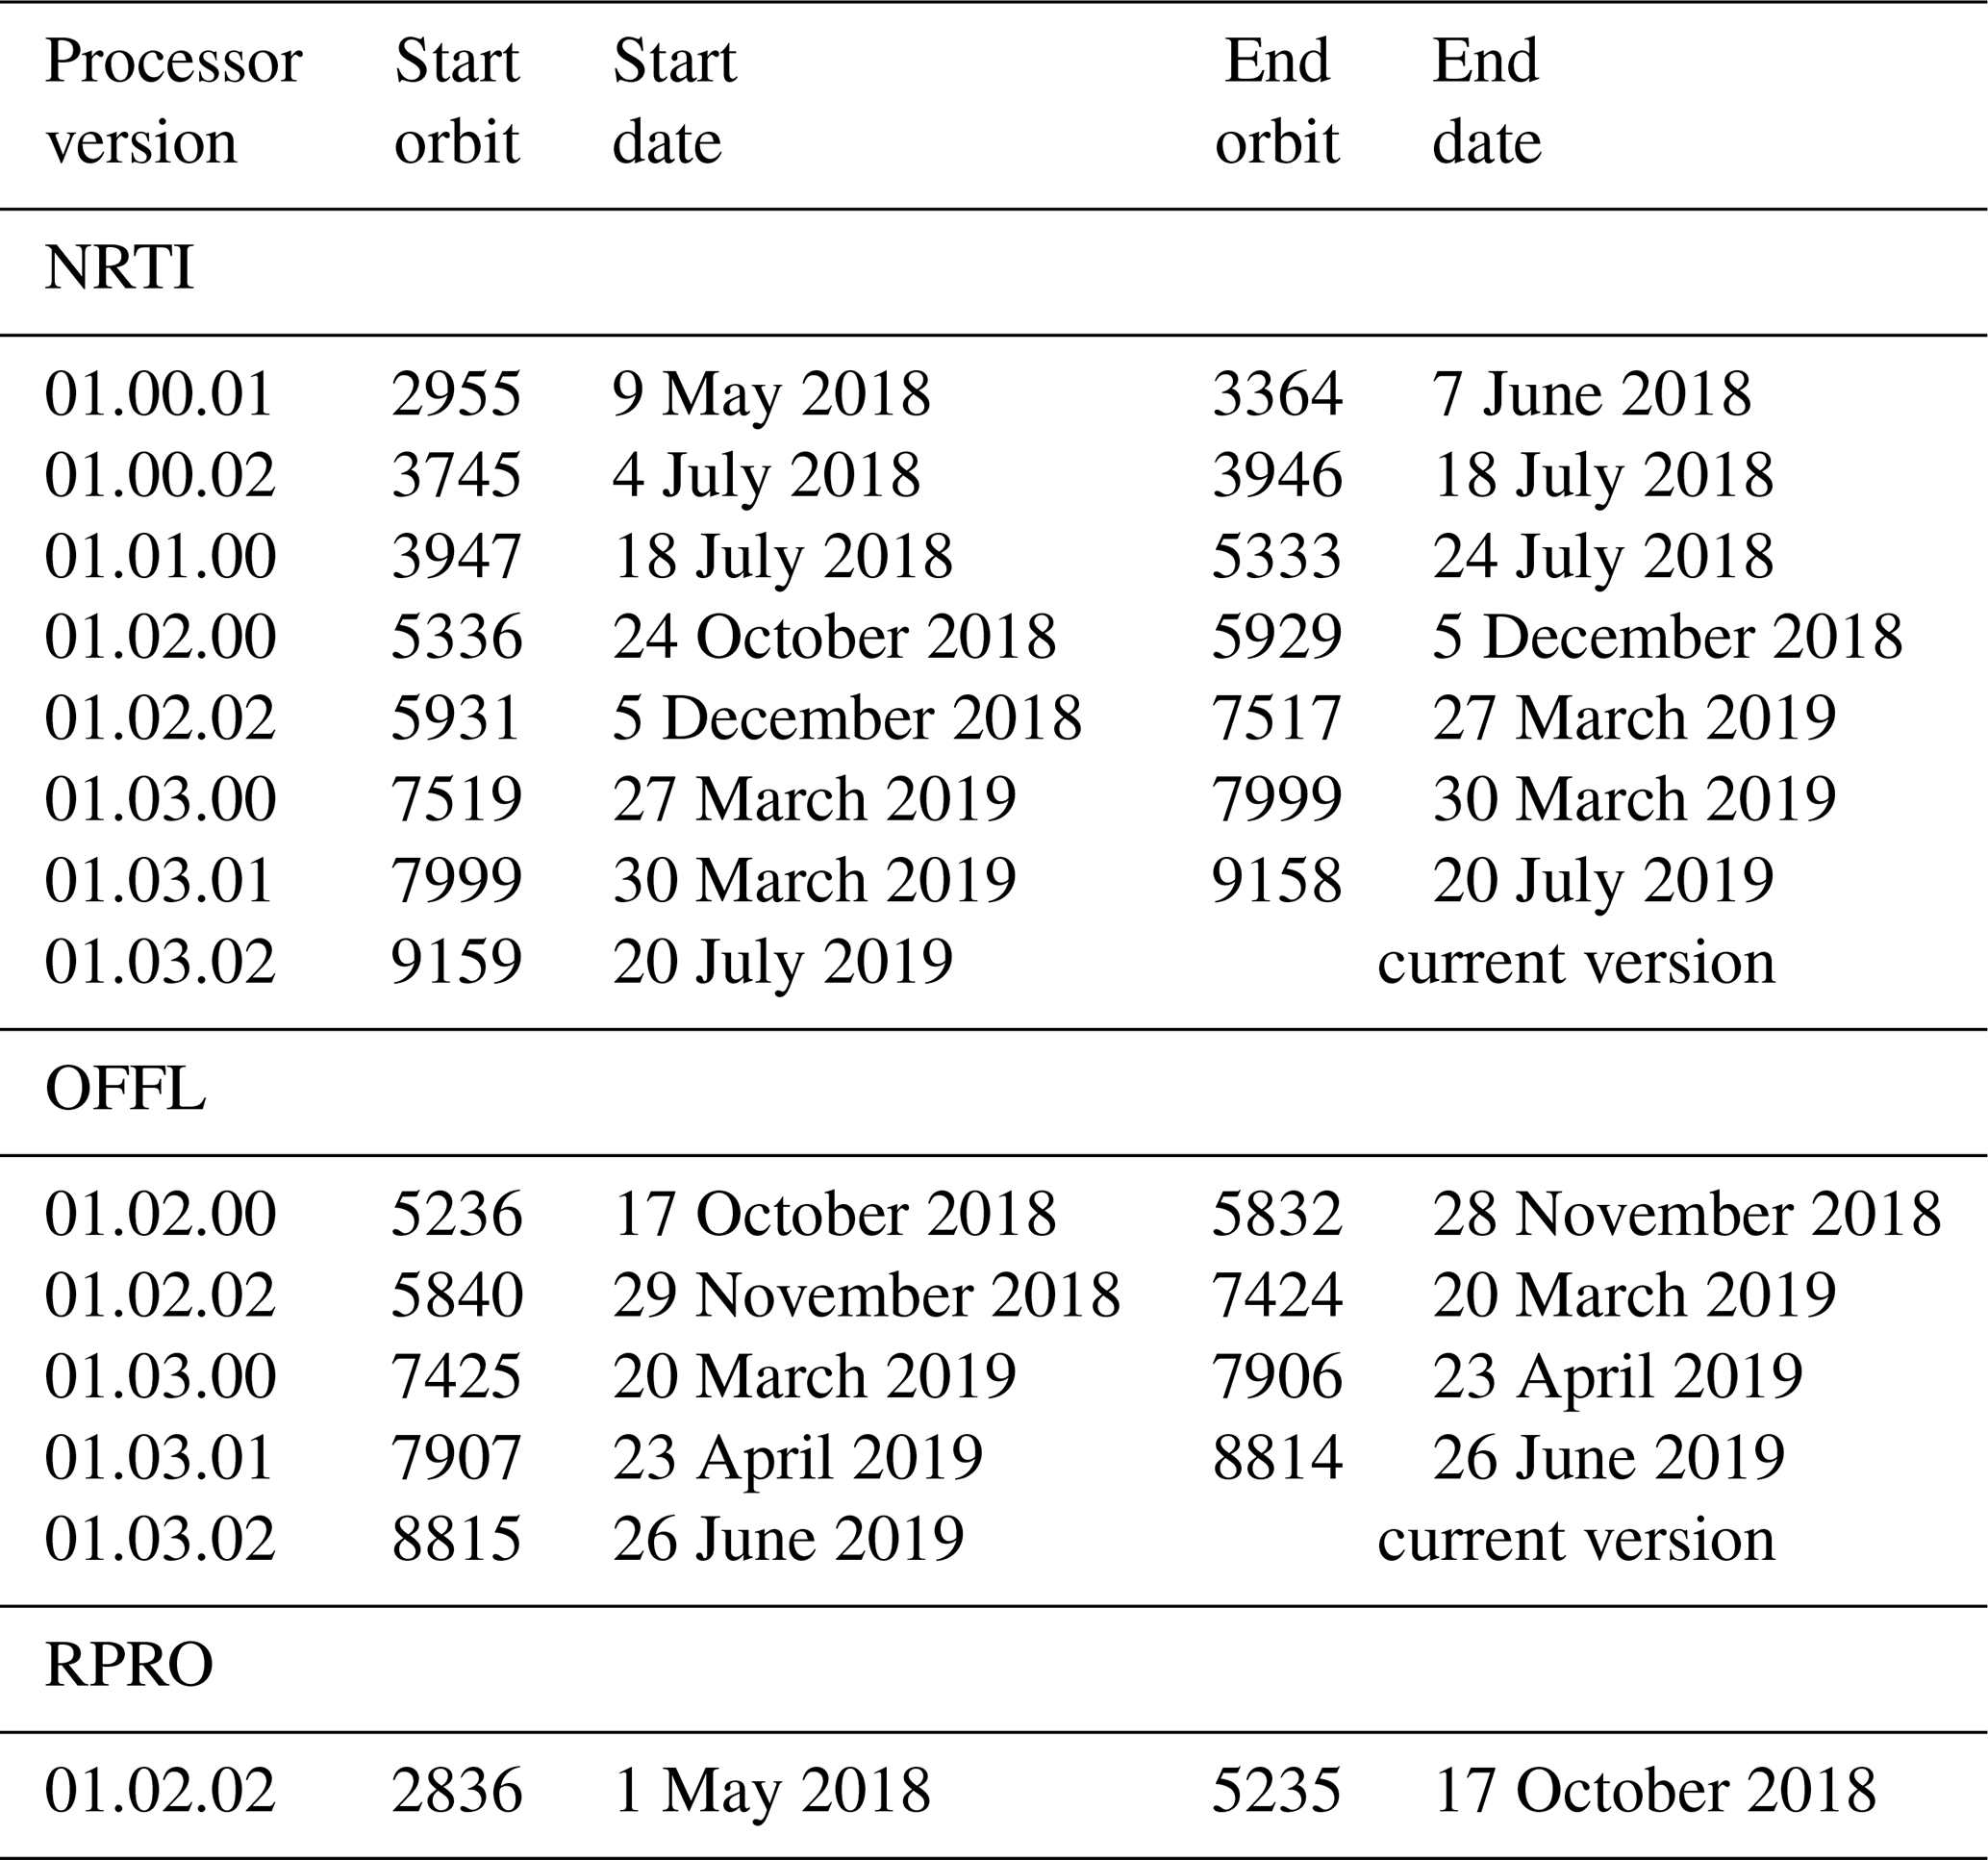
The retrieval of NO2 (sub)columns from TROPOMI Earth nadir radiance and solar irradiance spectra is a three-step process relying on DOAS and on a chemical transport model (CTM)-based stratosphere–troposphere separation. The TROPOMI NO2 algorithm is an adaptation of the QA4ECV community retrieval approach (Boersma et al., 2018) and of the DOMINO/TEMIS algorithm (Boersma et al., 2007, 2011), already applied successfully to heritage and current satellite data records (GOME, SCIAMACHY, OMI, GOME-2). In the first step, the integrated amount of NO2 along the optical path, or slant column density (SCD), is derived using the classical DOAS approach (Platt and Perner, 1983). In the second step, the retrieved SCD is assimilated by the TM5-MP CTM to allocate a vertical profile of the NO2 concentration, needed for the separation between stratospheric and tropospheric SCDs. This assimilation procedure favours observations over pristine, remote areas where the entire NO2 SCD can be attributed to the stratospheric component. Assuming relatively slow changes in the stratospheric NOx field, the model transports information to areas with a more significant tropospheric component. In the third step, the three slant (sub)column densities are converted into vertical (sub)column densities using appropriate air mass factors (AMFs). The CTM can be run either in forecast mode, using 1 d forecast meteorological data from the European Centre for Medium-Range Weather Forecasts (ECMWF), or in a more delayed processing mode, using 0–12 h forecast meteorological data. The former is used for near-real-time (NRTI) processing of the TROPOMI measurements, the latter for the offline (OFFL) production. For full technical details, the reader is referred to the Product Readme File (PRF), Product User Manual (PUM), and Algorithm Theoretical Basis Document (ATBD), all available at http://www.tropomi.eu/data-products/nitrogen-dioxide (last access: 5 January 2021). A detailed description and quality assessment of the derived slant column data have already been published by van Geffen et al. (2020), and a publication on satellite intercomparison of vertical column data is under preparation (Eskes et al., 2020). The current paper addresses the independent ground-based validation of vertical subcolumn densities in the troposphere and stratosphere and of the vertical total column. The S5P dataset validated here covers the nominal operational phase (Phase E2) of the S5P mission, starting in April 2018 and up to February 2020. No data obtained during the commissioning phase of the satellite have been used. Table 1 provides an overview of the processor versions to which this corresponds. They constitute as continuous a dataset as possible from May (NRTI) or October (OFFL) 2018 onwards. Combining interim reprocessing (RPRO) (May–October 2018) with OFFL, a coherent dataset with the OFFL processor v01.02.02 or higher can be obtained.
Table 1Identification of the S5P NO2 data versions validated here: near-real-time channel (NRTI), offline channel (OFFL), and interim reprocessing (RPRO). Major updates were those leading to v01.02.00 and to v01.03.00.
Besides very detailed quality flags, the S5P NO2 data product includes a combined quality assurance value (qa_value) enabling end users to easily filter data for their own purpose. For tropospheric applications (when not using the averaging kernels), the guideline is to use only NO2 data with a qa_value >0.75. This removes very cloudy scenes (cloud radiance fraction >0.5), snow- or ice-covered scenes, and problematic retrievals. For stratospheric applications, where clouds are less of an issue, a more relaxed threshold of qa_value >0.5 is recommended. These data filtering recommendations have been applied here, where the stricter requirement of qa_value >0.75 has been used for the total column validation as well. Again, further details on this can be found in the PRF, PUM, and ATBD.
2.2 NDACC zenith-sky DOAS data
Since the pioneering ages of NO2 column measurements from space with ERS-2 GOME in the mid-1990s, ground-based UV–visible DOAS measurements at twilight have served as a reference for the validation of NO2 total column data over unpolluted stations and of NO2 stratospheric column data from all nadir UV–visible satellites to date (e.g. Lambert et al., 1997a, b; Petritoli et al., 2003; Celarier et al., 2008; Ionov et al., 2008; Gruzdev and Elokhov, 2010; Dirksen et al., 2011; Hendrick et al., 2011; Robles-Gonzalez et al., 2016). Here as well, S5P TROPOMI stratospheric NO2 column data are compared to the correlative measurements acquired by ZSL-DOAS (Zenith-Scattered-Light Differential Optical Absorption Spectroscopy) UV–visible spectrometers (e.g. Solomon et al., 1987; Hendrick et al., 2011, and references therein). A key property of zenith-sky measurements at twilight is the geometrical enhancement of the optical path in the stratosphere (Solomon et al., 1987), which offers high sensitivity to stratospheric absorbers of visible radiation and lower sensitivity to clouds and tropospheric species (except in the case of strong pollution events during thunderstorms or thick haze; see, for example, Pfeilsticker et al., 1999). However, the geometrical enhancement also implies horizontal smoothing of the measured information over hundreds of kilometres, which requires appropriate co-location methods to avoid large discrepancies with the higher resolution measurements of TROPOMI, as discussed in Sect. 4.1. Various ZSL-DOAS UV–visible instruments with standard operating procedures and harmonized retrieval methods perform network operation in the framework of the Network for the Detection of Atmospheric Composition Change (NDACC; De Mazière et al., 2018). As part of this, over 15 instruments of the SAOZ design (Système d'Analyse par Observation Zénitale) are distributed worldwide and provide data in near-real time through the CNRS LATMOS_RT Facility (Pommereau and Goutail, 1988). For the current work, ZSL-DOAS validation data have been obtained: (1) through the LATMOS_RT Facility (in near-real-time processing mode), (2) from the NDACC Data Host Facility (DHF), and (3) via private communication with the instrument operator. The geographical distribution of these instruments is shown in Fig. 1, and further details are provided in Sect. A1. Measurements are made during twilight, at sunrise, and at sunset, but only sunset measurements are used here for signal-to-noise reasons (larger NO2 column) and as these happen closer in time to the early-afternoon overpass of S5P. NDACC intercomparison campaigns (Roscoe et al., 1999; Vandaele et al., 2005) conclude an uncertainty of about 4 %–7 % on the slant column density. After conversion of the slant column into a vertical column using a zenith-sky AMF, and for the latest version of the data processing, the uncertainty on the vertical column is estimated to be on the order of 10 %–14 % (Yela et al., 2017; Bognar et al., 2019). Estimated uncertainties for all ground-based measurement types are summarized in Table 2. In Sect. 4.1, the photochemical adjustment required to correctly compare twilight with midday measurements is described.
Yela et al. (2017)Bognar et al. (2019)Hendrick et al. (2014)Kanaya et al. (2014)Herman et al. (2009)Choi et al. (2019)Table 2Estimated uncertainties for the different types of ground-based measurements used in this work. Ex ante refers to uncertainties provided with the data, based on a propagation of raw measurement uncertainties and on sensitivity analyses. Ex post refers to uncertainty estimates derived by comparison with other (independent) measurements, which inevitably also contain some representativeness uncertainties. More detail is provided in the dedicated subsections of Sect. 2.
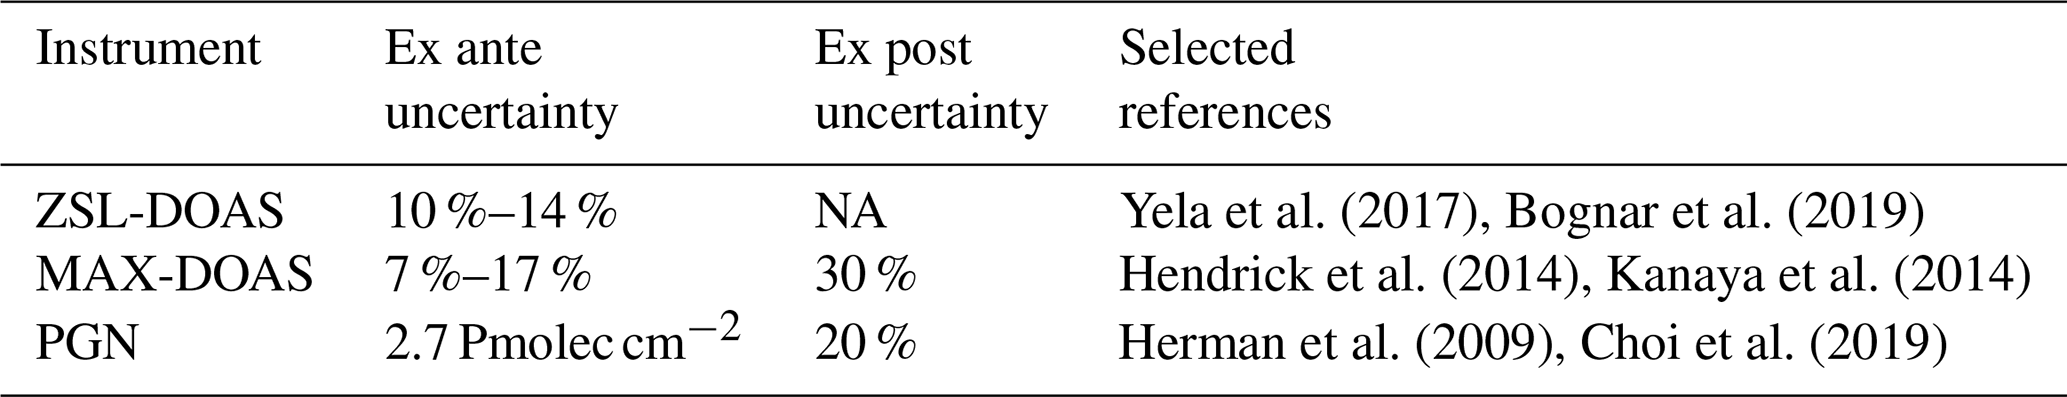
NA: not available.
2.3 MAX-DOAS data
Satellite tropospheric NO2 column data are compared classically to correlative measurements acquired by Multi-Axis Differential Optical Absorption Spectroscopy (MAX-DOAS) instruments (Hönninger and Platt, 2002; Hönninger et al., 2004; Sinreich et al., 2005). From sunrise to sunset, MAX-DOAS instruments measure the UV–visible radiance scattered in several directions and elevation angles, from which the tropospheric vertical column density (VCD) and/or the lowest part of the tropospheric NO2 profile (usually up to 3 km altitude, and up to 10 km at best) can be retrieved through different techniques (see, for example, Clémer et al., 2010; Hendrick et al., 2014; Friedrich et al., 2019; Bösch et al., 2018; Irie et al., 2008, 2011; Vlemmix et al., 2010; Wagner et al., 2011; Beirle et al., 2019), with between 1 and 3 degrees of freedom. Their horizontal spatial representativeness varies with the aerosol load and the spectral region of the retrieval, from a few kilometres to tens of kilometres (Irie et al., 2011; Wagner et al., 2011; Wang et al., 2014). Published total uncertainty estimates on the NO2 tropospheric VCD are of the order of 7 %–17 % in polluted conditions, including both random (around 3 % to 10 %, depending on the instrument) and systematic (11 % to 14 %) contributions (Irie et al., 2011; Wagner et al., 2011; Hendrick et al., 2014; Kanaya et al., 2014). These ranges are more or less confirmed by the uncertainties reported in the data files, as visualized in Fig. A1. Nevertheless, differences in the reported uncertainties and in the actual measurement of the same scene between individual instruments are sometimes larger, and the main potential sources of these inhomogeneities are summarized below:
- -
Different uncertainty reporting strategy. The reported systematic uncertainty may include only that from the NO2 cross sections (approx. 3 %; UNAM, BIRA-IASB, MPIC, AUTH, IUPB), or it may include also a contribution from the VCD retrieval step (up to 14 % in JAMSTEC data and 20 % in KNMI data) and the aerosol retrieval (Chiba U; Irie et al., 2011).
- -
Different SCD retrieval. Recommended common DOAS settings are used by all groups in the present study, and when doing so, instrument intercomparison campaigns like CINDI-1 and CINDI–2 (Roscoe et al., 2010; Kreher et al., 2020) revealed relative biases between 3 % and 10 % in the differential slant column density (DSCD).
- -
Different methods to retrieve VCD from DSCD (see also Table A2). Using either (1) vertical profile inversion using optimal estimation (BIRA-IASB, UNAM); (2) profile inversion using (an optimal estimation of) parameterized profile shapes (JAMSTEC and Chiba U); (3) direct retrieval via the calculation of a tropospheric AMF (QA4ECV datasets); or (4) direct retrieval using a geometrical approximation can lead to systematic differences in the 5 %–15 % range (Vlemmix et al., 2015; Frieß et al., 2019).
Consequently, expert judgement on the total uncertainty at the network level yields a conservative estimate of 30 % uncertainty in polluted conditions. Ongoing efforts to harmonize MAX-DOAS tropospheric NO2 data processing, e.g. as part of the ESA FRM4DOAS project, should help minimize such network inhomogeneities in the near future.
MAX-DOAS data have been used extensively for tropospheric NO2 satellite validation, for instance for Aura OMI and MetOp GOME-2 (e.g. by Celarier et al., 2008; Irie et al., 2012; Lin et al., 2014; Kanaya et al., 2014; Wang et al., 2017; Drosoglou et al., 2018; Liu et al., 2019a; Compernolle et al., 2020b; Pinardi et al., 2020), as well as for the evaluation of modelling results (Vlemmix et al., 2015; Blechschmidt et al., 2020).
Data are collected either through ESA's Atmospheric Validation Data Centre (EVDC; https://evdc.esa.int/, last access: 5 January 2021) or by direct delivery from the instrument principal investigators (e.g. within the S5PVT NIDFORVAL AO project). Currently, 19 MAX-DOAS stations have contributed correlative data in the TROPOMI measurement period from April 2018 to February 2020. Detailed information about the stations and instruments is provided in Sect. A2. A few contributing sites measure in several geometries (e.g. Xianghe measure in both MAX-DOAS and direct Sun mode; Bremen and Athens both report MAX-DOAS and zenith-sky measurements) or have multiple instruments (e.g. Cabauw and UNAM stations host both MAX-DOAS and Pandora instruments). This allows for detailed (sub)column consistency checks and in-depth analysis of the site peculiarities, beyond the scope of the present overview paper.
2.4 PGN/Pandora data
The Pandonia Global Network (PGN) delivers direct Sun total column and multi-axis tropospheric column observations of several trace gases, including NO2, from a network of ground-based standardized Pandora Sun photometers in an automated way. In this work, only direct Sun observations are used. These have a random error uncertainty of about 0.27 Pmolec cm−2 and a systematic error uncertainty of 2.7 Pmolec cm−2 (Herman et al., 2009). Studies at US and Korean sites during the DISCOVER-AQ campaign found a good agreement of Pandora instruments with aircraft in situ measurements (within 20 % on average; Choi et al., 2019), although larger differences are observed for individual sites (Nowlan et al., 2018).
Pandora data have been used before to validate satellite NO2 measurements from Aura OMI (Herman et al., 2009; Tzortziou et al., 2014; Kollonige et al., 2018; Choi et al., 2019; Judd et al., 2019; Griffin et al., 2019; Herman et al., 2019; Pinardi et al., 2020) and TROPOMI (Griffin et al., 2019; Ialongo et al., 2020; Zhao et al., 2020).
For the current work, 25 sites have contributed Pandora data, collected either from the ESA Atmospheric Validation Data Centre (EVDC) (https://evdc.esa.int/, last access: 5 January 2021) or from the PGN data archive (https://pandonia-global-network.org/, last access: 5 January 2021). Only data files from a recent quality upgrade (processor version 1.7, retrieval version nvs1, with file version 004 and 005; see https://www.pandonia-global-network.org/home/documents/release-notes/, last access: 5 January 2021) were used, with 005 files (consolidated data) having precedence over 004 files (rapid delivery data). The most important change with the previous data release is a more stringent quality filtering. A total of 17 sites have provided measurement data newer than 3 months.
Except at low Sun elevation, the footprint of these direct Sun measurements is much smaller than a TROPOMI pixel. Therefore, as is the case with MAX-DOAS, a significant horizontal smoothing difference error can be expected in the TROPOMI–Pandora comparison, especially in the case of tropospheric NO2 gradients and when tropospheric NO2 is the largest contributor to the total column.
Three Pandora instruments (Altzomoni, Izaña, Mauna Loa) are located near the summit of a volcanic peak and are therefore not sensitive to the lower lying tropospheric NO2. In this work, their observations are compared to the TROPOMI stratospheric NO2 data (see Sect. 4).
Vandaele et al. (1998)(Zara et al., 2017)Vandaele et al. (1998)Harder et al. (1997)Vandaele et al. (1996)Vandaele et al. (1998)Peters et al. (2017)Vandaele et al. (1998)Table 3NO2 cross section source and temperature for the different data processing used in this work. More detail is provided in Sect. 2.5.

2.5 NO2 cross section data
A potential source of inconsistencies between the different data products lies in the NO2 cross sections that are used. An overview of the different choices made is provided in Table 3. Most products use the cross sections published by Vandaele et al. (1998), but there are differences in the choice of temperature at which to take the cross sections. The ZSL-DOAS measurements are processed with cross sections at a fixed 220 or 227 K, i.e. typical stratospheric temperatures. MAX-DOAS data are processed either with cross sections at room temperature (298 K, representing a typical tropospheric temperature) or using an orthogonalized set of cross sections at 298 and 220 K when both tropospheric and stratospheric slant columns are retrieved. As the scientific focus of the PGN up until processor version 1.7 (used for this study) was on measuring polluted conditions, i.e. in the presence of moderate to large tropospheric columns, the cross sections used in the processor are scaled to a fixed effective temperature of 254.4 K, which corresponds to the situation of approximately equal column amounts in the troposphere and stratosphere. The S5P retrievals use cross sections at 220 K but with an explicit correction for the temperature dependence of the NO2 cross sections in the AMF: space–time co-located daily ECMWF temperature profile forecasts are used to compute a height-dependent AMF correction factor. The temperature sensitivity parameterized in this correction is approximately 0.32 % K−1 (Zara et al., 2017). A posteriori temperature correction of the ground-based data is beyond the scope of this paper, so it must be kept in mind that this may contribute to differences between S5P and ground-based columns. Specifically, we could expect a small seasonal cycle in the stratospheric column comparisons of a few percent due to the seasonal variation in stratospheric temperature not being accounted for in the ZSL-DOAS data processing. PGN columns may either be overestimated by up to 10 % when the column is mostly stratospheric or underestimated by a similar order of magnitude when large tropospheric amounts are present. The MAX-DOAS data may be biased in either direction by a few percent when tropospheric and/or stratospheric temperatures differ strongly from the 298 and 220 K default temperatures.
As described in Sect. 2.1, the main difference between the NRTI and OFFL data processors lies in the use of either 1 d or 0–12 h forecast ECMWF meteorological data as input, which impacts the TM5-MP vertical NO2 profiles. The mutual consistency between the NRTI and OFFL data products is monitored routinely using data and tools provided by the S5P MPC Level-2 Quality Control Portal (http://mpc-l2.tropomi.eu, last access: 5 January 2021). Figure 2 shows that, looking at global means of the NO2 total column, the NRTI and OFFL data look very much alike, with NRTI column values on average 0.79 % larger than those obtained in OFFL. Eight NRTI and six OFFL processor versions are used in this comparison (as identified in Table 1). The activation of the successive processor versions and the switch to the smaller ground pixel size (on 6 August 2019) are marked by the yellow vertical lines. As expected, both NRTI and OFFL channels show NO2 maxima in the winter/summer seasons (December, June) and minima near the equinoxes. The scatter also exhibits a seasonal cycle, with the largest values observed in the Northern Hemisphere winter season.
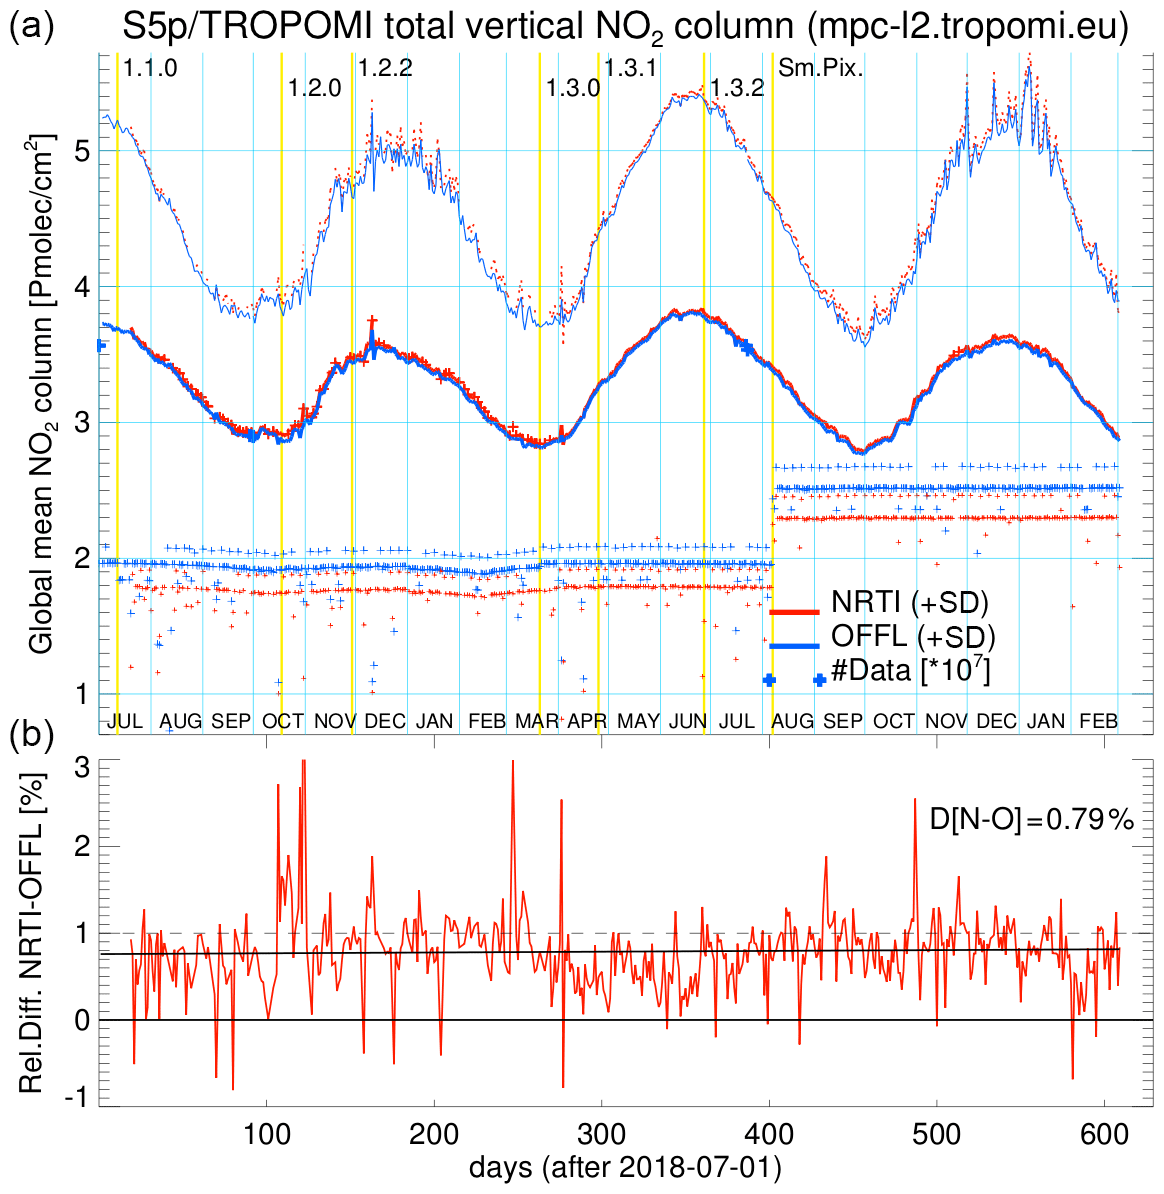
Figure 2(a) Time series of the global means of NO2 total column data retrieved with the NRTI (red line) and OFFL (blue line) processors, and their standard deviation, in Pmolec cm−2, from July 2018 till February 2020. Crosses depict the number of measurements divided by 107, with the same colour code: red for NRTI, blue for OFFL. Yellow vertical lines indicate the transition dates for processor upgrades and the switch to the smaller ground pixel size. (b) Percent relative difference between NRTI and OFFL global means of total NO2 values. The Theil–Sen linear regression line (black) is superimposed.
To further assess similarities and differences between the NRTI and OFFL processing channels, NO2 values along individual orbits are also compared directly. An illustration is given in Fig. 3 for S5P orbit no. 07407, a randomly selected orbit crossing western Europe on a relatively cloud-free day (19 March 2019). Data were filtered to include only those pixels with a qa_value larger than 0.5 and were gridded to before calculating the differences.
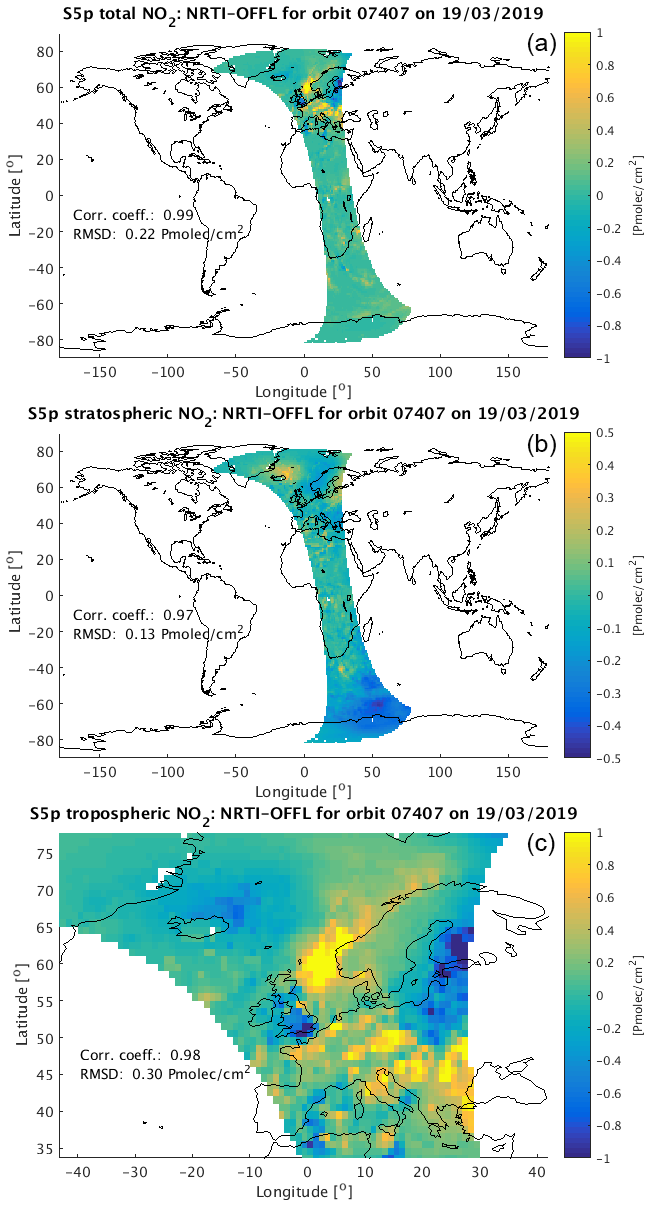
Figure 3Maps of the difference between the NRTI and OFFL NO2 data values for S5P orbit no. 07407 on 19 March 2019. Difference between (a) total column values and (b) stratospheric column values. (c) Close-up of the difference in tropospheric column values over western Europe.
The three maps of Fig. 3 show the difference between NRTI and OFFL values for the total, stratospheric, and tropospheric NO2 column, respectively, together with the corresponding Pearson correlation coefficient and root-mean-square deviation (RMSD). While the correlation coefficient is high (typically around 0.98), the maps do reveal regions where significant deviations occur, up to ±0.5 Pmolec cm−2 between the NRTI and OFFL stratospheric columns and up to ±2 Pmolec cm−2 for both the tropospheric columns and the total columns. North-east of Iceland, NRTI-OFFL differences in stratospheric and in tropospheric columns are of opposite sign, while total column differences are minimal, indicating a different stratosphere–troposphere separation after the slant column retrieval leading. West of Norway, total columns differ significantly between NRTI and OFFL, and these differences are allocated mostly to the tropospheric columns. These features are specific to this particular orbit and not systematic. A more detailed investigation targeted solely at regions and times of significant deviations between NRTI and OFFL would be needed to better reveal the full benefit of the OFFL analysis, but that is beyond the scope of the current paper. What needs to be underlined is that the ground-based validation studies on which the present consolidated results are based upon do not yield significantly different conclusions for the two processing modes. Therefore, all results reported in this paper may be considered as applicable to the two processing channels.
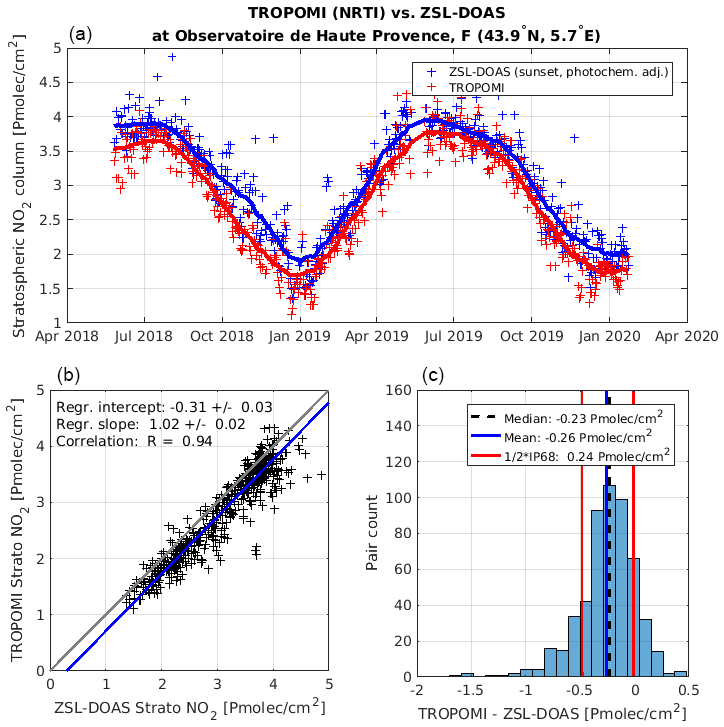
Figure 4(a) Time series of S5P NRTI stratospheric NO2 column data co-located with ground-based SAOZ sunset measurements performed by CNRS/LATMOS at the NDACC mid-latitude station of Observatoire de Haute-Provence (France). The latter were adjusted for the photochemical difference between the S5P and twilight solar local times, while S5P data were averaged over the ground-based twilight air mass. Solid lines represent 2-month running medians. Scatter plot (b) and histogram of the differences (c) with several statistical measures of the agreement between data.
4.1 Co-location and harmonization
To reduce mismatch errors due to the significant difference in horizontal sensitivity between S5P and ZSL-DOAS measurements, individual TROPOMI NO2 stratospheric column data (in ground pixels at high horizontal sampling) are averaged over the much larger footprint of the air mass to which the ground-based zenith-sky measurement is sensitive; see Lambert et al. (1997b, 2012), Verhoelst et al. (2015), and Compernolle et al. (2020b) for details. The length of this footprint if of the order of 300–600 km in the direction of the Sun, and the width is typically of the order of 50–100 km at mid-latitudes, depending on the duration of sunrise and sunset. Note that, as the TROPOMI stratospheric column is a TM5 output, its true resolution is actually much lower than the pixel size. To account for effects of the photochemical diurnal cycle of stratospheric NO2, the ZSL-DOAS measurements at sunset are adjusted to the early-afternoon S5P overpass time using a model-based correction factor. The latter is calculated with the PSCBOX 1D stacked-box photochemical model (Errera and Fonteyn, 2001; Hendrick et al., 2004), initiated by daily fields from the SLIMCAT chemical transport model (CTM). The amplitude of the adjustment factor is sensitive to the effective solar zenith angle (SZA) assigned to the ZSL-DOAS measurements. It is assumed here to be 89.5∘ or, during polar day and close to polar night, the largest or smallest SZA reached, respectively. This photochemical correction factor is an average based on 10 years of the box-model simulations, and the range of values over these 10 years can be considered an uncertainty estimate. It varies between 1 % and 6 % at the sites considered here, the uncertainty being largest at high latitudes in local winter. This does however not contain any model uncertainty (in the sense of the accuracy of the model in representing the true photochemical variation during the day). Another way to estimate the uncertainty in the adjusted ZSL-DOAS data is by comparing the agreement between sunrise and sunset measurements when both are photochemically adjusted to the S5P overpass time. This does also contain co-location mismatch uncertainty due to transport of air occurring during the period between sunrise and sunset and due to the different air masses that are probed (east or west of the instrument respectively). Moreover, it also contains that part of the measurement uncertainty that is not systematic on a daily (or longer) timescale. We find that sunrise and sunset measurements typically agree within 6 % (standard deviation of the differences). Overall, the 10 %–14 % total uncertainty estimate already presented in Sect. 2.2 thus seems realistic.
4.2 Comparison results
Figure 4 illustrates the comparison between TROPOMI and ground-based ZSL-DOAS SAOZ NO2 data at the NDACC station at Observatoire de Haute-Provence (OHP) in southern France. The time series reveal a small negative median difference for TROPOMI, which is found to be a common feature across the network, but little seasonal structure. The correlation coefficient is excellent, and the histogram of the differences has an almost Gaussian shape.
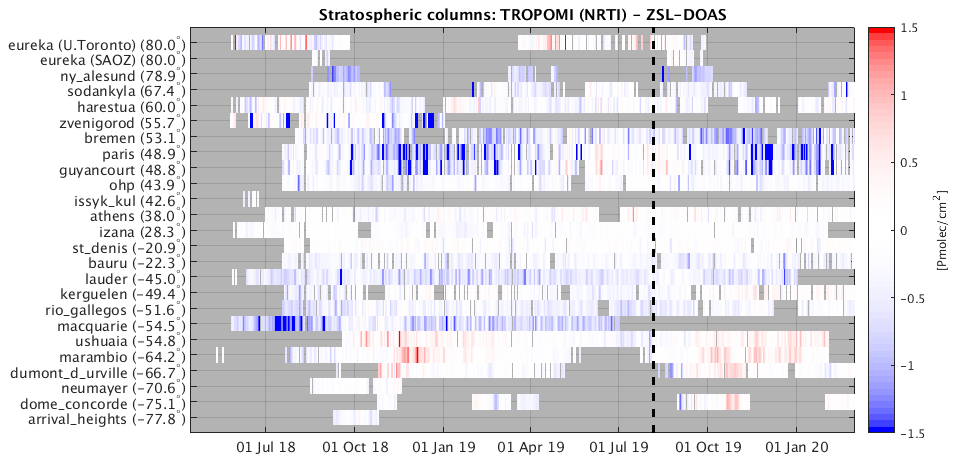
Figure 5Difference between the S5P TROPOMI and NDACC ZSL-DOAS NO2 stratospheric column data as a function of time, after photochemical adjustment of the ZSL-DOAS sunset data to the S5P SZA. Stations are ordered by increasing latitude (south at the bottom). The dashed vertical line on 6 August 2019 represents the reduction in S5P ground pixel size from 7.0×3.5 to 5.5×3.5 km.
Comparison results for the entire ZSL-DOAS network are presented in Fig. 5. This figure reveals occasionally larger differences in more difficult co-location conditions (e.g. enhanced variability at the border of the polar vortex) but no impact of the TROPOMI pixel size change on 6 August 2019. The latter result must be interpreted with care as, for these comparisons, multiple TROPOMI pixels are averaged over the ZSL-DOAS observation operator before comparison (see Sect. 4.1), and as such any change in the noise statistics of individual pixels will be hidden.
Statistical estimators of the bias (median difference) and scatter per station are presented in box-and-whisker plots in Fig. 6 and in tabular form in Sect. A1. Across the network, S5P NRTI and OFFL stratospheric NO2 column data are generally lower than the ground-based values by approximately 0.2 Pmolec cm−2, with a station–station scatter of this median difference of similar magnitude (0.3 Pmolec cm−2). These numbers are within the mission requirement of a maximum bias of 10 % (equivalent to 0.2–0.4 Pmolec cm−2, depending on latitude and season) and within the combined systemic uncertainty of the reference data and their model-based photochemical adjustment. The IP68/2 dispersion of the difference between TROPOMI stratospheric column and correlative data around their median value rarely exceeds 0.3 Pmolec cm−2 at sites without tropospheric pollution. When combining random errors in the satellite and reference measurements with irreducible co-location mismatch effects, it can be concluded that the random uncertainty on the S5P stratospheric column measurements falls within the mission requirements of max. 0.5 Pmolec cm−2 uncertainty.
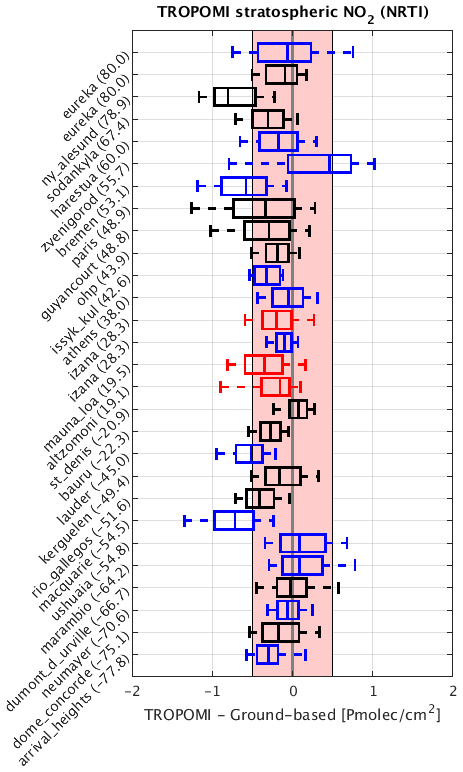
Figure 6Box-and-whisker plots summarizing from pole to pole the bias and spread of the difference between S5P TROPOMI NRTI and NDACC ZSL-DOAS NO2 stratospheric columns (SAOZ data in black, other ZSL-DOAS in blue, and PGN in red). The median difference is represented by a vertical solid line inside the box, which marks the 25 % and 75 % quantiles. The whiskers cover the 9 %–91 % range of the differences. The shaded area represents the mission requirement of 0.5 Pmolec cm−2 for the uncertainty. Values between brackets in the labels denote the latitude of the station.
The potential dependence of the TROPOMI stratospheric column bias and uncertainty on several influence quantities has been evaluated. Figure 7 shows results for the solar zenith angle (SZA), the fractional cloud cover (CF), and the surface albedo of the TROPOMI measurement. This evaluation does not reveal any variation of the bias much larger than 0.4 Pmolec cm−2 over the range of these influence quantities.

Figure 7Dependence of the difference between TROPOMI NRTI and ground-based ZSL-DOAS stratospheric NO2 column data on the satellite solar zenith angle (SZA), satellite cloud fraction, and satellite surface albedo, including a median and IP68/2 spread per bin (bin widths of 10∘ in SZA, 0.05 in CF, and 0.1 in surface albedo). Different colours represent different stations, to illustrate the (modest) impact of station–station network inhomogeneity on these analyses.
4.3 PGN measurements at high-altitude stations
Three of the PGN direct Sun instruments (see Sect. 6) are located near the summit of a volcanic peak: Altzomoni (3985 m a.m.s.l.) in the State of Mexico, Izaña (2360 m a.m.s.l.) on Mount Teide on the island of Tenerife, and Mauna Loa (4169 m a.m.s.l.) on the island of Hawaii. At these high-altitude sites, the total column measured by the ground-based direct Sun instrument misses most of the tropospheric (potentially polluted) part and as such becomes representative of the TROPOMI stratospheric column. These sites have therefore been added to Fig. 6, illustrating that these comparisons based on direct Sun data yield similar conclusions as those based on zenith-sky data, that is, a minor negative median difference of the order of −0.2 Pmolec cm−2. It must be noted that, as discussed in Sect. 2.5, the PGN data are processed using cross sections at a temperature of 254.4 K, representative of a total column made of equal amounts of NO2 in the stratosphere and troposphere. This leads to columns which are about 10 % larger than if they had been processed with cross sections for 220 K. Future processing of the PGN data will address this, and it is expected that this will mostly remove the apparent negative bias for TROPOMI (but lead to a slight inconsistency with the ZSL-DOAS results).
5.1 Co-location and harmonization
TROPOMI data are filtered following the qa_value >0.75 rule as recommended in the associated PRF (see Sect. 2.1). Then for each day, the pixel over the site is selected. MAX-DOAS data series are temporally interpolated at the TROPOMI overpass time (only if data within ±1h exist), and daily comparisons are performed. This short temporal window avoids the need for a photochemical cycle adjustment. Details on the comparison approach are described in Pinardi et al. (2020) for the validation of OMI and GOME-2 NO2 column data and in Compernolle et al. (2020b) for the validation of the OMI QA4ECV NO2 Climate Data Record.

5.2 Comparison results
An illustration of the daily comparisons between TROPOMI and ground-based MAX-DOAS measurements between May 2018 and the end of January 2020 is presented in Fig. 8 for the Uccle station (Brussels, B, with moderate pollution levels). The two datasets have a correlation coefficient of 0.75 and a regression slope and intercept of 0.47 and 1.0 Pmolec cm−2 respectively. The (median and mean) difference of about −2.3 to −3.1 Pmolec cm−2 corresponds to a median relative difference of about −30 %.
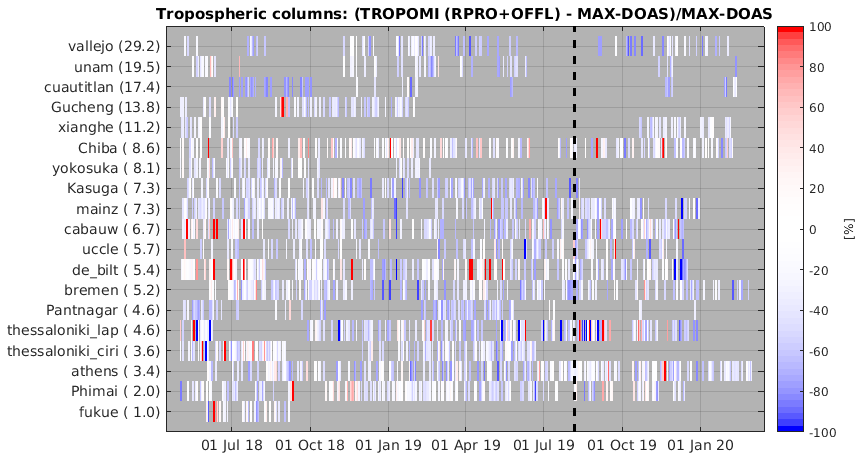
Figure 9Percent relative difference between the S5P TROPOMI and MAX-DOAS NO2 tropospheric column data as a function of time. Stations are ordered by median NO2 tropospheric column (lowest median value at the bottom). The dashed vertical line on 6 August 2019 represents the reduction in S5P ground pixel size from 7.0×3.5 to 5.5×3.5 km2.
Results for the entire MAX-DOAS network are presented in Fig. 9. This figure reveals mostly (but not only) negative differences, with a fairly significant variability but no clear seasonal features. No impact of the TROPOMI ground pixel size change on 6 August 2019 is observed.
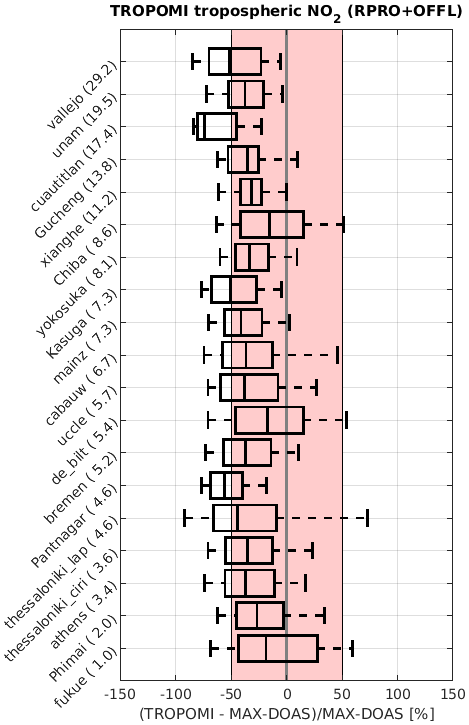
Figure 10Same as Fig. 6 but now for the difference between S5P TROPOMI OFFL and MAX-DOAS NO2 tropospheric columns and ordered as a function of the median ground-based tropospheric column (largest median VCD values on top). The line represents the median difference. Box bounds represent the 25 and 75 percentiles, while whiskers indicate the 9 and 91 percentiles. The shaded area corresponds to the mission requirement of a maximum bias of 50 %.
Box-and-whisker plots for the whole network are shown in Fig. 10, with corresponding numeric values listed in Sect. A2. Based on measurements from these 19 MAX-DOAS stations, three different regimes can be identified:
- i.
Small tropospheric NO2 column values (median values below 2 Pmolec cm−2), e.g. at the Fukue and Phimai stations, lead to small differences. Typically, these stations show a small median bias (<0.5 Pmolec cm−2), but this can still correspond to up to a −27 % relative bias. The dispersion (IP68/2) of the difference is smaller than 1 Pmolec cm−2.
- ii.
More polluted sites (median tropospheric columns from 3 to 14 Pmolec cm−2) experience a clear negative bias. The median difference ranges between −1 and −5 Pmolec cm−2, i.e. between −15 % (Chiba) and −56 % (Pantnagar). This underestimation is similar to the one identified in the validation of Aura OMI and MetOp GOME-2 tropospheric NO2 data by Compernolle et al. (2020b) and Pinardi et al. (2020). The dispersion (IP68/2) of the difference ranges from ∼2 to ∼6 Pmolec cm−2, roughly increasing with increasing tropospheric NO2 median VCD.
- iii.
Extremely polluted sites report larger differences. This is the case, for example, at the Mexican UNAM sites (UNAM and Vallejo in/close to Mexico City and Cuautitlan in a more remote part of the State of Mexico), with median tropospheric columns larger than 15 Pmolec cm−2. These stations experience larger differences (>10 Pmolec cm−2, i.e. from −37 % to −74 %). The dispersion (IP68/2) of the difference is also quite large, between 4 and ∼12 Pmolec cm−2. Results at these sites need deeper analysis.
The overall bias (median of all station median differences) is −2.4 Pmolec cm−2, i.e. −37 %. The median dispersion is 3.5 Pmolec cm−2, while the site–site dispersion (IP68/2 over all site medians) is 2.8 Pmolec cm−2. Note that these network-averaged numbers are close to the numbers found for the polluted (Athens to Gucheng) sites. These results are within the mission requirement of a maximum bias of 50 %, but they exceed the uncertainty requirement of at most 0.7 Pmolec cm−2, which is only satisfied for the clean sites' ensemble. A discussion on the causes of these biases and sometimes large comparisons' spread is provided in Sect. 7.
Two key influence quantities for observations of tropospheric NO2 are aerosol optical depth (AOD) and cloud (radiance) fraction (CRF). The dependence of the differences between MAX-DOAS and TROPOMI tropospheric columns on these two influence quantities is visualized in Fig. 11. AOD is only retrieved in the processing of a handful of MAX-DOAS instruments, the others using climatological information, hence the limited subset in stations in panel (a) of this figure. No clear dependence of the bias on either property is seen, though in view of the relatively large scatter in these tropospheric column comparisons, this does not preclude more subtle dependencies. The impact of aerosol peak height would also be interesting to assess, but this is impossible to judge within the scope of the current paper as no such information is readily available.
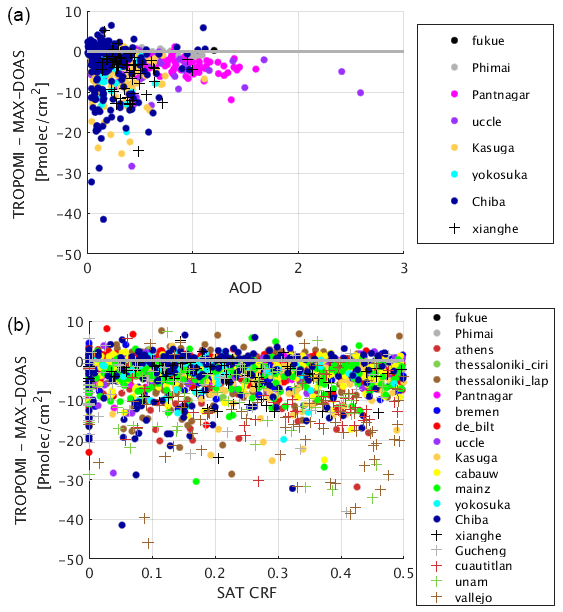
Figure 11Dependence of the difference between TROPOMI OFFL and ground-based MAX-DOAS tropospheric NO2 column data on (a) the MAX-DOAS-retrieved aerosol optical depth (AOD; only available for a subset of the instruments) and (b) the satellite cloud radiance fraction (CRF).
6.1 Filtering, co-location, and harmonization
As was done for the tropospheric column validation in Sect. 5, only S5P pixels with a qa_value of at least 0.75 are retained. The so-called summed product is used, i.e. the total column computed as the stratospheric plus the tropospheric column values. This summed column differs from the total column product. Only Pandonia measurements with the highest quality label (0 and 10) are used. The average column value within a 1 h time interval, centred on the S5P overpass time, is used. As the NO∕NO2 ratio varies only slowly around the afternoon solar local time of the TROPOMI overpass, this small temporal window ensures no model-based adjustment is required. A 30 min time interval was tested as well, but this did not change the results significantly. Moreover, only TROPOMI pixels containing the station were considered.
6.2 Comparison results
An example of a time series of co-located TROPOMI and PGN total column measurements, and their difference, is shown in Fig. 12.
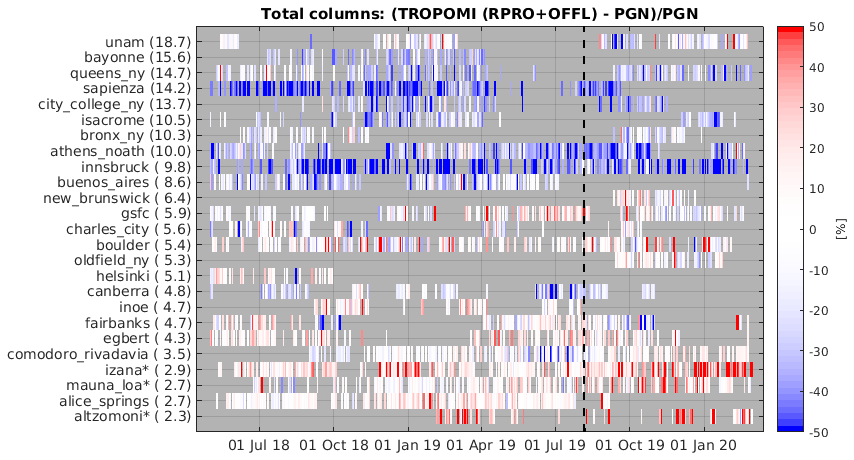
Figure 13Percent relative difference between the S5P TROPOMI and PGN NO2 total column data as a function of time. Stations are ordered by median NO2 total column (lowest median value at the bottom). The dashed vertical line on 6 August 2019 represents the reduction in S5P ground pixel size from 7.0×3.5 to 5.5×3.5 km. The three mountaintop sites more suited for the validation of only the stratospheric column are marked with an asterisk.
Results for the entire PGN network are presented in Fig. 13. This figure reveals that the difference, even in relative units, depends strongly on the total NO2 column, with low (or slightly positive) biases at low columns and markedly negative biases at high columns. No impact is observed for the TROPOMI ground pixel size switch of 6 August 2019.
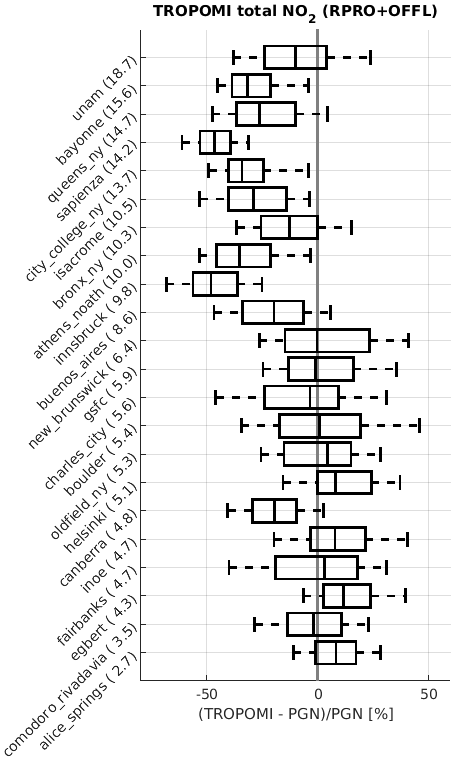
Figure 14Same as Figs. 6 and 10 but now for the difference between S5P TROPOMI (RPRO+OFFL) and PGN NO2 total columns. Stations are ordered by ground-based total NO2 median value, like in Fig. 10. The median difference is represented by a vertical solid line inside the box, which marks the 25 % and 75 % quantiles. The whiskers cover the 9 %–91 % range of the differences. The three mountaintop PGN instruments used for the validation of the stratospheric columns are not included here but in Fig. 6.
Statistical estimators of the comparison results across the network are visualized in Fig. 14 and presented in tabular form in Table A3. One can distinguish roughly two different regimes.
- i.
The PGN median total column value is between 3 (Alice Springs) and 6 Pmolec cm−2 (New Brunswick). The absolute bias (median difference) is within ±0.2 Pmolec cm−2 in most cases (up to +0.5 Pmolec cm−2 at Egbert and Helsinki), while the median relative difference is within 5 % in most cases (up to ∼10 % at Alice Springs, Egbert, Inoe, and Helsinki). Canberra is a deviating case, with larger negative bias (−0.9 Pmolec cm−2; −20 %). The difference dispersion (IP68/2) roughly increases with increasing PGN NO2 median VCD, from 0.4–0.6 Pmolec cm−2 at the three cleanest sites to 1–2 Pmolec cm−2 at the other sites.
- ii.
The PGN NO2 median total column value is between 8 (Buenos Aires) and 19 Pmolec cm−2 (UNAM, Mexico City). A negative bias is observed, ranging from −1 Pmolec cm−2 (−15 %) at the Bronx (New York) to −7 Pmolec cm−2 (−50 %) at Rome Sapienza. The difference dispersion ranges from ∼3 (Buenos Aires) to 5 Pmolec cm−2 (UNAM).
The median relative difference is mostly within (or bordering) the ±10 % range for the sites with lower NO2 median total column values (Alice Springs to New Brunswick; Canberra is an exception), while it is negative and mostly outside this range, but still within ±50 %, for the sites with higher NO2 median total column value (Buenos Aires to UNAM).
The overall bias over all sites (median over all site medians or site relative medians) is −0.5 Pmolec cm−2 (−7 %). The overall dispersion is 1.8 Pmolec cm−2, while the site–site dispersion (IP68/2 over all site medians) is 2.2 Pmolec cm−2.
It is however more useful to make the distinction between sites with low NO2 (Alice Springs to New Brunswick) and high NO2 (Buenos Aires to UNAM). For the low NO2 sites, the overall bias is 0.1 Pmolec cm−2 (2 %), the overall dispersion is 1.1 Pmolec cm−2, and the site–site dispersion is 0.2 Pmolec cm−2. For the high NO2 sites, the overall bias is −3.6 Pmolec cm−2 (−32 %), the overall dispersion is 3.3 Pmolec cm−2, and the site–site dispersion is 1.4 Pmolec cm−2.
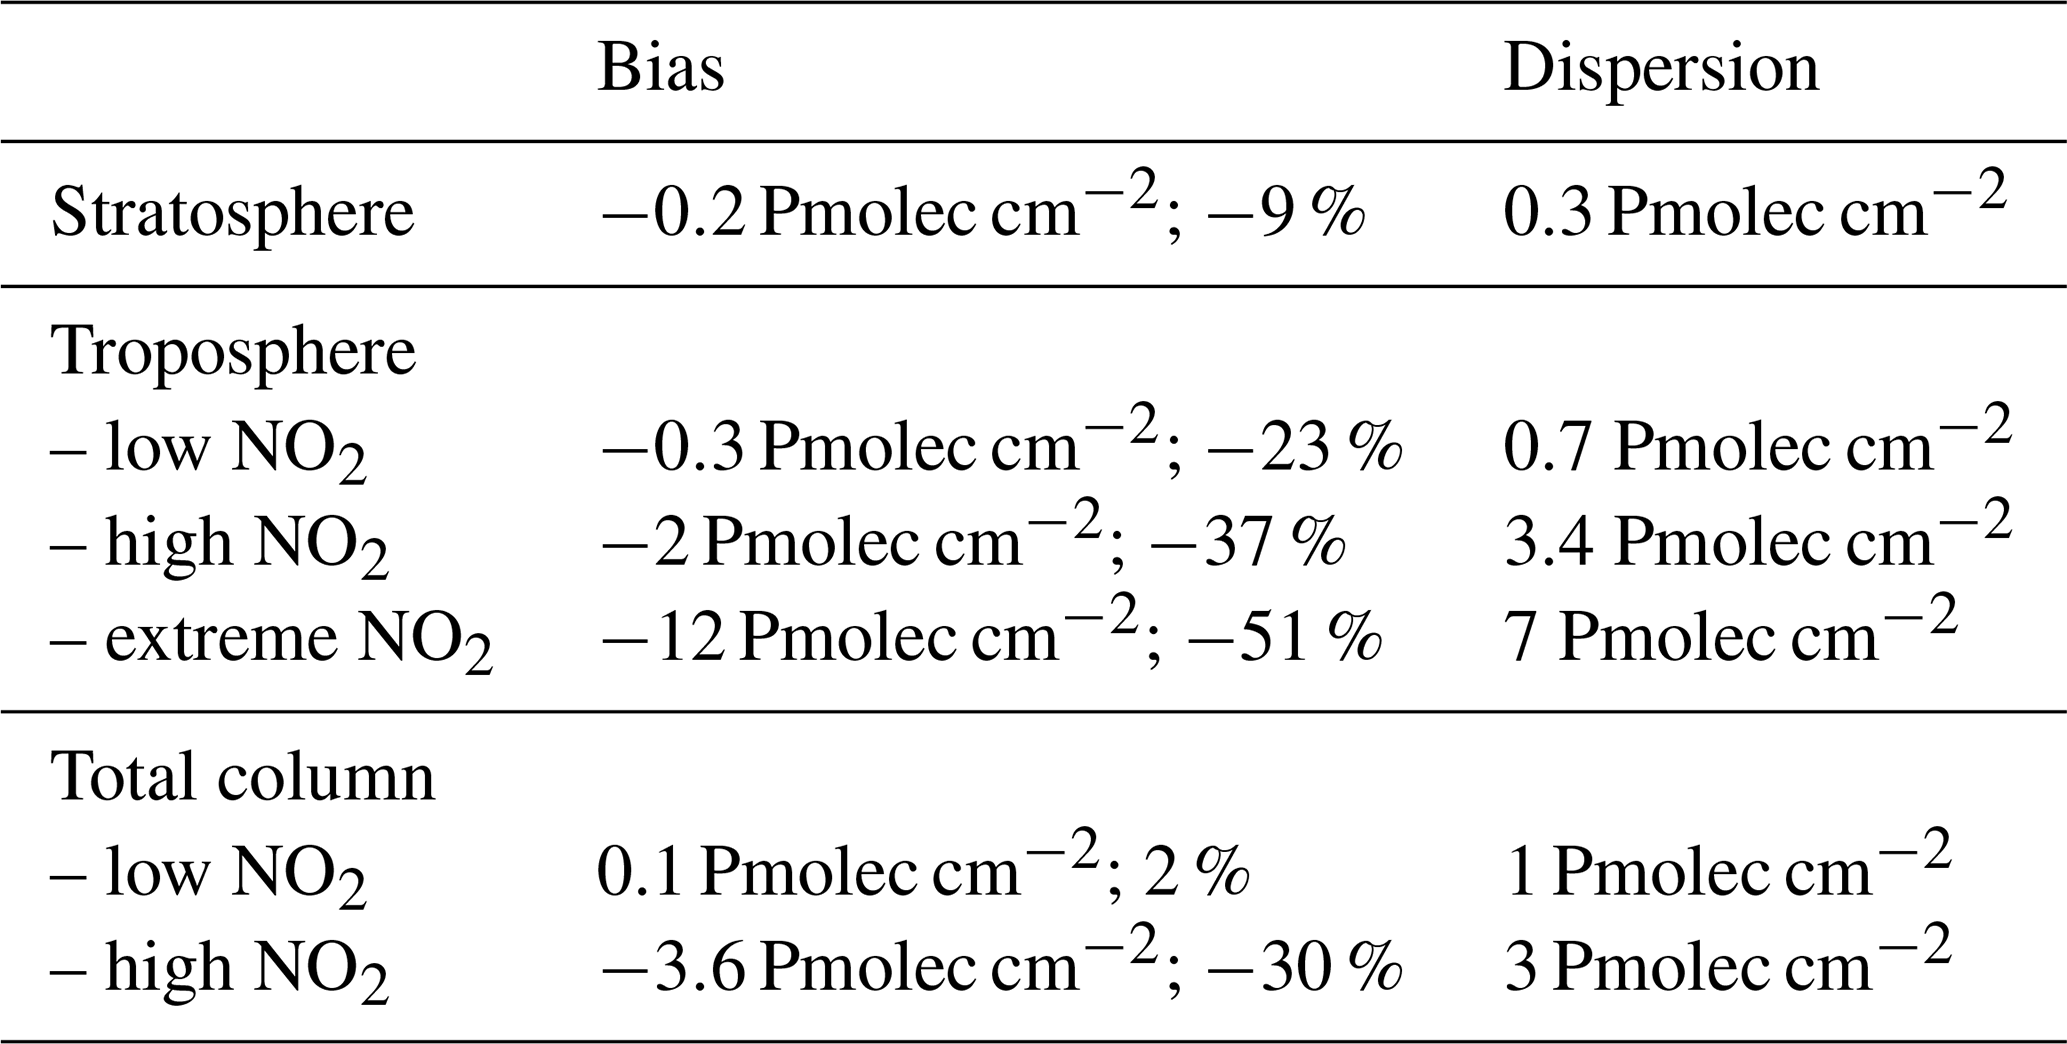
A cross-network summary of the median difference and dispersion for the three S5P NO2 (sub)column data is attempted in Table 4. While the difference between the NRTI and OFFL NO2 values can reach up to a few Pmolec cm−2 for individual TROPOMI pixels, the two processing channels do not lead to significantly different validation results, and Table 4 therefore makes no distinction between the two.
Table 4Cross-network summary of the validation results: bias (median) and dispersion (IP68/2) of the difference with respect to the ground-based correlative measurements (median value over the stations).
For the stratospheric column, the general picture is a slight negative median difference of TROPOMI with respect to the NDACC ZSL-DOAS network, of the order of -0.2 Pmolec cm−2 on average, with some station–station inhomogeneities and with larger differences in the highly variable conditions of the denoxified polar stratosphere in local winter. This median difference remains within the S5P mission requirements and is similar to the conclusions derived for similar satellite data from other sounders (e.g. Compernolle et al., 2020b). In view of the sources of systematic uncertainties in the different components of the comparison (satellite data, reference data, photochemical cycle adjustment, irreducible mismatch errors), this result is entirely within expectations. While comparisons to mountaintop PGN instruments confirm these values, using cross sections at a more appropriate (lower) temperature in the PGN data processing would lead to somewhat smaller columns and therefore a less significant negative median difference than that observed with respect to the ZSL-DOAS instruments. This probably reflects the true accuracy of the ground-based data, which should thus be taken to be of the order of ±10 % at best.
For the tropospheric and total columns, averaging results over the networks with the hope of obtaining a meaningful global estimate is of limited use as the results depend strongly on the amount of tropospheric NO2. Overall, mission requirements in terms of bias are mostly met, the only exception being the tropospheric columns at extremely polluted sites, which have a bias on the threshold of 50 %. Nevertheless, it is clear that large negative median differences are observed across all sites experiencing significant tropospheric pollution. The dispersion of the difference is well outside of the mission requirements formulated for the tropospheric column data. Nevertheless, these results are consistent with those obtained with completely different validation techniques, such as those explored by Lorente et al. (2019) over Paris (using ground-based and Eiffel Tower NO2 concentrations and a climatology of observed column–surface ratios). Many factors play a role in this apparent disagreement between TROPOMI and the ground-based networks, that can neither be attributed solely to the S5P data, nor to pure area-averaging differences.
First, local horizontal and vertical variations of the NO2 field can explain (part of) such discrepancies, as illustrated in Chen et al. (2009), Pinardi et al. (2020), Compernolle et al. (2020b), and Dimitropoulou et al. (2020). While the MAX-DOAS picks up small local enhancements, the much larger satellite pixel provides a smoothed perception of the field. In particular for sounders with footprints (much) larger than the emission sources, this generally leads to underestimation in urban conditions while having better agreement in remote locations (Celarier et al., 2008; Kanaya et al., 2014; Pinardi et al., 2020). Dimitropoulou et al. (2020) showed specific improvements of the S5P NO2 comparison results in the case of the Uccle MAX-DOAS when making use of the multiple azimuthal scan mode and when improving the S5P selection criteria to pixels along the MAX-DOAS field-of-view direction and within the effective sensitivity length. Large inhomogeneities around MAX-DOAS sites were also shown by Wang et al. (2014), Ortega et al. (2015), Gratsea et al. (2016), Peters et al. (2019), and Schreier et al. (2020). When taking some of these inhomogeneities into account in validation of other sounders, results have been improved (Brinksma et al., 2008). Judd et al. (2019) also showed the smoothing of the NO2 field when resampling GeoTASO high-resolution airborne measurements to different simulated satellite pixel sizes.
Second, vertical sensitivity (and thus averaging kernels) and a priori vertical profiles are known to be different for MAX-DOAS and nadir UV–visible satellite retrievals (Wang et al., 2017; Liu et al., 2019b; Compernolle et al., 2020b), with MAX-DOAS measurements sensitive to layers close to the surface and satellite retrievals sensitive mostly to the free troposphere. The effect of the a priori vertical profile on the comparison was estimated for TROPOMI by Dimitropoulou et al. (2020) for Uccle, showing an increase by about 55 % when recalculating the TROPOMI column with MAX-DOAS daily mean tropospheric profile. Similarly, Ialongo et al. (2020) and Zhao et al. (2020) show improvement of the agreement between TROPOMI and Pandora total column data for episodes of NO2 enhancement, when replacing the coarse a priori NO2 profiles with high-resolution profiles from a high-resolution regional air quality forecast model. Somewhat related to the vertical sensitivity is the treatment of aerosol optical depth and its vertical profile. Poor representation of the aerosol opacity has been shown (from simulations) to cause both underestimated NO2 in satellite retrievals and overestimated NO2 in MAX-DOAS measurements (Leitão et al., 2010; Ma et al., 2013; Jin et al., 2016). Satellite-ground discrepancies in previous validation studies have already been attributed to such aerosol issues (Boersma et al., 2018; Compernolle et al., 2020b). Moreover, explicit aerosol corrections in the S5P retrievals have already been shown to improve the agreement (Liu et al., 2020).
Third, the treatment of cloud properties can have a significant effect on the retrieval of the TROPOMI NO2 tropospheric VCD. Eskes et al. (2020) discuss the comparison with OMI NO2 tropospheric column retrievals and show that on average TROPOMI is lower than OMI by −10 % to −12 % over Europe, North America, and India and up to −22 % over China. This difference is mainly attributed to the different cloud data product used in the NO2 retrieval: FRESCO-S derives the cloud top pressure from TROPOMI radiances in the near-infrared O2−A band, while for OMI the cloud top pressure is retrieved from the O2−O2 band in the UV–visible. Preliminary validation results (Compernolle et al., 2020a, and Henk Eskes, private communication, 2020) indicate that FRESCO-S is biased high in pressure, especially at altitudes close to the surface. A new version of FRESCO-S with an adapted wavelength window has been implemented and seems to remove most of the 10 %–22 % bias with OMI in polluted regions.
Fourth, although this work, Compernolle et al. (2020b), and Pinardi et al. (2020) all show a generally good coherence of the validation results among the MAX-DOAS instruments across the network and also among MAX-DOAS and Pandora instruments, network homogenization remains an important challenge to focus on to improve the accuracy of future satellite validations (see Sect. 5 for a description of contributors to network inhomogeneity). Intercomparison campaigns, such as the CINDI-1 and CINDI-2 (Piters et al., 2012; Kreher et al., 2020), in-depth intercomparison studies of the retrieval methods (Frieß et al., 2019; Tirpitz et al., 2020; Peters et al., 2019), and dedicated projects aiming at the harmonization of the processing and of the associated metadata (such as the FRM4DOAS project of ESA's Fiducial Reference Measurements programme) are an important way to achieve this.
Regarding the mutual consistency of MAX-DOAS- and PGN-based validation results, while it may appear that, at low column values, PGN-based comparisons indicate a smaller bias than the MAX-DOAS comparisons, one must not forget that PGN measures the total column: at stations with a lower total column value, the stratospheric contribution is relatively more important. The better agreement here is therefore consistent with the good agreement found for the TROPOMI stratospheric NO2 column vs. ZSL-DOAS and also vs. PGN at pristine mountain sites (Sect. 4). For sites characterized by a higher total NO2 column, the tropospheric contribution becomes more important, and some of the same effects that make satellite–MAX-DOAS comparisons difficult, such as the smoothing difference error, the lower sensitivity of the satellite close to the surface, and the approximate S5P a priori profile, come into play as well.
In conclusion, the first 2 years of Copernicus S5P TROPOMI NO2 column data produced both with the NRTI and OFFL versions 01.0x.xx of the operational processors do meet mission requirements for the bias and, to some extent, with precaution for the uncertainty (dispersion). The different data products available publicly through the Copernicus system are mutually consistent, are in good geophysical and quantitative agreement with ground-based correlative data of documented quality, and can be used for a variety of applications, on the condition that the features and limitations exposed here are taken into proper consideration and that the S5P data are filtered and used according to the recommendations provided in the official Product Readme File (PRF) and associated documentation, also available publicly. Ground-based validation activities relying on the correlative measurements contributed by the NDACC ZSL-DOAS, MAX-DOAS, and PGN global monitoring networks have progressed significantly in recent years and have demonstrated their capacity but also their current limitations in an operational context such as the Copernicus programme. Room does exist for further improvement of both the satellite and ground-based datasets, as well as the intercomparison methodology and its associated error budget. Beyond the methodology advances published here and in aforementioned papers, special effort is needed to understand fully and ever reduce comparison mismatch errors, which so far make the accurate validation of S5P data uncertainty bars difficult. Several updates of the calibration of TROPOMI spectra and of the TROPOMI NO2 data retrieval processors are already in development and in implementation. Upcoming data versions should be validated with the same system as used in the current paper, allowing the necessary independent assessment of the S5P data product evolution.
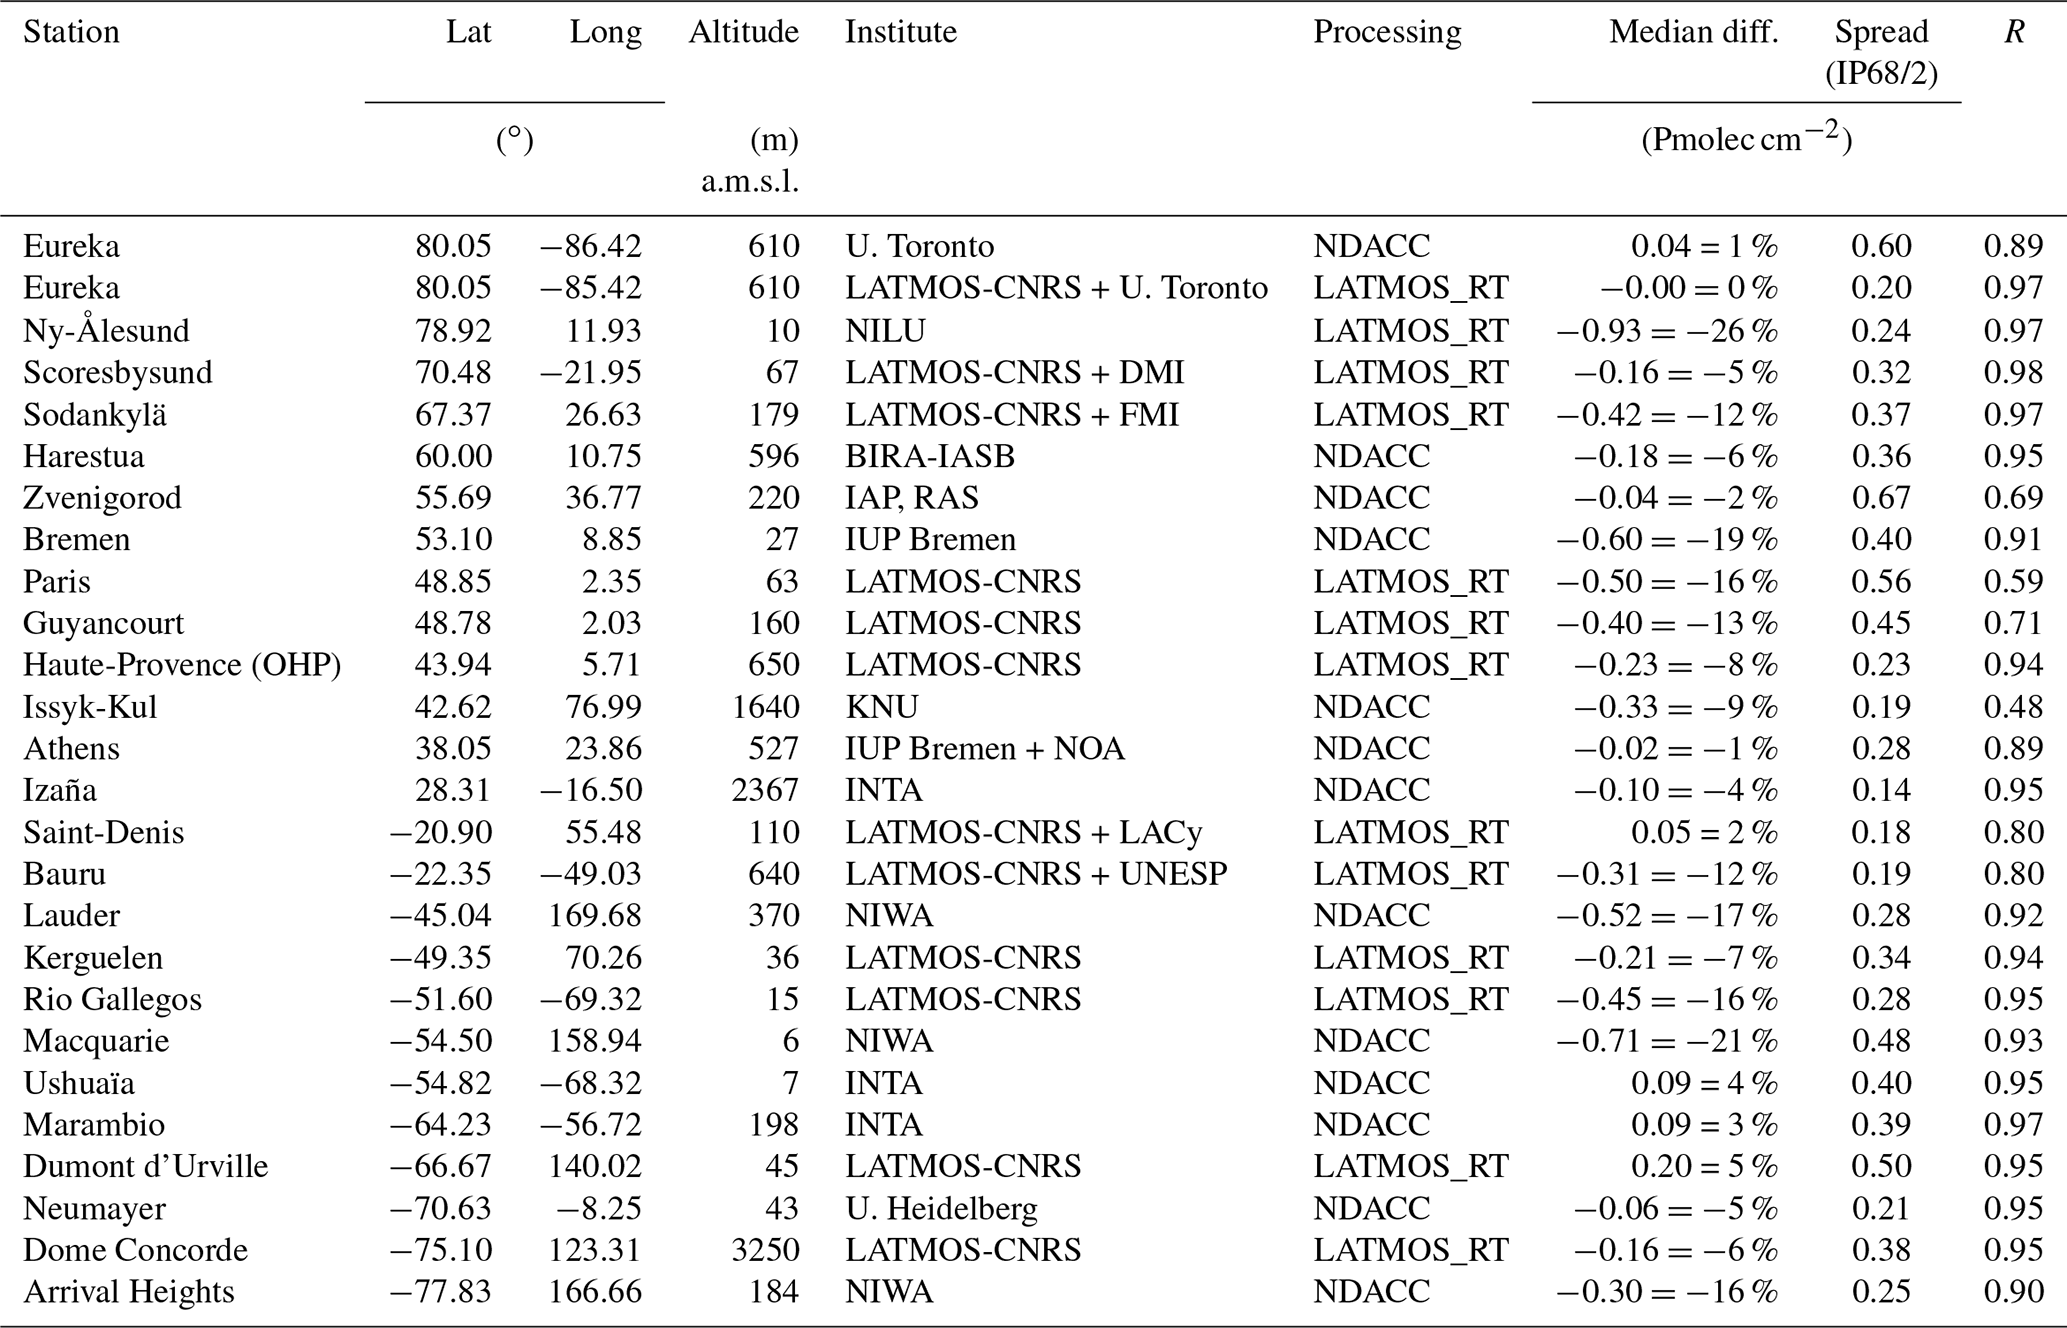
A1 The NDACC ZSL-DOAS network
Table A1ZSL-DOAS hosting stations, ordered by latitude, that contribute to the stratospheric NO2 column validation. Several measures of the agreement between TROPOMI and the ground-based data are also provided. The bias over all stations (median over all station median differences) is −0.23 Pmolec cm−2, while the overall dispersion (median over all 1/2IP68) is 0.31 Pmolec cm−2, and the inter-station dispersion (1/2IP68 over all station medians) is 0.30 Pmolec cm−2.
A2 The MAX-DOAS network
Table A2MAX-DOAS hosting stations, ordered by increasing median tropospheric column (VCDgb, lowest at the bottom), that contribute to the tropospheric NO2 column validation. More details on the QA4ECV datasets can be found at http://www.qa4ecv.eu/ecvs (last access: 5 January 2021). References are the following: (a) Arellano et al. (2016), (b) Friedrich et al. (2019), (c) Xing et al. (2017), (d) Xing et al. (2020), (e) Hendrick et al. (2014), (f) Irie et al. (2011), (g) Irie et al. (2012), (h) Irie et al. (2015), (i) Kanaya et al. (2014), (j) Vlemmix et al. (2010), (k) Gielen et al. (2014), (l) Hoque et al. (2018), (m) Drosoglou et al. (2017). Several measures of the agreement between TROPOMI and the ground-based data are also provided. Biases and comparison spreads vary strongly between stations, mainly as a function of the nature of the site (clean or polluted). When calculating these numbers for the three regimes (clean, polluted, extreme), the median biases are −0.3, −2, and −12 Pmolec cm−2 (−23 %, −37 %, and −51 %) respectively, with median dispersions of 0.7, 3.4, and 7 Pmolec cm−2. Note that the median values for the high tropospheric columns (Athens to Xianghe) are almost the same as the statistics found for the whole network. The site–site bias dispersion is 0.2, 1.2, and 3.3 Pmolec cm−2 for each regime.


Figure A1(a) Box-and-whisker plots summarizing the TROPOMI–MAX-DOAS tropospheric VCD difference, per station, ordered as a function of the median ground-based tropospheric column (largest median VCD values on top). Panels (b, c, d) present, respectively, the assumed aerosol optical depth (AOD; either retrieved from the MAX-DOAS measurement or taken from the climatology used in the NO2 retrieval), the MAX-DOAS absolute uncertainties, and the relative uncertainties (total median uncertainty in grey bars, random part in black and systematic part in red).
A3 The Pandonia Global Network
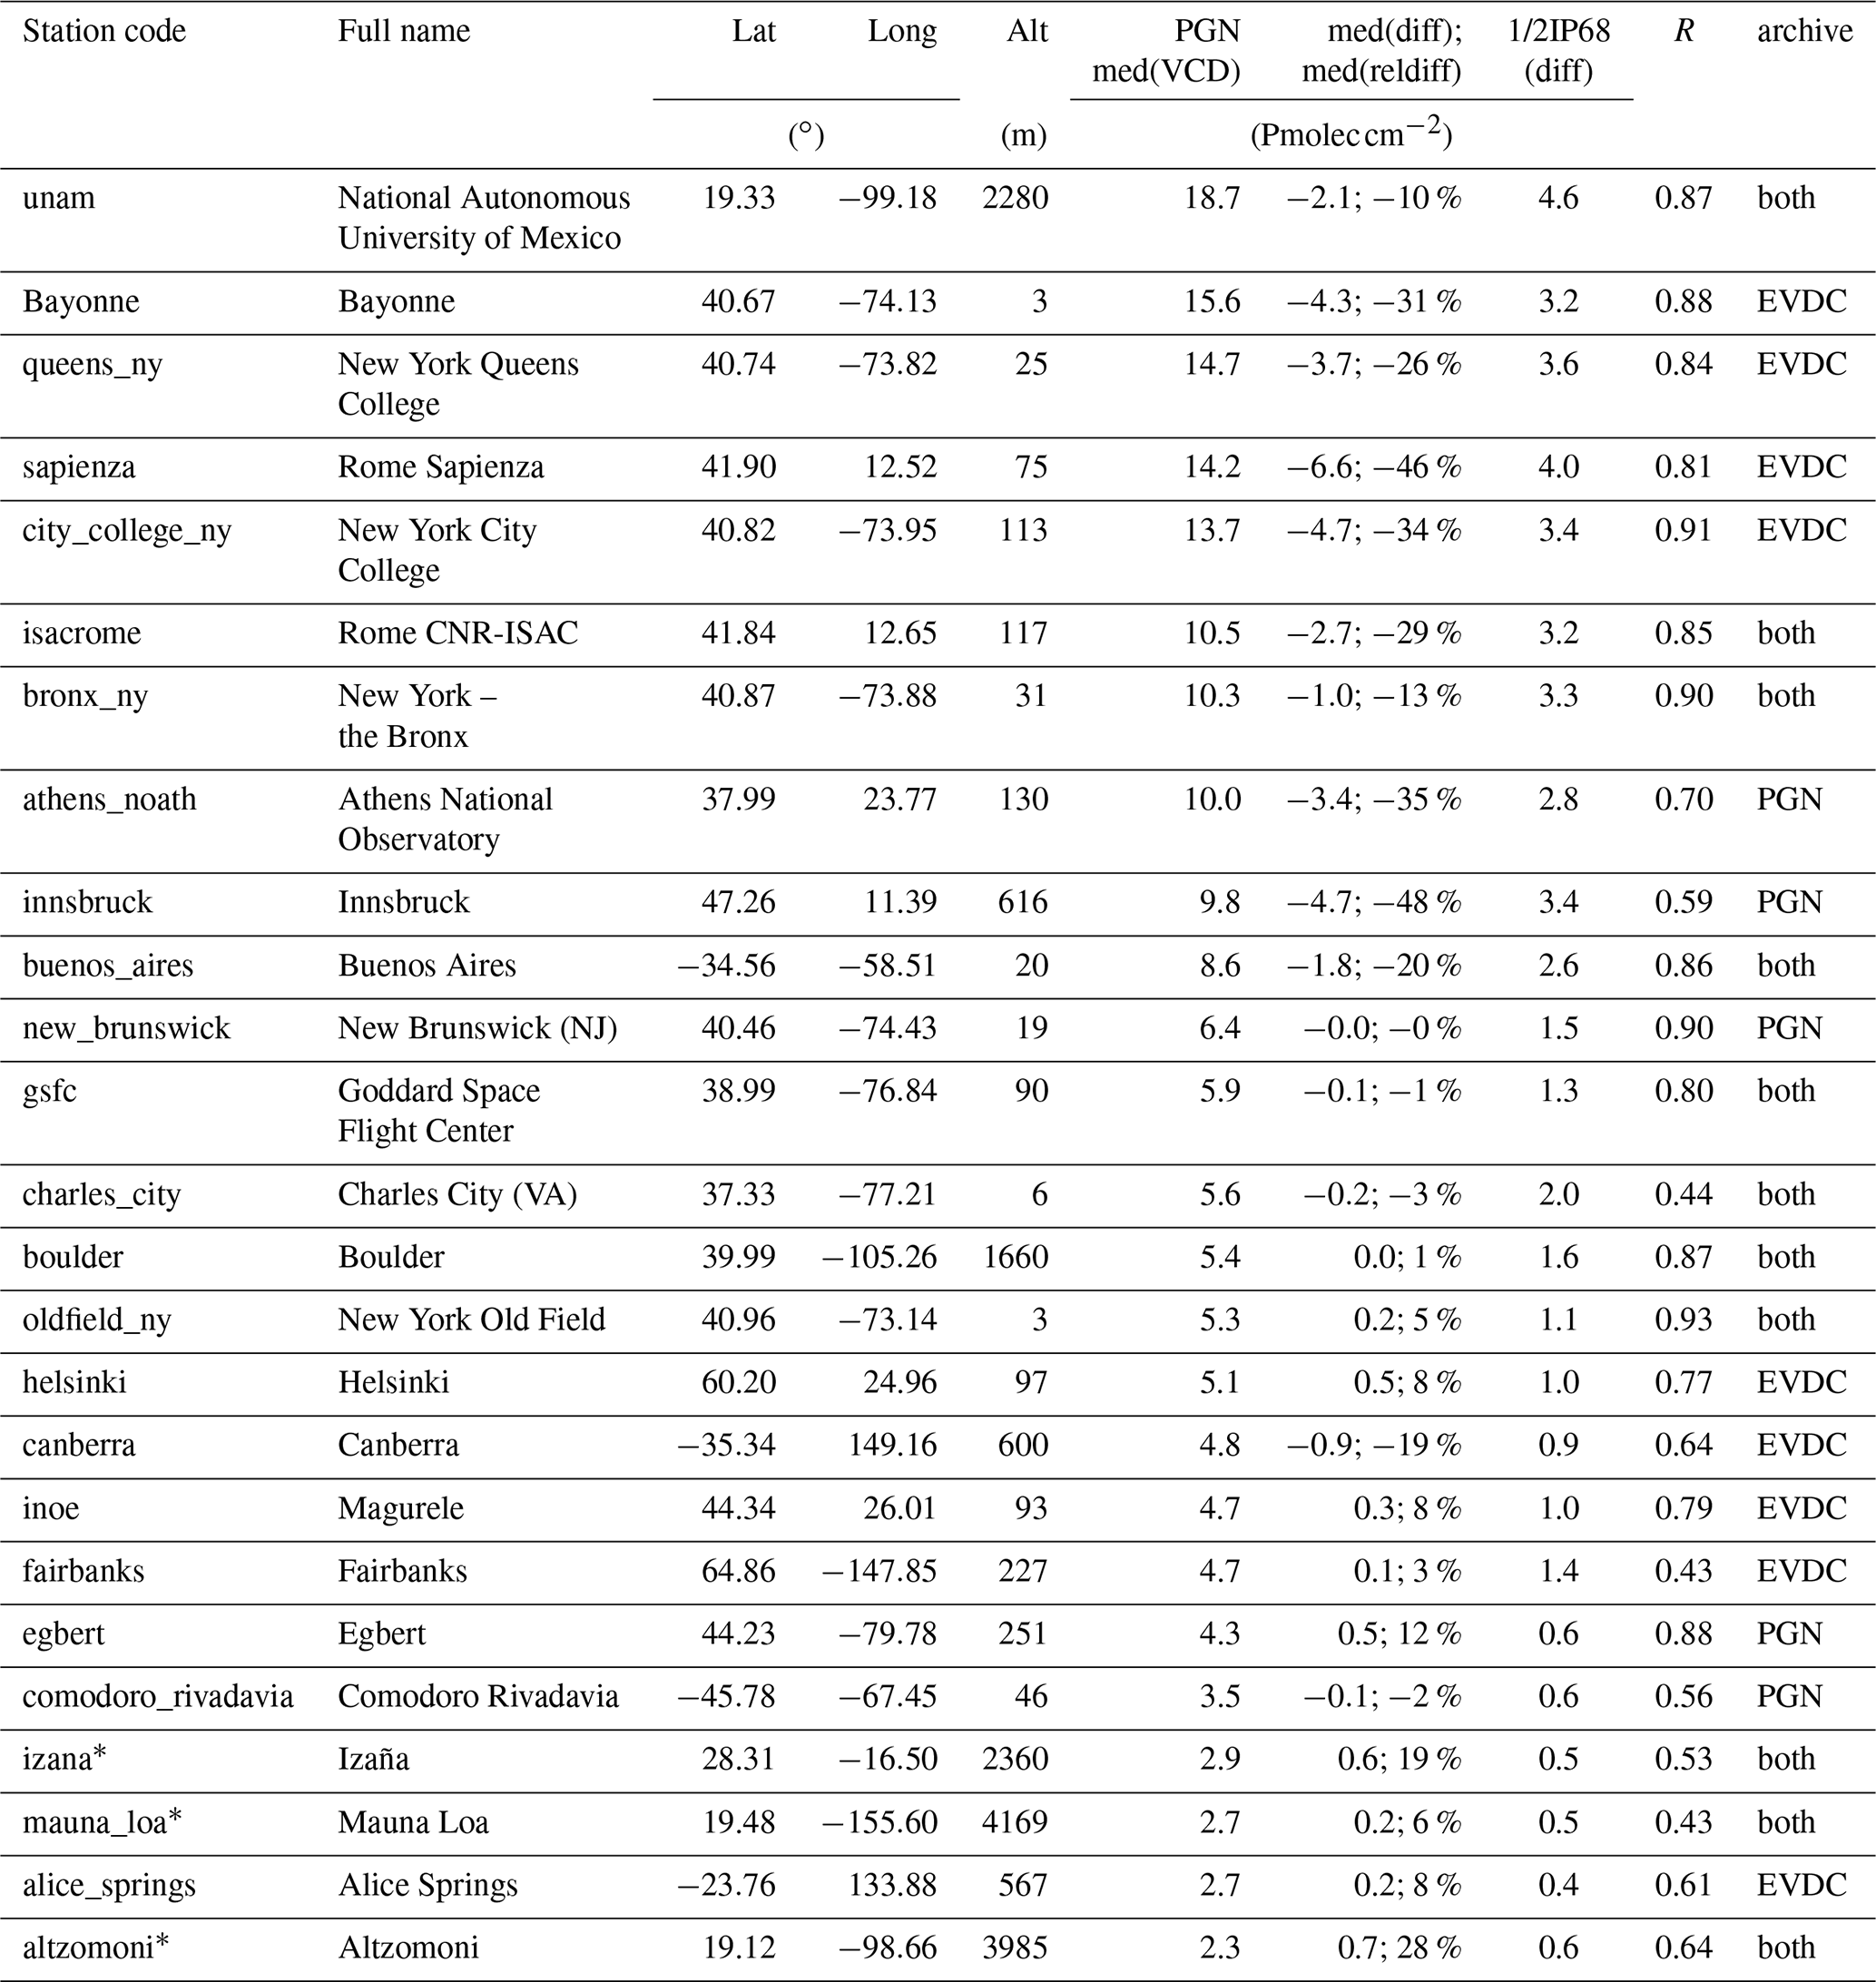
Table A3PGN stations, ordered by median PGN NO2 column value, that contribute to the total NO2 validation. Mountaintop stations (not sensitive to lower lying tropospheric NO2) are marked with an asterisk. In the last row, we indicate where the data can be obtained (EVDC or directly from the PGN website). Note that only PGN data from a recent quality upgrade (with file version 004 or 005, where 005 has precedence) was used. The bias over all stations (median over all station medians) is −0.5 Pmolec cm−2 (−7 %), while the overall dispersion (median over all 1/2IP68) is 1.8 Pmolec cm−2, and the inter-station dispersion (1/2IP68 over all station medians) is 2.2 Pmolec cm−2. Considering the low NO2 stations (Alice Springs to New Brunswick) only, the bias is 0.1 Pmolec cm−2 (2 %), the overall dispersion is 1.1 Pmolec cm−2, and the inter-station dispersion is 0.2 Pmolec cm−2. For the high NO2 stations (Buenos Aires to UNAM), the bias is −3.6 Pmolec cm−2 (−30 %), the overall dispersion is 3.3 Pmolec cm−2 and the inter-station dispersion is 1.4 Pmolec cm−2. Note that the mountaintop stations are not used in the calculation of these overall statistics.
No data were produced specifically for this research. The S5P data used here are publicly available from the Copernicus Open Access Hub (https://scihub.copernicus.eu/, last access: 5 January 2021, ESA, 2021). The ZSL-DOAS and MAX-DOAS data are publicly available from the NDACC Data Host Facility (ftp://ftp.cpc.ncep.noaa.gov/ndacc, last access: 5 January 2021, NDACC, 2021). The PGN data are publicly available from the Pandonia data archive (http://data.pandonia-global-network.org/, last access: 5 January 2021, PGN, 2021).
TV, SC, and GP carried out the global validation analysis. JCL, KUE, and MVR contributed input and advise at all stages of the analysis. AMF (EVDC), JG (Multi-TASTE), and SN (MPC VDAF-AVS) preprocessed and/or post-processed the ground-based and satellite data. HJE, KFB, PFL, and JPV developed the TROPOMI NO2 data processor. AR, MVR, and TW contributed expertise on satellite NO2 data retrieval. AC, FH, KK, MT, APa, JPP, and MVR supervise network operation and contributed ground-based scientific expertise. AD, LSdM, and CZ supervise the Copernicus S5P mission, the S5P MPC, and the S5PVT. All other co-authors contributed ground-based data and expertise at ground-based stations. TV, SC, GP, and JCL wrote and edited the paper. All co-authors revised and commented on the paper.
The authors declare that they have no conflict of interest.
This article is part of the special issue “TROPOMI on Sentinel-5 Precursor: first year in operation (AMT/ACP inter-journal SI)”. It is not associated with a conference.
Part of the reported work was carried out in the framework of the Copernicus Sentinel-5 Precursor Mission Performance Centre (S5P MPC), contracted by the European Space Agency and supported by the Belgian Federal Science Policy Office (BELSPO), the Royal Belgian Institute for Space Aeronomy (BIRA-IASB), the Netherlands Space Office (NSO), and the German Aerospace Centre (DLR). Part of this work was carried out also in the framework of the S5P Validation Team (S5PVT) AO projects NIDFORVAL (ID no. 28607, PI Gaia Pinardi, BIRA-IASB) and CESAR (ID no. 28596, PI Arnoud Apituley, KNMI). The authors express special thanks to Ann Mari Fjæraa, José Granville, Sander Niemeijer, and Olivier Rasson for post-processing of the network and satellite data and for their dedication to the S5P operational validation.
The LATMOS real-time processing facility is acknowledged for fast delivery of ZSL-DOAS SAOZ data. Fast delivery of MAX-DOAS data tailored to the S5P validation was organized through the S5PVT AO project NIDFORVAL. The authors are grateful to ESA/ESRIN for supporting the ESA Validation Data Centre (EVDC) established at NILU and for running the Fiducial Reference Measurements (FRM) programme and in particular the FRM4DOAS and Pandonia projects. The PGN is a bilateral project between NASA and ESA, and the NASA funding for the PGN is provided through the NASA Tropospheric Composition Program and Goddard Space Flight Center Pandora project.
The MAX-DOAS, ZSL-DOAS, and PGN instrument PIs and staff at the stations are thanked warmly for their sustained effort on maintaining high-quality measurements and for valuable scientific discussions. Aleksandr Elokhov and Aleksandr Gruzdev acknowledge national funding from RFBR through the project 20-95-00274. IUP Bremen acknowledges DLR Bonn for funding received through project 50EE1709A. The SAOZ network acknowledges funding from the French Institut National des Sciences de l'Univers (INSU) of the Centre National de la Recherche Scientifique (CNRS), Centre National d'Etudes Spatiales (CNES), and Institut polaire français Paul Emile Victor (IPEV). Work done by Hitoshi Irie was supported by the Environment Research and Technology Development Fund (2-1901) of the Environmental Restoration and Conservation Agency of Japan, JSPS KAKENHI (grant nos. JP19H04235 and JP17K00529), the JAXA 2nd Research Announcement on the Earth Observations (grant no. 19RT000351), and JST CREST (grant no. JPMJCR15K4). The University of Toronto ZSL-DOAS measurements at Eureka were made at the Polar Environment Atmospheric Research Laboratory (PEARL) by the Canadian Network for the Detection of Atmospheric Change (CANDAC), with support from the Canadian Space Agency (AVATARS project), the Natural Sciences and Engineering Research Council (PAHA project), and Environment and Climate Change Canada.
This research has been supported by the ESA/ESRIN (grant no. 4000117151/16/I-LG) and the BELSPO/ESA ProDEx (TROVA-E2 (PEA grant no. 4000116692)).
This paper was edited by Jhoon Kim and reviewed by two anonymous referees.
Arellano, J., Krüger, A., Rivera, C., Stremme, W., Friedrich, M., Bezanilla, A., and Grutter, M.: The MAX-DOAS network in Mexico City to measure atmospheric pollutants, Atmosfera, 29, 157–167, https://doi.org/10.20937/ATM.2016.29.02.05, 2016. a
Beirle, S., Dörner, S., Donner, S., Remmers, J., Wang, Y., and Wagner, T.: The Mainz profile algorithm (MAPA), Atmos. Meas. Tech., 12, 1785–1806, https://doi.org/10.5194/amt-12-1785-2019, 2019. a
Blechschmidt, A.-M., Arteta, J., Coman, A., Curier, L., Eskes, H., Foret, G., Gielen, C., Hendrick, F., Marécal, V., Meleux, F., Parmentier, J., Peters, E., Pinardi, G., Piters, A. J. M., Plu, M., Richter, A., Segers, A., Sofiev, M., Valdebenito, Á. M., Van Roozendael, M., Vira, J., Vlemmix, T., and Burrows, J. P.: Comparison of tropospheric NO2 columns from MAX-DOAS retrievals and regional air quality model simulations, Atmos. Chem. Phys., 20, 2795–2823, https://doi.org/10.5194/acp-20-2795-2020, 2020. a
Boersma, K. F., Eskes, H. J., Veefkind, J. P., Brinksma, E. J., van der A, R. J., Sneep, M., van den Oord, G. H. J., Levelt, P. F., Stammes, P., Gleason, J. F., and Bucsela, E. J.: Near-real time retrieval of tropospheric NO2 from OMI, Atmos. Chem. Phys., 7, 2103–2118, https://doi.org/10.5194/acp-7-2103-2007, 2007. a
Boersma, K. F., Eskes, H. J., Dirksen, R. J., van der A, R. J., Veefkind, J. P., Stammes, P., Huijnen, V., Kleipool, Q. L., Sneep, M., Claas, J., Leitão, J., Richter, A., Zhou, Y., and Brunner, D.: An improved tropospheric NO2 column retrieval algorithm for the Ozone Monitoring Instrument, Atmos. Meas. Tech., 4, 1905–1928, https://doi.org/10.5194/amt-4-1905-2011, 2011. a
Boersma, K. F., Eskes, H. J., Richter, A., De Smedt, I., Lorente, A., Beirle, S., van Geffen, J. H. G. M., Zara, M., Peters, E., Van Roozendael, M., Wagner, T., Maasakkers, J. D., van der A, R. J., Nightingale, J., De Rudder, A., Irie, H., Pinardi, G., Lambert, J.-C., and Compernolle, S. C.: Improving algorithms and uncertainty estimates for satellite NO2 retrievals: results from the quality assurance for the essential climate variables (QA4ECV) project, Atmos. Meas. Tech., 11, 6651–6678, https://doi.org/10.5194/amt-11-6651-2018, 2018. a, b
Bognar, K., Zhao, X., Strong, K., Boone, C., Bourassa, A., Degenstein, D., Drummond, J., Duff, A., Goutail, F., Griffin, D., Jeffery, P., Lutsch, E., Manney, G., McElroy, C., McLinden, C., Millán, L., Pazmino, A., Sioris, C., Walker, K., and Zou, J.: Updated validation of ACE and OSIRIS ozone and NO2 measurements in the Arctic using ground-based instruments at Eureka, Canada, J. Quant. Spectrosc. Ra., 238, 106571, https://doi.org/10.1016/j.jqsrt.2019.07.014, 2019. a, b
Bösch, T., Rozanov, V., Richter, A., Peters, E., Rozanov, A., Wittrock, F., Merlaud, A., Lampel, J., Schmitt, S., de Haij, M., Berkhout, S., Henzing, B., Apituley, A., den Hoed, M., Vonk, J., Tiefengraber, M., Müller, M., and Burrows, J. P.: BOREAS – a new MAX-DOAS profile retrieval algorithm for aerosols and trace gases, Atmos. Meas. Tech., 11, 6833–6859, https://doi.org/10.5194/amt-11-6833-2018, 2018. a
Bovensmann, H., Burrows, J. P., Buchwitz, M., Frerick, J., Noël, S., Rozanov, V. V., Chance, K. V., and Goede, A. P. H.: SCIAMACHY: Mission Objectives and Measurement Modes, J. Atmos. Sci., 56, 127–150, 1999. a
Brinksma, E. J., Pinardi, G., Volten, H., Braak, R., Richter, A., Scho, A., Van Roozendael, M., Fayt, C., Hermans, C., Dirksen, R. J., Vlemmix, T., Berkhout, A. J. C., Swart, D. P. J., Oetjen, H., Wittrock, F., Wagner, T., Ibrahim, O. W., Leeuw, G. D., Moerman, M., Curier, R. L., Celarier, E. A., Cede, A., Knap, W. H., Veefkind, J. P., Eskes, H. J., Allaart, M., Rothe, R., Piters, A., and Levelt, P. F.: The 2005 and 2006 DANDELIONS NO2 and aerosol intercomparison campaigns, J. Geophys. Res., 113, D16S46, https://doi.org/10.1029/2007JD008808, 2008. a, b
Burrows, J. P., Weber, M., Buchwitz, M., Rozanov, V., Ladstätter-Weißenmayer, A., Richter, A., DeBeek, R., Hoogen, R., Bramstedt, K., Eichmann, K.-U., Eisinger, M., and Perner, D.: The Global Ozone Monitoring Experiment (GOME): Mission Concept and First Scientific Results, J. Atmos. Sci., 56, 151–175, 1999. a
Celarier, E. A., Brinksma, E. J., Gleason, J. F., Veefkind, J. P., Cede, A., Herman, J. R., Ionov, D., Pommereau, J.-P., Goutail, F., Lambert, J.-C., Pinardi, G., Van Roozendael, M., Wittrock, F., Schonhardt, A., Richter, A., Ibrahim, O. W., Wagner, T., Bojkov, B., Mount, G., Spine, E., Chen, C. M., Pongett, T. J., Sander, S. P., Bucsela, E. J., O.Wenig, M., Swart, D. P. J., Volten, H., Levelt, P. F., and Kroon, M.: Validation of Ozone Monitoring Instrument nitrogen dioxide columns, J. Geophys. Res., 113, D15S15, https://doi.org/10.1029/2007JD008908, 2008. a, b, c, d
Chen, D., Zhou, B., Beirle, S., Chen, L. M., and Wagner, T.: Tropospheric NO2 column densities deduced from zenith-sky DOAS measurements in Shanghai, China, and their application to satellite validation, Atmos. Chem. Phys., 9, 3641–3662, https://doi.org/10.5194/acp-9-3641-2009, 2009. a
Choi, S., Lamsal, L. N., Follette-Cook, M., Joiner, J., Krotkov, N. A., Swartz, W. H., Pickering, K. E., Loughner, C. P., Appel, W., Pfister, G., Saide, P. E., Cohen, R. C., Weinheimer, A. J., and Herman, J. R.: Assessment of NO2 observations during DISCOVER-AQ and KORUS-AQ field campaigns, Atmos. Meas. Tech., 13, 2523–2546, https://doi.org/10.5194/amt-13-2523-2020, 2019. a, b, c
Clémer, K., Van Roozendael, M., Fayt, C., Hendrick, F., Hermans, C., Pinardi, G., Spurr, R., Wang, P., and De Mazière, M.: Multiple wavelength retrieval of tropospheric aerosol optical properties from MAXDOAS measurements in Beijing, Atmos. Meas. Tech., 3, 863–878, https://doi.org/10.5194/amt-3-863-2010, 2010. a
Compernolle, S., Argyrouli, A., Lutz, R., Sneep, M., Lambert, J.-C., Fjæraa, A. M., Hubert, D., Keppens, A., Loyola, D., O'Connor, E., Romahn, F., Stammes, P., Verhoelst, T., and Wang, P.: Validation of the Sentinel-5 Precursor TROPOMI cloud data with Cloudnet, Aura OMI O2−O2, MODIS and Suomi-NPP VIIRS, Atmos. Meas. Tech. Discuss., https://doi.org/10.5194/amt-2020-122, in review, 2020a. a
Compernolle, S., Verhoelst, T., Pinardi, G., Granville, J., Hubert, D., Keppens, A., Niemeijer, S., Rino, B., Bais, A., Beirle, S., Boersma, F., Burrows, J. P., De Smedt, I., Eskes, H., Goutail, F., Hendrick, F., Lorente, A., Pazmino, A., Piters, A., Peters, E., Pommereau, J.-P., Remmers, J., Richter, A., van Geffen, J., Van Roozendael, M., Wagner, T., and Lambert, J.-C.: Validation of Aura-OMI QA4ECV NO2 climate data records with ground-based DOAS networks: the role of measurement and comparison uncertainties, Atmos. Chem. Phys., 20, 8017–8045, https://doi.org/10.5194/acp-20-8017-2020, 2020b. a, b, c, d, e, f, g, h, i, j
De Mazière, M., Thompson, A. M., Kurylo, M. J., Wild, J. D., Bernhard, G., Blumenstock, T., Braathen, G. O., Hannigan, J. W., Lambert, J.-C., Leblanc, T., McGee, T. J., Nedoluha, G., Petropavlovskikh, I., Seckmeyer, G., Simon, P. C., Steinbrecht, W., and Strahan, S. E.: The Network for the Detection of Atmospheric Composition Change (NDACC): history, status and perspectives, Atmos. Chem. Phys., 18, 4935–4964, https://doi.org/10.5194/acp-18-4935-2018, 2018. a
Dimitropoulou, E., Hendrick, F., Pinardi, G., Friedrich, M. M., Merlaud, A., Tack, F., De Longueville, H., Fayt, C., Hermans, C., Laffineur, Q., Fierens, F., and Van Roozendael, M.: Validation of TROPOMI tropospheric NO2 columns using dual-scan multi-axis differential optical absorption spectroscopy (MAX-DOAS) measurements in Uccle, Brussels, Atmos. Meas. Tech., 13, 5165–5191, https://doi.org/10.5194/amt-13-5165-2020, 2020. a, b, c
Dirksen, R. J., Boersma, K. F., Eskes, H. J., Ionov, D. V., Bucsela, E. J., Levelt, P. F., and Kelder, H. M.: Evaluation of stratospheric NO2 retrieved from the Ozone Monitoring Instrument: Intercomparison, diurnal cycle, and trending, J. Geophys. Res., 116, D08305, https://doi.org/10.1029/2010jd014943, 2011. a
Drosoglou, T., Bais, A. F., Zyrichidou, I., Kouremeti, N., Poupkou, A., Liora, N., Giannaros, C., Koukouli, M. E., Balis, D., and Melas, D.: Comparisons of ground-based tropospheric NO2 MAX-DOAS measurements to satellite observations with the aid of an air quality model over the Thessaloniki area, Greece, Atmos. Chem. Phys., 17, 5829–5849, https://doi.org/10.5194/acp-17-5829-2017, 2017. a
Drosoglou, T., Koukouli, M. E., Kouremeti, N., Bais, A. F., Zyrichidou, I., Balis, D., van der A, R. J., Xu, J., and Li, A.: MAX-DOAS NO2 observations over Guangzhou, China; ground-based and satellite comparisons, Atmos. Meas. Tech., 11, 2239–2255, https://doi.org/10.5194/amt-11-2239-2018, 2018. a
Errera, Q. and Fonteyn, D.: Four-dimensional variational chemical assimilation of CRISTA stratospheric measurements, J. Geophys. Res., 106, 12253–12265, 2001. a
ESA: Copernicus Sentinels 4 and 5 Mission Requirements Traceability Document, EOP-SM/2413/BV-bv, available at: https://sentinel.esa.int/documents/247904/2506504/ Copernicus-Sentinels-4-and-5-Mission-Requirements-Traceability-Document.pdf (last access: 5 January 2021), 2017a. a
ESA: Sentinel-5 Precursor Calibration and Validation Plan for the Operational Phase, ESA-EOPG-CSCOP-PL-0073, available at: https://sentinel.esa.int/documents/247904/2474724/Sentinel-5P-Calibration-and-Validation-Plan.pdf (last access: 5 January 2021), 2017b. a
ESA: Copernicus Open Access Hub, ESA, available at: https://scihub.copernicus.eu/, last access: 5 January 2021. a
Eskes, H. J., van Geffen, J., Boersma, K. F., Sneep, M., ter Linden, M., Richter, A., Beirle, S., and Veefkind, J. P.: High spatial resolution nitrogen dioxide tropospheric column observations derived from Sentinel-5P TROPOMI observations, Atmos. Meas. Tech., submitted, 2020. a, b
Friedrich, M. M., Rivera, C., Stremme, W., Ojeda, Z., Arellano, J., Bezanilla, A., García-Reynoso, J. A., and Grutter, M.: NO2 vertical profiles and column densities from MAX-DOAS measurements in Mexico City, Atmos. Meas. Tech., 12, 2545–2565, https://doi.org/10.5194/amt-12-2545-2019, 2019. a, b
Frieß, U., Beirle, S., Alvarado Bonilla, L., Bösch, T., Friedrich, M. M., Hendrick, F., Piters, A., Richter, A., van Roozendael, M., Rozanov, V. V., Spinei, E., Tirpitz, J.-L., Vlemmix, T., Wagner, T., and Wang, Y.: Intercomparison of MAX-DOAS vertical profile retrieval algorithms: studies using synthetic data, Atmos. Meas. Tech., 12, 2155–2181, https://doi.org/10.5194/amt-12-2155-2019, 2019. a, b
Gielen, C., Van Roozendael, M., Hendrick, F., Pinardi, G., Vlemmix, T., De Bock, V., De Backer, H., Fayt, C., Hermans, C., Gillotay, D., and Wang, P.: A simple and versatile cloud-screening method for MAX-DOAS retrievals, Atmos. Meas. Tech., 7, 3509–3527, https://doi.org/10.5194/amt-7-3509-2014, 2014. a
Gratsea, M., Vrekoussis, M., Richter, A., Wittrock, F., Schönhardt, A., Burrows, J., Kazadzis, S., Mihalopoulos, N., and Gerasopoulos, E.: Slant column MAX-DOAS measurements of nitrogen dioxide, formaldehyde, glyoxal and oxygen dimer in the urban environment of Athens, Atmos. Environ., 135, 118–131, https://doi.org/10.1016/j.atmosenv.2016.03.048, 2016. a
Griffin, D., Zhao, X., McLinden, C. A., Boersma, F., Bourassa, A., Dammers, E., Degenstein, D., Eskes, H., Fehr, L., Fioletov, V., Hayden, K., Kharol, S. K., Li, S.-M., Makar, P., Martin, R. V., Mihele, C., Mittermeier, R. L., Krotkov, N., Sneep, M., Lamsal, L. N., ter Linden, M., van Geffen, J., Veefkind, P., and Wolde, M.: High-Resolution Mapping of Nitrogen Dioxide With TROPOMI: First Results and Validation Over the Canadian Oil Sands, Geophys. Res. Lett., 46, 1049–1060, https://doi.org/10.1029/2018GL081095, 2019. a, b
Gruzdev, A. N. and Elokhov, A. S.: Validation of Ozone Monitoring Instrument NO2 measurements using ground based NO2 measurements at Zvenigorod, Russia, Int. J. Remote Sens., 31, 497–511, https://doi.org/10.1080/01431160902893527, 2010. a
Harder, J. W., Brault, J. W., Johnston, P. V., and Mount, G. H.: Temperature dependent NO2 cross sections at high spectral resolution, J. Geophys. Res., 102, 3861–3879, https://doi.org/10.1029/96jd03086, 1997. a
Hendrick, F., Barret, B., Van Roozendael, M., Boesch, H., Butz, A., De Mazière, M., Goutail, F., Hermans, C., Lambert, J.-C., Pfeilsticker, K., and Pommereau, J.-P.: Retrieval of nitrogen dioxide stratospheric profiles from ground-based zenith-sky UV-visible observations: validation of the technique through correlative comparisons, Atmos. Chem. Phys., 4, 2091–2106, https://doi.org/10.5194/acp-4-2091-2004, 2004. a
Hendrick, F., Pommereau, J.-P., Goutail, F., Evans, R. D., Ionov, D., Pazmino, A., Kyrö, E., Held, G., Eriksen, P., Dorokhov, V., Gil, M., and Van Roozendael, M.: NDACC/SAOZ UV-visible total ozone measurements: improved retrieval and comparison with correlative ground-based and satellite observations, Atmos. Chem. Phys., 11, 5975–5995, https://doi.org/10.5194/acp-11-5975-2011, 2011. a, b
Hendrick, F., Müller, J.-F., Clémer, K., Wang, P., De Mazière, M., Fayt, C., Gielen, C., Hermans, C., Ma, J. Z., Pinardi, G., Stavrakou, T., Vlemmix, T., and Van Roozendael, M.: Four years of ground-based MAX-DOAS observations of HONO and NO2 in the Beijing area, Atmos. Chem. Phys., 14, 765–781, https://doi.org/10.5194/acp-14-765-2014, 2014. a, b, c, d
Herman, J., Cede, A., Spinei, E., Mount, G., Tzortziou, M., and Abuhassan, N.: NO2 column amounts from ground-based Pandora and MFDOAS spectrometers using the direct-sun DOAS technique: Intercomparisons and application to OMI validation, J. Geophys. Res., 114, D13307, https://doi.org/10.1029/2009JD011848, 2009. a, b, c
Herman, J., Abuhassan, N., Kim, J., Kim, J., Dubey, M., Raponi, M., and Tzortziou, M.: Underestimation of column NO2 amounts from the OMI satellite compared to diurnally varying ground-based retrievals from multiple PANDORA spectrometer instruments, Atmos. Meas. Tech., 12, 5593–5612, https://doi.org/10.5194/amt-12-5593-2019, 2019. a
Hönninger, G. and Platt, U.: Observations of BrO and its vertical distribution during surface ozone depletion at Alert, Atmos. Environ., 36, 2481–2489, https://doi.org/10.1016/S1352-2310(02)00104-8, 2002. a
Hönninger, G., von Friedeburg, C., and Platt, U.: Multi axis differential optical absorption spectroscopy (MAX-DOAS), Atmos. Chem. Phys., 4, 231–254, https://doi.org/10.5194/acp-4-231-2004, 2004. a
Hoque, H. M. S., Irie, H., Damiani, A., Rawat, P., and Naja, M.: First Simultaneous Observations of Formaldehyde and Glyoxal by MAX-DOAS in the Indo-Gangetic Plain Region, SOLA, 14, 159–164, https://doi.org/10.2151/sola.2018-028, 2018. a
Ialongo, I., Virta, H., Eskes, H., Hovila, J., and Douros, J.: Comparison of TROPOMI/Sentinel-5 Precursor NO2 observations with ground-based measurements in Helsinki, Atmos. Meas. Tech., 13, 205–218, https://doi.org/10.5194/amt-13-205-2020, 2020. a, b
Ionov, D. V., Timofeyev, Y. M., Sinyakov, V. P., Semenov, V. K., Goutail, F., Pommereau, J.-P., Bucsela, E. J., Celarier, E. A., and Kroon, M.: Ground-based validation of EOS-Aura OMI NO2 vertical column data in the midlatitude mountain ranges of Tien Shan (Kyrgyzstan) and Alps (France), J. Geophys. Res., 113, D15S08, https://doi.org/10.1029/2007jd008659, 2008. a, b
Irie, H., Kanaya, Y., Akimoto, H., Tanimoto, H., Wang, Z., Gleason, J. F., and Bucsela, E. J.: Validation of OMI tropospheric NO2 column data using MAX-DOAS measurements deep inside the North China Plain in June 2006: Mount Tai Experiment 2006, Atmos. Chem. Phys., 8, 6577–6586, https://doi.org/10.5194/acp-8-6577-2008, 2008. a
Irie, H., Takashima, H., Kanaya, Y., Boersma, K. F., Gast, L., Wittrock, F., Brunner, D., Zhou, Y., and Van Roozendael, M.: Eight-component retrievals from ground-based MAX-DOAS observations, Atmos. Meas. Tech., 4, 1027–1044, https://doi.org/10.5194/amt-4-1027-2011, 2011. a, b, c, d, e
Irie, H., Boersma, K. F., Kanaya, Y., Takashima, H., Pan, X., and Wang, Z. F.: Quantitative bias estimates for tropospheric NO2 columns retrieved from SCIAMACHY, OMI, and GOME-2 using a common standard for East Asia, Atmos. Meas. Tech., 5, 2403–2411, https://doi.org/10.5194/amt-5-2403-2012, 2012. a, b
Irie, H., Nakayama, T., Shimizu, A., Yamazaki, A., Nagai, T., Uchiyama, A., Zaizen, Y., Kagamitani, S., and Matsumi, Y.: Evaluation of MAX-DOAS aerosol retrievals by coincident observations using CRDS, lidar, and sky radiometer inTsukuba, Japan, Atmos. Meas. Tech., 8, 2775–2788, https://doi.org/10.5194/amt-8-2775-2015, 2015. a
Jin, J., Ma, J., Lin, W., Zhao, H., Shaiganfar, R., Beirle, S., and Wagner, T.: MAX-DOAS measurements and satellite validation of tropospheric NO2 and SO2 vertical column densities at a rural site of North China, Atmos. Environ., 133, 12–25, https://doi.org/10.1016/j.atmosenv.2016.03.031, 2016. a
Judd, L. M., Al-Saadi, J. A., Janz, S. J., Kowalewski, M. G., Pierce, R. B., Szykman, J. J., Valin, L. C., Swap, R., Cede, A., Mueller, M., Tiefengraber, M., Abuhassan, N., and Williams, D.: Evaluating the impact of spatial resolution on tropospheric NO2 column comparisons within urban areas using high-resolution airborne data, Atmos. Meas. Tech., 12, 6091–6111, https://doi.org/10.5194/amt-12-6091-2019, 2019. a, b
Kanaya, Y., Irie, H., Takashima, H., Iwabuchi, H., Akimoto, H., Sudo, K., Gu, M., Chong, J., Kim, Y. J., Lee, H., Li, A., Si, F., Xu, J., Xie, P.-H., Liu, W.-Q., Dzhola, A., Postylyakov, O., Ivanov, V., Grechko, E., Terpugova, S., and Panchenko, M.: Long-term MAX-DOAS network observations of NO2 in Russia and Asia (MADRAS) during the period 2007–2012: instrumentation, elucidation of climatology, and comparisons with OMI satellite observations and global model simulations, Atmos. Chem. Phys., 14, 7909–7927, https://doi.org/10.5194/acp-14-7909-2014, 2014. a, b, c, d, e
Kollonige, D. E., Thompson, A. M., Josipovic, M., Tzortziou, M., Beukes, J. P., Burger, R., Martins, D. K., van Zyl, P. G., Vakkari, V., and Laakso, L.: OMI Satellite and Ground-Based Pandora Observations and Their Application to Surface NO2 Estimations at Terrestrial and Marine Sites, J. Geophys. Res.-Atmos., 123, 1441–1459, https://doi.org/10.1002/2017JD026518, 2018. a
Kreher, K., Van Roozendael, M., Hendrick, F., Apituley, A., Dimitropoulou, E., Frieß, U., Richter, A., Wagner, T., Lampel, J., Abuhassan, N., Ang, L., Anguas, M., Bais, A., Benavent, N., Bösch, T., Bognar, K., Borovski, A., Bruchkouski, I., Cede, A., Chan, K. L., Donner, S., Drosoglou, T., Fayt, C., Finkenzeller, H., Garcia-Nieto, D., Gielen, C., Gómez-Martín, L., Hao, N., Henzing, B., Herman, J. R., Hermans, C., Hoque, S., Irie, H., Jin, J., Johnston, P., Khayyam Butt, J., Khokhar, F., Koenig, T. K., Kuhn, J., Kumar, V., Liu, C., Ma, J., Merlaud, A., Mishra, A. K., Müller, M., Navarro-Comas, M., Ostendorf, M., Pazmino, A., Peters, E., Pinardi, G., Pinharanda, M., Piters, A., Platt, U., Postylyakov, O., Prados-Roman, C., Puentedura, O., Querel, R., Saiz-Lopez, A., Schönhardt, A., Schreier, S. F., Seyler, A., Sinha, V., Spinei, E., Strong, K., Tack, F., Tian, X., Tiefengraber, M., Tirpitz, J.-L., van Gent, J., Volkamer, R., Vrekoussis, M., Wang, S., Wang, Z., Wenig, M., Wittrock, F., Xie, P. H., Xu, J., Yela, M., Zhang, C., and Zhao, X.: Intercomparison of NO2, O4, O3 and HCHO slant column measurements by MAX-DOAS and zenith-sky UV–visible spectrometers during CINDI-2, Atmos. Meas. Tech., 13, 2169–2208, https://doi.org/10.5194/amt-13-2169-2020, 2020. a
Lambert, J.-C., Van Roozendael, M., De Maziere, M., Simon, P., Pommereau, J.-P., Goutail, F., , Sarkissian, A., Denis, L., Dorokhov, V., Eriksen, P., Kyrö, E., Leveau, J., Roscoe, H., Tellefsen, C., and Vaughan, G.: Pole to pole Validation of the ERS-2 GOME Level 2 Products with the SAOZ Ground-based Network, in: Proc. 3rd ESA ERS Scientific Symposium, Florence, Italy, 17–20 March 1997, ESA SP-414, 2, 629–636, 1997a. a
Lambert, J.-C., Van Roozendael, M., Granville, J., Gerard, P., Peeters, P., Simon, P., Claude, H., and Stahelin, J.: Comparison of the GOME ozone and NO2 total amounts at mid-latitude with ground-based zenith-sky measurements, Atmospheric Ozone – 18th Quad. Ozone Symp., L'Aquila, Italy, 1996, edited by: Bojkov, R. and Visconti, G., 1, 301–304, 1997b. a, b
Lambert, J.-C., De Clercq, C., and von Clarmann, T.: Comparing and merging water vapour observations: A multi-dimensional perspective on smoothing and sampling issues, in: Monitoring Atmospheric Water Vapour, edited by: Kämpfer, N., Springer New York, ISSI Scientific Report Series, 10, 177–199, https://doi.org/10.1007/978-1-4614-3909-7_10, 2012. a
Leitão, J., Richter, A., Vrekoussis, M., Kokhanovsky, A., Zhang, Q. J., Beekmann, M., and Burrows, J. P.: On the improvement of NO2 satellite retrievals – aerosol impact on the airmass factors, Atmos. Meas. Tech., 3, 475–493, https://doi.org/10.5194/amt-3-475-2010, 2010. a
Levelt, P. F., Joiner, J., Tamminen, J., Veefkind, J. P., Bhartia, P. K., Stein Zweers, D. C., Duncan, B. N., Streets, D. G., Eskes, H., van der A, R., McLinden, C., Fioletov, V., Carn, S., de Laat, J., DeLand, M., Marchenko, S., McPeters, R., Ziemke, J., Fu, D., Liu, X., Pickering, K., Apituley, A., González Abad, G., Arola, A., Boersma, F., Chan Miller, C., Chance, K., de Graaf, M., Hakkarainen, J., Hassinen, S., Ialongo, I., Kleipool, Q., Krotkov, N., Li, C., Lamsal, L., Newman, P., Nowlan, C., Suleiman, R., Tilstra, L. G., Torres, O., Wang, H., and Wargan, K.: The Ozone Monitoring Instrument: overview of 14 years in space, Atmos. Chem. Phys., 18, 5699–5745, https://doi.org/10.5194/acp-18-5699-2018, 2018. a
Lin, J.-T., Martin, R. V., Boersma, K. F., Sneep, M., Stammes, P., Spurr, R., Wang, P., Van Roozendael, M., Clémer, K., and Irie, H.: Retrieving tropospheric nitrogen dioxide from the Ozone Monitoring Instrument: effects of aerosols, surface reflectance anisotropy, and vertical profile of nitrogen dioxide, Atmos. Chem. Phys., 14, 1441–1461, https://doi.org/10.5194/acp-14-1441-2014, 2014. a
Liu, M., Lin, J., Boersma, K. F., Pinardi, G., Wang, Y., Chimot, J., Wagner, T., Xie, P., Eskes, H., Van Roozendael, M., Hendrick, F., Wang, P., Wang, T., Yan, Y., Chen, L., and Ni, R.: Improved aerosol correction for OMI tropospheric NO2 retrieval over East Asia: constraint from CALIOP aerosol vertical profile, Atmos. Meas. Tech., 12, 1–21, https://doi.org/10.5194/amt-12-1-2019, 2019a. a
Liu, M., Lin, J., Kong, H., Boersma, K. F., Eskes, H., Kanaya, Y., He, Q., Tian, X., Qin, K., Xie, P., Spurr, R., Ni, R., Yan, Y., Weng, H., and Wang, J.: A new TROPOMI product for tropospheric NO2 columns over East Asia with explicit aerosol corrections, Atmos. Meas. Tech., 13, 4247–4259, https://doi.org/10.5194/amt-13-4247-2020, 2020. a
Liu, S., Valks, P., Pinardi, G., De Smedt, I., Yu, H., Beirle, S., and Richter, A.: An improved total and tropospheric NO2 column retrieval for GOME-2, Atmos. Meas. Tech., 12, 1029–1057, https://doi.org/10.5194/amt-12-1029-2019, 2019b. a, b
Lorente, A., Boersma, K. F., Eskes, H. J., Veefkind, J. P., van Geffen, J. H. G. M., de Zeeuw, M. B., Denier van der Gon, H. A. C., Beirle, S., and Krol, M. C.: Quantification of nitrogen oxides emissions from build-up of pollution over Paris with TROPOMI, Scientific Reports, 9, 20033, https://doi.org/10.1038/s41598-019-56428-5, 2019. a
Ma, J. Z., Beirle, S., Jin, J. L., Shaiganfar, R., Yan, P., and Wagner, T.: Tropospheric NO2 vertical column densities over Beijing: results of the first three years of ground-based MAX-DOAS measurements (2008–2011) and satellite validation, Atmos. Chem. Phys., 13, 1547–1567, https://doi.org/10.5194/acp-13-1547-2013, 2013. a
NDACC: ZSL-DOAS and MAX-DOAS data, NDACC Data Host Facility, available at: ftp://ftp.cpc.ncep.noaa.gov/ndacc, last access: 5 January 2021. a
Nowlan, C. R., Liu, X., Janz, S. J., Kowalewski, M. G., Chance, K., Follette-Cook, M. B., Fried, A., González Abad, G., Herman, J. R., Judd, L. M., Kwon, H.-A., Loughner, C. P., Pickering, K. E., Richter, D., Spinei, E., Walega, J., Weibring, P., and Weinheimer, A. J.: Nitrogen dioxide and formaldehyde measurements from the GEOstationary Coastal and Air Pollution Events (GEO-CAPE) Airborne Simulator over Houston, Texas, Atmos. Meas. Tech., 11, 5941–5964, https://doi.org/10.5194/amt-11-5941-2018, 2018. a
Noxon, J. F., Whipple Jr., E. C., and Hyde, R. S.: Stratospheric NO2: 1. Observational method and behavior at mid‐latitude, J. Geophys. Res., 84, 5047–5065, https://doi.org/10.1029/JC084iC08p05047, 1979. a
Ortega, I., Koenig, T., Sinreich, R., Thomson, D., and Volkamer, R.: The CU 2-D-MAX-DOAS instrument – Part 1: Retrieval of 3-D distributions of NO2 and azimuth-dependent OVOC ratios, Atmos. Meas. Tech., 8, 2371–2395, https://doi.org/10.5194/amt-8-2371-2015, 2015. a
Peters, E., Pinardi, G., Seyler, A., Richter, A., Wittrock, F., Bösch, T., Van Roozendael, M., Hendrick, F., Drosoglou, T., Bais, A. F., Kanaya, Y., Zhao, X., Strong, K., Lampel, J., Volkamer, R., Koenig, T., Ortega, I., Puentedura, O., Navarro-Comas, M., Gómez, L., Yela González, M., Piters, A., Remmers, J., Wang, Y., Wagner, T., Wang, S., Saiz-Lopez, A., García-Nieto, D., Cuevas, C. A., Benavent, N., Querel, R., Johnston, P., Postylyakov, O., Borovski, A., Elokhov, A., Bruchkouski, I., Liu, H., Liu, C., Hong, Q., Rivera, C., Grutter, M., Stremme, W., Khokhar, M. F., Khayyam, J., and Burrows, J. P.: Investigating differences in DOAS retrieval codes using MAD-CAT campaign data, Atmos. Meas. Tech., 10, 955–978, https://doi.org/10.5194/amt-10-955-2017, 2017. a
Peters, E., Ostendorf, M., Bösch, T., Seyler, A., Schönhardt, A., Schreier, S. F., Henzing, J. S., Wittrock, F., Richter, A., Vrekoussis, M., and Burrows, J. P.: Full-azimuthal imaging-DOAS observations of NO2 and O4 during CINDI-2, Atmos. Meas. Tech., 12, 4171–4190, https://doi.org/10.5194/amt-12-4171-2019, 2019. a, b
Petritoli, A., Giovanelli, G., Kostadinov, I., Ravegnani, F., Bortoli, D., Werner, R., Valev, D., and Atanassov, A.: SCIAMACHY validation of NO2 total column by means of ground-based DOAS measurements at Mt. Cimone (44N, 11E) and Stara Zagora (42N, 25E) stations, in: Proceedings of the ENVISAT Validation Workshop (ESA SP-531), Frascati, Italy, 9–13 December 2003, edited by: Lacoste, H., European Space Agency, Special Publication, 2003. a, b
Pfeilsticker, K., Arlander, D., Burrows, J., Erle, F., Gil, M., Goutail, F., Hermans, C., Lambert, J.-C., Platt, U., Pommereau, J.-P., Richter, A., Sarkissian, A., Van Roozendael, M., Wagner, T., and Winterrath, T.: Intercomparison of the influence of tropospheric clouds on UV-visible absorptions detected during the NDSC Intercomparison Campaign at OHP in June 1996, Geophys. Res. Lett., 26, 1169–1172, https://doi.org/10.1029/1999GL900198, 1999. a
PGN (Pandonia Global Network): Pandonia data archive, available at: http://data.pandonia-global-network.org/, last access: 5 January 2021. a
Pinardi, G., Van Roozendael, M., Hendrick, F., Theys, N., Abuhassan, N., Bais, A., Boersma, F., Cede, A., Chong, J., Donner, S., Drosoglou, T., Dzhola, A., Eskes, H., Frieß, U., Granville, J., Herman, J. R., Holla, R., Hovila, J., Irie, H., Kanaya, Y., Karagkiozidis, D., Kouremeti, N., Lambert, J.-C., Ma, J., Peters, E., Piters, A., Postylyakov, O., Richter, A., Remmers, J., Takashima, H., Tiefengraber, M., Valks, P., Vlemmix, T., Wagner, T., and Wittrock, F.: Validation of tropospheric NO2 column measurements of GOME-2A and OMI using MAX-DOAS and direct sun network observations, Atmos. Meas. Tech., 13, 6141–6174, https://doi.org/10.5194/amt-13-6141-2020, 2020. a, b, c, d, e, f, g, h
Piters, A. J. M., Boersma, K. F., Kroon, M., Hains, J. C., Van Roozendael, M., Wittrock, F., Abuhassan, N., Adams, C., Akrami, M., Allaart, M. A. F., Apituley, A., Beirle, S., Bergwerff, J. B., Berkhout, A. J. C., Brunner, D., Cede, A., Chong, J., Clémer, K., Fayt, C., Frieß, U., Gast, L. F. L., Gil-Ojeda, M., Goutail, F., Graves, R., Griesfeller, A., Großmann, K., Hemerijckx, G., Hendrick, F., Henzing, B., Herman, J., Hermans, C., Hoexum, M., van der Hoff, G. R., Irie, H., Johnston, P. V., Kanaya, Y., Kim, Y. J., Klein Baltink, H., Kreher, K., de Leeuw, G., Leigh, R., Merlaud, A., Moerman, M. M., Monks, P. S., Mount, G. H., Navarro-Comas, M., Oetjen, H., Pazmino, A., Perez-Camacho, M., Peters, E., du Piesanie, A., Pinardi, G., Puentedura, O., Richter, A., Roscoe, H. K., Schönhardt, A., Schwarzenbach, B., Shaiganfar, R., Sluis, W., Spinei, E., Stolk, A. P., Strong, K., Swart, D. P. J., Takashima, H., Vlemmix, T., Vrekoussis, M., Wagner, T., Whyte, C., Wilson, K. M., Yela, M., Yilmaz, S., Zieger, P., and Zhou, Y.: The Cabauw Intercomparison campaign for Nitrogen Dioxide measuring Instruments (CINDI): design, execution, and early results, Atmos. Meas. Tech., 5, 457–485, https://doi.org/10.5194/amt-5-457-2012, 2012. a
Platt, U. and Perner, D.: Measurements of atmospheric trace gases by long path differential UV-visible absorption spectroscopy, Optical and Laser Remote Sensing, edited by: Killinger, D. A. and Mooradien, A., Springer Verlag, New York, 95–105, 1983. a, b
Pommereau, J. and Goutail, F.: O3 and NO2 ground-based measurements by visible spectrometry during Arctic winter and spring 1988, Geophys. Res. Lett., 15, 891–894, https://doi.org/10.1029/GL015i008p00891, 1988. a
Robles-Gonzalez, C., Navarro-Comas, M., Puentedura, O., Schneider, M., Hase, F., Garcia, O., Blumenstock, T., and Gil-Ojeda, M.: Intercomparison of stratospheric nitrogen dioxide columns retrieved from ground-based DOAS and FTIR and satellite DOAS instruments over the subtropical Izana station, Atmos. Meas. Tech., 9, 4471–4485, https://doi.org/10.5194/amt-9-4471-2016, 2016. a
Roscoe, H., Johnston, P., Van Roozendael, M., Richter, A., Sarkissian, A., Roscoe, J., Preston, K., Lambert, J.-C., Hermans, C., De Cuyper, W., Dzienus, S., Winterrath, T., Burrows, J., Goutail, F., Pommereau, J.-P., D'Almeida, E., Hottier, J., Coureul, C., Ramon, D., Pundt, I., Bartlett, L., McElroy, C., Kerr, J., Elokhov, A., Giovanelli, G., Ravegnani, F., Premuda, M., Kostadinov, I., Erle, F., Wagner, T., Pfeilsticker, K., Kenntner, M., Marquard, L., Gil, M., Puentedura, O., Yela, M., Arlander, W., Kåstad Høiskar, B., Tellefsen, C., Karlsen Tørnkvist, K., Heese, B., Jones, R., Aliwell, S., and Freshwater, R.: Slant column measurements of O3 and NO2 during the NDSC intercomparison of zenith-sky UV-visible spectrometers in June 1996, J. Atmos. Chem., 32, 281–314, 1999. a
Schreier, S. F., Richter, A., Peters, E., Ostendorf, M., Schmalwieser, A. W., Weihs, P., and Burrows, J. P.: Dual ground-based MAX-DOAS observations in Vienna, Austria: Evaluation of horizontal and temporal NO2, HCHO, and CHOCHO distributions and comparison with independent data sets, Atmos. Environ.: X, 5, 100059, https://doi.org/10.1016/j.aeaoa.2019.100059, 2020. a
Sinreich, R., Friess, U., Wagner, T., and Platt, U.: Multi axis differential optical absorption spectroscopy (MAX-DOAS) of gas and aerosol distributions, Faraday discussions, 130, 153–164, 2005. a
Solomon, S., Schmeltekopf, A. L., and Sanders, R. W.: On the interpretation of zenith sky absorption measurements, J. Geophys. Res., 92, 8311–8319, https://doi.org/10.1029/JD092iD07p08311, 1987. a, b
Tirpitz, J.-L., Frieß, U., Hendrick, F., Alberti, C., Allaart, M., Apituley, A., Bais, A., Beirle, S., Berkhout, S., Bognar, K., Bösch, T., Bruchkouski, I., Cede, A., Chan, K. L., den Hoed, M., Donner, S., Drosoglou, T., Fayt, C., Friedrich, M. M., Frumau, A., Gast, L., Gielen, C., Gomez-Martín, L., Hao, N., Hensen, A., Henzing, B., Hermans, C., Jin, J., Kreher, K., Kuhn, J., Lampel, J., Li, A., Liu, C., Liu, H., Ma, J., Merlaud, A., Peters, E., Pinardi, G., Piters, A., Platt, U., Puentedura, O., Richter, A., Schmitt, S., Spinei, E., Stein Zweers, D., Strong, K., Swart, D., Tack, F., Tiefengraber, M., van der Hoff, R., van Roozendael, M., Vlemmix, T., Vonk, J., Wagner, T., Wang, Y., Wang, Z., Wenig, M., Wiegner, M., Wittrock, F., Xie, P., Xing, C., Xu, J., Yela, M., Zhang, C., and Zhao, X.: Intercomparison of MAX-DOAS vertical profile retrieval algorithms: studies on field data from the CINDI-2 campaign, Atmos. Meas. Tech. Discuss., https://doi.org/10.5194/amt-2019-456, in review, 2020. a
Tzortziou, M., Herman, J. R., Ahmad, Z., Loughner, C. P., Abuhassan, N., and Cede, A.: Atmospheric NO2 dynamics and impact on ocean color retrievals in urban nearshore regions, J. Geophys. Res.-Oceans, 119, 3834–3854, https://doi.org/10.1002/2014JC009803, 2014. a
Valks, P., Pinardi, G., Richter, A., Lambert, J.-C., Hao, N., Loyola, D., Van Roozendael, M., and Emmadi, S.: Operational total and tropospheric NO2 column retrieval for GOME-2, Atmos. Meas. Tech., 4, 1491–1514, https://doi.org/10.5194/amt-4-1491-2011, 2011. a, b
van Geffen, J., Boersma, K. F., Eskes, H., Sneep, M., ter Linden, M., Zara, M., and Veefkind, J. P.: S5P TROPOMI NO2 slant column retrieval: method, stability, uncertainties and comparisons with OMI, Atmos. Meas. Tech., 13, 1315–1335, https://doi.org/10.5194/amt-13-1315-2020, 2020. a
Vandaele, A., Hermans, C., Simon, P., Carleer, M., Colin, R., Fally, S., M'erienne, M., Jenouvrier, A., and Coquart, B.: Measurements of the NO2 absorption cross-section from 42 000 cm−1 to 10 000 cm−1 (238–1000 nm) at 220 K and 294 K, J. Quant. Spectrosc. Ra., 59, 171–184, https://doi.org/10.1016/s0022-4073(97)00168-4, 1998. a, b, c, d, e
Vandaele, A. C., Hermans, C., Simon, P. C., Van Roozendael, M., Guilmot, J. M., Carleer, M., and Colin, R.: Fourier transform measurement of NO2 absorption cross-section in the visible range at room temperature, J. Atmos. Chem., 25, 289–305, https://doi.org/10.1007/BF00053797, 1996. a
Vandaele, A. C., Fayt, C., Hendrick, F., Hermans, C., Humbled, F., Van Roozendael, M., Gil, M., Navarro, M., Puentedura, O., Yela, M., Braathen, G., Stebel, K., Tørnkvist, K., Johnston, P., Kreher, K., Goutail, F., Mieville, A., Pommereau, J.-P., Khaikine, S., Richter, A., Oetjen, H., Wittrock, F., Bugarski, S., Frieß, U., Pfeilsticker, K., Sinreich, R., Wagner, T., Corlett, G., and Leigh, R.: An intercomparison campaign of ground-based UV-visible measurements of NO2, BrO, and OClO slant columns: Methods of analysis and results for NO2, J. Geophys. Res., 110, D08305, https://doi.org/10.1029/2004JD005423, 2005. a
Verhoelst, T., Granville, J., Hendrick, F., Köhler, U., Lerot, C., Pommereau, J.-P., Redondas, A., Van Roozendael, M., and Lambert, J.-C.: Metrology of ground-based satellite validation: co-location mismatch and smoothing issues of total ozone comparisons, Atmos. Meas. Tech., 8, 5039–5062, https://doi.org/10.5194/amt-8-5039-2015, 2015. a
Vlemmix, T., Piters, A. J. M., Stammes, P., Wang, P., and Levelt, P. F.: Retrieval of tropospheric NO2 using the MAX-DOAS method combined with relative intensity measurements for aerosol correction, Atmos. Meas. Tech., 3, 1287–1305, https://doi.org/10.5194/amt-3-1287-2010, 2010. a, b
Vlemmix, T., Eskes, H. J., Piters, A. J. M., Schaap, M., Sauter, F. J., Kelder, H., and Levelt, P. F.: MAX-DOAS tropospheric nitrogen dioxide column measurements compared with the Lotos-Euros air quality model, Atmos. Chem. Phys., 15, 1313–1330, https://doi.org/10.5194/acp-15-1313-2015, 2015. a, b
Wagner, T., Beirle, S., Brauers, T., Deutschmann, T., Frieß, U., Hak, C., Halla, J. D., Heue, K. P., Junkermann, W., Li, X., Platt, U., and Pundt-Gruber, I.: Inversion of tropospheric profiles of aerosol extinction and HCHO and NO2 mixing ratios from MAX-DOAS observations in Milano during the summer of 2003 and comparison with independent data sets, Atmos. Meas. Tech., 4, 2685–2715, https://doi.org/10.5194/amt-4-2685-2011, 2011. a, b, c
Wang, Y., Li, A., Xie, P. H., Wagner, T., Chen, H., Liu, W. Q., and Liu, J. G.: A rapid method to derive horizontal distributions of trace gases and aerosols near the surface using multi-axis differential optical absorption spectroscopy, Atmos. Meas. Tech., 7, 1663–1680, https://doi.org/10.5194/amt-7-1663-2014, 2014. a, b
Wang, Y., Beirle, S., Lampel, J., Koukouli, M., De Smedt, I., Theys, N., Li, A., Wu, D., Xie, P., Liu, C., Van Roozendael, M., Stavrakou, T., Müller, J.-F., and Wagner, T.: Validation of OMI, GOME-2A and GOME-2B tropospheric NO2, SO2 and HCHO products using MAX-DOAS observations from 2011 to 2014 in Wuxi, China: investigation of the effects of priori profiles and aerosols on the satellite products, Atmos. Chem. Phys., 17, 5007–5033, https://doi.org/10.5194/acp-17-5007-2017, 2017. a, b
Xing, C., Liu, C., Wang, S., Chan, K. L., Gao, Y., Huang, X., Su, W., Zhang, C., Dong, Y., Fan, G., Zhang, T., Chen, Z., Hu, Q., Su, H., Xie, Z., and Liu, J.: Observations of the vertical distributions of summertime atmospheric pollutants and the corresponding ozone production in Shanghai, China, Atmos. Chem. Phys., 17, 14275–14289, https://doi.org/10.5194/acp-17-14275-2017, 2017. a
Xing, C., Liu, C., Hu, Q., Fu, Q., Lin, H., Wang, S., Su, W., Wang, W., Javed, Z., and Liu, J.: Identifying the wintertime sources of volatile organic compounds (VOCs) from MAX-DOAS measured formaldehyde and glyoxal in Chongqing, southwest China, Sci. Total Environ., 715, 136258, https://doi.org/10.1016/j.scitotenv.2019.136258, 2020. a
Yela, M., Gil-Ojeda, M., Navarro-Comas, M., Gonzalez-Bartolomé, D., Puentedura, O., Funke, B., Iglesias, J., Rodríguez, S., García, O., Ochoa, H., and Deferrari, G.: Hemispheric asymmetry in stratospheric NO2 trends, Atmos. Chem. Phys., 17, 13373–13389, https://doi.org/10.5194/acp-17-13373-2017, 2017. a, b
Zara, M., Boersma, K. F., van Geffen, J., and Eskes, H.: An improved temperature correction for OMI NO2 slant column densities from the 405-465 nm fitting window, KNMI, De Bilt, The Netherlands, Tech. rep., TN-OMIE-KNMI-982, available at: https://kfolkertboersma.files.wordpress.com/2019/09/tn-omie-knmi-982.pdf (last access: 5 January 2021), 2017. a, b
Zhao, X., Griffin, D., Fioletov, V., McLinden, C., Cede, A., Tiefengraber, M., Müller, M., Bognar, K., Strong, K., Boersma, F., Eskes, H., Davies, J., Ogyu, A., and Lee, S. C.: Assessment of the quality of TROPOMI high-spatial-resolution NO2 data products in the Greater Toronto Area, Atmos. Meas. Tech., 13, 2131–2159, https://doi.org/10.5194/amt-13-2131-2020, 2020. a, b
- Abstract
- Introduction
- Data description
- Mutual coherence between TROPOMI NRTI and OFFL
- Stratospheric column validation
- Tropospheric column validation
- Total column validation
- Discussion and conclusions
- Appendix A: Ground networks
- Data availability
- Author contributions
- Competing interests
- Special issue statement
- Acknowledgements
- Financial support
- Review statement
- References