the Creative Commons Attribution 4.0 License.
the Creative Commons Attribution 4.0 License.
 | 23 Jul 2021
Why we need radar, lidar, and solar radiance observations to constrain ice cloud microphysics
Silke Groß
Martin Wirth
Julien Delanoë
Stuart Fox
Bernhard Mayer
Ice clouds and their effect on earth's radiation budget are one of the largest sources of uncertainty in climate change predictions. The uncertainty in predicting ice cloud feedbacks in a warming climate arises due to uncertainties in measuring and explaining their current optical and microphysical properties as well as from insufficient knowledge about their spatial and temporal distribution. This knowledge can be significantly improved by active remote sensing, which can help to explore the vertical profile of ice cloud microphysics, such as ice particle size and ice water content. This study focuses on the well-established variational approach VarCloud to retrieve ice cloud microphysics from radar–lidar measurements.
While active backscatter retrieval techniques surpass the information content of most passive, vertically integrated retrieval techniques, their accuracy is limited by essential assumptions about the ice crystal shape. Since most radar–lidar retrieval algorithms rely heavily on universal mass–size relationships to parameterize the prevalent ice particle shape, biases in ice water content and ice water path can be expected in individual cloud regimes. In turn, these biases can lead to an erroneous estimation of the radiative effect of ice clouds. In many cases, these biases could be spotted and corrected by the simultaneous exploitation of measured solar radiances.
The agreement with measured solar radiances is a logical prerequisite for an accurate estimation of the radiative effect of ice clouds. To this end, this study exploits simultaneous radar, lidar, and passive measurements made on board the German High Altitude and Long Range Research Aircraft. By using the ice clouds derived with VarCloud as an input to radiative transfer calculations, simulated solar radiances are compared to measured solar radiances made above the actual clouds. This radiative closure study is done using different ice crystal models to improve the knowledge of the prevalent ice crystal shape. While in one case aggregates were capable of reconciling radar, lidar, and solar radiance measurements, this study also analyses a more problematic case for which no radiative closure could be achieved. In this case, collocated in situ measurements indicate that the lack of closure may be linked to unexpectedly high values of the ice crystal number density.
- Article
(11667 KB) - Full-text XML
- BibTeX
- EndNote


Ice clouds play an essential role in the climate system since they have a large effect on earth’s radiation budget, on heating and cooling rates throughout the atmosphere, and on the water cycle (Liou, 1986). Thin ice clouds, so-called cirrus clouds, play a special role in earth's climate due to their semi-transparency for solar radiation. While cirrus reflect only a small portion of the incoming solar radiation, they are very effective at inhibiting the transmission of thermal radiation from the surface and lower troposphere into space due to their location in the upper troposphere, where low temperatures prevail. Averaged globally, cirrus clouds thus have a net warming effect on the earth–atmosphere system (Hong et al., 2016). The level of scientific understanding of whether this effect of ice clouds will change in a warming climate including various cloud–climate feedbacks is, however, still low (IPCC, 2013). Measurement uncertainties in their current optical and microphysical properties as well as the insufficient knowledge about their spatial and temporal distribution contribute to this problem (Eliasson et al., 2011). The solar radiative effect of ice clouds is governed by their optical thickness and their particle size and shape (Eichler et al., 2009). It is therefore essential to improve and validate current techniques to retrieve these cloud properties.
1.1 Active vs. passive remote sensing of ice clouds
Since the early days of cloud remote sensing from space, properties like cloud cover, optical thickness, effective radius, or total water path were derived using bi-spectral retrieval techniques in the solar (Nakajima and King, 1990; Han et al., 1994; Platnick et al., 2003) as well as thermal spectral range (Rossow et al., 1989; Ewald et al., 2013). Sub-pixel cloud inhomogeneity (Zinner and Mayer, 2006), three-dimensional radiative effects (Marshak et al., 2006), and problematic viewing geometries (Cho et al., 2015) can however cause significant biases when using these passive techniques. While passive microwave observations are largely unaffected by these effects, uncertainties in the surface emissivity limit this technique from space to thicker ice clouds (Zhao et al., 2002). Almost all of these challenges are tied to an uncontrolled light source, where either the origin or path of the measured light is partly unknown. Active remote sensing techniques rely on their own light source and can therefore significantly improve the remote sensing of cloud microphysics from space or aircraft. Time-of-flight measurements with pulsed techniques such as radar or lidar can even yield profiles of cloud properties.
1.2 Combination of radar, lidar, and passive measurements
The combination of radar and lidar measurements can even provide height-resolved information of ice cloud microphysics. Since radar reflectivity Z is proportional to the sixth moment of the particle size distribution (PSD), its measurement is highly sensitive to the cloud particle size. In contrast, the lidar backscatter coefficient β is linked to extinction α, which is proportional to the second moment of the PSD and, in turn, more sensitive to the cloud particle number concentration. Due to this different sensitivity to particle sizes, both instruments complement each other in multiple ways. In the overlap region of both instruments, two moments of the PSD (e.g., particle number concentration and particle size) can be determined. Furthermore, the lidar contributes complementary measurements for optically thin ice clouds with a radar backscatter that is too weak, while the radar can penetrate deep convective ice clouds with precipitation for which the lidar signal is quickly extinguished.
First steps towards combined radar–lidar retrievals were made by Intrieri et al. (1993), Donovan and van Lammeren (2001), Tinel et al. (2005), and Mitrescu et al. (2005). While the extinction-to-backscatter ratio (lidar ratio S) had to be assumed in the first approach, the latter studies already combined radar reflectivity Z and attenuated lidar backscatter coefficient βa while varying S. These methods were, however, only applicable to the overlap region where the lidar signal is not yet attenuated, but cloud particles are already large enough to be detected by a cloud radar. More recent approaches (e.g., Delanoë and Hogan, 2008) solved this limitation by using optimal estimation frameworks that fit a microphysical model profile to lidar and radar measurements.
For the Cloud-Aerosol Lidar with Orthogonal Polarization (CALIOP) aboard CALIPSO (Winker et al., 2010) and the Cloud Profiling Radar (CPR) aboard CloudSat (Stephens et al., 2002) as well as for the upcoming ESA–JAXA EarthCARE mission (Illingworth et al., 2015), variational optimal estimation algorithms have been developed, which combine radar, lidar (e.g., 2C-ICE; Deng et al., 2010), and thermal radiance measurements (VarCloud; Delanoë and Hogan, 2008) in a unified framework. While the VarCloud algorithm is a versatile framework which is constantly developed further (Delanoë et al., 2014; Cazenave et al., 2019), a version called DARDAR (Delanoe and Hogan, 2010) is used to retrieve operational ice cloud microphysics from CloudSat and CALIPSO.
Up to now, all of these methods rely heavily on radar–lidar profile measurements and only make limited use of vertically integrating measurements like thermal radiances. The incorporation of passive measurements in the solar spectrum is planned for the future unified algorithm CAPTIVATE, as proposed by Illingworth et al. (2015) for the EarthCARE mission.
1.3 Problem statement
Combined radar–lidar measurements can provide high-resolution vertical profiles of cloud properties on the scale of a few dozen meters. This capability cannot be matched by cloud retrievals which are based on passive sensors only (Duncan and Eriksson, 2018). However, even radar–lidar measurements are not enough to constrain ice cloud microphysics, e.g., retrieve the effective radius (reff) and ice water content (IWC) unambiguously as shown by Ham et al. (2017). While lidar measurements are most sensitive to the particle extinction, radar reflectivity is mostly dependent on the squared-mass distribution of ice particles (Tinel et al., 2005). The mapping between the lidar and radar measurements depends significantly on the assumed particle habit and size distribution (Sourdeval et al., 2018). These assumptions determine the relationship between the extinction and further retrieved quantities like reff and IWC (Cazenave et al., 2019). Here, IR emissivity measurements can help constrain the problem (e.g., Delanoë and Hogan, 2008). But even then, ambiguity can remain as IR measurements saturate quite quickly with optical depth (Hong et al., 2016; Khatri et al., 2018).
For this reason, radar–lidar retrievals have to simplify the variability in naturally occurring ice crystals. The mass M and projected area A are commonly used properties to simplify the ice crystal variability since the radar reflectivity is proportional to M2 and the lidar-extinction coefficient is proportional to A (e.g., Delanoë et al., 2014). For that reason, large in situ data sets are explored for relationships that associate ice particle sizes D with their average in-situ-measured mass M and projected area A (e.g., Cazenave et al., 2019). Since these M–D and A–D relationships change with particle shape, the performance of combined radar–lidar retrievals relies on the statistical representativeness of the sampled ice particle shapes in the used in situ data.
Recent in situ studies, however, found an extreme variability in M–D properties among clouds as well as within individual clouds volumes (Xu and Mace, 2016; Mace and Benson, 2017). They observed that the assumption of a constant M–D relationship (and thus constant shape assumption) can lead to an uncertainty of a factor of 2 in ice water content retrievals. This finding is consistent with numerous other studies that discovered large differences in IWC (up to a factor of 2) between different radar–lidar retrievals (Comstock et al., 2007; Zhao et al., 2012; Deng et al., 2012; Hong et al., 2016).
In many cases, these biases could already be identified during the remote sensing process when retrieved cloud properties disagreed with simultaneously acquired passive measurements. In this context, Stein et al. (2011) examined two different microphysical assumptions within the VarCloud retrieval framework: the standard ice crystal shape assumption of oblate spheroids (following the M–D relationship of Brown and Francis, 1995) and a bullet rosette shape. In their study, Stein et al. (2011) could show that optical depths are globally a factor of 2 lower than those retrieved from MODIS when using oblate spheroids but overestimated by the same factor when using the bullet rosette shape. This strong sensitivity to the ice crystal shape serves as motivation to use solar radiances as a valuable tool to obtain ice cloud microphysics with accurate optical properties. Moreover, solar radiation promises greater synergy with radar–lidar measurements compared to thermal radiation due to its deeper cloud penetration depth.
The objective of this paper is to demonstrate how passive solar radiance measurements can be used to identify possible inconsistencies of the ice crystal model used in radar–lidar retrievals. To this end, the paper is organized as follows: Section 2 briefly recapitulates the prerequisites needed for a successful combination of radar, lidar, and passive radiance measurements and introduces the approach to validate radar–lidar retrieval results by radiative closure. The instruments and numerical methods used for this radiative closure study are introduced in Sects. 2.2 and 2.3. Section 3 then applies the presented approach to simultaneous radar, lidar, and passive radiance measurements from an airborne platform. The paper concludes with the presentation of a case with unsuccessful radiative closure, which is analyzed and discussed in Sect. 4 using collocated in situ measurements.
The following section introduces the methods used in the synergistic retrieval and its radiative closure study. It also highlights the challenges and prerequisites for a successful retrieval of ice cloud microphysics from the combination of all three instruments. The prerequisites to reconcile the knowledge gained from radar, lidar, and passive radiance measurements are the following:
-
The first prerequisite is simultaneous radar, lidar, and radiance measurements on a single platform. A temporal offset of minutes or a spatial offset larger than 1 km leads to errors for which a synergistic retrieval of ice cloud properties can no longer be trusted (Illingworth et al., 2000).
-
Secondly, sufficiently realistic forward models are an essential building block of every retrieval. Without a consistent translation of cloud microphysical properties into signals of all three instruments, the retrieval can exhibit substantial biases. Scattering and absorption as well as multiple scattering should be described with as much complexity as necessary, while the models should remain as simple and thus fast as possible.
-
Finally, the model which simplifies the variability in ice cloud microphysics and translates them into optical properties should be consistent among all three instruments. Different assumptions about the ice crystal shape or physically inconsistent particle properties would cause further biases which are inherently embedded in assumptions.
Figure 1 illustrates our approach to obtain consistent microphysical, optical, and radiative properties of individual ice clouds as these prerequisites are met. Specifically, this study uses lidar (WALES) and radar (MIRA) measurements to retrieve the ice water content and the ice crystal effective radius using an optimal estimation framework (VarCloud). To check the retrieved microphysics for consistency, solar radiation reflected from these clouds is then forward-simulated using a sophisticated radiative transfer code (libRadtran) and compared against solar radiances measured by spectroradiometers (specMACS) on the same platform. This is done multiple times using different assumptions about the ice crystal habit until radiative closure is achieved. The following subsection introduces the different instruments and methods in more detail.
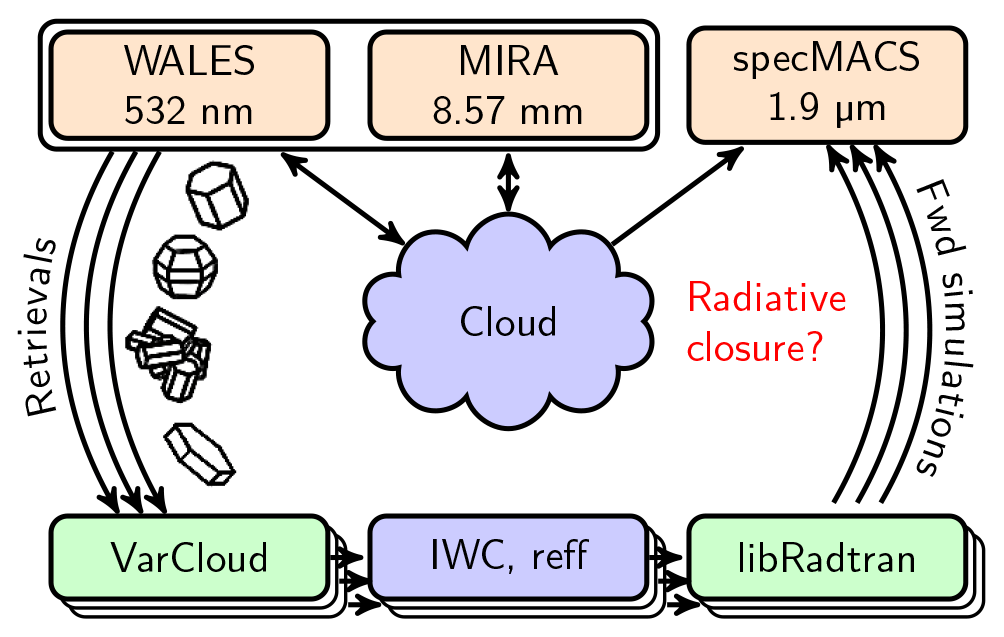
Figure 1Overall strategy to validate the lidar–radar (WALES/MIRA) retrieval results (VarCloud) for different assumptions about the ice crystal shape by radiative closure between measured (specMACS) and simulated (libRadtran) solar radiances.
2.1 Field campaign NAWDEX
During the North Atlantic Waveguide and Downstream Impact Experiment (NAWDEX; Schäfler et al., 2018), multiple research aircraft were deployed over the North Atlantic and western Europe in September and October 2016. The campaign was focused on the multi-scale observation of weather patterns associated with forecast errors in high-impact weather over Europe. Here, a special focus was placed on rapidly intensifying cyclones and their associated warm conveyor belts (WCBs). For the duration of the campaign, multiple research aircraft were deployed for coordinated measurement flights: the German research aircraft HALO (High Altitude and Long Range Research Aircraft; Krautstrunk and Giez, 2012), a modified Gulfstream G550 jet, and the SAFIRE French Falcon 20 operated from Iceland. For joint measurement flights, the BAe-146 research aircraft of the Facility for Airborne Atmospheric Measurements (FAAM; http://www.faam.ac.uk, last access: 17 July 2021) operated from the United Kingdom.
2.2 Instruments
The lidar, radar, and radiometer used in this study are part of the remote sensing payload of HALO. During various flight campaigns (NARVAL, NAWDEX, EUREC4A), the radar and lidar were deployed in the belly pod of HALO, while the spectroradiometer was installed in the tail of the airplane (Fig. 2).
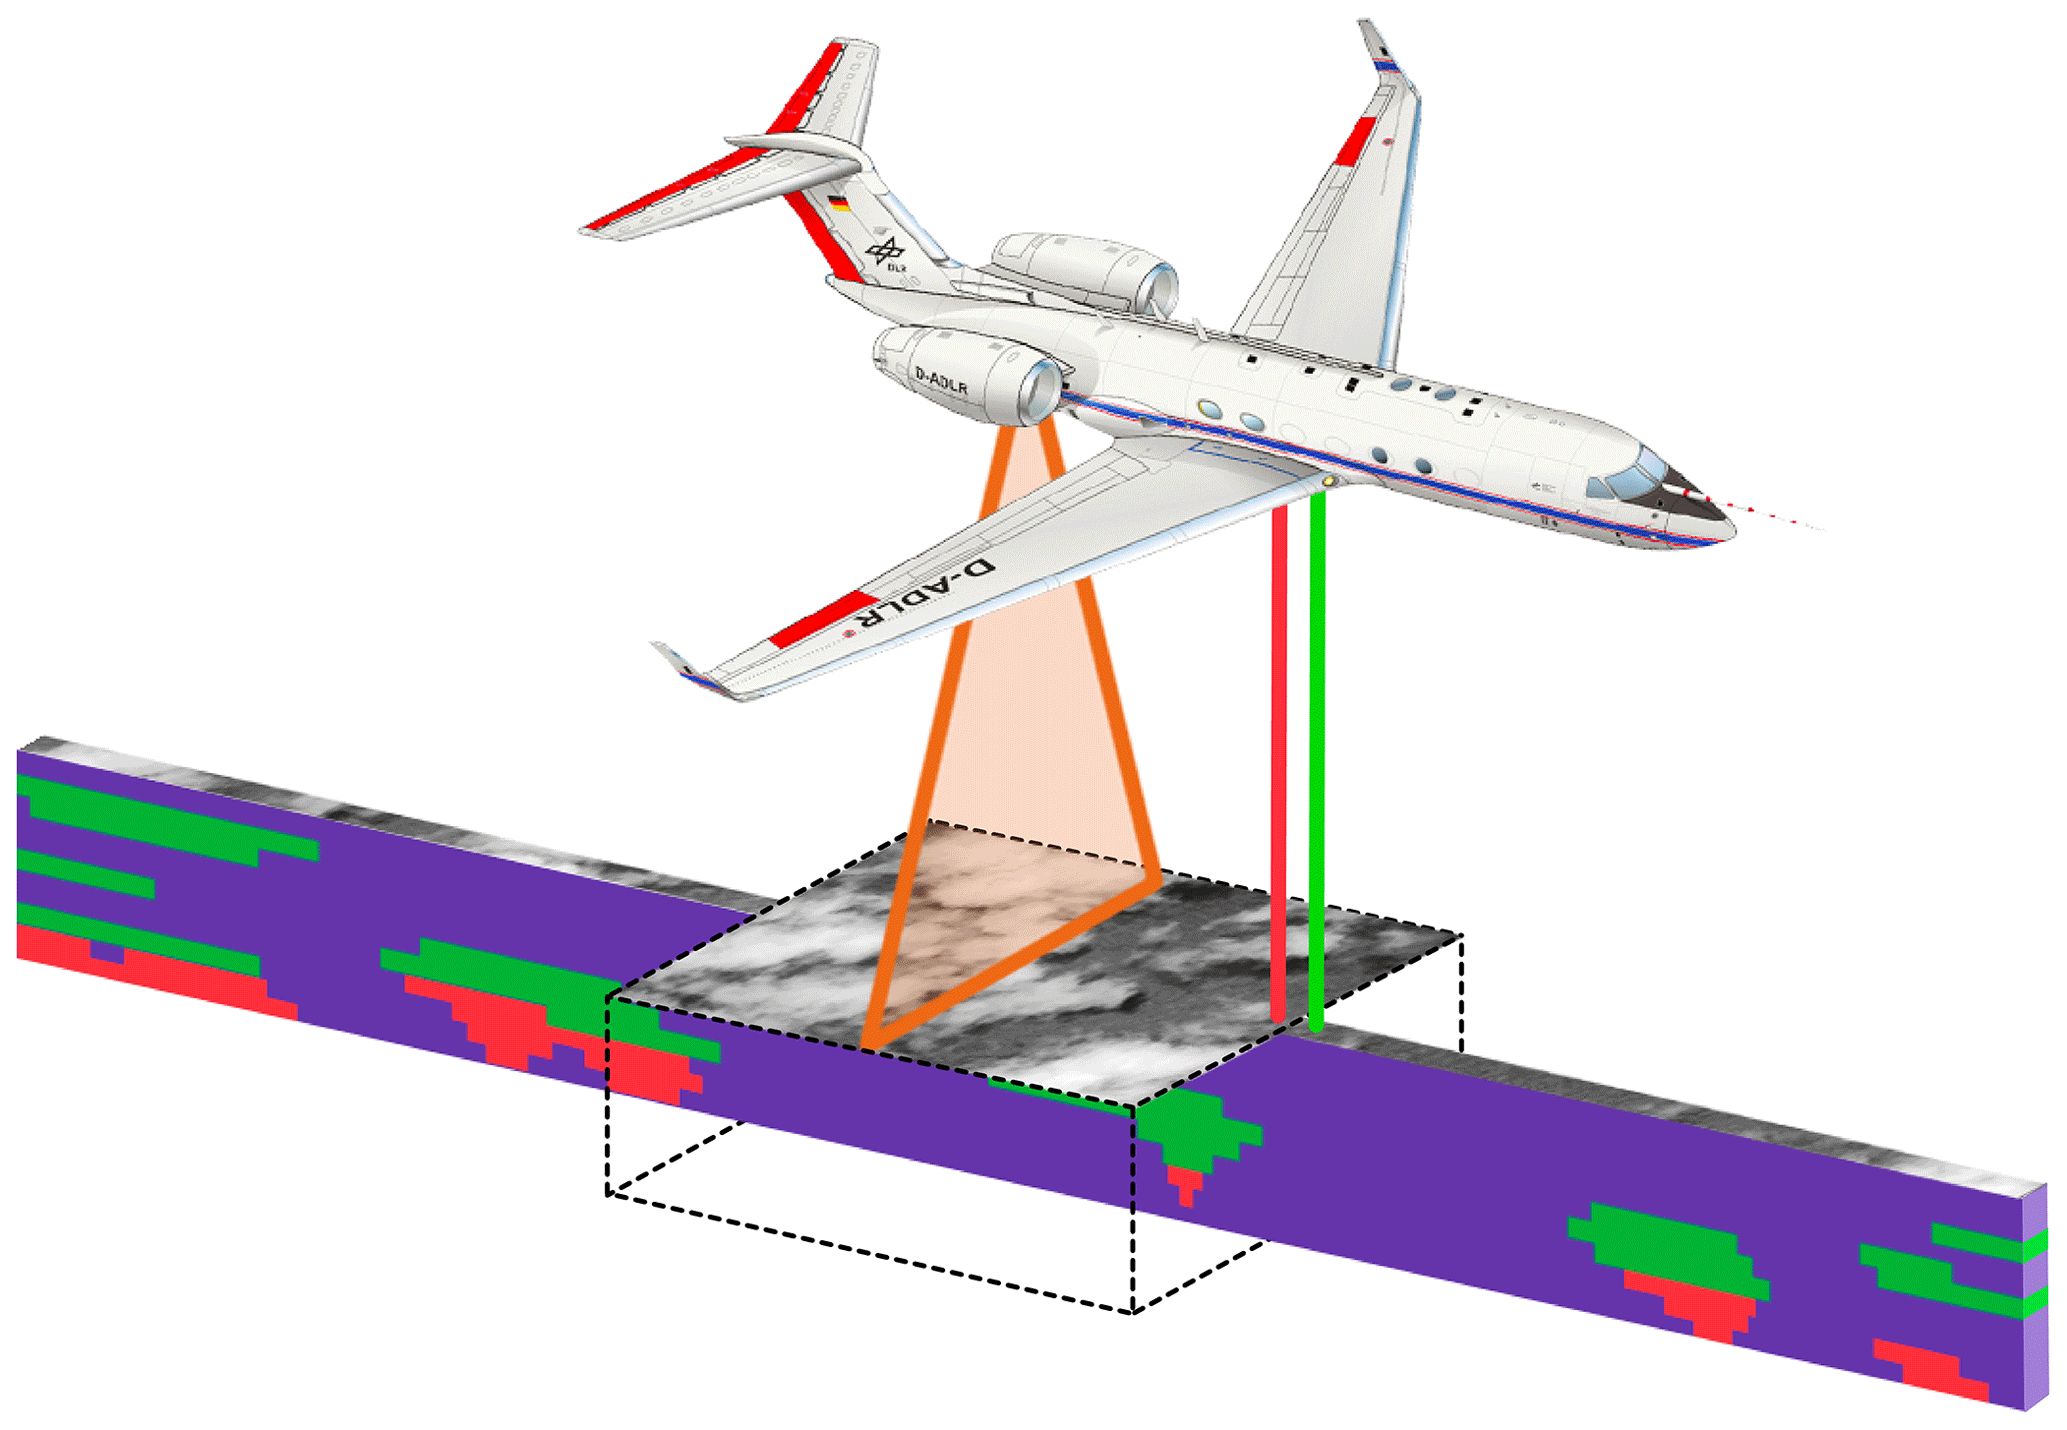
Figure 2Combined lidar (WALES), radar (HAMP MIRA), and solar radiance measurements (specMACS) from the German High Altitude Long Range Research Aircraft (HALO). Lidar (green) and radar (red) provide along-track cross-sections through the atmosphere, while the swath of the imager (orange) captures the across-track dimension of the scene.
2.2.1 WALES
The German Aerospace Center (DLR) airborne lidar system WALES (Water Vapour Lidar Experiment in Space) was built as a demonstrator for an ESA-proposed lidar mission in space to measure water vapor (Wirth et al., 2009). The WALES system has the capability for high-spectral-resolution lidar (HSRL) measurements at 532 nm and for lidar depolarization measurements at 532 and 1064 nm. Additionally, it measures water vapor mixing ratios from water vapor absorption bands around 935 nm (DIAL). In 2010, the WALES system flew for the first time on the HALO aircraft and showed its potential for cirrus cloud and water vapor studies (Groß et al., 2014).
2.2.2 HAMP MIRA
The HAMP MIRA instrument is a METEK Ka-band (35 GHz) cloud radar which can also determine the vertical velocity and the depolarization of cloud particles. As part of the HALO microwave package (HAMP) it is deployed in the belly pod of HALO. The instrument is well characterized and calibrated and proved to be in good agreement (±1 dB) with the 94 GHz cloud radars on board the French Falcon 20 aircraft and CloudSat during common flights (Ewald et al., 2019a).
2.2.3 specMACS
The specMACS imager was developed at the Meteorological Institute of the Ludwig Maximilian University and is a combination of two imaging spectroradiometers in the visible to near-infrared (400–1000 nm) and near-infrared (1000–2500 nm) wavelength regions. It measures spectral radiance with a spectral resolution of 3 nm in the visible and 10 nm in the infrared. As a push broom scanner, its spatial resolution is on the order of 10 m for cloud objects at a distance of about 10 km The system is well characterized and calibrated (Ewald et al., 2016), while first retrievals for cloud optical properties were developed (Zinner et al., 2016; Ewald et al., 2019b).
2.2.4 In situ measurements
For one of the flights (Sect. 3.2), simultaneous in situ measurements of ice water content and ice particle size distributions were made on board the FAAM BAe-146. During this flight (B984), the aircraft was equipped with a deep-cone Nevzorov hot-wire probe (Korolev et al., 2013), which provides measurements of the bulk total and liquid water content. To enhance the sensitivity for low ice water content, the hot-wire measurements were corrected using the baseline correction proposed by Abel et al. (2014). For flight B984, the BAe-146 was also equipped with the cloud imaging probes DMT CIP-15 and DMT CIP-100 (Baumgardner et al., 2011) to measure the particle size distribution (PSD) of hydrometeors in 1 s intervals. For this study, both instruments were fitted with deflection tips to reduce large ice crystal shattering, which otherwise would contaminate small particle number concentrations (Korolev et al., 2011). A detailed description of the cloud imaging instrumentation and the processing of the data is given in Cotton et al. (2013). With a resolution of 15 µm, the CIP-15 probe covered the diameter range 15–930 µm of smaller cloud particles, while the CIP-100 probe sampled larger cloud particles with diameters between 100–6200 µm with a resolution of 100 µm. To obtain particle size distributions for the whole size range, the PSDs measured by the CIP-15 probe were used up to a diameter of 700 µm and combined with PSDs measured by the CIP-100 probe above that diameter. Due to the small sampling volume of the cloud imaging probes, the PSDs were furthermore averaged over 10 s intervals. These composite PSDs were then used to calculate ice crystal number concentrations for the whole diameter range.
2.3 Numerical methods
2.3.1 Synergistic radar–lidar retrieval
The retrieval approach for the radar and lidar instruments is based on a variational optimal estimation algorithm (VarCloud; Delanoë and Hogan, 2008), which combines radar, lidar, and thermal radiances in a unified framework. The retrieval is the basis of the DARDAR Cloud microphysics product for ice clouds on A-Train data (Delanoe and Hogan, 2010). The unique characteristic of this approach is its rigorous application of a forward model developed by Hogan (2008) to simulate the multiple-scattered lidar signal. It then uses the Jacobians from this forward model to update an a priori microphysical profile to achieve convergence of the simulated measurements to the actual ones. For this study, the most current retrieval version with updated ice cloud microphysics of Cazenave et al. (2019) was used. The algorithm performs retrievals of extinction α, IWC, and reff. In addition, ice crystal number concentrations (ICNCs) are derived from the microphysical best estimate. This method (DARDAR Nice) is described and has been thoroughly evaluated by Sourdeval et al. (2018) against a large number of in situ measurements. For this study, the VarCloud framework was adapted to the HALO instrumentation. To that end, the reflectivity lookup tables were extended to 35 GHz to include the wavelength of the cloud radar HAMP MIRA (see Sect. 2.3.2), while the wavelength (532 µm) and beam divergence of WALES were used in the lidar forward model.
2.3.2 Microphysical parameterization
The ice microphysical and scattering models employed in this study are of central importance. Both the lidar–radar results and the simulated solar radiances used in the closure assessment depend on the ice microphysical and scattering models assumed. In this section, we describe the microphysical and scattering models employed in this study. We cover both the assumptions used in the retrieval and in the simulation of the solar radiances for the radiative closure. While the relationship between the mass and size of ice crystals is profoundly important for the backscatter of radar waves at millimeter wavelengths (Ham et al., 2017), their geometric cross-section has a decisive influence on lidar and passive solar radiance measurements (Holz et al., 2016). Even the shape of ice crystals influences the solar radiance reflected from ice clouds due to differences in the scattering phase function (Eichler et al., 2009).
A commonly used framework which simplifies the variability in naturally occurring ice cloud particles is the concept of an effective ice particle density ρi,eff. It is defined as the ratio between the ice particle mass M and the volume of a sphere that encloses the maximum diameter Dmax of the ice particle (Cotton et al., 2013). A frequent observation in in situ measurements is the decreasing effective density of ice crystal as their maximum diameter Dmax increases (Brown and Francis, 1995; Cotton et al., 2013). Based on these measurements, the relationship between Dmax and M is commonly described by a power law: (Mitchell et al., 1996; Heymsfield et al., 2010). For this study, the most recent M–D relationship for VarCloud with a=0.007 and b=2.2 was used (Cazenave et al., 2019). The M–D relationship also allows the calculation of the equivalent melted diameter Deq for a given Dmax. Analogously, in situ data were used by Heymsfield et al. (2013) to derive an A–D relationship to connect Dmax with the geometric cross-section A of ice particles.
To describe the average scattering properties of ice particles, VarCloud uses the approximation by Hogan et al. (2012) of horizontally aligned oblate spheroids. This approximation simplifies the arbitrarily complex shape of ice particles with oblate spheroids with an aspect ratio of 0.6 while maintaining the maximum diameter Dmax and the total ice mass M. The dielectric properties of these soft spheroids with an effective density according to the M–D relationship are modeled as a blend of ice and air (Petty and Huang, 2010) using the effective medium approximation by Maxwell Garnett (1904). The radar cross-section σbck is obtained by the T-matrix method of Mishchenko et al. (2004). The A–D relationship is used to calculate the visible extinction cross-section σext=2A(D) to be twice its geometric cross-section A following the geometric optics limit here. The optical single-scattering properties of these spheroids, such as scattering phase function and asymmetry parameter g, are calculated using the T-matrix method.
The second ice crystal model tested in this study is the randomly oriented ice crystals described by Yang et al. (2000) with specific geometric shapes. The following study considers three ice crystal shapes, called habits: solid columns, aggregates, and plates. For reasons of consistency, the radar backscatter cross-section σbck is calculated in the same way as for the soft spheroids using the corresponding M–D and A–D relationships given in Yang et al. (2000). For their optical properties, the well-established single-scattering library of Yang et al. (2013) is used. In this library, the discrete dipole approximation, the T-matrix method, and an improved geometric optics method are combined to describe the more complex scattering of light by ice crystals with specific shapes.
To represent the variability in ice particle sizes within a cloud volume, a realistic and well-established particle size distribution (PSD) is used. Since PSDs are known to be highly variable (Intrieri et al., 1993), we choose the normalized PSD approach by Delanoë et al. (2005), which is based on an extensive database of airborne in situ measurements with updated parameters and βF=1.754 from Cazenave et al. (2019). The visible extinction αv and the radar reflectivity Z are then derived by integrating σext and the radar backscatter cross-section σbck over this PSD:
The same integration is done for the ice crystal mass M(D) to obtain the corresponding IWC:
Following Delanoë et al. (2014), the effective radius reff is calculated from αv and IWC using the approximation of Foot (1988):
where ρice=917 kg m−3 is the density of ice.
Figure 3 summarizes the microphysical, single-scattering, and bulk radiative properties for the soft spheroid approximation (gray line) used in Cazenave et al. (2019) and the specific ice crystal shapes (symbol line) of Yang et al. (2000). The upper panels in Fig. 3 show single particle properties as a function of the maximum dimension Dmax, such as the effective ice density (Fig. 3a), the extinction cross-section σext at 532 nm (Fig. 3b), and the radar backscatter cross-section σbck in square meters (Fig. 3c). For Dmax < 500 µm, Fig. 3a confirms that the specific ice crystal shapes (in particular plates) are less dense than the soft spheroids of Cazenave et al. (2019). Only larger aggregates (Dmax>500 µm) have a higher effective density. The mostly two-dimensional plates have the largest extinction cross-section (Fig. 3b) in relation to Dmax, followed by the complexly structured aggregates, the soft spheroids, and the more needle-like solid columns. A similar behavior can be observed for Z, where aggregates and solid columns scatter less than plates when they have the same effective radius reff. Below reff<30 µm, spheroids of the same reff show smaller Z than aggregates; for reff>30 µm, spheroids show similar Z as solid columns.
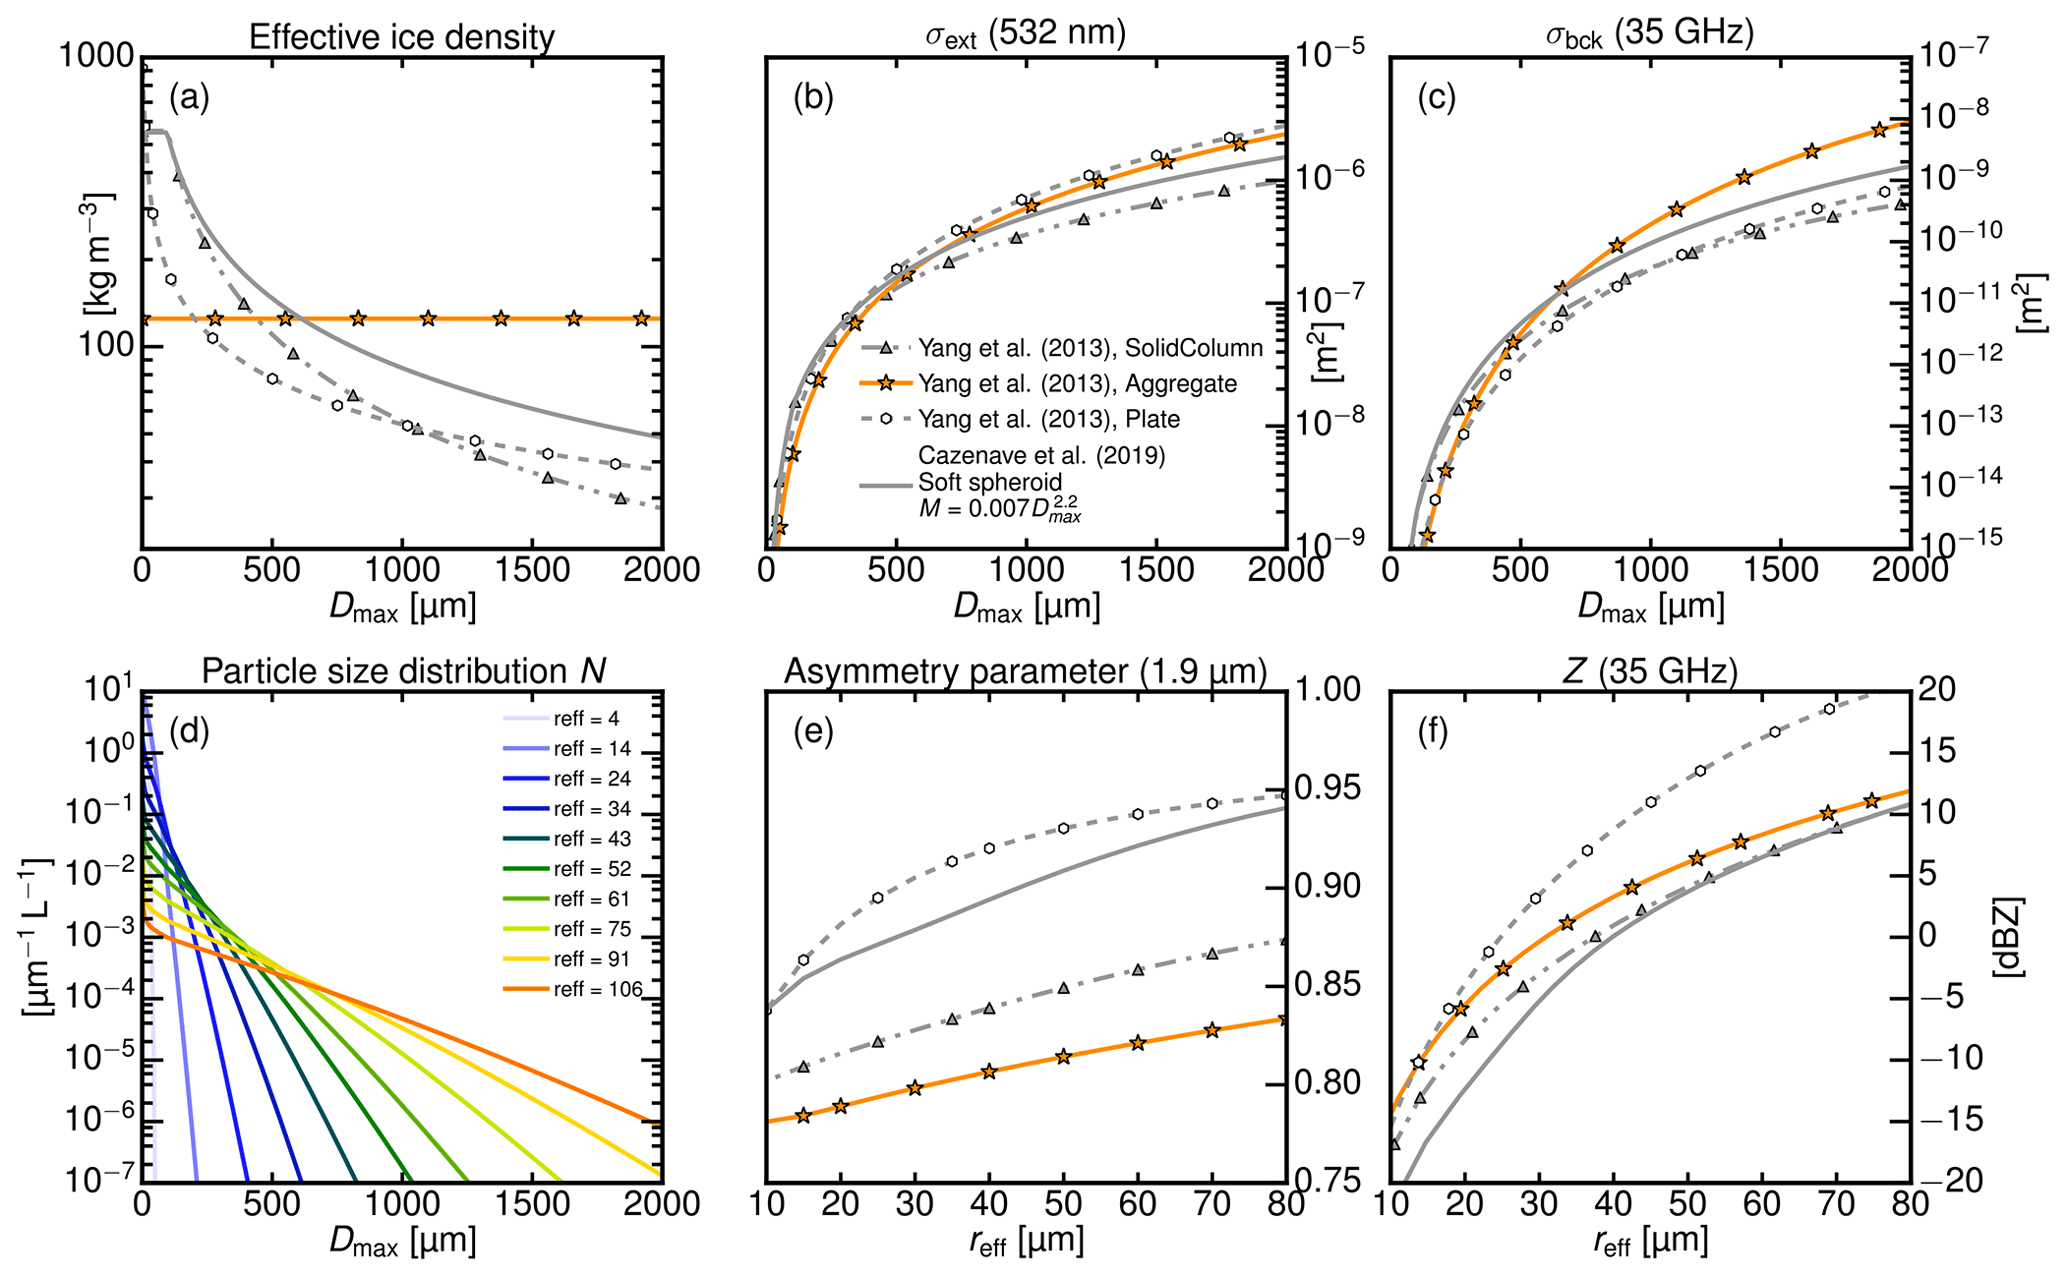
Figure 3Microphysical, single-scattering, and bulk radiative properties of the different ice crystal models used in this study (gray line: soft spheroid approximation following Cazenave et al., 2019; symbol lines: specific ice crystal shapes following Yang et al., 2000). (a) Relationship between maximum dimension Dmax and effective ice density for single ice crystals in kg m−3, (b) extinction cross-section σext at 532 nm, and (c) radar backscatter cross-section σbck in square meters. (d) Particle size distributions of Cazenave et al. (2019) for different effective radii and corresponding (e) asymmetry parameter at 1.9 µm and radar reflectivity Z at 35 GHz for an ice cloud with constant IWC=1 g m−3.
2.3.3 Solar radiance forward modeling
While VarCloud only retrieves properties of ice clouds, solar radiation can also be reflected by liquid water clouds and aerosols. As a consequence, the radiance measurements can contain a mixture of information from ice clouds, underlying water clouds, aerosols, and the surface. This poses a problem for the radiative closure.
Radiative transfer model
In this study, the DISORT (Stamnes et al., 1988) solver was used to explore radiative transfer effects in one-dimensional, multilayer cloud scenes. For cloud scenes reconstructed from HALO measurements, more realistic forward simulations of reflected solar radiation were done using the Monte Carlo code for the physically correct tracing of photons in cloudy atmospheres (MYSTIC; Mayer, 2009). Both models are part of the radiative transfer library libRadtran (Mayer and Kylling, 2005; Emde et al., 2016), which also includes the single-scattering properties of Yang et al. (2013). Atmospheric absorption is considered using the representative wavelengths absorption parametrization (REPTRAN; Gasteiger et al., 2014), which is based on the HITRAN absorption database (Rothman et al., 2005). As shown by Zinner et al. (2019), the medium resolution (cm−1) of REPTRAN is sufficient to model the spectral resolution of specMACS after convolving it with its spectral response (e.g., Δλ=6.4 nm at 1900 nm; Ewald et al., 2016). For the following sensitivity study, the standard summer mid-latitude profiles by Anderson et al. (1986) were used.
Exclusion of surface and water cloud reflection
To overcome the previously mentioned problem of multilayer scenes for passive remote sensing, Gao et al. (1993) suggested exploiting the water vapor absorption band at 1.38 µm to detect thin cirrus clouds with the Airborne Visible/Infrared Imaging Spectrometer (AVIRIS). The technique takes advantage of the fact that cirrus clouds and large parts of other ice clouds are mostly located above the atmospheric water vapor column. In a strong water vapor absorption band, a downward-looking sensor flying above 10 km receives almost no solar radiation scattered from the surface or low-level clouds. In contrast, the solar radiation scattered by high-level clouds stands out above this black and homogeneous background. This technique is also used to monitor the reflectance (Gao and Kaufman, 1994) and to retrieve the optical thickness (Meyer and Platnick, 2010) of cirrus clouds globally using the Moderate Resolution Imaging Spectrometer (MODIS).
With specMACS, all water vapor absorption bands up to 2.5 µm in the near-infrared wavelength region are readily available. Figure 4 explores and illustrates the technique to exclude the contribution of the surface and low-level water clouds in multilayer scenes observed with specMACS. In this experiment, a water cloud layer with a fixed effective radius reff,w of 10 µm was superimposed with an ice cloud layer with a fixed optical thickness τi of 0.5. Subsequently, DISORT was used to calculate the spectral transmittance of that cloud scene for solar radiation between 800 nm and 2.5 µm. Figure 4a shows the atmospheric transmittance at 870 nm (red line) and 1.9 µm (orange line) as a function of altitude. It is evident how the atmosphere is semi-transparent down to the water cloud layer in a so-called window channel at 870 nm and how absorption by water vapor confines the solar radiation at 1.9 µm to the upper troposphere. Figure 4b illustrates how the spectral transmittance of atmospheric water vapor acts as a vertical weighting function for reflected photons. The most opaque water vapor bands are centered at 1.38 and 1.9 µm within the wavelength range accessible with specMACS.
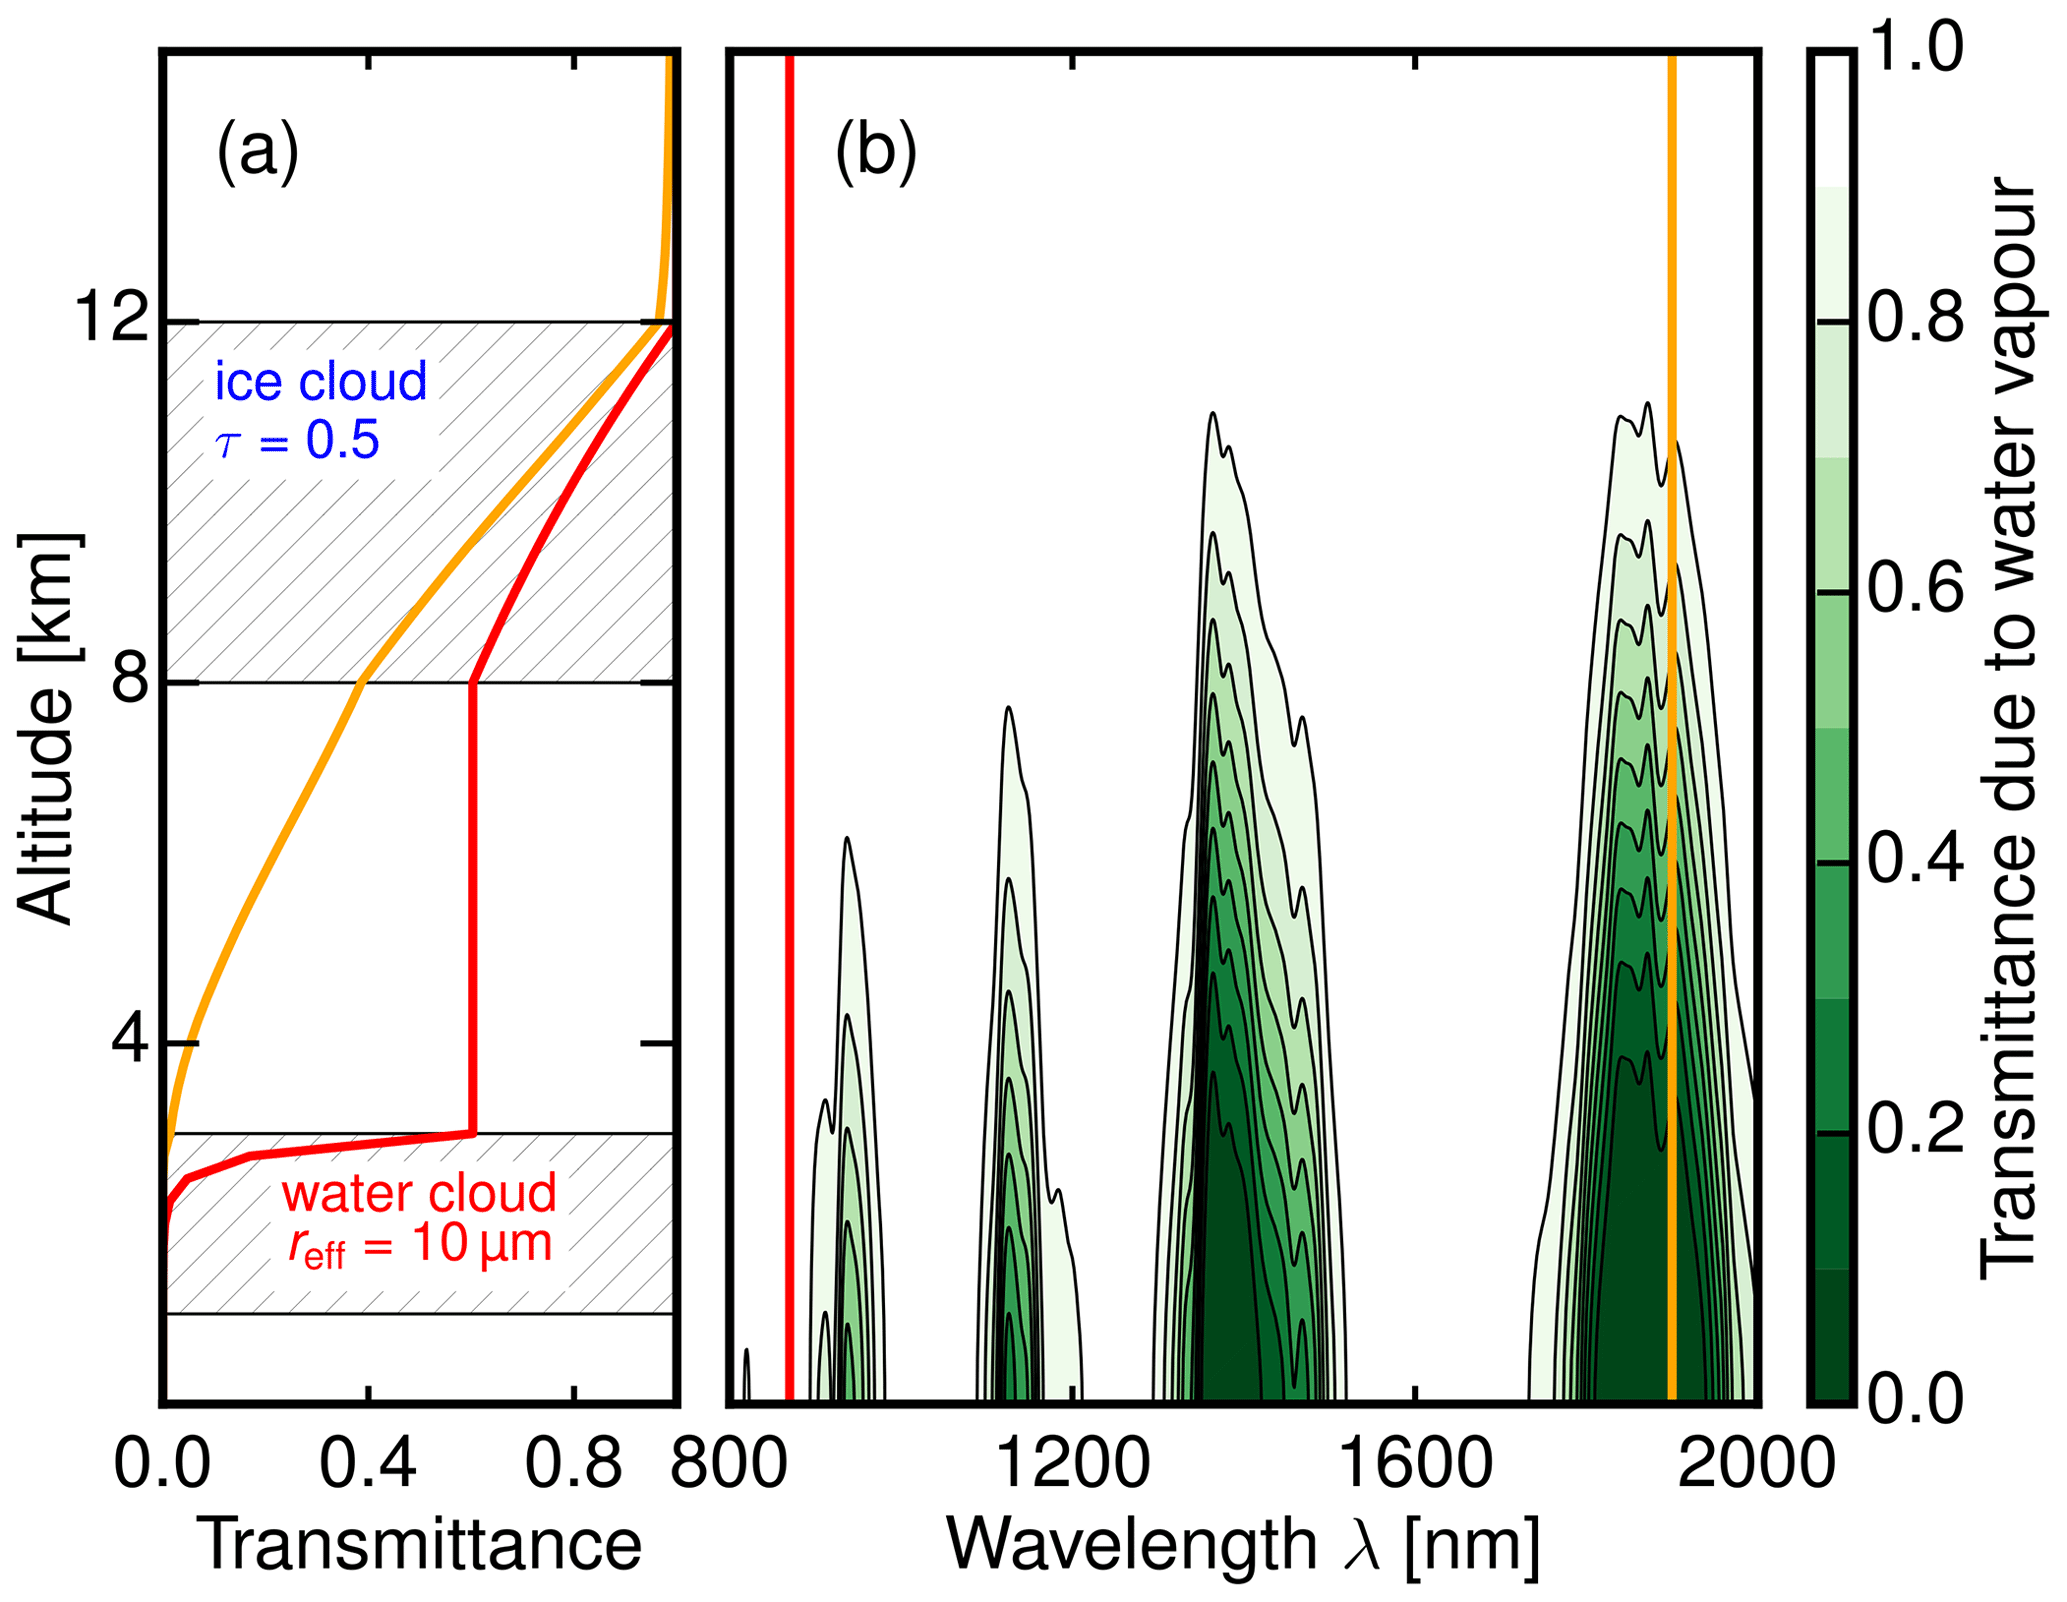
Figure 4(a) Atmospheric transmittance of a water cloud and overlying ice cloud layer at 870 nm (red line) and 1.9 µm (orange line). (b) The spectral transmittance of atmospheric water vapor acting as a vertical weighting function.
While the more commonly used cirrus band at 1.38 µm is almost as opaque as the band at 1.9 µm, the latter has a significant advantage for the radiative closure study: the absorption coefficient of ice exhibits a much stronger maximum close to 1.9 µm, which gives this channel a sensitivity to ice crystal size. To analyze this unique combination of sensitivity and opaqueness, the spectral reflectance of this scene was calculated while varying the ice crystal size reff,i in the cirrus layer and the optical thickness τw of the underlying water cloud layer. Figure 5 (left) shows the results for different τw ( µm) and fixed optical thickness τi of 0.5. While the reflectance at 870 nm increases from 0.03 to 0.7 as τw increases from 0 to 30, it remains invariant of τw at both water vapor absorption bands (1.9 µm as well as 1.38 µm). When the ice crystal size reff,i is modified (Fig. 5, right), however, the spectral reflectance shows a different characteristic. While the reflectance is cut in half (0.016 to 0.007) as ice crystal size increases from µm to µm at 1.9 µm, no large variation can be observed for 1.38 µm. The sensitivity for reff,i appears at slightly larger wavelengths (1.4 µm) for which the atmosphere becomes transparent down to the water cloud layer again. Hence, the 1.9 µm water vapor absorption band is the only sufficiently opaque wavelength region accessible with specMACS which simultaneously shows a sensitivity to ice crystal size.
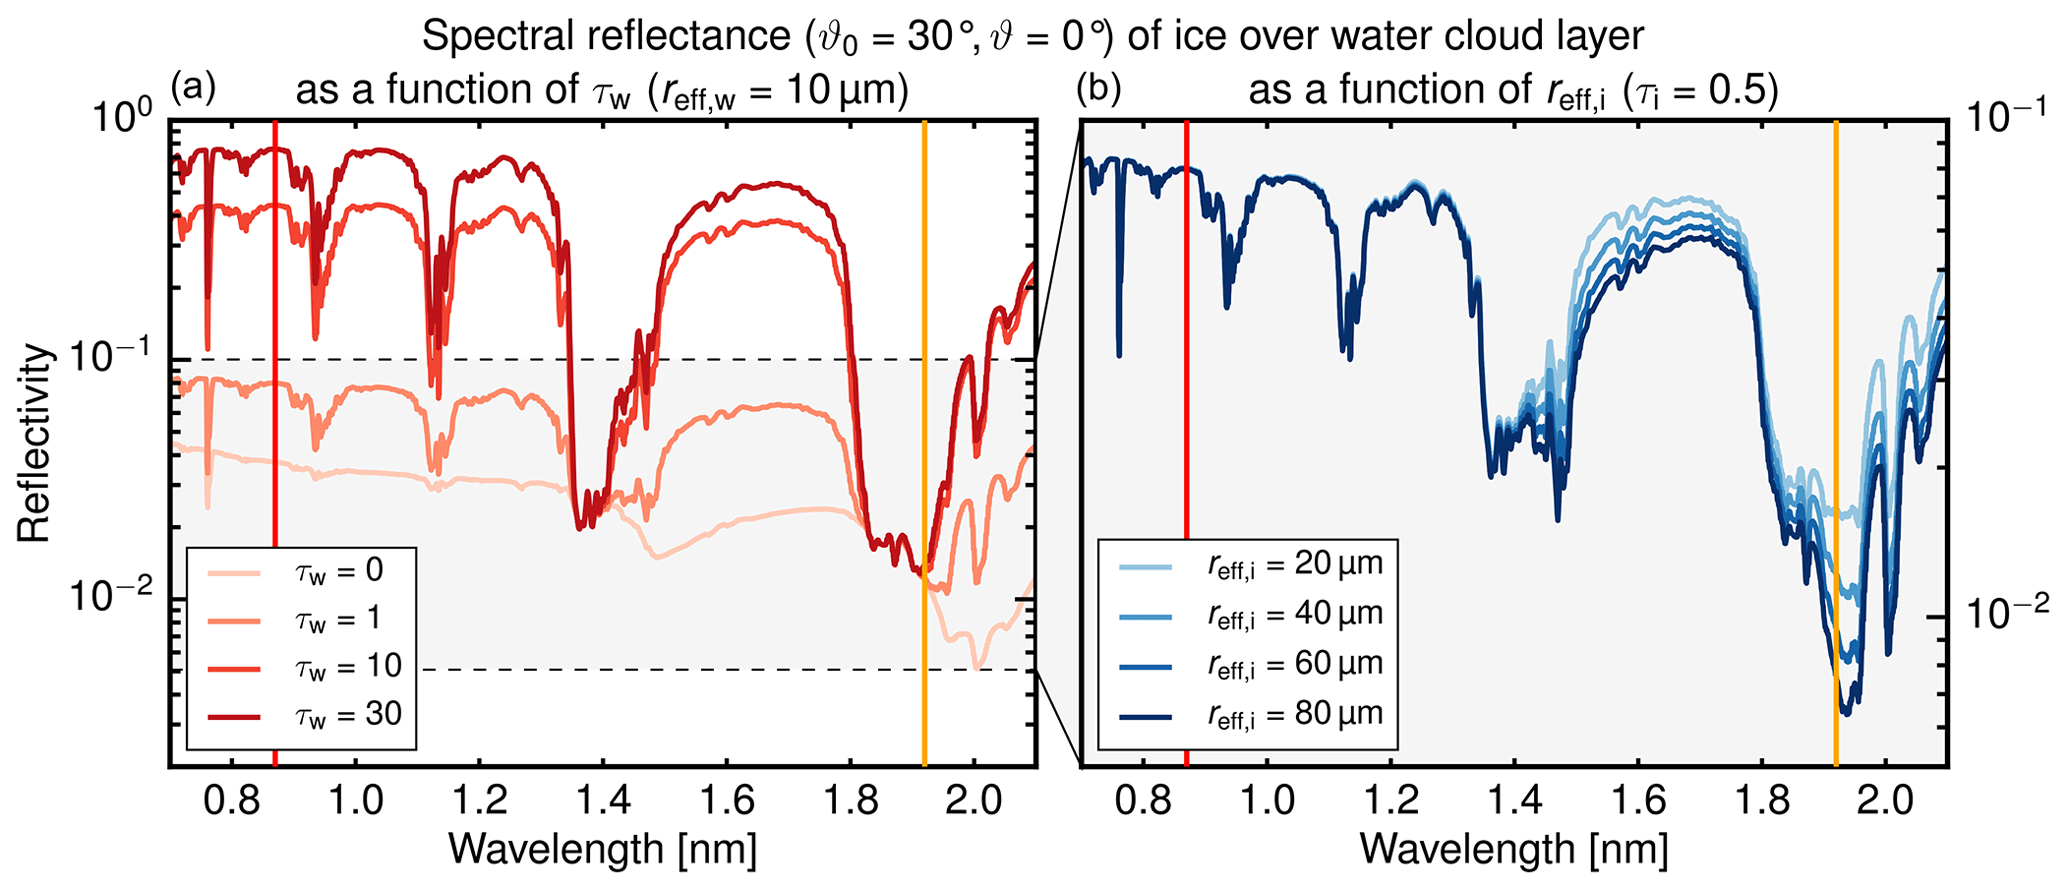
Figure 5Spectral reflectance of an ice over water cloud layer as sketched in Fig. 4a for the nadir () perspective and a solar zenith angle of . (a) Results (red lines) for varying optical thickness τw of the water cloud layer and (b) results (blue lines) for varying ice crystal size reff,i of the ice cloud layer.
3.1 Case 1: cirrus outflow of a WCB
The first case study was measured during the sixth research flight (RF06) of HALO on 1 October 2016. The scientific target of the flight was a rapidly intensifying cyclone southwest of Iceland, named the Stalactite cyclone due to its stalactite-like tropopause trough (Schäfler et al., 2018). Its rapid development occurred between 29 September and 2 October in the context of a large-scale upper-level trough over Greenland. On 1 October, its center was located at about 50∘ N, 35∘ W, with an intense warm conveyor belt located in the upstream region of a warm subtropical air mass. The strong ascent led to a strong ridge building over Iceland and the subsequent formation of a Scandinavian blocking situation (Maddison et al., 2019). A satellite image in Fig. 6a reveals the flight path (white) and the flight leg (red section) considered in this case study. The panels in Fig. 7 show measurements and retrieved ice microphysics that were made between 08:55–09:25 UTC above a cirrus cloud layer at the eastern flank of the upper-level divergent outflow of the WCB. Between 61.2∘ N, 25.8∘ W, and 57.9∘ N, 28.6∘ W, this cirrus cloud deck appeared above a shallow marine cloud deck and deepened during the flight leg towards the center of the cyclone.

Figure 6(a) SEVIRI satellite image of the case discussed in Fig. 7 (red section), where HALO (white) measured the cirrus outflow of a WCB on 1 October 2016 in a region south of Iceland. (b) SEVIRI satellite image of the case discussed in Fig. 8. On 14 October 2016, HALO (white) and the FAAM BAe-146 (orange) research aircraft flew a coordinated flight leg (red section) over ice clouds within an occluded front west of the Scottish Highlands. © 2020 EUMETSAT.

Figure 7Remote sensing of a cirrus layer measured with HALO on 1 October 2016 during the NAWDEX campaign. (a) True-color image acquired by the hyperspectral cloud imager specMACS (Ewald et al., 2016) along the flight path, (b) attenuated backscatter coefficient measured with the WALES lidar at 532 nm and corresponding (c) equivalent effective reflectivity Ze measured with the cloud radar HAMP MIRA at 35 GHz. (d) Ice water content and (e) effective radius of ice crystals retrieved by combining information from lidar (Fig. 7b) and (Fig. 7c) radar using the VarCloud framework.
The top-down perspective along the flight path is given in Fig. 7a by a true-color image which was acquired by specMACS. The corresponding vertical perspective obtained by the active remote sensing instruments is shown in Fig. 7b with the attenuated backscatter coefficient measured by WALES at 532 nm and in Fig. 7c with the equivalent effective reflectivity Ze measured by HAMP MIRA at 35 GHz. Figure 7b and c illustrate the complementary nature of radar and lidar measurements: while the lidar can contribute detailed structures in optically thin layers on the cloud top, the cloud radar retrieves signals from deep within the cloud, where the lidar signal is already extinguished. This synergy is used to retrieve IWC and reff using the VarCloud framework described in Sect. 2.3.1. Figure 7d and e show the retrieved IWC and the retrieved ice crystal effective radius using the microphysical parameterization of Cazenave et al. (2019) in VarCloud. While ice crystals are very small at the cloud top (reff=20 µm), their size increases considerably while sedimenting downward to reach reff=80 µm at the bottom of the cirrus layer.
3.2 Case 2: occluded front clouds
The second case study was measured during the 11th research flight (RF11) of HALO on 14 October 2016. The scientific objective was the collocated measurement of a frontal cloud system with three aircraft and a joint underpass of the CALIPSO/CloudSat satellite constellation to characterize and validate synergies obtained from radar, lidar, and radiometer measurements. The frontal cloud system was located over Scotland and was associated with a cut-off low just west of Ireland. On the leading edge of this low, a moist and warm air mass was advected northward over the North Sea and lifted to form an occluded front. Over the day, the front remained almost stationary with a southeastern flow over the Scottish Highlands.
Over the sea between the Scottish Highlands and the Outer Hebrides, HALO, the SAFIRE Falcon, and the FAAM BAe-146 performed a common flight leg staggered at different altitudes above this occluded front. The satellite image in Fig. 6b gives an overview of the cloud scene, the flight tracks of HALO (white) and the FAAM BAe-146 (orange), and the common flight leg (red section). While HALO and the SAFIRE Falcon flew over the cloud layer at an altitude of 13.5 and 11 km, respectively, the FAAM BAe-146 performed a profiling flight pattern within the radar–lidar curtain. Figure 8 shows the measurements made on HALO between 10:30–10:52 UTC while all three aircraft flew a south–north cross-section over the occluded front along 6.5∘ W longitude and between 58.1∘ N and 59.4∘ N. Figure 8a shows again a true-color image measured with specMACS for a zoomed section between 10:30–10:33 UTC along the flight path. The attenuated backscatter coefficient in Fig. 8b shows very strong backscatter peaks embedded within multiple cloud decks at an altitude of 5 km which rise stepwise to a continuous cloud deck at an altitude of 8 km in the second part of the cross-section. Ahead and trailing the front, multiple supercooled cloud layers can be identified by their strong backscatter and attenuation. Overall, the lidar signal is extinguished much more rapidly compared to the case shown in Fig. 7b. The equivalent effective reflectivity Ze in Fig. 8 shows a deep ice cloud layer with precipitation to the ground and mixed-phase regions above a melting layer at 1.5 km altitude. The overlap of radar and lidar measurements is smaller in contrast to the first case (Sect. 3.1). To exclude obvious mixed-phase regions, the VarCloud retrieval was only applied to measurements with air temperatures below −15 ∘C and down to 4 km altitude. Like before, the last two panels (Fig. 8d and e) present the retrieved IWC and the retrieved effective radius for the default microphysical parameterization of Cazenave et al. (2019).
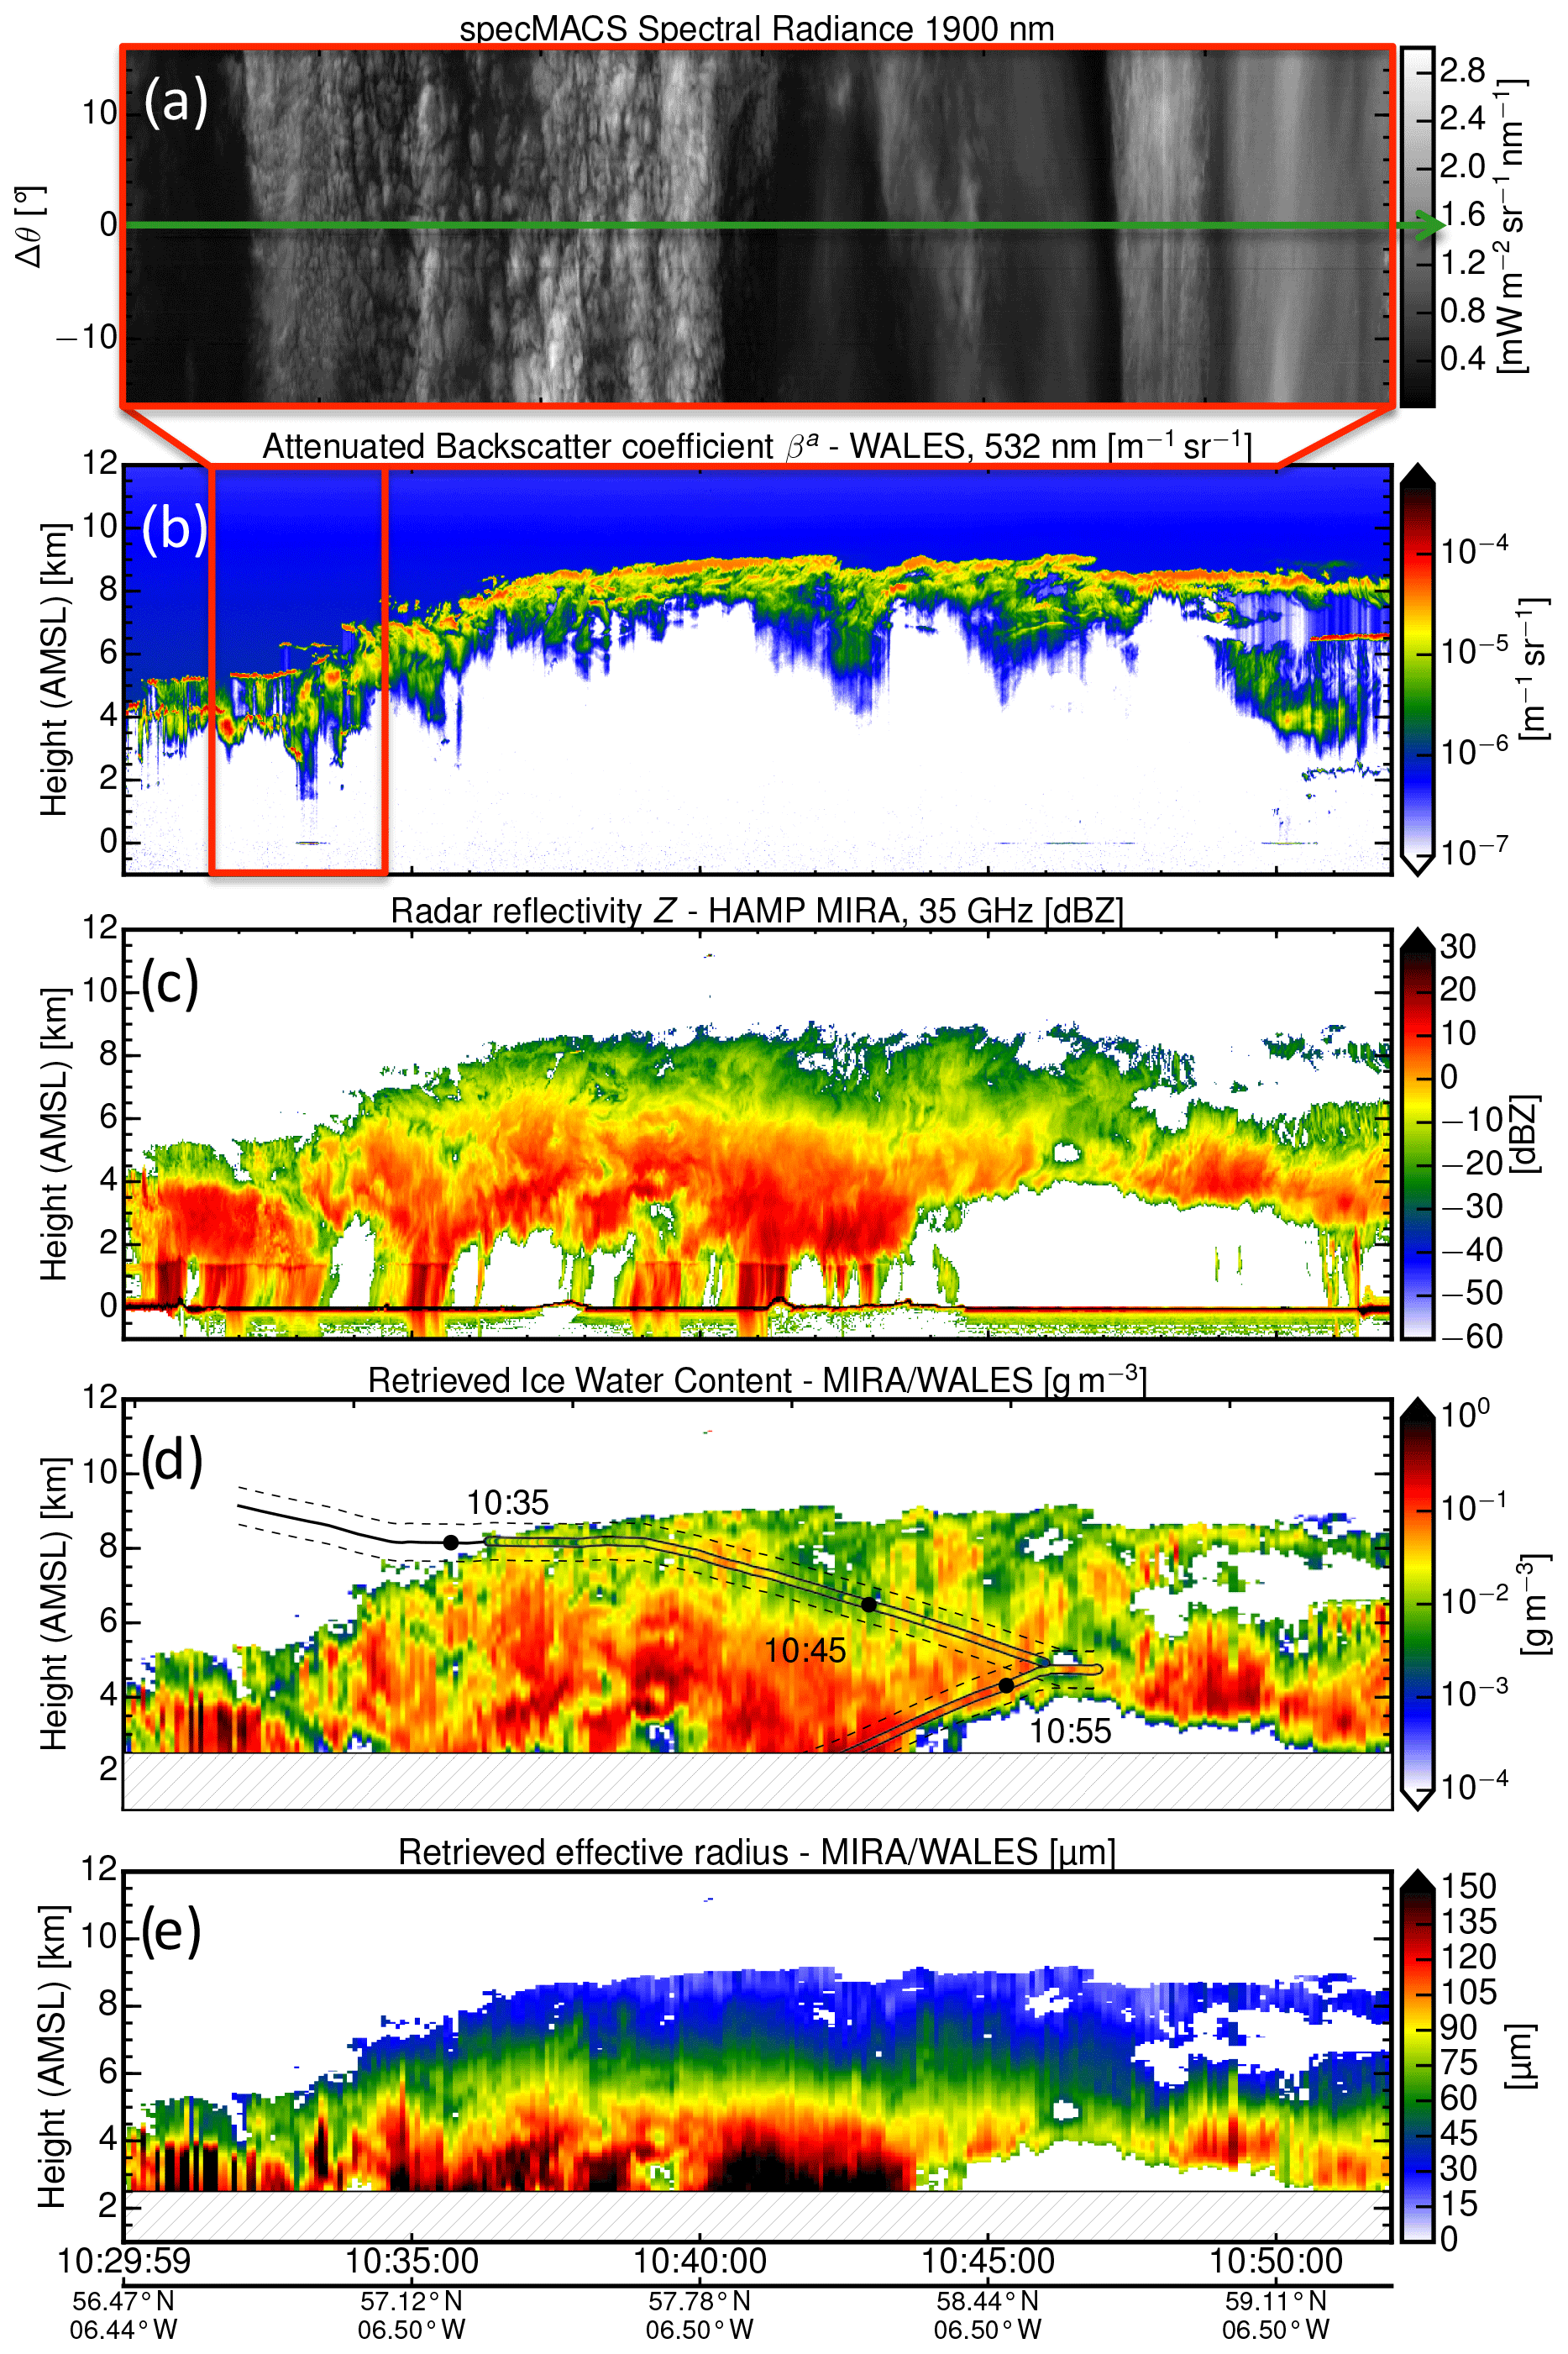
Figure 8Remote sensing of a cloud layer measured with HALO on 14 October 2016 during the NAWDEX campaign. (a) Spectral radiance at 1.9 µm acquired by specMACS along the flight path, (b) and (c) same as Fig. 7. (d) Ice water content and (e) effective radius retrieved by VarCloud. As an overlay in panel (d), in-situ-measured IWCs are plotted along the BAa-146 flight path (drawn line) with the spatial region (dashed lines) considered for the in situ comparison in Fig. 10.
3.3 Comparison with measured radiances
For both cases discussed in the previous Sect. 3.1 and 3.2, VarCloud was applied using the various microphysical assumptions described in Sect. 2.3.2: once using the default parameterization of Cazenave et al. (2019) and furthermore with the M–D and A–D relationships for the specific ice crystal habits of Yang et al. (2000). The retrieved IWC and reff were then used as input cloud fields to simulate the reflected solar radiation at 1.9 µm using optical properties corresponding to each microphysical parameterization as described in Sect. 2. Subsequently, the simulated solar radiances were compared with real measurements obtained with specMACS.
Figure 9c shows the comparison of measured and simulated solar radiances for RF06 on 1 October 2016. The relative variation in reflected radiance can be reproduced remarkably well by all microphysics tested. Over the whole scene, however, substantial biases become apparent. With their very strong forward scattering (see asymmetry parameter in Fig. 3e), plates as well as soft spheroids lead to a very strong underestimation of reflected solar radiation of −51 % and −71 %, respectively. A step closer to radiative closure can be achieved when ice crystals with less forward scattering are used. While solid columns still lead to an underestimation of reflected solar radiation (−22 %), the habit assumption with the smallest asymmetry parameter, aggregates, can reproduce the measured solar radiances remarkably well (−5 %).
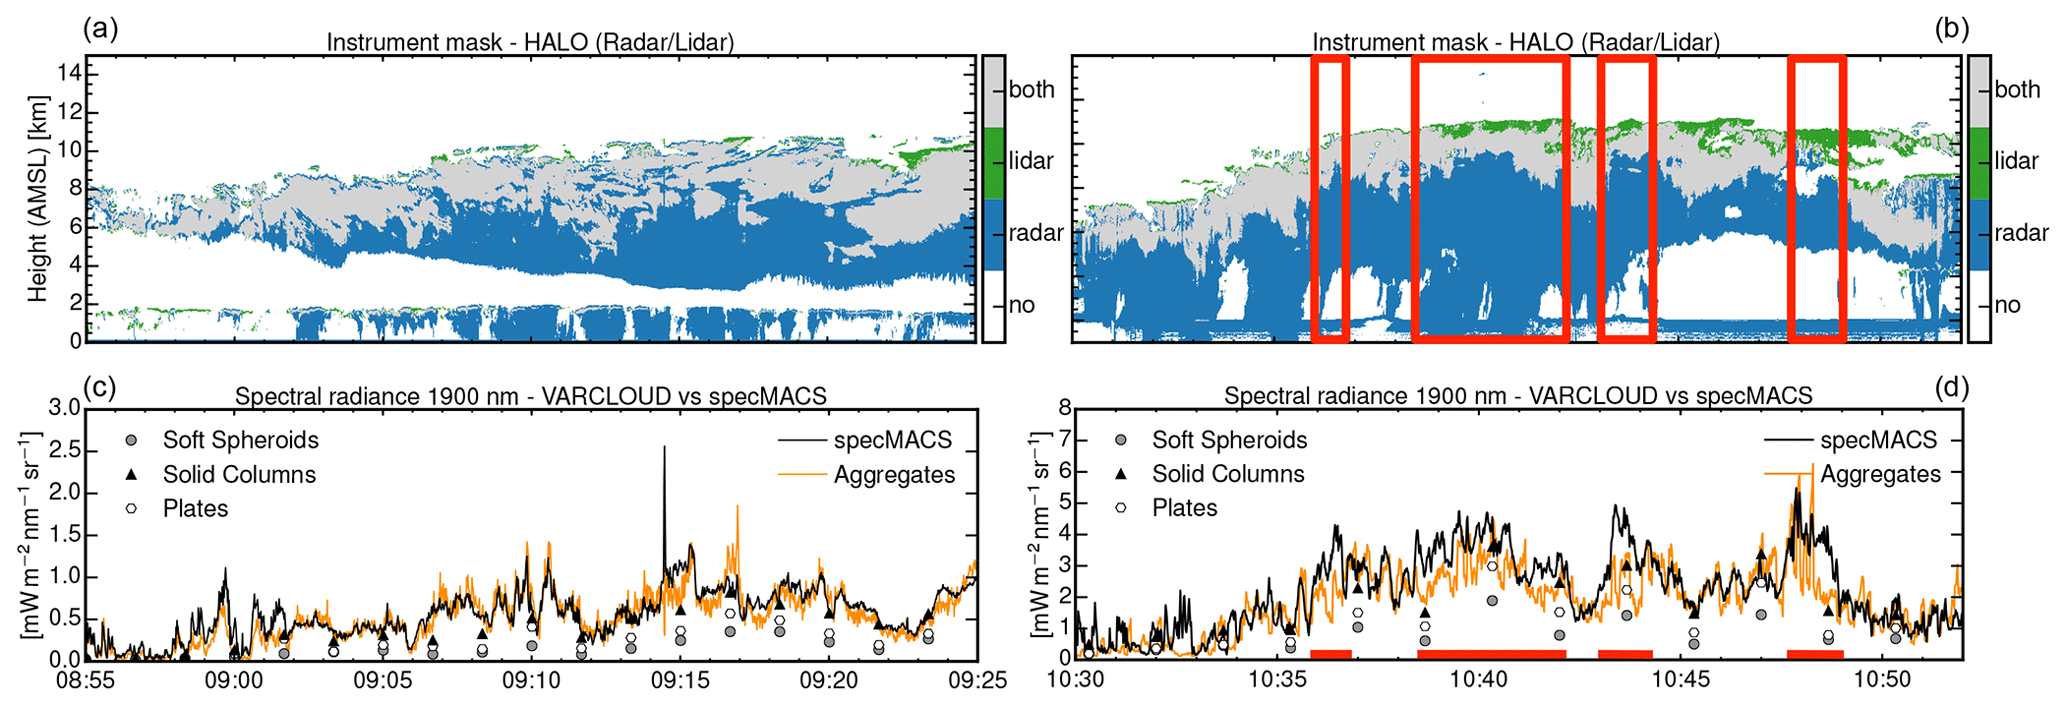
Figure 9Radiative closure study for the measurements shown in Figs. 7 and 8. (a, b) Instrument masks indicating regions with measurements from lidar only, radar only, and both instruments. The overlap region for which radar and lidar measurements are available is much larger for the first case. (c, d) Forward-modeled solar radiances (orange lines) compare well with measured solar radiances (black lines) for the case with large instrument overlap (a) but disagree for the case with a small overlap region (b) when aggregates are used. Soft spheroids (gray circles), solid columns (black triangles), and plates (white hexagons) lead to an underestimation of reflected solar radiation in both cases.
For the second case introduced in Sect. 3.2, radiative closure turned out to be harder to achieve for all the microphysical models considered. Over the whole scene, the assumption of plates or soft spheroids leads to a similarly strong underestimation of reflected solar radiation (−50 % or −69 %, respectively) like in the first case. The radiative closure for solid columns and aggregates with an underestimation of −30 % and −17 %, respectively, is now less convincing compared to the first case. While radiative closure could be achieved remarkably well for certain sections of the flight (e.g., 10:44–10:48 UTC) using aggregates, a closer inspection reveals cloud regions as being responsible for the overall underperformance. The comparison of measured and simulated radiances in Fig. 9d shows multiple regions where all used microphysics are unable to produce the higher spectral radiances measured by specMACS. This is particularly obvious during the period between 10:38–10:42, 10:43–10:44, and 10:48–10:49 UTC. Here, measured radiances are up to 2 times larger than the simulated radiances. These regions also coincide with layers of a very strong lidar backscatter at the cloud top for which the lidar signal is quickly extinguished. This leads to a reduced overlap between lidar and radar measurements with negative consequences for the exploitation of synergies.
The overlap of radar and lidar are the gray areas in the instrument masks shown in Fig. 9a for RF06 and in Fig. 9b for RF11. Here, the different vertical extent of the overlap region becomes apparent between both cases. When the overlap region is large (Fig. 9a), forward modeled solar radiances (using aggregates) compare well with measured solar radiances (Fig. 9c). In contrast, the radiative closure completely fails for cloud regions where the overlap region is small (marked by red regions in Fig. 9d). These regions are dominated by radar measurements and, in turn, have to rely heavily on assumptions of the ice crystal shape.
Collocated in situ measurements from the BAe-146 are available for the case study (shown in Fig. 8) with the partly failed radiative closure (shown in Fig. 9d). The in situ data and their processing are described Sect. 2.2.4. Figure 10 summarizes the comparison of retrieved and measured profiles of ice cloud microphysics. Between 10:35 and 11:00 UTC, the BAe-146 sampled in situ data along the same measurement curtain in a stepwise descent from 8 down to 2 km. To ensure comparability, the comparison with in situ data is only performed for VarCloud results within a spatial vicinity of ±500 m of the BAe-146 flight path. The temporal offset is limited to 15 min, with a better temporal coincidence (<5 min) for the flyover of BAe-146 by HALO between 8 and 4.5 km altitude. Figure 8d shows IWCs retrieved by VarCloud superimposed with IWCs measured along the BAe-146 flight path. Here, the spatial region considered for comparison is delimited by the dashed lines. For the following study, the in situ data were binned by temperature in steps of 5 K to obtain reliable statistics of the vertical profile. The following comparison are in-cloud statistics, where retrieval and in situ data with IWCs smaller than 10−3 g m−3 have been discarded.

Figure 10Comparison of VarCloud results derived from HALO measurements with in situ measurements on board the BAe-146 for the joint flight leg. (a) Retrieved ice water content (contour) against Nevzorov hot-wire (red boxplot) and CIP-100 (black boxplot) probe measurements. (b) Retrieved ice crystal number concentration (contour) against the composite measurement of CIP-15 and CIP-100 (gray boxplot) and CIP-100 (black boxplot) alone.
In the following, IWCs retrieved with VarCloud are validated using data from the Nevzorov hot wire as well as the CIP-100. Figure 10 (left) shows box plots of the averaged IWC profile measured by the Nevzorov hot wire (red) and the CIP-100 (black). Here, the boxes show the lower and upper quartile of measured IWCs, while the whiskers give the maximum and minimum values found (excluding outliers outside the 1.5 interquartile range). The median IWC is shown by the orange vertical lines through the boxes. The contour in the background of Fig. 10 (left) represents the retrieved IWC using the assumptions of Cazenave et al. (2019). While the overall observation of increasing IWC with increasing air temperature is reproduced well by VarCloud, biases become apparent at the cloud top and deeper within the cloud in comparison with the Nevzorov hot-wire measurements. At the cloud top, the median IWC is first sightly overestimated by VarCloud by +10 % at T=230 K but then strongly underestimated by up to −70 % at T=235 K. At around T=240 K and below, the agreement with in situ IWCs is remarkably good. Between T=240 K and T=255 K, the median of the retrieved IWC is well inside the lower and upper quantile of the in situ data with a small negative bias of up to −15 %. At even lower altitudes and with air temperatures rising to the melting point of ice, the retrieved IWC still agrees well with in situ data, with a slight overestimation of up to +20 %. Throughout the whole profile, the hot-wire data are in line with the CIP-100 probe measurements, with a slight disagreement of less than 25 % at T=245 K.
In the same manner, the retrieved and measured ice crystal number concentrations are compared in Fig. 10 (right). This comparison is done once for the composite PSDs from the CIP-15 and CIP-100 probe (gray boxplot) and once including only larger particles from the CIP-100 probe (black boxplot) to analyze the contribution of very small ice crystals to the ICNC. Here, the challenging situation just below the top of the cloud layer is even more obvious. While the retrieval gets the ICNC almost right directly at the cloud top (230 K : 280 L−1 vs. 200 L−1), it misses the extraordinarily high ICNC slightly below (235 K:130 L−1 vs. 1500 L−1). Below this region and similar to the IWC validation, VarCloud agrees remarkably well with the ICNC of the composite PSD. The very high values just below the cloud top (235 K) can be mainly explained by a high number of very small particles when comparing ICNCs from the combined CIP probes with ICNCs from the CIP-100 probe alone. The implications of the occurrence of the regions of unexpectedly high ICNCs are discussed in the next section.
In the first case study (Sect. 3.1), radiative closure could be achieved by changing the assumption of the ice crystal shape. While the standard soft spheroid approximation led to a strong underestimation of reflected solar radiation, radiative closure could be achieved when using aggregates. At wavelengths without strong absorption of light by ice, reflected solar radiation from ice clouds is mainly governed by the optical thickness and the scattering phase function of its particles (Fu and Takano, 1994). For cloud layers with the same optical thickness, ice crystal shapes with a stronger forward scattering (i.e., larger asymmetry parameter) led to lower reflected radiance at the cloud top (Eichler et al., 2009). This is in line with the first case study, where the ice crystals with a large asymmetry parameter, like plates and soft spheroids, led to a strong underestimation of reflected solar radiation.
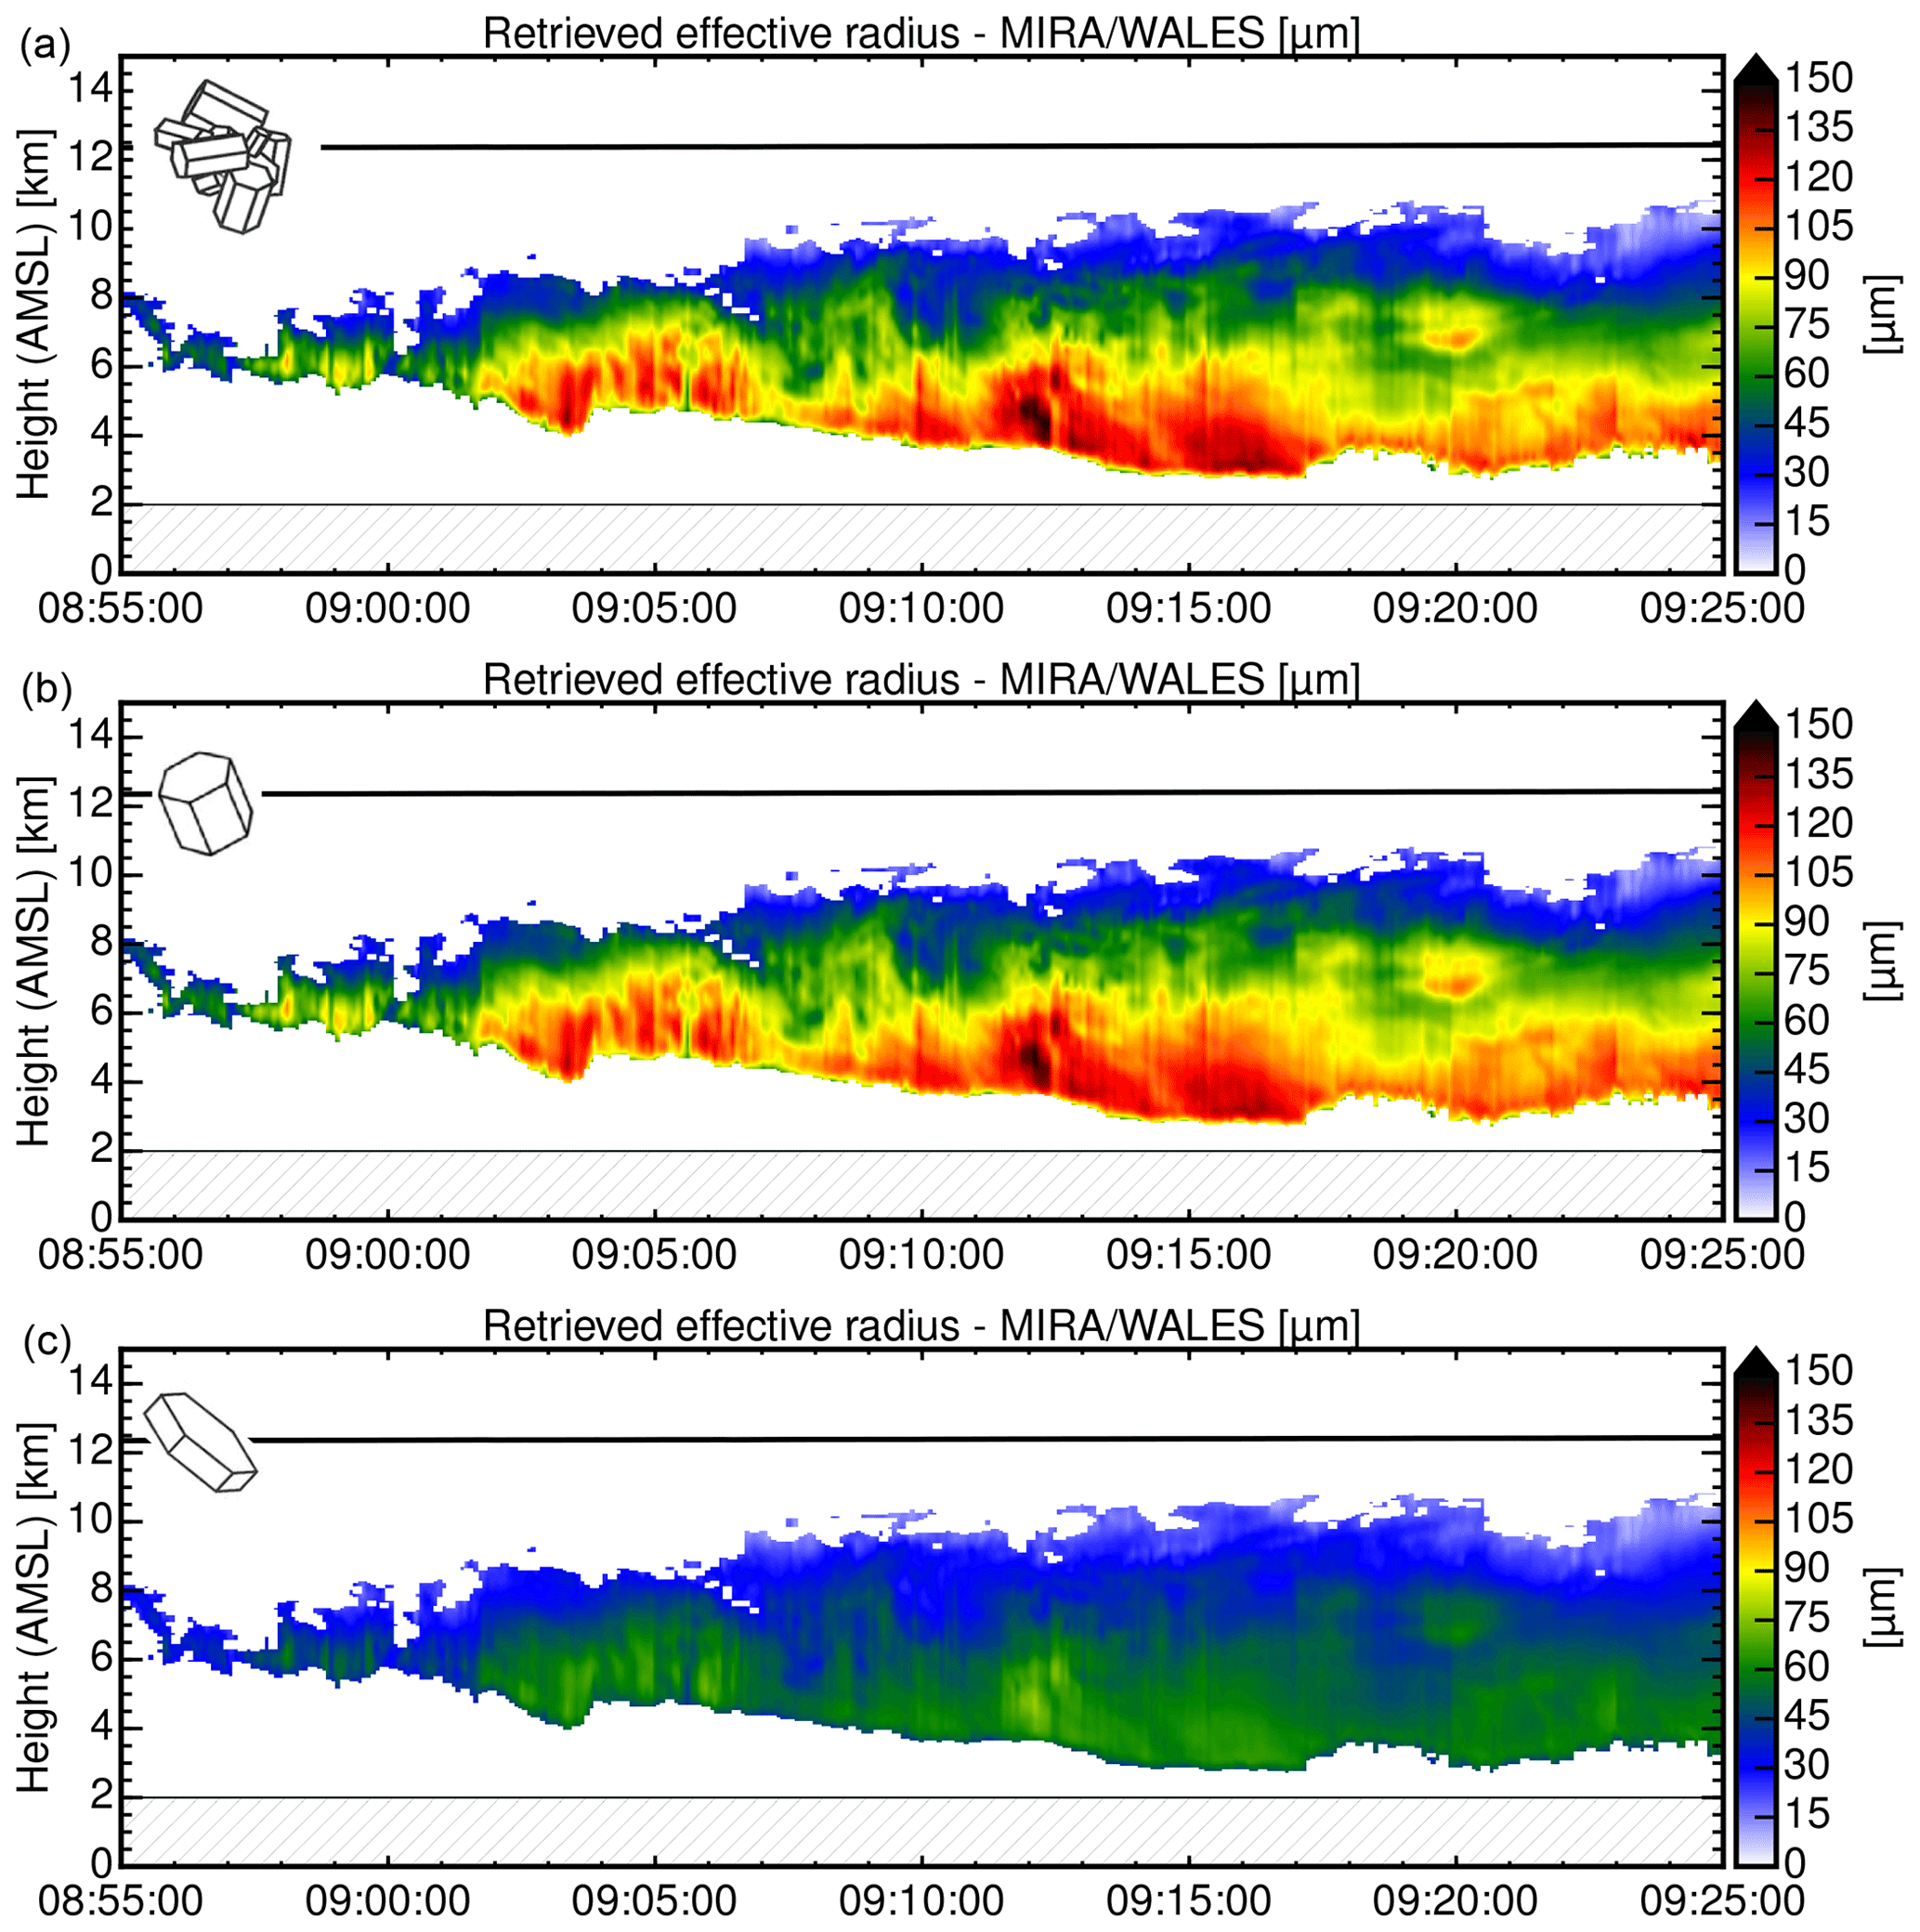
It is worth mentioning that the soft spheroid assumption led to the lowest radiances, although plates of the same effective radius have a larger asymmetry parameter (see Fig. 3e). This apparent contradiction is resolved when the intermediate VarCloud results, in particular the retrieved effective radii, are compared between the ice crystal habits (Figs. A1 and 7e). Here, VarCloud retrieves significantly smaller reff for the plates assumption. This can be explained with Fig. 3f, where the radar reflectivity Z is shown as a function of reff for an ice cloud with constant IWC=1 g m−3. For an observed value of Z, plates always have the smallest reff. If one exchanges Z with particle mass, this observation is in line with the definition of reff in Eq. (4). For the same particle mass and with reff defined as the ratio of particle mass and visible extinction, the primarily two-dimensional plates have the smallest reff since they have the largest visible extinction cross-section compared to the other habits. In turn, the soft spheroid assumption thus yields a larger reff and thus larger asymmetry parameter compared to the plate assumption (see Fig. 3e). This explains the strongest underestimation of reflected solar radiation by soft spheroids, followed by plates and the better agreement for solid columns and aggregates.
In contrast, changing the assumption of the ice crystal shape could not explain all discrepancies found between the forward-simulated and measured radiances for the second case (Sect. 3.2). This is an indication that there are further challenges beyond the ice crystal habit assumption for this cloud scene. The in situ data suggest a very high ICNC with predominately small ice crystals, which poses a problem on several levels: (1) cloud regions with high ICNC and small ice crystals are barely visible in cloud radar measurements, while the lidar signal is quickly extinguished. This has a negative consequence on the instrument overlap, which is needed to determine IWC and reff without relying too heavily on a priori profiles. (2) Delanoë et al. (2014) and Cazenave et al. (2019) included particles down to a minimum diameter of 50 µm to fit the shape of the normalized PSD shape (Fig. 3d) to in situ data corrected for ice shattering effects. However, the large spread of almost 2 orders of magnitude between the ICNC measured by the CIP-15 and CIP-100 probe is an indication that the normalized PSD can no longer capture the PSD shape of this specific cloud region at low temperatures. (3) Furthermore, there is a very distinct jump in ICNC between 240 and 235 K. However, cubic spline basis functions with a sampling distance of 240 m are used to smooth the microphysical profile of the ice crystal number concentration and to stabilize the performance of the VarCloud algorithm. The resulting oversmoothing across this discontinuity could lead to the undesired perturbation of microphysical variables, like the lidar ratio or extinction, in adjacent ice cloud layers.
This study demonstrated how passive solar radiance measurements can be used to test the well-established variational approach VarCloud and to adapt the assumed ice crystal model to be consistent with radar–lidar as well as radiance measurements. While active remote sensing is capable of providing vertical backscatter profiles, the inversion to ice cloud microphysics relies heavily on the assumption of the prevalent ice particle shape and its mass–size relationship. On the basis of two airborne-measured case studies, this paper analyzed VarCloud results for different ice crystal habit assumptions. The VarCloud results for the different habit assumptions were then used to simulate reflected solar radiances. Through radiative closure with simultaneously measured solar radiances, the performance of VarCloud could then be tested for the different habit assumptions. Besides the standard soft spheroid approximation of VarCloud, three specific ice crystal habits (solid columns, aggregates, and plates) were tested for their ability to reconcile radar, lidar, and solar radiance measurements. To ensure physical consistency this was done for the radar–lidar retrieval as well as for the forward simulations of solar radiance. To exclude the contribution of surface reflection and solar radiation reflected by low-level liquid clouds, this radiative closure study was done at λ=1.9 µm. This technique exploits the strong water vapor absorption, which ensures that mainly light reflected by cirrus and high-altitude ice clouds is contributing to the measured radiance. At this wavelength, radiative closure could be achieved in one case study by changing the ice crystal habit assumption from the soft spheroid model of Cazenave et al. (2019) (underestimation of solar radiation by −71 %) to the aggregate model of Yang et al. (2000) (underestimation of solar radiation by −5 %). In a second case study, changing the assumption of the ice crystal shape to aggregates led to an improved radiative closure, too. In contrast to the first case study, this could not explain all discrepancies found for certain cloud sections between the forward-simulated and measured radiances. Here, collocated in situ measurements revealed very high ICNCs slightly below the cloud top which strongly reduced the overlap of radar and lidar measurements.
In light of these findings, the following conclusions can be drawn:
-
In both cases and for all tested ice habit assumptions, the radar–lidar framework VarCloud found a microphysical state which could explain the radar and lidar signals within their measurement uncertainties. Similar residuals between the forward simulations and radar and lidar measurements did not allow us to discriminate the best-fitting ice crystal habit for the first case study (Sect. 3.1), nor did it indicate a problem for the second case study (Sect. 3.2).
-
This is an expected behavior of an under-determined problem with two measurements (βa and Ze) but three unknowns (IWC, reff, ice habit). Here, an additional measurement using a completely different remote sensing technique, e.g., passive remote sensing of reflected solar radiation, is an urgently needed benchmark to assess the quality of the radar–lidar result and to identify inconsistencies of the used assumptions.
-
In the case of a large radar–lidar overlap, and hence two measurements, the reflected solar radiation can help to narrow down the ice crystal shape assumption. Here, the sensitivity to the asymmetry parameter of the scatterer in the reflected solar radiation is key to obtain additional information about the ice crystal shape.
-
At first glance, passive solar radiance falls short in comparison with the rich vertical insight of radar and lidar measurements. A closer inspection reveals the unique strength of passive measurements being the product of an integral over the cloud profile: while radar and lidar signals contain only information in the exact backscatter direction of the ice crystals, reflected solar radiation is the product of a multiple-scattering process and thus sensitive to the full scattering phase function of the ice crystals.
Observations of reflected solar radiance thus complement the active profiling technique. In two case studies, this work could show how the proposed radiative closure technique can be used to test and improve the performance of a radar–lidar retrieval:
-
The closure with measured radiances can help to obtain consistent cloud properties with correct radiative properties in the solar spectrum. This is especially important for studies which are using radar–lidar retrieval results to assess the radiative effect of ice clouds.
-
Radiative closure can furthermore be used to assess the performance of the radar–lidar technique and to identify regions with unreliable retrieval results. In this study, the radiative closure technique was able to spot cloud regions with a very high ice crystal number concentration and, in turn, unreliable VarCloud results which would have been otherwise missed.
While this study demonstrated the radiative closure technique for VarCloud, further studies are now required which are beyond the scope of this paper:
-
A further study should assess the VarCloud performance on the basis of a sound statistical data set using existing measurements made during prior airborne campaigns.
-
A method should be developed to incorporate the solar radiance measurements already during the VarCloud optimal estimate. This should naturally lead to a better constraint of the ice crystal model and to a physically more consistent retrieval result.
-
Right now, VarCloud as well as this study assumes one ice crystal model (e.g., a fixed M–D relationship). Various studies found a large variability in ice clouds among clouds in different geographical regions as well as within individual clouds volumes (Comstock et al., 2007; Deng et al., 2012; Xu and Mace, 2016). To that end, a further degree of freedom (e.g., a parameter of the ice crystal model) has to be introduced which can be seamlessly changed throughout the microphysical profile.
Recent years have brought significant progress towards an integrated approach to combine multiple remote sensing instruments. In the context of the tenth anniversary of the two A-Train profilers CloudSat and CALIPSO and the upcoming launch of EarthCARE, progress is due to harmonize existing radar–lidar retrieval techniques with passive measurements. In this context, the seamless exploitation of passive solar radiances within VarCloud will be a next step towards a better understanding of ice cloud microphysics.
The data set of HAMP MIRA is available in ESSD with the identifier https://doi.org/10.5194/essd-11-921-2019 (Konow et al., 2019). Access to the data set of WALES can be requested via https://halo-db.pa.op.dlr.de (DLR, 2021). SEVIRI L1 data (HRIT) were provided by EUMETSAT via EUMETCast (https://www.eumetsat.int/eumetcast; EUMETSAT, 2021). The in situ and specMACS data are provided upon request.
FE, SG, and JD conceived the concept of this study. FE, SG, and MW performed the airborne measurements and their calibration. FE developed the presented methods and carried out the analysis. SG, JD, and BM contributed to the interpretation of the results. SF processed and provided the in situ data used in this study. FE took the lead in writing the manuscript. All authors provided feedback on the manuscript.
The authors declare that they have no conflict of interest.
Publisher’s note: Copernicus Publications remains neutral with regard to jurisdictional claims in published maps and institutional affiliations.
This work was jointly supported by the German Aerospace Center (DLR) and the German Research Foundation (DFG) through the HALO Priority Program SPP 1294, Atmospheric and Earth System Research with the Research Aircraft HALO (High Altitude and Long Range Research Aircraft). The authors would like to thank the crew and personnel involved in the NAWDEX campaign, who did a great job in coordinating the involved aircraft. The BAe-146 research aircraft is operated by Airtask and Avalon and managed by the Facility for Airborne Atmospheric Measurements (FAAM). DLR-FX and its pilots are thanked for their great support during planning of research flights. The authors thank Luca Bugliaro for his internal review of the manuscript. We thank the four anonymous reviewers for their helpful suggestions.
The article processing charges for this open-access publication were covered by the German Aerospace Center (DLR).
This paper was edited by Alexander Kokhanovsky and reviewed by four anonymous referees.
Abel, S. J., Cotton, R. J., Barrett, P. A., and Vance, A. K.: A comparison of ice water content measurement techniques on the FAAM BAe-146 aircraft, Atmos. Meas. Tech., 7, 3007–3022, https://doi.org/10.5194/amt-7-3007-2014, 2014. a
Anderson, G., Clough, S., Kneizys, F., Chetwynd, J., and Shettle, E.: AFGL Atmospheric Constituent Profiles (0–120 km), Tech. Rep., AFGL-TR-86-0110, 1986. a
Baumgardner, D., Brenguier, J. L., Bucholtz, A., Coe, H., DeMott, P., Garrett, T. J., Gayet, J. F., Hermann, M., Heymsfield, A., Korolev, A., Krämer, M., Petzold, A., Strapp, W., Pilewskie, P., Taylor, J., Twohy, C., Wendisch, M., Bachalo, W., and Chuang, P.: Airborne instruments to measure atmospheric aerosol particles, clouds and radiation: A cook's tour of mature and emerging technology, Atmos. Res., 102, 10–29, https://doi.org/10.1016/j.atmosres.2011.06.021, 2011. a
Brown, P. R. A. and Francis, P. N.: Improved Measurements of the Ice Water Content in Cirrus Using a Total-Water Probe, J. Atmos. Ocean. Tech., 12, 410–414, https://doi.org/10.1175/1520-0426(1995)012<0410:IMOTIW>2.0.CO;2, 1995. a, b
Cazenave, Q., Ceccaldi, M., Delanoë, J., Pelon, J., Groß, S., and Heymsfield, A.: Evolution of DARDAR-CLOUD ice cloud retrievals: new parameters and impacts on the retrieved microphysical properties, Atmos. Meas. Tech., 12, 2819–2835, https://doi.org/10.5194/amt-12-2819-2019, 2019. a, b, c, d, e, f, g, h, i, j, k, l, m, n, o, p
Cho, H.-M., Zhang, Z., Meyer, K., Lebsock, M., Platnick, S., Ackerman, A. S., Girolamo, L. D., C. Labonnote, L., Cornet, C., Riedi, J., and Holz, R. E.: Frequency and causes of failed MODIS cloud property retrievals for liquid phase clouds over global oceans, J. Geophys. Res.-Atmos., 120, 4132–4154, https://doi.org/10.1002/2015JD023161, 2015. a
Comstock, J. M., McFarlane, S. A., d'Entremont, R., DeSlover, D., Turner, D. D., Mace, G. G., Matrosov, S. Y., Shupe, M. D., Minnis, P., Mitchell, D., Sassen, K., and Wang, Z.: An Intercomparison of Microphysical Retrieval Algorithms for Upper-Tropospheric Ice Clouds, B. Am. Meteorol. Soc., 88, 191–204, https://doi.org/10.1175/BAMS-88-2-191, 2007. a, b
Cotton, R. J., Field, P. R., Ulanowski, Z., Kaye, P. H., Hirst, E., Greenaway, R. S., Crawford, I., Crosier, J., and Dorsey, J.: The effective density of small ice particles obtained from in situ aircraft observations of mid-latitude cirrus, Q. J. Roy. Meteor. Soc., 139, 1923–1934, https://doi.org/10.1002/qj.2058, 2013. a, b, c
Delanoë, J. and Hogan, R. J.: A variational scheme for retrieving ice cloud properties from combined radar, lidar, and infrared radiometer, J. Geophys. Res., 113, D07204, https://doi.org/10.1029/2007JD009000, 2008. a, b, c, d
Delanoë, J. and Hogan, R. J.: Combined CloudSat-CALIPSO-MODIS retrievals of the properties of ice clouds, J. Geophys. Res.-Atmos., 115, D00H29, https://doi.org/10.1029/2009JD012346, 2010. a, b
Delanoë, J., Protat, A., Testud, J., Bouniol, D., Heymsfield, A. J., Bansemer, A., Brown, P. R. A., and Forbes, R. M.: Statistical properties of the normalized ice particle size distribution, J. Geophys. Res.-Atmos., 110, D10201, https://doi.org/10.1029/2004JD005405, 2005. a
Delanoë, J. M. E., Heymsfield, A. J., Protat, A., Bansemer, A., and Hogan, R. J.: Normalized particle size distribution for remote sensing application, J. Geophys. Res.-Atmos., 119, 4204–4227, https://doi.org/10.1002/2013JD020700, 2014. a, b, c, d
Deng, M., Mace, G. G., Wang, Z., and Okamoto, H.: Tropical Composition, Cloud and Climate Coupling Experiment validation for cirrus cloud profiling retrieval using CloudSat radar and CALIPSO lidar, J. Geophys. Res.-Atmos., 115, D00J15, https://doi.org/10.1029/2009JD013104, 2010. a
Deng, M., Mace, G. G., Wang, Z., and Lawson, R. P.: Evaluation of Several A-Train Ice Cloud Retrieval Products with In Situ Measurements Collected during the SPARTICUS Campaign, J. Appl. Meteorol. Clim., 52, 1014–1030, https://doi.org/10.1175/JAMC-D-12-054.1, 2012. a, b
Donovan, D. P. and van Lammeren, A. C. A. P.: Cloud effective particle size and water content profile retrievals using combined lidar and radar observations: 1. Theory and examples, J. Geophys. Res.-Atmos., 106, 27425–27448, https://doi.org/10.1029/2001JD900243, 2001. a
Duncan, D. I. and Eriksson, P.: An update on global atmospheric ice estimates from satellite observations and reanalyses, Atmos. Chem. Phys., 18, 11205–11219, https://doi.org/10.5194/acp-18-11205-2018, 2018. a
Eichler, H., Ehrlich, A., Wendisch, M., Mioche, G., Gayet, J.-F., Wirth, M., Emde, C., and Minikin, A.: Influence of ice crystal shape on retrieval of cirrus optical thickness and effective radius: A case study, J. Geophys. Res.-Atmos., 114, D19203, https://doi.org/10.1029/2009JD012215, 2009. a, b, c
Eliasson, S., Buehler, S. A., Milz, M., Eriksson, P., and John, V. O.: Assessing observed and modelled spatial distributions of ice water path using satellite data, Atmos. Chem. Phys., 11, 375–391, https://doi.org/10.5194/acp-11-375-2011, 2011. a
Emde, C., Buras-Schnell, R., Kylling, A., Mayer, B., Gasteiger, J., Hamann, U., Kylling, J., Richter, B., Pause, C., Dowling, T., and Bugliaro, L.: The libRadtran software package for radiative transfer calculations (version 2.0.1), Geosci. Model Dev., 9, 1647–1672, https://doi.org/10.5194/gmd-9-1647-2016, 2016. a
EUMETSAT: EUMETCast, available at: https://www.eumetsat.int/eumetcast, last access: 17 July 2021. a
Ewald, F., Bugliaro, L., Mannstein, H., and Mayer, B.: An improved cirrus detection algorithm MeCiDA2 for SEVIRI and its evaluation with MODIS, Atmos. Meas. Tech., 6, 309–322, https://doi.org/10.5194/amt-6-309-2013, 2013. a
Ewald, F., Kölling, T., Baumgartner, A., Zinner, T., and Mayer, B.: Design and characterization of specMACS, a multipurpose hyperspectral cloud and sky imager, Atmos. Meas. Tech., 9, 2015–2042, https://doi.org/10.5194/amt-9-2015-2016, 2016. a, b, c
Ewald, F., Groß, S., Hagen, M., Hirsch, L., Delanoë, J., and Bauer-Pfundstein, M.: Calibration of a 35 GHz airborne cloud radar: lessons learned and intercomparisons with 94 GHz cloud radars, Atmos. Meas. Tech., 12, 1815–1839, https://doi.org/10.5194/amt-12-1815-2019, 2019a. a
Ewald, F., Zinner, T., Kölling, T., and Mayer, B.: Remote sensing of cloud droplet radius profiles using solar reflectance from cloud sides – Part 1: Retrieval development and characterization, Atmos. Meas. Tech., 12, 1183–1206, https://doi.org/10.5194/amt-12-1183-2019, 2019b. a
Foot, J. S.: Some observations of the optical properties of clouds. II: Cirrus, Q. J. Roy. Meteor. Soc., 114, 145–164, https://doi.org/10.1002/qj.49711447908, 1988. a
Fu, Q. and Takano, Y.: On the limitation of using asymmetry factor for radiative transfer involving cirrus clouds, Atmos. Res., 34, 299–308, https://doi.org/10.1016/0169-8095(94)90098-1, 1994. a
Gao, B.-C. and Kaufman, Y. J.: Selection of the 1.375 µm MODIS Channel for Remote Sensing of Cirrus Clouds and Stratospheric Aerosols from Space, J. Atmos. Sci., 52, 4231–4237, https://doi.org/10.1175/1520-0469(1995)052<4231:SOTMCF>2.0.CO;2, 1994. a
Gao, B.-C., Goetz, A. F. H., and Wiscombe, W. J.: Cirrus cloud detection from Airborne Imaging Spectrometer data using the 1.38 µm water vapor band, Geophys. Res. Lett., 20, 301–304, https://doi.org/10.1029/93GL00106, 1993. a
Gasteiger, J., Emde, C., Mayer, B., Buras, R., Buehler, S. A., and Lemke, O.: Representative wavelengths absorption parameterization applied to satellite channels and spectral bands, J. Quant. Spectrosc. Ra., 148, 99–115, https://doi.org/10.1016/j.jqsrt.2014.06.024, 2014. a
German Aerospace Center (DLR): HALO database, available at: https://halo-db.pa.op.dlr.de, last access: 17 July 2021. a
Groß, S., Wirth, M., Schäfler, A., Fix, A., Kaufmann, S., and Voigt, C.: Potential of airborne lidar measurements for cirrus cloud studies, Atmos. Meas. Tech., 7, 2745–2755, https://doi.org/10.5194/amt-7-2745-2014, 2014. a
Ham, S.-H., Kato, S., and Rose, F. G.: Examining impacts of mass-diameter (m-D) and area-diameter (A-D) relationships of ice particles on retrievals of effective radius and ice water content from radar and lidar measurements, J. Geophys. Res.-Atmos., 122, 2016JD025 672, https://doi.org/10.1002/2016JD025672, 2017. a, b
Han, Q., Rossow, W., and Lacis, A.: Near-global survey of effective droplet radii in liquid water clouds using ISCCP data, J. Climate, 7, 465–497, https://doi.org/10.1175/1520-0442(1994)007<0465:NGSOED>2.0.CO;2, 1994. a
Heymsfield, A. J., Schmitt, C., Bansemer, A., and Twohy, C. H.: Improved Representation of Ice Particle Masses Based on Observations in Natural Clouds, J. Atmos. Sci., 67, 3303–3318, https://doi.org/10.1175/2010JAS3507.1, 2010. a
Heymsfield, A. J., Schmitt, C., and Bansemer, A.: Ice Cloud Particle Size Distributions and Pressure-Dependent Terminal Velocities from In Situ Observations at Temperatures from 0∘ to −86 ∘C, J. Atmos. Sci., 70, 4123–4154, https://doi.org/10.1175/JAS-D-12-0124.1, 2013. a
Hogan, R. J.: Fast Lidar and Radar Multiple-Scattering Models. Part I: Small-Angle Scattering Using the Photon Variance–Covariance Method, J. Atmos. Sci., 65, 3621–3635, https://doi.org/10.1175/2008JAS2642.1, 2008. a
Hogan, R. J., Tian, L., Brown, P. R. A., Westbrook, C. D., Heymsfield, A. J., and Eastment, J. D.: Radar Scattering from Ice Aggregates Using the Horizontally Aligned Oblate Spheroid Approximation, J. Appl. Meteorol. Clim., 51, 655–671, https://doi.org/10.1175/JAMC-D-11-074.1, 2012. a
Holz, R. E., Platnick, S., Meyer, K., Vaughan, M., Heidinger, A., Yang, P., Wind, G., Dutcher, S., Ackerman, S., Amarasinghe, N., Nagle, F., and Wang, C.: Resolving ice cloud optical thickness biases between CALIOP and MODIS using infrared retrievals, Atmos. Chem. Phys., 16, 5075–5090, https://doi.org/10.5194/acp-16-5075-2016, 2016. a
Hong, Y., Liu, G., and Li, J.-L. F.: Assessing the Radiative Effects of Global Ice Clouds Based on CloudSat and CALIPSO Measurements, J. Climate, 29, 7651–7674, https://doi.org/10.1175/JCLI-D-15-0799.1, 2016. a, b, c
Illingworth, A. J., Hogan, R. J., van Lammeren, A. C. A. P., Donovan, D. P., Berger, F. H., Halecker, T., Liu, C.-L., Feijt, A., and Bloemink, H. I.: Quantification of the synergy aspects of the Earth Radiation Mission (Final report), Tech. rep., ESTEC Contract 13167/98/NL/GD, 2000. a
Illingworth, A. J., Barker, H. W., Beljaars, A., Ceccaldi, M., Chepfer, H., Clerbaux, N., Cole, J., Delanoë, J., Domenech, C., Donovan, D. P., Fukuda, S., Hirakata, M., Hogan, R. J., Huenerbein, A., Kollias, P., Kubota, T., Nakajima, T., Nakajima, T. Y., Nishizawa, T., Ohno, Y., Okamoto, H., Oki, R., Sato, K., Satoh, M., Shephard, M. W., Velázquez-Blázquez, A., Wandinger, U., Wehr, T., and van Zadelhoff, G.-J.: The EarthCARE Satellite: The Next Step Forward in Global Measurements of Clouds, Aerosols, Precipitation, and Radiation, B. Am. Meteorol. Soc., 96, 1311–1332, https://doi.org/10.1175/BAMS-D-12-00227.1, 2015. a, b
Intrieri, J. M., Stephens, G. L., Eberhard, W. L., and Uttal, T.: A Method for Determining Cirrus Cloud Particle Sizes Using Lidar and Radar Backscatter Technique, J. Appl. Meteorol., 32, 1074–1082, https://doi.org/10.1175/1520-0450(1993)032<1074:AMFDCC>2.0.CO;2, 1993. a, b
IPCC: Climate Change 2013: The Physical Science Basis. Contribution of Working Group I to the Fifth Assessment Report of the Intergovernmental Panel on Climate Change, edited by: Stocker, T. F., Qin, D., Plattner, G.-K., Tignor, M., Allen, S. K., Boschung, J., Nauels, A., Xia, Y., Bex, V., and Midgley, P. M., Cambridge University Press, Cambridge, United Kingdom and New York, NY, USA, 1535 pp., https://doi.org/10.1017/CBO9781107415324, 2013. a
Khatri, P., Iwabuchi, H., and Saito, M.: Vertical Profiles of Ice Cloud Microphysical Properties and Their Impacts on Cloud Retrieval Using Thermal Infrared Measurements, J. Geophys. Res.-Atmos., 123, 5301–5319, https://doi.org/10.1029/2017JD028165, 2018. a
Konow, H., Jacob, M., Ament, F., Crewell, S., Ewald, F., Hagen, M., Hirsch, L., Jansen, F., Mech, M., and Stevens, B.: A unified data set of airborne cloud remote sensing using the HALO Microwave Package (HAMP), Earth Syst. Sci. Data, 11, 921–934, https://doi.org/10.5194/essd-11-921-2019, 2019. a
Korolev, A., Strapp, J. W., Isaac, G. A., and Emery, E.: Improved Airborne Hot-Wire Measurements of Ice Water Content in Clouds, J. Atmos. Ocean. Tech., 30, 2121–2131, https://doi.org/10.1175/JTECH-D-13-00007.1, 2013. a
Korolev, A. V., Emery, E. F., Strapp, J. W., Cober, S. G., Isaac, G. A., Wasey, M., and Marcotte, D.: Small Ice Particles in Tropospheric Clouds: Fact or Artifact? Airborne Icing Instrumentation Evaluation Experiment, B. Am. Meteorol. Soc., 92, 967–973, https://doi.org/10.1175/2010BAMS3141.1, 2011. a
Krautstrunk, M. and Giez, A.: The Transition From FALCON to HALO Era Airborne Atmospheric Research, in: Atmospheric Physics. Research Topics in Aerospace, edited by: Schumann, U., Springer Berlin Heidelberg, https://doi.org/10.1007/978-3-642-30183-4_37, pp. 609–624, 2012. a
Liou, K.-N.: Influence of cirrus clouds on weather and climate processes: A global perspective, Mon. Weather Rev., 114, 1167–1199, https://doi.org/10.1175/1520-0493(1986)114<1167:IOCCOW>2.0.CO;2, 1986. a
Mace, G. and Benson, S.: Diagnosing Cloud Microphysical Process Information from Remote Sensing Measurements – A Feasibility Study Using Aircraft Data. Part I: Tropical Anvils Measured during TC4, J. Appl. Meteorol. Clim., 56, 633–649, https://doi.org/10.1175/JAMC-D-16-0083.1, 2017. a
Maddison, J. W., Gray, S. L., Martínez-Alvarado, O., and Williams, K. D.: Upstream Cyclone Influence on the Predictability of Block Onsets over the Euro-Atlantic Region, Mon. Weather Rev., 147, 1277–1296, https://doi.org/10.1175/MWR-D-18-0226.1, 2019. a
Marshak, A., Platnick, S., Varnai, T., Wen, G., and Cahalan, R. F.: Impact of three-dimensional radiative effects on satellite retrievals of cloud droplet sizes, J. Geophys. Res., 111, D09207, https://doi.org/10.1029/2005JD006686, 2006. a
Maxwell Garnett, J. C.: Colours in metal glasses and in metallic films, Philos. T. R. Soc., 203, 385–420, https://doi.org/10.1098/rsta.1904.0024, 1904. a
Mayer, B.: Radiative transfer in the cloudy atmosphere, Eur. Physical J. Conf., 1, 75–99, https://doi.org/10.1140/epjconf/e2009-00912-1, 2009. a
Mayer, B. and Kylling, A.: Technical note: The libRadtran software package for radiative transfer calculations - description and examples of use, Atmos. Chem. Phys., 5, 1855–1877, https://doi.org/10.5194/acp-5-1855-2005, 2005. a
Meyer, K. and Platnick, S.: Utilizing the MODIS 1.38 µm channel for cirrus cloud optical thickness retrievals: Algorithm and retrieval uncertainties, J. Geophys. Res.-Atmos., 115, D24209, https://doi.org/10.1029/2010JD014872, 2010. a
Mishchenko, M., Videen, G., Babenko, V., Khlebtsov, N., and Wriedt, T.: T-matrix theory of electromagnetic scattering by particles and its applications: a comprehensive reference database, J. Quant. Spectrosc. Ra., 88, 357–406, https://doi.org/10.1016/j.jqsrt.2004.05.002, 2004. a
Mitchell, D., Chai, S., Liu, Y., Heymsfield, A., and Dong, X.: Modeling cirrus clouds. Part I: Treatment of bimodal size spectra and case study analysis, J. Atmos. Sci., 53, 2952–2966, https://doi.org/10.1175/1520-0469(1996)053<2952:MCCPIT>2.0.CO;2, 1996. a
Mitrescu, C., Haynes, J. M., Stephens, G. L., Miller, S. D., Heymsfield, G. M., and McGill, M. J.: Cirrus cloud optical, microphysical, and radiative properties observed during the CRYSTAL-FACE experiment: A lidar-radar retrieval system, J. Geophys. Res.-Atmos., 110, D09208, https://doi.org/10.1029/2004JD005605, 2005. a
Nakajima, T. Y. and King, M. D.: Determination of the optical thickness and effective particle radius of clouds from reflected solar radiation measurements. Part I: Theory, J. Atmos. Sci, 47, 1878–1893, https://doi.org/10.1175/1520-0469(1990)047<1878:DOTOTA>2.0.CO;2, 1990. a
Petty, G. W. and Huang, W.: Microwave Backscatter and Extinction by Soft Ice Spheres and Complex Snow Aggregates, J. Atmos. Sci., 67, 769–787, https://doi.org/10.1175/2009JAS3146.1, 2010. a
Platnick, S., King, M., Ackermann, A., Menzel, W., Baum, B., Riedi, J., and Frey, R.: The MODIS cloud products: Algorithms and examples from TERRA, IEEE T. Geosci. Remote, 41, 459–473, https://doi.org/10.1109/TGRS.2002.808301, 2003. a
Rossow, W., Garder, L., and Lacis, A.: Global, seasonal cloud variations from satellite radiance measurements, Part I: Sensitivity analysis, J. Climate, 2, 419–458, https://doi.org/10.1175/1520-0442(1989)002<0419:GSCVFS>2.0.CO;2, 1989. a
Rothman, L. S., Jacquemart, D., Barbe, A., Benner, D. C., Birk, M., Brown, L. R., Carleer, M. R., Chackerian Jr., C., Chance, K., Coudert, L. H., Dana, V., Devi, V. M., Flaud, J., Gamache, R. R., Goldman, A., Hartmann, J., Jucks, K. W., Maki, A. G., Mandin, J., Massie, S. T., Orphal, J., Perrin, A., Rinsland, C. P., Smith, M. A. H., Tennyson, J., Tolchenov, R. N., Toth, R. A., Vander Auwera, J., Varanasi, P., and Wagner, G.: The HITRAN 2004 molecular spectroscopic database, J. Quant. Spectrosc. Ra., 96, 139–204, https://doi.org/10.1016/j.jqsrt.2004.10.008, 2005. a
Schäfler, A., Craig, G., Wernli, H., Arbogast, P., Doyle, J. D., McTaggart-Cowan, R., Methven, J., Rivière, G., Ament, F., Boettcher, M., Bramberger, M., Cazenave, Q., Cotton, R., Crewell, S., Delanoë, J., Dörnbrack, A., Ehrlich, A., Ewald, F., Fix, A., Grams, C. M., Gray, S. L., Grob, H., Groß, S., Hagen, M., Harvey, B., Hirsch, L., Jacob, M., Kölling, T., Konow, H., Lemmerz, C., Lux, O., Magnusson, L., Mayer, B., Mech, M., Moore, R., Pelon, J., Quinting, J., Rahm, S., Rapp, M., Rautenhaus, M., Reitebuch, O., Reynolds, C. A., Sodemann, H., Spengler, T., Vaughan, G., Wendisch, M., Wirth, M., Witschas, B., Wolf, K., and Zinner, T.: The North Atlantic Waveguide and Downstream Impact Experiment, B. Am. Meteorol. Soc., 99, 1607–1637, https://doi.org/10.1175/BAMS-D-17-0003.1, 2018. a, b
Sourdeval, O., Gryspeerdt, E., Krämer, M., Goren, T., Delanoë, J., Afchine, A., Hemmer, F., and Quaas, J.: Ice crystal number concentration estimates from lidar–radar satellite remote sensing – Part 1: Method and evaluation, Atmos. Chem. Phys., 18, 14327–14350, https://doi.org/10.5194/acp-18-14327-2018, 2018. a, b
Stamnes, K., Tsay, S., Wiscombe, W., and Jayaweera, K.: A numerically stable algorithm for discrete-ordinate-method radiative transfer in multiple scattering and emitting layered media, Appl. Optics, 27, 2502–2509, https://doi.org/10.1364/AO.27.002502, 1988. a
Stein, T. H. M., Delanoë, J., and Hogan, R. J.: A Comparison among Four Different Retrieval Methods for Ice-Cloud Properties Using Data from CloudSat, CALIPSO, and MODIS, J. Appl. Meteorol. Clim., 50, 1952–1969, https://doi.org/10.1175/2011JAMC2646.1, 2011. a, b
Stephens, G., Vane, D., Boain, R., Mace, G., Sassen, K., Wang, Z., Illingworth, A., O'Connor, E., Rossow, W., Durden, S., Miller, S., Austin, R., Benedetti, A., Mitrescu, C., and the CloudSat Science Team: The CloudSat mission and the A-train, B. Am. Meterol. Soc., 83, 1771–1790, https://doi.org/10.1175/BAMS-83-12-1771, 2002. a
Tinel, C., Testud, J., Pelon, J., Hogan, R., Protat, A., Delanoe, J., and Bouniol, D.: The retrieval of ice-cloud properties from cloud radar and lidar synergy, J. Appl. Meteorol., 44, 860–875, https://doi.org/10.1175/JAM2229.1, 2005. a, b
Winker, D. M., Pelon, J., Coakley, J. A., Ackerman, S. A., Charlson, R. J., Colarco, P. R., Flamant, P., Fu, Q., Hoff, R. M., Kittaka, C., Kubar, T. L., Le Treut, H., Mccormick, M. P., Mégie, G., Poole, L., Powell, K., Trepte, C., Vaughan, M. A., and Wielicki, B. A.: The CALIPSO Mission, B. Am. Meteorol. Soc., 91, 1211–1230, https://doi.org/10.1175/2010BAMS3009.1, 2010. a
Wirth, M., Fix, A., Mahnke, P., Schwarzer, H., Schrandt, F., and Ehret, G.: The airborne multi-wavelength water vapor differential absorption lidar WALES: system design and performance, Applied Physics B, 96, 201–213, https://doi.org/10.1007/s00340-009-3365-7, 2009. a
Xu, Z. and Mace, G. G.: Ice Particle Mass–Dimensional Relationship Retrieval and Uncertainty Evaluation Using the Optimal Estimation Methodology Applied to the MACPEX Data, J. Appl. Meteorol. Clim., 56, 767–788, https://doi.org/10.1175/JAMC-D-16-0222.1, 2016. a, b
Yang, P., Liou, K., Wyser, K., and Mitchell, D.: Parameterization of the scattering and absorption properties of individual ice crystals, J. Geophys. Res., 105, 4699–4718, https://doi.org/10.1029/1999JD900755, 2000. a, b, c, d, e, f
Yang, P., Bi, L., Baum, B. A., Liou, K.-N., Kattawar, G. W., Mishchenko, M. I., and Cole, B.: Spectrally Consistent Scattering, Absorption, and Polarization Properties of Atmospheric Ice Crystals at Wavelengths from 0.2 to 100 µm, J. Atmos. Sci., 70, 330–347, https://doi.org/10.1175/JAS-D-12-039.1, 2013. a, b
Zhao, C., Xie, S., Klein, S. A., Protat, A., Shupe, M. D., McFarlane, S. A., Comstock, J. M., Delanoë, J., Deng, M., Dunn, M., Hogan, R. J., Huang, D., Jensen, M. P., Mace, G. G., McCoy, R., O'Connor, E. J., Turner, D. D., and Wang, Z.: Toward understanding of differences in current cloud retrievals of ARM ground-based measurements, J. Geophys. Res.-Atmos., 117, D10206, https://doi.org/10.1029/2011JD016792, 2012. a
Zhao, T.-P., Stowe, L., Smirnov, A., Crosby, D., Sapper, J., and McClain, C.: Development of a global validation package for satellite oceanic aerosol optical thickness retrieval based on AERONET observations and its application to NOAA/NESDIS operational aerosol retrievals, J. Atmos. Sci., 59, 294–312, https://doi.org/10.1175/1520-0469(2002)059<0294:DOAGVP>2.0.CO;2, 2002. a
Zinner, T. and Mayer, B.: Remote sensing of stratocumulus clouds: Uncertainties and biases due to inhomogeneity, J. Geophys. Res., 111, D14209, https://doi.org/10.1029/2005JD006955, 2006. a
Zinner, T., Hausmann, P., Ewald, F., Bugliaro, L., Emde, C., and Mayer, B.: Ground-based imaging remote sensing of ice clouds: uncertainties caused by sensor, method and atmosphere, Atmos. Meas. Tech., 9, 4615–4632, https://doi.org/10.5194/amt-9-4615-2016, 2016. a
Zinner, T., Schwarz, U., Kölling, T., Ewald, F., Jäkel, E., Mayer, B., and Wendisch, M.: Cloud geometry from oxygen-A-band observations through an aircraft side window, Atmos. Meas. Tech., 12, 1167–1181, https://doi.org/10.5194/amt-12-1167-2019, 2019. a
- Abstract
- Introduction
- Methods
- Solar radiance closure study
- Comparison of in situ and remote sensing observation
- Discussion
- Conclusions
- Appendix A: Influence of ice crystal habit on reff.
- Data availability
- Author contributions
- Competing interests
- Disclaimer
- Acknowledgements
- Financial support
- Review statement
- References