the Creative Commons Attribution 4.0 License.
the Creative Commons Attribution 4.0 License.
 | 30 Jul 2021
Species correlation measurements in turbulent flare plumes: considerations for field measurements
Scott P. Seymour
Matthew R. Johnson
Field measurement of flare emissions in turbulent flare plumes is an important and complex challenge. Incomplete combustion from these processes results in emissions of black carbon, unburnt fuels (methane), CO2, and other pollutants. Many field measurement approaches necessarily assume that combustion species are spatially and/or temporally correlated in the plume, such that simple species ratios can be used to close a carbon balance to calculate species emission factors and flare conversion efficiency. This study examines the veracity of this assumption and the associated implications for measurement uncertainty. A novel tunable diode laser absorption spectroscopy (TDLAS) system is used to measure the correlation between H2O and black carbon (BC) volume fractions in the plumes of a vertical, turbulent, non-premixed, buoyancy-driven lab-scale gas flare. Experiments reveal that instantaneous, path-averaged concentrations of BC and H2O can vary independently and are not necessarily well correlated over short time intervals. The scatter in the ratio along a path through the plume was well beyond that which could be attributed to measurement uncertainty and was asymmetrically distributed about the mean. Consistent with previous field observations, this positive skewness toward higher ratios implies short, localized, and infrequent bursts of high BC production that are not well correlated with H2O. This demonstrates that the common assumption of fixed species ratios is not universally valid, and measurements based on limited samples, short sampling times, and/or limited spatial coverage of the plume could be subject to potentially large added uncertainty. For BC emission measurements, the positive skewness of the ratio also suggests that results from small numbers of samples are more likely to be biased low. However, a bootstrap analysis of the results shows how these issues can be avoided with sufficient sample size and provides initial guidance for creating sampling protocols for future field measurements using analogous path-averaged techniques.
- Article
(5132 KB) - Full-text XML
- BibTeX
- EndNote


Flaring in the upstream oil and gas industry is a process used to destroy unwanted combustible gas, typically in buoyancy-driven, turbulent diffusion flames atop vertical stacks or in refractory-lined pits that are open to atmosphere. In 2019, global gas flaring volumes were estimated to be 150 billion m3, an increase of 3 % from 2018, reaching levels not seen since 2009 (World Bank, 2020). Flaring is preferable to venting since the 20-100-year global warming potential (GWP) of methane, a common constituent of flare gas, is times higher than the CO2 produced by flaring (Gasser et al., 2017). However, flaring can also produce unwanted pollutants such as soot (primarily black carbon, which has its own important climate impacts), CO, oxides of nitrogen (NOx), volatile organic compounds (VOCs), and uncombusted flare gases.
Of the pollutants produced by gas flaring, black carbon (BC; the carbonaceous, strongly light-absorbing component of particulate matter) and methane are both short-lived climate pollutants (SLCP) that, along with CO2, constitute the three most climate warming pollutants in the atmosphere (e.g. Bond et al., 2013; IPCC, 2013; Jacobson, 2010; Ramanathan and Carmichael, 2008). Atmospheric BC directly warms the atmosphere, as it is a strong absorber of both in- and out-going radiation at all wavelengths (U.S. EPA, 2012). BC that is deposited onto Arctic snow and ice has the additional effect of decreasing surface albedo (i.e. reflectance) and accelerating ice melting (Flanner, 2013; Sand et al., 2016). Black carbon has a relatively short atmospheric lifetime (typically between 4–12 d, e.g. Cape et al., 2012) and represents a unique mitigation opportunity to obtain near-term climatic benefits.
Field measurements of black carbon and other pollutant emissions from gas flaring in the upstream oil and gas industry are limited. The lack of direct measurements is due to the difficulties in quantifying emissions in a turbulent, inhomogeneous, and unconfined plume that freely entrains air as it evolves downstream. Field measurements generally fall into two categories, i.e. intrusive (extractive) or non-intrusive (remote) sampling. Both measurement types tend to characterize flare performance in broad terms such as pollutant emission factors (EFs), carbon conversion efficiency (CCE), also referred to as “combustion efficiency” (CE), or destruction removal efficiency (DRE). Uncertainties in global pollutant emission inventories stemming from uncertainties in the few available flare measurements can have significant impacts on climate modelling studies (Klimont et al., 2017; Winiger et al., 2019).
Extractive sampling techniques use an aspirated sampling system to pull gas samples into an instrument suite capable of measuring the constituent species (sometimes simply CO2, black carbon, and methane). The relative species concentrations are then used to close a molar- or mass-balance of carbon to determine the desired flare performance metrics (e.g. Gvakharia et al., 2017; Herndon et al., 2012; Pohl et al., 1986; Strosher, 2000; Weyant et al., 2016). Non-intrusive techniques typically employ Fourier transform infrared spectroscopy (FTIR, both active and passive) to measure column concentrations of each species along a line-of-sight (LOS) through the plume (e.g. Blackwood, 2000; Wormhoudt et al., 2012). The relative column concentrations of combustion species are similarly used to close a carbon balance. Critically, these techniques all rely on the assumption that the species in these measurements are well-mixed, and therefore well-correlated, in the plume, or that sufficient measurements have been acquired to minimize the added bias and uncertainty from this assumption. Assessing the veracity of this assumption is vital for designing robust sampling strategies to obtain representative flare performance metrics. If, for example, concentrations of carbon species are weakly or perhaps inversely correlated in time and/or space (i.e. a ratio of these species is not constant) within the turbulent plume, then a limited set of measurements using the above approaches would be prone to error. Although it is possible that local variations in combustion efficiency or pollutant emission may be averaged out in some of the available field measurement techniques, the number of required measurements is uncertain, and to date no study has attempted to directly inspect this potential issue.
To the authors' knowledge, this paper presents the first investigation of the instantaneous correlation of combustion product species in turbulent flare plumes. A unique measurement system was designed to measure instantaneous, path-averaged species correlations of black carbon and H2O concentrations in vertical flare plumes to understand if variations in relative species concentrations, and therefore variations in species ratios, are present. The results of these experiments provide insight into how these variations could affect field measurement techniques that assume constant combustion species ratios (i.e. well-correlated species). Further data analysis highlights potential implications for current field measurement approaches that should be considered when designing future measurement campaigns.
2.1 Carleton University Flare Facility (CUFF)
Experiments were conducted at the Carleton University Flare Facility (CUFF) (Fig. 1), which has been previously discussed in Conrad and Johnson (2019). Experiments considered two main flare gas compositions, summarized in Table 1, characteristic of flaring in the Bakken oil region of North Dakota (Brandt et al., 2016) and in Ecuador (Conrad and Johnson, 2017), as well as reference cases of pure methane and hydrogen. These compositions were selected to consider different higher heating values, which has been shown to have a direct relationship with sooting propensity (Conrad and Johnson, 2017; McEwen and Johnson, 2012). The custom combinations of C1–C4 alkanes, C2 and C3 alkenes, CO2, and N2 from pressurized gas cylinders and evaporated C5–C7 alkanes from a controlled evaporative mixer (CEM) were combined and sent to a vertical flare nozzle to be combusted. The gas and liquid constituents were metered using thermal mass flow controllers and Coriolis mass flow controllers, respectively, and sent to a vertical flare nozzle (with selectable internal diameters of 25.4 or 76.2 mm). The fuel was combusted in a turbulent, buoyancy-driven, non-premixed flame. Prior to each experiment, the flare was run for up to 20 min to ensure the burner nozzle had reached a steady temperature.
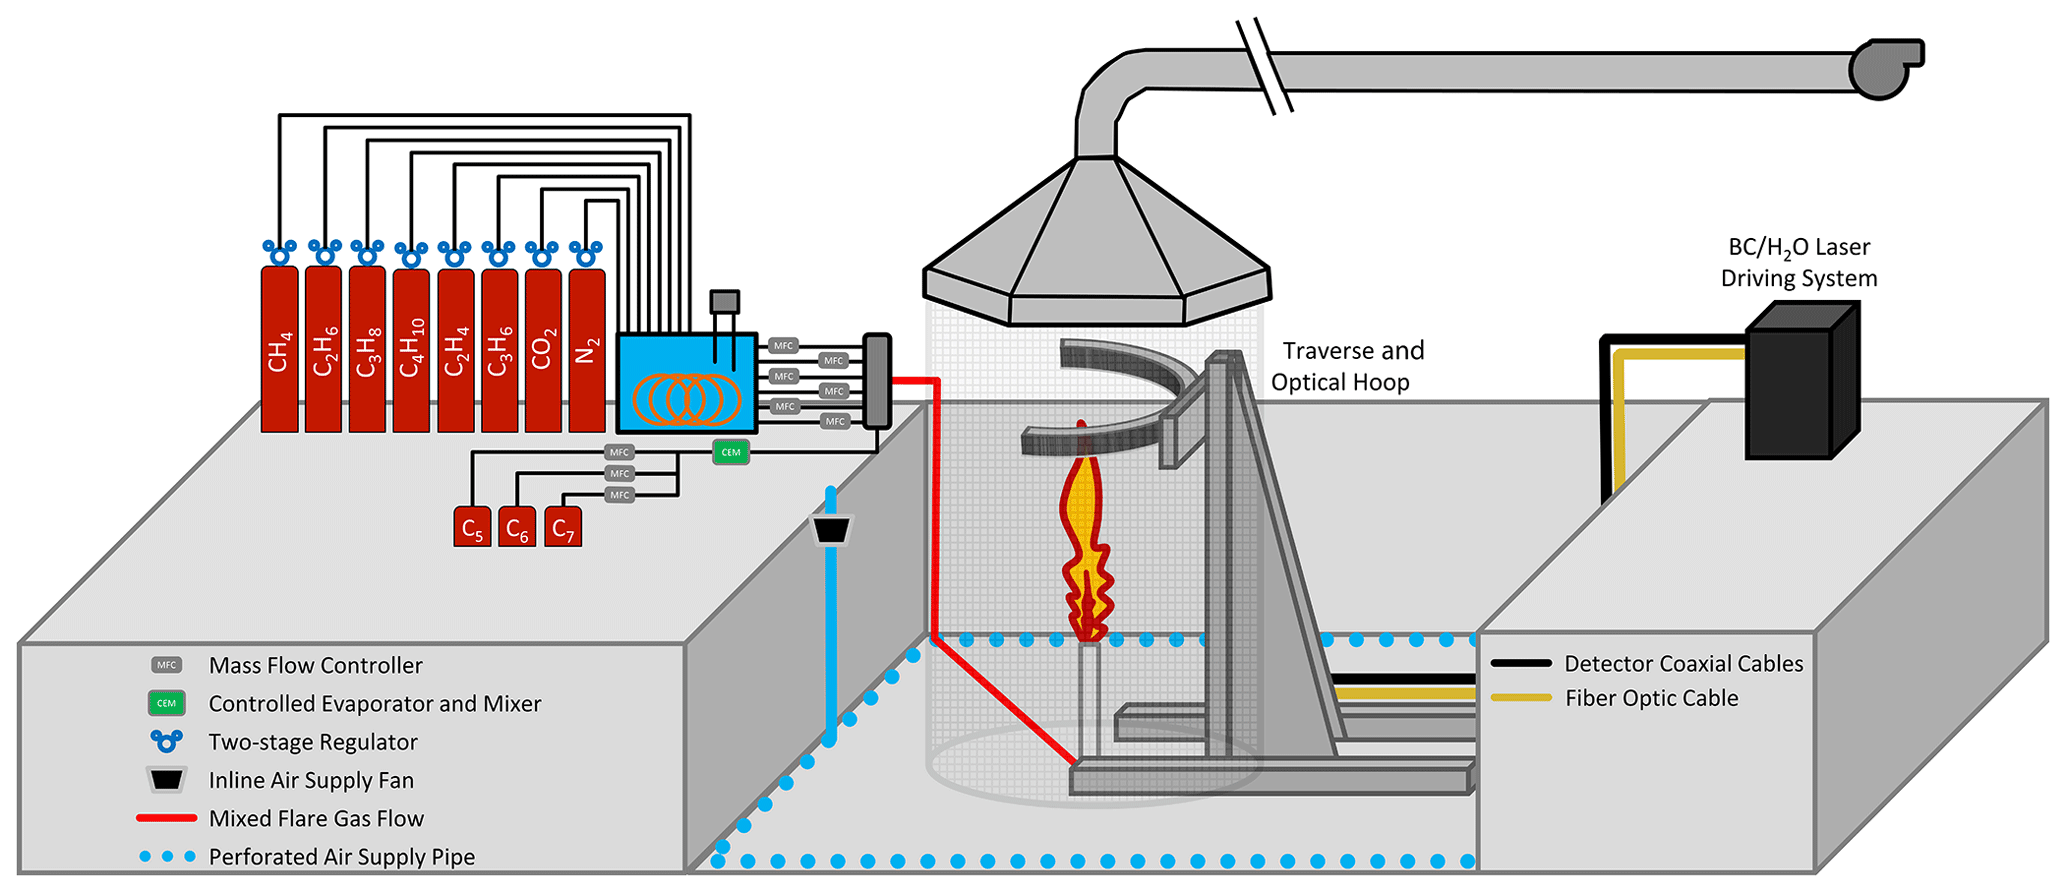
Figure 1Schematic of the Carleton University Flare Facility (CUFF) showing the mounting “hoop” for the optics that were positioned above the flare by a three-axis traverse system.
Table 1Experimental fuel compositions in volume fraction [%] with their molecular weight (MW), volumetric higher heating value (HHVv), and molar carbon–hydrogen ratio (CHR). Prefixes “n” and “i” distinguish between straight- and branched-chain isomers, where appropriate, of the C1–C7 alkanes.
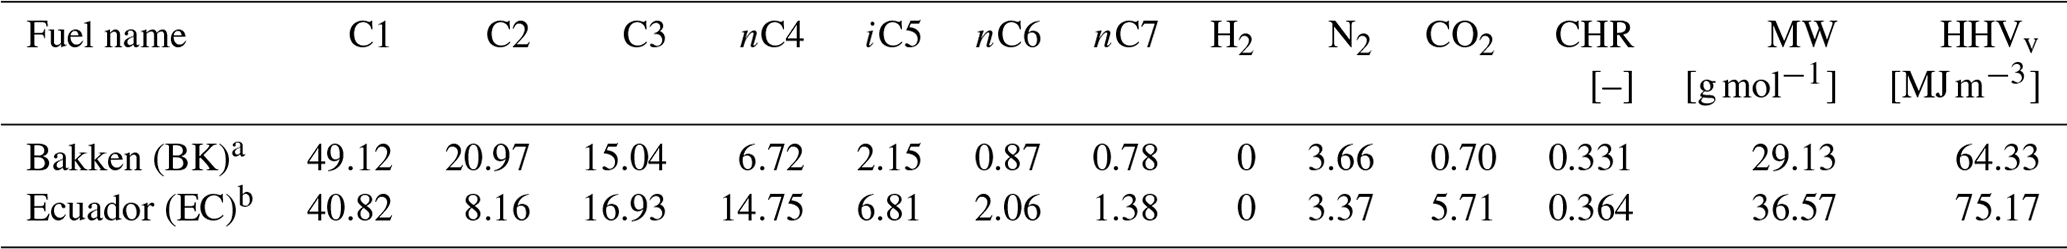
a Mean gas compositions from roughly 700 wells in the
Bakken region (Brandt et al., 2016)
b Selected gas composition from Ecuador's Orellana province (Conrad and Johnson, 2017)
A three-axis translating traverse system was outfitted with a square-channel semi-circular “hoop” that was positioned above the vertical flame. The hoop was manufactured from Invar, a nickel and iron alloy with a coefficient of thermal expansion of approximately K−1 (roughly an order of magnitude less than stainless steel), which allowed rigid and stable mounting of the launch and collection optics of the black carbon and H2O measurement system. The 1.5 m long optical measurement path was centred over the burner and positioned 2 m above the burner exit plane. Fiber-optic cables and detector signal cables were run from launch and collection optics to the laser driving and computer hardware systems located remotely as shown in Fig. 1. This arrangement permitted the temperature-sensitive laser driving systems to be positioned far away from the flame.
2.2 Optical system
Figure 2 shows a schematic of the optical measurement system. Two distributed feedback (DFB) lasers at nominal wavelengths of 1428 and 1654 nm from NTT Electronics were used for H2O vapour and black carbon (BC) detection, respectively. H2O volume fraction was measured using tunable diode laser absorption spectroscopy (TDLAS), and BC volume fraction was simultaneously measured via line-of-sight attenuation (LOSA). The radiation generated by each laser was fiber-coupled and sent through separate single-mode fiber networks, which included taps for wavelength references (fiber ring resonators), gas reference cells, and laser power references. All reference components were housed in an enclosure that is thermally stabilized by a thermoelectric heater–cooler unit to prevent reference signal drift. Each laser was mounted in an ILX laser mount (LMD-4984) and controlled by a Stanford Research Systems (SRS) laser diode controller (LDC500). Light from each network was coupled into a single fiber using a wavelength division multiplexer (WDM, WDM-12N-111-1428/1650 from Oz Optics) with optical circulators (6015-3-APC, Thorlabs) to prevent light leakage between the two fiber networks. The combined wavelengths were then sent in a single fiber to an open path beam collimator located on the optical hoop that launched the light through the flare plume towards the collection optics 1.5 m away. This arrangement ensured that the H2O and BC measurements were coincident through the plume.
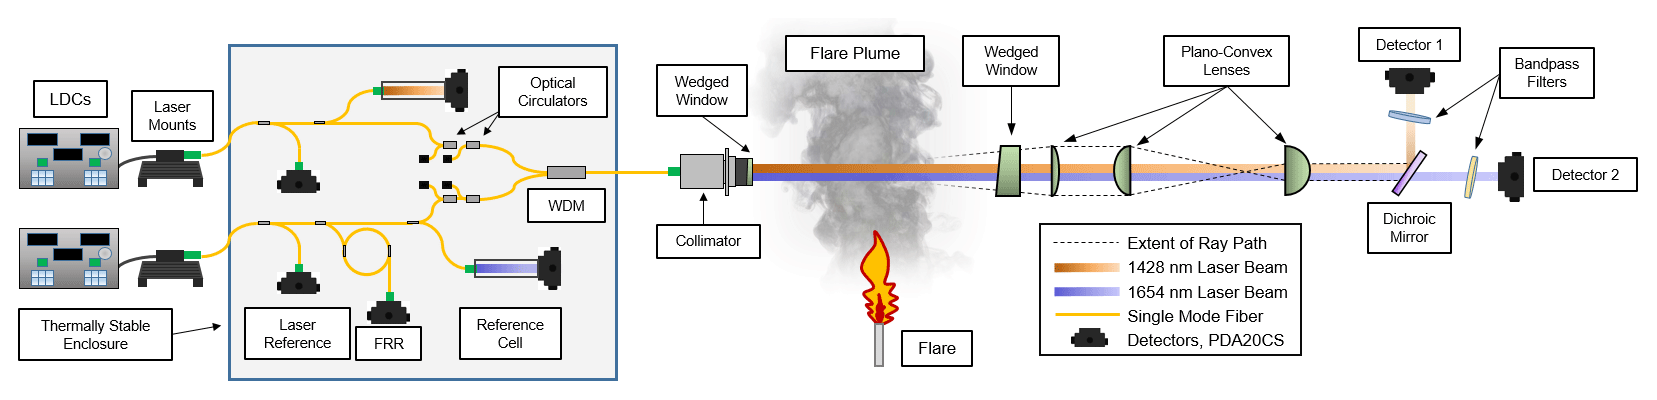
Figure 2Schematic of the optical measurement system for measuring synchronous path-averaged BC and H2O volume fractions along a path through the flare plume. Components within the shaded box were temperature-stabilized within a thermo-electric heater–cooler. Dashed lines representing ray path extent show how optical arrangement minimizes any effects of beam steering through the plume.
The collection optics were designed to maximize light capture despite any beam steering as the light transects the hot plume gases. Although beam steering through hot flare plumes should be minimal, <1 mrad according to Conrad et al. (2020), any light loss due to beam steering is necessarily interpreted as the presence of black carbon (refer to Appendix A2 for an investigation on beam steering impacts on the measurements). To further minimize any potential beam steering effects, a 0.75 m focal length plano-convex lens (Thorlabs, LA1978-C) was used to collect the light assuming the beam was steered at the mid-point of the open path. The collected beam was focused to half its collimated diameter by a set of plano-convex lenses (LA1134-C and LA1805-C, focal lengths of 60 and 30 mm, respectively) to ensure the beam was smaller than the detector photodiode diameter. The two-wavelength beam was split into its constituent wavelengths by a dichroic mirror (Thorlabs, DMLP1500R), passed through bandpass filters (FB1650-12 from Thorlabs, and 87-868 from Edmund Optics), and directed onto transimpedance-amplified InGaAs detectors (Thorlabs, PDA20CS). Signals from all detectors were recorded using a 1 MHz oscilloscope (National Instruments, PXIe-5172) and processed using software written in LabVIEW.
The optical system was controlled by a National Instruments (NI) PXI base station which included the oscilloscope for reading detector signals, a waveform generator used to sweep the laser injection current (NI, PXI-5406), and the laser driving systems. The injection current of the H2O detection laser was swept using a 200 Hz triangle waveform to allow the laser to scan back and forth across the two absorption peaks of H2O vapour centred at 7006.12 cm−1 (1427.32 nm) and 7007.03 cm−1 (1427.14 nm) corresponding to combinational vibrational bands of (2ν2+ν3) and (ν1+ν3), respectively. Each 5 ms sweep period, consisting of a forward and backward scan of the H2O peaks, was averaged to produce a single H2O spectral signal for analysis. The laser output wavelength throughout each sweep was determined using a gas reference cell (80 cm path length, containing 2.16 % H2O vapour by volume) in combination with a fiber-ring resonator (FRR), which had a free spectral range of 0.345 GHz (0.0115 cm−1). The H2O absorption peaks observed in the reference cell served as absolute wavelength references while the optical resonance peaks of the FRR indicated the wavelength change throughout the laser sweep. The 1654 nm laser was held at a constant wavelength, tuned away from absorbing gas species, and the 1 MHz data were averaged over 5 ms periods to produce synchronous BC and H2O volume fraction estimates.
An estimate of the absorption-free intensity, necessary to quantify light attenuation during an experiment, was made before and after each experiment by placing a tube across the optical path and purging with N2 gas for several minutes to remove the light-absorbing species (i.e. ambient H2O). Ambient H2O concentrations could also be measured after the tube was removed and prior to lighting the flame. Signals collected during experiments were processed by subtracting the detector's measured dark current and then normalizing by the absorption-free intensity estimate to yield the measured transmissivity and hence absorption.
3.1 Black carbon detection – line-of-sight attenuation (LOSA)
Soot or black carbon content in the flare plume was measured via optical attenuation of the 1654 nm laser, where the exact wavelength was tuned so that it was not detectably absorbed by H2O, CO2, CO, or methane. Following the definition of Baumgardner et al. (2012), this approach of inferring soot volume fraction from light absorption yields estimates of “black carbon” (BC), which might alternatively be called “equivalent BC” (Andreae and Gelencsér, 2006; Petzold et al., 2013) or “light-absorbing carbon” (Bond and Bergstrom, 2006). In the specific context of gas flares, fresh particulate emissions are statistically pure elemental carbon (e.g. Conrad and Johnson, 2019; Popovicheva et al., 2019; Schwarz et al., 2015); thus, “elemental carbon”, “soot”, (equivalent) black carbon, and light-absorbing carbon can be considered as synonymous in the present work.
The optical transmissivity observed through a flare plume with the 1654 nm laser can be directly related to the soot or BC volume fraction through
where [m−1] is the BC extinction coefficient evaluated at some wavelength λ, fν [–] is the local BC volume fraction that can be integrated over the optical path s [m], and the transmissivity τ [–] is calculated as a ratio of the measured (transmitted) intensity I over the incident intensity I0 (Coderre et al., 2011; Migliorini et al., 2011). If the BC extinction coefficient is known at the operating wavelength, the transmissivity can be used to yield the integrated or path-averaged BC volume fraction. From the review by Coderre et al. (2011), most rigorous soot optical property measurements in the literature have been conducted in or near the visible region, with most not exceeding 1064 nm in the infrared. Among the few studies investigating soot optical properties between 1400 and 1700 nm, there is disagreement on values. However, this is not a limiting concern in the present work, since any bias in assumed black carbon optical properties will affect absolute BC volume fractions but not the strength of correlation with H2O. Thus, BC optical properties at the measurement wavelength of 1654 nm were assumed using complex refractive index values calculated from Chang and Charalampopoulos (1990) and a scattering-to-absorption ratio extrapolated from Migliorini et al. (2011) to yield a reference extinction coefficient of 2.6×10⁶ m−1.
3.2 H2O absorption spectra isolation
The strongly light-absorbing black carbon will attenuate light at both laser wavelengths thereby corrupting the H2O vapour absorption spectra near 1428 nm. Given values at the two measurement wavelengths, a simple ratio of Eq. (1) at each wavelength would be sufficient to isolate the H2O absorption spectra from the attenuation caused by black carbon. Rather than relying on the literature where there is some disagreement about values in the near infrared, an experiment was conducted to estimate the ratio between BC extinction coefficients at 1654 and 1428 nm. Using a heavily sooting ethylene flare, attenuation magnitudes were observed at both wavelengths (while the 1428 nm laser was tuned away from detectable H2O absorption peaks). As detailed in the Appendix, the experimentally determined BC extinction coefficient ratio of fell within the range of values that could be calculated from the literature and most closely resembled the results of Krishnan et al. (2001).
3.3 H2O detection – tunable diode laser absorption spectroscopy (TDLAS)
The transmissivity of light through a light-absorbing gas medium is described by Beer–Lambert's law,
where τ(ν) [–] is the optical transmissivity evaluated at some wavenumber ν [cm−1], and the wavenumber is the inverse of the incident radiation wavelength λ. τ(ν) is related to local gas properties, where q [–] is the volume fraction of the absorbing species, p [Pa] is the pressure, and T [K] is the gas temperature. The equation also depends on Boltzmann's constant kb [ (kg cm2) (s2 K)−1] and the absorption cross section of the medium [cm2 molecule−1] evaluated at some wavenumber. Equation (2) is computed by integrating over the optical path, s [m]. Following the correction for black carbon attenuation and in the absence of other light absorbers at the chosen wavelength, for the isolated H2O absorption spectra were computed using the High-resolution TRANsmission molecular absorption database (HITRAN) and assuming a Lorentz profile to describe line broadening.
In the present application, the sample path is a line-of-sight (LOS) through a turbulent flare plume. This means that the integral in Eq. (2) cannot be directly evaluated without knowledge of the temperature and volume fraction distribution along the measurement path. Instead, a technique called profile fitting, as implemented by Liu et al. (2007) in laminar flames, was employed here to deal with non-uniform gas properties along the LOS. The technique was selected since it was observed in preliminary simulations to have superior performance to other spectroscopic techniques developed for non-uniform sensing, at least in this application. Other techniques considered include integrated absorbance of two transitions (e.g. Farooq et al., 2008; Fotia et al., 2015; Liu et al., 2006; Allen, 1998; Zhou et al., 2003) or multiple transitions in a linear regression solution (e.g. Liu et al., 2013, 2005; Sanders et al., 2001; Zhang et al., 2016).
The profile-fitting technique assumes that the unknown gas property distributions in Eq. (2) (in this case the H2O volume fraction q, and temperature T) can be described by some general form. Here, we assume column (“tophat”) distributions with identical column widths for both H2O volume fraction and gas temperature as shown in Fig. 3. The column distributions are a function of three independent unknowns to be solved (column width w, column temperature Tcol, and column volume fraction qcol) and two constants (ambient temperature Tamb and volume fraction qamb) that can be directly measured. The assumed column distributions were substituted into Eq. (2) to compute theoretical absorption spectra that were compared with measured H2O absorption signals. The parameters describing the column distributions (w, Tcol, qcol) were then iteratively refined using a Nelder–Mead downhill simplex optimization scheme to best match the measured absorption spectra. The final column distributions were used to compute path-averaged H2O volume fractions for further analysis. Importantly, it is not critical to accurately reconstruct the spatial distribution of gas temperature and H2O volume fraction along the path; the column distribution simply allows for meaningful path-average values to be calculated from an unknown distribution. Preliminary simulations also showed the column distribution approach to be more stable and accurate, at least in this application, than the Gaussian distribution approach proposed by Grauer et al. (2018).
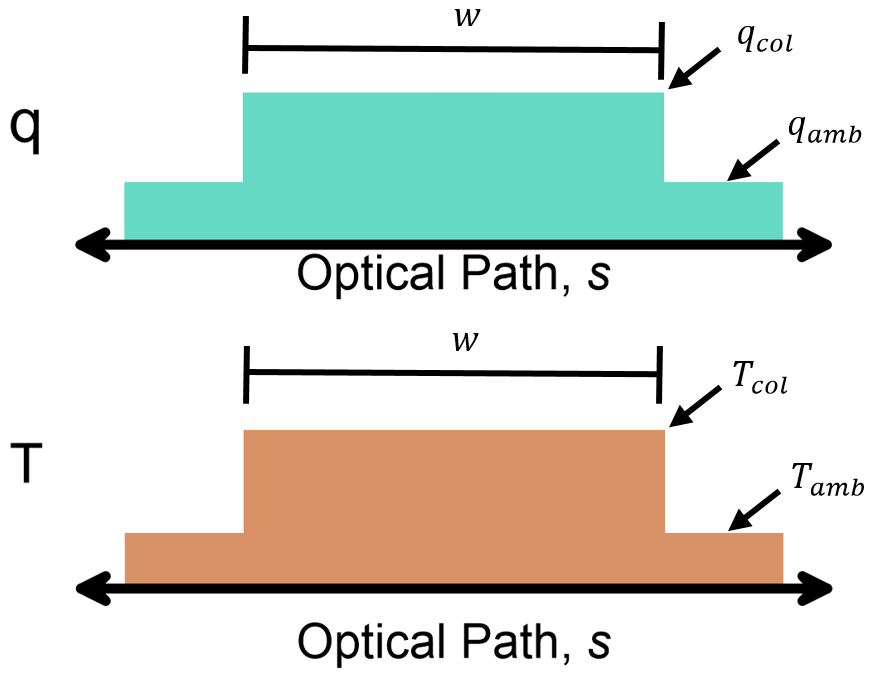
Figure 3Column distribution of temperature and H2O volume fraction used to generate theoretical spectra for comparison with measured data. Tamb and qamb represent the ambient temperature and H2O volume fraction in the facility and Tcol and qcol are the elevated temperature and H2O volume fraction of the combustion products in the plume.
A critical consideration for developing an optical system capable of measuring path-averaged H2O volume fractions was the judicious selection of absorption transitions. After considering many potential transitions from the HITRAN database, a laser of 1428 nm nominal wavelength output was selected to measure two absorption peaks of H2O vapour centred at 7006.12 cm−1 (1427.32 nm) and 7007.03 cm−1 (1427.14 nm), related to combinational vibrational bands of (2ν2+ν3) and (ν1+ν3), respectively. These transitions were chosen because they had sufficient absorption strength to be measured in the lab; were isolated from other species transitions; and possessed the unique characteristic of having opposite, and near-linear, scaling trends of peak absorption with increased temperature over the range of 300 to 800 K. This last characteristic, related to their large difference in lower-state energies, means that temperature and concentration effects on the absorption peaks were effectively decoupled in the optimization scheme, increasing the overall accuracy of the method. Since expected flare plume temperatures were <800 K (and most likely ≤600 K as suggested in thermocouple measurements by Poudenx et al., 2004), these absorption transitions were ideally suited to this application. Poudenx et al.'s measurements were taken 1.4 m downstream of a 2.21 cm diameter flare with 2 m s−1 exit velocity. In this study, the measurements presented in Sect. 4 used flow velocities not exceeding 2 m s−1 and took LOS measurements at 2 m above the burner on buoyancy-driven turbulent flare plumes. Post-analysis of measurements presented in Sect. 4 confirmed that 95 % of final measurements had path-averaged temperatures <333 K and a maximum value of 384 K. Expected temperatures were thus also well below species reaction temperatures (e.g. adiabatic flame temperature of methane at 2224 K, thermal NOx formation above ∼1600 K) (Turns, 2000; U.S. EPA, 1999), meaning no major chemical reactions were occurring at the measurement height above the flare that would otherwise complicate measurements.
Prior to commencing experiments, the capabilities of the profile-fitting technique were tested using the large-eddy simulation (LES) data for methane flares in crossflow described by Conrad et al. (2020). Species and temperature data along chords through the simulated flare plume were extracted and used to compute simulated line-integrated signals (including added noise) that would be sensed by a detector. These test data included near-field locations with high peak temperatures and localized pockets of combustion products, as well as far-field locations with lower peak temperatures and more dispersed combustion products. For line-of-sight measurements where peak temperatures were below 800 K, the profile-fitting technique accurately estimated the path-averaged H2O volume fraction with a mean relative error of 0.3 %; 95 % of measurements were within ±3.2 % relative error and all measurements were within ±6.3 % relative error.
3.4 Experimental acquisition and processing
A typical pair of laser signals, following normalization by the absorption-free intensity estimates for each line, is shown in Fig. 4 for an experiment running the Bakken flare gas mixture. The 1428 nm signal in Fig. 4a is the average of the lead and lag components of the 5 ms (200 Hz) triangle waveform sweep. The measurement from the 1654 nm laser shown in Fig. 4b was averaged similarly to the 1428 nm (by averaging lead and lag) to allow mapping of the BC attenuation data onto the 1428 nm signal. This allowed isolation of the H2O spectra (shown in Fig. 5 plotted against wavenumber as determined using the FRR and reference cell signals). Overlaid in black on Fig. 5 is the fitted theoretical absorption spectrum produced by the column distributions as determined by the Nelder–Mead algorithm; the residual plot above demonstrates the closeness of fit. The synchronous BC signal (Fig. 4b) was time-averaged over the sweep duration to obtain a single BC volume fraction for comparison with the H2O estimate.
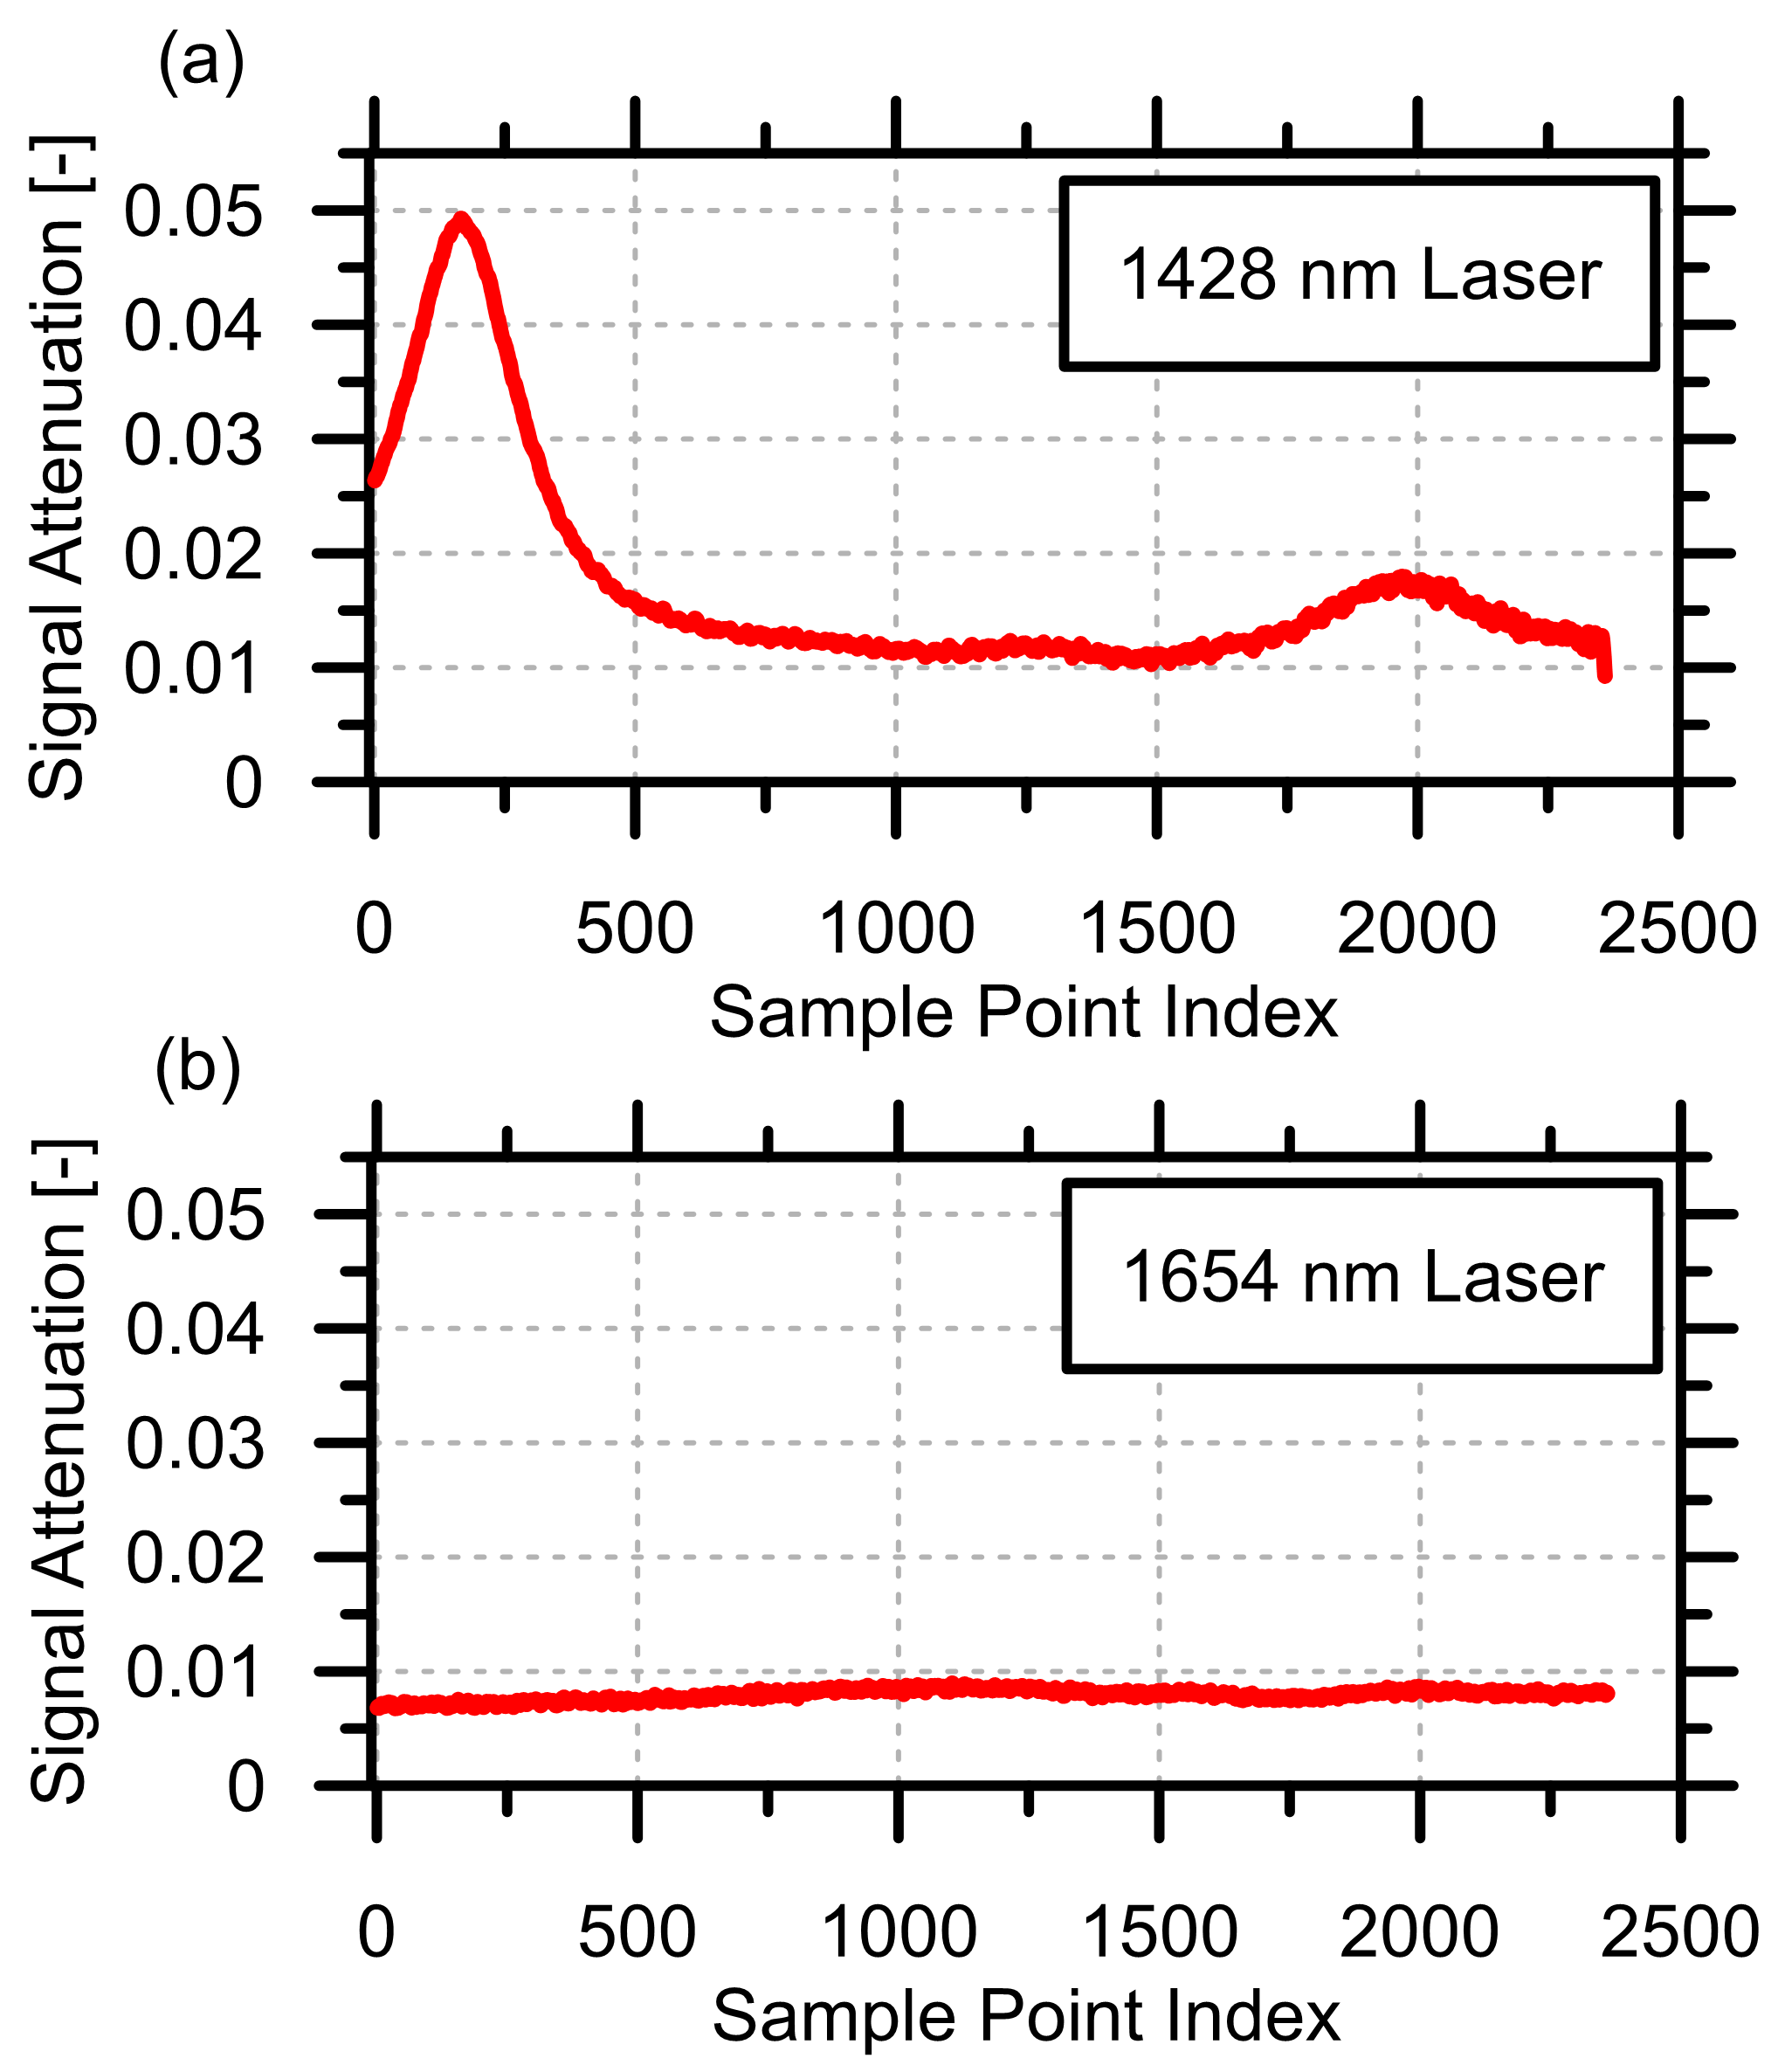
Figure 4Sample 5 ms duration measurement of (a) 1428 nm (H2O+BC) and (b) 1654 nm (BC) laser signals through a Bakken flare plume. Time-resolved signals can be mapped to isolate spectral H2O absorption peaks from black carbon.
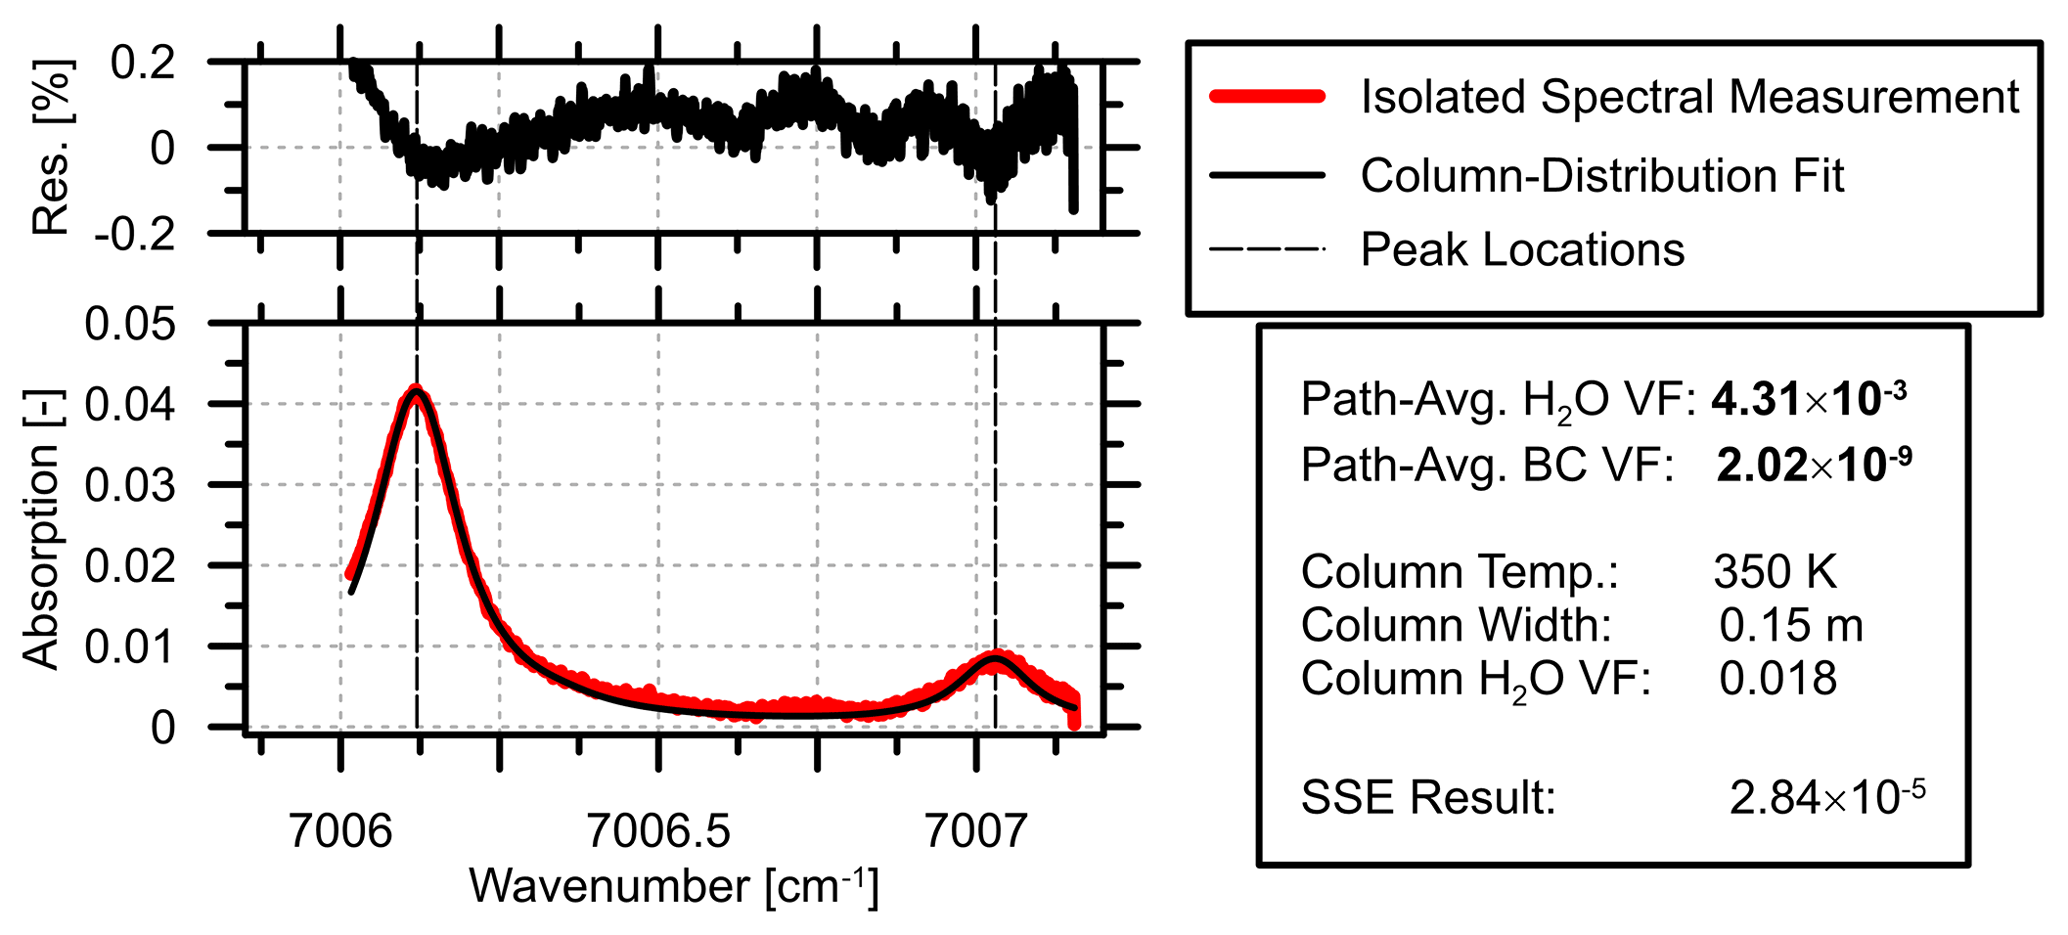
Figure 5H2O absorption peaks in isolated, spectrally resolved form compared to the column distribution result from the Nelder–Mead optimization search.
In the Nelder–Mead optimization scheme, a scalar sum-of-squared errors (SSE) value is produced representing the difference between the measured and fitted path-averaged H2O absorption spectra. A purposefully restrictive SSE threshold of was used to filter the raw experimental data. Filtering on the basis of SSE is shown in the Appendix to remove spectral data that is not well-fitted to a theoretical absorption peak during the profile fitting, potentially due to beam steering events. However, while this tight tolerance ensured robustness of the presented results, it is possible that this artificially reduces the variability and skewness of the ratio as elaborated in the Appendix. For example, if cases of less than ideal spectral fitting are correlated with instances in which complex turbulent structures in the plume allow BC and H2O fluctuations to be uncorrelated, then the filtering could suppress part of the phenomena to be quantified. Future experiments with a faster time resolution system and/or additional measured absorption lines could explore this further. For now, however, the presented correlation results likely represent a conservative lower bound on the spread and skewness of the ratio.
Optical measurements were conducted for flare compositions characteristic of the Bakken region and Ecuador (described in Sect. 2.1) across multiple flow rates and burner nozzle diameters. Figure 6 shows example scatter plots of instantaneous path-averaged measurements of produced H2O (measured H2O volume fraction minus measured ambient H2O volume fraction) and BC volume fractions for two flare experiments. Although there is a general correlation between the species, as should be expected since the mean emission rate of each species is proportional to the overall rate of combustion, the results show considerable scatter about the central trend. Importantly, if ratios were fixed, then dilution of the turbulent plume with air would only populate points along the central line. The scatter is also not attributable to measurement noise, which is roughly an order of magnitude less than the apparent variation. As elaborated in the Appendix, the anticipated error on the measured H2O volume fraction was (relative error of ±8.1 % at 95 % confidence). For BC, the volume fraction error is estimated to be (95 % confidence). The low correlation coefficients of r2=0.50 and 0.56 in Fig. 6 suggest that approximately half of the variation is unexplained with a the linear model where dilution is the driver of correlation, and the ratio is assumed constant. Similar plots were seen for all test conditions with coefficients ranging from 0.40 to 0.67.
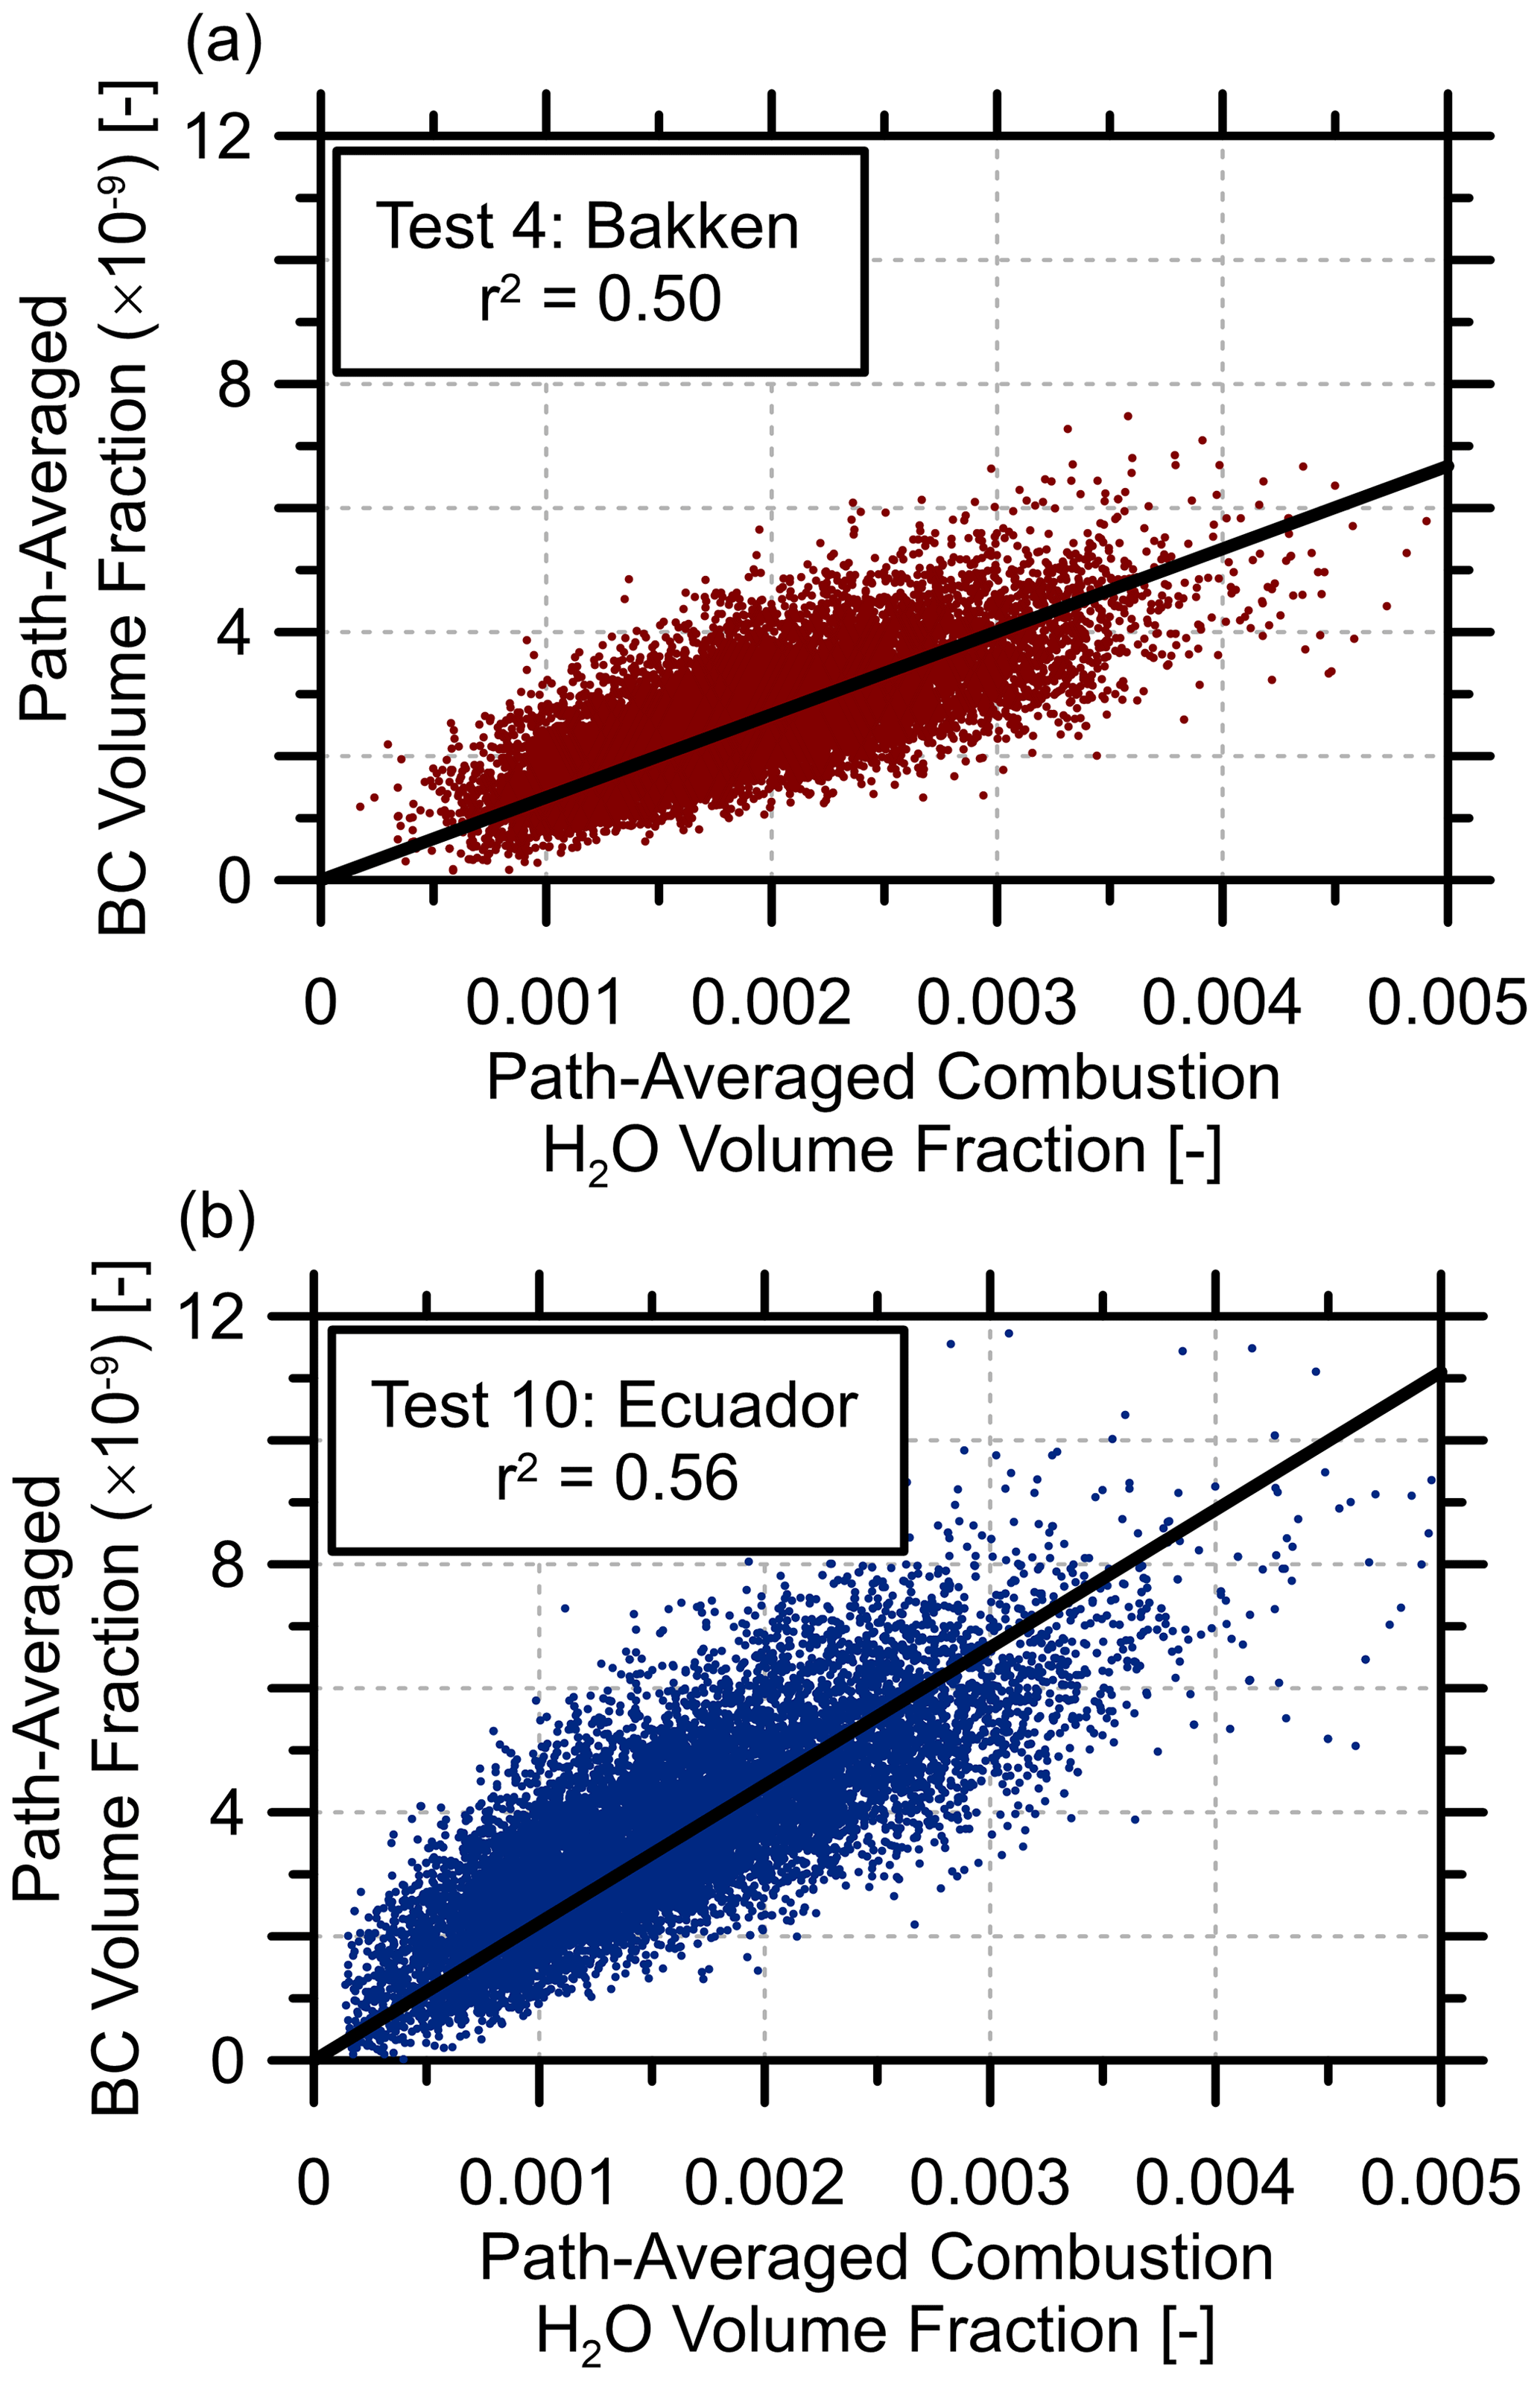
Figure 6Sample scatter plots of path-averaged produced black carbon (BC) and H2O volume fractions for (a) Bakken fuel test 4 (40 SLPM, 25.4 mm burner) and (b) Ecuador fuel test 10 (40 SLPM, 76.2 mm burner).
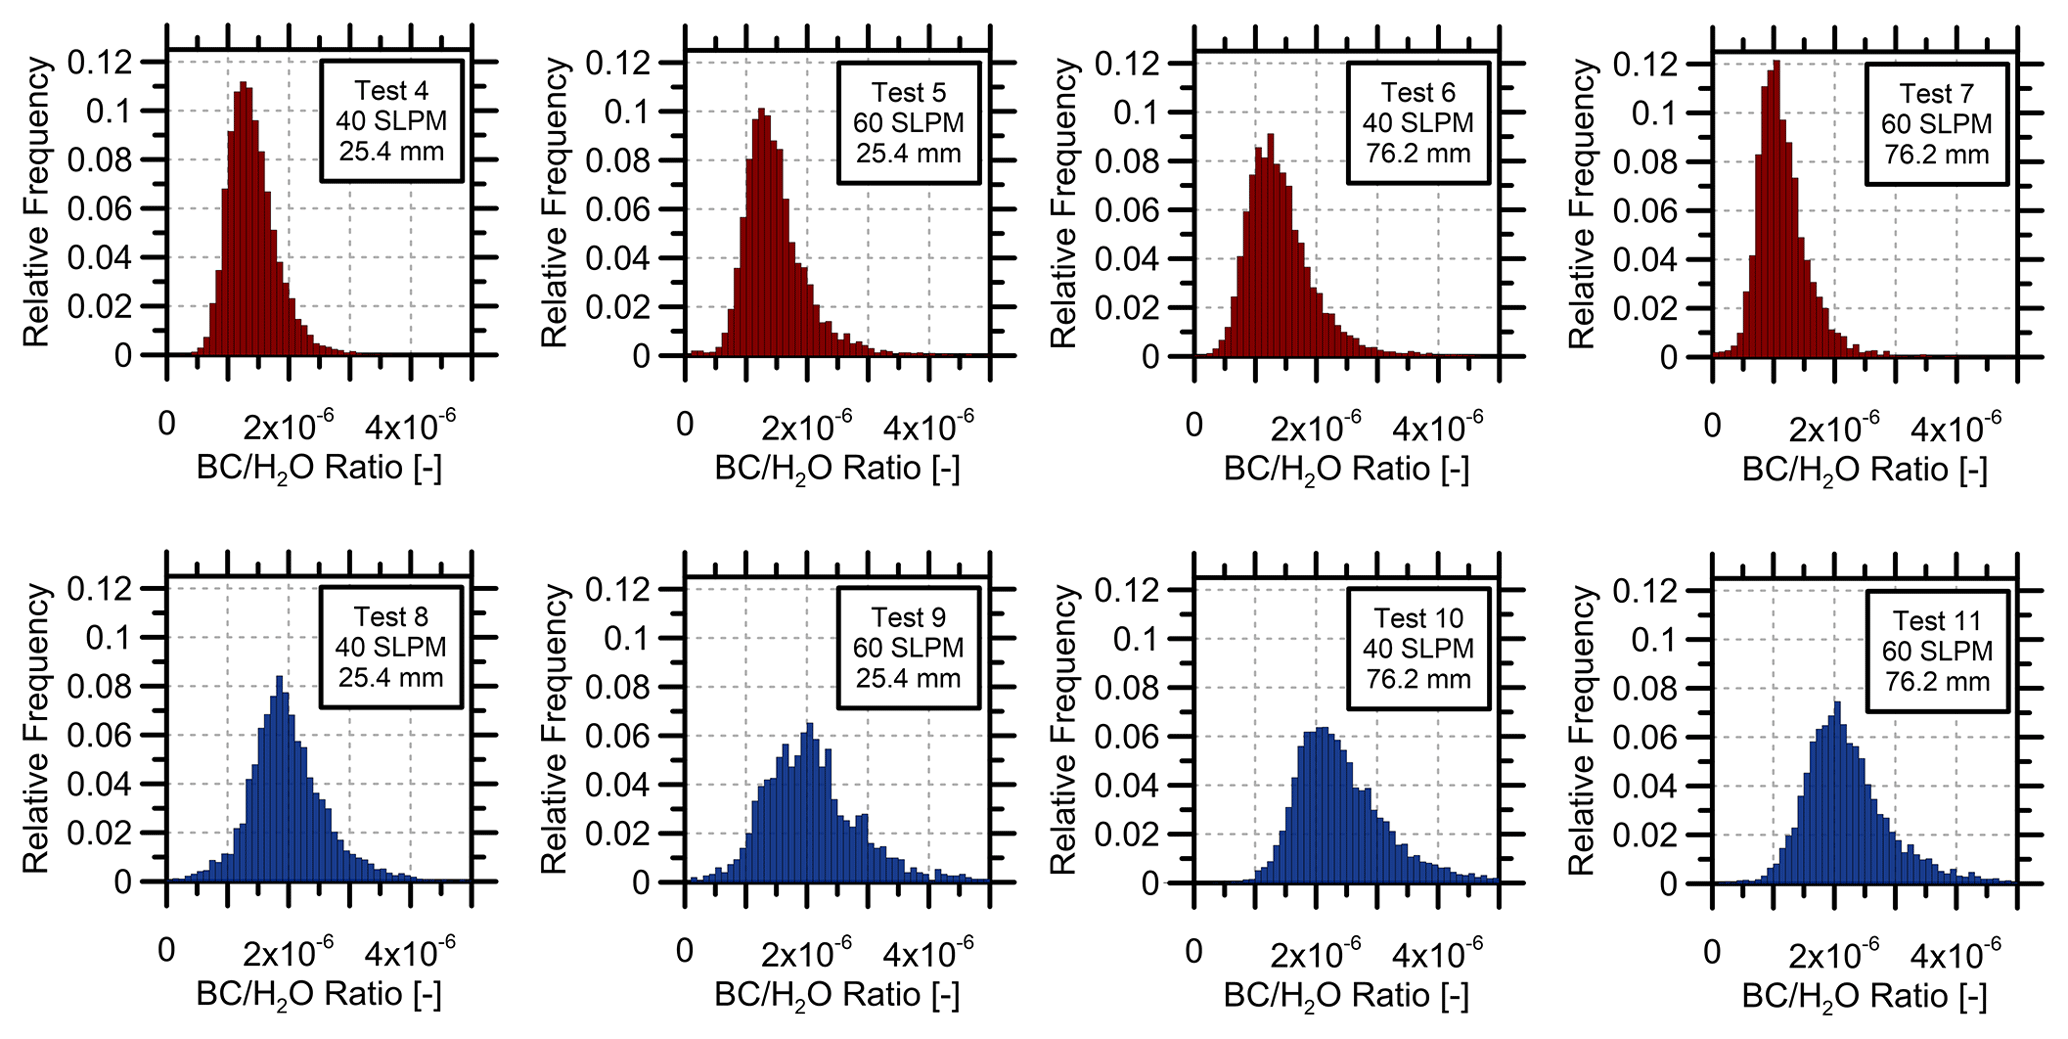
Figure 7Black carbon (BC)H2O volume fraction ratios for tests with the Bakken flare gas mixture (top row) and Ecuador flare gas mixture (bottom row).
Table 2Summary of flare test black carbonH2O ratio results and relevant statistics.
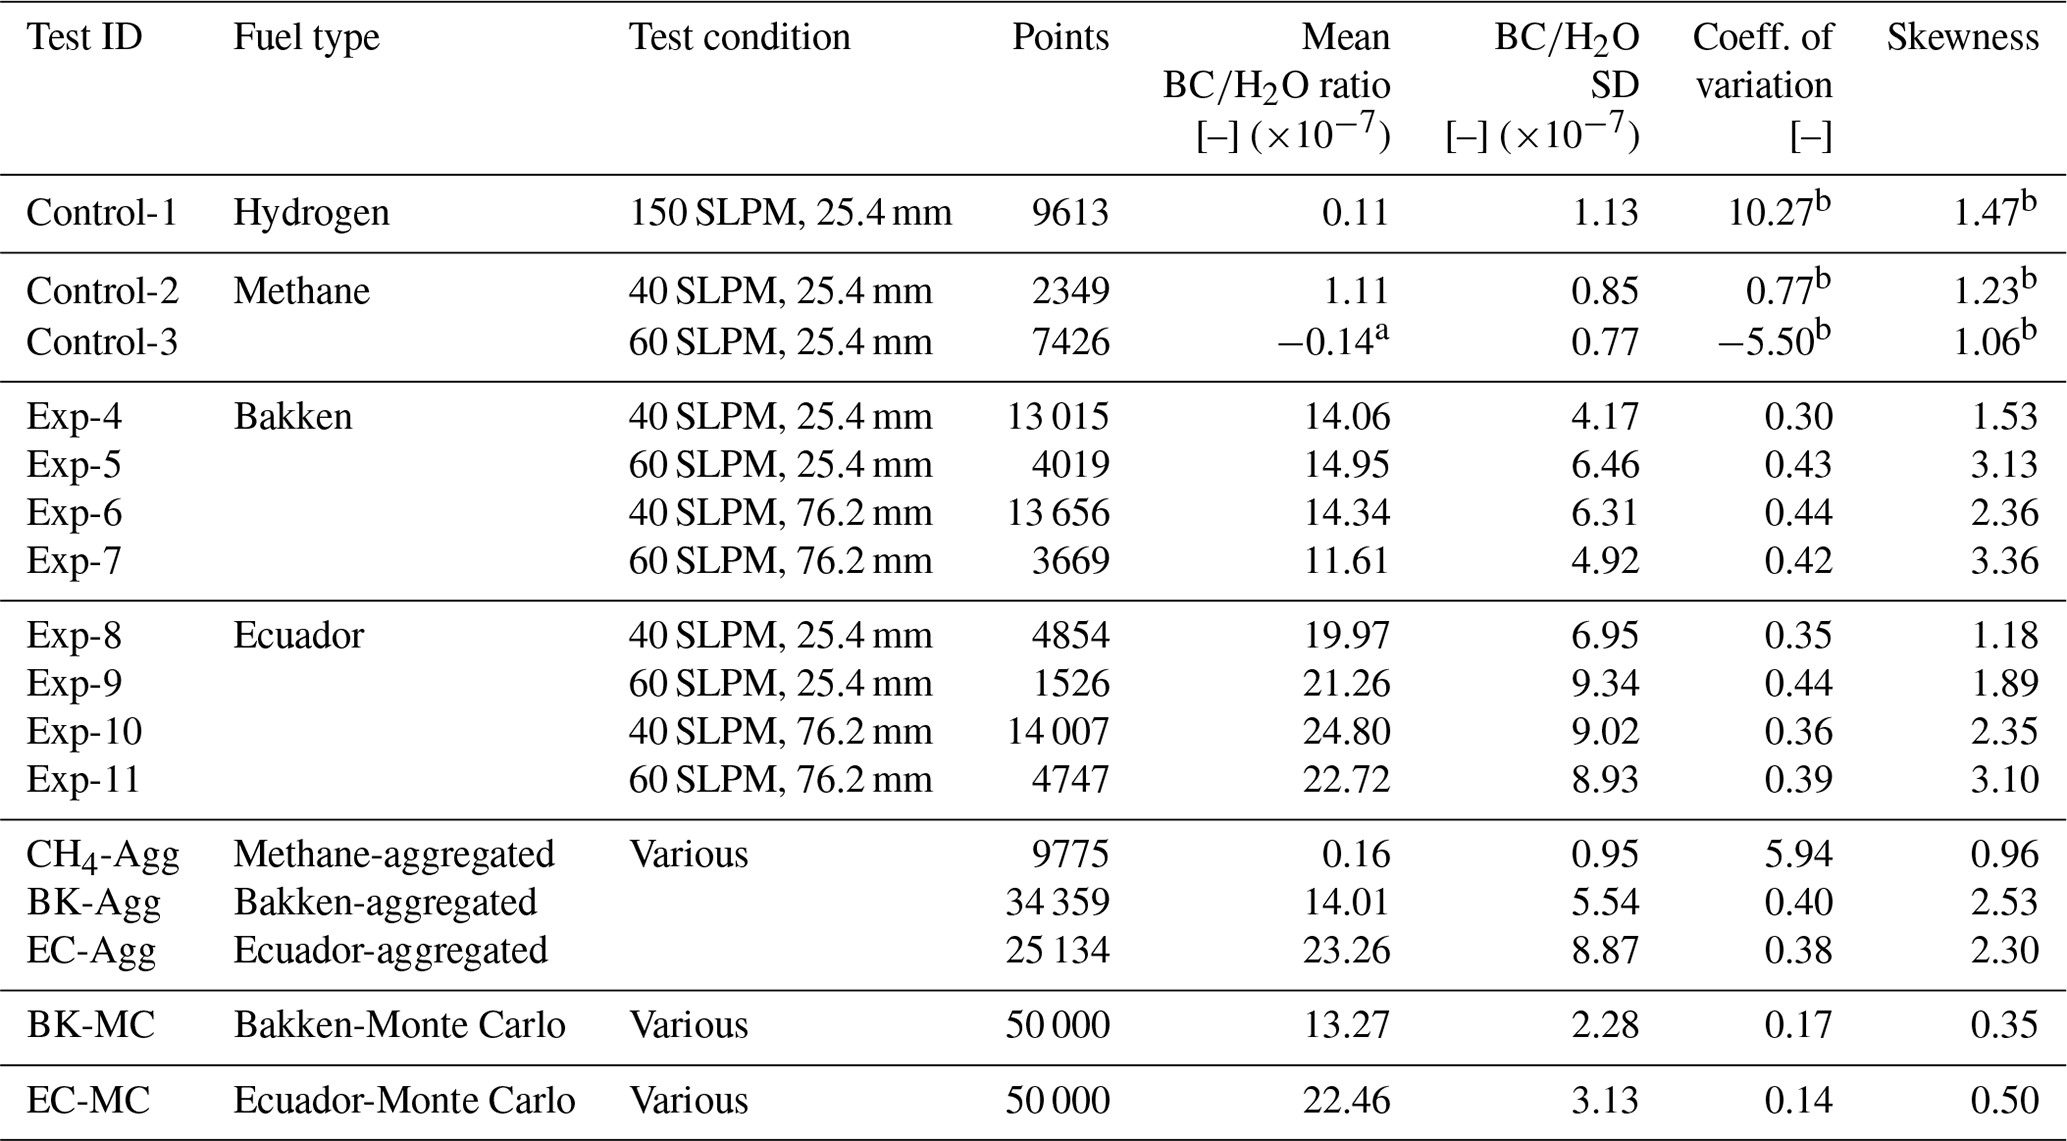
a This non-physical value of the
ratio is a result of system noise and uncertainty on a BC signal near zero for
the pure methane flame, suggesting BC may not be sufficiently detectable for
the methane experiment.
b Coefficients of variation and skewness for the control tests are included for completion but are not meaningful since the mean ratios are near zero for these tests and the absolute variations (as measured by the standard deviation) are much smaller than those of the experimental cases.
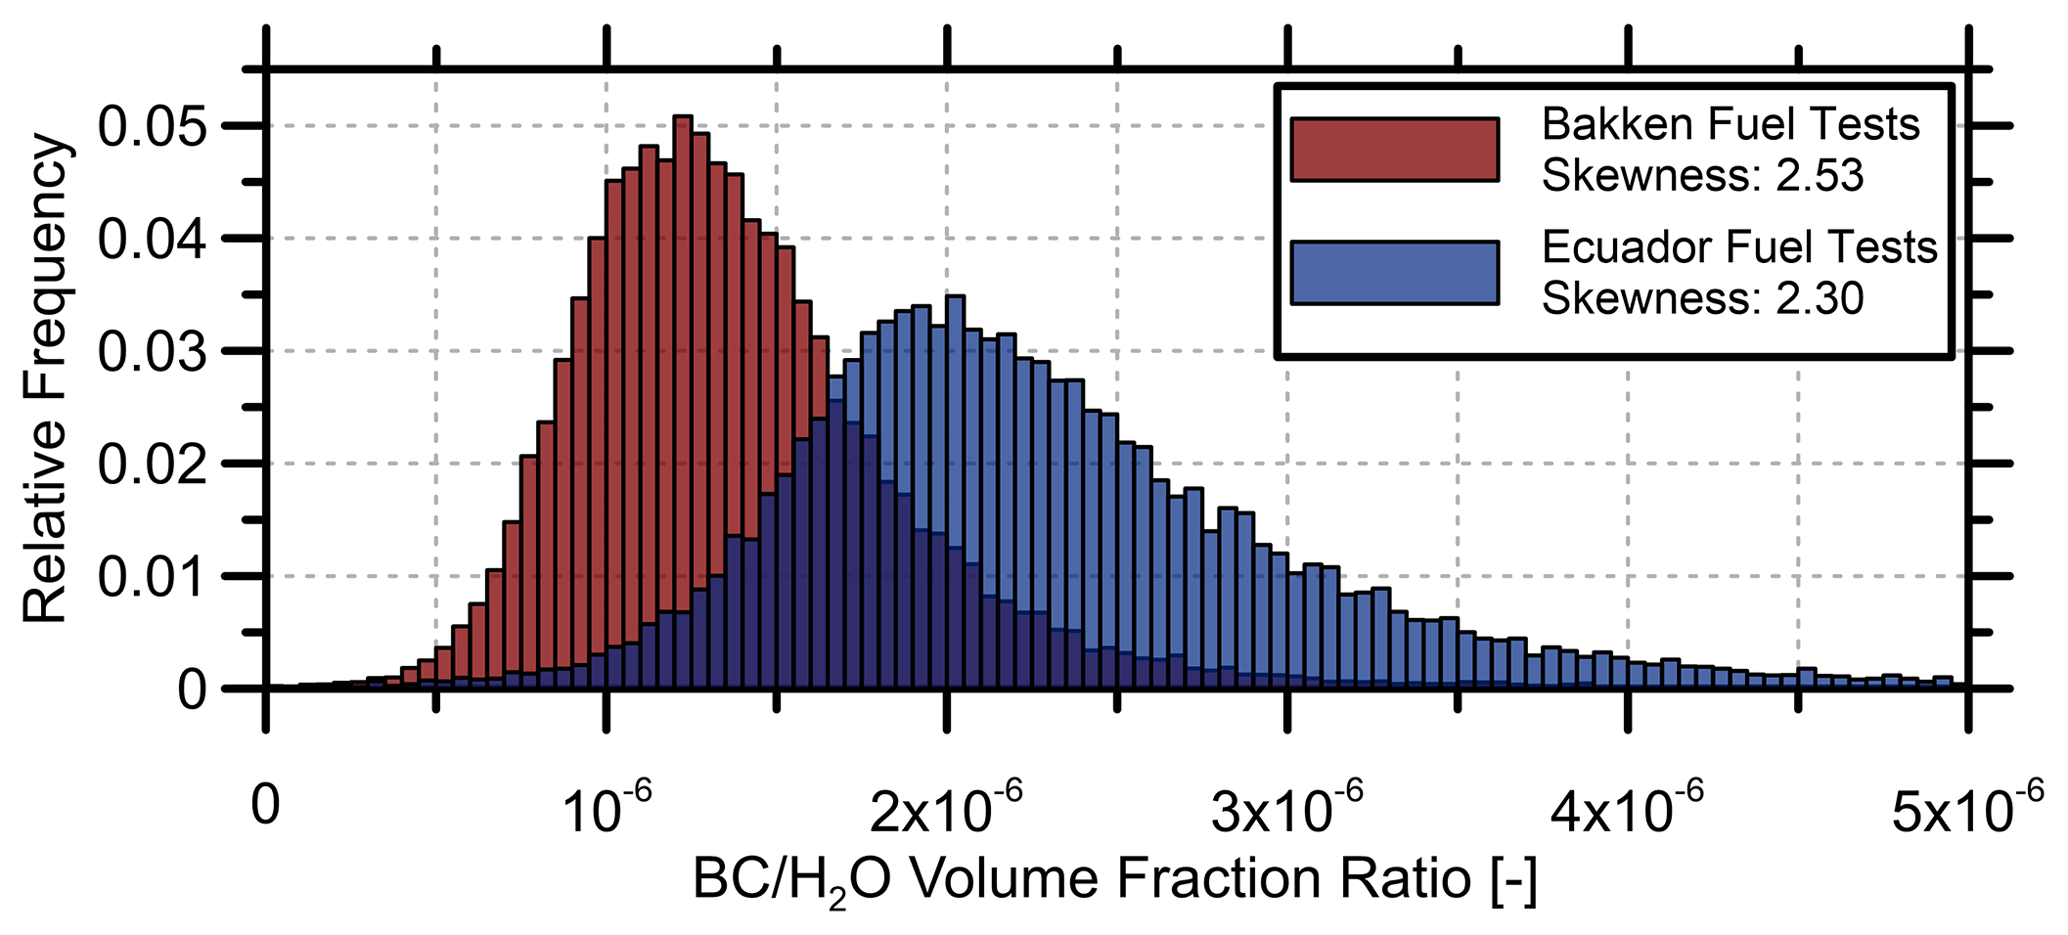
For mass- or molar-balance approaches relying on a fixed ratio of species in space and/or time throughout the plume, histograms of the species ratio data are plotted for each experiment in Fig. 7. Statistics for all cases, including hydrogen and methane control tests, are summarized in Table 2. As apparent in Fig. 7, all of the experiments with realistic flare gas mixtures show similar distributions, with the ratio varying about a single mode. Moreover, the distributions are all positively skewed, with a tail towards intermittent, higher values of the ratio. There is no apparent trend with flare gas flow rate or flare nozzle diameter, suggesting that the variation in ratio is an inherent characteristic of the turbulent buoyant plumes. There is, however, an apparent dependence on flare gas composition, with the larger heating value Ecuador flare gas mixtures producing broader variation in ratios (7.0– vs. 4.2–) than the Bakken flare measurements, as well as higher overall ratios (20.0– vs. 11.6–). This dependence of ratios on fuel type is a result of BC yield scaling with the fuel's higher heating value (Conrad and Johnson, 2017; McEwen and Johnson, 2012) and similar H2O production between the fuels. Data for each of these mixtures is aggregated in Table 2 and replotted in Fig. 8, where the skewness of the distributions becomes more apparent. On a relative basis, the coefficient of variance (mean-normalized standard deviation) of the ratios for the two mixtures are similar, 0.40 and 0.38, for Bakken and Ecuador mixtures, respectively. The consistency between the coefficient of variance and skewness for the two fuels shows that these species ratio variations do not scale with increased BC production and instead suggests that the uncorrelated variation in instantaneous species concentrations are most likely related to combustion dynamics and species mixing within the turbulent flame rather than fuel chemistry.
Prior to considering the possible implications of these results, it is first important to understand and bound the potential contributions of measurement uncertainty to the observed variability and skewness. Results of the hydrogen and methane tests were identically processed to glean the maximum amount of variability in an inferred ratio that could be observable from measurement uncertainty alone. For the H2 flame, there could be no black carbon produced, and any attenuation variation in the BC measurement laser would be solely attributable to experimental uncertainty. Similarly, any minor contribution from BC in the methane control tests would only lead to a conservatively high estimate of uncertainty. Together, the hydrogen and methane control tests, with adiabatic flame temperatures of 2379 and 2224 K, bound those of the experimental flare gas mixtures (2249 and 2250 K) and thus should more than encompass the range of temperature-driven beam steering effects and thermally driven fluid structures within the plume. The measured variability in the ratio for the Bakken and Ecuador flare gas experiments exceeds the ratio variation of the control methane and hydrogen experiments by at least 3.7 times (median is a factor of 6.0).
In addition, a simple Monte Carlo (MC) simulation was performed to estimate ratio variation and skewness attributable to measurement uncertainty, as further detailed in the Appendix. The simulation took median BC and H2O volume fraction results from Bakken and Ecuador datasets and computed ratios of the species volume fractions while including a random, independently drawn contribution due to measurement uncertainty from distributions based on the control tests; further details are included in the Appendix. Repeating this process 50 000 times produced a distribution of ratios that represents a worst-case error bound since any correlation of uncertainty between the two species that might cancel when calculating their ratio was neglected. Statistics of the resulting distributions in ratio after 50 000 iterations of the MC simulation are included in Table 2. Importantly, the experimentally measured variation in ratios for the realistic Bakken and Ecuador flare gas mixtures is much larger than that which could be attributed to measurement uncertainty. The standard deviation was ∼2.4–2.8 times larger and the skewness 4.6–7.2 times greater than what might be expected based on the Monte Carlo simulations (which represents a conservative upper bound on likely uncertainties, as explained in Appendix A5).
The measured ratios of the Bakken and Ecuador flare gas mixtures, qualified by the control tests and Monte Carlo simulations, point toward two important conclusions:
-
Variability in instantaneous ratios suggests the species are not always well-correlated in the turbulent plume.
-
Skewness of ratio suggests the existence of short bursts of high black carbon production that are not well correlated with H2O.
The measured variability in path-averaged ratios exceeds estimated measurement uncertainty and variability of control tests, and the variation is not symmetrical about the mean. The positive skewness of the ratio suggests that infrequent bursts of high ratio heavily weight the mean value and populate the long tail of the distributions observed in Fig. 8. This is interpreted physically as short bursts of high black carbon production that are not well correlated with H2O. Short, infrequent, and localized bursts of high BC production have been previously observed by Conrad and Johnson (2017), who used the sky-LOSA technique to measure black carbon production from flares in Veracruz, Mexico, and Orellana, Ecuador. Their study demonstrated that overall BC emission rates are dominated by short bursts of high BC emission; in an extreme case, 10 % of their instantaneous data corresponded to 56 % of total emissions measured. What was not known in their study was whether these high-sooting bursts were necessarily correlated with spikes in concentration of other combustion species such that any ratio of species would be fixed. Experimental evidence from the current study suggests that this is unlikely. The observed variability and positive skewness in the distribution of the measured ratios suggests that assumption of a constant species ratios is not universally true, which could limit the accuracy of field measurement techniques quantifying flare performance based on short-duration measurements.
4.1 Implications for field measurements
The motivation of this study was to determine whether variations in species ratios in a turbulent plume could be detected and, if so, to examine how these might affect field measurements that rely on the assumption of a fixed ratio as part of a molar- or mass-balance to quantify pollutant emission rates or combustion and destruction efficiency. Although a sufficiently long temporally and spatially averaged species ratio measurement will approach some mean value for a given operating condition, the necessary measurement timescales or length scales required for accurate estimates are not clear. Moreover, the effects of fluctuations in relative species concentrations (i.e. species ratios) are exacerbated in measurement techniques that rely on a limited number of measurements.
Although the presented optical instrument was not intended to replicate the measurements of any specific field technique, the experimental observations of variable ratio can still be used to infer general impacts on flare performance estimates from a limited dataset. As a thought experiment, if we assume that an aircraft or similar path-averaged technique randomly samples 1 to 6 values (consistent with 1–6 path-averaged transects through a flare plume, e.g. Weyant et al., 2016) from the aggregated histograms for the Bakken and Ecuador fuel mixtures (Fig. 8), this small sample size is unlikely to obtain an accurate estimate of the mean ratio for that flare. The skewed distribution means the calculated ratio from a small number of samples would more likely be biased low, potentially missing infrequent bursts of high BC production. For any single measurement, the most likely result would be the mode, which underestimates the mean ratio by ∼13 % for either fuel mixture. Although the present experiments considered ratios (H2O was more accurately measured than CO2 in the present setup), ratios are expected to follow the same trends, since for any hydrocarbon fuel (CxHy) the major combustion products and expected end states are H2O and CO2, which are associated with the majority of the energy release from the flame (e.g. Turns, 2000). This suggests that a 13 % underestimate of the ratio would yield a 13 % underestimate of a BC emission factor. More generally, however, the present results show how the broad variation in the ratios of instantaneous path-averaged species concentrations could introduce substantial additional uncertainty to measurements that assume these ratios are fixed.
A simple bootstrapping test was conducted to further consider the implications of undersampling. If we assume that some path-averaging measurement technique is sampling from either of the ratio distributions in Fig. 8, these distributions can be randomly sampled (with replacement) to derive statistical criteria for the minimum sample size required for a target level of accuracy. Histograms of the relative error of the calculated mean ratio for a range of sample sizes (each derived using 10 000 bootstrap trials) are plotted in Fig. 9. As should be expected, the potential error rapidly decreases as the sample size is increased. However, to be within a 10 % error of the true mean ratio, the results of Fig. 9 suggest ∼100 measurements would be required. For a measurement limited to five samples, relative errors between −34 % and +35 % could be expected (95 % confidence limits of the distribution), with the most likely outcome (modes of Fig. 9) being a 1 %–5 % underestimate of the true value. With only two samples, this range of likely errors grows to −55 % to +53 %, with the modes dropping to 2.5 %–7.5 % below the mean.
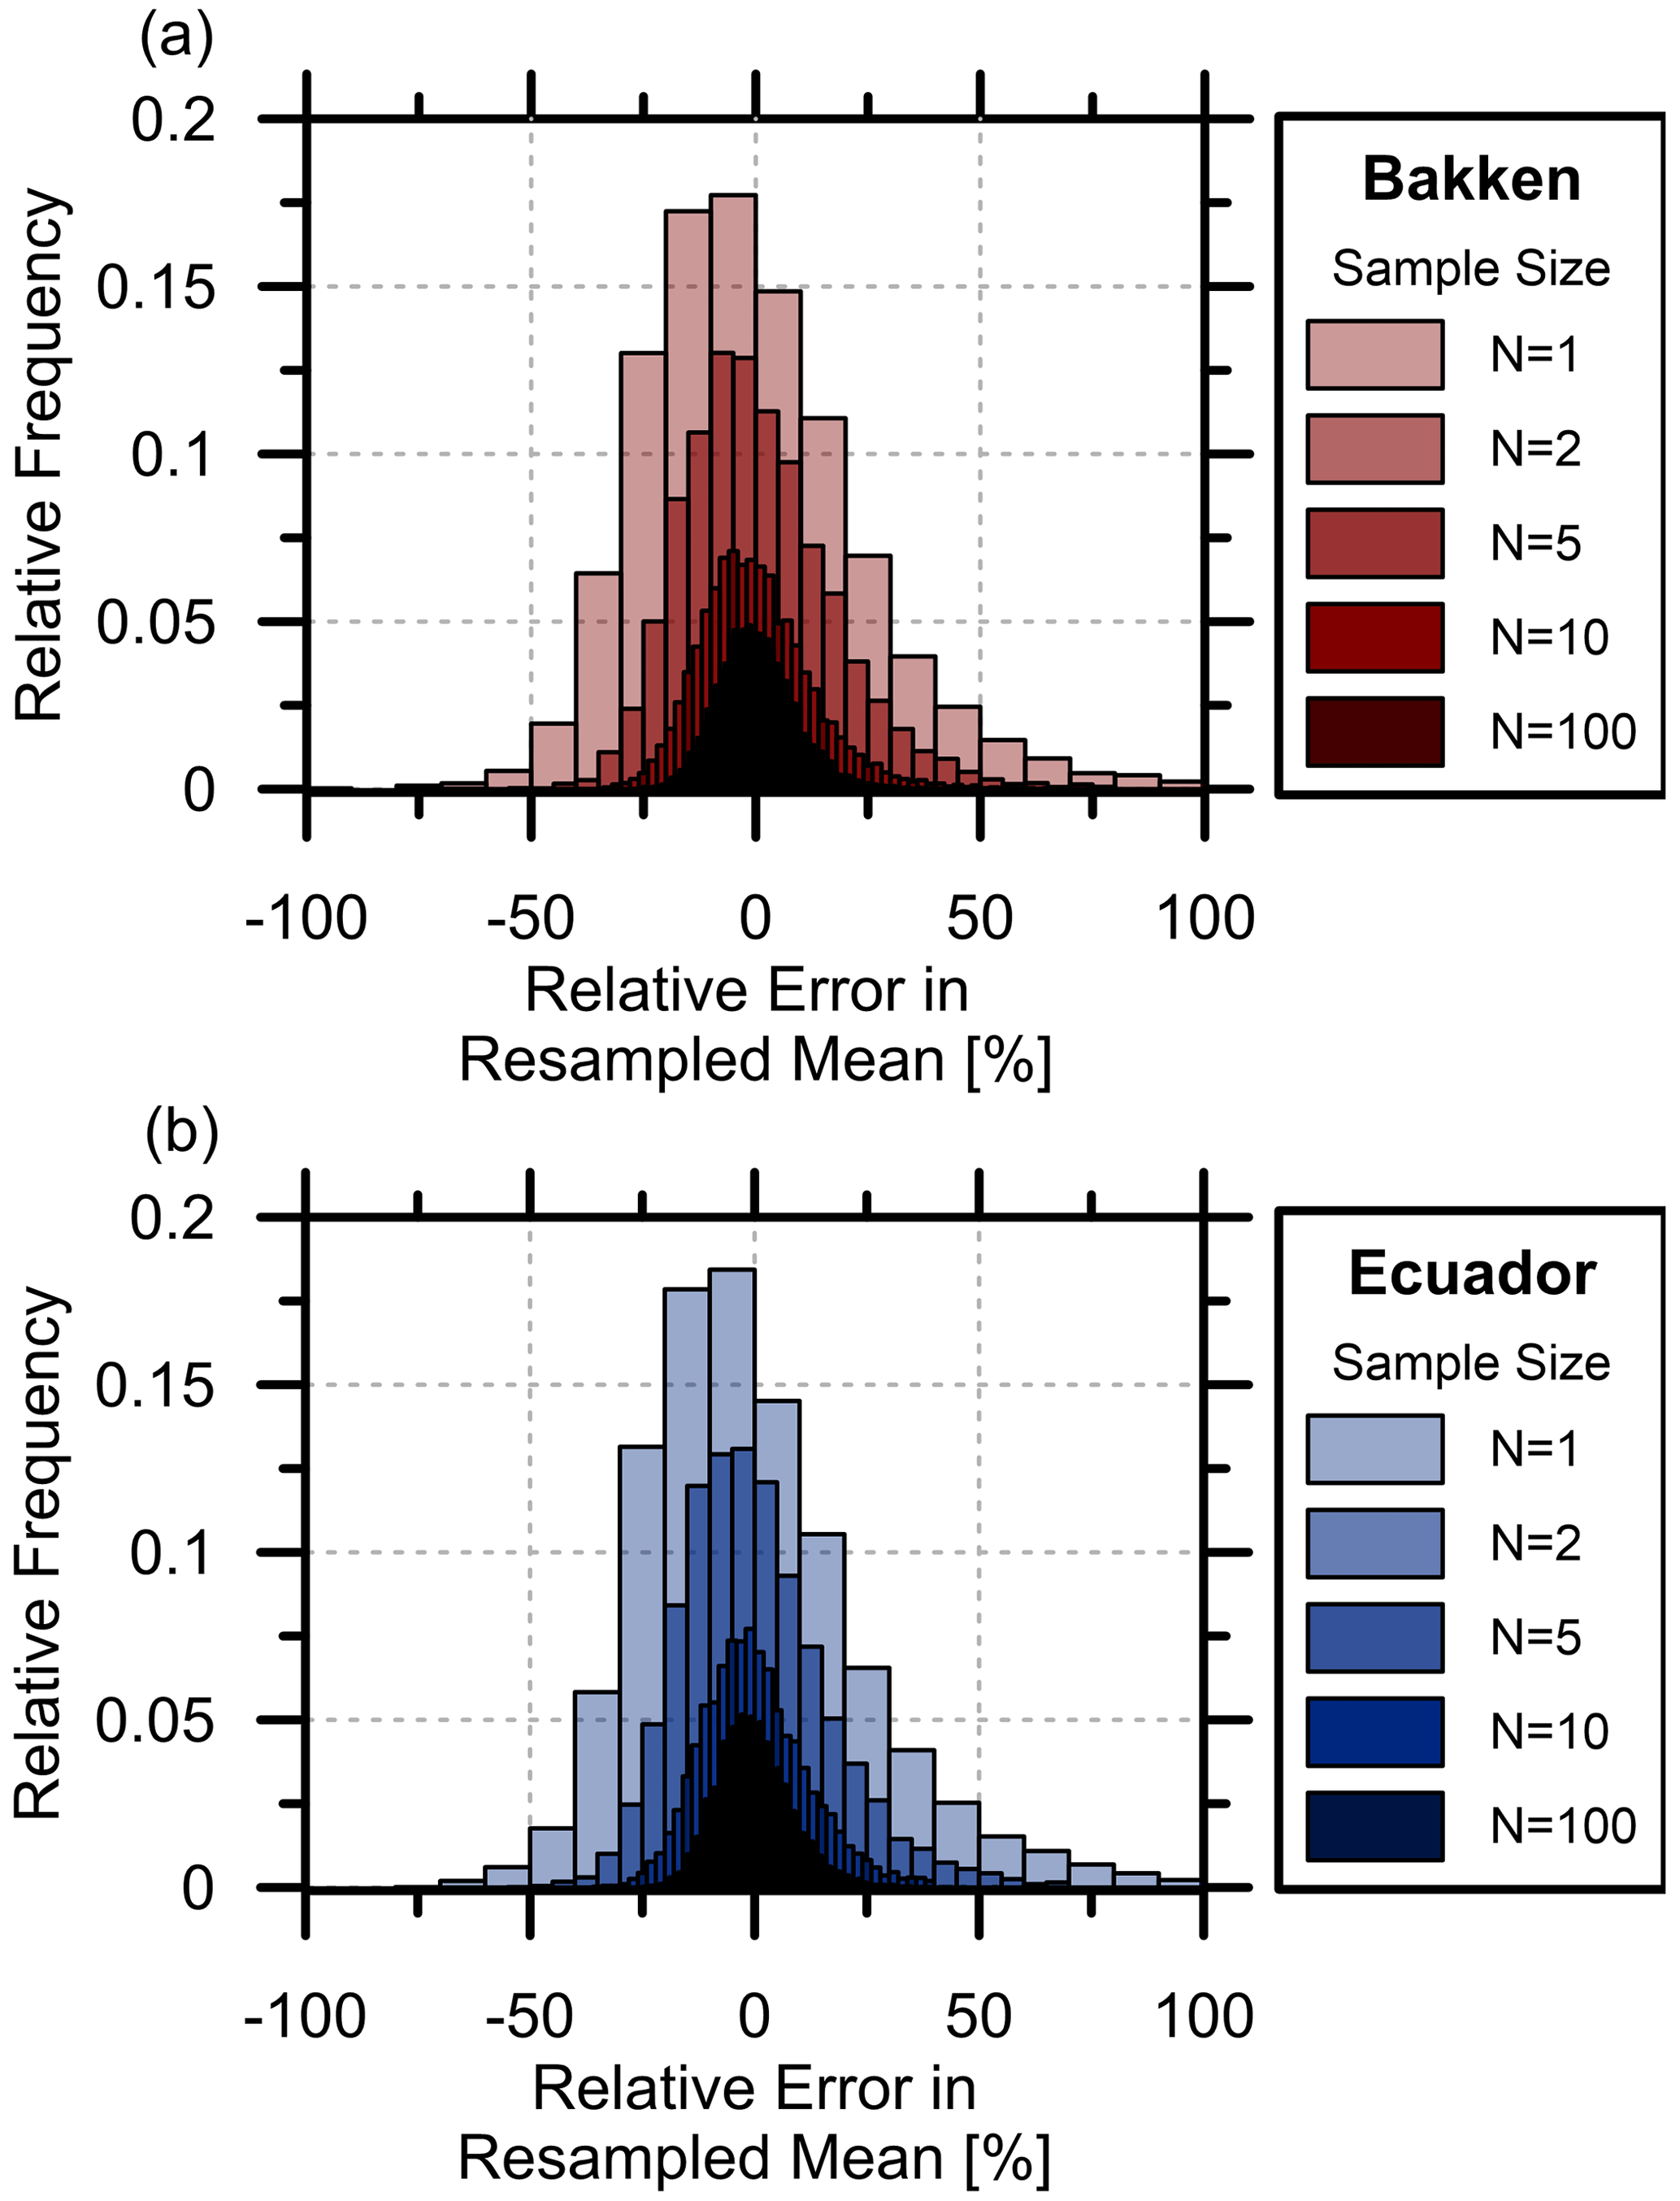
Figure 9Distributions of sample mean for sample sets of size N from ratio results of the (a) Bakken and (b) Ecuador flare tests.
It should be reiterated that these results are based on path-averaged measurements through vertical flare plumes. Different measurement techniques can be expected to be more or less susceptible to these issues, but in general shorter path measurements (e.g. extractive samples from fixed probes or stationary drones) are expected to observe greater variability in species correlations without the benefit of long path averages to smooth out relative species variations. Indeed, time-averaged measurements of the compositional structure of flare plumes in a wind tunnel show that spatial variation in relative species concentrations (specifically methane and CO2) can be very large and on their own (i.e. ignoring additional temporal effects) are sufficient to produce substantial variations in the locally calculated carbon conversion efficiency at different points within the plume (Poudenx, 2000). This suggests that spatial coverage is necessary, irrespective of the observed variations in BC production, to ensure representative measurements are obtained. This may be less of an issue in full-sized aircraft sampling approaches (e.g. Gvakharia et al., 2017; Weyant et al., 2016), which would be expected to measure a much larger volume than the presented technique; however, the required data averaging to obtain representative results will depend on the relative plume volumes sampled at that downstream measurement position, sampling duration, and how the technique interrogates the plume (e.g. stationary point or line-of-sight, transect downwind or crosswind, among others).
More generally, the influence of turbulent crosswind on the flare plume could be expected to exacerbate the presently observed temporal variations in relative species concentrations. While turbulent plume motion could have beneficial mixing effects for some measurement approaches, this is not necessarily the case. High-frequency methane sampling measurements (Johnson et al., 2001) and flow visualization experiments (Johnson and Kostiuk, 2002) of flares in crossflow have also shown that methane can be emitted as intermittent bursts below the lee-side of a deflected flare flame, where these bursts are separated from the main CO2-rich plume. These observations imply that CO2 and unburnt fuel (methane) may be uncorrelated and that issues of species correlation extend beyond BC production, with an overall effect of further hindering field measurements. Above all, the present results suggest a need to carefully consider convergence criteria when designing and deploying measurement techniques that rely on an implicit assumption about temporally and spatially constant ratios of plume species and a need for caution when interpreting measurements based on limited numbers of short-duration samples.
Measurements from a novel tunable diode laser-based system have shown that path-averaged black carbon (BC) and H2O can vary independently and are not necessarily well correlated in plumes of vertical, turbulent, or buoyancy-driven flares. In particular, the observed variability in species ratios, which was well beyond measurement uncertainty, reveals that the species ratio distributions are skewed towards higher values, suggesting that BC emissions are skewed by intermittent bursts of high BC production not well correlated with H2O. These results demonstrate that the common assumption of correlated or well-mixed combustion species in the plume is not necessarily valid and that molar- or mass-balance approaches relying on these assumptions may be subject to potentially large added uncertainties. The positive skewness of the ratio suggests that field measurement techniques relying on a limited number of samples, short time intervals, or limited spatial coverage are most likely to be biased low and therefore may be prone to underestimating BC emission factors; the significance of this effect can be expected to vary among different sampling approaches. The present results considered path-averaged samples through the near-field of a turbulent plume in the absence of crosswind. The species ratio variability would likely be exacerbated by shorter measurement paths (e.g. stationary point samples) and crosswind effects but should also be mitigated by sampling larger fractions of the plume cross section. Most importantly, the bootstrap analysis of the present results also demonstrates how issues of bias and uncertainty can be readily avoided with sufficient sample size. These results provide initial guidance for developing protocols for future field experiments using similar path-averaged measurement approaches, while demonstrating the fundamental importance of convergence testing within any technique that makes explicit or implicit assumptions about the stability of species ratios in the plume. This is important since species ratio variability represents an added source of uncertainty beyond any inherent variability in emission rates for this class of technique.
A1 Spectral profile-fitting simulations
The performance of the optical measurement approach was first proven using large-eddy simulation (LES) datasets of methane-rich flares in crossflow described by Conrad et al. (2020). These simulations were of a 10 m tall, 102.3 mm diameter vertical flare stack in crosswind and were designed to yield data representative of gas flaring operations in Alberta, Canada. The simulated flare burned natural gas (90.53 % methane, 3.73 % ethane, 0.34 % propane, 1.54 % CO2, and 3.86 % N2) at a stack exit velocity of 4 m s−1. The present study considered two of the crosswind cases, 1.11 and 7.78 m s−1, corresponding to the 10th and 95th percentile wind speeds (simulations I and IV) in Conrad et al. (2020). Because the available simulation domain was larger than the flare plumes produced at the Carleton University Flare Facility, the spatial domain was scaled down by a factor of 2 (5 cm grid resolution was assigned to be 2.5 cm), noting that this would only increase the intensity of the variation along the line-of-sight when testing the performance of the analysis algorithm.
Instantaneous line-of-sight (LOS) datasets from many different chords through the simulated flare plume were used to obtain a wide variety of test conditions. These included samples in or near the flare where peak temperatures were high and combustion species were localized, as well as far-field samples where gas mixing had drastically reduced peak temperatures and combustion species were more dispersed along the LOS. The extracted LOS datasets from the flare simulations were 150 cm long, the intended path length of the experimental setup, and were 60 nodes across. Theoretically measured H2O spectra (i.e. the theoretical spectra reaching a detector after passing through the simulated plume domain) were generated by taking the product of the transmissivity through each node on the LOS, computed using the H2O volume fraction and temperature and assuming a Lorentz lineshape. Because the flare simulations did not include detailed aerosol modelling, the spatial distributions of black carbon volume fraction were produced by scaling the combustion-derived CO2 volume fraction by a factor of [–] to produce the optical attenuation values between 0 and 5 % expected in laboratory experiments, similar to Conrad et al. (2020). It was not important that the absolute BC volume fractions be accurate, only that the distribution be representative of what might be found in a flare to facilitate testing of the analysis techniques. Black carbon attenuation along a LOS was calculated as the product of the BC attenuation at each node, knowing the local BC volume fraction, and assuming BC optical properties from the literature. BC extinction coefficients, , were assumed for each measurement wavelength using complex index of refraction values calculated from Chang and Charalampopoulos (1990), and a BC scattering-to-absorption ratio estimated from Migliorini et al. (2011). The theoretical 1428 nm detector signal was a product of both BC attenuation and H2O spectral absorption, whereas the 1654 nm signal was affected by BC attenuation only. Each of the calculated attenuation signals were intentionally corrupted with Gaussian-distributed noise with a standard deviation of [–]. The level of added noise used was conservatively selected to be 50 % larger than that measured during tests of the experimental system. The ability of the analysis algorithm to correctly reproduce the path-averaged concentration from the noise-affected integrated signals was then quantitatively tested.
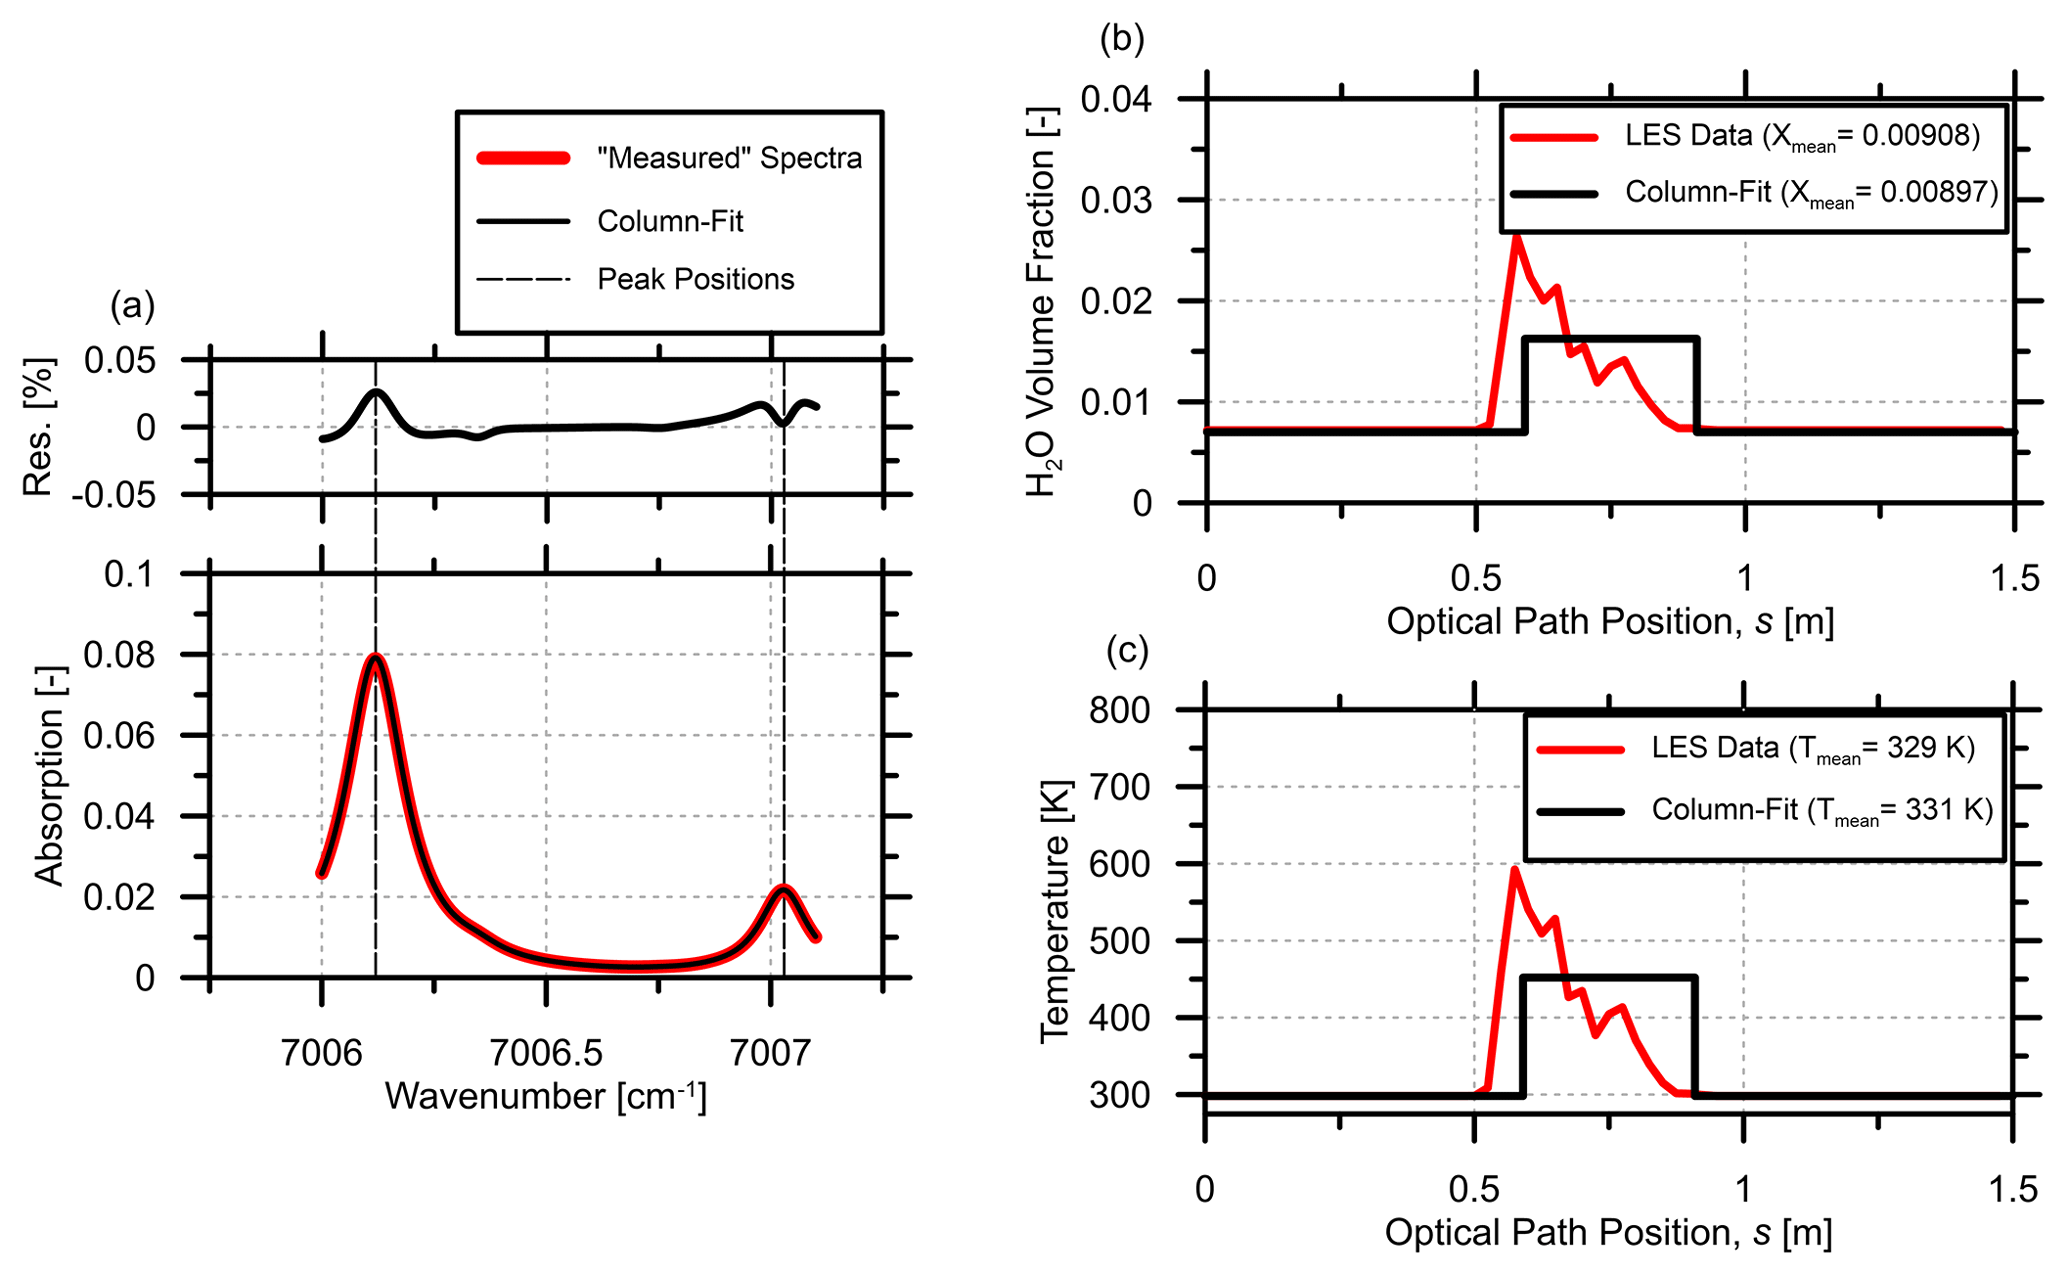
Figure A1Sample profile-fitting result where (a) compares the column distribution spectra to the simulated measured spectra, and (b) and (c) compare the column distribution profiles with LES data for volume fraction and temperature, respectively.
In the ∼8000 instantaneous simulation results, true path-averaged BC volume fraction results ranged from 0 to 15 ppb and were correctly estimated to within 0.02 ppb in all cases. The error in instantaneous path-averaged BC volume fraction estimates was solely due to precision error caused by the corrupting noise. Path-averaged BC volume fraction estimates were then used to isolate the H2O spectral absorption signal, as discussed in Sect. 3.2. The isolated H2O signals were fitted with theoretical column distributions of H2O volume fraction and temperature using a Nelder–Mead optimization scheme; the final calculated path-average H2O fraction and temperature were then compared to the known path-averages from the LES simulations. Figure A1a shows a typical result of the column distribution fit, plotting the theoretical spectral absorption fitted to the simulated measured signal. Figure A1b and c compare the fitted column distributions of H2O volume fraction and temperature with the spatially distributed LES data used to generate the measured signal. As indicated in the legend of Fig. A1b, the path-averaged volume fraction in this example was estimated to within 1.2 % of the true path average. Similarly, the effective mean temperature was within 2 K of the true path-averaged value in Fig. A1c.
By compiling all individual results, a trend of spectral fitting performance with peak gas temperature along the LOS for each measurement was observed. Figure A2 shows the relative error in path-averaged H2O as a function of the peak gas temperature. The error in H2O volume fraction appears to increase significantly with peak temperatures above roughly 800 K, which occurs in approximately 5 % of the simulation results. This is likely due to the divergence of the transition linestrengths from near-linear beyond the range of 300 to 800 K. In practice, 95 % of simulated measurements with peak LOS temperatures above 800 K produced a path-averaged temperature above 315 K, and the median path-averaged temperature was 351 K. By comparison, 95 % of the experimental path-averaged temperatures were below 334 and 333 K for Bakken and Ecuador tests, respectively. This gives some indication that peak temperatures in the experiment were not in excess of 800 K, although these results are difficult to compare directly. However, as previously discussed, thermocouple measurements in plumes downstream of turbulent jet diffusion flames by Poudenx et al. (2004) suggest that temperatures do not typically exceed 600 K. Based on these results, the peak temperatures in the measured region of the present plumes are not expected exceed 800 K. Removing spectral fitting results from in-flame and with peak LOS temperatures in excess of 800 K, 95 % of the ∼7500 path-averaged H2O volume fraction results were estimated to within ±3.2 %, with a mean relative error of 0.32 %; the maximum relative error was 6.3 %.
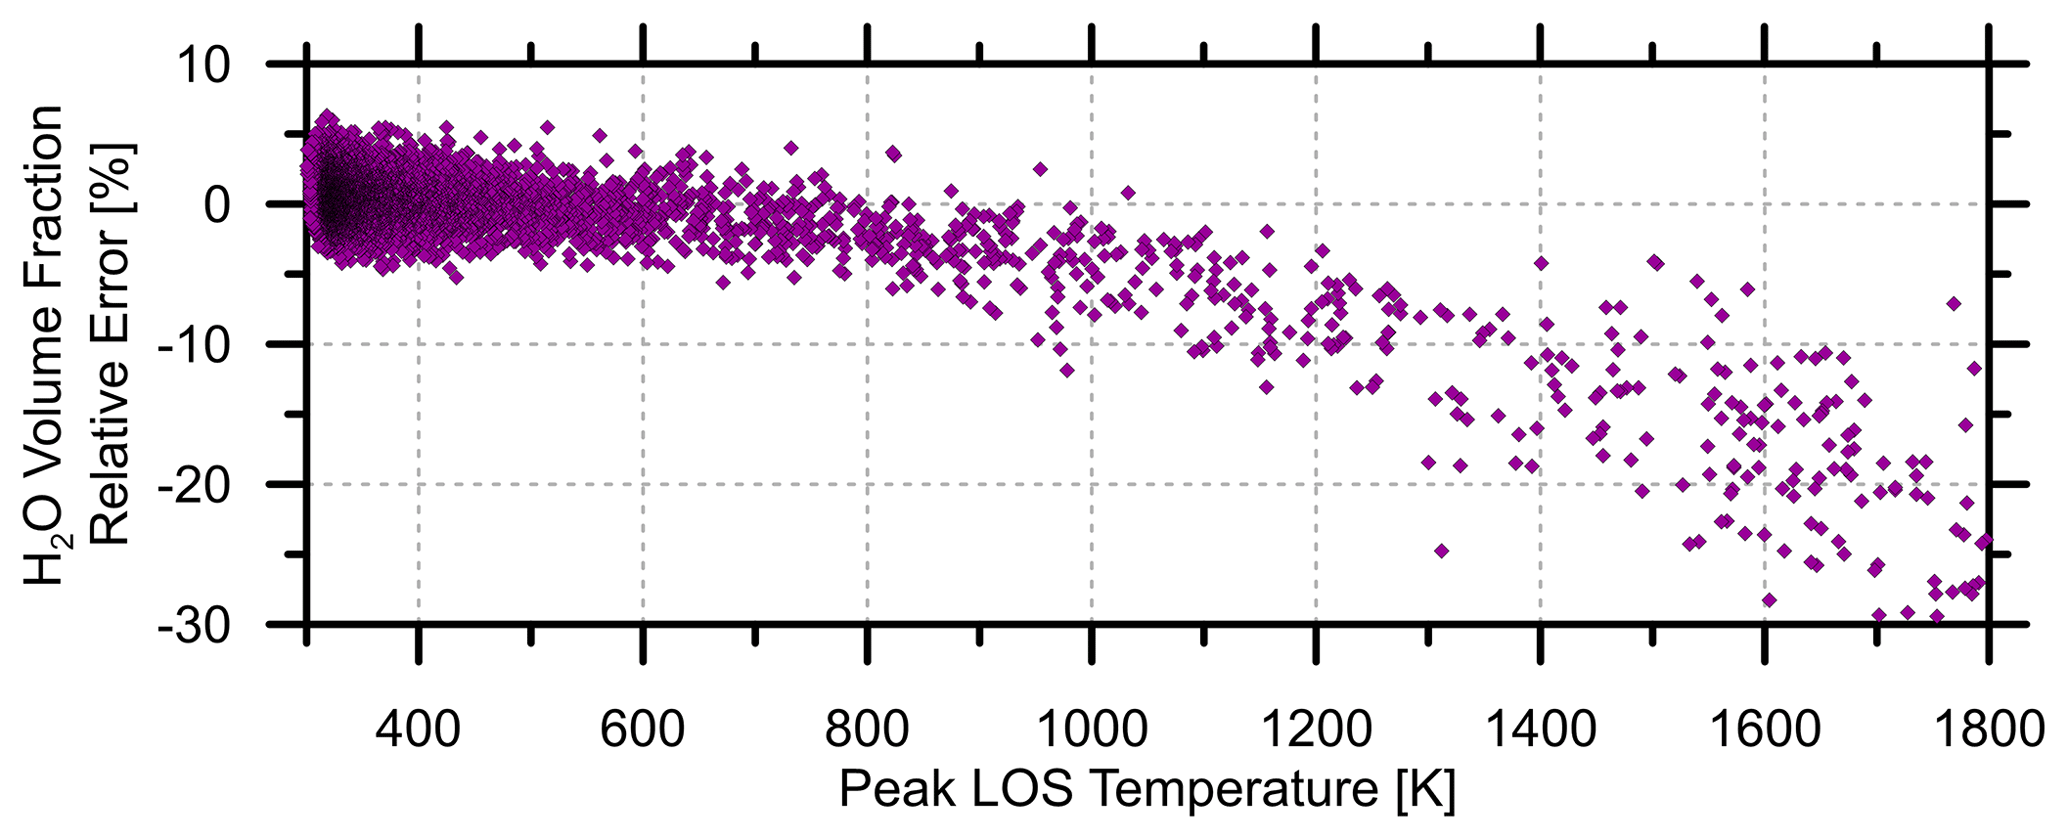
Figure A2Relative error of H2O volume fraction results from simulated measured data compared to peak LOS temperature for each result.

Figure A3Light attenuation due to beam steering and inferred black carbon (BC) volume fraction (VF) presence due to the attenuation.
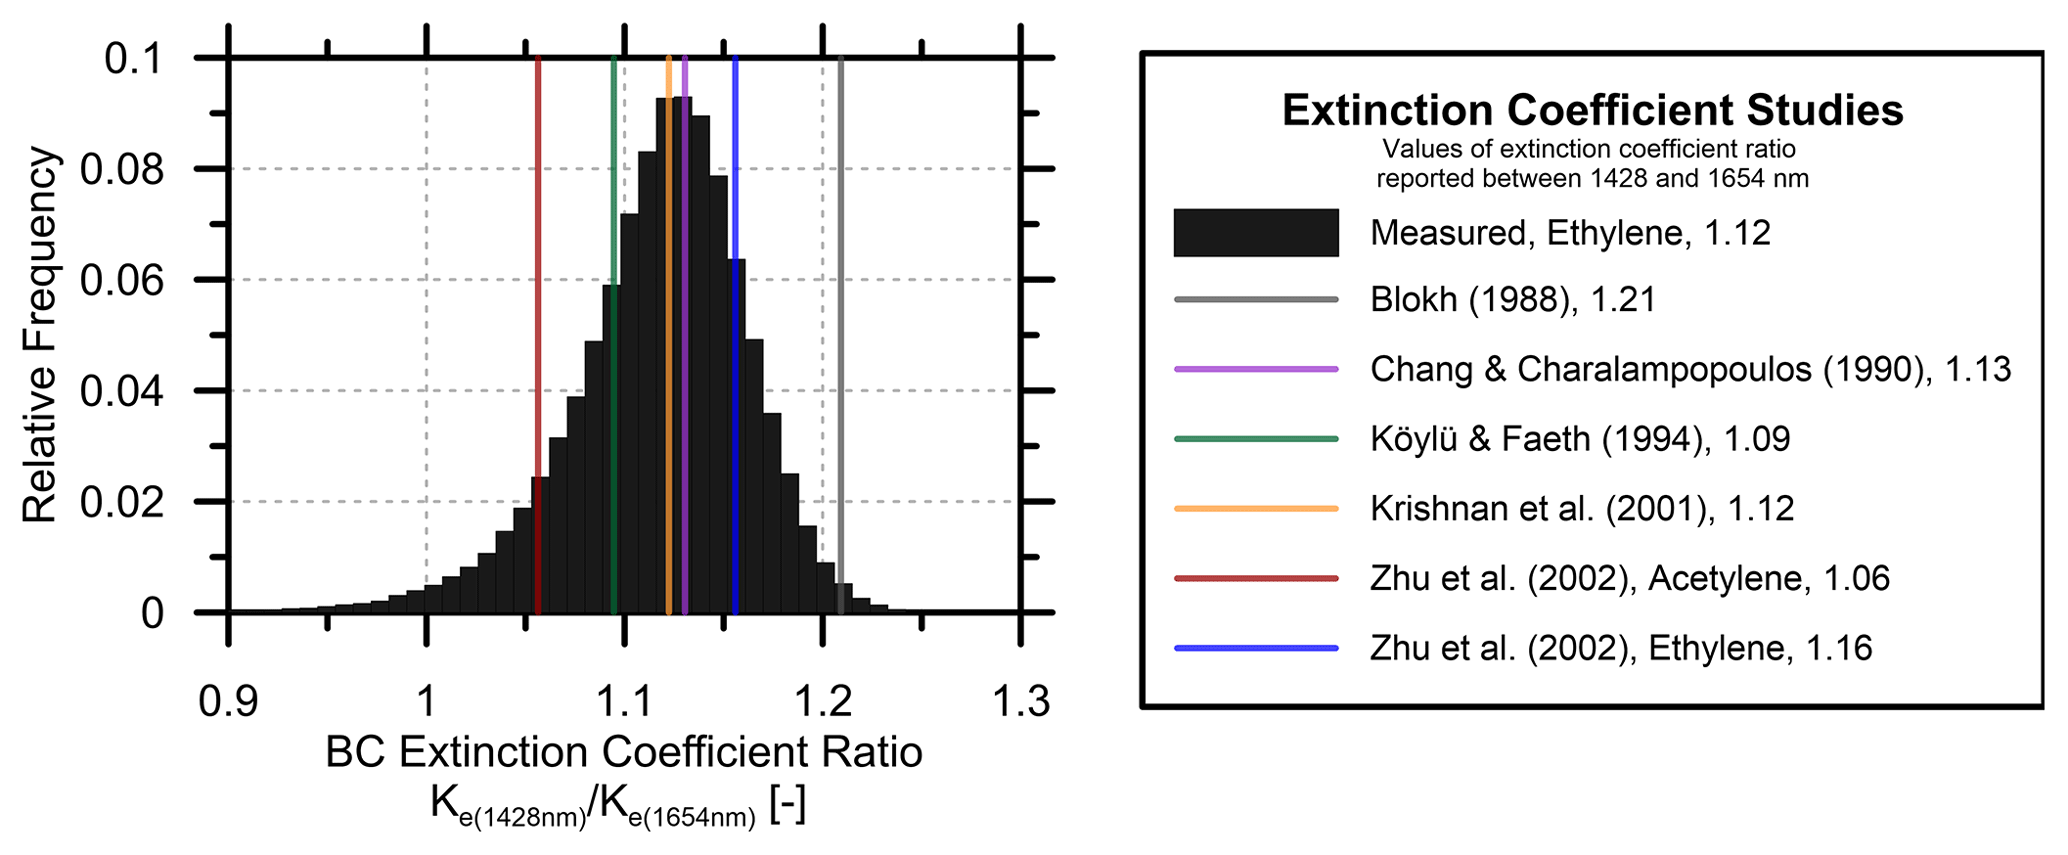
Figure A4Distribution of estimated Ke ratio between 1428 and 1654 nm during ethylene flare test. The measured mean BC extinction coefficient ratio was 1.12 (standard error of the mean of ).
An additional potential source of measurement error could arise due to temporal changes in the individual spectral signatures within the 5 ms (200 Hz) time resolution of the H2O measurement. Because the available LES data did not have sufficient time resolution to investigate this issue, experimentally measured time-resolved BC attenuation data were instead used to produce synthetic time-varying H2O volume fraction data to estimate effects of temporal averaging of spectral signals. As discussed further in Seymour (2019), the results suggest a mean relative error of 0.28 % for path-averaged H2O volume fractions, where 95 % of measurements were within ±5.1 %. Assuming the temporal and spatial error estimated for path-averaged H2O volume fraction are independent, the values were combined in quadrature that resulted in a mean error of 0.63 %, with 95 % of measurements falling within ±8.1 %.
A2 Beam steering effects on measurements
Although the optical system was meticulously aligned prior to each experiment and simulations by Conrad et al. (2020) suggest beam steering through turbulent flare plumes should not exceed 1 mrad, beam steering effects in the present experiments cannot be completely discounted because the location and orientation of the highest temperature gradients is invariably unknown. Because beam steering would result in a loss or gain of light into the detectors, it would necessarily be interpreted as fluctuations in plume transmissivity and therefore BC presence. To experimentally quantify light loss due to beam steering, tests were completed on a flare burning pure hydrogen at 150 SLPM on the 25.4 mm diameter burner. The 1654 nm laser was then used to acquire transmissivity measurements in the absence of BC. A histogram of laser signal attenuation, and apparent BC presence, for a 2 min period is shown in Fig. A3. In this hydrogen flare test, where no BC is produced, the system observes an apparent path-averaged mean BC volume fraction of (i.e. centred about zero) with a standard deviation of . By comparison, the Bakken and Ecuador tests showed variations of and centred about mean values of and , respectively. Therefore, 95 % of the measurements presented in Sect. 4 for Bakken and Ecuador flare gas have a BC signal-to-noise ratio (SNR) of at least 4 times the H2 standard deviation; the median SNR is
Although the two laser beams were collinear through the heated plume, they were ultimately focused onto two separate targets, meaning that it was still possible to have some relative differences in the signals due to beam steering. To bound the potential impact of this effect, attenuation differences between the two laser signals were recorded through plumes of a hydrogen flare, whose adiabatic flame temperature (2379 K) exceeded that of all other flare tests, providing an upper limit to the magnitudes of temperature gradient-driven beam steering. The 1428 nm laser was tuned to a minimum H2O absorption wavelength of 7009.25 cm−1 (1426.69 nm), where it was estimated that the H2O fluctuations would not contribute absorption magnitudes higher than 0.03 %, and attenuation data were recorded for both laser lines. The differences in attenuation magnitude between synchronous points from each laser were centred about zero (mean of 0.007 %) with a standard deviation of 0.16 % suggesting that 95 % of measurements had attenuation differences of less than 0.31 %. For reference, the main peak of interest to be measured varied between 2 % and 6 % absorption, i.e. between 6.5 and 20 times higher signal amplitude in all cases. Although this will cause some distortion in the H2O absorption spectra, the profile-fitting algorithm with goodness-of-fit filter was able to identify cases where beam steering produced poor fitting results, as explained in Sect. A4 below.
Table A1Summary of black carbon extinction coefficient measurements with extinction coefficient ratios (ECRs) calculated for the wavelengths selected for measurement.

a Determined from complex index of refraction
relations, assuming BC scatter-to-absorption ratio of 0.02.
b
Calculated from interpolation of extinction data.
c BC ECR between
1565 and 1314 nm.
A3 Black carbon optical property ratio measurements
As discussed in Sect. 3.2, a ratio of black carbon (BC) extinction coefficient () values at the two laser wavelengths was required to isolate the H2O absorption spectra in the presence of broadband BC attenuation. Since there was disagreement in the literature about BC optical properties in the near infrared, the ratio of optical properties used in the present analysis was measured experimentally. Using a heavily sooting ethylene flare at 50 SLPM on the 76.2 mm diameter burner attenuation measurements were recorded at the two laser wavelengths (1654 and 1428 nm). The 1428 nm laser was tuned off of detectable H2O absorption peaks to solely measure BC attenuation through the plume. The extinction coefficient ratio (ECR) between the measurement wavelengths was calculated for conditions with at least 5 % attenuation along the path (giving a SNR of >30) using Eq. (1) and the experimental data are shown in Fig. A4 overlaid with values calculated from the literature. The mean BC extinction coefficient ratio () was 1.12 with a standard error of the mean of . The resulting ECR estimate is bounded by values calculated from extinction experiments in the literature (Table A1) and most closely resembles the result calculated using data from Krishnan et al. (2001). This necessary result permits the isolation of spectral H2O absorption in subsequent measurements.
A4 ratio data filtering
As noted in Sect. 3.4, experimental data were filtered based on the closeness of fit between the measured H2O spectra and theoretical spectra produced by the Nelder–Mead fitting algorithm, as characterized by the scalar sum-of-squared errors (SSE). The purpose of this filtering was to reduce uncertainty by removing cases where the spatial or temporal changes in H2O volume fraction and/or temperature rendered spectra difficult to describe with a column distribution. As argued in the main text, a conservative SSE cut-off of 10−4 [–] was applied, following an investigation of the effects of the chosen SSE cut-off on distributions of the measured ratio.
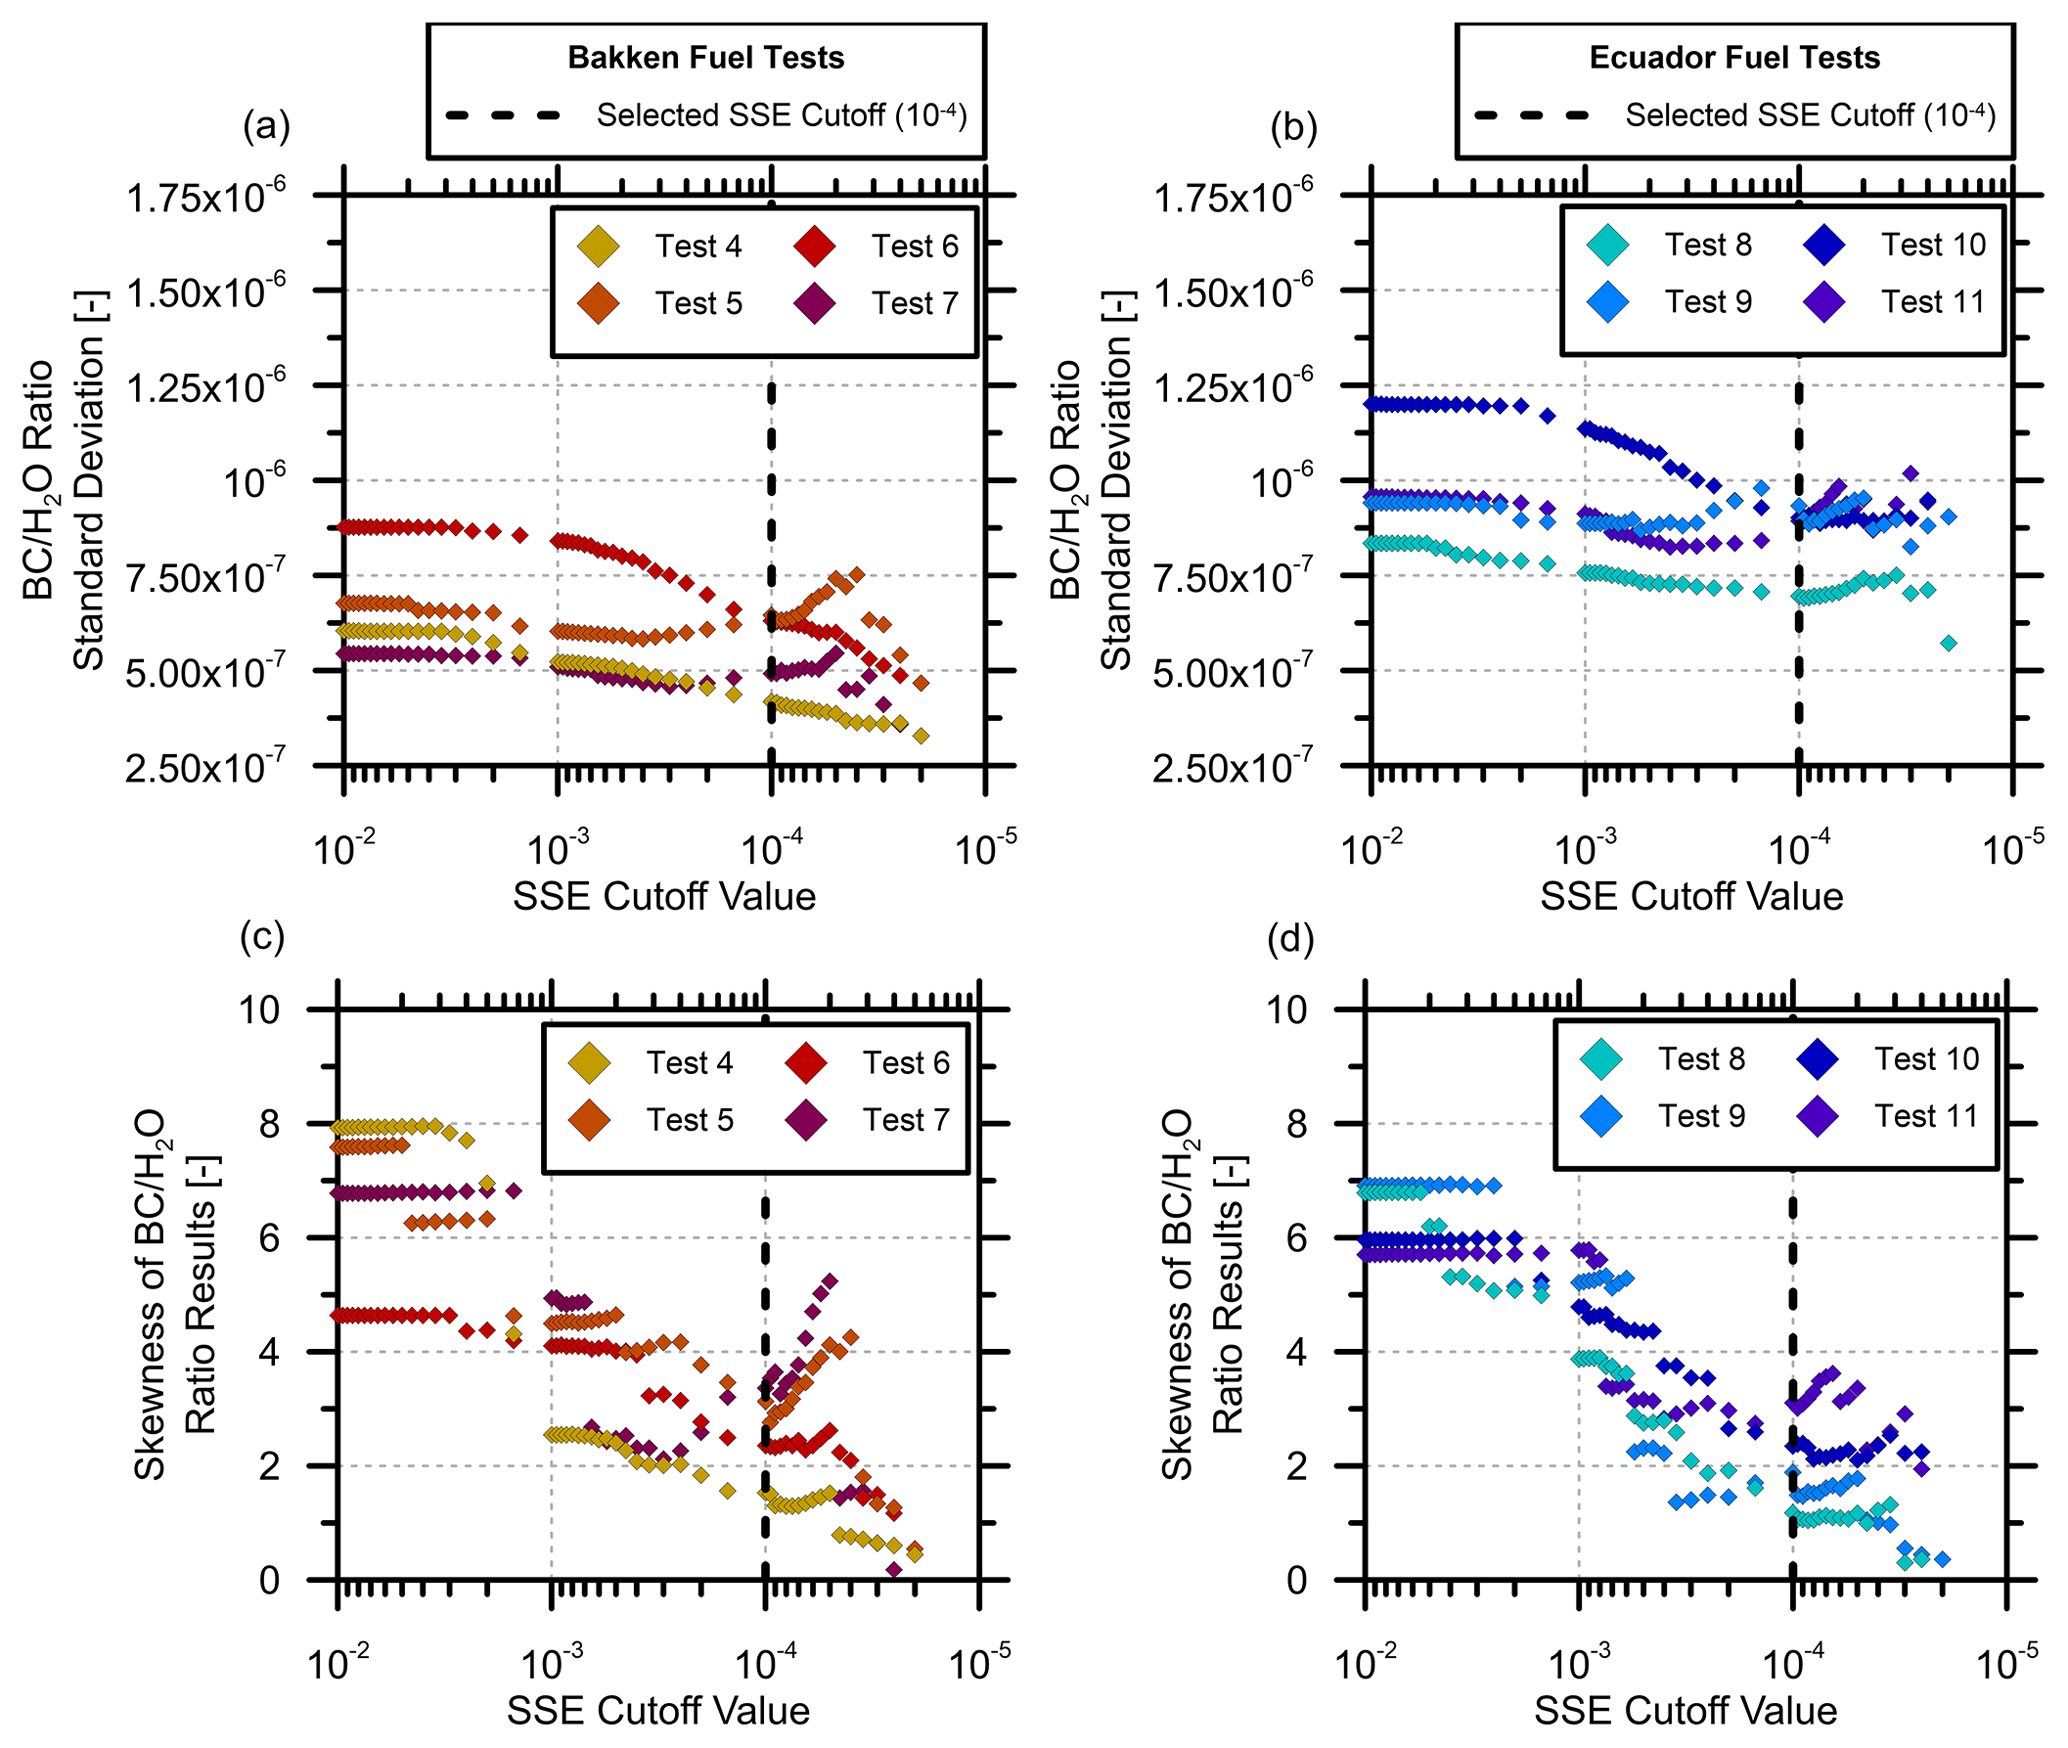
Figure A5SSE-filtering effect on ratio statistics. Panels (a, b) show standard deviation for Bakken and Ecuador fuels, and panels (c, d) indicate skewness of ratio.
The maximum SSE cut-off of 10−4 [–] was selected, corresponding to the largest SSE value measured during controlled H2O vapour measurements in an optical flow-through cell (Seymour, 2019). This implied an expected upper-bound error for fitting of real-world spectra with theory. Subsequent analysis revealed that this choice is conservative, such that raising this filter threshold only increased the range of measured ratios and heightened the skewness of the distribution. This was demonstrated by reprocessing the experimental datasets with a range of SSE filter values and recomputing the ratio variability and skewness. Figure A5 shows the filtering effect on standard deviation (a, b) and skewness (c, d) for the two fuel compositions. Less restrictive SSE filter settings only increase the variability and skewness of the ratio data.
A5 Upper-bound potential influence of uncertainty on ratio distributions
To bound the potential influence of measurement uncertainty on the measured variations in the ratio, a simple Monte Carlo simulation was conducted. As described in Sect. A1, the H2O measurement had a mean relative error of 0.63 % with a standard deviation of 4.1 %; for BC, the mean relative error was 0.007 %, and the standard deviation was 0.16 %. In Sect. A2, hydrogen flare experiments suggest beam steering produces an apparent path-averaged mean BC volume fraction of no more than with a standard deviation of . Random draws of these experimentally determined measurement uncertainties were independently applied to the median BC and H2O volume fraction results from the Bakken and Ecuador datasets. The distribution of ratios about the median ratio (i.e. the distribution of results attributable to measurement uncertainty alone) were then plotted and overlaid on the experimental results for the Bakken and Ecuador fuel mixtures, as shown in Fig. A6. It should be noted that by assuming measurement uncertainties on the BC and H2O signals are completely uncorrelated, this approach gives a conservative upper bound on the potential effect of uncertainty on the ratio measurement.
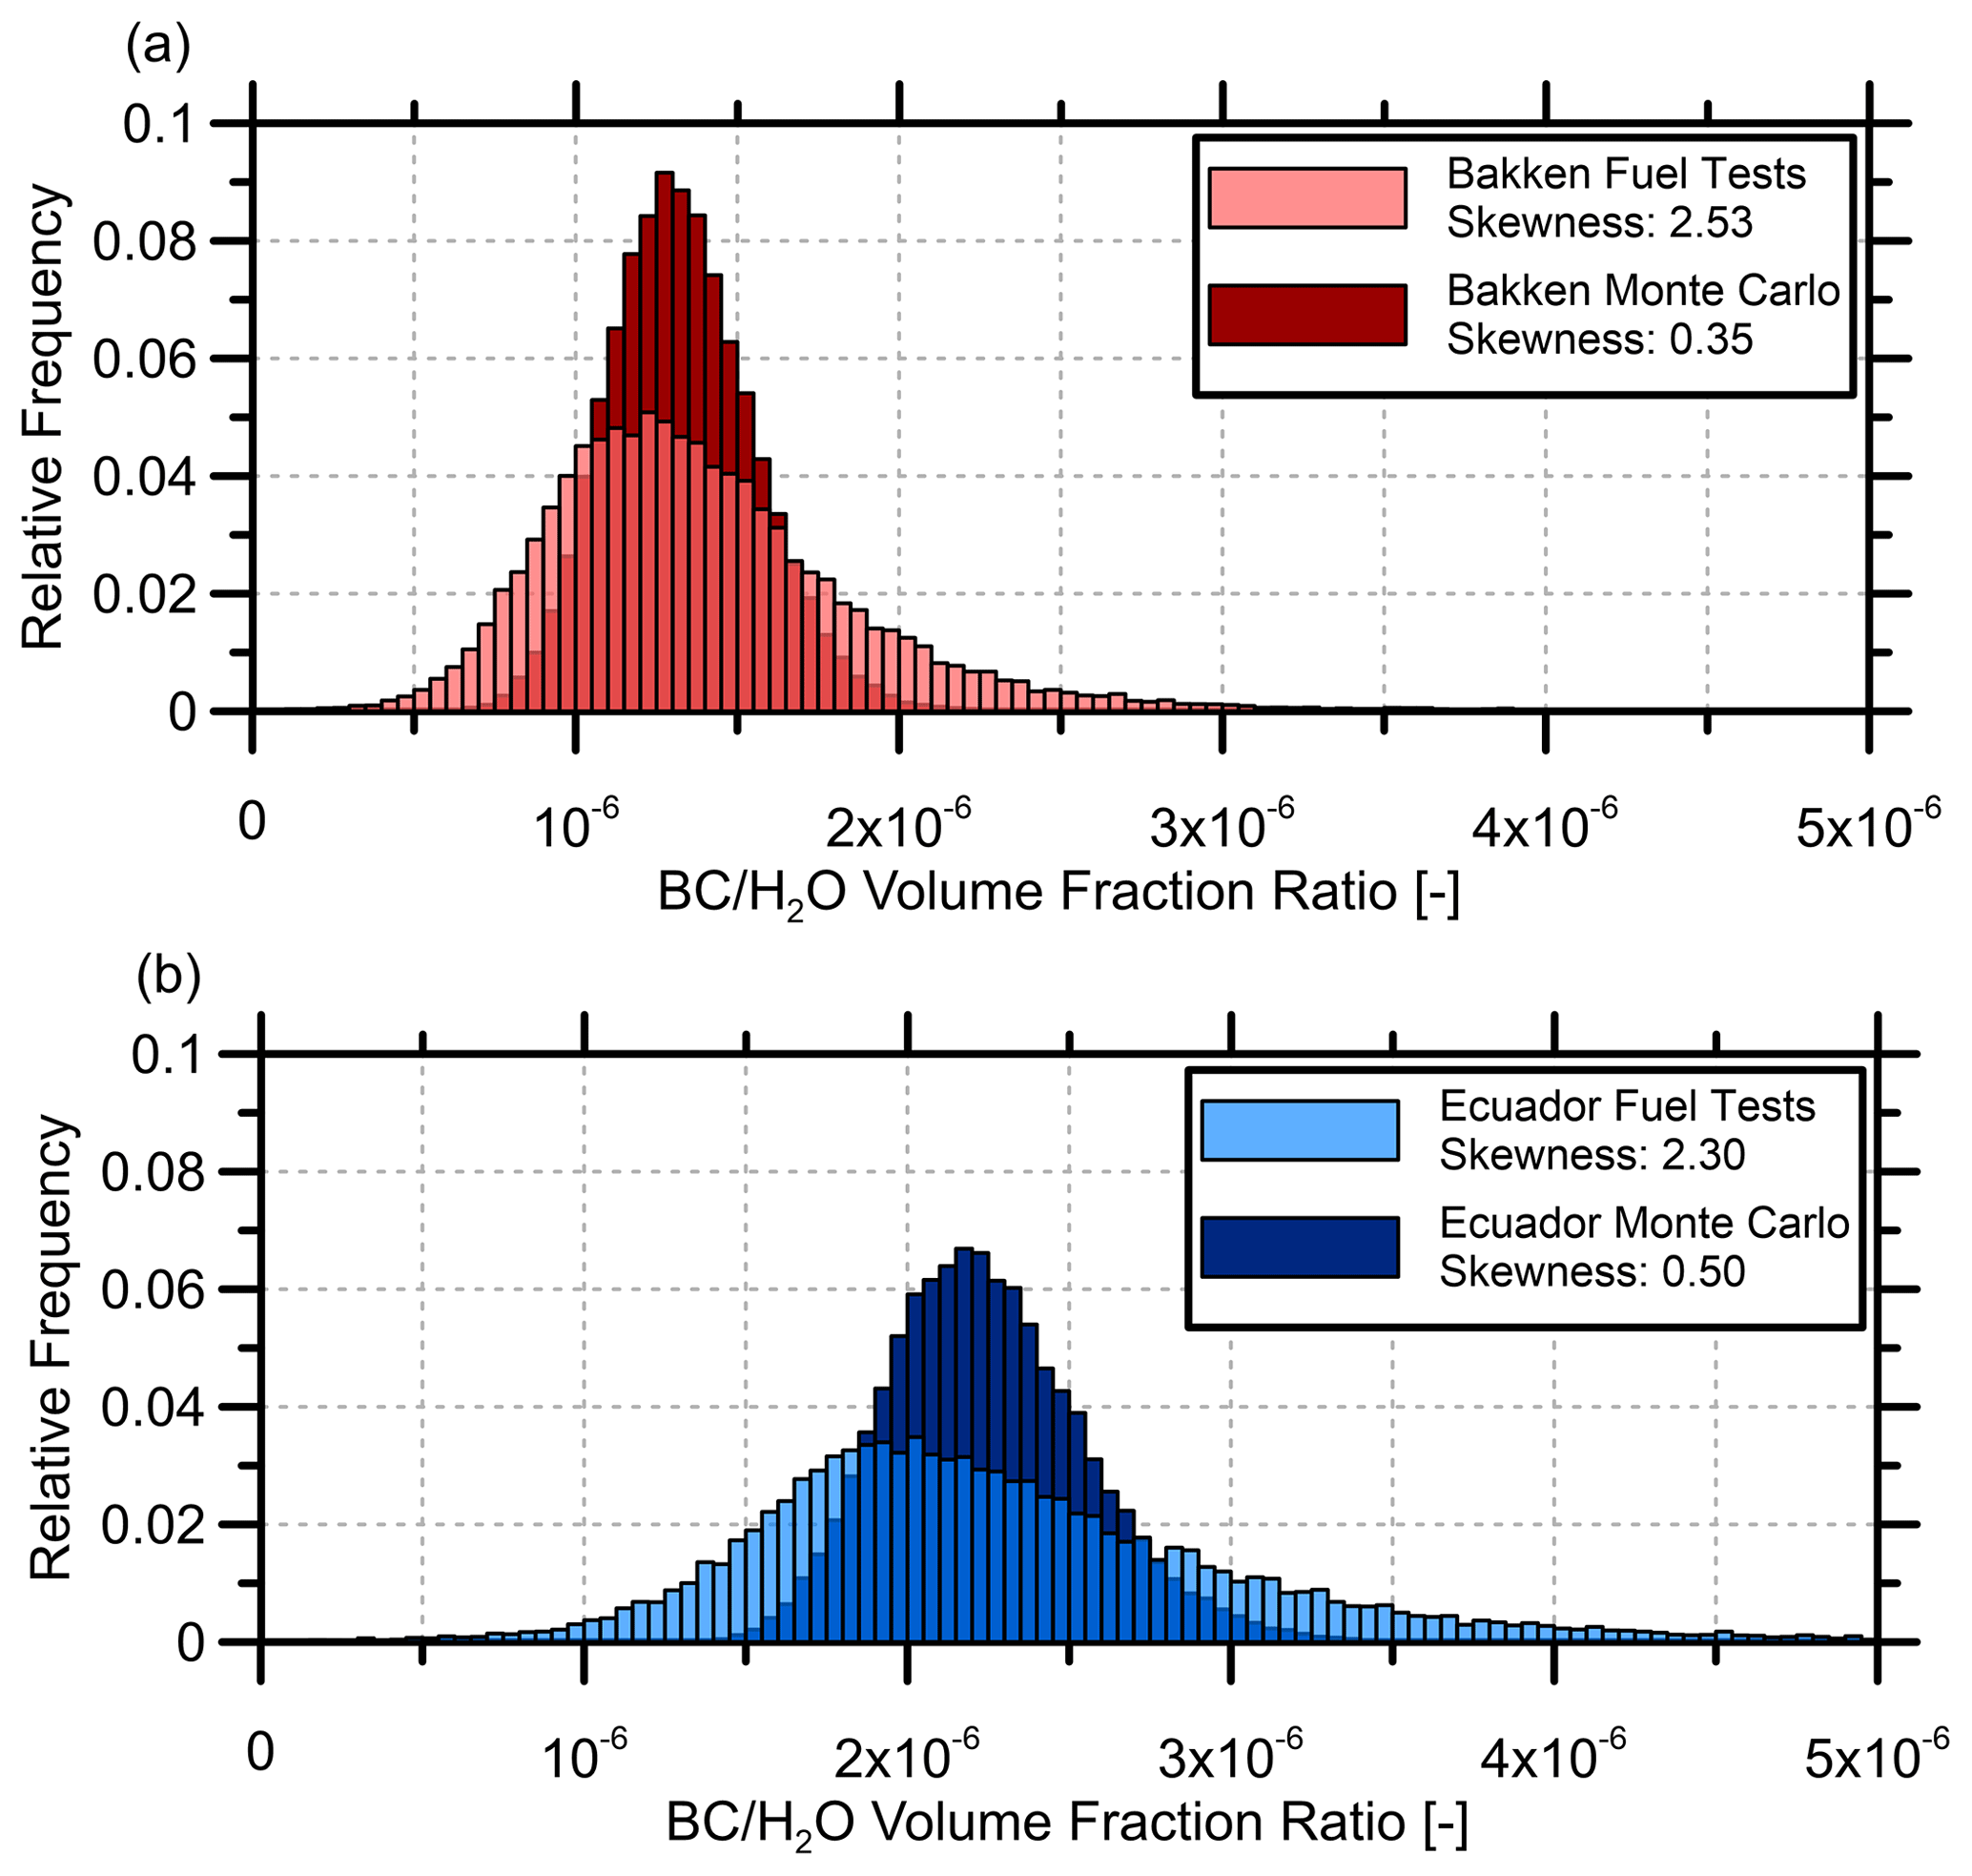
Figure A6Distributions of black carbon (BC)H2O volume fraction ratios from Monte Carlo simulations with error related to beam steering, system noise, and spatial- and temporal-averaging.
As summarized in Table 2 of the main text, the Monte Carlo results suggest that the maximum variation in the measured ratio that could be attributable to uncertainty had a standard deviation of and and skewness of 0.35 and 0.50 for the Bakken and Ecuador mixture experiments, respectively. The Bakken and Ecuador experiments exceeded the Monte Carlo standard deviations by factors of 2.4 and 2.8 and skewness by factors of 7.2 and 4.6, respectively. As overlaid in Fig. A6, the experimentally observed variation in the ratio is notably larger, and the skewness notably stronger, than the upper-bound estimate of what might be attributable to measurement uncertainty alone.
Software will be made available upon request by contacting the corresponding author.
Data will be made available upon request by contacting the corresponding author.
MRJ and SPS contributed to the conception and design. SPS performed the acquisition of data. SPS and MRJ contributed to analysis and interpretation of data, drafting and revising of the article, and the approval of the submitted version for publication.
The authors declare that they have no conflict of interest.
Publisher's note: Copernicus Publications remains neutral with regard to jurisdictional claims in published maps and institutional affiliations.
We are indebted to Jeremy Thornock and Philip Smith (University of Utah) for sharing high-fidelity LES data used during test simulations to develop the optical diagnostic. We are also grateful for the support and leadership of Michael Layer (project manager, Natural Resources Canada) for championing this and related projects.
This work was supported by the Natural Sciences and Engineering Research Council of Canada (NSERC) FlareNet Strategic Network (grant no. 479641), NSERC Discovery Research and Accelerator Supplement Grants (grant no. 06632 and 522658), and Natural Resources Canada (Project Manager, Michael Layer).
This research has been supported by the Natural Sciences and Engineering Research Council of Canada (grant nos. 479641, 06632, and 522658) and Natural Resources Canada (grant no. CH-GHG IETS-19-103).
This paper was edited by Jean-Philippe Putaud and reviewed by two anonymous referees.
Allen, M. G.: Diode laser absorption sensors for gas-dynamic and combustion flows, Meas. Sci. Technol., 9, 545, available at: http://stacks.iop.org/0957-0233/9/i=4/a=001 (last access: 23 July 2021), 1998.
Andreae, M. O. and Gelencsér, A.: Black carbon or brown carbon? The nature of light-absorbing carbonaceous aerosols, Atmos. Chem. Phys., 6, 3131–3148, https://doi.org/10.5194/acp-6-3131-2006, 2006.
Baumgardner, D., Popovicheva, O., Allan, J., Bernardoni, V., Cao, J., Cavalli, F., Cozic, J., Diapouli, E., Eleftheriadis, K., Genberg, P. J., Gonzalez, C., Gysel, M., John, A., Kirchstetter, T. W., Kuhlbusch, T. A. J., Laborde, M., Lack, D., Müller, T., Niessner, R., Petzold, A., Piazzalunga, A., Putaud, J. P., Schwarz, J., Sheridan, P., Subramanian, R., Swietlicki, E., Valli, G., Vecchi, R., and Viana, M.: Soot reference materials for instrument calibration and intercomparisons: a workshop summary with recommendations, Atmos. Meas. Tech., 5, 1869–1887, https://doi.org/10.5194/amt-5-1869-2012, 2012.
Blackwood, T. R.: An evaluation of flare combustion efficiency using open-path Fourier transform infrared technology, J. Air Waste Manage., 50, 1714–22, 2000.
Blokh, A. G.: Heat Transfer In Steam Boiler Furnaces, 1st edn., CRC Press, Boca Raton, Florida, USA, 1988.
Bond, T. C. and Bergstrom, R. W.: Light Absorption by Carbonaceous Particles: An Investigative Review, Aerosol Sci. Tech., 40, 27–67, https://doi.org/10.1080/02786820500421521, 2006.
Bond, T. C., Doherty, S. J., Fahey, D. W., Forster, P. M., Berntsen, T. K., DeAngelo, B. J., Flanner, M. G., Ghan, S., Kärcher, B., Koch, D., Kinne, S., Kondo, Y., Quinn, P. K., Sarofim, M. C., Schultz, M. G., Schulz, M., Venkataraman, C., Zhang, H., Zhang, S., Bellouin, N., Guttikunda, S. K., Hopke, P. K., Jacobson, M. Z., Kaiser, J. W., Klimont, Z., Lohmann, U., Schwarz, J. P., Shindell, D. T., Storelvmo, T., Warren, S. G., and Zender, C. S.: Bounding the role of black carbon in the climate system: A scientific assessment, J. Geophys. Res.-Atmos., 118, 5380–5552, https://doi.org/10.1002/jgrd.50171, 2013.
Brandt, A. R., Yeskoo, T., McNally, M. S., Vafi, K., Yeh, S., Cai, H., and Wang, M. Q.: Energy intensity and greenhouse gas emissions from tight oil production in the Bakken formation, Energ. Fuel., 30, 9613–9621, https://doi.org/10.1021/acs.energyfuels.6b01907, 2016.
Cape, J. N., Coyle, M., and Dumitrean, P.: The atmospheric lifetime of black carbon, Atmos. Environ., 59, 256–263, https://doi.org/10.1016/j.atmosenv.2012.05.030, 2012.
Chang, H. and Charalampopoulos, T. T.: Determination of the Wavelength Dependence of Refractive Indices of Flame Soot, P. Roy. Soc. A-Math. Phy., 430, 577–591, https://doi.org/10.1098/rspa.1990.0107, 1990.
Coderre, A. R., Thomson, K. A., Snelling, D. R., and Johnson, M. R.: Spectrally-Resolved Light Absorption Properties of Cooled Soot from a Methane Flame, Appl. Phys. B, 104, 175–188, https://doi.org/10.1007/s00340-011-4448-9, 2011.
Conrad, B. M. and Johnson, M. R.: Field measurements of black carbon yields from gas flaring, Environ. Sci. Technol., 51, 1893–1900, https://doi.org/10.1021/acs.est.6b03690, 2017.
Conrad, B. M. and Johnson, M. R.: Mass absorption cross-section of flare-generated black carbon: Variability, predictive model, and implications, Carbon, 149, 760–771, https://doi.org/10.1016/j.carbon.2019.04.086, 2019.
Conrad, B. M., Thornock, J. N., and Johnson, M. R.: Beam steering effects on remote optical measurements of pollutant emissions in heated plumes and flares, J. Quant. Spectrosc. Ra., 254, https://doi.org/10.1016/j.jqsrt.2020.107191, 2020.
Farooq, A., Jeffries, J. B., and Hanson, R. K.: In situ combustion measurements of H2O and temperature near 2.5 µm using tunable diode laser absorption, Meas. Sci. Technol., 19, 075604, https://doi.org/10.1088/0957-0233/19/7/075604, 2008.
Flanner, M. G.: Arctic climate sensitivity to local black carbon, J. Geophys. Res.-Atmos., 118, 1840–1851, https://doi.org/10.1002/jgrd.50176, 2013.
Fotia, M. L., Sell, B. C., Hoke, J., Wakefield, S., and Schauer, F.: 1 kHz Mid-IR Absorption Spectroscopy for CO and CO2 Concentration and Temperature Measurement, Combust. Sci. Technol., 187, 1922–1936, https://doi.org/10.1080/00102202.2015.1069281, 2015.
Gasser, T., Peters, G. P., Fuglestvedt, J. S., Collins, W. J., Shindell, D. T., and Ciais, P.: Accounting for the climate–carbon feedback in emission metrics, Earth Syst. Dynam., 8, 235–253, https://doi.org/10.5194/esd-8-235-2017, 2017.
Grauer, S. J., Conrad, B. M., Miguel, R. B., and Daun, K. J.: Gaussian Model for Emission Rate Measurement of a Heated Plume using Hyperspectral Data, J. Quant. Spectrosc. Ra., 206, 125–134, https://doi.org/10.1016/j.jqsrt.2017.11.005, 2018.
Gvakharia, A., Kort, E. A., Brandt, A. R., Peischl, J., Ryerson, T. B., Schwarz, J. P., Smith, M. L., and Sweeney, C.: Methane, black carbon, and ethane emissions from natural gas flares in the Bakken Shale, North Dakota, Environ. Sci. Technol., 51, 5317–5325, https://doi.org/10.1021/acs.est.6b05183, 2017.
Herndon, S. C., Nelson, D. D., Wood, E. C., Knighton, W. B., Kolb, C. E., Kodesh, Z., Torres, V. M., and Allen, D. T.: Application of the Carbon Balance Method to Flare Emissions Characteristics, Ind. Eng. Chem. Res., 51, 12577–12585, https://doi.org/10.1021/ie202676b, 2012.
IPCC: Anthropogenic and Natural Radiative Forcing, Chapt. 8, in: Climate Change 2013: The Physical Science Basis. Contribution of Working Group I to the Fifth Assessment Report of the Intergovernmental Panel on Climate Change, edited by: Stocker, T. F., Qin, D., Plattner, G.-K., Tignor, M., Allen, S. K., Boschung, J., Nauels, A., Xia, Y., Bex, V., and Midgley, P. M., Cambridge University Press, Cambridge, UK and New York, NY, USA, 659–740, 2013.
Jacobson, M. Z.: Short-term effects of controlling fossil-fuel soot, biofuel soot and gases, and methane on climate, Arctic ice, and air pollution health, J. Geophys. Res., 115, 1–24, https://doi.org/10.1029/2009JD013795, 2010.
Johnson, M. R. and Kostiuk, L. W.: Visualization of the fuel stripping mechanism for wake-stabilized diffusion flames in a crossflow, in: IUTAM Symposium on Turbulent Mixing and Combustion, vol. 70, edited by: Pollard, A. and Candel, S., Springer Netherlands, Dordrecht, 295–303, 2002.
Johnson, M. R., Wilson, D. J., and Kostiuk, L. W.: A fuel stripping mechanism for wake-stabilized jet diffusion flames in crossflow, Combust. Sci. Technol., 169, 155–174, https://doi.org/10.1080/00102200108907844, 2001.
Klimont, Z., Kupiainen, K., Heyes, C., Purohit, P., Cofala, J., Rafaj, P., Borken-Kleefeld, J., and Schöpp, W.: Global anthropogenic emissions of particulate matter including black carbon, Atmos. Chem. Phys., 17, 8681–8723, https://doi.org/10.5194/acp-17-8681-2017, 2017.
Köylü, Ü. Ö. and Faeth, G. M.: Optical properties of overfire soot in buoyant turbulent diffusion flames at long residence times, J. Heat Transf., 116, 152–159, https://doi.org/10.1115/1.2910849, 1994.
Krishnan, S. S., Lin, K.-C., and Faeth, G. M.: Extinction and Scattering Properties of Soot Emitted From Buoyant Turbulent Diffusion Flames, J. Heat Transf., 123, 331, https://doi.org/10.1115/1.1350823, 2001.
Liu, C., Xu, L. and Cao, Z.: Measurement of nonuniform temperature and concentration distributions by combining line-of-sight tunable diode laser absorption spectroscopy with regularization methods, Appl. Optics, 52, 4827, https://doi.org/10.1364/AO.52.004827, 2013.
Liu, J. T. C., Rieker, G. B., Jeffries, J. B., Gruber, M. R., Carter, C. D., Mathur, T., and Hanson, R. K.: Near-infrared diode laser absorption diagnostic for temperature and water vapor in a scramjet combustor, Appl. Optics, 44, 6701, https://doi.org/10.1364/AO.44.006701, 2005.
Liu, X., Jeffries, J. B., Hanson, R. K., Hinckley, K. M., and Woodmansee, M. A.: Development of a tunable diode laser sensor for measurements of gas turbine exhaust temperature, Appl. Phys. B-Lasers O., 82, 469–478, https://doi.org/10.1007/s00340-005-2078-9, 2006.
Liu, X., Jeffries, J. B., and Hanson, R. K.: Measurement of Non-Uniform Temperature Distributions Using Line-of-Sight Absorption Spectroscopy, AIAA J., 45, 411–419, https://doi.org/10.2514/1.26708, 2007.
McEwen, J. D. N. and Johnson, M. R.: Black carbon particulate matter emission factors for buoyancy-driven associated gas flares, J. Air Waste Manage., 62, 307–321, https://doi.org/10.1080/10473289.2011.650040, 2012.
Migliorini, F., Thomson, K. A., and Smallwood, G. J.: Investigation of optical properties of aging soot, Appl. Phys. B-Lasers O., 104, 273–283, https://doi.org/10.1007/s00340-011-4396-4, 2011.
Petzold, A., Ogren, J. A., Fiebig, M., Laj, P., Li, S.-M., Baltensperger, U., Holzer-Popp, T., Kinne, S., Pappalardo, G., Sugimoto, N., Wehrli, C., Wiedensohler, A., and Zhang, X.-Y.: Recommendations for reporting ”black carbon” measurements, Atmos. Chem. Phys., 13, 8365–8379, https://doi.org/10.5194/acp-13-8365-2013, 2013.
Pohl, J. H., Tichenor, B. A., Lee, J., and Payne, R.: Combustion Efficiency of Flares, Combust. Sci. Technol., 50, 217–231, https://doi.org/10.1080/00102208608923934, 1986.
Popovicheva, O. B., Timofeev, M. A., Persiantseva, N., Jefferson, M. A., Johnson, M. R., Rogak, S. N., and Baldelli, A.: Microstructure and Chemical Composition of Particles from Small-scale Gas Flaring, Aerosol Air Qual. Res., 19, 2205–2221, https://doi.org/10.4209/aaqr.2019.04.0177, 2019.
Poudenx, P.: Plume sampling of a flare in crosswind: structure and combustion efficiency, M.Sc. Thesis, University of Alberta, Edmonton, AB, Canada, Edmonton, 2000.
Poudenx, P., Howell, L. W., Wilson, D. J., and Kostiuk, L. W.: Downstream Similarity of Thermal Structure in Plumes From Jet Diffusion Flames in a Crossflow, Combust. Sci. Technol., 176, 409–435, https://doi.org/10.1080/00102200490270139, 2004.
Ramanathan, V. and Carmichael, G.: Global and regional climate changes due to black carbon, Nat. Geosci., 1, 221–227, https://doi.org/10.1038/ngeo156, 2008.
Sand, M., Berntsen, T. K., Von Salzen, K., Flanner, M. G., Langner, J., and Victor, D. G.: Response of Arctic temperature to changes in emissions of short-lived climate forcers, Nat. Clim. Change, 6, 286–289, https://doi.org/10.1038/nclimate2880, 2016.
Sanders, S. T., Wang, J., Jeffries, J. B., and Hanson, R. K.: Diode-laser absorption sensor for line-of-sight gas temperature distributions, Appl. Optics, 40, 4404–4415, 2001.
Schwarz, J. P., Holloway, J. S., Katich, J. M., McKeen, S., Kort, E. A., Smith, M. L., Ryerson, T. B., Sweeney, C., and Peischl, J.: Black carbon emissions from the Bakken oil and gas development region, Environ. Sci. Tech. Let., 2, 281–285, https://doi.org/10.1021/acs.estlett.5b00225, 2015.
Seymour, S. P.: Spectroscopic Measurements of Path-Averaged Species Correlations in Turbulent Flare Plumes, Carleton University, Ottawa, Canada, 2019.
Strosher, M. T.: Characterization of emissions from diffusion flare systems, J. Air Waste Manage., 50, 1723–33, 2000.
Turns, S. R.: An Introduction to Combustion: Concepts and Applications, 2nd edn., McGraw-Hill, New York, USA, 2000.
U.S. EPA: Nitrogen Oxides (NOx), Why and How They Are Controlled, United States Environmental Protection Agency (U.S. EPA), Research Triangle Park, NC, USA, 1999.
U.S. EPA: Report to Congress on Black Carbon, United States Environmental Protection Agency (U.S. EPA), Research Triangle Park, NC, USA, 2012.
Weyant, C. L., Shepson, P. B., Subramanian, R., Cambaliza, M. O. L. L., Heimburger, A., Mccabe, D., Baum, E., Stirm, B. H., and Bond, T. C.: Black carbon emissions from associated natural gas flaring, Environ. Sci. Technol., 50, 2075–2081, https://doi.org/10.1021/acs.est.5b04712, 2016.
Winiger, P., Barrett, T. E., Sheesley, R. J., Huang, L., Sharma, S., Barrie, L. A., Yttri, K. E., Evangeliou, N., Eckhardt, S., Stohl, A., Klimont, Z., Heyes, C., Semiletov, I. P., Dudarev, O. V., Charkin, A., Shakhova, N., Holmstrand, H., Andersson, A., and Gustafsson, Ö.: Source apportionment of circum-Arctic atmospheric black carbon from isotopes and modeling, Science Advanes, 5, eaau8052, https://doi.org/10.1126/sciadv.aau8052, 2019.
World Bank: Global Gas Flaring Jumps to Levels Last Seen in 2009, available at: https://www.worldbank.org/en/news/press-release/2020/07/21/global-gas-flaring-jumps-to-levels-last-seen-in-2009 (last access: 4 February 2021), 2020.
Wormhoudt, J., Herndon, S. C., Franklin, J., Wood, E. C., Knighton, B., Evans, S., Laush, C., Sloss, M., and Spellicy, R.: Comparison of remote sensing and extractive sampling measurements of flare combustion efficiency, Ind. Eng. Chem. Res., 51, 12621–12629, https://doi.org/10.1021/ie202783m, 2012.
Zhang, G., Liu, J., Xu, Z., He, Y., and Kan, R.: Characterization of temperature non-uniformity over a premixed CH4-air flame based on line-of-sight TDLAS, Appl. Phys. B-Lasers O., 122, 1–9, https://doi.org/10.1007/s00340-015-6289-4, 2016.
Zhou, X., Liu, X., Jeffries, J. B., and Hanson, R. K.: Development of a sensor for temperature and water concentration in combustion gases using a single tunable diode laser, Meas. Sci. Technol., 14, 1459–1468, https://doi.org/10.1088/0957-0233/14/8/335, 2003.
Zhu, J., Choi, M. Y., Mulholland, G. W., Manzello, S. L., Gritzo, L. A., and Suo-Anttila, J.: Measurement of visible and near-IR optical properties of soot produced from laminar flames, P. Combust. Inst., 29, 2367–2374, https://doi.org/10.1016/S1540-7489(02)80288-7, 2002.
- Abstract
- Introduction
- Experimental setup
- Measurement theory
- Experimental results and discussion
- Conclusions
- Appendix A: Quantification of measurement error
- Code availability
- Data availability
- Author contributions
- Competing interests
- Disclaimer
- Acknowledgements
- Financial support
- Review statement
- References