the Creative Commons Attribution 4.0 License.
the Creative Commons Attribution 4.0 License.
 | 03 Aug 2021
Iodide CIMS and m∕z 62: the detection of HNO3 as NO3− in the presence of PAN, peroxyacetic acid and ozone
Raphael Dörich
Philipp Eger
Jos Lelieveld
Chemical ionisation mass spectrometry (CIMS) using I− (the iodide anion), hereafter I-CIMS, as a primary reactant ion has previously been used to measure NO3 and N2O5 both in laboratory and field experiments. We show that reports of large daytime mixing ratios of NO3 and N2O5 (both usually present in detectable amounts only at night) are likely to be heavily biased by the ubiquitous presence of HNO3 in the troposphere and lower stratosphere. We demonstrate in a series of laboratory experiments that the CIMS detection of HNO3 at 62 using I− ions is efficient in the presence of peroxy acetyl nitric anhydride (PAN) or peroxyacetic acid (PAA) and especially O3. We have characterised the dependence of the sensitivity to HNO3 detection on the presence of acetate anions (, 59, from either PAN or PAA). The loss of via conversion to in the presence of HNO3 may represent a significant bias in I-CIMS measurements of PAN and PAA in which continuous calibration (e.g. via addition of isotopically labelled PAN) is not carried out. The greatest sensitivity to HNO3 at 62 is achieved in the presence of ambient levels of O3 whereby the thermodynamically disfavoured, direct reaction of I− with HNO3 to form is bypassed by the formation of , which reacts with HNO3 to form, for example, iodic acid and . The ozone and humidity dependence of the detection of HNO3 at 62 was characterised in laboratory experiments and applied to daytime, airborne measurements in which good agreement with measurements of the I−(HNO3) cluster ion (specific for HNO3 detection) was obtained. At high ozone mixing ratios, we show that the concentration of I− ions in our ion–molecule reactor (IMR) is significantly depleted. This is not reflected by changes in the measured I− signal at 127 as the formed does not survive passage through the instrument but is likely detected after fragmentation to I−. This may result in a bias in measurements of trace gases using I-CIMS in stratospheric air masses unless a calibration gas is continuously added or the impact of O3 on sensitivity is characterised.
- Article
(3095 KB) - Full-text XML
-
Supplement
(590 KB) - BibTeX
- EndNote


The use of iodide anions (I−) as primary ions in mass-spectrometric studies of ion–molecule reactions has a long history. Fehsenfeld et al. (1975) and Davidson et al. (1978) established that the nitrate anion (, 62) was formed in a rapid reaction between I− and N2O5. was also identified as the main product of the reaction between I− and ClONO2 (Huey et al., 1995). The large rate constants for reaction of I− with N2O5 and ClONO2 led to the development of chemical ionisation mass spectrometry (CIMS) using I− primary ions (henceforth I-CIMS) in kinetic studies of heterogeneous, atmospheric reactions (e.g. Hanson and Ravishankara, 1991) and more recently I-CIMS has found widespread deployment for measurement of atmospheric trace gases (Huey, 2007, and references therein). Early field measurements utilised I-CIMS to detect N2O5 and peroxyacetyl nitric anhydride (PAN, CH3C(O)O2NO2) (Slusher et al., 2004), but since then the range of molecules that have been detected using I− has greatly increased and trace gases as diverse as inorganic radicals and halogenates and a host of organic species are now routinely measured (Huey, 2007; Lee et al., 2014; Iyer et al., 2017; Riva et al., 2019). In this work, we focus on the detection of two atmospherically important trace gases N2O5 and HNO3 using a CIMS operating with I− reactant ions.
Both N2O5 and HNO3 are formed in the atmosphere by the sequential oxidation of NO, which has both anthropogenic and natural sources. In a well-known series of reactions (Lightfoot et al., 1992; Atkinson et al., 2004), NO is oxidised (Reactions R1 and R2) by reaction with O3 or peroxyl radicals (RO2) to NO2, which during the day, may be removed by reaction with OH to form HNO3 (Reaction R3) and during the night to form N2O5 (Reactions R4 and R5).
Both HNO3 and N2O5 have important, non-gas-phase loss processes (Crowley et al., 2010) such as uptake to particles and other surfaces. In addition, N2O5 can thermally dissociate back to NO3.
The chain of reactions to form N2O5 is broken during the day as NO3 is generally photolysed within a few seconds (Wayne et al., 1991) and also reacts with NO so that N2O5 is expected to be present at significant levels only at night-time.
The detection of N2O5 using I− reactant ions can be achieved by monitoring either the product at 62 (see above) or the adduct ion at 235 (Kercher et al., 2009). The former is reported to be more sensitive and less dependent on water vapour concentrations but less specific, with large and highly variable background signals potentially arising from trace gases such as NO3, ClONO2 and BrONO2. Despite this, night-time N2O5 has been monitored in ambient air (as ) using I− reactant ions, showing reasonable agreement with optical methods (Slusher et al., 2004; Dubé et al., 2006; Chang et al., 2011).
During a recent, airborne deployment of our I-CIMS, we monitored at 62 in an attempt to detect N2O5 during two night-time flights. The air masses we investigated were mainly in the tropical free and upper troposphere and lower stratosphere, and we did not expect significant interference from, for example, halogen nitrates at 62. However, our airborne measurements (described in detail in Sect. 4) revealed a large and variable signal at 62 during both the day and night. To illustrate this, raw signals obtained during daytime when the aircraft sampled air masses with varying degrees of stratospheric influence are displayed in Fig. S1 in the Supplement. The signal at 62 is large and highly variable and is not affected by addition of NO to the heated inlet, ruling out its assignment to either N2O5 or NO3 (see below). The great increase in signal when entering the lower stratosphere and the obvious correlation with O3 (Fischer et al., 1997; Popp et al., 2009) provided an early clue to the identity of the trace gas detected at 62 which we initially assigned to HNO3. Our results thus appeared to contrast the conclusions of a previous observation of a large daytime signal at 62 when deploying an I-CIMS (in this case in the boundary layer), which was interpreted as resulting (at least in part) from high levels of daytime NO3 and/or N2O5 (Wang et al., 2014). Based on complementary laboratory experiments, Wang et al. (2014) showed, in accord with earlier investigations (Fehsenfeld et al., 1975; Huey et al., 1995), that HNO3 is not detected sensitively at 62 using I-CIMS.
The unexpected observation of a large daytime signal at 62 during airborne operation led us to perform a series of laboratory experiments to identify potential “interfering” trace gases at this mass-to-charge ratio when using I-CIMS. In contrast to the conclusions drawn from previous studies, our laboratory and airborne measurements show that, during daytime, the predominant contributor to 62 when sampling ambient air (in the presence of ozone) is likely to be HNO3.
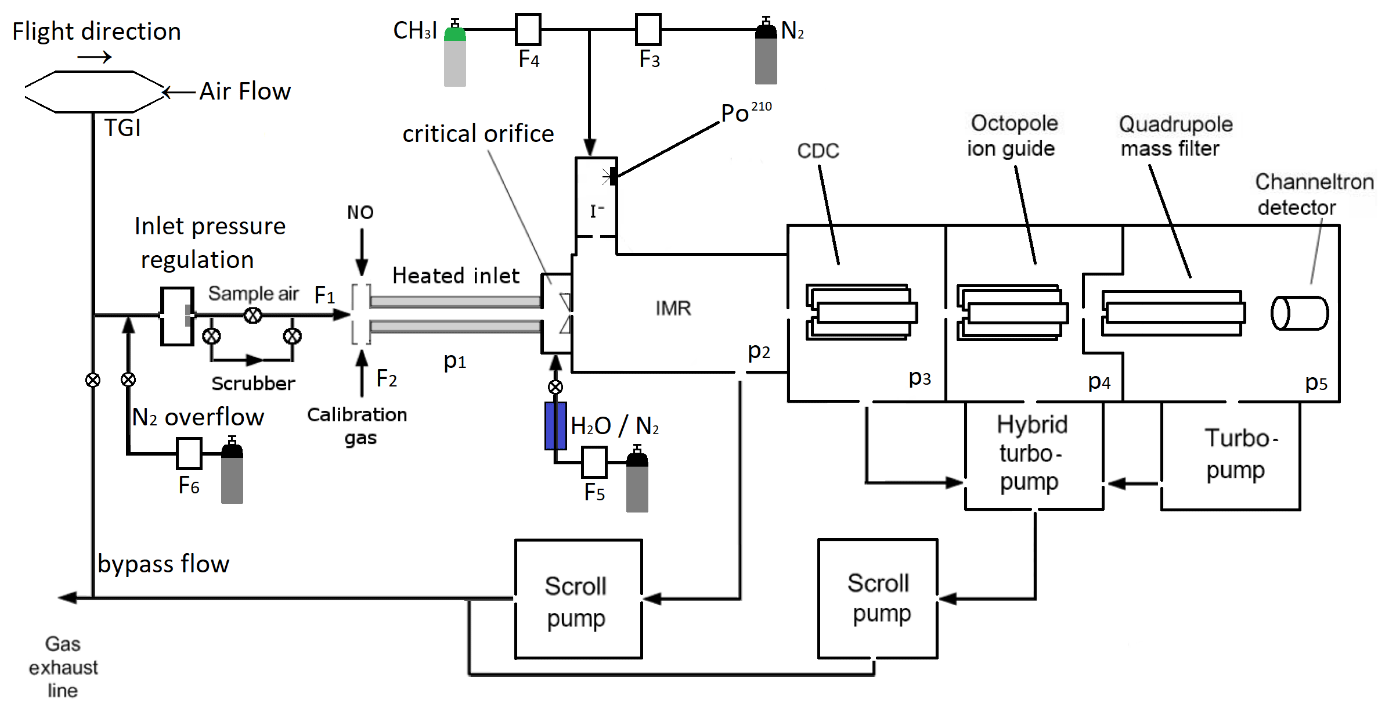
Figure 1Schematic diagram illustrating the central components of the I-CIMS used in this work. IMR = ion–molecule reactor, CDC = collisional dissociation chamber, F1=1250 cm3 (STP) min−1, F2=50 cm3 (STP) min−1, F3=750 cm3 (STP) min−1, F4=4 cm3 (STP) min−1, F5=50 cm3 (STP) min−1. p1=100 mbar, p2=24 mbar, p3=0.6 mbar, mbar, mbar. The heated inlet is made of PFA tubing. TGI = Trace-gas inlet. When overflowing the inlet line, the valve to the exhaust line is closed. When sampling air, the valve to the N2 bottle is closed.
The I-CIMS we used in our laboratory and airborne investigations (see Fig. 1) is similar to that described by Slusher et al. (2004) and Zheng et al. (2011) and was originally constructed in collaboration with Georgia Tech as a prototype instrument of the company THS (http://thsinstruments.com, last access: 30 July 2021). It is essentially a hybrid of the instruments described by Phillips et al. (2013) and Eger et al. (2019), the former using a 210Po ion source, the latter an electrical discharge source but with improved (digital) control of the MS settings enabling different mass-to-charge ratios to be monitored using different potentials for the collisional dissociation of cluster ions. For all the experiments described below, the 210Po ion source was used to generate I− as this configuration has much better sensitivity for PAN, the main target trace gas during the deployment of the I-CIMS on the HALO aircraft (High Altitude Long range platform for atmospheric Observations). The set-up for PAN detection includes a heated inlet section (∼170 ∘C, 100 mbar, residence time ∼40 ms) to thermally dissociate PAN to CH3C(O)O2 which subsequently reacts with I− to form the acetate anion () which is detected at 59. At this inlet temperature and pressure, the lifetime of PAN with respect to thermal decomposition <3 ms (Ammann et al., 2021). For N2O5, the lifetime with respect to its thermal dissociation to NO2 and NO3 is ∼0.5 ms (IUPAC, 2021) so that N2O5 is stoichiometrically converted to NO3 and the instrument measures the sum of N2O5 and NO3 at 62. In order to separate PAN signals from those of peroxyacetic acid (CH3C(O)OOH, also detected as at 59), we periodically add NO ( molecule cm−3) to the inlet to remove CH3C(O)O2 and thus eliminate sensitivity to PAN. As NO reacts more rapidly with NO3 than with CH3C(O)O2 at 170 ∘C ( , ; IUPAC, 2021), the concentration of NO added is also sufficient to quantitatively titrate NO3 to NO2 and thus provides a measure of the “background” signal at 62 in the absence of NO3 and N2O5.
During airborne operation on HALO, the dynamic pressure generated in a forward facing trace gas inlet (TGI) located on top of the aircraft (see Fig. 1) was used to create a flow of air through in. (OD) PFA tubing sampling at an angle of 90∘ to the flight direction. The in. tubing was attached to a in. (OD) PFA tube attached to an exhaust plate at the underside of the aircraft to create a fast “bypass” flow. The bypass flow was sub-sampled (again at 90∘ and by in. PFA tubing heated to 40 ∘C) by the 1.4 L (STP) min−1 flow into the I-CIMS. Sub-sampling twice at 90∘ to the flow was helpful in reducing the number of large particles (e.g. cloud droplets) that could enter the thermal dissociation inlet and IMR.
The thermal dissociation inlet of the I-CIMS is regulated to a pressure of 100 mbar, which results in a pressure in the ion–molecule reactor of 24 mbar. This way, a stable pressure in the thermal dissociation inlet and the ion–molecule reactor (IMR) was maintained at altitudes up to ∼15 km. Prior to take off, the inlet line and TGI were flushed with nitrogen to prevent contamination by the high levels of pollutant trace gases at the airport. As described in Eger et al. (2019) negative ions exiting the IMR were declustered in passage through a collisional dissociation region (CDC, 0.6 mbar) before passing through an octopole ion guide ( mbar) and a quadrupole for mass selection ( mbar) prior to detection using a channeltron.
I− ions were generated by combining flows of 4 cm3 (STP) min−1 (400 ppmv) with 750 cm3 (STP) min−1 N2 and passing the mixture through a 370 MBq 210Po source. Under standard operating conditions (including airborne deployment), a constant amount of H2O was added to the IMR by flowing 50 cm3 (STP) min−1 N2 (at 1 bar pressure) through a 30 cm length of water-permeable 1/8 in. tubing (Permapure) immersed in water. The 50 cm3 (STP) min−1 flow of N2 acquires a relative humidity close to 100 % in transit through the tubing and is subsequently mixed with the dry N2 flow and sample air. Under these conditions, the ratio of signals at 145 (I−(H2O)) to that at 127 (I−) was 0.068. By comparison with calibration curves (see Fig. S2 and associated text) this indicates an H2O concentration in the IMR of molecule cm−3. For laboratory tests, the amount of water in the IMR could be increased by reducing the pressure in the permeable tube (thus increasing the mole fraction of H2O) or set to zero by bypassing the humidifier.
Based on a (calculated) literature value for the free energy of formation of I−(H2O)1 of −6.1 kcal mol−1 (Teiwes et al., 2019), we derive an equilibrium constant (at 298 K) of cm3 molecule−1 for the formation and thermal dissociation of I−(H2O)1:
With an H2O concentration (in the IMR) of 3.9×10¹⁴ molecule cm−3, this implies that the ratio . Our measured ratio of signals at 145 (I−(H2O)) : 127 (I−) was a factor ∼6 lower, reflecting the fact that, even when the declustering potential is reduced to its minimum value, most I−(H2O) ions do not survive the CDC region.
During extended operation of the CIMS, changes in sensitivity were captured by monitoring the primary ion signal (I− and its water cluster). Background signals at each of the mass-to-charge ratios monitored were obtained by passing the sampled air through a tubular scrubber (aluminium) filled with stainless-steel wool heated to 120 ∘C.
3.1 Detection of HNO3 at 62: the role of ozone
As described above, our observations of a clear correlation between 62 and O3 mixing ratios during the first HALO deployment of the I-CIMS strongly suggested that HNO3 was the origin of the signal although previous experiments had shown that I− does not react with HNO3 to form . In order to determine the sensitivity of our I-CIMS to HNO3, we constructed a permeation source in which a 20 cm3 (STP) min−1 flow of zero air was passed through a 1 m length of PFA tubing (0.125 in. OD) which was formed into a coil and submerged in an aqueous solution of 65 % HNO3 held at 50 ∘C. The permeation rate was determined by passing the 20 cm3 (STP) min−1 flow through an optical absorption cell and measuring the optical extinction at 185 nm where the absorption cross-section of HNO3 is well known (Dulitz et al., 2018). For the I-CIMS calibration, the 20 cm3 (STP) min−1 output was dynamically diluted to generate a mixing ratio of between 5 and 50 ppbv. Based on uncertainties in the absorption cross-section (5 %), the reproducibility of the optical measurement and the dilution factor, the uncertainty of the HNO3 mixing ratio is estimated as 15 %.
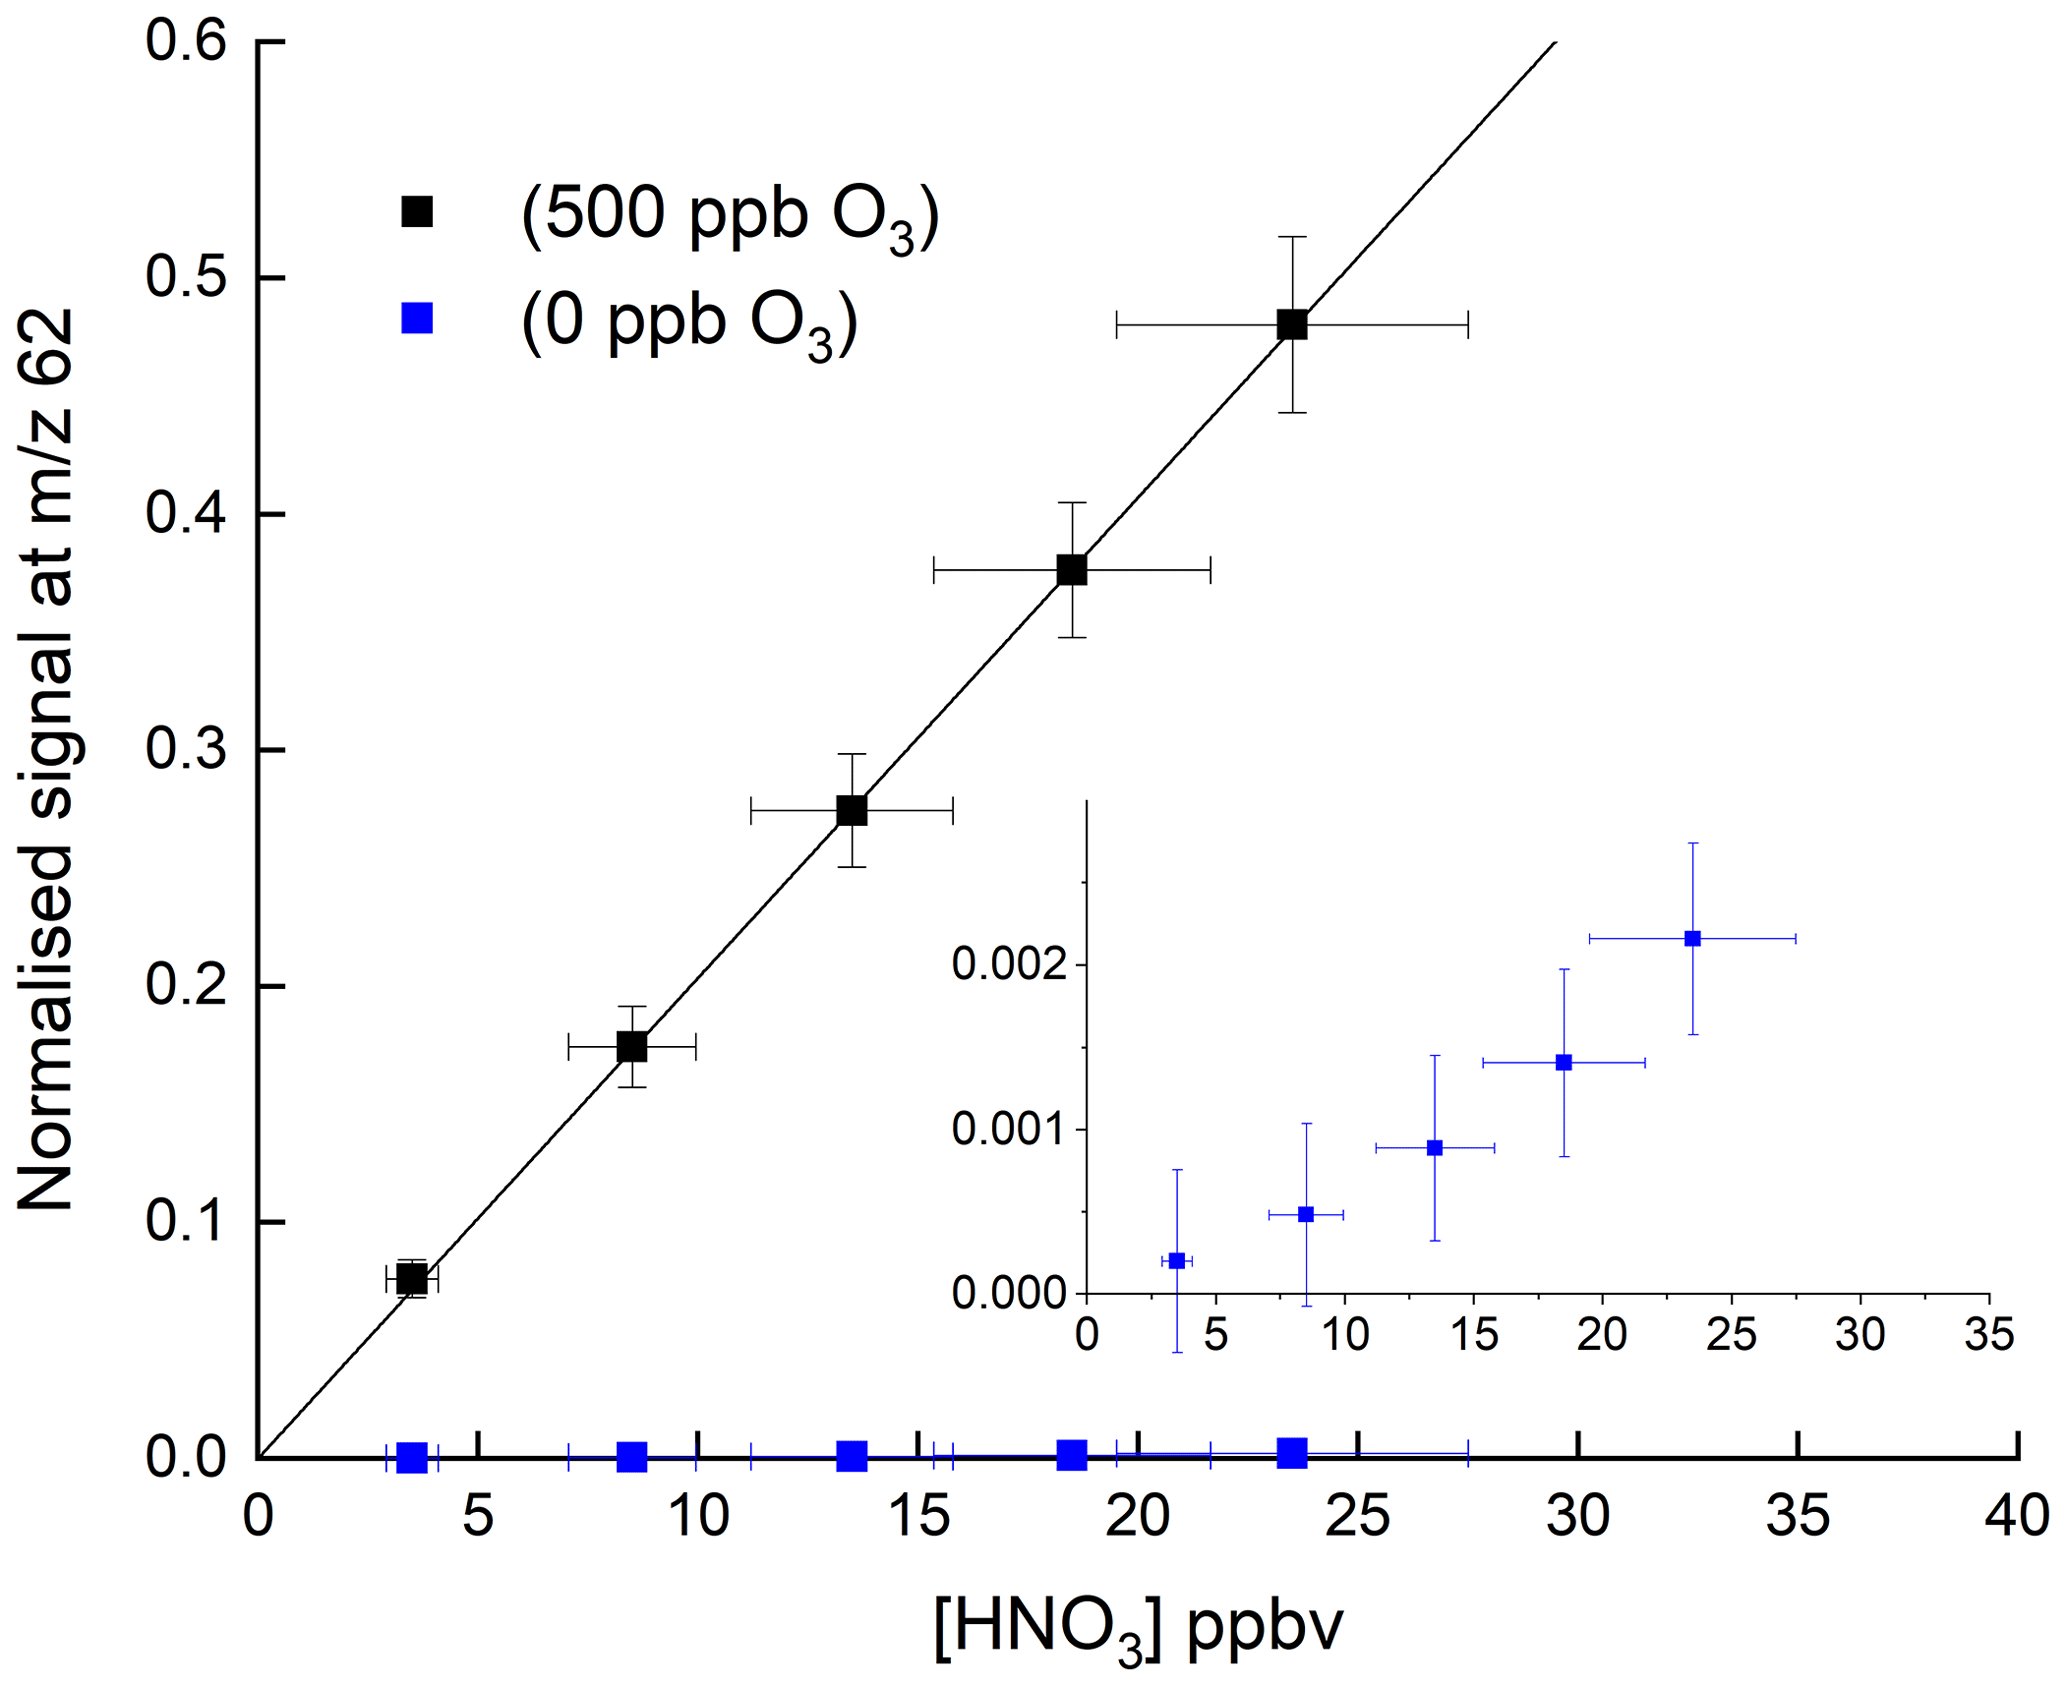
Figure 2HNO3 detection at 62 in the absence and presence (500 ppbv) of O3. The solid lines are non-weighted, linear regressions to the data and are and ppbv−1 HNO3 when 500 ppbv O3 and zero O3 were present, respectively. The inset (same x and y axes as in the full figure) is an expanded view of the signal obtained in the absence of O3. The error bars represent 15 % systematic uncertainty in the HNO3 concentration and 2σ statistical uncertainty in the signal at 62.
Figure 2 shows the response of the I-CIMS at 62 to addition of various amounts of HNO3. Throughout the paper, when presenting raw data, we generally normalise the I-CIMS signal by dividing by the primary ion signal at 127. This is standard practice and corrects for drifts in the CH3I flow which may occur over several hours after the instrument was switched from standby mode to operational mode. It also accounts for longer-term drifts caused by the weakening activity of the 210Po source over the duration of a measurement campaign (months) or since the last calibration and for loss of detector sensitivity over similar time periods. We show later that, when adding large concentrations of reactants that significantly deplete the primary ion signal at 127, this procedure may lead to bias is some measurements. For this reason, when detecting HNO3 at 190 (see later), we normalise to an interpolated signal at 127 that was measured when the air was scrubbed.
The weak signal in the absence of O3 (blue data points) confirms the conclusions of previous studies that derive a low rate coefficient for Reaction (R7). For comparison, approximate, relative sensitivities to PAN ( 59), N2O5 ( 62) and HNO3 ( 62), using this instrument are 1, 0.1 and , respectively. Indeed, as written below, Reaction (R7) is endothermic by ∼43 kJ mol−1 (Goos et al., 2005).
In a further series of experiments, we measured the response of the I-CIMS to HNO3 when adding O3 to the zero air. The results, also plotted in Fig. 2 (black symbols), indicate a factor ∼250 increase in the signal at 62 when ∼500 ppbv ozone was added. There are two possible explanations for this observation. The first involves conversion of NO2 impurity (which is present as a ∼8 % impurity in the HNO3 permeation flow) to NO3 and N2O5 (Reactions R1, R4, and R5), which are subsequently detected. This can however be ruled out as the rate-limiting step in the formation of NO3 is the slow reaction between NO2 and O3 with at room temperature (Atkinson et al., 2004). The addition of 1000 ppbv O3 (equivalent to a concentration of 2.4×10¹³ molecule cm−3) would only convert an insignificant fraction of the NO2 to NO3 in the ∼40 ms reaction time available from the point of mixing to the IMR. This was confirmed by adding NO (7.7 ppm) to the inlet, which would remove any NO3 (see above) and observing no change in the signal at 62.
The second explanation is that the presence of O3 results in the generation of further reagent ions that can react with HNO3. Iodide anions are known to react with O3, leading, in a series of exothermic reactions, to the formation of iodate (Williams et al., 2002; Teiwes et al., 2018; Bhujel et al., 2020).
In this scheme, Reaction (R8) is rate-limiting ( ; Bhujel et al., 2020), whereas the further steps (Reactions R9–R10) in the sequential oxidation to iodate proceed with rate constants at least 2 orders of magnitude larger (Teiwes et al., 2018; Bhujel et al., 2020). IO− and also react with O2 to reform O3:
with rate coefficients of and (Bhujel et al., 2020). With the O3 (∼ 1–5 ×10¹⁰ molecule cm−3), O2 concentrations ( that of O3) and reaction times used in their studies (Teiwes et al., 2018, 2019; Bhujel et al., 2020), was observed to be the dominant form of .
In the presence of water vapour, I− is also present as a hydrate I−(H2O) (see above) for which, according to Teiwes et al. (2019), the rate coefficient for reaction with O3 (Reactions R13a, R13b) is a factor ∼40 larger than k8 and results in the formation of and I−:
As Reaction (R8) is rate-limiting, this implies an increase in the amount of, for example, formed in the IMR in the presence of water. In most regions of the troposphere and lower atmosphere, ozone mixing ratios lie between 30 and >1000 ppbv. An ambient ozone concentration of 50 ppbv results in a concentration in the IMR of >1010 molecules cm−3. The large rate coefficients for Reactions (R9) and (R10) and the reactions of IO− and with O2 result in the rapid inter-conversion of I−, IO−, and , which results (for a given RH and ozone concentration) in a quasi-equilibrium between anions.
We explored the relevance of these reactions for our I-CIMS by carrying out a set of experiments in which varying amounts of O3 were added to the inlet and the mass-to-charge ratios corresponding to IO− ( 143), ( 159) and ( 175) were monitored; the results are depicted in Fig. 3.
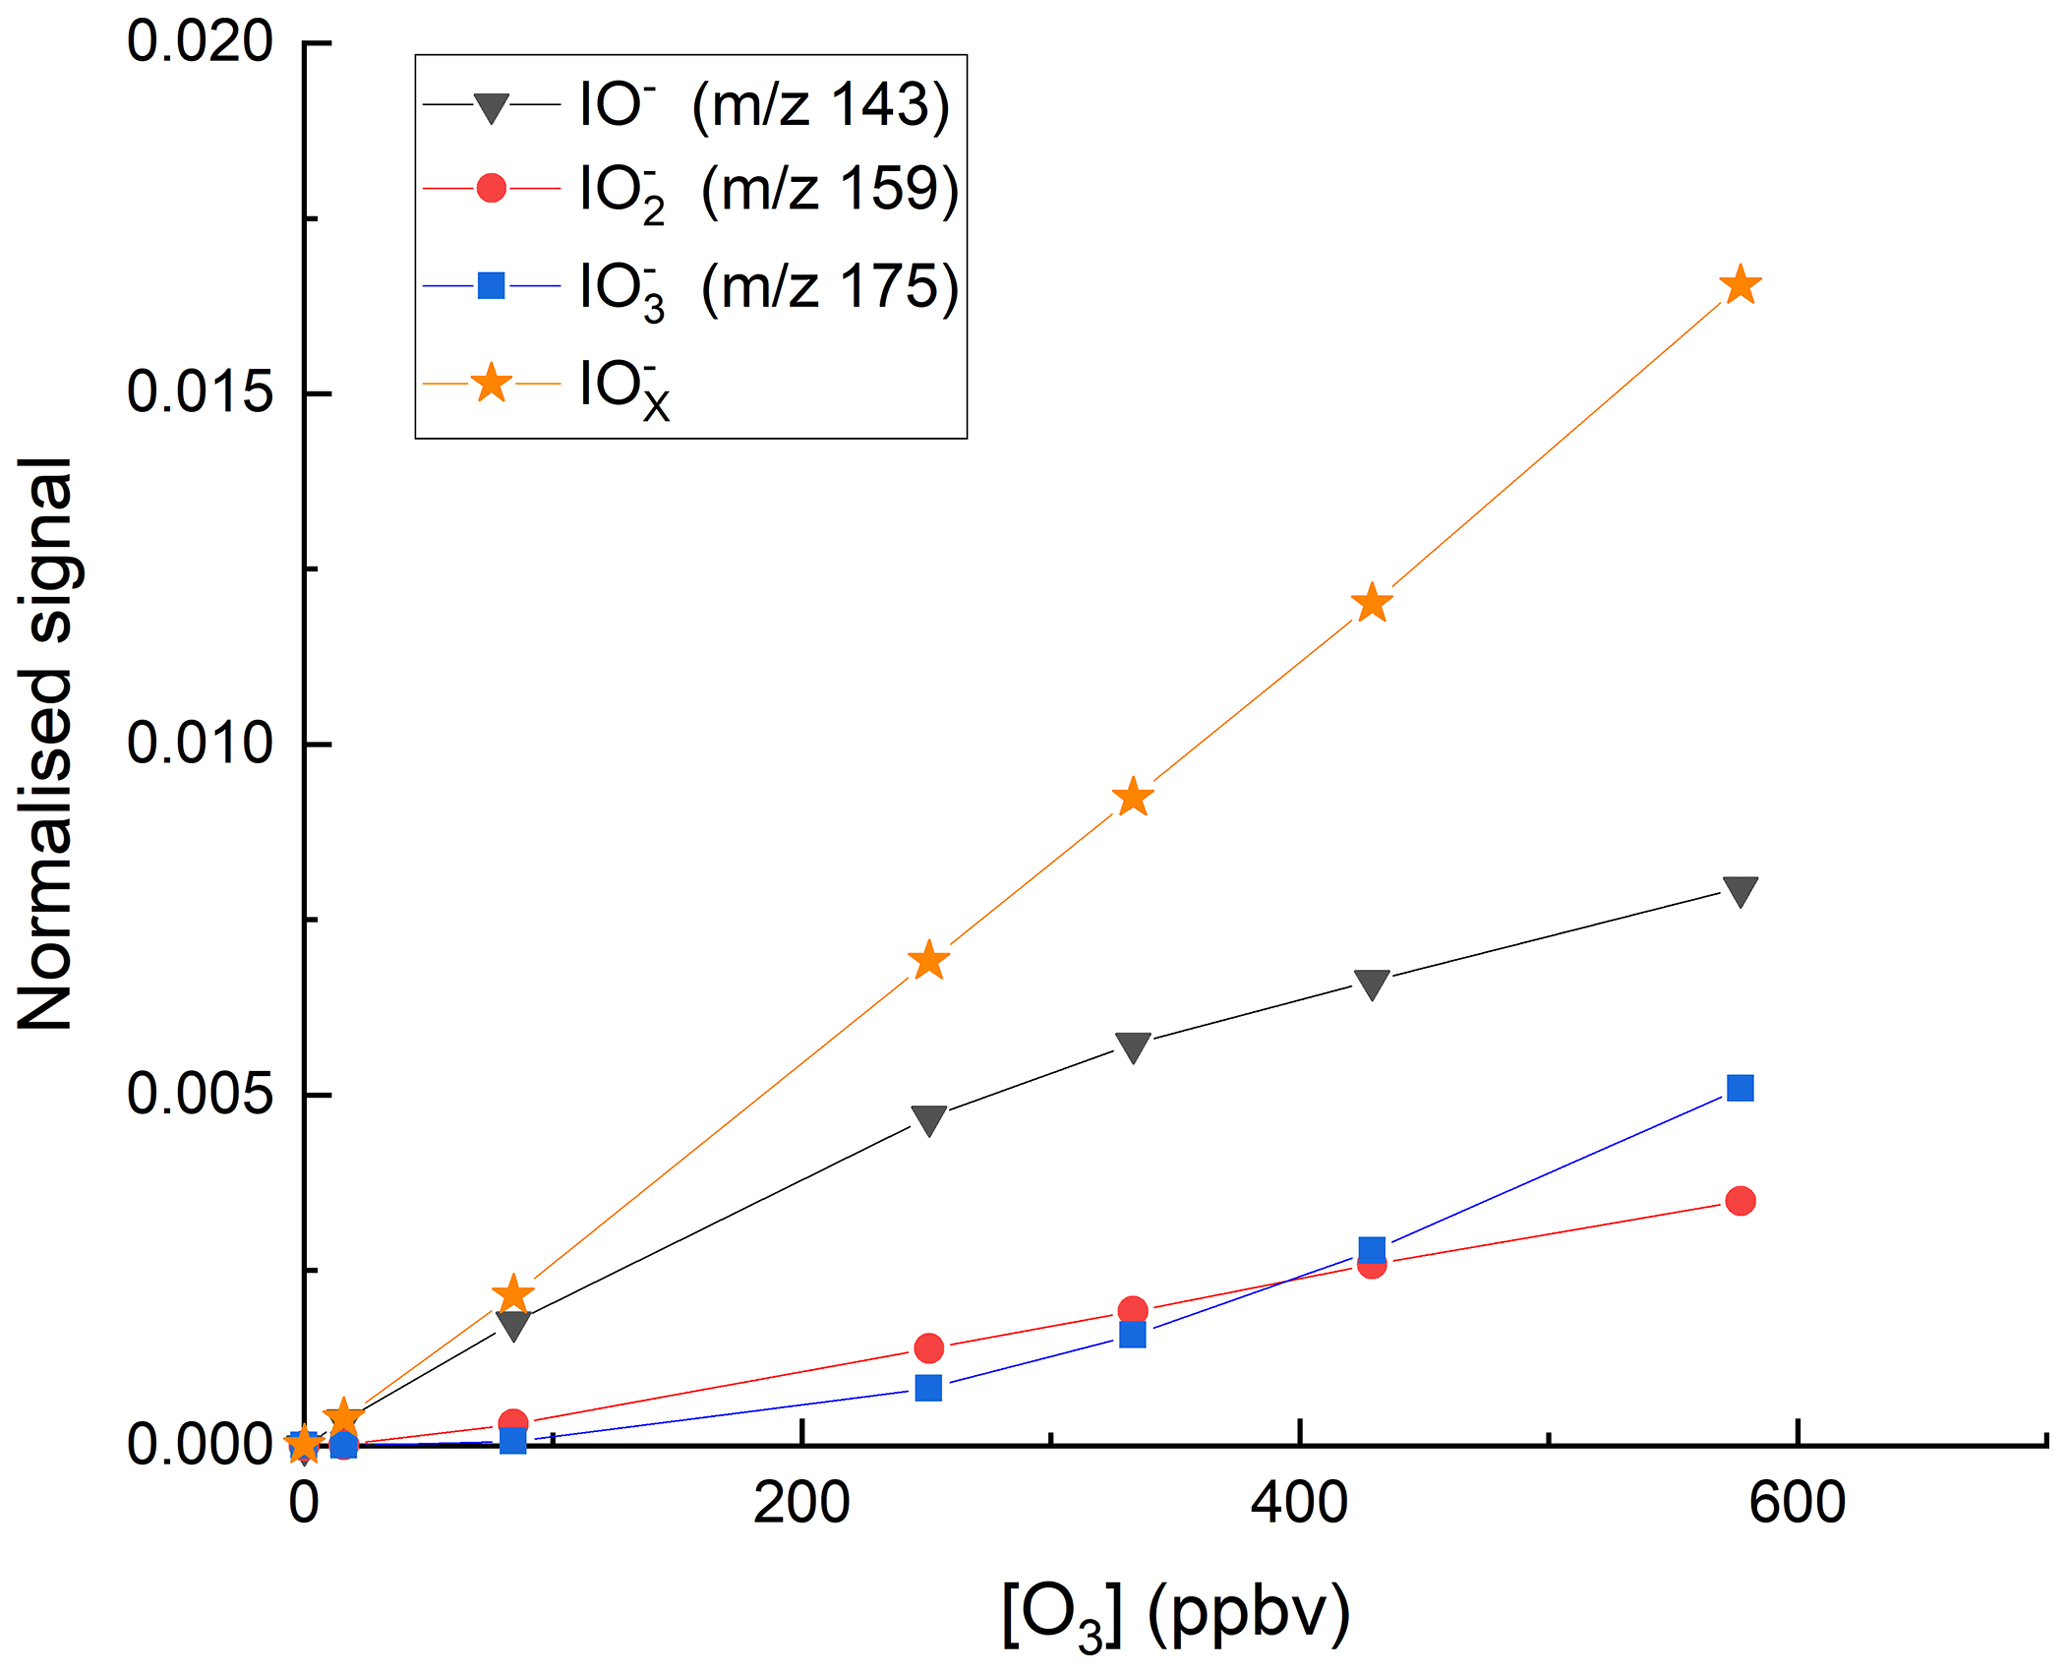
Figure 3Variation of the I-CIMS signals at 143 (IO−), 159 () and 175 () with the mixing ratios of O3. The O3 mixing ratios are those measured in air before the gas flow entered the inlet. The water vapour was held constant using our standard setting ( molecule cm−3).
First, we note that all three mass-to-charge ratios were indeed observed, but only under conditions where the CDC potential was set to the lowest value at which ions still reach the detector. The dependence of the various anions on the O3 mixing ratio is broadly as expected from the reaction scheme (Reactions R8–R12) listed above: the major contributor to at low [O3] is IO−, which is converted to and more efficiently as O3 increases, while the total concentration of increases approximately linearly. At the maximum O3 mixing ratio used (577 ppbv) there is (following dilution) 375 ppbv in the IMR, which translates to a concentration (at 24 mbar and ∼298 K) of 2.1×10¹¹ molecule cm−3. This O3 concentration is comparable with those used by Teiwes et al. (2018) (∼ 1–4 ×10¹¹ molecule cm−3) or Bhujel et al. (2020) ( molecule cm−3) in their ion-trap-based, kinetic investigations of the formation of when reacting I− with O3. Their observation that is the dominant anion is however not consistent with our results, which indicate that represents only ∼35 % of the total signal. The relative abundance of each depends not only on the O3 concentration but also on the reaction time, which, for both Teiwes et al. (2018) and Bhujel et al. (2020) was between 10–100 ms. Based on the flow into the IMR, its volume (∼50 cm3) and the pressure, we calculate a similar residence time (for neutrals) of about 25 ms. We also considered the possibility that the application in our I-CIMS of a potential difference between the entrance and exit of the IMR (to optimise ion transmission) could result in a significantly shorter IMR residence time for ions. This was assessed by calculating the drift velocity (Vd) in the IMR from the electric field strength (E∼12 V m−1) and the ion mobility (μ).
The electrical mobility of I− was calculated for our conditions (using the Mason–Schamp equation) as ∼0.15 using a collision cross-section (for an pair) of cm2 molecule−1 (McCracken, 1952). Via Eq. (1), this results in a drift velocity of 1.8 m s−1, or an ion residence time (in the ∼8 cm long IMR) of 44 ms, which is comparable to the residence time of neutrals. Note that the IMR reaction times we derive are only approximate as we do not take into account the mixing and flow dynamics in the IMR, which are likely to be complex (and possibly shorter than 25 ms) owing to sampling via a critical orifice. While we cannot rule out that our observation of IO− (and not ) being the dominant ion signal is partially caused by differences in reaction times, slight differences in O3 concentrations and differences in temperature (our IMR is at ∼15 ∘C above ambient temperature owing to the heated inlet), we note that the higher pressure of O2 (factor ∼ 1–10 ×104) in our IMR is likely to have a large effect. The presence of O2 converts back to IO−, thus competing with further oxidation (via reaction with O3) to . Additionally, the high IMR pressures (24 mbar) in our experiments are ∼ 6 orders of magnitude higher than the mbar available in the ion-trap experiments of Teiwes et al. (2018) and Bhujel et al. (2020), which will result in more rapid thermalisation of the ions present and prevent potentially non-thermal reactions and thus bias to the rate coefficients derived.
The effect of adding H2O to the IMR was explored in a further set of experiments, and the variations of the signals at mass-to-charge ratios corresponding to with [H2O] are displayed in Fig. 4. The experiments were carried out with the O3 mixing ratio fixed at either 70 or 120 ppbv, close to that typically found in the lower troposphere (∼20–100 ppbv). At the lowest H2O concentrations in our experiments, the total signal is about 30 counts. This increases by a factor of ∼10 when [H2O]IMR increases to 3×10¹⁵ molecule cm−3. Increasing the O3 mixing ratio from 70 to 120 ppbv results in an increase in the signals at 175 () and 159 () at all water vapour concentrations, whereas the signal at 143 (IO−) is reduced at the lowest water vapour concentrations. These observations reinforce the concept of a larger rate coefficient for reaction of I−(H2O) with O3 (Reaction R13a) compared to I− (Reaction R8) (Teiwes et al., 2019) and the sequential conversion of IO− to more oxidised forms as described by Reactions (R8)–(R10).

Figure 4Variation in the total ion signal (counts) due to IO−, and with the concentration of water vapour in the IMR. The results are from two sets of experiments where the O3 mixing ratio was either 70 or 120 ppbv.
Having established that all of the expected anions are present in our IMR, we can propose a route for HNO3 detection as , which involves transfer of a proton from HNO3 (a very strong acid) to the conjugate base of the respective iodine containing acids (hypoiodous, iodous and iodic acid):
Taking as an example, we see that the net reaction, () is driven by the relative stability of iodic acid compared to O3, thus bypassing the thermodynamic barrier to direct formation of from . Using heats of formation (in kJ mol−1 at 298 K) of (Eger et al., 2019), (Goos et al., 2005), (Khanniche et al., 2016) and (Goos et al., 2005), we calculate that Reaction (R16) is exothermic by ∼62 kJ mol−1.
As described above, the O3 dependence of the ion signals we observe for IO−, and is consistent with the sequential oxidation of I− by O3. However, the relative ion abundance we observe at the detector does not necessarily reflect the relative concentration of the ions in the IMR, and we cannot assign the individual contribution of any single anion to HNO3 detection. We are unable to completely shut of collisional dissociation in our I-CIMS, which may be a characteristic that is peculiar to our instrument as we do not detect weakly bound I−(R(O)OH) clusters which are commonly monitored in other instruments utilising I− chemical ionisation (Lee et al., 2014). Hence, our relative sensitivity to the components is unknown.
In order to confirm that is responsible for detection of HNO3, we examined the depletion of the signals at 143, 159 and 175 when adding very large concentrations of HNO3 to the IMR. The results, summarised in Fig. 5, indicate that all three ions are removed when the HNO3 mixing ratio was increased from zero to 80 ppbv, but with different fractional changes. This can be understood if, for example, the individual reacts with HNO3 with different rate coefficients. The solid lines in Fig. 5 represent exponential decays of each ion, with rate coefficients of for , for and for . These approximate values were derived by converting the HNO3 mixing ratio into a concentration in the IMR and assuming pseudo-first-order behaviour (i.e. negligible depletion of HNO3) so that (using as example)
where S and S( are the signals at 175 after and prior to addition of HNO3, respectively. [HNO3]IMR is the concentration (molecule cm−3) of HNO3 in the IMR, k () is the rate coefficient for reaction between HNO3 and , and t is the reaction time, which we assume to be 25 ms (see above). This analysis assumes that the re-establishment of equilibria between is minimal on the timescale of the reaction between any single and HNO3. The results indicate qualitatively that is the most reactive of the anions towards HNO3 but that all three contribute to HNO3 detection. The depletion of the summed signals versus the accompanying increase in signal due to at 62 is displayed in Fig. 6, which indicates a roughly linear relationship, confirming that is mainly responsible for detection of HNO3 in our I-CIMS. We note that the absolute increase in signal at 62 is about a factor of 100 greater than the reduction in the signal from , implying that the detection of in our instrument is inefficient.
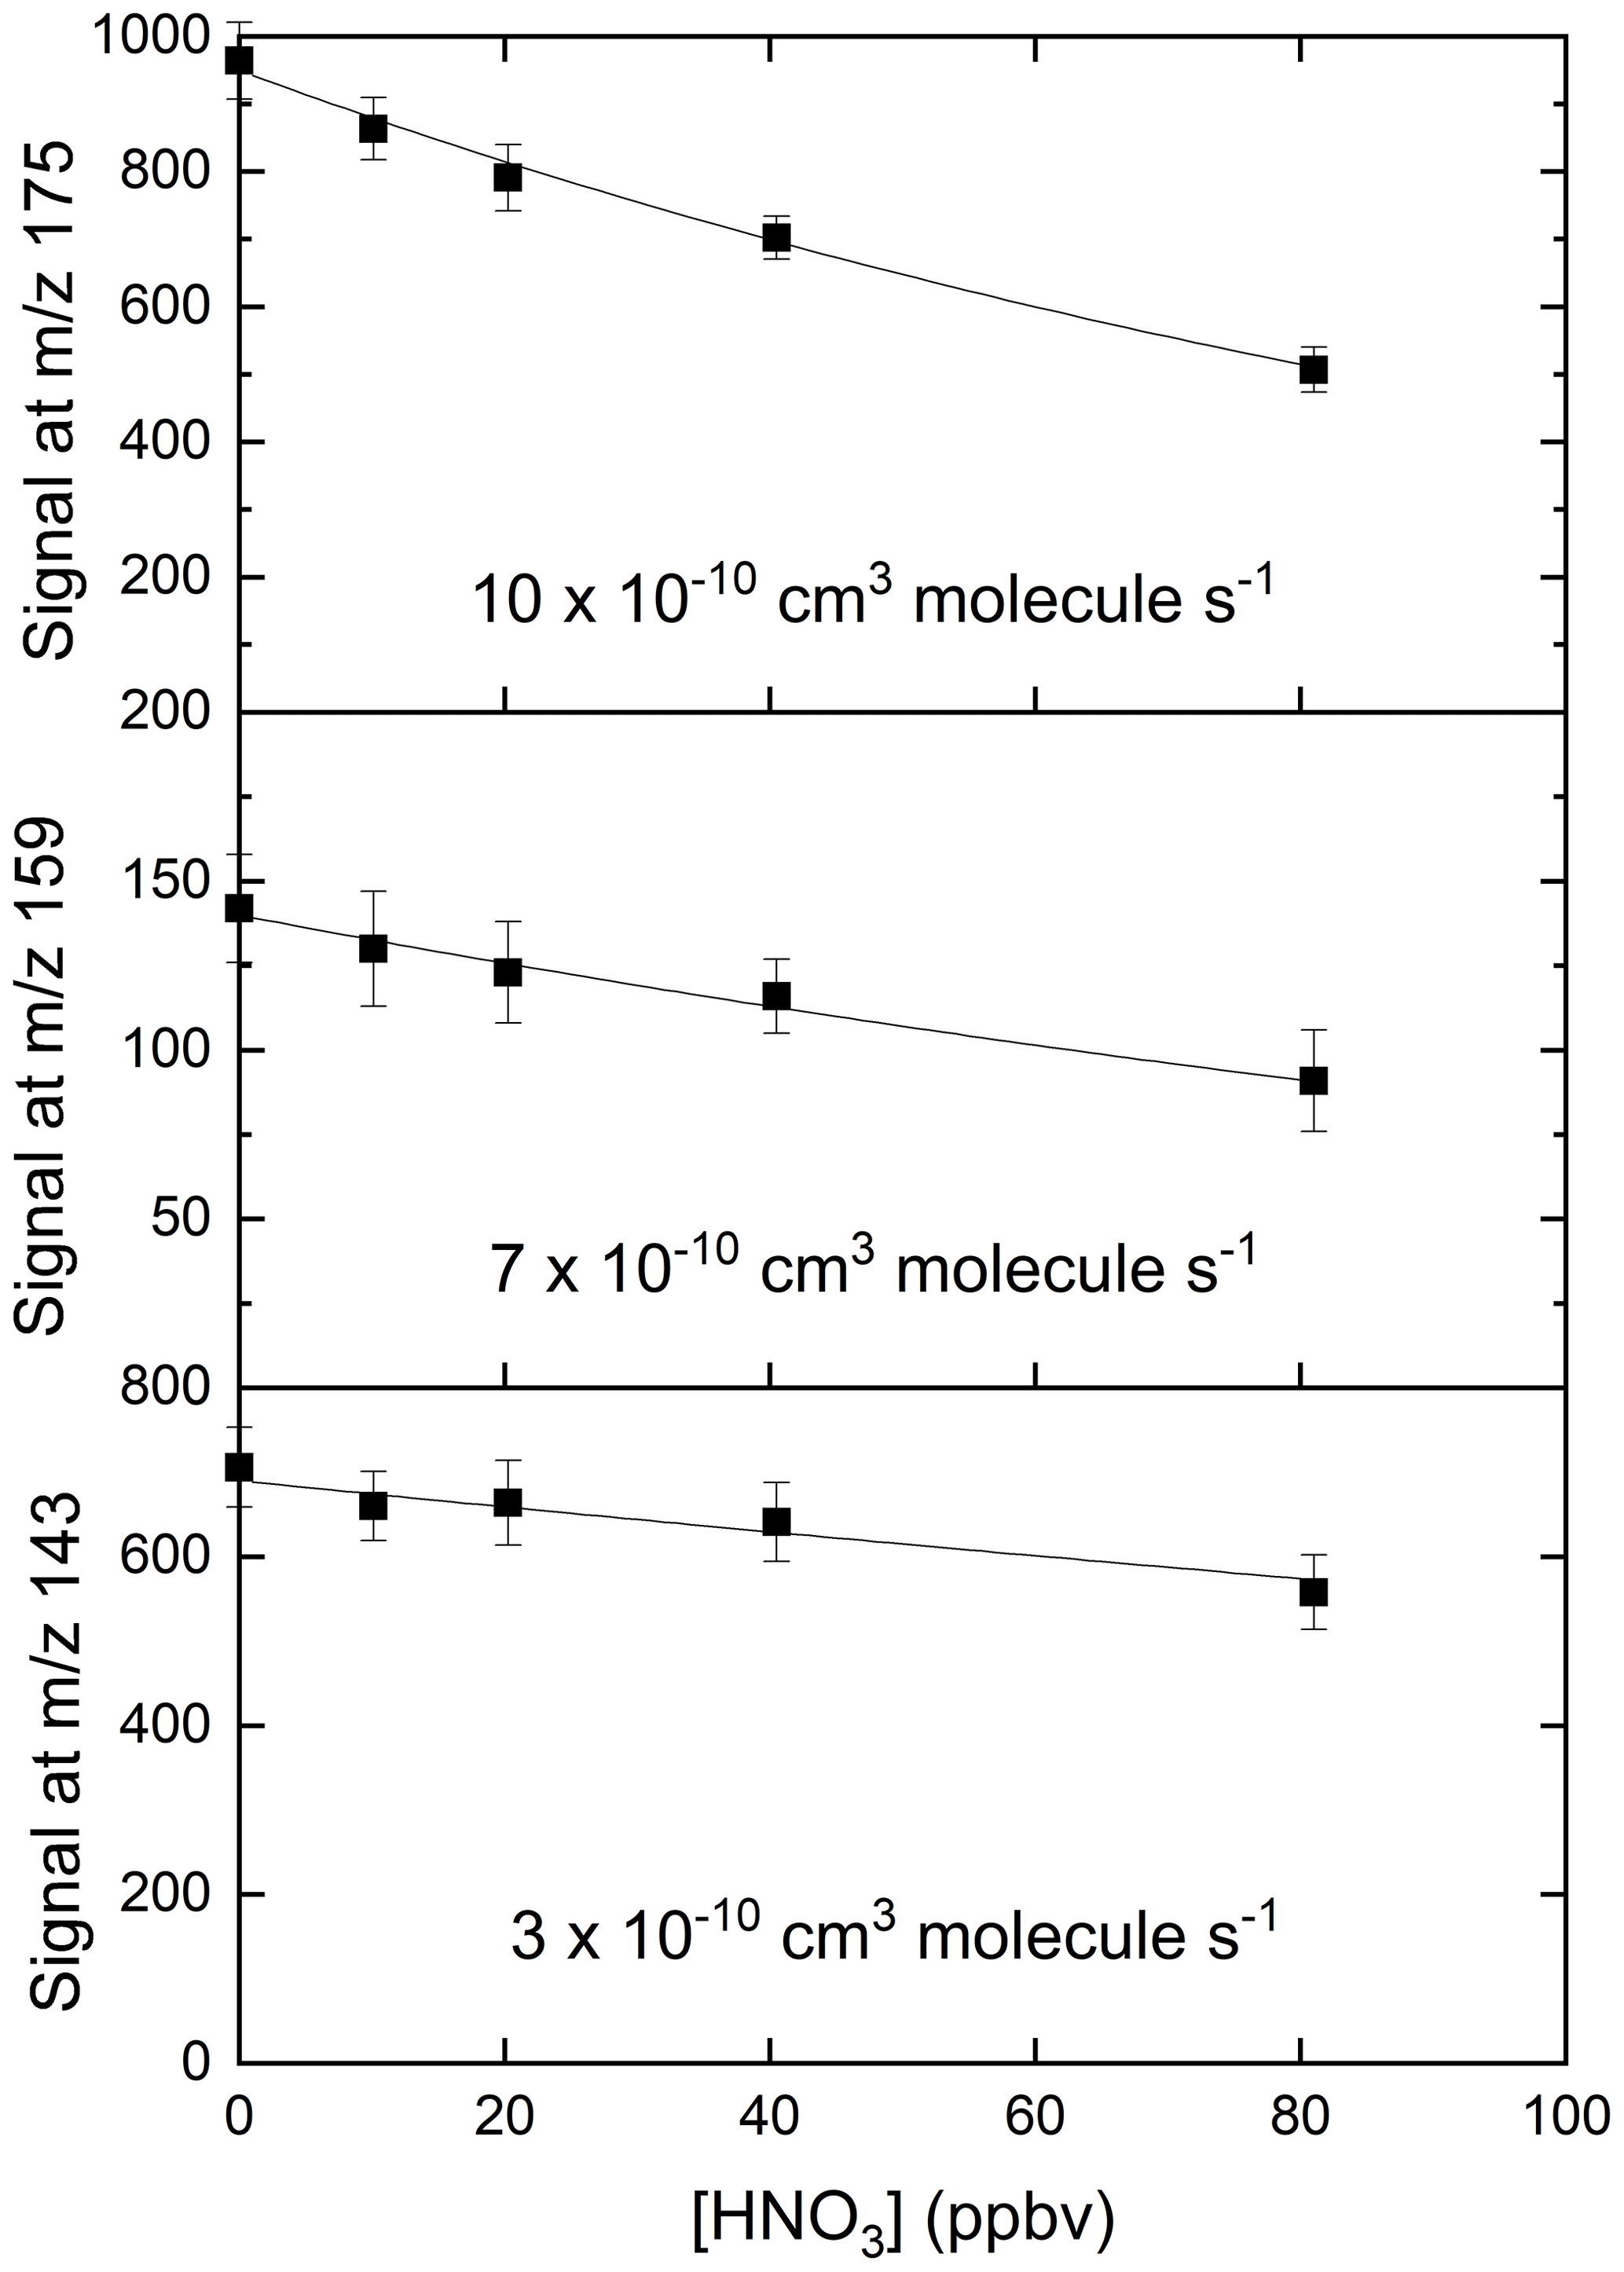
Figure 5Relative changes in signals at 143 (IO−), 159 () and 175 () when adding up to 80 ppbv of HNO3. The rate coefficients were calculated using a reaction time of 25 ms and should thus only be regarded as approximate.
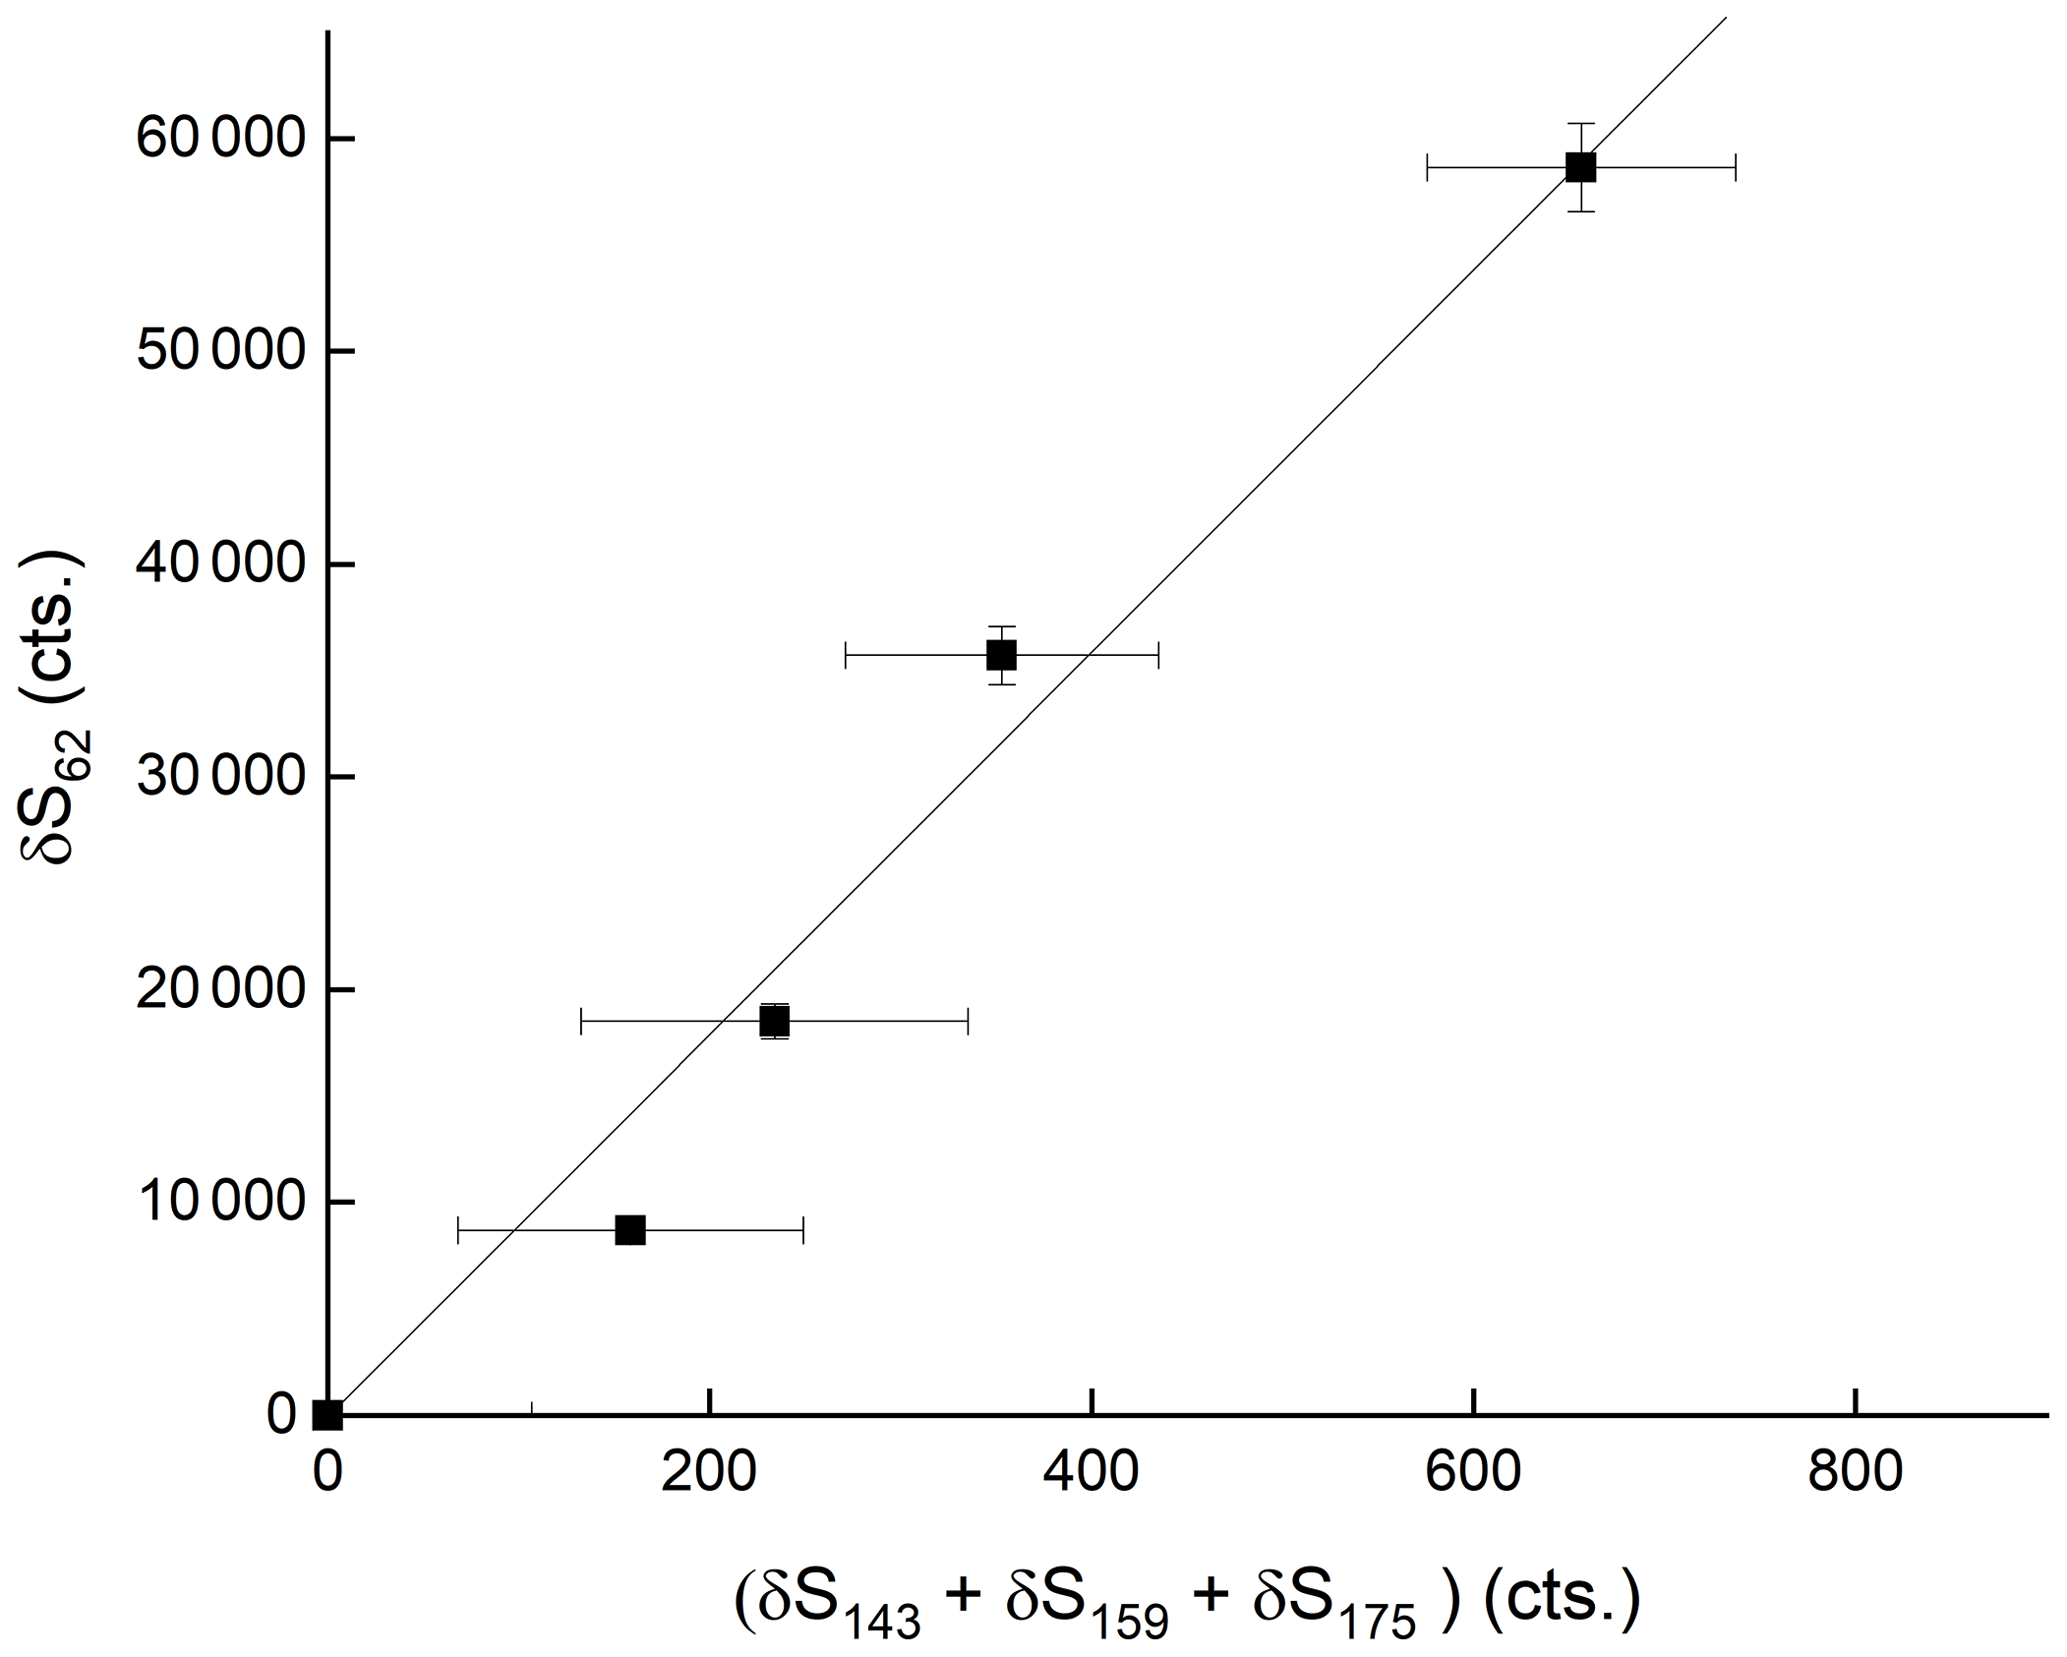
Figure 6Relative changes in the sum of signals at 143 (IO−), 159 () and 175 () when adding up to 80 ppbv of HNO3. δ refers to the change in signal upon adding HNO3 and thus takes background signals at each mass-to-charge ratio into account.
While the reactions of with HNO3 represent the most likely route to HNO3 detection at 62 in our CIMS, other possibilities are the reactions of oxide, superoxide and ozone anions () and hydrated with HNO3 as they have large rate coefficients ( ) and form (Huey, 1996; Wincel et al., 1996; Lengyel et al., 2020):
However, when adding O3 (up to 600 ppbv) to the IMR, we saw no signal that could be attributable to any oxide anion .
Figure 7a displays the dependence of the signal at 62 on the O3 mixing ratio with HNO3 held constant at 40(±6) ppbv. The dependence of the normalised signal at 62 on [O3] is clearly non-linear. We showed above that the sum of all anions increases approximately linearly with O3 mixing ratio while at the same time the behaviour of IO− and is more complex. The sensitivity of HNO3 detection to changes in O3 concentration is expected to depend not only on the individual concentrations of each anion in the IMR but also on their respective rate coefficients for reaction with HNO3 (which are different, see above), and the observed non-linearity is not surprising. The solid lines through the data points are regressions of the form
which reflects the expected, approximately exponential dependence of the concentration of in the IMR on the O3 concentration. In Eq. (2), [O3] is the O3 mixing ratio in ppbv and B has a value of per ppbv of O3. As shown in Fig. 7b, for a given [HNO3], the parameter A is dependent on the water vapour concentration (i.e. on ratio of signals at 145 and 127, () over the range explored and can be parameterised as
In these experiments, H2O was not added to the thermal dissociation (TD) inlet (this would have increased the retention time of HNO3 on inlet surfaces, thereby making changes in the 62 difficult to interpret) but directly to the IMR, as described in Sect. 2 and as used during airborne operation of the CIMS. The linear dependence of the signal at 62 on the ratio of signals at 145 and 127 at various ozone concentrations ([HNO3] fixed at 38.5 ppbv) is further highlighted in Fig. S3.
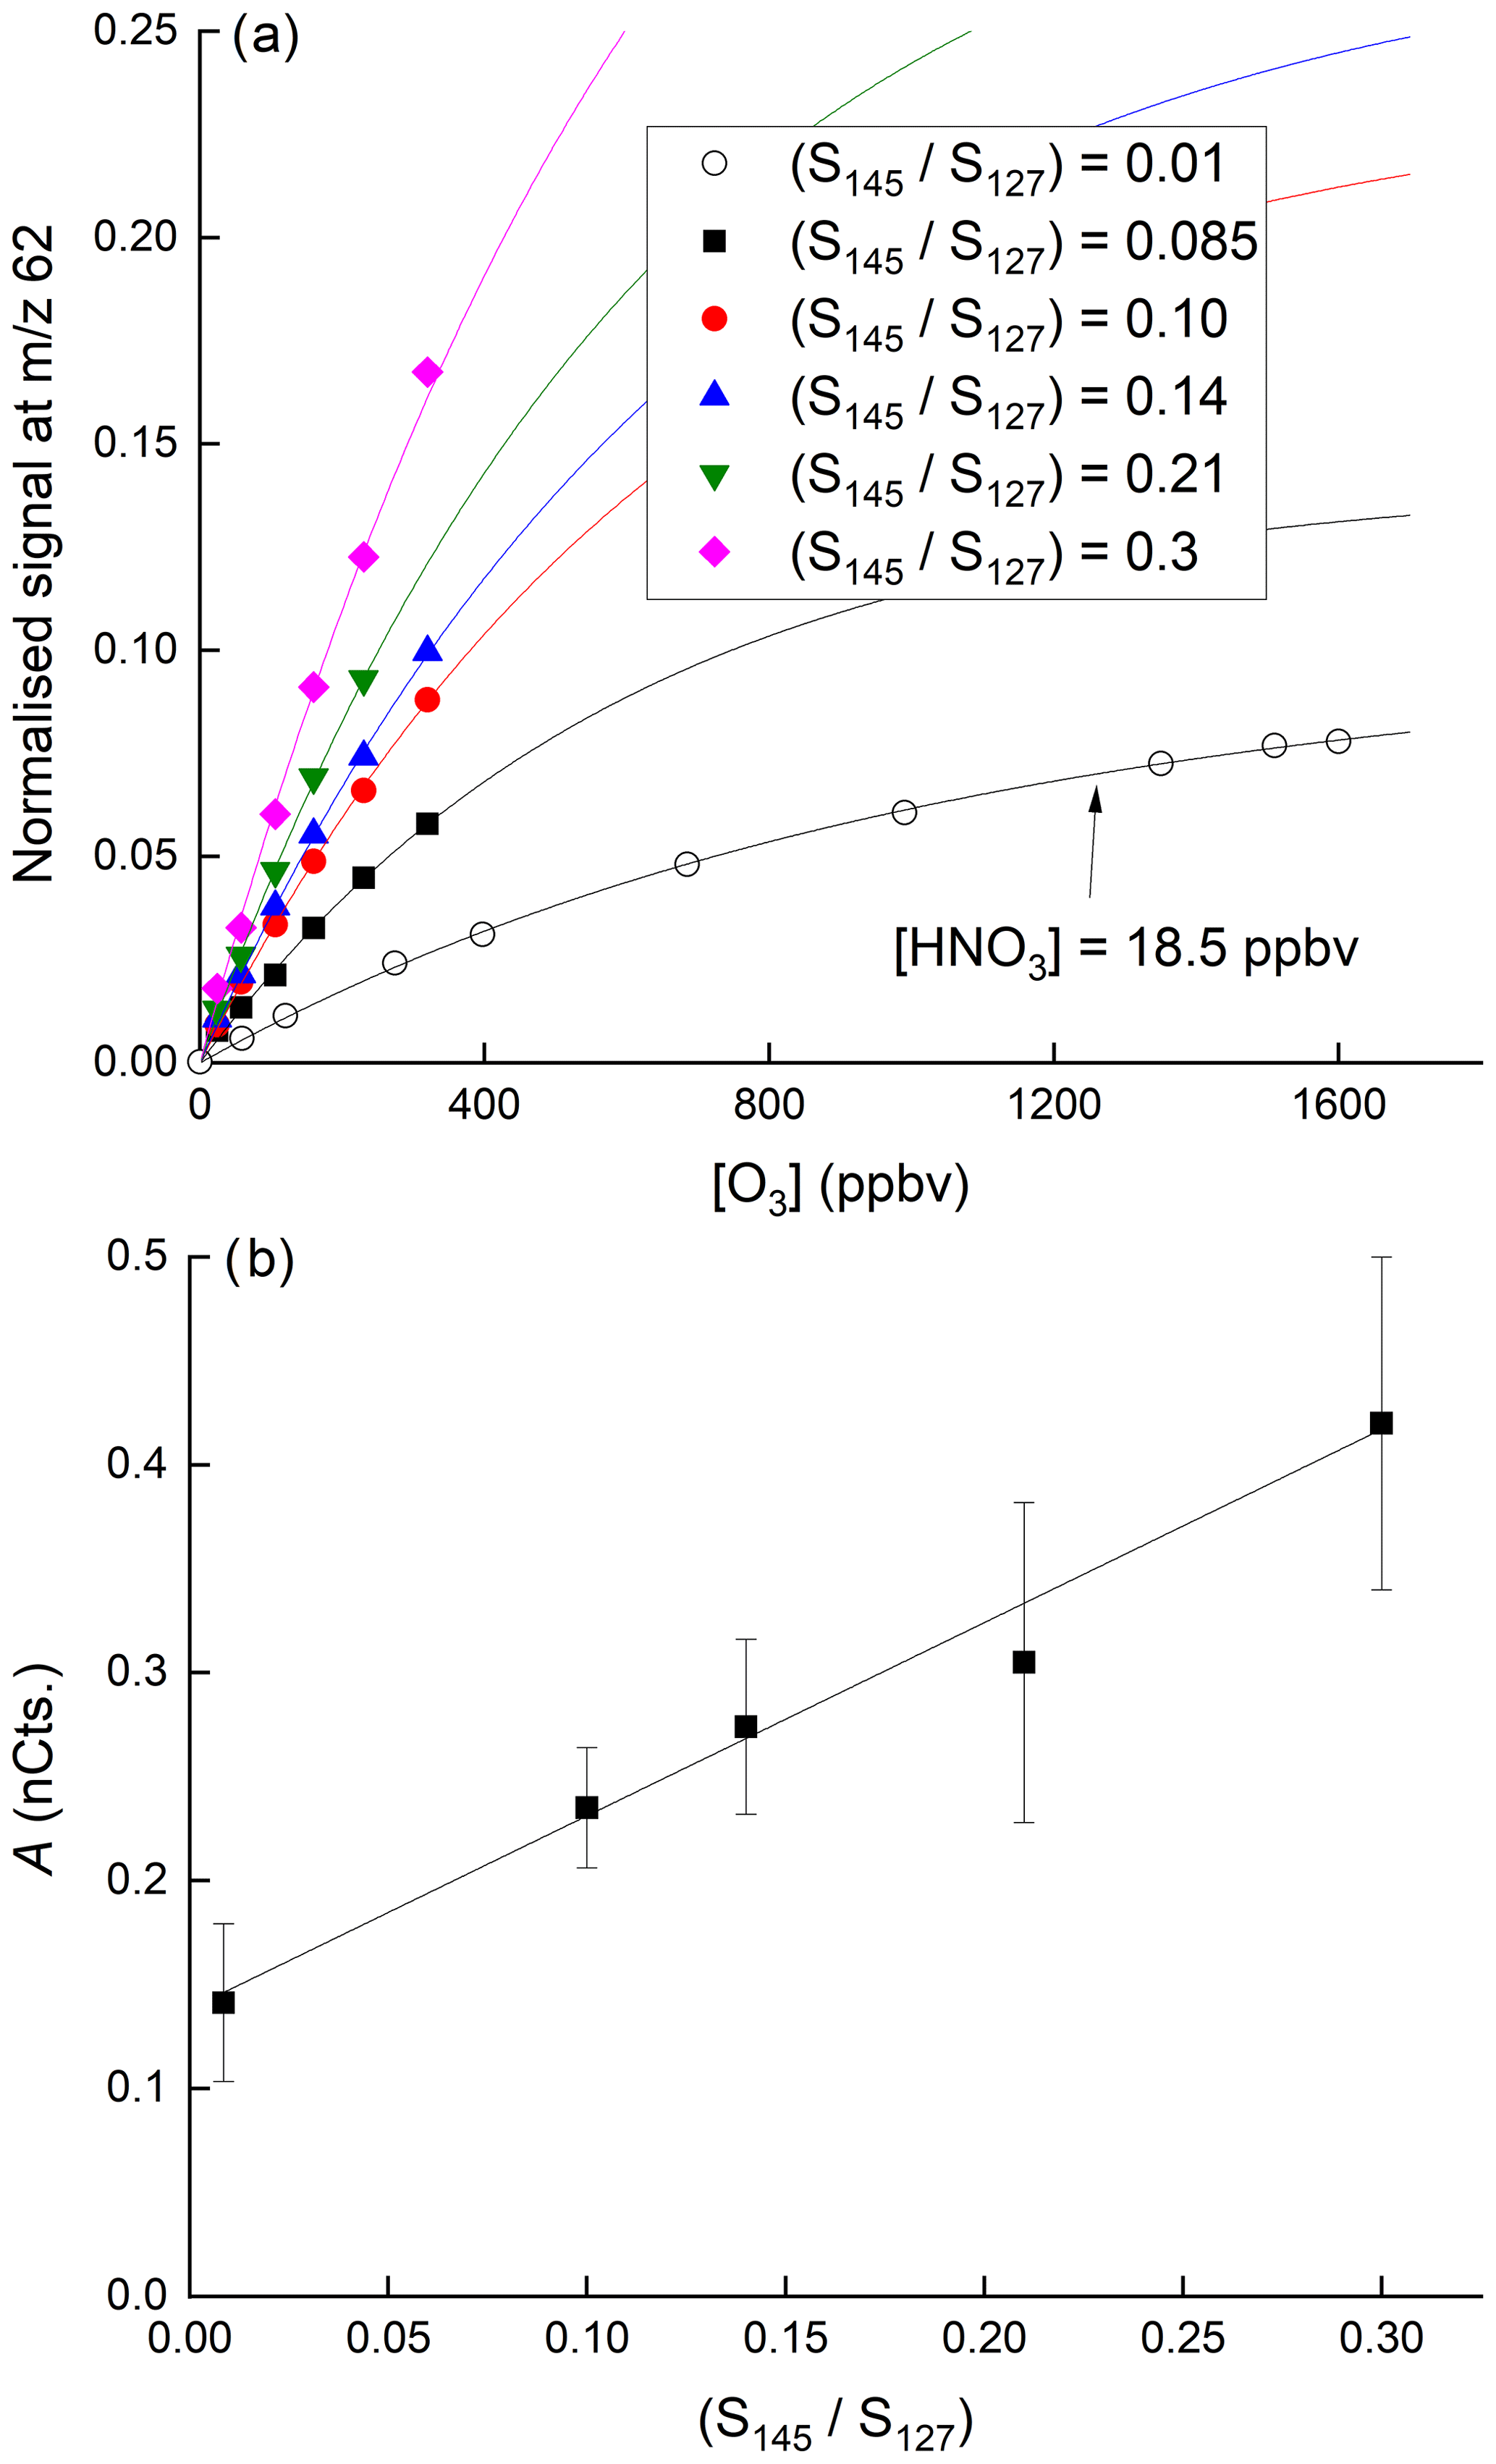
Figure 7(a) Dependence of the signal at 62 on the O3 mixing ratio for six different concentrations of H2O in the IMR. In the upper five curves (solid symbols) the HNO3 mixing ratio was 38.5 ppbv. In the lowermost curve, the HNO3 mixing ratio was 18.5 ppbv, as indicated. The fits lines are of the following form: . (b) Plot of parameter A versus the relative signal at 145 and 127.
The positive intercept in Fig. 7b indicates that there is significant sensitivity to HNO3 detection at 62 in the absence of water in the IMR, implying that anions can react directly with HNO3 to form as written in Reactions (R14)–(R16). The increase in the sensitivity to HNO3 as the water vapour concentration is increased is consistent with the formation of I−(H2O) ( 145) which reacts more rapidly with O3 (to form directly) than does I− (Teiwes et al., 2019), thereby increasing the abundance of in the IMR (see above) and thus the instrument's sensitivity to HNO3.
The very strong sensitising effect of ozone and H2O vapour can explain why similar instruments to ours observe large signals at 62 when sampling ambient air. Indeed, both O3 and HNO3 are ubiquitous and generally present at much higher levels than either NO3 or N2O5. Attempts to measure these traces gases using I-CIMS without TD inlets and NO titration (to remove the HNO3 contribution) will likely result in erroneously high levels of both, especially during the day when lower-tropospheric O3 and HNO3 are often at their highest levels. It also explains why laboratory tests (generally carried out without added O3 or H2O) have shown only low (or no) sensitivity to HNO3 at 62.
3.2 Detection of HNO3 at 190
We now compare the detection of HNO3 at 62 to its detection at 190, the I−(HNO3) adduct, with various amounts of O3 present. In Fig. 8 we present the results of an experiment in which a constant flow of HNO3 (12.5 ppbv) was introduced into the inlet and the ozone mixing ratio was varied from zero to 900 ppbv. We observe a great increase in the signal at 62 as expected (from 9 counts to >6000 counts). At zero ozone, the signal at 190 is about 1000 counts and is largely background free, making this the preferred mass to monitor HNO3 in the absence of O3. The cross-over point (when the signals at 62 and 190 are equal) is at an ozone mixing ratio of 100 ppbv. At an ozone mixing ratio of 800 ppbv, the signal at 62 is a factor 8.5 larger than that at 190.

Figure 8Dependence of the signals at 62 and 190 on the O3 mixing ratio with HNO3 fixed at 12.5 ppbv. The lines through the data are described by the expressions listed in the figure.
Apparent from this figure is the depletion of the signal at 190 as the O3 mixing ratio increases to values of 800 ppbv, as present, for example, in the lower stratosphere. The solid lines are least-squares fits to the datasets that describe the exponential growth of the 62 signal as O3 is increased and the exponential decay of 190 over the same range. The reduction in signal at 190 is characterised by an exponential term , which means that at 800 ppbv O3 a ∼30 % reduction in sensitivity is observed. The loss of sensitivity at 190 is driven by the loss of I− in the IMR as O3 is added. At the same time, the depletion of the signal at 127 is weaker, which reflects the fact that only a small fraction of formed in the IMR are detected, the rest presumably being fragmented in the CDC before being detected as I−.
The fact that some I− is converted to IOx in the IMR at high O3 levels but is not reflected in the I− signal at 127 has repercussions for normalisation of product ion signals to the primary ion signal whereby the assumption is made that the measured signal at 127 stems only from I−. In our instrument, the loss of I− in the IMR is significant at high levels of O3 (e.g. 30 % at 800 ppbv O3). For this reason, we normalise the signals using values of the signal at 127 obtained by interpolating between measurements obtained when scrubbing the air. The normalisation problem may occur in other I-CIMS instruments to varying extents, and the degree of bias will depend on the conversion of I− to and the extent to which is detected as I−. The potential bias can be circumvented by the continuous addition of a calibration gas that is detected via reaction with I−.
3.3 Detection of HNO3 at 62: the role of acetate anions
We have also evaluated the potential for “unintentional” HNO3 detection at 62 by its reaction with the acetate anion, :
The anion is the conjugate base of a weak acid (CH3C(O)OH) has been utilised to monitor a number of trace gases via proton transfer (Veres et al., 2008). While Veres et al. (2010) generated deliberately by passing acetic anhydride through their 210Po source, in our experiments it is the product (monitored at 59) of the reaction between I− primary ions and either CH3C(O)O2 (from the thermal dissociation of PAN) or CH3C(O)OOH.
Figure 9a shows the result of a set of experiments demonstrating HNO3 detection at 62 without (blue data points) and with 3.25 ppbv of CH3C(O)OOH (black data points) added to the inlet flow. The initial (non-normalised) signal at 59 from the anion in the absence of HNO3 was 53 500 counts. The presence of 3.25 ppbv CH3C(O)OOH (and resultant ) results in a ∼50-fold increase in the sensitivity of the I-CIMS to HNO3. We also carried out a few experiments (less systematic) in which PAN (instead of PAA) was added to the IMR and obtained the same results.
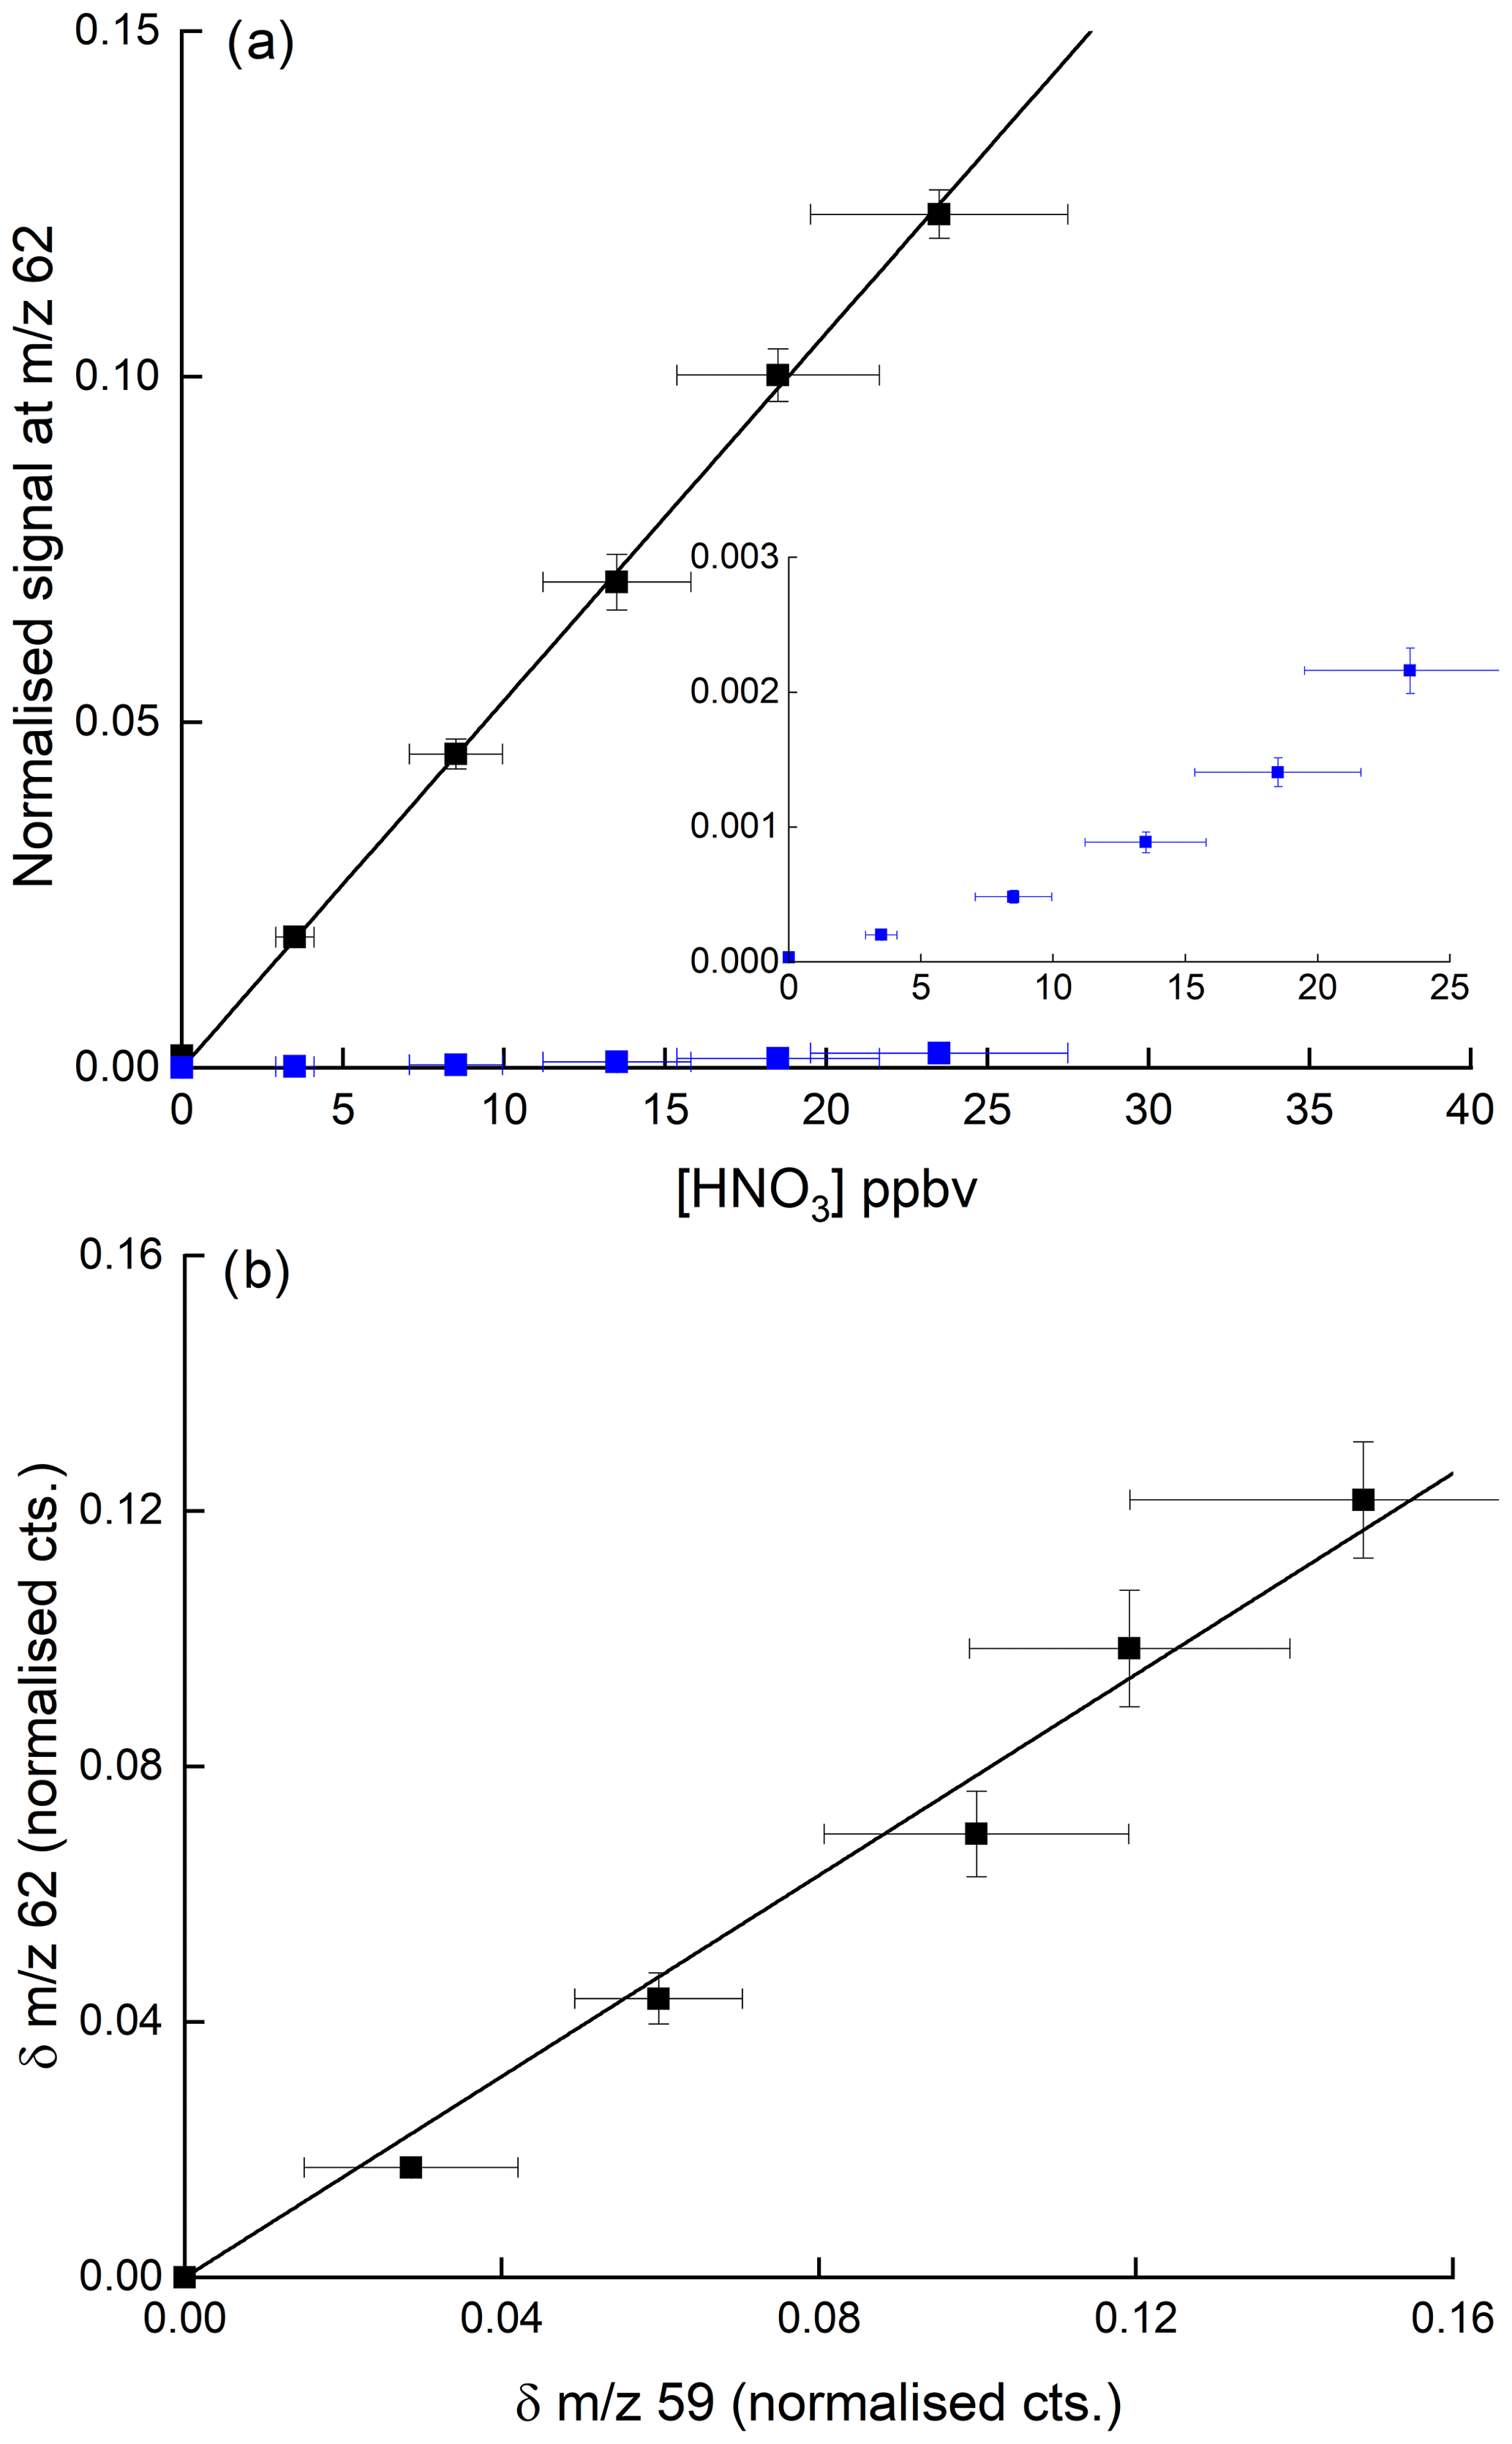
Figure 9(a) Detection of HNO3 at 62 in the presence of 3.25 ppbv PAA (and thus the acetate anion, CH3CO2). The blue data points (expanded view in the inset) were obtained in the absence of PAA, whereby detection of HNO3 at 62 is inefficient. The error bars are 1σ statistical uncertainty in the signal at 62 and 17 % total uncertainty in the HNO3 mixing ratio. (b) Change in normalised signals at 62 and 59 upon adding HNO3 for the same dataset (i.e. background corrected signals). The error bars are 1σ statistical uncertainty.
Our results disagree with the conclusions of Wang et al. (2014), who saw no increase at 62 when adding PAN to air containing HNO3 but are consistent with the use of as a primary reactant ion to detect HNO3 at 62 (Veres et al., 2008). Figure 9b indicates that the increase in signal at 62 when adding HNO3 to a flow of CH3C(O)OOH in air is approximately proportional to the reduction in the ion signal at 59. This helps confirm that is the ion responsible for the detection of HNO3 but also indicates that the detection of PAN and CH3C(O)OOH via conversion to can be compromised when HNO3 is present in the air sample. Indeed, in many air masses the concentration of HNO3 can be an order of magnitude greater than that of either PAN or CH3C(O)OOH, and given that other abundant trace gases (e.g. organic acids) also react with (Veres et al., 2008), further reactions of in the ion–molecule reactor regions of I-CIMS instruments may result in a significant bias (to lower values) which would have to be analysed case by case for different instruments. One way to avoid this problem is the continuous addition of isotopically labelled PAN to the inlet (see e.g. Roiger et al., 2011) as the secondary, reactive losses of 12C and 13C are expected to be identical.
Wang et al. (2014) observed that the majority of the 62 signal during the daytime could be removed by addition of NO (0.54 ppmv or 1.3×10¹³ molecule cm−3) to the inlet. At their inlet temperature of 120–180 ∘C, NO reacts with O3 with a rate coefficient in the range 6– , which results in a half-life for O3 of 500 to 800 ms. Wang et al. (2014) do not mention the residence time of air passing through their heated inlet, but it appears plausible that a substantial fraction of ambient O3 would have been removed during background measurement, thus decreasing (or removing) sensitivity towards HNO3 via reactions involving O3 in the IMR, and leading the authors to conclude that NO3 was being detected above a lower background than truly present.
To illustrate the potential size of the bias due to HNO3 when monitoring N2O5 at 62 in field measurements, we take the relative sensitivities (at 62) of our I-CIMS to N2O5 and to HNO3 in the presence of typical boundary layer mixing ratios of O3 (50 ppbv) and at typical relative humidity (50 %). Under these conditions, with N2O5 and HNO3 mixing ratios of 0.2 and 2 ppbv, respectively, we calculate that HNO3 would account for >70 % of the signal at 62.
Having shown that HNO3 is detected by our I-CIMS with reasonable sensitivity when sufficient O3 is present in ambient air samples, we now examine the signals at 62 obtained in airborne operation of the I-CIMS during two CAFE (Chemistry of the Atmosphere Field Experiment) campaigns of the HALO aircraft. In the CAFE-Africa campaign (2018) the I-CIMS monitored 62 on several flights over the Atlantic west of the African continent. During the 2020 CAFE-EU campaign with HALO over Europe, the I-CIMS additionally monitored 190 (the I−(HNO3) cluster ion), which is selective to HNO3. During both campaigns, O3 and H2O (required for analysis of the signal at 62) were routinely measured.
4.1 CAFE-Africa
Here we examine the results obtained during a HALO flight as part of the CAFE-Africa mission. The flight in question was the transfer from Sal airport on the Cabo Verde islands (which served as the base station during the mission) back to Germany. During the flight the aircraft flew mainly at high altitudes (13–15 km) so that stratospheric air was sampled at higher latitudes but also made two dives into the free troposphere. The flight track is displayed in Fig. S4.
Figure 10 shows a time series of ozone mixing ratios during the flight (panel a) along with the I-CIMS signal at 62 (panel b). In air masses with stratospheric influence (i.e. O3 values >100 ppb, 12:20–15:10 UTC) there is an obvious, strong co-variance between these two parameters. However, once corrected for the dependence of the sensitivity of the I-CIMS to O3 (Eqs. 2 and 3) we obtain the black line representing the mixing ratios of HNO3 and the covariance is greatly reduced. We also note that, apart from some significant increases at ∼11:30 and ∼16:00, the HNO3 mixing ratio decreases slowly throughout the flight, which is the result of HNO3 generation in the 210Po source leading to an initially large background signal. The formation of HNO3 in the 210Po source has been documented previously (Ji et al., 2020); its level can be reduced by permanently flushing N2 through the source while keeping the mass spectrometer under operational vacuum. This was not carried out during the CAFE missions on HALO as continuous operation of the instrument (i.e. overnight between flights) was not possible. We note that the background signal at 62 that originates from the polonium source cannot be obtained by scrubbing the air of HNO3 as this also removes O3 and thus also sensitivity to HNO3 at this mass.
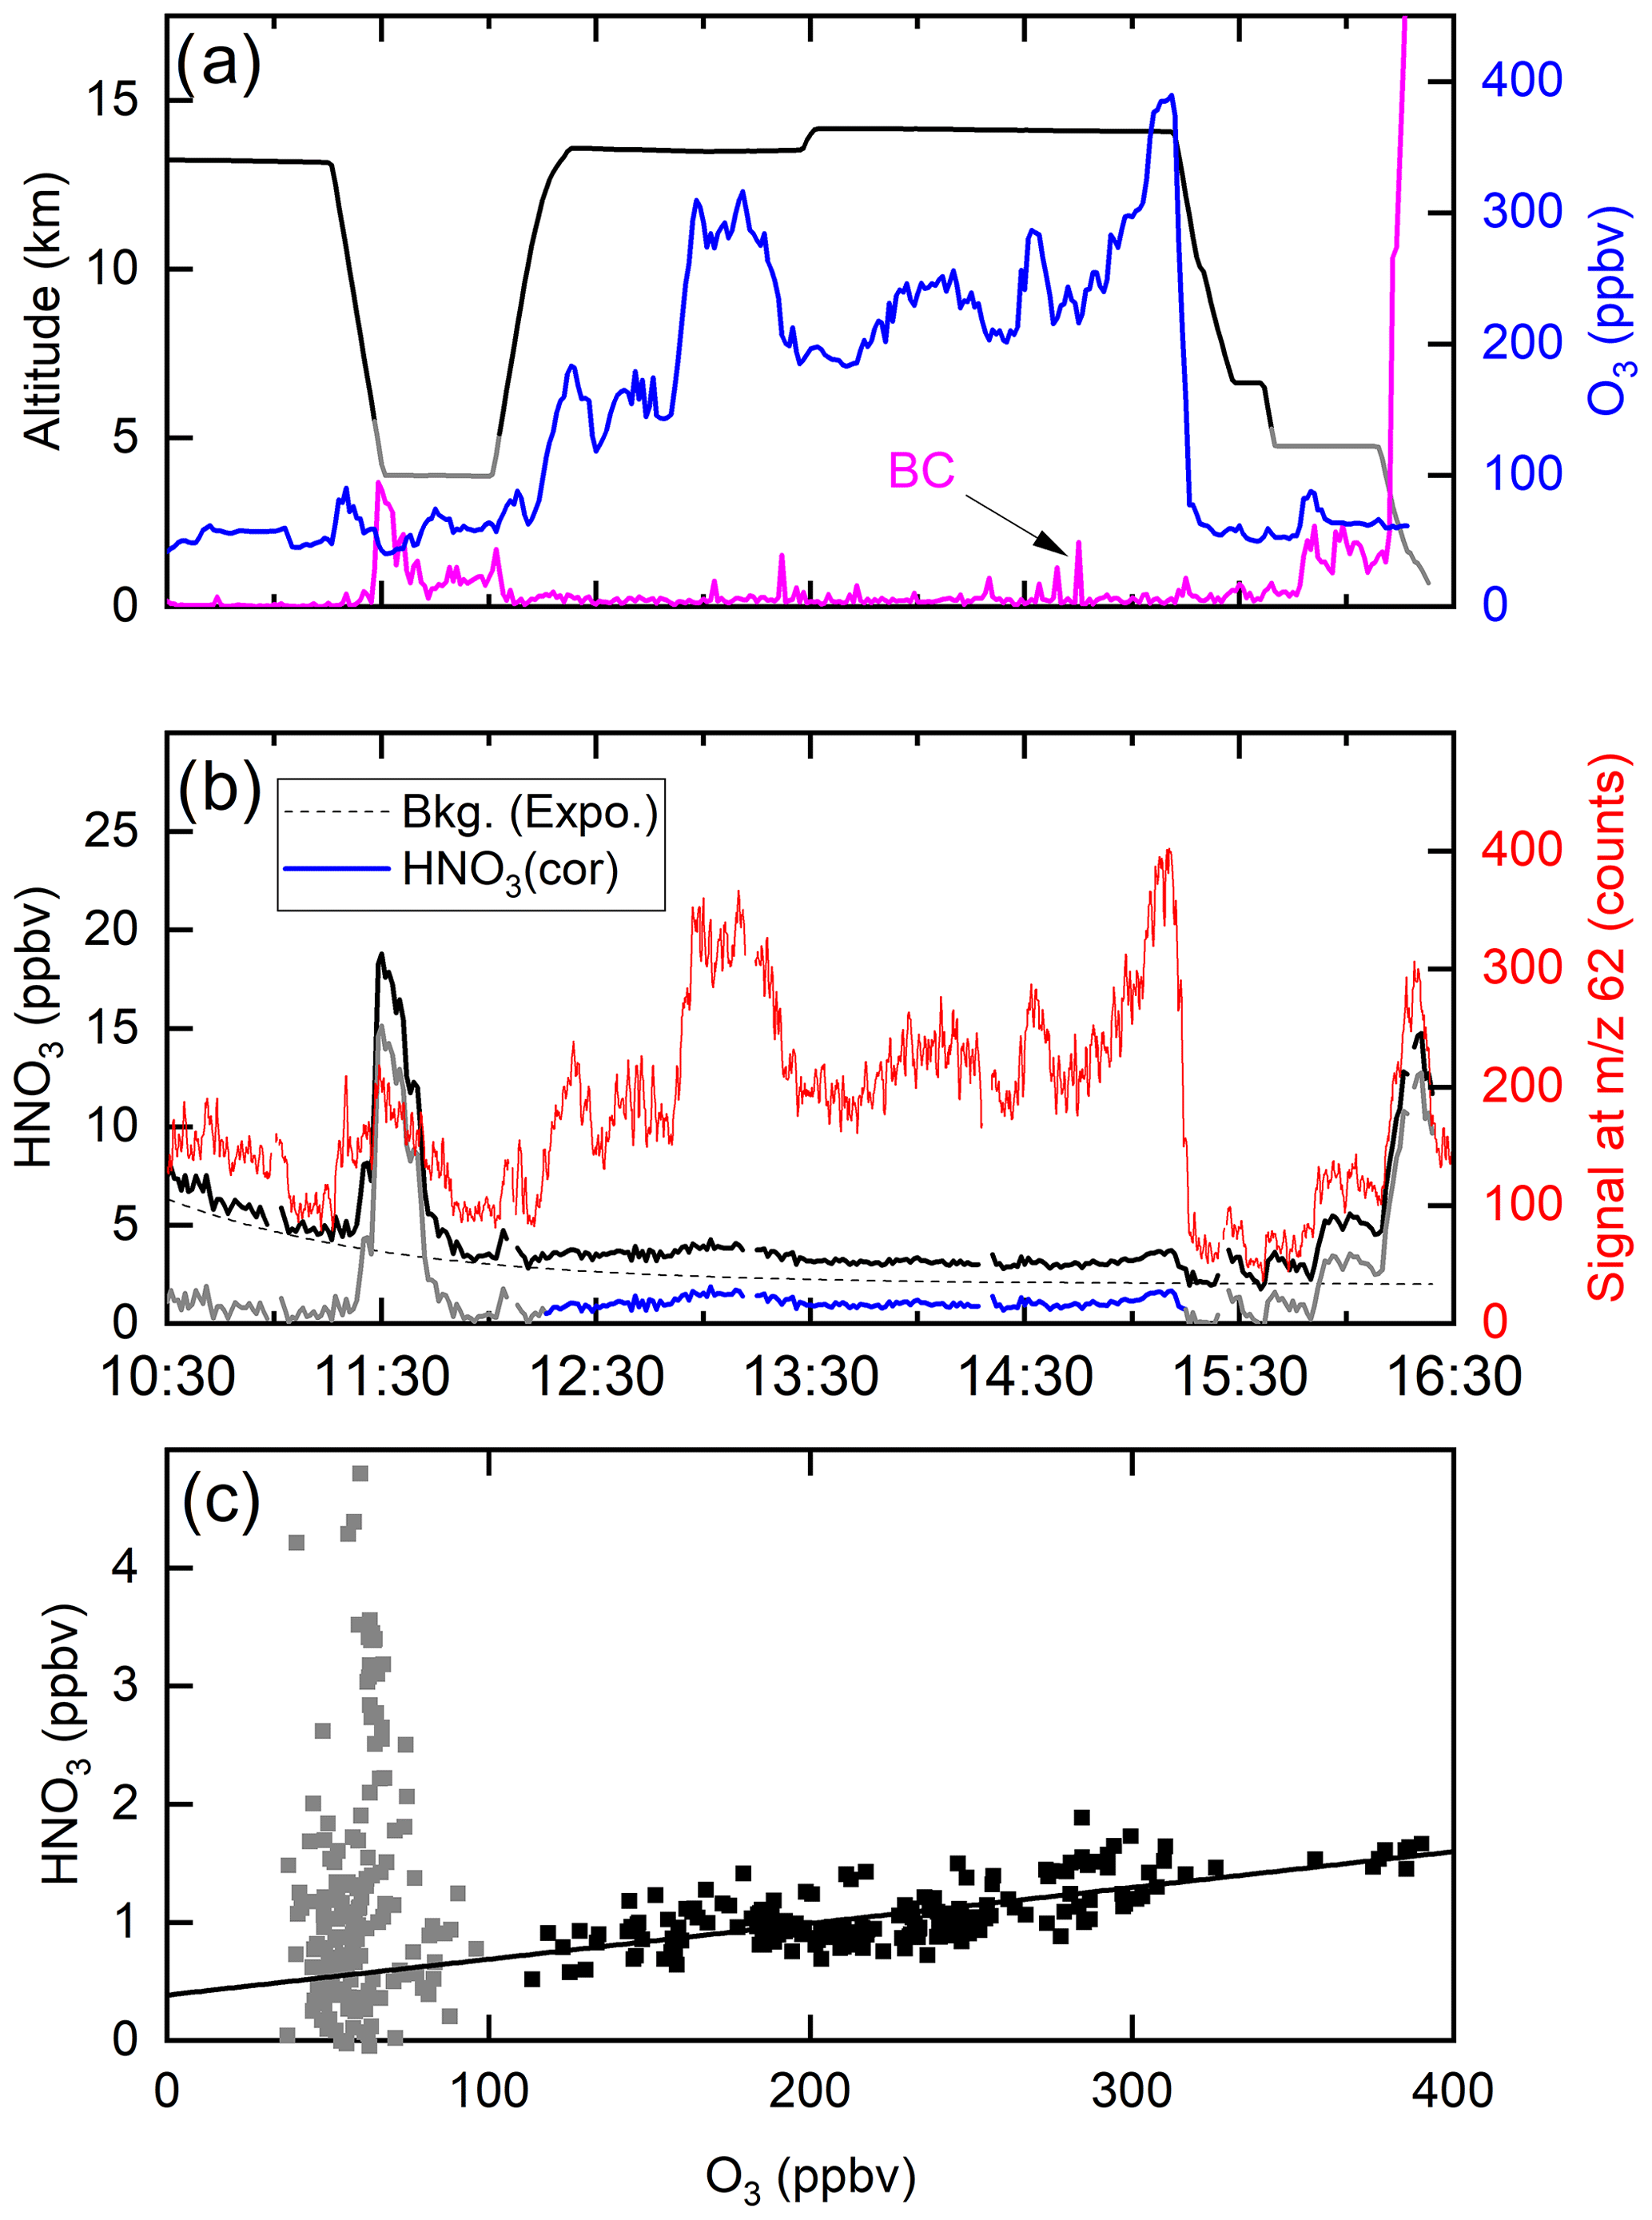
Figure 10(a) Altitude (black) and O3 mixing ratios (blue) from a HALO flight during the CAFE-Africa campaign. The purple line (arbitrary units) is proportional to the black-carbon particle number density (BC). (b) The signal at 62 (red line) clearly co-varies with O3. Following conversion to a mixing ratio (black line) and subtraction of an HNO3 background signal (dotted line, assuming an exponential decay) originating in the 210Po source, the solid blue line for HNO3 is obtained (HNO3 cor). (c) HNO3 mixing ratios plotted versus O3 mixing ratios. The straight black line has a slope of and does not take into account the grey data points (O3 mixing ratio <100 ppbv).
A roughly exponential decay of the HNO3 background signal was observed in all of the flights in which 62 was monitored, which presumably reflects depletion of the initially large HNO3 reservoir which was built up when the I-CIMS was switched off.
A coarse correction of the dataset was thus undertaken by subtracting an exponentially decaying background from the total HNO3 signal. The resulting HNO3 mixing ratios are depicted as the blue line in Fig. 10b and plotted against the O3 mixing ratio in Fig. 10c. Considering only the high-altitude data for which O3 mixing ratios were >100 ppbv (stratospheric influence, black data points), we derive a slope of (the uncertainty is 2σ, statistical only), which is consistent with previously reported values obtained in airborne measurements of HNO3 and O3 in the lower stratosphere (see Popp et al., 2009, and references therein). We stress that deriving accurate mixing ratios of HNO3 is not possible with this dataset, and the values obtained are strongly dependent on the background correction. Here, we merely wish to indicate that, while most of the variability in our 62 signal is related to the central role of ozone in the detection scheme (i.e. formation of ), some covariance between HNO3 and O3 remains after correction of the raw data and the slope is roughly in line with that expected. We also do not propose that the correlation of 62 with O3 proves that the signal can be attributed entirely to HNO3. This aspect will be covered in Sect. 4.2.
Figure 10b reveals sharp increases in the (background-corrected) HNO3 mixing ratio when sampling at lower altitudes, noticeably at 11:30–12:00 (3.9 km altitude) and at 15:45–16:10 (4.7 km altitude) and at the end of the flight during descent to Oberpfaffenhofen in Bavaria, Germany. In all cases, these periods of enhanced HNO3 coincided with higher levels of particles. Back trajectories (HYSPLIT) indicated that, in the 10 d prior to interception by HALO, the air mass sampled at 11:30 had passed over the West African continent (Mauritania, Mali and Niger), whereas the air masses sampled after 16:00 were of European origin. The large, coincidental increase in the HNO3 mixing ratio and particle mass was a recurrent feature of the CAFE-Africa flights. It is conceivable that the HNO3 measured by the I-CIMS was a mixture of gas-phase HNO3 and HNO3 associated with particles that desorb HNO3 when passing through the thermal dissociation inlet at 180 ∘C. This temperature would be sufficient to thermally convert ammonium nitrate to HNO3 (and NH3) as well as to result in the desorption of HNO3 that was physisorbed, for example, on chemically aged black-carbon or mineral-dust particles. As we do not know the efficiency with which particles of various diameters enter the TD inlet of the CIMS, we cannot estimate the relative contribution of gas-phase and particulate nitrate to the signal at 62 but indicate that a similar phenomenon may occur in ground-based measurements using TD inlets and may represent an additional source of bias during ambient measurements of NO3 and/or N2O5 at 62.
4.2 CAFE-EU
During the CAFE-EU HALO flights the I-CIMS monitored 190, the I−(HNO3) adduct, as well as at 62. The detection of HNO3 at 190 varies with the water vapour concentration in the IMR: the response of the HNO3 signal at 190 to changes in the HNO3 concentration and in the ratio (i.e. the relative humidity in the IMR, see Fig. S2) is illustrated in Fig. S5.
Figure 11 displays a set of data obtained during a flight on 30 May 2020 on which the HALO aircraft flew a path from southern Germany to the Atlantic (west of Ireland) and back at various altitudes (for flight track see Fig. S6). Figure 11a plots the raw signals measured by the I-CIMS at 62 and 190 as well as the O3 mixing ratio. Similar to the CAFE-Africa dataset, the signal at 62 covaries strongly with the O3 mixing ratios, which were between ∼40 and ∼700 ppbv, whereas the raw signals at 62 and 190 (both due to HNO3) bear little resemblance to each other.
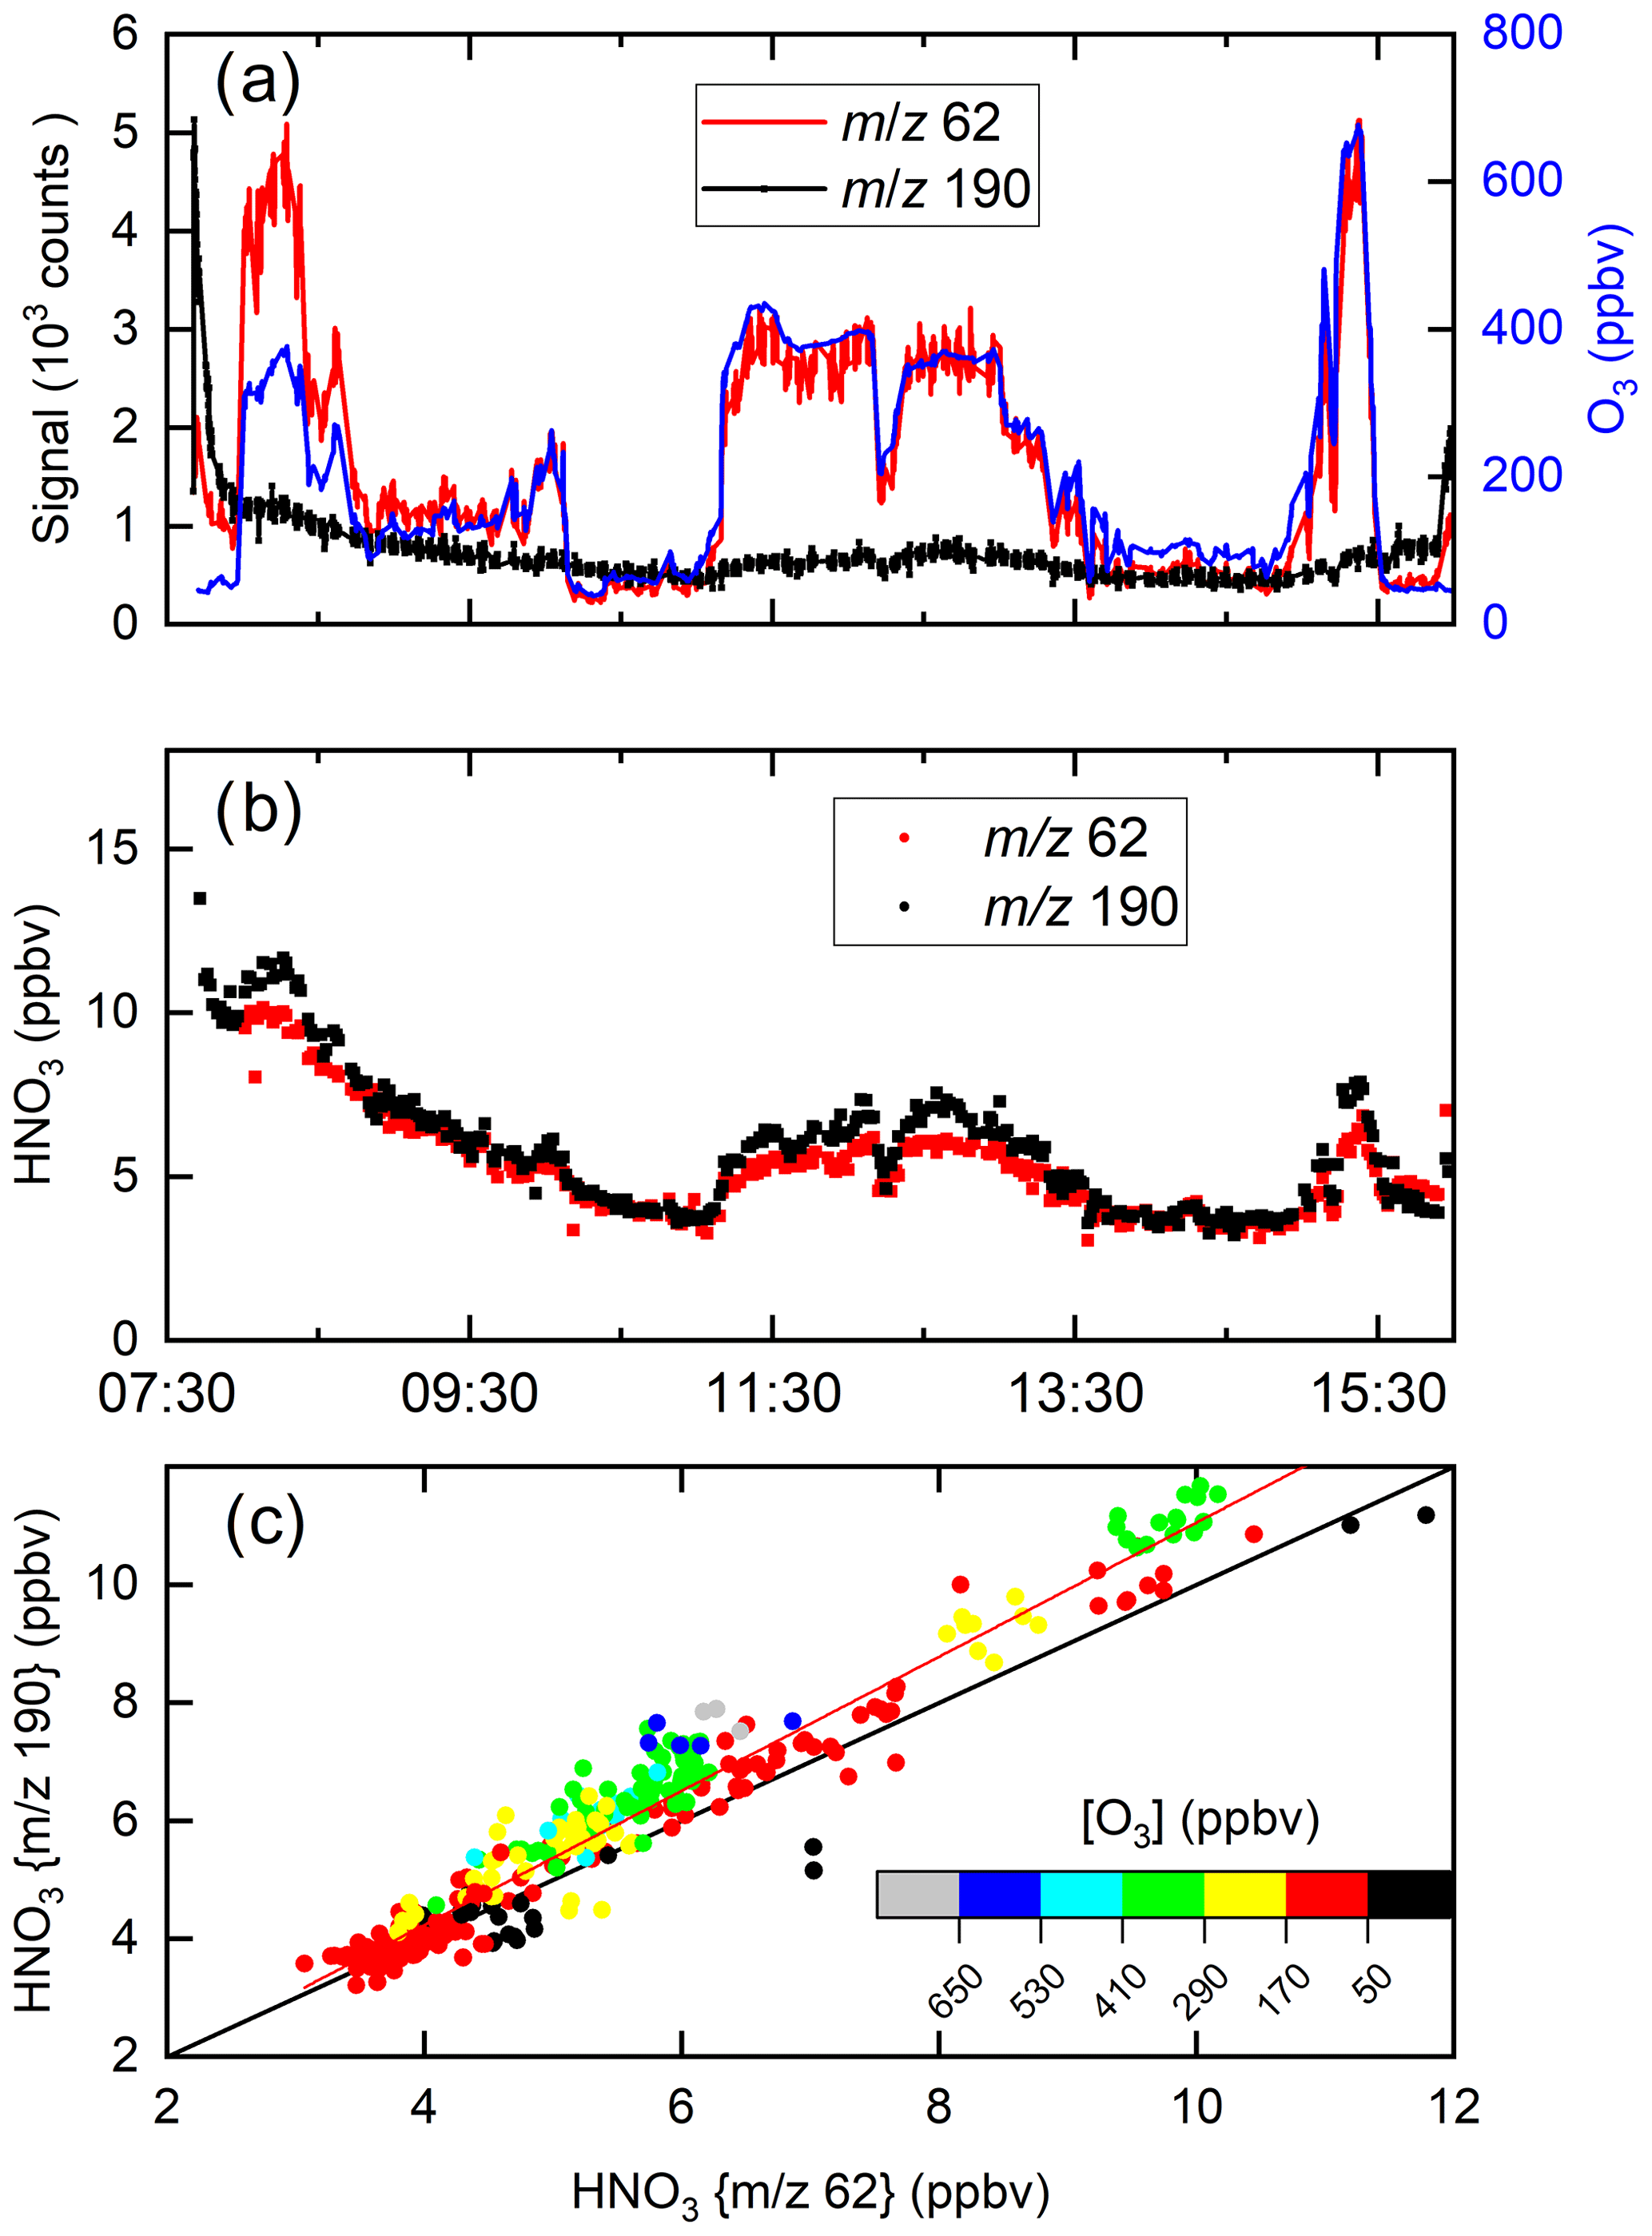
Figure 11I-CIMS HNO3 measurements and auxiliary data from a HALO flight during the CAFE-EU campaign. (a) Signals at 62 and 190 as well as O3 mixing ratios. (b) HNO3 mixing ratios derived from the signals at 62 and 190 taking the dependence of sensitivity on ozone and relative humidity into account. (c) Correlation of the HNO3 mixing ratios derived from the two masses. The red line is a bivariate fit (slope 1.14±0.05, intercept ), and the black line is a 1:1 line. A large fraction of the HNO3 measured stems from the polonium source, especially at the beginning of the flight.
Using the calibration parameters described in Sect. 3 and (for 190) in Fig. S3, the signals at 62 and 190 were converted to HNO3 mixing ratios, depicted in Fig. 11b. Despite the greatly divergent raw signals, the HNO3 mixing ratios obtained using the different mass-to-charge ratios are in reasonable agreement, both displaying a gradual decrease after take-off at ∼ 08:00 UTC. The high initial level of HNO3 is largely the result of HNO3 being formed in the 210Po source during overnight instrument shut-down (see Sect. 4.1). The HNO3 mixing ratios observed at 62 and 190 both increase when the aircraft sampled stratospheric air (11:00 to 13:00 and 15:10 to 15:30 UTC). In Fig. 11c HNO3 mixing ratios derived at 62 and 190 are plotted in a correlation diagram. The slope (1.14±0.05) and intercept () indicate reasonable agreement even when the raw signals are greatly divergent at high levels of O3. At the highest levels of O3, some differences in the retrieved mixing ratios of HNO3 using 62 and 190 are observed, which, given the large, O3-dependent corrections applied (especially for 62), is not surprising. Our airborne data show that in many (if not most) air masses, 62 provides a measure of HNO3 rather than NO3 and N2O5.
A series of laboratory experiments investigating the origin of signal at 62 when using an I-CIMS has revealed unexpected sensitivity to HNO3 at this mass-to-charge ratio in the presence of O3 or peroxyacetic acid (PAA) or PAN. The ozone effect is related to the formation of , which reacts rapidly with HNO3 to form thus bypassing the thermodynamic barrier to formation of by direct reaction of HNO3 with I−. The presence of O3 at a mixing ratio of 500 ppbv results in a 250-fold increase in sensitivity to HNO3 at 62. The sensitivity to HNO3 at this mass-to-charge ratio was also found to be highly dependent on the concentration of H2O in the ion–molecule reactor as this aids formation of . The sensitivity to HNO3 at 62 in the presence of PAA is a result of the presence of acetate anions () as demonstrated previously (Veres et al., 2008). We conclude that measurements of PAN using I-CIMS may be biased to low values if large mixing ratios of HNO3 (or organic acids) are present and continuous calibration (e.g. with isotopically labelled PAN) is not carried out. Our laboratory experiments indicate that measurements of atmospheric NO3 and N2O5 at 62 can be heavily biased by the presence of HNO3 and may explain reports of unexpectedly high daytime mixing ratios of N2O5. The relative sensitivity at 62 to HNO3 and will vary from one I-CIMS instrument to the next and must thus be analysed case by case.
We have examined signals at 62 during two periods of operation of the I-CIMS on the HALO aircraft: one over the Atlantic west of the African coast and one over Europe. During the flights over Europe HNO3 mixing ratios derived from 62 and at 190 (I−(HNO3)) were in good agreement. The data obtained over the Atlantic indicated that measurements at 62 using a thermal dissociation inlet can be strongly influenced by particulate nitrate that can thermally dissociate (or desorb) to gas-phase HNO3.
Data measured during the flight campaign CAFE campaigns are available to all scientists agreeing to the CAFE data protocol. The laboratory data underlying the figures are available upon request to the authors.
The supplement related to this article is available online at: https://doi.org/10.5194/amt-14-5319-2021-supplement.
RD conducted the laboratory experiments, carried out the airborne measurements with assistance from PE and JNC, and analysed the laboratory data with assistance from JNC. The manuscript was written by JNC and RD with contributions from all other authors. JL designed and helped plan the airborne operations.
The authors declare that they have no conflict of interest.
Publisher's note: Copernicus Publications remains neutral with regard to jurisdictional claims in published maps and institutional affiliations.
We acknowledge the collaboration with the DLR (German Aerospace Centre) during the HALO campaigns CAFE-Africa and CAFE-EU. We thank Florian Obersteiner and Andreas Zahn (KIT-Karlsruhe) for use of the O3 data during CAFE-Africa and CAFE-EU.
The article processing charges for this open-access publication were covered by the Max Planck Society.
This paper was edited by Fred Stroh and reviewed by three anonymous referees.
Ammann, M., Cox, R. A., Crowley, J. N., Herrmann, H., Jenkin, M. E., McNeill, V. F., Mellouki, A., Rossi, M. J., Troe, J., and Wallington, T. J.: Atmospheric Chemical Kinetic Data Evaluation, available at: http://iupac.pole-ether.fr/index.html, last access: 20 July 2021.
Atkinson, R., Baulch, D. L., Cox, R. A., Crowley, J. N., Hampson, R. F., Hynes, R. G., Jenkin, M. E., Rossi, M. J., and Troe, J.: Evaluated kinetic and photochemical data for atmospheric chemistry: Volume I – gas phase reactions of Ox, HOx, NOx and SOx species, Atmos. Chem. Phys., 4, 1461–1738, https://doi.org/10.5194/acp-4-1461-2004, 2004.
Bhujel, M., Marshall, D. L., Maccarone, A. T., McKinnon, B. I., Trevitt, A. J., da Silva, G., Blanksby, S. J., and Poad, B. L. J.: Gas phase reactions of iodide and bromide anions with ozone: evidence for stepwise and reversible reactions, Phys. Chem. Chem. Phys., 22, 9982–9989, https://doi.org/10.1039/d0cp01498b, 2020.
Chang, W. L., Bhave, P. V., Brown, S. S., Riemer, N., Stutz, J., and Dabdub, D.: Heterogeneous atmosperic chemistry, ambient measurements and model calculatuons of N2O5: A review, Aerosol Sci. Tech., 45, 655–685, https://doi.org/10.1080/02786826.2010.551672, 2011.
Crowley, J. N., Ammann, M., Cox, R. A., Hynes, R. G., Jenkin, M. E., Mellouki, A., Rossi, M. J., Troe, J., and Wallington, T. J.: Evaluated kinetic and photochemical data for atmospheric chemistry: Volume V – heterogeneous reactions on solid substrates, Atmos. Chem. Phys., 10, 9059–9223, https://doi.org/10.5194/acp-10-9059-2010, 2010.
Davidson, J. A., Viggiano, A. A., Howard, C. J., Dotan, I., Fehsenfeld, F. C., Albritton, D. L., and Ferguson, E. E.: Rate Constants for Reactions of , , NO+, H3O+, , , and Halide Ions with N2O5 at 300 K, J. Chem. Phys., 68, 2085–2087, 1978.
Dubé, W. P., Brown, S. S., Osthoff, H. D., Nunley, M. R., Ciciora, S. J., Paris, M. W., McLaughlin, R. J., and Ravishankara, A. R.: Aircraft instrument for simultaneous, in situ measurement of NO3 and N2O5 via pulsed cavity ring-down spectroscopy, Rev. Sci. Instrum., 77, 034101, https://doi.org/10.1063/1.2176058, 2006.
Dulitz, K., Amedro, D., Dillon, T. J., Pozzer, A., and Crowley, J. N.: Temperature-(208–318 K) and pressure-(18–696 Torr) dependent rate coefficients for the reaction between OH and HNO3, Atmos. Chem. Phys., 18, 2381–2394, https://doi.org/10.5194/acp-18-2381-2018, 2018.
Eger, P. G., Helleis, F., Schuster, G., Phillips, G. J., Lelieveld, J., and Crowley, J. N.: Chemical ionization quadrupole mass spectrometer with an electrical discharge ion source for atmospheric trace gas measurement, Atmos. Meas. Tech., 12, 1935–1954, https://doi.org/10.5194/amt-12-1935-2019, 2019.
Fehsenfeld, F. C., Howard, C. J., and Schmeltekopf, A. L.: Gas phase ion chemistry of HNO3, J. Chem. Phys., 63, 2835–2841, https://doi.org/10.1063/1.431722, 1975.
Fischer, H., Waibel, A. E., Welling, M., Wienhold, F. G., Zenker, T., Crutzen, P. J., Arnold, F., Burger, V., Schneider, J., Bregman, A., Lelieveld, J., and Siegmund, P. C.: Observations of high concentrations of total reactive nitrogen (NOy) and nitric acid (HNO3) in the lower Arctic stratosphere during the stratosphere-troposphere experiment by aircraft measurements (STREAM) II campaign in February 1995, J. Geophys. Res.-Atmos., 102, 23559–23571, https://doi.org/10.1029/97jd02012, 1997.
Goos, E., Burcat, A., and Ruscic, B.: Extended Third Millennium Ideal Gas and Condensed Phase Thermochemical Database for Combustion with Updates from Active Thermochemical Tables: Update of “Third Millennium Ideal Gas and Condensed Phase Thermochemical Database for Combustion with Updates from Active Thermochemical Tables by Alexander Burcat and Branko Ruscic”, Aerospace Engineering, and Argonne National Laboratory, Chemistry Division, Rep. ANL 05/20 and TAE 960 Technion-IIT, September 2005.
Hanson, D. R. and Ravishankara, A. R.: The reaction probabilities of ClONO2 and N2O5 on polar stratospheric cloud material, J. Geophys. Res., 96, 5081–5090, 1991.
Huey, L. G.: The kinetics of the reactions of Cl−, O−, and with HNO3: Implications for measurement of HNO3 in the atmosphere, Int. J. Mass Spectrom., 153, 145–150, https://doi.org/10.1016/0168-1176(95)04354-3, 1996.
Huey, L. G.: Measurement of trace atmospheric species by chemical ionization mass spectrometry: Speciation of reactive nitrogen and future directions, Mass Spectrom. Rev., 26, 166–184, https://doi.org/10.1002/mas.20118, 2007.
Huey, L. G., Hanson, D. R., and Howard, C. J.: Reactions of and I− with atmospheric trace gases, J. Phys. Chem., 99, 5001–5008, https://doi.org/10.1021/j100014a021, 1995.
Iyer, S., He, X. C., Hyttinen, N., Kurten, T., and Rissanen, M. P.: Computational and experimental investigation of the detection of HO2 radical and the products of its reaction with cyclohexene ozonolysis derived RO2 radicals by an iodide-based chemical ionization mass spectrometer, J. Phys. Chem. A, 121, 6778–6789, https://doi.org/10.1021/acs.jpca.7b01588, 2017.
Ji, Y., Huey, L. G., Tanner, D. J., Lee, Y. R., Veres, P. R., Neuman, J. A., Wang, Y., and Wang, X.: A vacuum ultraviolet ion source (VUV-IS) for iodide–chemical ionization mass spectrometry: a substitute for radioactive ion sources, Atmos. Meas. Tech., 13, 3683–3696, https://doi.org/10.5194/amt-13-3683-2020, 2020.
Kercher, J. P., Riedel, T. P., and Thornton, J. A.: Chlorine activation by N2O5: simultaneous, in situ detection of ClNO2 and N2O5 by chemical ionization mass spectrometry, Atmos. Meas. Tech., 2, 193–204, https://doi.org/10.5194/amt-2-193-2009, 2009.
Khanniche, S., Louis, F., Cantrel, L., and Černušák, I.: A theoretical study of the microhydration of iodic acid (HOIO2), Comput. Theor. Chem., 1094, 98–107, https://doi.org/10.1016/j.comptc.2016.09.010, 2016.
Lee, B. H., Lopez-Hilfiker, F. D., Mohr, C., Kurten, T., Worsnop, D. R., and Thornton, J. A.: An iodide-adduct high-resolution time-of-flight chemical-ionization mass spectrometer: Application to atmospheric inorganic and organic compounds, Environ. Sci. Technol., 48, 6309–6317, https://doi.org/10.1021/es500362a, 2014.
Lengyel, J., Oncak, M., and Beyer, M. K.: Chemistry of NOx and HNO3 molecules with gas-phase hydrated O− and OH− ions, Chem.-Eur. J., 26, 7861–7868, https://doi.org/10.1002/chem.202000322, 2020.
Lightfoot, P. D., Cox, R. A., Crowley, J. N., Destriau, M., Hayman, G. D., Jenkin, M. E., Moortgat, G. K., and Zabel, F.: Organic peroxy radicals – kinetics, spectroscopy and tropospheric chemistry, Atmos. Environ. A-Gen., 26, 1805–1961, 1992.
McCracken, F. L.: Total collision cross sections of negative atomic iodine ions in nitrogen and argon, Phys. Rev. 86, 135, https://doi.org/10.1103/PhysRev.86.135, 1952.
Phillips, G. J., Pouvesle, N., Thieser, J., Schuster, G., Axinte, R., Fischer, H., Williams, J., Lelieveld, J., and Crowley, J. N.: Peroxyacetyl nitrate (PAN) and peroxyacetic acid (PAA) measurements by iodide chemical ionisation mass spectrometry: first analysis of results in the boreal forest and implications for the measurement of PAN fluxes, Atmos. Chem. Phys., 13, 1129–1139, https://doi.org/10.5194/acp-13-1129-2013, 2013.
Popp, P. J., Marcy, T. P., Gao, R. S., Watts, L. A., Fahey, D. W., Richard, E. C., Oltmans, S. J., Santee, M. L., Livesey, N. J., Froidevaux, L., Sen, B., Toon, G. C., Walker, K. A., Boone, C. D., and Bernath, P. F.: Stratospheric correlation between nitric acid and ozone, J. Geophys. Res., 114, D03305, https://doi.org/10.1029/2008jd010875, 2009.
Riva, M., Rantala, P., Krechmer, J. E., Peräkylä, O., Zhang, Y., Heikkinen, L., Garmash, O., Yan, C., Kulmala, M., Worsnop, D., and Ehn, M.: Evaluating the performance of five different chemical ionization techniques for detecting gaseous oxygenated organic species, Atmos. Meas. Tech., 12, 2403–2421, https://doi.org/10.5194/amt-12-2403-2019, 2019.
Roiger, A., Aufmhoff, H., Stock, P., Arnold, F., and Schlager, H.: An aircraft-borne chemical ionization – ion trap mass spectrometer (CI-ITMS) for fast PAN and PPN measurements, Atmos. Meas. Tech., 4, 173–188, https://doi.org/10.5194/amt-4-173-2011, 2011.
Slusher, D. L., Huey, L. G., Tanner, D. J., Flocke, F. M., and Roberts, J. M.: A thermal dissociation-chemical ionization mass spectrometry (TD-CIMS) technique for the simultaneous measurement of peroxyacyl nitrates and dinitrogen pentoxide, J. Geophys. Res.-Atmos., 109, D19315, https://doi.org/10.1029/2004JD004670, 2004.
Teiwes, R., Elm, J., Handrup, K., Jensen, E. P., Bilde, M., and Pedersen, H. B.: Atmospheric chemistry of iodine anions: elementary reactions of I−, IO−, and with ozone studied in the gas-phase at 300 K using an ion trap, Phys. Chem. Chem. Phys., 20, 28606–28615, https://doi.org/10.1039/c8cp05721d, 2018.
Teiwes, R., Elm, J., Bilde, M., and Pedersen, H. B.: The reaction of hydrated iodide I(H2O)− with ozone: a new route to products, Phys. Chem. Chem. Phys., 21, 17546–17554, https://doi.org/10.1039/c9cp01734h, 2019.
Veres, P., Roberts, J. M., Warneke, C., Welsh-Bon, D., Zahniser, M., Herndon, S., Fall, R., and de Gouw, J.: Development of negative-ion proton-transfer chemical-ionization mass spectrometry (NI-PT-CIMS) for the measurement of gas-phase organic acids in the atmosphere, Int. J. Mass Spectrom., 274, 48–55, https://doi.org/10.1016/j.ijms.2008.04.032, 2008.
Veres, P., Gilman, J. B., Roberts, J. M., Kuster, W. C., Warneke, C., Burling, I. R., and de Gouw, J.: Development and validation of a portable gas phase standard generation and calibration system for volatile organic compounds, Atmos. Meas. Tech., 3, 683–691, https://doi.org/10.5194/amt-3-683-2010, 2010.
Wang, X., Wang, T., Yan, C., Tham, Y. J., Xue, L., Xu, Z., and Zha, Q.: Large daytime signals of N2O5 and NO3 inferred at 62 amu in a TD-CIMS: chemical interference or a real atmospheric phenomenon?, Atmos. Meas. Tech., 7, 1–12, https://doi.org/10.5194/amt-7-1-2014, 2014.
Wayne, R. P., Barnes, I., Biggs, P., Burrows, J. P., Canosa-Mas, C. E., Hjorth, J., Le Bras, G., Moortgat, G. K., Perner, D., Poulet, G., Restelli, G., and Sidebottom, H.: The nitrate radical: Physics, chemistry, and the atmosphere, Atmos. Environ. A-Gen., 25A, 1–206, 1991.
Williams, S., Campos, M. F., Midey, A. J., Arnold, S. T., Morris, R. A., and Viggiano, A. A.: Negative ion chemistry of ozone in the gas phase, J. Phys. Chem. A, 106, 997–1003, https://doi.org/10.1021/jp012929r, 2002.
Wincel, H., Mereand, E., and Castleman, A. W.: Gas phase reactions of DNO3 with X−(D2O)n, X = O, OD, O2, DO2, and O3, J. Phys. Chem., 100, 7488–7493, https://doi.org/10.1021/jp953104i, 1996.
Zheng, W., Flocke, F. M., Tyndall, G. S., Swanson, A., Orlando, J. J., Roberts, J. M., Huey, L. G., and Tanner, D. J.: Characterization of a thermal decomposition chemical ionization mass spectrometer for the measurement of peroxy acyl nitrates (PANs) in the atmosphere, Atmos. Chem. Phys., 11, 6529–6547, https://doi.org/10.5194/acp-11-6529-2011, 2011.