the Creative Commons Attribution 4.0 License.
the Creative Commons Attribution 4.0 License.
 | 06 Aug 2021
Absorption instruments inter-comparison campaign at the Arctic Pallas station
John Backman
Henri Servomaa
Aki Virkkula
Maria I. Gini
Konstantinos Eleftheriadis
Thomas Müller
Sho Ohata
Yutaka Kondo
Antti Hyvärinen
Aerosol light absorption was measured during a 1-month field campaign in June–July 2019 at the Pallas Global Atmospheric Watch (GAW) station in northern Finland. Very low aerosol concentrations prevailed during the campaign, which posed a challenge for the instruments' detection capabilities. The campaign provided a real-world test for different absorption measurement techniques supporting the goals of the European Metrology Programme for Innovation and Research (EMPIR) Black Carbon (BC) project in developing aerosol absorption standard and reference methods. In this study we compare the results from five filter-based absorption techniques – aethalometer models AE31 and AE33, a particle soot absorption photometer (PSAP), a multi-angle absorption photometer (MAAP), and a continuous soot monitoring system (COSMOS) – and from one indirect technique called extinction minus scattering (EMS). The ability of the filter-based techniques was shown to be adequate to measure aerosol light absorption coefficients down to around 0.01 Mm−1 levels when data were averaged to 1–2 h. The hourly averaged atmospheric absorption measured by the reference MAAP was 0.09 Mm−1 (at a wavelength of 637 nm). When data were averaged for >1 h, the filter-based methods agreed to around 40 %. COSMOS systematically measured the lowest absorption coefficient values, which was expected due to the sample pre-treatment in the COSMOS inlet. PSAP showed the best linear correlation with MAAP (slope=0.95, R2=0.78), followed by AE31 (slope=0.93). A scattering correction applied to PSAP data improved the data accuracy despite the added noise. However, at very high scattering values the correction led to an underestimation of the absorption. The AE31 data had the highest noise and the correlation with MAAP was the lowest (R2=0.65). Statistically the best linear correlations with MAAP were obtained for AE33 and COSMOS (R2 close to 1), but the biases at around the zero values led to slopes clearly below 1. The sample pre-treatment in the COSMOS instrument resulted in the lowest fitted slope. In contrast to the filter-based techniques, the indirect EMS method was not adequate to measure the low absorption values found at the Pallas site. The lowest absorption at which the EMS signal could be distinguished from the noise was >0.1 Mm−1 at 1–2 h averaging times. The mass absorption cross section (MAC) value measured at a range 0–0.3 Mm−1 was calculated using the MAAP and a single particle soot photometer (SP2), resulting in a MAC value of 16.0±5.7 m2 g−1. Overall, our results demonstrate the challenges encountered in the aerosol absorption measurements in pristine environments and provide some useful guidelines for instrument selection and measurement practices. We highlight the need for a calibrated transfer standard for better inter-comparability of the absorption results.
- Article
(2173 KB) - Full-text XML
-
Supplement
(186 KB) - BibTeX
- EndNote


The development of a filter-based aerosol absorption measurement method began with an experiment by Rosen et al. (1978). The Raman spectral measurements confirmed that the light attenuation is proportional to the graphitic soot content on a filter. After this discovery the development was continued by Hansen et al. (1982, 1984), and today, the various filter-based techniques are commonly used in aerosol absorption measurements (Tørseth et al., 2019). The filter-based methods are sensitive, simple, and robust and therefore widely applicable.
However, it has become evident that the filter-based methods are prone to several filter artifacts. These include the dependence of light attenuation on the filter tape mass loading and the interference by aerosol light scattering with the absorption measurement (Müller et al., 2011a). Aerosol size affects the penetration depth in a filter adding another size-dependent measurement artifact (Kondo et al., 2009; Nakayama et al., 2010). Additional sources of uncertainties are the variations in filter spot size and the non-idealities of the light source (Bond et al., 1999). Various algorithms to correct for these artifacts have been developed (Bond et al., 1999; Weingartner et al., 2003; Arnott et al., 2005; Schmid et al., 2006; Virkkula et al., 2007; Nakayama et al., 2010; Ogren, 2010; Virkkula, 2010; Collaud Coen et al., 2010). The diverse use of these algorithms complicates a direct comparison of aerosol absorption values from different studies. The measured aerosol light absorption is frequently reported as equivalent black carbon (eBC) mass (in units of ng m−3), which relies on a specific wavelength-dependent mass absorption cross section (MAC) coefficient (Bond and Bergstrom, 2006; Petzold et al., 2013a).
Alternative absorption measurement methods exist. They are less prone to measurement artifacts and have been used for the development of algorithms to remedy the uncertainties associated with the filter-based techniques. Photoacoustic techniques have the advantage of measuring particle absorption in their natural atmospheric state suspended in air (Arnott et al., 1999). However, they suffer from artifacts related to the gas composition and are less robust and sensitive than the filter-based techniques. An individual particle analysis with a laser-induced incandescence (LII) technique is to date the most accurate and sensitive method to measure the absorbing mass content, the so-called refractory black carbon (rBC) mass, of the aerosol. The existing LII techniques are expensive and complex, and converting the rBC signal to atmospheric absorption is not straightforward (Schulz et al., 2006; Schwarz et al., 2006). A simultaneous measurement of the aerosol extinction and scattering is yet another alternative that allows derivation of the aerosol absorption indirectly (Strawa et al., 2003; Virkkula et al., 2005). A review of methods with their common pros and cons is provided by Moosmuller et al. (2009).
The different methods to measure aerosol light absorption have been compared and verified in previous laboratory (Saathoff et al., 2003; Slowik et al., 2007; Müller et al., 2011a) and field (Reid et al., 1998; Schmid et al., 2006; Kanaya et al., 2008; Kondo et al., 2011; Backman et al., 2017; Laing et al., 2020) campaigns. The campaigns have focused on characterizing uncertainties of the different absorption techniques and examined their response to varying absorbing aerosol sources. Reid et al. (1998) measured Brazilian biomass burning aerosol using six different techniques, concluding that there was about 20 % agreement between them. Kanaya et al. (2008) found an overall good agreement between the results of different instruments, but the discrepancies increased at high organic carbon (OC) content. Schmid et al. (2006) measured the Amazon biomass burning aerosol using various methods and estimated a 15 % and 20 % accuracy for particle soot absorption photometer (PSAP) and aethalometer measurements, respectively. Better agreement, in terms of eBC mass, can be expected when solely non-volatile absorbing particles are analyzed avoiding any artifacts from volatile light-scattering particles (Kondo et al., 2011).
The accuracy of the aerosol absorption measurement methods needs to be improved to reduce the uncertainties associated with their climate impacts. Absorbing aerosol has an accelerating impact on the global temperature rise, which is further intensified over the polar regions due to the regional strong climate feedbacks. The aerosol light absorption, and its spatial and temporal variability, are therefore of specific concern in the Arctic. Absorption measurements in the Arctic require sensitive and robust techniques. Previous work has presented data analysis techniques aimed to improve the detection capabilities of the absorption instruments (Springston et al., 2007; Hagler et al., 2011; Backman et al., 2017), yet instrument inter-comparisons are few. The co-located PSAP and CLAP instruments showed good agreement in a real-world Arctic inter-comparison (Ogren et al., 2017), but the study did not include aethalometer or multi-angle absorption photometer (MAAP) instruments. Co-located aethalometers in the Arctic showed relatively more discrepancies, which were discussed by Mölders and Edwin (2018). However, to the best of our knowledge, comprehensive studies of co-located parallel filter-based instruments in pristine field environments are lacking, leading to a poorly quantified Arctic absorption baseline. Recently, Backman et al. (2017) and Schmeisser et al. (2018) found significant spatial differences in aerosol light absorption seasonal characteristics in the Arctic. All long-term aerosol absorption data series from the Arctic are measured using filter-based methods. Backman et al. (2017) used co-located measurements to construct a homogeneous dataset for multiple Arctic sites, but a parallel comparison of all relevant instruments at one site has never been performed. Such a parallel comparison in the Arctic would help estimate the uncertainties associated with these measurements and improve the understanding of reported differences in baseline absorption at different Arctic stations.
The European Metrology Programme for Innovation and Research (EMPIR) Black Carbon (BC) project (http://www.empirblackcarbon.com/, last access: 7 July 2021) develops metrology for light absorption by atmospheric aerosols. It aims at finding standard reference materials that mimic the atmospheric absorbing aerosol and a traceable, primary method to determine the aerosol absorption coefficients. An additional goal of the EMPIR BC project is to develop a validated transfer standard for field calibrations. The Pallas campaign was the first field campaign in the project. The goal was to test the stability, accuracy, and detection capabilities of the commonly available absorption measurement methods focusing on the filter-based techniques and to evaluate their applicability in pristine environments. To our knowledge, this is the most comprehensive absorption and BC mass measurement instrument parallel field comparison done in the Arctic.
2.1 Pallas site description
The Pallas atmosphere ecosystem supersite is located in northern Finland in the Arctic. It is part of the Pallas–Sodankylä Global Atmospheric Watch (GAW) station and contributes to various national and international networks and programs. Important in this context is the Aerosols, Clouds, and Trace gases Research InfraStructure (ACTRIS), to which Pallas provides quality-controlled and continuous data on aerosol number, size, and optical properties. The main station for aerosol measurements at Pallas is on top of the Sammaltunturi fell (67∘58′ N, 24∘7′ E; 560 m a.g.l.) where the EMPIR BC field campaign was organized. A detailed description of the site, its surroundings, and ongoing measurement programs were published by Hatakka et al. (2003) and Lohila et al. (2015).
Table 1The campaign instrumentation presented in columns: (1) instrument abbreviation, (2) variable measured (scattering:sca; extinction:ext; refractory black carbon:rBC; equivalent black carbon:eBC; particle number concentration:PN), (3) measurement time resolution, (4) flow rate, (5) instrument inlet (cut size 10 µm:PM10; total inlet:TOT), and (6) lower detection limit based on manufacturer information.
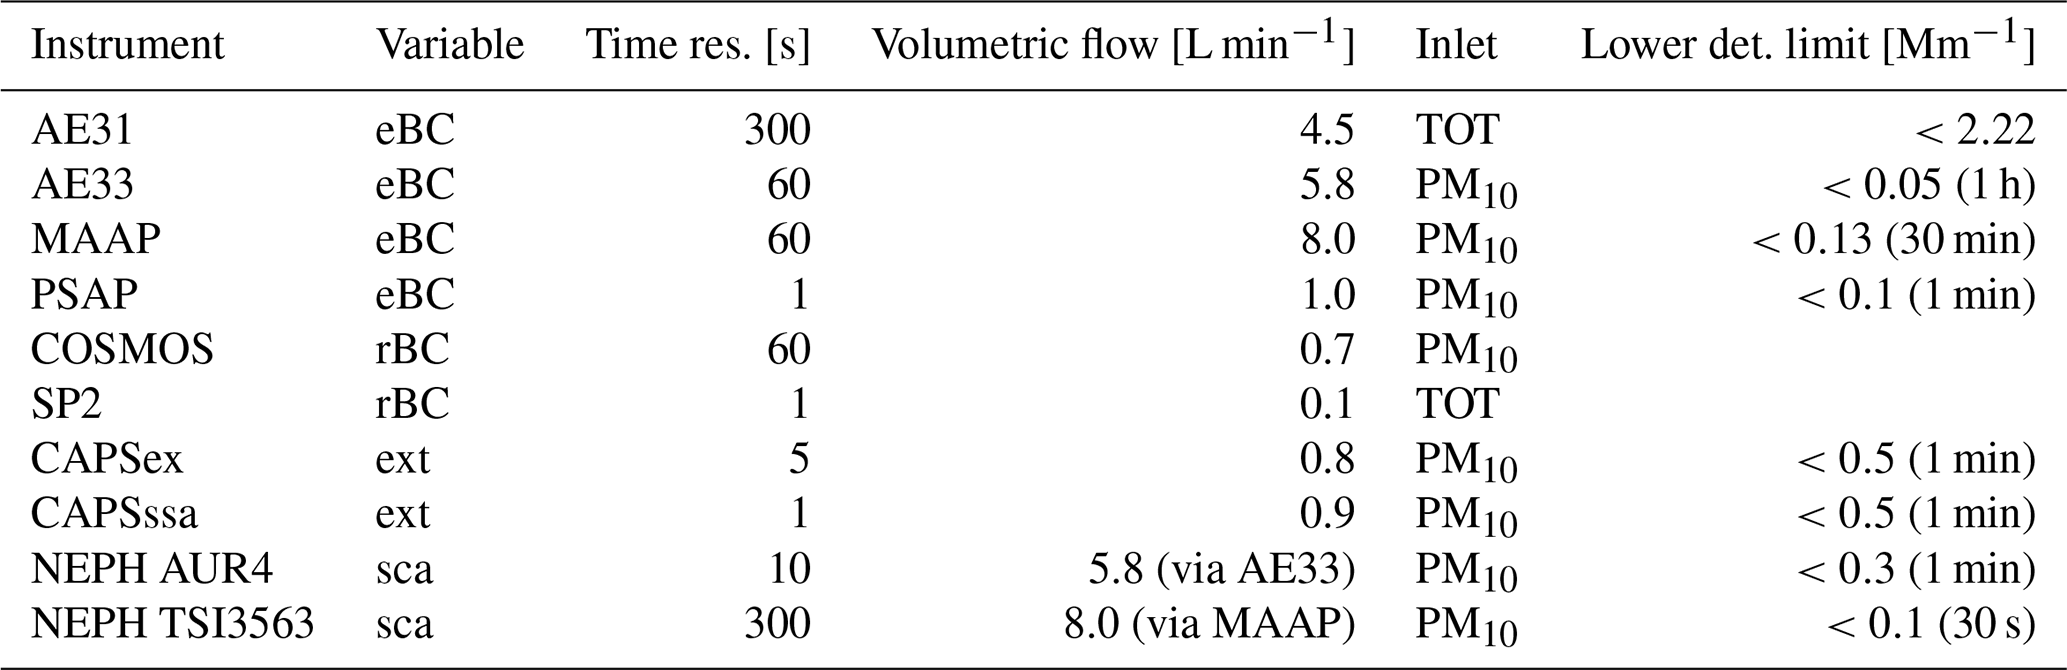
The EMPIR BC field campaign took place during the Nordic summer, between 19 June–17 July 2019. A summary of the instrumentation used with corresponding settings during the campaign is presented in Table 1. Each instruments' operational principle and respective data corrections are presented in detail below.
2.2 Aerosol optical properties
Appendix A summarizes the quantities that frequently appear in this text. All the filter-based instruments measure aerosol light absorption coefficients σAP,λ at instrument-specific wavelengths λ, which are acquired from the measured light attenuation using signal post-processing. σAP,λ can be normalized by particle mass, yielding a simple factor called mass absorption cross section (MAC) (Bond and Bergstrom, 2006). Some applications, such as atmospheric modeling, favor the use of BC mass over the absorption coefficient, for which the value of MAC needs to be known.
Here, when referring to a corrected absorption coefficient measured using a particular technique, a notation σINST,λ, where INST is an abbreviation of the technique, is used. When referring to an aerosol light absorption coefficient value directly reported by the instrument, σ0,λ is used instead.
A typical measure of aerosol “brightness” is the ratio of aerosol scattering coefficient σSP,λ to the aerosol extinction coefficient σEP,λ, a parameter called single-scattering albedo,
which is of great significance when assessing the radiative forcing of the aerosols. The scattering wavelength dependence is described as
where αSP,λ is called the Ångström exponent of scattering and is related to the aerosol optical size. A similar wavelength-dependent parameter, αAP,λ, can be defined for aerosol absorption.
Interpolation of σSP,λ to any wavelength λ was done by applying the calculated Ångström exponent at the nearest available wavelengths (Anderson and Ogren, 1998). Interpolation of σAP,λ to a wavelength λ was done by assuming .
2.3 Instruments
Data from five filter-based absorption photometers – two instruments that measure aerosol scattering, two instruments that measure aerosol extinction, and one instrument that measures refractory BC – are used in this paper. The data were corrected with the best practices considered for each particular instrument independently, following the global guidelines, literature citations, and earlier work done at the station.
The flow rate of each instrument was measured at the beginning and at the end of the campaign with a volumetric flow calibrator (Gilian Gilibrator-2, Sensodyne) and converted to standard (STP) conditions (0 ∘C, 1013 hPa). The flow correction based on the Eq. (5) in Bond et al. (1999) was applied to CAPS (cavity-attenuated phase shift light extinction), PSAP, and nephelometer instruments, which provided raw data in ambient conditions. Instrument flow rates are shown in Table 1.
2.3.1 AE31
The aethalometer model AE31 (Magee Scientific Inc.) has been part of the permanent installation at the Pallas site since year 2005 (Lihavainen et al., 2015). It measures the aerosol absorption coefficient at seven wavelengths (370, 470, 520, 590, 660, 880, and 950 nm), with a typical nominal full width at half maximum (FWHM) of 20 nm and a measured FWHM variance in the range of 10–85 nm (Müller et al., 2011a). The measurement principle is based on the observed light attenuation caused by the particles that are continuously collected on a filter tape (Hansen et al., 1982, 1984). The aerosol attenuation coefficient is then calculated as
where A is the filter spot size, Q is the flow rate, and ΔATN is the measured change in the attenuation during the time interval Δt (e.g., Backman et al., 2017, Eq. 1). The AE31 changed the filter spot automatically when a pre-set limit value of ATN = 60 was reached. The instrument reports data in eBC mass concentration, which is simply the measured aerosol absorption coefficient corrected with a wavelength-dependent specific attenuation and MAC values.
The AE31 data measured at Pallas were corrected for the multiple scattering of light by filter fibers by dividing σ0,λ with a multiple scattering enhancement factor, C0=3.5, which is selected according to the global recommendation of the Global Atmospheric Watch's World Calibrations Centre for Aerosol Physics (GAWReport no. 227; https://library.wmo.int/doc_num.php?explnum_id=3073, last access: 2 August 2021) and is also very close to the C0 factor for the Arctic given by Backman et al. (2017). The filter loading artifact was corrected using the method by Virkkula et al. (2007, 2015) and the Pallas station-specific correction factor k=0.0038 (Backman et al., 2017). Note that this correction is a loading correction only, unlike the algorithms of Arnott et al. (2005) and Collaud Coen et al. (2010), in which a fraction of the scattering coefficient is subtracted from σ0,λ.
2.3.2 AE33
An updated version of the AE31 is the dual-spot aethalometer model AE33 (Drinovec et al., 2015). The instrument reports an aerosol light absorption coefficient based on the measured attenuation on two parallel filter spots with different particle loadings. It applies a real-time loading effect compensation algorithm that is essentially based on the work by Virkkula et al. (2007). The Pallas AE33 uses an internal multiple scattering correction factor C0=1.39 (Drinovec et al., 2015). This was corrected to a value C0=3.5 in order to comply with the global recommendation (GAWReport no. 227; https://library.wmo.int/doc_num.php?explnum_id=3073). No clear consensus or published recommendation for the AE33-specific global scattering correction factor C0 yet exists, although it is clear that the correction by the manufacturer is too low for most atmospheric aerosols (Laing et al., 2020). The AE33 at Pallas was programmed to change the filter spot automatically every 24 h.
2.3.3 MAAP
The multi-angle absorption photometer (MAAP) model 5012 (Thermo Scientific) has been frequently used as an absorption reference for the filter-based absorption instrument techniques (Müller et al., 2011a). It internally corrects for the scattering artifact by using a simultaneous back-scattering measurement of the filter tape at multiple angles. In general, the data need very little post-processing. MAAP measures absorption at a wavelength of 637 nm (FWHM 18 nm). A wavelength shift from the nominal value was reported by Müller et al. (2011a) and requires a correction with a multiplier 1.05. This correction was applied also here. Pallas MAAP was set to report eBC directly at STP conditions, and no further corrections were thus applied. In polluted environments the MAAP internal data averaging procedure can lead to an artifact that needs to be corrected as suggested by Hyvärinen et al. (2013).
2.3.4 PSAP
The particle soot absorption photometer (PSAP; Radiance Research) measures aerosol light attenuation at wavelengths of 467 (FWHM 20 nm), 530 (FWHM 40 nm), and 660 nm (FWHM 22 nm) (Bond et al., 1999; Müller et al., 2011a). The PSAP, in contrast to the other filter-based techniques used, requires a manual filter spot change. This was done when the transmittance reported by the instrument decreased from the initial value of 1.0 to a range of 0.8–0.7. The flow rate of PSAP was set at 1 L min−1 volumetric.
The PSAP records the signal, reference, and dark count data at 4 s time resolution, which was hourly averaged to calculate the absorption coefficients. The data were corrected with the measured filter spot size and flow rate as suggested by Bond et al. (1999) and Ogren (2010). An average of five spot sizes was determined to be A=18.63 mm2. The volumetric flow rate was measured at 15 different adjusted flow rate settings at the beginning and at the end of the campaign. The results were converted to standard flow rate and a linear fit was made to the data, resulting in a flow correction factor of 1.12.
The obtained aerosol absorption coefficient was corrected for the filter-tape loading and scattering artifacts using the correction scheme by Virkkula (2010):
where k0, k1, h0, h1, and s are wavelength-dependent constants given by Virkkula (2010). Trλ is the transmittance measured by PSAP at a wavelength λ, and σSP,λ is the corresponding scattering coefficients. The scattering coefficients were measured with a nephelometer (TSI Inc. model 3563) and interpolated to the three PSAP wavelengths using the calculated Ångström exponent values αSP,λ. The single scattering albedo ω0,λ in Eq. (4) was iterated until no significant change in σPSAP,λ was observed. At large values of ω0,λ such as here, this correction scheme approaches the widely applied Bond–Ogren correction scheme (Bond et al., 1999; Ogren, 2010). However, the corrected αAP,λ at high ω0,λ values should be interpreted with caution due to strongly increasing deviation with ω0,λ, as shown in Backman et al. (2014, their Fig. 7).
2.3.5 COSMOS
The continuous soot monitoring system (COSMOS) measures light attenuation at a wavelength of 565 nm (FWHM 25 nm). The measurement principle is similar to the other filter-based absorption photometers but differs in a sample pre-treatment (Miyazaki et al., 2008; Kondo et al., 2009). In the COSMOS inlet the volatile non-refractory aerosol components are removed by heating the sample to 300 ∘C (Kondo et al., 2009). The COSMOS mechanical and optical design with the determined instrument detection limit and measurement uncertainties are presented by Miyazaki et al. (2008). Due to the elimination of most aerosol scattering artifacts and lensing enhancements of absorption, this method is typically found to be in good agreement with the thermal–optical and the laser-induced incandescence techniques (Kondo et al., 2009, 2011) and not directly comparable to other filter-based absorption measurements. Each COSMOS is calibrated against a standard COSMOS instrument using ambient absorbing aerosol within an accuracy of about 5 %. The standard COSMOS, in turn, is calibrated by SP2 using ambient absorbing aerosol and applying an aerosol-specific MAC. At Pallas, we applied a MAC of 8.73 m2 g−1to calculate the absorption coefficient from the COSMOS data (Sinha et al., 2017). Detailed comparisons of COSMOS and SP2 measurements at several sites in Asia and the Arctic have demonstrated that the overall accuracy in the absorbing aerosol mass concentration measurement is about 10 % (Sinha et al., 2017; Ohata et al., 2019, 2020). The stability of MAC is explained by the elimination of the artifacts from aerosol scattering. At Pallas, COSMOS was operated at 0.7 L min−1 flow rate (STP), and the data were saved every 1 min.
2.3.6 SP2
The single particle soot photometer (SP2, Droplet Measurement Technologies Inc.) measures refractory black carbon (rBC) mass in particles >70 nm in diameter (Schwarz et al., 2006). The measurement principle is based on a laser-induced incandescence where the particle is heated up to the point of incandescence which is picked up by the instrument detectors (Stephens et al., 2003). The incandescence signal is proportional to the mass of the refractory black carbon which is calculated particle by particle to obtain the rBC mass concentration (Laborde et al., 2012). This technique is both sensitive and accurate and is here used as a reference for the rBC mass concentration in the field.
2.3.7 CAPS
The cavity-attenuated phase shift light extinction monitor CAPS PMex (CAPSex, Aerodyne Research Inc.) instrument measures total light extinction by aerosol particles (σEP,λ) utilizing a cavity-attenuated phase shift principle (Kebabian et al., 2007; Massoli et al., 2010; Petzold et al., 2013b; Perim de Faria et al., 2017). An updated model of CAPSex is the CAPS PMssa (CAPSssa, Aerodyne Research Inc.). CAPSssa additionally measures the aerosol light scattering allowing the single scattering albedo to be determined with a single instrument (Onasch et al., 2015; Modini et al., 2021). The scattering measurement technique is similar to an integrating nephelometer and utilizes a Lambertian integrating sphere in the sample cell. The aerosol light-scattering measurement by CAPSssa is affected by background, truncation, and light-source-related uncertainties for which calibration is needed.
Aerosol extinction measurement with CAPS is nearly a calibration-free technique as long as frequent baseline measurements are performed. A potential source of systematic bias is the geometry correction factor. This is generally a stable constant but has been shown to vary between instruments of even the same model (Petzold et al., 2013b; Onasch et al., 2015). An accurate aerosol extinction measurement thus requires initial calibration against a calibrated scattering instrument, generally a nephelometer.
The CAPSex and CAPSssa that were operated at the Pallas both measure at a wavelength of 630 nm (nominal FWHM 9.3 nm). The extinction signal from each instrument was calibrated using the nephelometer at the beginning.
2.3.8 Nephelometer
Aerosol light scattering is continuously monitored at the Pallas Sammaltunturi site with an integrating nephelometer (TSI3; TSI, model 3563) (Anderson and Ogren, 1998; Heintzenberg et al., 2006). It measures aerosol total scattering and back-scattering fraction at three wavelengths: 450, 550, and 700 nm (FWHM 40 nm) (Anderson et al., 1996). Nephelometer data were corrected for truncation as suggested by Anderson and Ogren (1998) and converted to standard atmospheric conditions (STP).
During the EMPIR campaign the aerosol light scattering was also measured with an Aurora integrating polar nephelometer (AUR4; Ecotech, model 4000) at two angles: 90 and 180∘. In this setup, the Aurora nephelometer measures the total scattering (0–180∘) and back scattering (90–180∘) of the aerosol in a similar manner as the TSI nephelometer. The Aurora 4000 measures scattering at wavelengths of 450, 525, and 635 nm (FWHM 30–40 nm, (Müller et al., 2011a)). Data were corrected for truncation based on Müller et al. (2011b) and converted to STP.
A zero check was performed daily for both nephelometers, and they were calibrated with CO2 gas at the beginning and end of the campaign.
2.3.9 Extinction minus scattering (EMS)
An indirect technique to determine the aerosol light absorption is based on separately measured aerosol extinction and aerosol scattering (Strawa et al., 2003; Virkkula et al., 2005; Modini et al., 2021). This extinction minus scattering (EMS) method relies on those aerosol optical properties that can be accurately determined using existing techniques. It is also traceable to SI units. The EMS method avoids the artifacts encountered with filter-based techniques.
In Pallas the aerosol light scattering was measured with two integrating nephelometers and the extinction with CAPSex and CAPSssa instruments. Two instrument “pairs” were formed: (1) Aurora 4000 polar nephelometer and CAPSssa (both were part of campaign instrumentation) and (2) CAPSex and the TSI nephelometer (permanent instrumentation at the site). These methods are here referred to as EMS1 and EMS2, respectively. The CAPSssa scattering and extinction measurement alone was also used to determine aerosol absorption, which is here referred to as method EMS3.
In the beginning, middle, and end of the campaign the CAPS instrument data were calibrated against the nephelometers. Purely scattering ammonium sulfate aerosol was produced with an atomizer (TOPAS, model ATM230). The aerosol losses in the sampling lines and in the instruments are size-dependent, and the αSP,λ reflects the optical size of the aerosol. In Pallas summer atmosphere a typical value is –1.7 (Lihavainen et al., 2015). The ammonium sulfate calibrations were performed in this αSP,λ range so that the calibrations will be valid for the ambient aerosol as well. Calibrations yielded correction factors of 1.21 (EMS1) and 1.04 (EMS2) (Fig. S1 in the Supplement). These correction factors were applied to all CAPS data in this paper. The different correction factors for the CAPSex and CAPSssa could be explained by the different individual geometry correction factors. The two CAPS used identical flow rates and inlet settings, and the two nephelometers had a small difference in flow rates and in inlet tubing sizes, which could to a minor part also explain the differences in correction factors. However, the discrepancies in nephelometers were very minor (2 %–5 %) in comparison with those between the CAPS instruments and the nephelometer (5 %–20 %).
2.4 Sampling
Most of the instruments were connected to a common inlet which was equipped with a particulate matter (PM) 10 µm cut-size aerosol inlet head and a Nafion Perma Pure model MD-700-48 aerosol drier. The relative humidity (RH) of the sample in the entrance of the inlet was monitored to remain <40 % throughout the campaign. The total flow of 18.3 L min−1 was divided for the instruments via a self-made flow divider that consisted of six cylindrically symmetric exit tubes. One of the exits was further divided into two flows using a TSI laminar flow divider: one for each extinction monitor (CAPSex and CAPSssa, see Table 1). In addition, two instruments (SP2 and AE31, see Table 1) were connected to a slightly heated, total aerosol inlet about 3 m apart from the PM10 line. The AE31 is measuring in this inlet year-round and the SP2 has a limited measurement size range for which the inlet cut size does not affect the result in cloud-free conditions.
3.1 Allan variance analysis on absorption methods stability and detection limits
Detection limits and optimal averaging times for the absorption measurement instruments were defined using Allan variance analysis. Allan variances describe the time-averaged stability of a series of consecutive measurements and can be used to estimate noise processes (Allan, 1966; Werle et al., 1993). They determine the data variability by analyzing the sum of the squared differences between the measurement subsets in such a way that if N is the number of subsets of yj measurements, each averaged over the measurement interval t, the Allan variance for a measurement time period is defined as
Thus, each yj is one of the total of N fractional frequency values averaged over the measurement interval, t. The Allan variances can be used to find the optimal averaging time that minimizes the noise without sacrificing the signal. For a white-noise-dominated system the square root of the variance, called Allan deviation, is equal to the standard deviation of the mean and gives the 1σ detection limit directly (Werle et al., 1993).
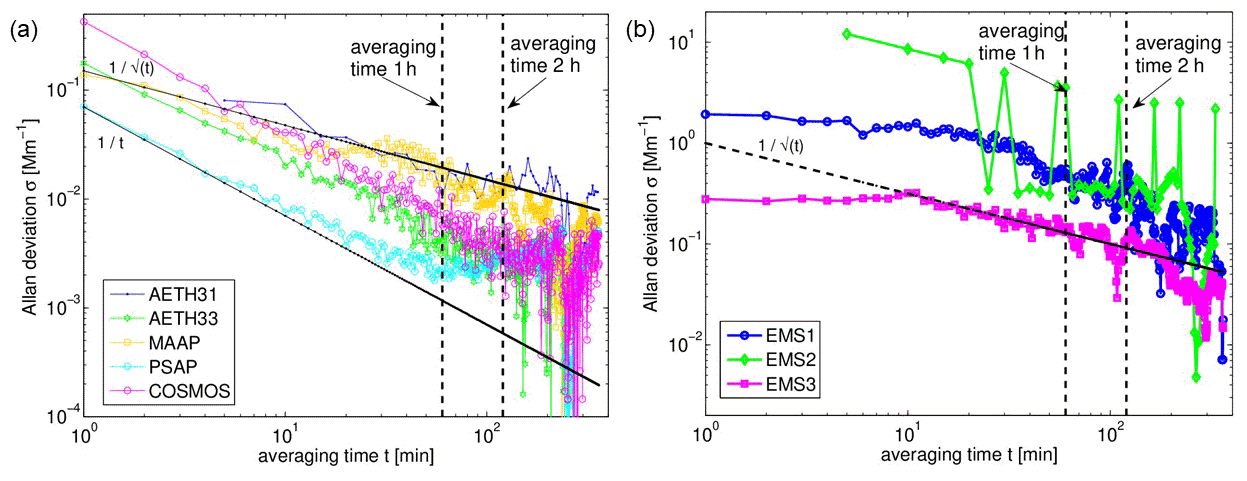
Figure 1Allan deviation of aerosol absorption σAP,637 nm measured with (a) the filter-based instruments and with (b) the EMS technique. Averaging times between 1 min and 6 h are shown in x axis. The black lines with slope −0.5 in (a, b) demonstrate white noise, and in (a) noise with slope −1.0 is added to guide the eye due to better fit with some instruments. Averaging times until 1 h (marked with black dashed line) improve signal to noise in all instruments but averaging 2 h or more (marked with the second black dashed line) does not always lead to improvement.
Noise in the measured absorption signal was determined during a 6 h period of clean, particle-free measurements. Allan deviation for the different absorption methods in this study was calculated for data averaging times from 1 min to 6 h (Fig. 1). The lowest Allan deviation minimum was measured by PSAP and followed by AE33, COSMOS, MAAP, and AE31 in the order from lowest to highest (Fig. 1a). The absorption coefficients measured by the three EMS methods were about an order of magnitude higher in Allan deviation when compared to the values determined for the filter-based methods (Fig. 1b). The minimum Allan deviation in PSAP data was obtained with an averaging time of about 1 h, after which a strong increase ( dependence) in noise occurred. Deviation from the typical behavior of a white-noise-dominated system (i.e., dependence) can be expected for PSAP as was shown by Springston et al. (2007). The increasing Allan deviation of the absorption at the averaging times of >1 h that was observed in PSAP indicates systematic drifts. A similar drift effect could be interpreted to take place in AE33 and COSMOS instruments at >2.5 h data averaging times. The EMS methods showed a constant decrease in a white noise signal from 10 min to longer averaging times. Out of the three EMS methods used, the EMS3 that measured both extinction and scattering with a single instrument, here presented the lowest noise. Moreover, it is known that even the single-instrument EMS approach is subject to considerable uncertainty at low values of absorption due to error amplification (Modini et al., 2021).
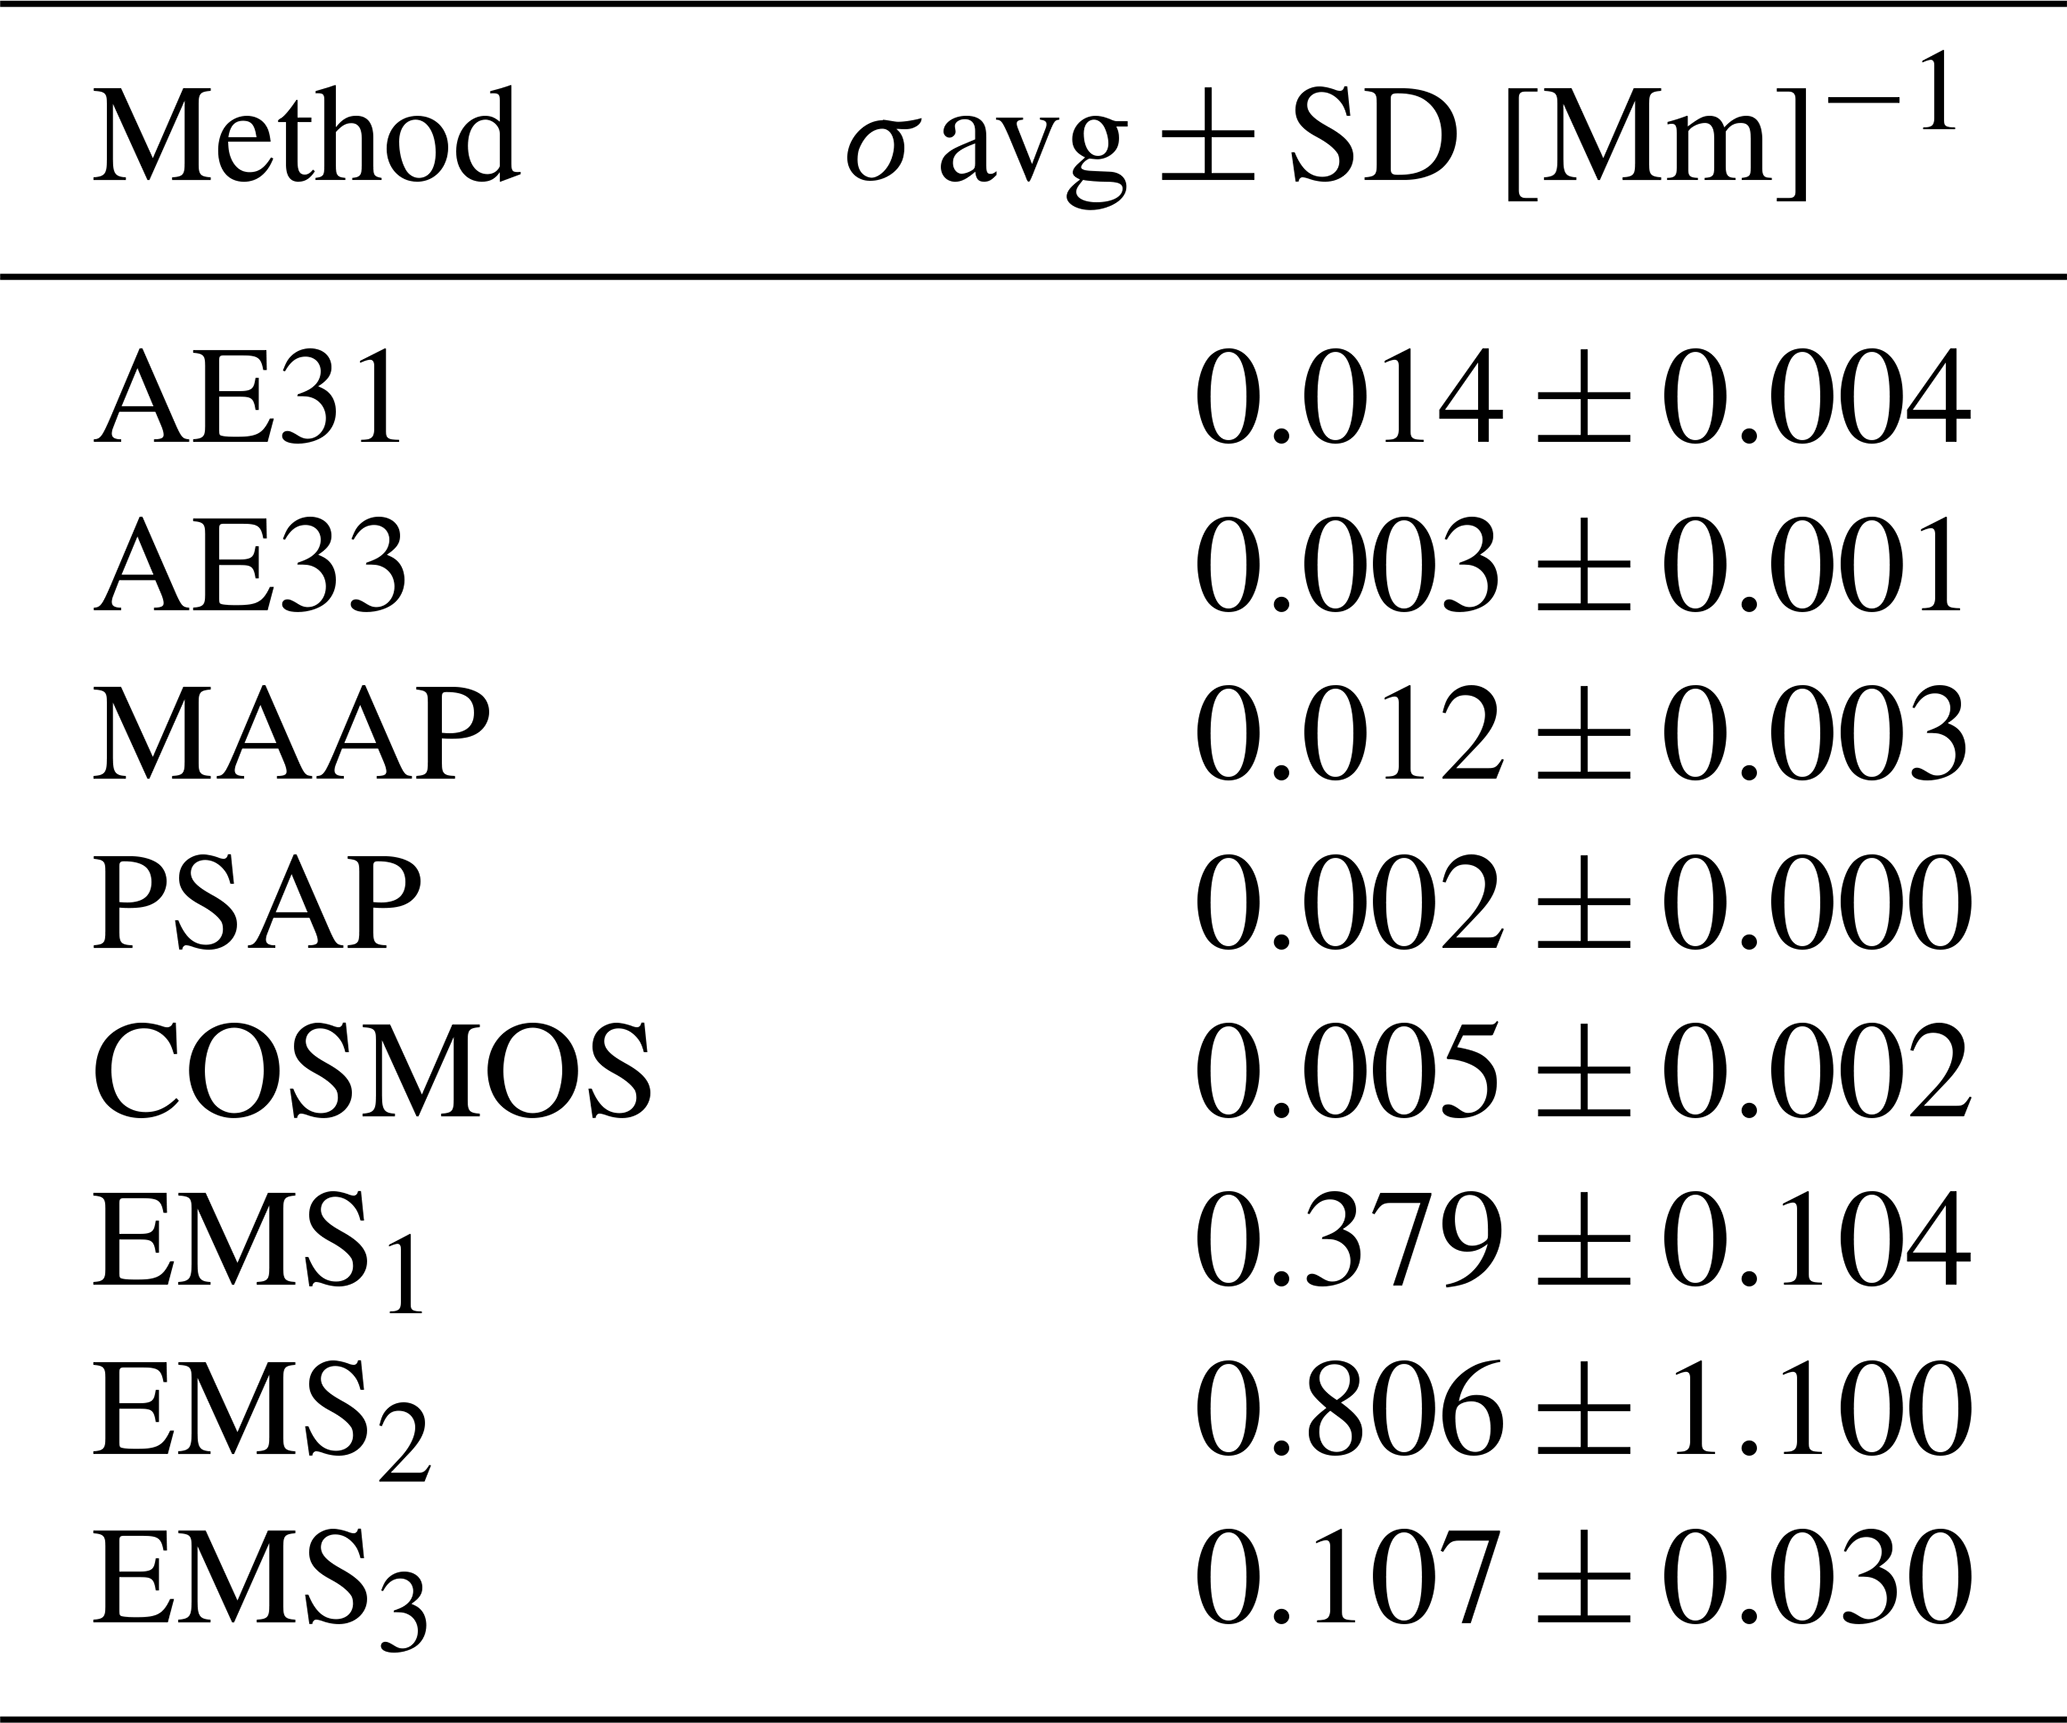
The 1σ detection limits of different σAP,637 nm measurement methods were calculated as an average of the Allan deviation between 1–2 h averaging times and are presented in Table 2. The lowest detection limit of 0.002 Mm−1 was calculated for PSAP, while it was 0.01 Mm−1 for MAAP, 0.1 Mm−1 for EMS3, and 0.8 Mm−1 for EMS2. Qualitatively and in comparison to each other, the instruments' detection limits followed those provided by the instrument manufacturers, although the determined 1σ absolute values were all slightly lower than stated (Table 1).
Table 2The Allan deviation σ of absorption coefficient σAP,637 nm measured with different methods between 1–2 h averaging time (average±standard deviation).
The above stability analysis is used to justify our choice to use hourly averaged absorption data in the further analysis of this work.
3.2 Aerosol absorption coefficient values measured in Arctic air masses
The absorption instruments were used in parallel to measure the atmospheric aerosol in the Pallas campaign. Arctic air masses prevailed during all the campaign, and correspondingly very low aerosol concentrations were measured (Fig. 2). The aerosol was highly scattering, with an average single-scattering albedo of 0.97. These conditions challenged the detection capabilities of the absorption measurement methods used. The aerosol absorption coefficient σAP,630 nm measured with filter-based instruments varied between 0 and 0.3 Mm−1 (Fig. 2a). The values of σAP,630 nm measured by the EMS methods differed 10-fold, giving a range between 0 and 3 Mm−1 (Fig. 2b). A plausible explanation for this clear overestimation of absorption by the EMS method is that it is calculated by taking the difference of two large and noisy numbers that also have significant bias and drift relative to one another.
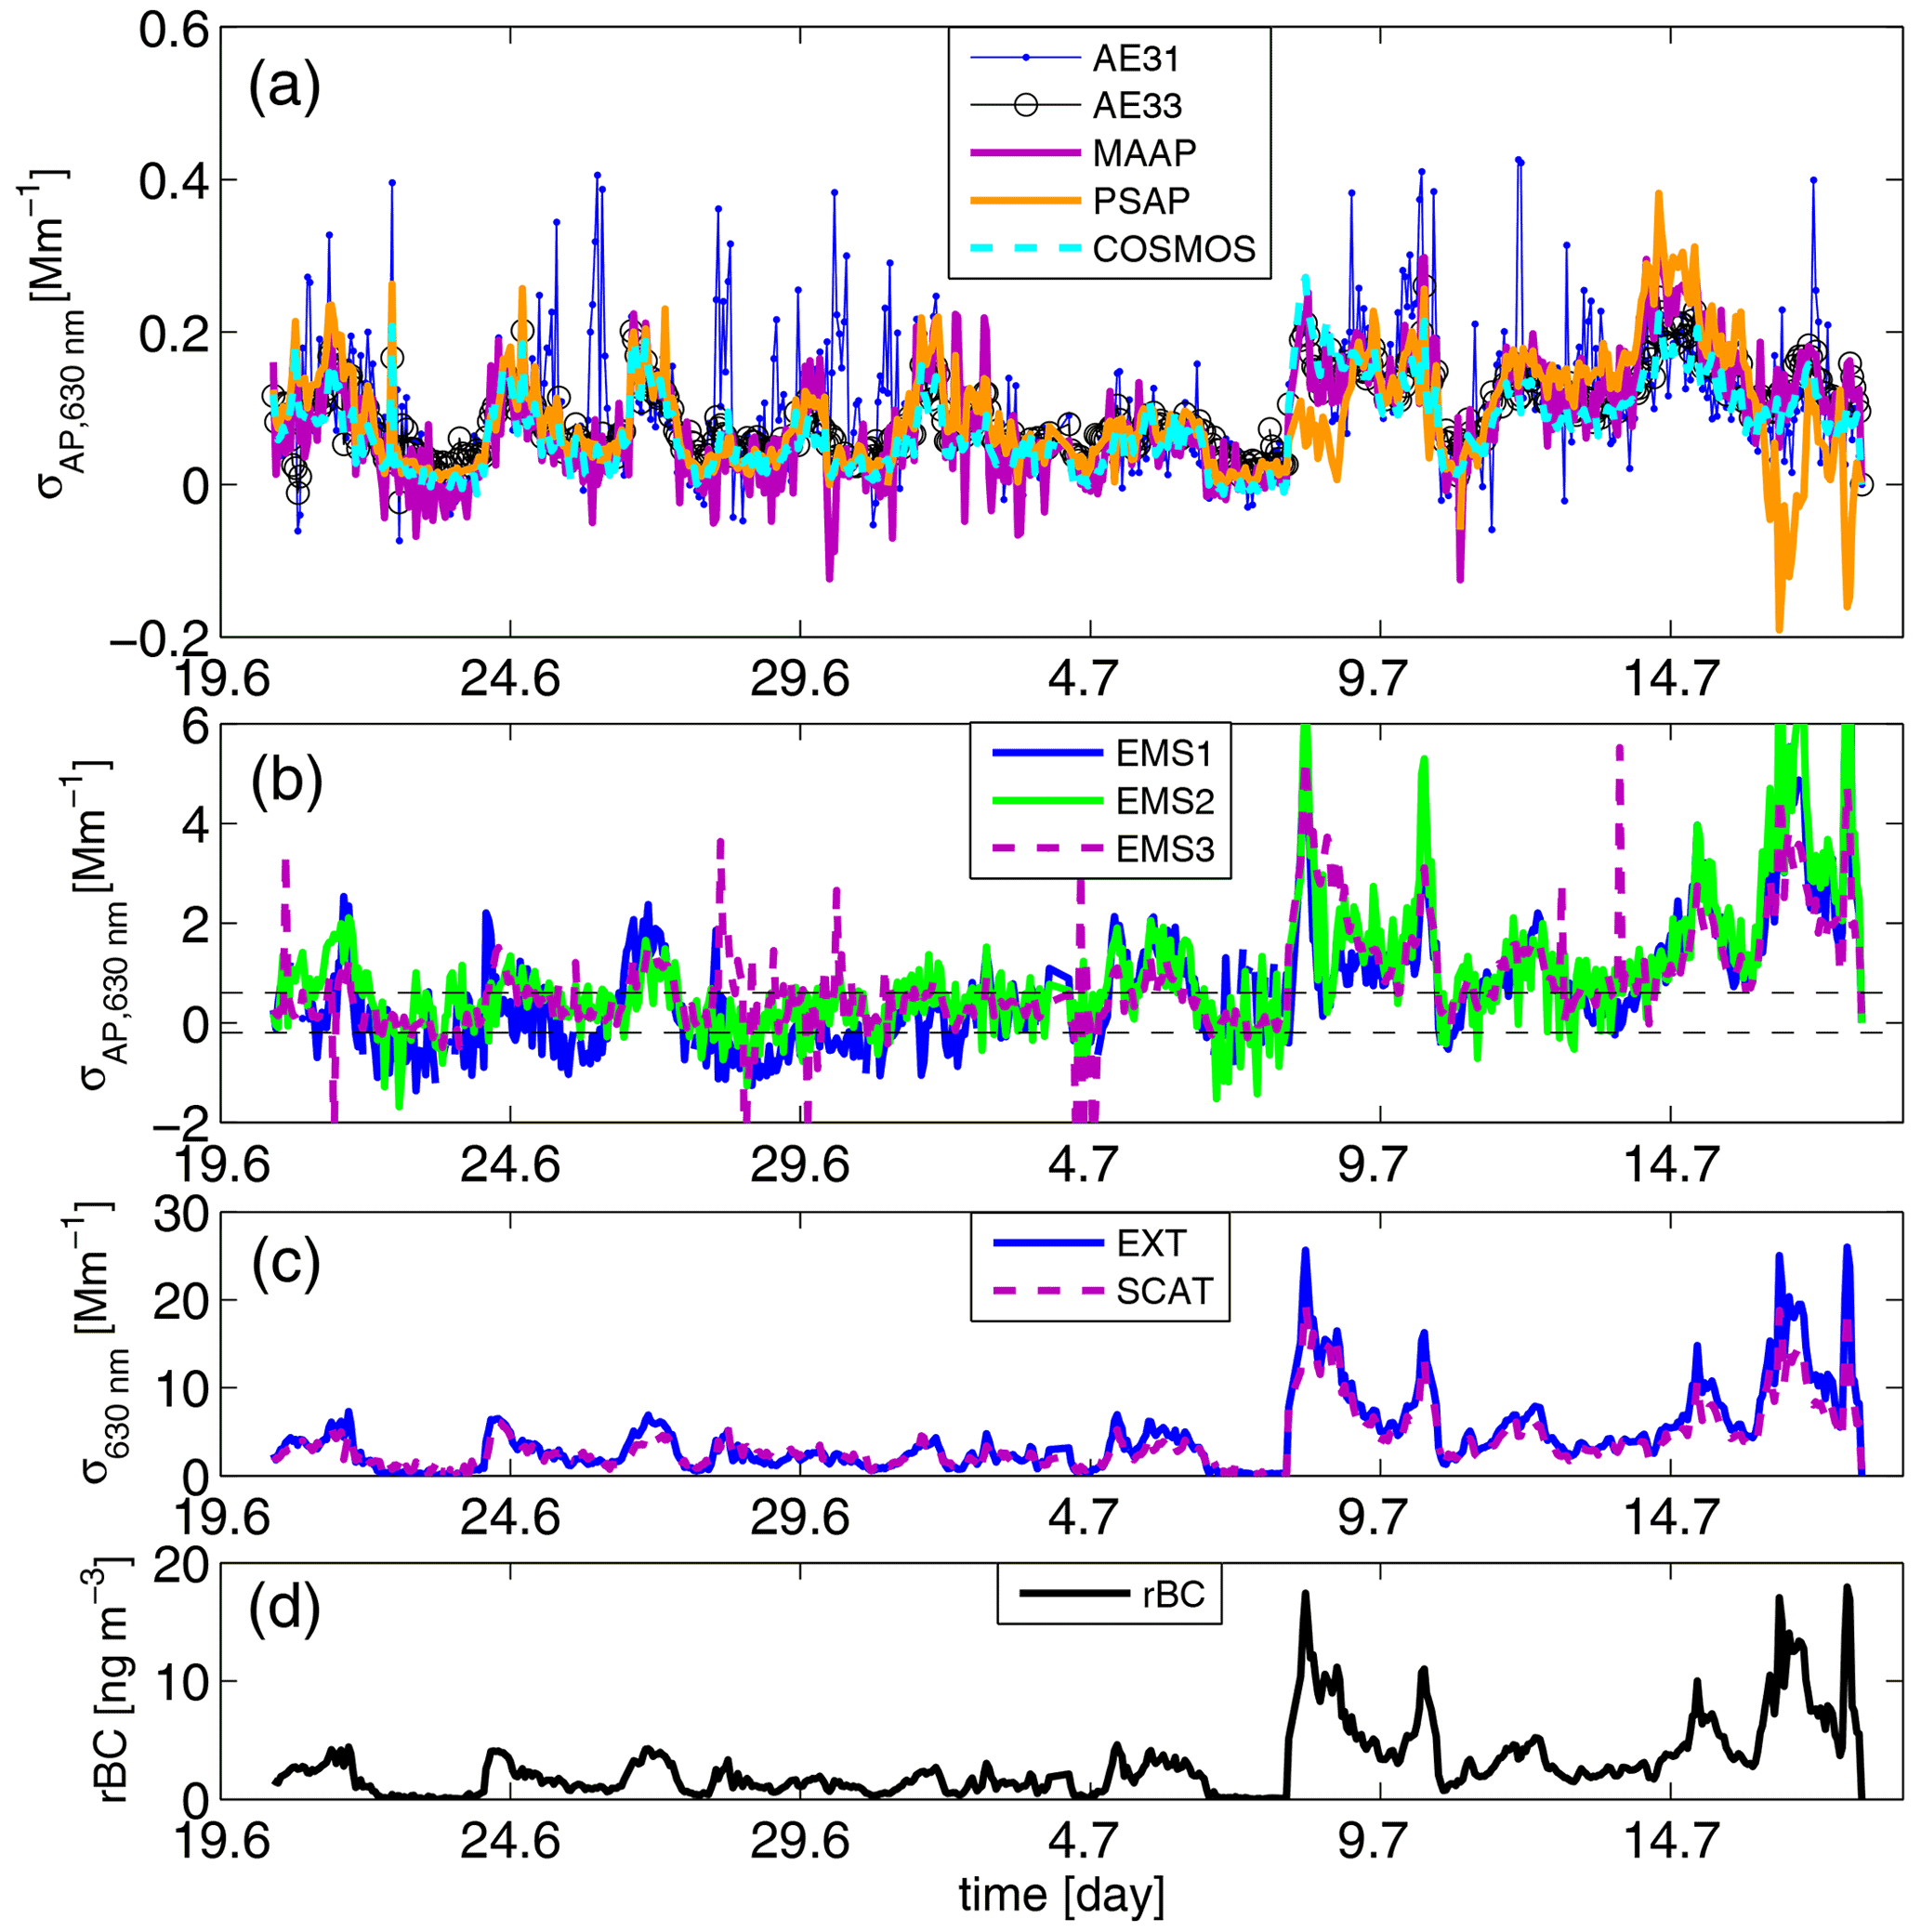
Figure 2The 1 h averaged absorption coefficients at λ=630 nm during the whole campaign period measured with (a) the filter-based instruments and (b) the EMS technique. To guide the eye, in (b) the lower and upper limits of (a) are also depicted with dashed black lines. Simultaneously measured extinction and scattering coefficients and the residual-BC concentration are presented in (c, d). The extinction and scattering presented were measured with AUR4 and CAPSssa instruments, and the rBC was measured with SP2.
Both absorption and scattering increased slightly during the second half of the campaign from 7 July onwards (Fig. 2c). The maximum σEP,630 nm of around 25 Mm−1 was observed on 8 and 16 July. During these high-concentration episodes PSAP seemed to underestimate the absorption, when compared to the other filter-based instruments and especially the reference MAAP. Particularly high ω0 of >0.99 was measured in both these cases. The wavelength-dependent scattering correction function that was applied to PSAP data could thus overestimate the correction when extremely high scattering values are measured and in particular at the higher wavelengths. Essentially an opposite behavior was observed on 14 July when PSAP and MAAP coincided in absorption while the other filter-based instruments underestimated the absorption. In this case the ω0 was in the range of 0.85–0.95, which is rather low for Pallas.
Table 3Average±standard deviation and median absorption coefficient σAP,635 nm measured with different methods.
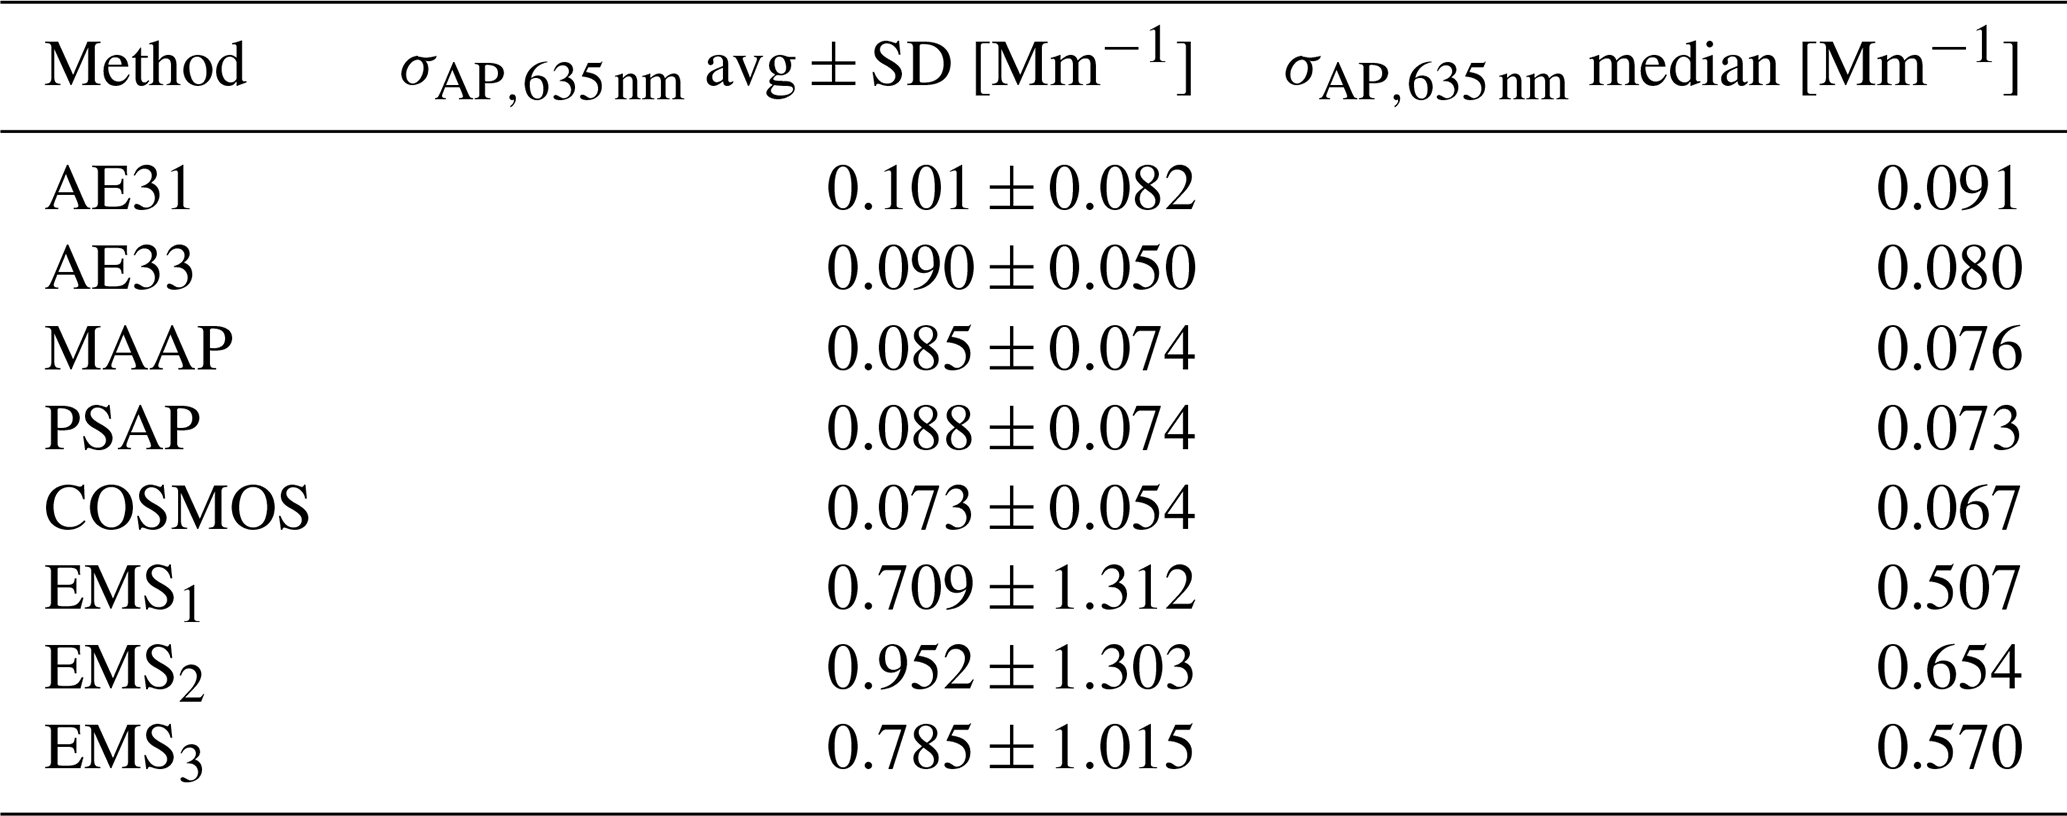
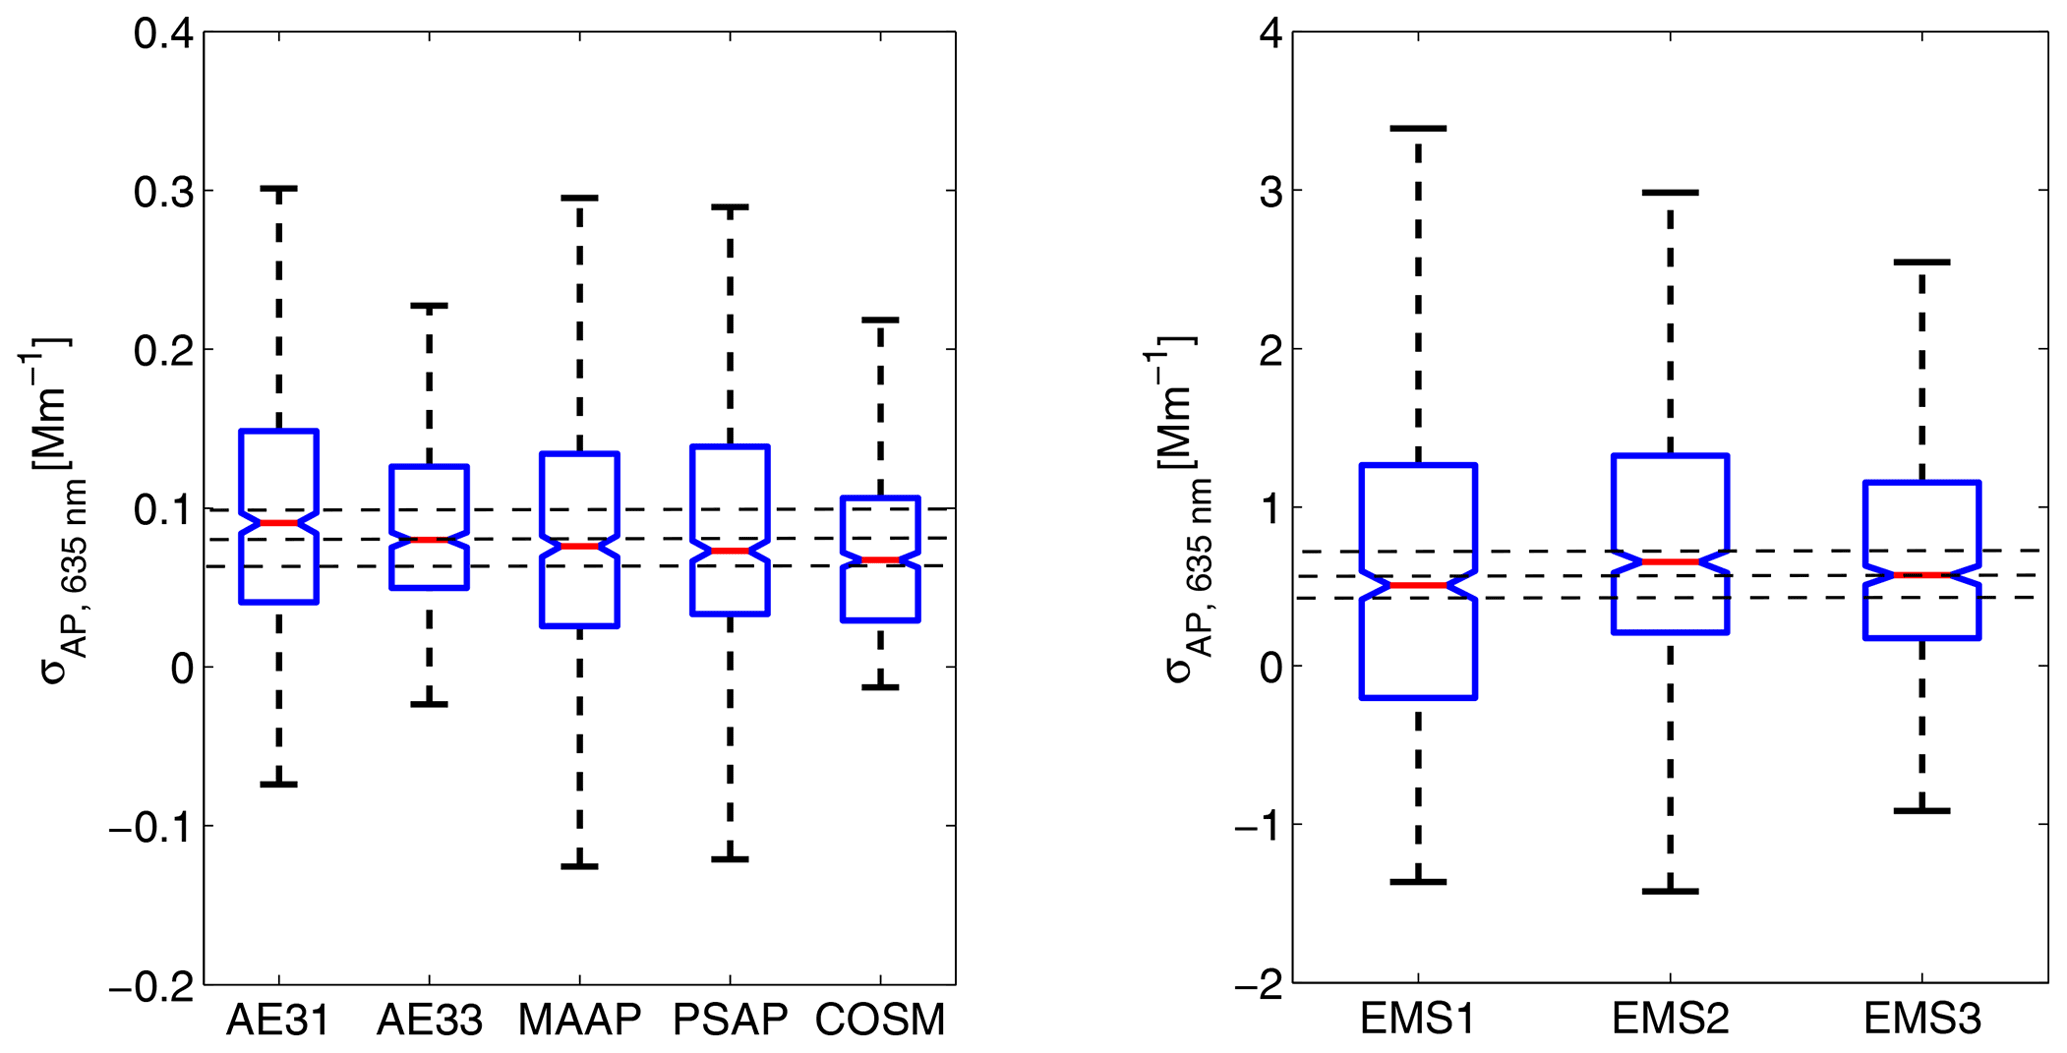
Figure 3The vertical black lines show the range of 1 h averaged absorption coefficient values measured with the eight different techniques labeled in the x axis. The red lines show the medians and the blue boxes the 25th and 75th percentiles. The horizontal dotted black lines present the overall medians±25 %.
The median aerosol absorption coefficients σAP,635 nm measured by the five filter-based methods during the campaign ranged from 0.07 to 0.09 Mm−1 (Table 3). The overall median using data from all instruments was 0.08 Mm−1 and the 25th and the 75th percentiles were 0.06 and 0.10 Mm−1 (Fig. 3). The measured atmospheric absorption coefficient values with their standard deviation range exceeded the instruments' detection limits for all the five filter-based methods (Table 2). The lowest average σAP,λ was measured with the COSMOS instrument along with the lowest inter-quartile range (Fig. 3, Table 2). This is expected since the sample pre-treatment in the COSMOS heated inlet effectively removes light-scattering particles and coatings, thereby eliminating the related artifacts. Heating also decreases fluctuations caused by possible sample RH variations. However, the sample modification also changes the aerosol interaction with light, which then no longer corresponds to its dry atmospheric state. Therefore, this method is primarily used to determine the mass of the absorbing refractory particles rather than the aerosol light absorption in the atmosphere. A low standard deviation around the average was also measured by the AE33. The highest average σAP,λ was measured by the AE31 instrument. This could be explained by this methods' sensitivity to various artifacts and thus a significant dependence on the aerosol characteristics.
The EMS methods systematically overestimated the aerosol absorption coefficient, giving a campaign-average medium of 0.59 Mm−1 and the 25th and the 75th percentiles of 0.44 and 0.74 Mm−1 when considering all EMS data (Fig. 3). The absorption values measured at Pallas are clearly below the detection capabilities of the EMS methods, as already suggested by the results from the previous section. The baseline drift and the error amplification are known to affect the EMS method detection limits (Modini et al., 2021). The calculated standard deviation around the average σAP,λ for all three EMS methods encompassed zero (Table 3).
3.3 Representativeness of the measured absorption values
The absorption coefficients measured during this project were in the lower end of those typically observed at the Pallas site. Long-term analysis (Lihavainen et al., 2015) showed that the σAP,550 nm in Pallas during summer ranges between 0.05–1 Mm−1 (10–90 percentile range), where the lowest values correspond to the clean Arctic air flows. Summer is also the season of the highest ω0 in all the year, with values ranging from 0.90 to 0.98 (Lihavainen et al., 2015). Both the Arctic marine and the continental air masses are observed during summer season, and typically with a similar probability of occurrence. Thus, having our campaign-time air masses 100 % from the Arctic was rather unexpected and focuses our analysis on pristine environments.
Indeed, the σAP,λ values measured during the Pallas campaign represent well those observed at around the Arctic during summer (Schmeisser et al., 2018). In a majority of the Arctic region, a minimum in absorption is observed during summer and early autumn when the monthly median σAP,550 nm remains below 0.1 Mm−1 for 4–5 months (Schmeisser et al., 2018). Quantification of this Arctic absorption concentration baseline thus requires well-calibrated, accurate techniques. An additional measurement challenge is that the Arctic aerosol is particularly white with ω0 typically exceeding 0.95 (Schmeisser et al., 2018). The filter-based techniques and correction schemes are known to be particularly sensitive and noisy at high values of ω0 (Backman et al., 2014; Ogren et al., 2017).
3.4 Accuracy of the measured absorption
The accuracy of the filter-based methods was further investigated by comparing them using MAAP as a main campaign-time reference. MAAP is known to be essentially an artifact-free technique to measure aerosol absorption on a filter and has been widely utilized in the past as a practical field reference method (Müller et al., 2011a; Backman et al., 2017).
Linear correlation between the absorption coefficients measured with different techniques was calculated using the Williamson–York bivariate fitting method provided by Cantrell (2008). This method is less sensitive to outliers than the standard least-squares method and considers that uncertainties can exist in both fitting variables, which is the case here. The correlation statistics (R2, slope and intercept with their corresponding standard errors) for the filter-based techniques are presented in Table 4. All correlations were statistically highly significant.
Table 4Linear regression statistics (correlation coefficients and standard error, SE) and R2 values for 1 h average absorption coefficient measured with filter-based instruments , where x=MAAP and y=AE31, AE33, PSAP, or COSMOS. All presented correlations are statistically highly significant (p<0.001) and calculated at λ=637 nm.
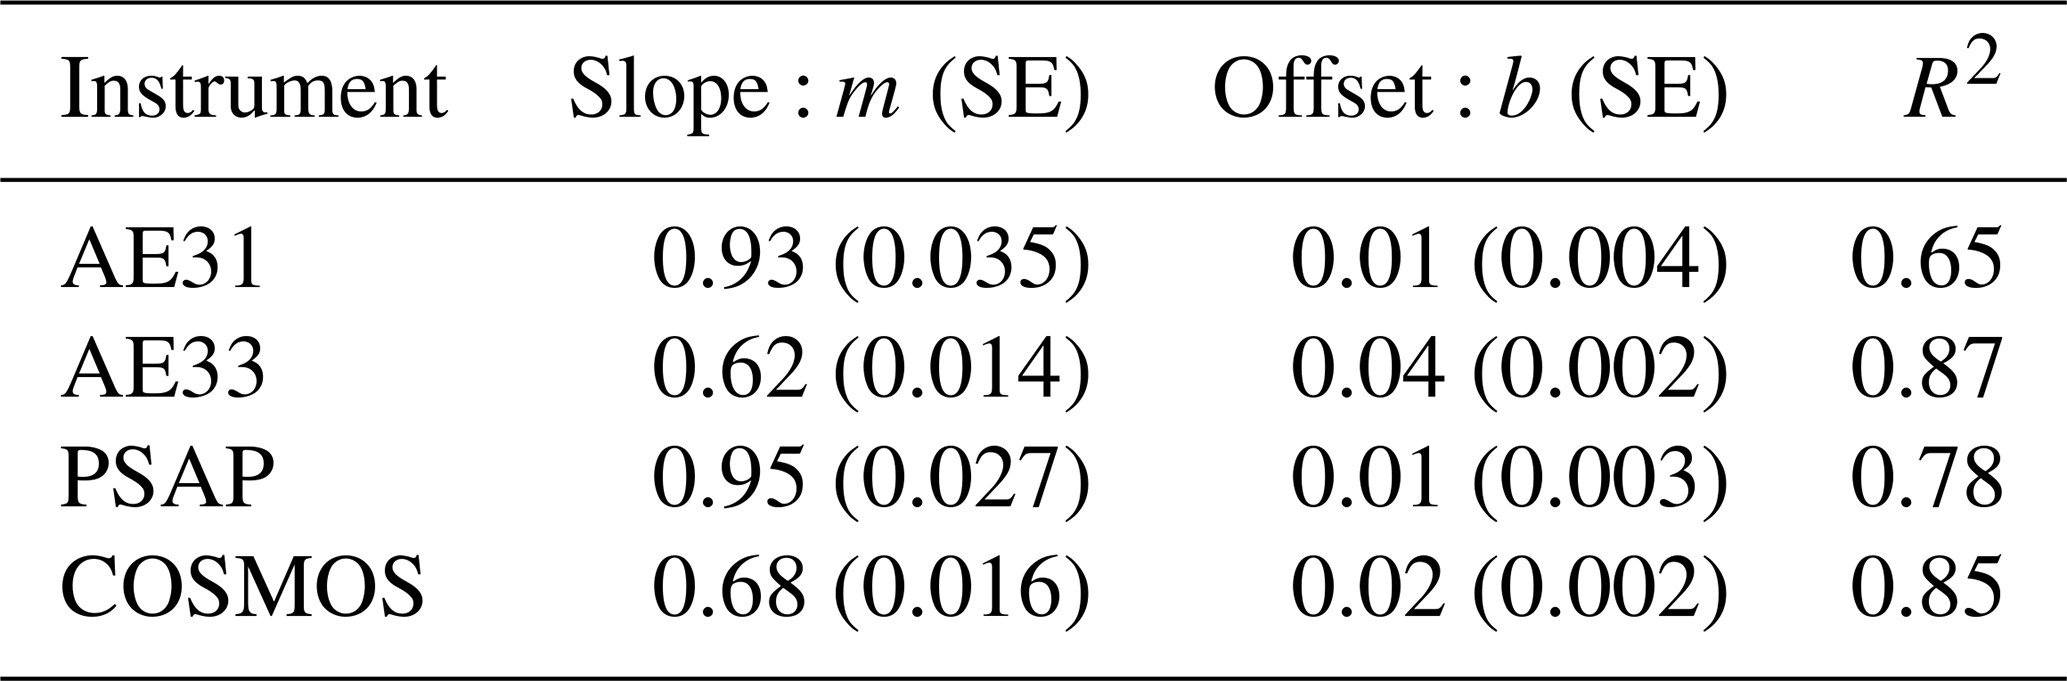
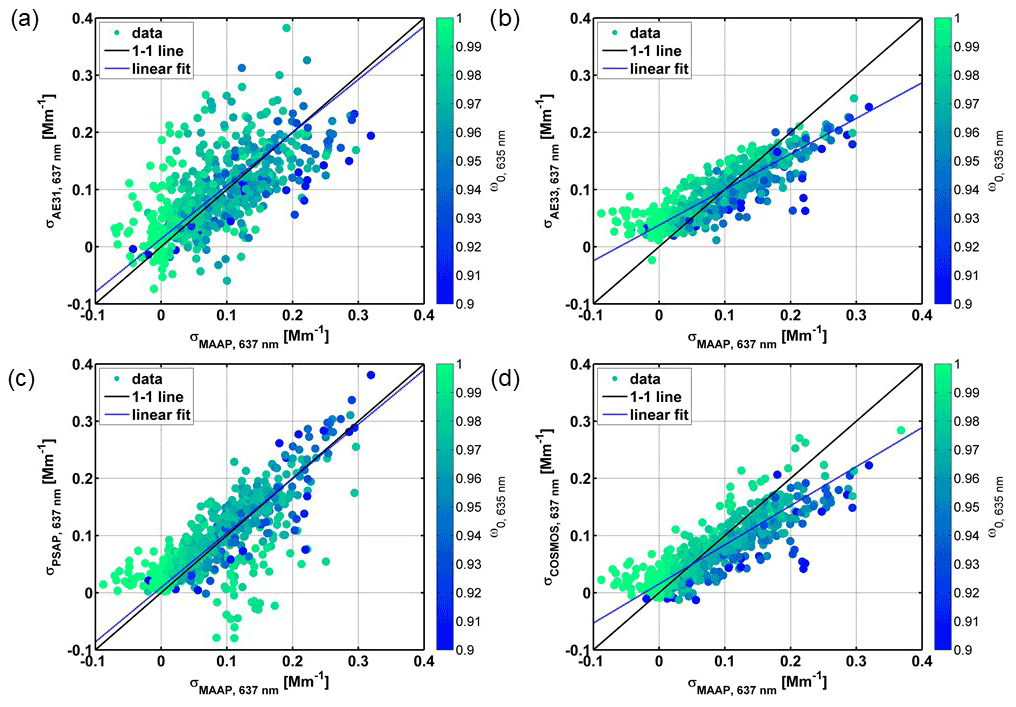
Figure 4One-hour averaged absorption coefficient measured by MAAP (x axis) and by (a) AE31, (b) AE33, (c) PSAP, and (d) COSMOS colored by 1 h averaged ω0,635 nm. The solid lines are bivariate fits to the data, and the dashed lines are the 1:1 values. The corresponding correlation coefficients, their standard errors, and the R2 statistics are presented in Table 4.
The best correlation was obtained with σAE33,λ and σMAAP,λ, followed by σCOSMOS,λ and σMAAP,λ (R2=0.87 and 0.85, respectively). Correlation between σAE31,λ and σMAAP,λ was noisy and resulted in the lowest R2=0.65. Both AE31 and PSAP compared to MAAP showed a nearly linear correlation of σAP,λ, with a slope of 0.95 and 0.93, respectively, and an offset of 0.01. The scattering correction done for PSAP data, which adds noise from the nephelometer measurement (Backman et al., 2014), is a plausible explanation for the lower R2=0.78. The AE33 appeared to overestimate the σAP,λ at the lowest measured absorption values, while it slightly underestimated at the other end of the scale. This led to a correlation slope significantly below 1, as compared to MAAP. The slope of the linear fitting for both COSMOS and AE33 was clearly below 1 (0.68 and 0.62, respectively), but in COSMOS this is explained by the sample pre-treatment in inlet which modifies the sample composition. The low fitting slope value of AE33 seems to be rather explained by the deviation of data near the zero values. Overestimation of σAP,λ at values close to 0 as compared to MAAP was notable in all instrument data, except in AE31 (Fig. 4).
Figure 4 additionally shows that at low values of absorption the single scattering albedo ω0 increases. This can be a real effect but can also partly relate to the decreasing accuracy in σAP,λ result at the edge of the instrument detection limits, affecting the scattering-to-absorption ratio.
Given that the measured absorption coefficients are close to the detection limits of the instruments the obtained correlation coefficients (R2) are reasonably good. This suggests that the filter techniques examined here can provide useful data with an accuracy of 40 % for 1–2 h averages even at the very low absorption values encountered. However, slopes and intercepts are sensitive to different selection of data outliers at such low absorption values.
Comparison of σAP,λ measured with EMS methods to the hourly averaged values from MAAP did not lead to statistically highly significant correlations. Our observations do not support the use of EMS methods in such pristine environments.
3.5 Mass absorption cross section of Arctic aerosol
The absorbing particle mass based on the measured absorption coefficient can be calculated with a suitable selection of the mass absorption cross section (MAC). We defined the average MAC during our campaign by comparing the measured absorption by MAAP with the measured rBC mass by SP2 over the range from 0 to 18 ng m−3 (Fig. 2d). This analysis resulted in a MAC value of 16.0±5.7 m2 g−1 (Fig. 5). The default MAC in MAAP is 6.6 m2 g−1, which gives a ratio of 2.4 between the black carbon mass equivalent and the refractory black carbon mass.
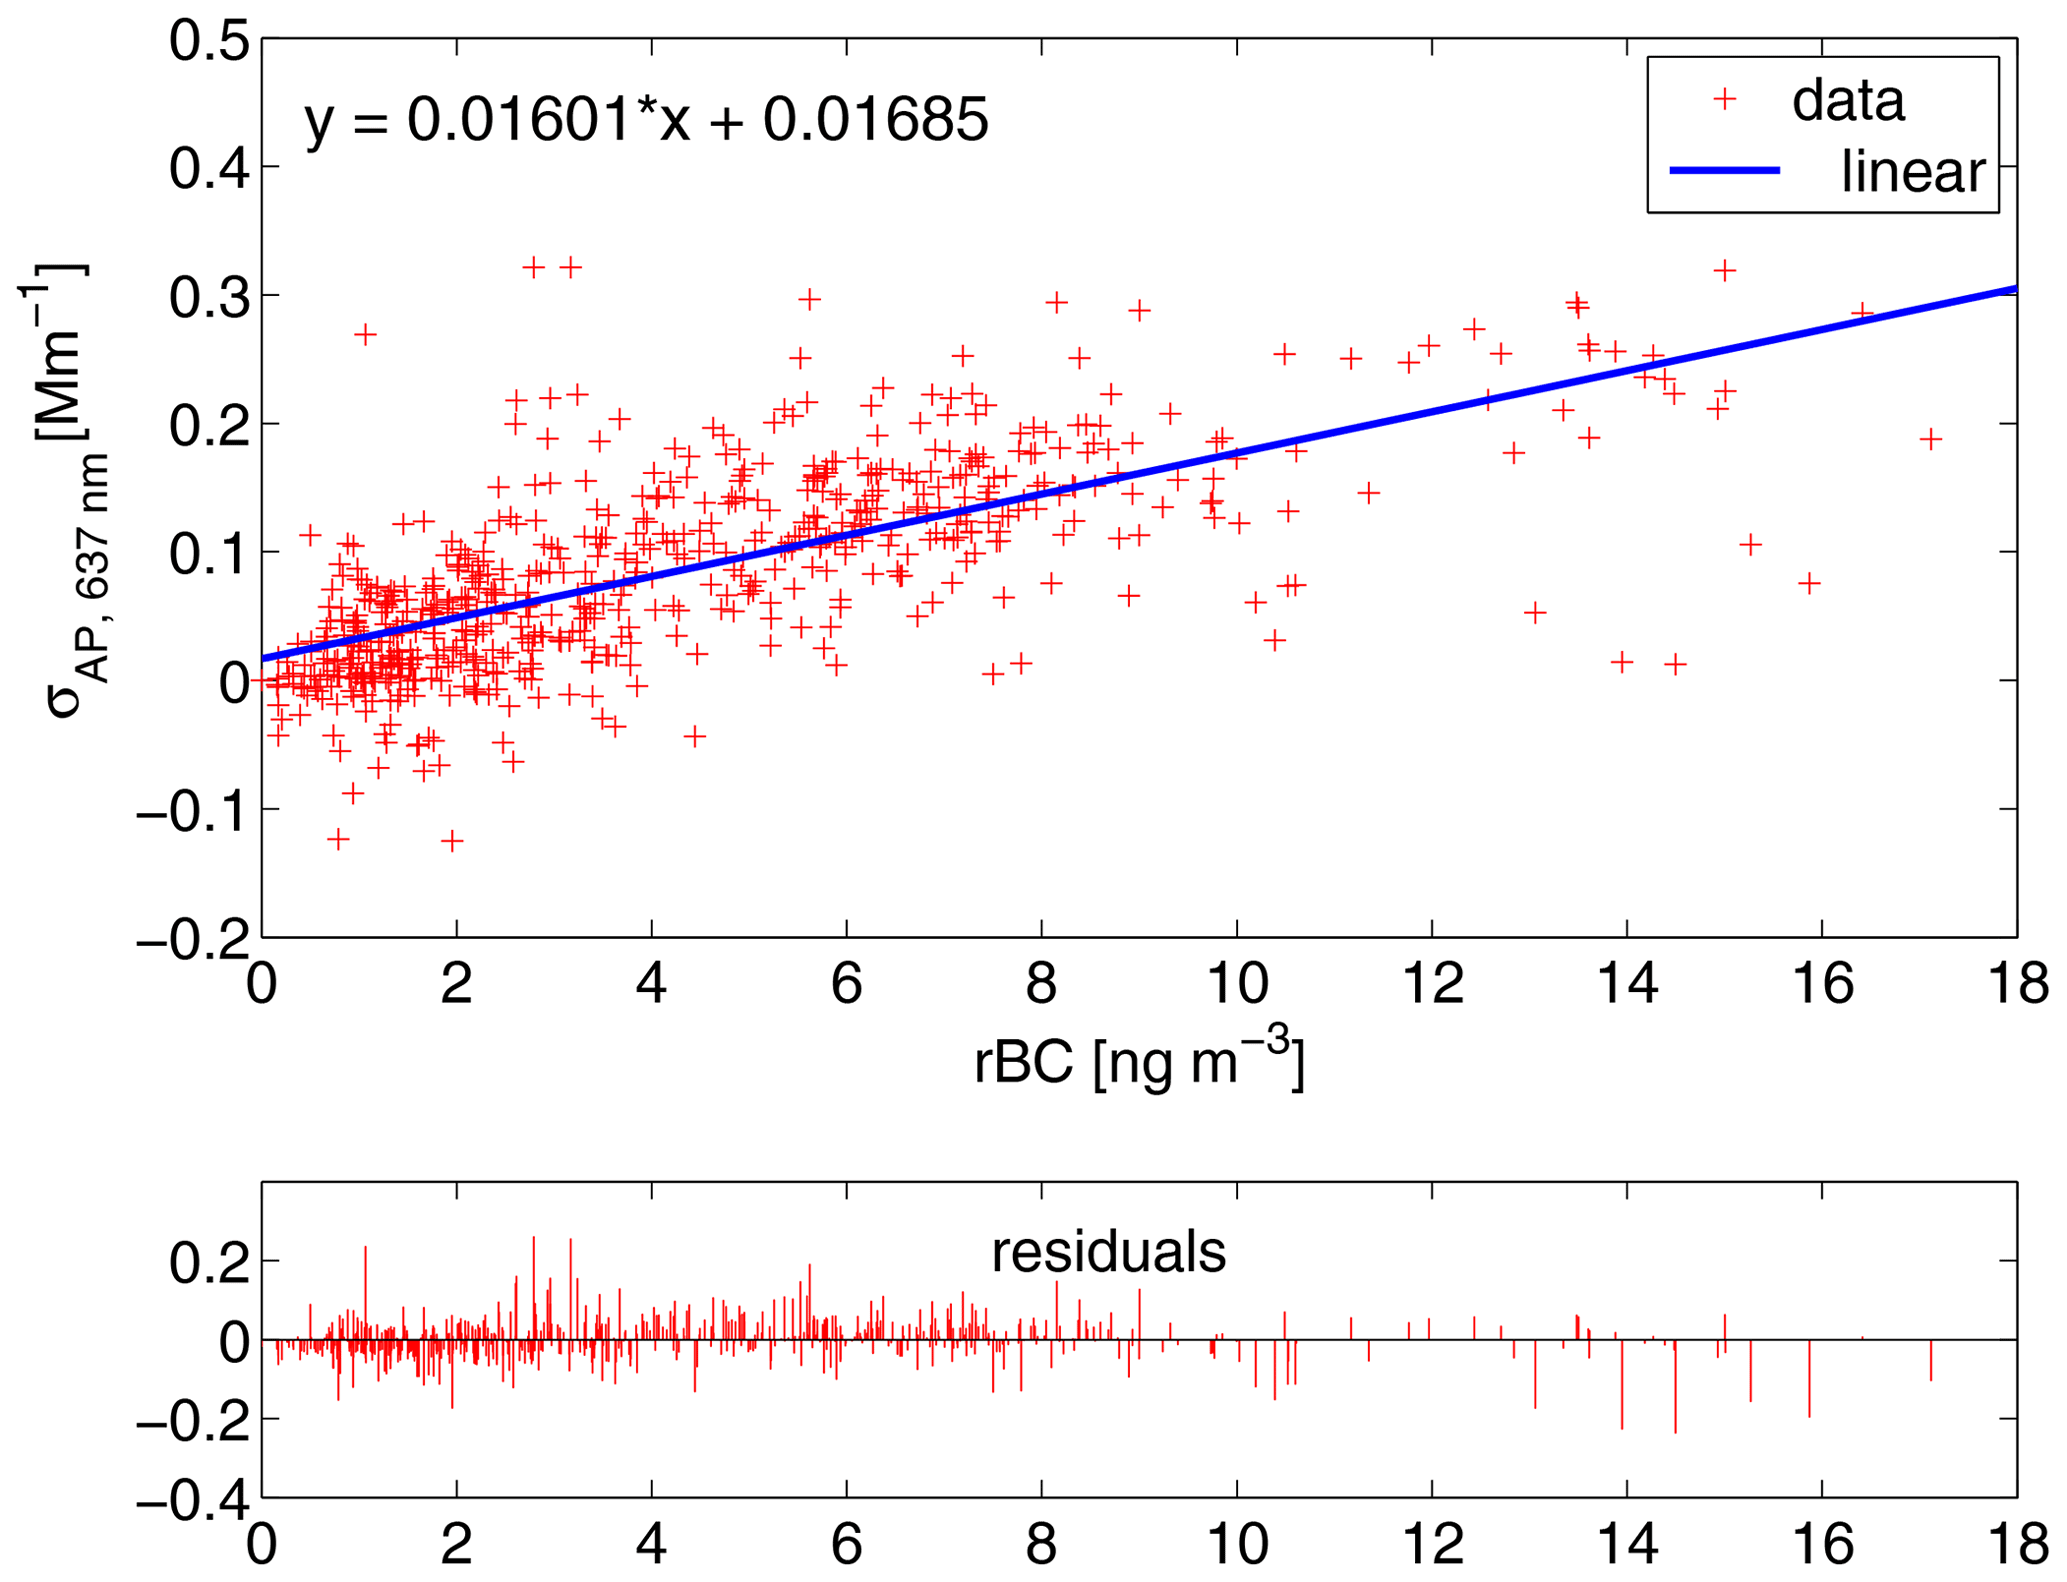
Figure 5The absorption coefficient measured with MAAP as a function of the rBC concentration measured with SP2. The linear regression slope provides the corresponding mass absorption cross section (MAC=16.0 m2 g−1) value for MAAP, and the lower panel presents the residuals of the correlation.
The MAC is not a constant value and can depend on various factors such as the absorbing aerosol source and the aerosol mixing state that is subject to its atmospheric aging (Jacobson, 2001; Slowik et al., 2007; Petzold et al., 2013a; Zanatta et al., 2018; Ohata et al., 2020). Zanatta et al. (2018) measured fairly high MAC values of 9.81±1.68 m2 g−1 at Zeppelin Arctic station, which could be explained by the scattering enhancement. A comprehensive characterization of the Arctic MAC values was recently published by Ohata et al. (2020). Their results were calculated for a dataset covering a broad range of absorption values measured around the Arctic using COSMOS as a reference mass monitor. The overall average MAC in their study was 14.0 m2 g−1 and thus on the same order of magnitude as obtained here for the Pallas site using the MAAP and SP2.
Absorbing aerosol characteristics were measured by various methods and instruments in an EMPIR BC month-long measurement campaign at the remote Pallas station in northern Finland. Arctic air masses prevailed and consequently very clean and highly scattering aerosol persisted throughout the campaign. This was a challenge for the absorption instrumentation in terms of their accuracy and detection limits.
We determined the 1σ detection limits of σAP,637 nm for five filter-based absorption monitors (MAAP, AE31, AE33, PSAP, COSMOS) and for the extinction minus scattering (EMS) method with three different instrument pairs using Allan variance analysis by data averaging at a 1–2 h interval. The detection limits of filter-based instruments ranged from 0.002 to 0.014 Mm−1. The lowest detection limit was calculated for PSAP and the highest for AE31. The detection limits of EMS methods were an order of magnitude higher, ranging from 0.38 to 0.11 Mm−1. As a general rule our results suggest that the filter-based absorption instruments can be applied down to Mm−1 and the EMS methods are not usable at Mm−1, at least for the high ω0 values encountered in this study.
The aerosol absorption coefficient measured at Pallas ranged from 0.06 to 0.10 Mm−1 (representing the 25th to 75th percentiles) and the different filter-based instruments agreed approximately within 40 %. The values we measured were at the lower edge of absorption typically measured at the Pallas site but represent Arctic summer conditions encountered at other sites well. AE33 showed the best linear correlation with MAAP (R2=0.87), followed by COSMOS (R2=0.85) and PSAP (R2=0.78). The scattering correction that was applied to PSAP data at the measured low absorption values improved the correlation with MAAP at low ω0 values but likely led to an underestimation and increased noise at extremely high ω0 values >0.99. The noisy AE31 data resulted in a slightly lower, yet a highly significant correlation (R2=0.65). A positive bias at low σAP,λ values near zero levels was observed in AE33, PSAP, and COSMOS. The correlation slope with MAAP was close to 1 in PSAP and AE31 but clearly below 1 in COSMOS and AE33. It has to be kept in mind that these results were calculated for a very clean environment and at a relatively narrow σAP,λ range from 0 to 0.3 Mm−1. Thus the biases observed at around zero concentrations can significantly affect the fitted slopes.
Finally, we determined the aerosol MAC value during the campaign using SP2 as a mass reference and MAAP as an absorption reference. The MAC, determined as a slope of the correlation between those two, was 16.0±5.7 m2 g−1 and is consistent with previous values measured during Arctic studies (Zanatta et al., 2018; Ohata et al., 2020).
Overall, the filter-based absorption instruments are shown to be a robust and sensitive method to measure absorption in pristine environments, such as the Arctic. Sufficient averaging of data to reach minimum instrument detection limits and a utilization of co-located instruments as transfer standards to better estimate data precision are recommended. In lack of a validated absorption transfer standard, continued use of MAAP as a practical field reference method is recommended. Future studies should focus on providing the means for field instrument reference and calibration methods to further improve the accuracy of the filter-based methods.
| Symbol | Explanation |
| λ | Wavelength of light. |
| σSP,λ | Scattering coefficient at wavelength λ. |
| σAP,λ | Absorption coefficient at wavelength λ. |
| σEP,λ | Extinction coefficient at wavelength λ. |
| σ0,λ | Absorption coefficient at wavelength λ as directly reported by instrument. |
| σINST,λ | Absorption coefficient at wavelength λ after corrections measured with INST. |
| INST | Abbreviation of the absorption measurement instrument (see Sect. 2, “Methodology”, for a complete list of instruments used). |
| ω0,λ | Single-scattering albedo at wavelength λ. |
| αSP,λ | Ångström exponent of scattering at wavelength λ. |
| αAP,λ | Ångström exponent of absorption at wavelength λ. |
| EMSn | Extinction minus scattering technique to measure absorption, where n=1, 2, or 3, referring to a pair of instruments used (see Sect. 2, “Methodology”, for details). |
Pallas WMO Global Atmospheric Watch (GAW) station, part of the Aerosols, Clouds, and Trace gases Research InfraStructure (ACTRIS), submits aerosol number, size, scattering, and absorption measurement data annually to the EBAS database operated at the Norwegian Institute for Air Research (NILU) (http://ebas.nilu.no, NILU, 2021). These data are available at no cost and can be used in agreement with the ACTRIS Data Policy statement. The specific data measured during EMPIR BC campaign are stored at institutional data repositories and are freely available for scientific use upon request; these include Aurora 4000 (TROPOS), CAPSssa (DEMOKRITOS), COSMOS (NIPR), and SP2 and CAPSex (FMI) data.
The supplement related to this article is available online at: https://doi.org/10.5194/amt-14-5397-2021-supplement.
EA, HS, JB, MG, KE, TM, and AH participated in planning the campaign. EA, JB, HS, and MG made the measurements. EA analyzed the filter-based instrument absorption data and all auxiliary data with contributions from AV and JB. JB analyzed SP2 data. MG and KE analyzed CAPS data. TM analyzed Aurora nephelometer data. SO, YK, and HS analyzed COSMOS data. EA prepared the paper with contributions from all authors.
The authors declare that they have no conflict of interest.
Publisher's note: Copernicus Publications remains neutral with regard to jurisdictional claims in published maps and institutional affiliations.
We greatly acknowledge the funding from the 16ENV02 Black Carbon project of the European Union through the European Metrology Programme for Innovation and Research (EMPIR). The financial support of ACTRIS by the European Union's Horizon 2020 research and innovation program under grant agreement no. 654109 is also gratefully acknowledged. This research was also supported by the Academy of Finland via project NABCEA (grant no. 29664) and by Business Finland via project BC Footprint (grant no. 49402-201040). This work was also supported by the Environmental Research and Technology Development Fund (2-2003) and the Arctic Challenge for Sustainability II (ArCS II) project of Japan.
This research has been supported by the European Association of National Metrology Institutes (grant no. 16ENV02), Horizon 2020 (ACTRIS-2 (grant no. 654109)), the Academy of Finland (grant no. 29664), Business Finland (grant no. 49402-201040), and the Environmental Research and Technology Development Fund (Japan) (grant no. 2-2003).
This paper was edited by Charles Brock and reviewed by two anonymous referees.
Allan, D. W.: Statistics of Atomic Frequency Standards, Proc. IEEE, 54, 221–230, 1966. a
Anderson, T. L., Covert, D. S., Marshall, S. F., Laucks, M. L., Charlson, R. J., Waggoner, A. P., Ogren, J. A., Caldow, R., Holm, R., Quant, F., Sem, G., Wiedensohler, A., Ahlquist, N. A., and Bates, T. S.: Performance characteristics of a high-sensitivity, three-wavelength, total scatter/backscatter nephelometer, J. Atmos. Ocean. Tech., 13, 967–986, 1996. a
Anderson, T. L. and Ogren, J. A.: Determining aerosol radiative properties using the TSI 3563 integrating nephelometer, Aerosol Sci. Tech., 29, 57–69, https://doi.org/10.1080/02786829808965551, 1998. a, b, c
Arnott, W. P., Moosmüller, H., Rogers, C. F., Jin, T., and Bruch, R.: Photoacoustic spectrometer for measuring light absorption by aerosol: Instrument description, Atmos. Environ., 33, 2845–2852, https://doi.org/10.1016/S1352-2310(98)00361-6, 1999. a
Arnott, W. P., Hamasha, K., Moosmüller, H., Sheridan, P. J., and Ogren, J. A.: Towards aerosol light-absorption measurements with a 7-wavelength aethalometer: evaluation with a photoacoustic instrument and 3-wavelength nephelometer, Aerosol Sci. Tech., 39, 17–29, https://doi.org/10.1080/027868290901972, 2005. a, b
Backman, J., Virkkula, A., Vakkari, V., Beukes, J. P., Van Zyl, P. G., Josipovic, M., Piketh, S., Tiitta, P., Chiloane, K., Petäjä, T., Kulmala, M., and Laakso, L.: Differences in aerosol absorption Ångström exponents between correction algorithms for a particle soot absorption photometer measured on the South African Highveld, Atmos. Meas. Tech., 7, 4285–4298, https://doi.org/10.5194/amt-7-4285-2014, 2014. a, b, c
Backman, J., Schmeisser, L., Virkkula, A., Ogren, J. A., Asmi, E., Starkweather, S., Sharma, S., Eleftheriadis, K., Uttal, T., Jefferson, A., Bergin, M., Makshtas, A., Tunved, P., and Fiebig, M.: On Aethalometer measurement uncertainties and an instrument correction factor for the Arctic, Atmos. Meas. Tech., 10, 5039–5062, https://doi.org/10.5194/amt-10-5039-2017, 2017. a, b, c, d, e, f, g, h
Bond, T. C. and Bergstrom, R. W.: Light Absorption by CarbonaceousParticles: An Investigative Review, Aerosol Sci. Tech., 40, 27–67, 2006. a, b
Bond, T. C., Anderson, T. L., and Campbell, D.: Calibration and intercomparison of filter-based measurements of visible light absorption by aerosols, Aerosol Sci. Tech., 30, 582–600, https://doi.org/10.1080/027868299304435, 1999. a, b, c, d, e, f
Cantrell, C. A.: Technical Note: Review of methods for linear least-squares fitting of data and application to atmospheric chemistry problems, Atmos. Chem. Phys., 8, 5477–5487, https://doi.org/10.5194/acp-8-5477-2008, 2008. a
Collaud Coen, M., Weingartner, E., Apituley, A., Ceburnis, D., Fierz-Schmidhauser, R., Flentje, H., Henzing, J. S., Jennings, S. G., Moerman, M., Petzold, A., Schmid, O., and Baltensperger, U.: Minimizing light absorption measurement artifacts of the Aethalometer: evaluation of five correction algorithms, Atmos. Meas. Tech., 3, 457–474, https://doi.org/10.5194/amt-3-457-2010, 2010. a, b
Drinovec, L., Močnik, G., Zotter, P., Prévôt, A. S. H., Ruckstuhl, C., Coz, E., Rupakheti, M., Sciare, J., Müller, T., Wiedensohler, A., and Hansen, A. D. A.: The “dual-spot” Aethalometer: an improved measurement of aerosol black carbon with real-time loading compensation, Atmos. Meas. Tech., 8, 1965–1979, https://doi.org/10.5194/amt-8-1965-2015, 2015. a, b
Hagler, G., Vedantham, R., and Turner, J.: Post-processing method to reduce noise while preserving high time resolution in aethalometer real-time black carbon data, Aerosol Air Qual. Res., 11, 539–546, 2011. a
Hansen, A. D. A., Rosen, H., and Novakov, T.: Real-time measurement of the absorption coefficient of aerosol particles, Appl. Opt., 21, 3060–3062, https://doi.org/10.1364/AO.21.003060, 1982. a, b
Hansen, A. D. A., Rosen, H., and Novakov, T.: The aethalometer – An instrument for the real-time measurement of optical absorption by aerosol particles, Sci. Total Environ., 36, 191, https://doi.org/10.1016/0048-9697(84)90265-1, 1984. a, b
Hatakka J., Aalto T., Aaltonen V., Aurela M., Hakola H., Komppula M., Laurila T., Lihavainen H., Paatero J., Salminen K., and Viisanen Y.: Overview of the atmospheric research activities and results at Pallas GAW station, Boreal Environ. Res., 8, 365–383, 2003. a
Heintzenberg, J., Wiedensohler, A., Tuch, T. M., Covert, D. S., Sheridan, P., Ogren, J. A., Gras, J., Nessler, R., Kleefeld, C., Kalivitis, N., Aaltonen, V., Wilhelm, R. T., and Havlicek, M.: Intercomparisons and aerosol calibrations of 12 commercial integrating nephelometers of three manufacturers, J. Atmos. Ocean. Tech., 23, 902–914, https://doi.org/10.1175/JTECH1892.1, 2006. a
Hyvärinen, A.-P., Vakkari, V., Laakso, L., Hooda, R. K., Sharma, V. P., Panwar, T. S., Beukes, J. P., van Zyl, P. G., Josipovic, M., Garland, R. M., Andreae, M. O., Pöschl, U., and Petzold, A.: Correction for a measurement artifact of the Multi-Angle Absorption Photometer (MAAP) at high black carbon mass concentration levels, Atmos. Meas. Tech., 6, 81–90, https://doi.org/10.5194/amt-6-81-2013, 2013. a
Jacobson, M. Z.: Strong radiative heating due to the mixing state of Black Carbon in atmospheric aerosols, Nature, 409, 695–697, 2001. a
Kanaya, Y., Komazaki, Y., Pochanart, P., Liu, Y., Akimoto, H., Gao, J., Wang, T., and Wang, Z.: Mass concentrations of black carbon measured by four instruments in the middle of Central East China in June 2006, Atmos. Chem. Phys., 8, 7637–7649, https://doi.org/10.5194/acp-8-7637-2008, 2008. a, b
Kebabian, P. L., Robinson, W. A., and Freedman, A.: Optical extinction monitor using cw cavity enhanced detection, Rev. Sci. Instrum., 78, 063102, https://doi.org/10.1063/1.2744223, 2007. a
Kondo, Y., Sahu, L., Kuwata, M., Miyazaki, Y., Takegawa, N., Moteki, N., Imaru, J., Han, S., Nakayama, T., Kim Oanh, N. T., Hu, M., Kim, Y. J., and Kita, K.: Stabilization of the mass absorption cross section of black carbon for filter-based absorption photometry by the use of a heated inlet, Aerosol Sci. Tech., 43, 741–756, https://doi.org/10.1080/02786820902889879, 2009. a, b, c, d
Kondo, Y., Sahu, L., Moteki, N., Khan, F., Takegawa, N., Liu, X., Koike, M., and Miyakawa, T.: Consistency and traceability of black carbon measurements made by laser-induced incandescence, thermal-optical transmittance, and filter-based photo-absorption techniques, Aerosol Sci. Tech., 45, 295–312, https://doi.org/10.1080/02786826.2010.533215, 2011. a, b, c
Laborde, M., Schnaiter, M., Linke, C., Saathoff, H., Naumann, K.-H., Möhler, O., Berlenz, S., Wagner, U., Taylor, J. W., Liu, D., Flynn, M., Allan, J. D., Coe, H., Heimerl, K., Dahlkötter, F., Weinzierl, B., Wollny, A. G., Zanatta, M., Cozic, J., Laj, P., Hitzenberger, R., Schwarz, J. P., and Gysel, M.: Single Particle Soot Photometer intercomparison at the AIDA chamber, Atmos. Meas. Tech., 5, 3077–3097, https://doi.org/10.5194/amt-5-3077-2012, 2012. a
Laing, J. R., Jaffe, D. A., and Sedlacek, III, A. J.: Comparison of filter-based absorption measurements of biomass burning aerosol and background aerosol at the Mt. Bachelor Observatory, Aerosol Air Qual. Res., 20, 663–678, https://doi.org/10.4209/aaqr.2019.06.0298, 2020. a, b
Lihavainen, H., Hyvärinen, A., Asmi, E., Hatakka, J., and Viisanen, Y.: Long-term variability of aerosol optical properties in northern Finland, Boreal Environ. Res., 20, 526–541, available at: http://hdl.handle.net/10138/228289 (last access: 2 August 2021), 2015. a, b, c, d
Lohila A., Penttilä T., Jortikka S., Aalto T., Anttila P., Asmi E., Aurela M., Hatakka J., Hellén H., Henttonen H., Hänninen P., Kilkki J., Kyllönen K., Laurila T., Lepistö A., Lihavainen H., Makkonen U., Paatero J., Rask M., Sutinen R., Tuovinen J.-P., Vuorenmaa J., and Viisanen Y.: Preface to the special issue on integrated research of atmosphere, ecosystems and environment at Pallas, Boreal Environ. Res., 20, 431–454, available at: http://hdl.handle.net/10138/228278 (last access: 2 August 2021), 2015. a
Massoli, P., Kebabian, P. L., Onasch, T. B., Hills, F. B., and Freedman, A.: Aerosol Light Extinction Measurements by Cavity Attenuated Phase Shift (CAPS) Spectroscopy: Laboratory validation and field deployment of a compact aerosol particle extinction monitor, Aerosol Sci. Tech., 44, 428–435, https://doi.org/10.1080/02786821003716599, 2010. a
Miyazaki, Y., Kondo, Y., Sahu, L. K., Imaru, J., Fukushima, N., and Kanno, A.: Performance of a newly designed continuous soot monitoring system (COSMOS), J. Environ. Monitor., 10, 1195–1201, https://doi.org/10.1039/B806957C, 2008. a, b
Modini, R. L., Corbin, J. C., Brem, B. T., Irwin, M., Bertò, M., Pileci, R. E., Fetfatzis, P., Eleftheriadis, K., Henzing, B., Moerman, M. M., Liu, F., Müller, T., and Gysel-Beer, M.: Detailed characterization of the CAPS single-scattering albedo monitor (CAPS PMssa) as a field-deployable instrument for measuring aerosol light absorption with the extinction-minus-scattering method, Atmos. Meas. Tech., 14, 819–851, https://doi.org/10.5194/amt-14-819-2021, 2021. a, b, c, d
Moosmuller, H., Chakrabarty, R. K., and Arnott, W.: Aerosol light absorption and its measurement: A review, J. Quant. Spectrosc. Ra., 110, 844–878, https://doi.org/10.1016/j.jqsrt.2009.02.035, 2009. a
Mölders, N. and Edwin, S.: Review of Black Carbon in the Arctic–Origin, Measurement Methods, and Observations, Open Journal of Air Pollution, 7, 181–213. https://doi.org/10.4236/ojap.2018.72010, 2018. a
Müller, T., Henzing, J. S., de Leeuw, G., Wiedensohler, A., Alastuey, A., Angelov, H., Bizjak, M., Collaud Coen, M., Engström, J. E., Gruening, C., Hillamo, R., Hoffer, A., Imre, K., Ivanow, P., Jennings, G., Sun, J. Y., Kalivitis, N., Karlsson, H., Komppula, M., Laj, P., Li, S.-M., Lunder, C., Marinoni, A., Martins dos Santos, S., Moerman, M., Nowak, A., Ogren, J. A., Petzold, A., Pichon, J. M., Rodriquez, S., Sharma, S., Sheridan, P. J., Teinilä, K., Tuch, T., Viana, M., Virkkula, A., Weingartner, E., Wilhelm, R., and Wang, Y. Q.: Characterization and intercomparison of aerosol absorption photometers: result of two intercomparison workshops, Atmos. Meas. Tech., 4, 245–268, https://doi.org/10.5194/amt-4-245-2011, 2011a. a, b, c, d, e, f, g, h
Müller, T., Laborde, M., Kassell, G., and Wiedensohler, A.: Design and performance of a three-wavelength LED-based total scatter and backscatter integrating nephelometer, Atmos. Meas. Tech., 4, 1291–1303, https://doi.org/10.5194/amt-4-1291-2011, 2011. a
Nakayama, T., Kondo, Y., Moteki, N., Sahu, L. K., Kinase, T., Kita, K., and Matsumi, Y.: Size-dependent correction factors for absorption measurements using filter-based photometers: PSAP and COSMOS, J. Aerosol Sci., 41, 333–343, https://doi.org/10.1016/j.jaerosci.2010.01.004, 2010. a, b
Norwegian Institute for Air Research (NILU): EBAS database, available at: http://ebas.nilu.no, last access: 2 August 2021. a
Ogren, J. A.: Comment on “Calibration and intercomparison of filter-based measurements of visible light absorption by aerosols”, Aerosol Sci. Tech., 44, 589–591, https://doi.org/10.1080/02786826.2010.482111, 2010. a, b, c
Ogren, J. A., Wendell, J., Andrews, E., and Sheridan, P. J.: Continuous light absorption photometer for long-term studies, Atmos. Meas. Tech., 10, 4805–4818, https://doi.org/10.5194/amt-10-4805-2017, 2017. a, b
Ohata, S., Kondo, Y., Moteki, N., Mori, T., Yoshida, A., Sinha, P. R., and Koike, M.: Accuracy of black carbon measurements by a filter-based absorption photometer with a heated inlet, Aerosol Sci. Tech., 53, 1079–91, https://doi.org/10.1080/02786826.2019.1627283, 2019. a
Ohata, S., Mori, T., Kondo, Y., Sharma, S., Hyvärinen, A., Andrews, E., Tunved, P., Asmi, E., Backman, J., Servomaa, H., Veber, D., Koike, M., Kanaya, Y., Yoshida, A., Moteki, N., Zhao, Y., Matsushita, J., and Oshima, N.: Estimates of mass absorption cross sections of black carbon for filter-based absorption photometers in the Arctic, Atmos. Chem. Phys. Discuss. [preprint], https://doi.org/10.5194/acp-2020-1190, 2020. a, b, c, d
Onasch, T. B., Massoli, P., Kebabian, P. L., Hills, F. B., Bacon, F. W., and Freedman, A.: Single Scattering Albedo Monitor for Airborne Particulates, Aerosol Sci. Tech., 49, 267–279, https://doi.org/10.1080/02786826.2015.1022248, 2015. a, b
Perim de Faria, J., Bundke, U., Berg, M., Freedman, A., Onasch, T. B., and Petzold, A.: Airborne and laboratory studies of an IAGOS instrumentation package containing a modified CAPS particle extinction monitor, Aerosol Sci. Tech., 1–14, https://doi.org/10.1080/02786826.2017.1355547, 2017. a
Petzold, A., Ogren, J. A., Fiebig, M., Laj, P., Li, S.-M., Baltensperger, U., Holzer-Popp, T., Kinne, S., Pappalardo, G., Sugimoto, N., Wehrli, C., Wiedensohler, A., and Zhang, X.-Y.: Recommendations for reporting “black carbon” measurements, Atmos. Chem. Phys., 13, 8365–8379, https://doi.org/10.5194/acp-13-8365-2013, 2013a. a, b
Petzold, A., Onasch, T., Kebabian, P., and Freedman, A.: Intercomparison of a Cavity Attenuated Phase Shift-based extinction monitor (CAPS PMex) with an integrating nephelometer and a filter-based absorption monitor, Atmos. Meas. Tech., 6, 1141–1151, https://doi.org/10.5194/amt-6-1141-2013, 2013b. a, b
Reid, J. S., Hobbs, P. V., Liousse, C., Martins, J. V., Weiss, R. E., and Eck, T. F.: Comparisons of techniques for measuring shortwave absorption and black carbon content of aerosols from biomass burning in Brazil, J. Geophys. Res.-Atmos. 103, 32031–32040, https://doi.org/10.1029/98JD00773, 1998. a, b
Rosen, H., Hansen, A. D. A., Gundel, L., and Novakov, T.: Identification of the optically absorbing component in urban aerosols, Appl. Opt., 17, 3859–3861, https://doi.org/10.1364/AO.17.003859, 1978. a
Saathoff, H., Naumann, K. H., Schnaiter, M., Schock, W., Weingartner, E., Baltensperger, U., Kramer, L., Bozoki, Z., Pöschl,U., Niessner, R., and Schurath, U.: Carbon mass determinations during the AIDA soot aerosol campaign 1999, J. Aerosol Sci., 34, 1399–1420, https://doi.org/10.1016/S0021-8502(03)00365-3, 2003. a
Schmeisser, L., Backman, J., Ogren, J. A., Andrews, E., Asmi, E., Starkweather, S., Uttal, T., Fiebig, M., Sharma, S., Eleftheriadis, K., Vratolis, S., Bergin, M., Tunved, P., and Jefferson, A.: Seasonality of aerosol optical properties in the Arctic, Atmos. Chem. Phys., 18, 11599–11622, https://doi.org/10.5194/acp-18-11599-2018, 2018. a, b, c, d
Schmid, O., Artaxo, P., Arnott, W. P., Chand, D., Gatti, L. V., Frank, G. P., Hoffer, A., Schnaiter, M., and Andreae, M. O.: Spectral light absorption by ambient aerosols influenced by biomass burning in the Amazon Basin. I: Comparison and field calibration of absorption measurement techniques, Atmos. Chem. Phys., 6, 3443–3462, https://doi.org/10.5194/acp-6-3443-2006, 2006. a, b, c
Schulz, C., Kock, B., Hofmann, M., Michelsen, H. A., Will, S., Bougie, B., Suntz, R., and Smallwood, G.: Laser-induced incandescence: Recent trends and current questions, J. Appl. Phys. B., 83, 333–354, https://doi.org/10.1007/s00340-006-2260-8, 2006. a
Schwarz, J. P., Gao, R. S., Fahey, D. W., Thomson, D. S., Watts, L. A., Wilson, J. C., Reeves, J. M., Darbeheshti, M., Baumgardner, D. G., Kok, G. L., Chung, S. H., Schulz, M., Hendricks, J., Lauer, A., Kaercher, B., Slowik, J. G., Rosenlof, K. H., Thompson, T. L., Langford, A. O., Loewenstein, M., and Aikin, K. C.: Single-particle measurements of midlatitude black carbon and light scattering aerosols from the boundary layer to the lower stratosphere, J. Geophys. Res.-Atmos., 111, D16, https://doi.org/10.1029/2006JD007076, 2006. a, b
Sinha, P. R., Kondo, Y., Koike, M., Ogren, J. A., Jefferson, A., Barrett, T. E., Sheesley, R. J., Ohata, S., Moteki, N., Coe, H., Liu, D., Irwin, M., Tunved, P., Quinn, P. K., and, Zhao, Y.: Evaluation of ground-based black carbon measurements by filter-based photometers at two Arctic sites, J Geophys. Res.-Atmos., 122, 3544–3572, https://doi.org/10.1002/2016JD025843, 2017. a, b
Slowik, J. G., Cross, E. S., Han, J-H, Davidovits, P., Onasch, T. B., Jayne, J. T., Williams, L. R., Canagaratna, M. R., Worsnop, D. R., Chakrabarty, R. K., Moosmüller, H., Arnott, W. P., Schwarz, J. P., Gao, R-S., Fahey, D. W., David W. Kok, G. L., and Petzold, A.: An inter-comparison of instruments measuring black carbon content of soot particles, Aerosol Sci. Tech., 41, 295–314, https://doi.org/10.1080/02786820701197078, 2007. a, b
Springston, S. R. and Sedlacek III, A. J.: Noise characteristics of an instrumental particle absorbance technique, Aerosol Sci. Tech., 41, 1110–1116, https://doi.org/10.1080/02786820701777457, 2007. a, b
Stephens, M., Turner, N., and Sandberg, J.:Particle identification by laser-induced incandescence in a solid-state laser cavity, Appl. Opt., 42, 3726–3736, https://doi.org/10.1364/AO.42.003726, 2003. a
Strawa, A., Castaneda, R., Owano, T., Baer, D., Paldus, B., and Gore, W.: The measurement of aerosol optical properties using continuous wave cavity ring-down techniques, J. Atmos. Ocean. Tech., 20, 454–465, https://doi.org/10.1175/1520-0426(2003)20<454:TMOAOP>2.0.CO;2, 2003. a, b
Tørseth, K., Andrews, E., Asmi, E., Eleftheriadis, K., Fiebig, M. Herber, A., Lin, H., Kylling, A., Lupi, A., Massling, A., Mazzola, M., Nøjgaard, J. K., Popovicheva, O., Schichtel, B., Schmale, J., Sharma, S., Skov, H., Stebel, K., Vasel, B., Vitale, V., Whaley, C., Yttri, K. E., and Zanatta, M.: Review of observation capacities and data availability for black carbon in the arctic region: EU Action on black carbon in the Arctic – Technical Report 1, available at: https://www.amap.no/work-area/document/3058 (last access: 2 August 2021), 2019. a
Virkkula, A.: Correction of the calibration of the 3-wavelength particle soot absorption photometer (3λ PSAP), Aerosol Sci. Tech., 44, 706–712, https://doi.org/10.1080/02786826.2010.482110, 2010. a, b, c
Virkkula, A., Ahlquist, N. C., Covert, D. S., Sheridan, P. J., Arnott, W. P., and Ogren, J. A.: A three-wavelength optical extinction cell for measuring aerosol light extinction and its application to determining light absorption coefficient, Aerosol Sci. Tech., 39, 52–67, https://doi.org/10.1080/027868290901918, 2005. a, b
Virkkula, A., Mäkelä, T., Yli-Tuomi, T., Hirsikko, A., Koponen, I. K., Hämeri, K., and Hillamo, R.: A simple procedure for correcting loading effects of aethalometer data, JAPCA J. Air Waste Ma., 57, 1214–1222, https://doi.org/10.3155/1047-3289.57.10.1214, 2007. a, b, c
Virkkula, A., Chi, X., Ding, A., Shen, Y., Nie, W., Qi, X., Zheng, L., Huang, X., Xie, Y., Wang, J., Petäjä, T., and Kulmala, M.: On the interpretation of the loading correction of the aethalometer, Atmos. Meas. Tech., 8, 4415–4427, https://doi.org/10.5194/amt-8-4415-2015, 2015. a
Weingartner, E., Saathof, H., Schnaiter, M., Streit, N., Bitnar, B., and Baltensperger, U.: Absorption of light by soot particles: determination of the absorption coefficient by means of aethalometers, J. Aerosol Sci., 34, 1445–1463, https://doi.org/10.1016/S0021-8502(03)00359-8, 2003. a
Werle, P., Mücke, R., and Slemr, F.: The limits of signal averaging in atmospheric trace-gas monitoring by tunablediode-laser absorption spectroscopy (TDLAS), Appl. Phys. B, 57, 131–139, 1993. a, b
Zanatta, M., Laj, P., Gysel, M., Baltensperger, U., Vratolis, S., Eleftheriadis, K., Kondo, Y., Dubuisson, P., Winiarek, V., Kazadzis, S., Tunved, P., and Jacobi, H.-W.: Effects of mixing state on optical and radiative properties of black carbon in the European Arctic, Atmos. Chem. Phys., 18, 14037–14057, https://doi.org/10.5194/acp-18-14037-2018, 2018. a, b, c