the Creative Commons Attribution 4.0 License.
the Creative Commons Attribution 4.0 License.
 | 09 Aug 2021
Characterisation of gas reference materials for underpinning atmospheric measurements of stable isotopes of nitrous oxide
Ruth E. Hill-Pearce
Aimee Hillier
Eric Mussell Webber
Kanokrat Charoenpornpukdee
Simon O'Doherty
Joachim Mohn
Christoph Zellweger
David R. Worton
Paul J. Brewer
The precise measurement of the amount fraction of atmospheric nitrous oxide (N2O) is required to understand global emission trends. Analysis of the site-specific stable isotopic composition of N2O provides a means to differentiate emission sources. The availability of accurate reference materials of known N2O amount fractions and isotopic composition is critical for achieving these goals. We present the development of nitrous oxide gas reference materials for underpinning measurements of atmospheric composition and isotope ratio. Uncertainties target the World Metrological Organisation Global Atmosphere Watch (WMO-GAW) compatibility goal of 0.1 nmol mol−1 and extended compatibility goal of 0.3 nmol mol−1, for atmospheric N2O measurements in an amount fraction range of 325–335 nmol mol−1. We also demonstrate the stability of amount fraction and isotope ratio of these reference materials and present a characterisation study of the cavity ring-down spectrometer used for analysis of the reference materials.
- Article
(2009 KB) - Full-text XML
- BibTeX
- EndNote


Nitrous oxide (N2O) is a greenhouse gas with a global warming potential approximately 265 times that of carbon dioxide (CO2) (Myhre et al., 2013). Atmospheric amount fractions of N2O are increasing at a rate of ∼ 0.36 % yr−1 (WMO, 2019b). Recent measurements of N2O in the unpolluted troposphere are in an amount fraction range of 325–335 nmol mol−1 (WMO, 2019a). Current amount fractions of 332 nmol mol−1 have been published by the WMO (WMO, 2020). The growing field of N2O research is focused on improving understanding of the global N2O budget. A comprehensive identification of the N2O sources and sinks and the contribution of each to the global N2O budget is required for N2O mitigation studies (Lewicka-Szczebak et al., 2014).
Anthropogenic N2O is released into the atmosphere mainly via multiple reaction pathways from soil and marine sources as a result of fertiliser use and technical emissions from industrial and combustion processes (Snider et al., 2015; Kantnerová et al., 2019; Toyoda et al., 2017). These different sources emit N2O with distinct isotopic compositions, which can be used as an isotopic signature or fingerprint for identification (Denk et al., 2017). The most abundant N2O isotopocules are 14N14N16O, 14N14N18O, 14N15N16O and 15N14N16O. The site-specific isotopomers display 15N substitution at the central, alpha (α, 14N15N16O) and the terminal beta (β, 15N14N16O) positions.
Isotopic abundances are given in the delta notation (δ) and expressed as the amount fraction ratio (x) of minor to major isotopic species in a sample (Rsample), relative to a reference value (Rreference). For δ15N, the isotope abundance scale is AIR-N2, and for δ18O it is VSMOW (Vienna Standard Mean Ocean Water) (Toyoda and Yoshida, 1999). As differences in isotopic composition between sample and reference are usually small, delta values are generally expressed in per mille (‰).
Isotopologue quantification is well established for atmospheric CO2 (Flores et al., 2017). However, quantification of N2O isotopocules proves a greater analytical challenge due to (i) substantially lower atmospheric amount fractions; (ii) analytical difficulties in the provision of position specificity of the standard technique, isotope ratio mass spectrometry (IRMS), due to difficulty in the application of correction factors to account for the re-arrangement of 15N and 14N within the ion source (Mohn et al., 2014); and (iii) the lack of internationally accepted N2O isotope reference materials with stated uncertainty (Ostrom et al., 2018).
In summary, this results in a limited compatibility of laboratory analyses for N2O isotope measurements (Mohn et al., 2014). In turn, an improvement in standardisation of the assignment of delta values, within and between laboratories, can only be achieved through calibration with accurate isotope ratio reference materials.
Atmospheric N2O has a relative abundance of 0.9903 mol mol−1 for the major isotopolocule 14N14N16O. The minor isotopocules 14N15N16O, 15N14N16O and 14N14N18O display a relative abundance of 3.64 × 10⁻³, 3.64 × 10⁻³ and 1.99 × 10⁻³ mol mol−1, respectively (Kantnerová et al., 2019). This corresponds to less than 1 nmol mol−1 for 14N14N18O in ambient amount fraction N2O reference materials. High-sensitivity instrumentation is required to precisely quantify the low amount fractions of the minor N2O isotopocules (Griffith et al., 2012).
Recent advances in spectroscopic instrumentation have improved N2O isotopolocule quantification. Cavity ring-down spectroscopy (CRDS) has been applied to the real-time amount fraction and isotopic composition measurements of N2O in ambient air. In the laboratory, this technique has demonstrated a precision (Allan deviation) of < 0.05 nmol mol−1 for N2O amount fraction and < 0.5 ‰ for δ15Nα, δ15Nβ and δ18O-N2O with 5 min averaging times (Harris et al., 2020; Erler et al., 2015). This precision is comparable with off-axis integrated cavity output spectroscopy (OA-ICOS) analysis (van der Schoot et al., 2015), which demonstrated in-field analytical precisions of < 0.07 nmol mol−1, and superior to the standard technique for N2O amount fraction, gas chromatography with electron capture detector (GC–ECD) (Lopez et al., 2015). For δ15Nα and δ15Nβ the performance of CRDS is approaching IRMS (Ostrom et al., 2018).
Advances in instrumentation must be coupled with advances in high-precision isotope ratio reference materials, particularly for the calibration of the site-specific isotopic composition δ15Nα and δ15Nβ, to achieve accurate calibration of the small variations in isotopocule abundances observable in ambient N2O (Ostrom and Ostrom, 2017). Isotope ratio reference materials are required which span the full range expected in ambient N2O samples and covered by the World Metrological Organisation (WMO) scale (260–370 nmol mol−1). The currently available pure N2O secondary reference materials USG5S1 and USG5S2 (Reston Stable Isotope Laboratory) differ in their δ15Nα and δ15Nβ values but span a narrow range of δ15N and δ18O values (< 1 ‰), limiting applicability for use as calibration materials (Ostrom et al., 2018). The availability of N2O isotope ratio reference materials has the potential to improve calibration of analytical instrumentation and increase interlaboratory agreement.
Crucial for the development of reference materials is the stability of the N2O composition and isotope ratio. Ganesan et al. (2013) reported no significant drift in amount fraction for a 325 nmol mol−1 N2O in compressed air reference material in an aluminium cylinder (Scott Marrin, now Praxair) over a 3-year period. Similar findings were reported by Lushozi et al. (2019), but no study is available yet on the stability of the N2O isotope ratio at ambient amount fractions. In addition, improvements in the preparation and availability of N2O reference materials at ambient amount fraction is required to achieve the challenging WMO-GAW compatibility goals (Brewer et al., 2019b).
We present work on the development of N2O reference materials for underpinning atmospheric composition and isotope ratio with uncertainties targeting the WMO-GAW compatibility goals. We describe the characterisation of precision, repeatability and drift of a CRDS laser spectrometer. We also present work on all elements of the preparation process such as gravimetry, purity analysis, validation, stability, passivation of storage media and matrix effects. These developments are extended to multi-component mixtures of N2O with other greenhouse gases (CO2, CH4 and CO) in a synthetic air matrix containing atmospheric amount fractions of argon, oxygen and nitrogen, as required for calibration of spectroscopic instruments for atmospheric measurements.
2.1 Gravimetric preparation of primary reference materials (PRMs)
All primary reference materials (PRMs) were prepared by gravimetry, in accordance with ISO 6142-1:2015, in 10 L aluminium cylinders (Luxfer) with a range of outlet diaphragm valves (Ceodeux): BS341 no. 14, DIN 477 no. 1 and DIN 447 no. 8. The cylinders have SGS™ internal surface (Luxfer) or were treated internally with a range of proprietary passivation processes including SpectraSeal™ (BOC), Megalong™ and Aculife IV/III™ (Air Liquide). Cylinders were evacuated using an oil-free pump (Scrollvac SC15D, Leybold Vacuum) and turbo molecular pump with magnetic bearing (Turbovac 340M, Leybold Vacuum) to a pressure of < 3 × 10⁻⁷ mbar. Synthetic air was gravimetrically produced by blending argon (BIP+, Air Products), oxygen (N6.0, BOC) and nitrogen (BIP+, Air Products) to match atmospheric amount fractions (0.94, 20.96 and 78.10 cmol mol−1, respectively) (Tohjima et al., 2009). The purity of the matrix gas was assessed for amount fraction of N2O as detailed below.
The reference materials were produced gravimetrically by the addition of N2O (5.0, Air Liquide) via a transfer vessel (capped in. diameter tube, with a nominal volume of 45 mL, Swagelok, electro-polished stainless steel). The transfer vessel was weighed against a tare vessel matched for size and shape before and after N2O addition into the evacuated cylinder (Mettler-Toledo XP2004S, ±0.3 mg weighing uncertainty). The N2O was introduced into the evacuated cylinder through expansion to vacuum. Filling via a transfer vessel was used to achieve low uncertainty on the addition of small masses. Nitrogen was added via direct addition to the cylinder, through purged in. tubing (Swagelok, electro-polished stainless steel) to produce reference materials with nominal N2O amount fractions of 500 µmol mol−1. The mass of nitrogen added was determined by weighing of the cylinder before and after addition against a tare cylinder on an automatic weighing facility, developed by the Korean Research Institute for Standards and Science (KRISS) (Mettler-Toledo XP26003L, ±3 mg weighing uncertainty) (Lim et al., 2017).
Atmospheric amount fraction reference materials in the range 300–360 nmol mol−1 N2O were prepared by the addition of 500 µmol mol−1 N2O reference materials via a transfer vessel into an evacuated 10 L cylinder and dilution with synthetic air by the direct addition of argon, oxygen and nitrogen at atmospheric amount fractions (Tohjima et al., 2009). The cylinder was weighed before and after each matrix gas addition. Argon was added to the cylinder from a 30 % argon-in-nitrogen pre-mixture cylinder.
Gravimetric uncertainties associated with the preparation of N2O reference materials were calculated according to the Guide to the Expression of Uncertainty in Measurement (BIPM et al., 2008). The gravimetric uncertainty associated with the N2O amount fraction in the prepared mixtures is determined by the software package gravcalc2 (Brown, 2009), which combines the uncertainty in relative molar mass, the uncertainty in the mass of the parent mixture addition, and the uncertainty in the amount fraction of N2O in the parent mixture according to ISO 6142 (ISO, 2015).
The total gravimetric uncertainty of the reference material combines gravimetric uncertainty from the uncertainty in mass added in each addition with uncertainty in the amount of N2O in the matrix gases. For low amount fraction reference materials, the total uncertainty can be dominated by uncertainty in accurately quantifying trace amount fractions of the compound of interest within the matrix gases. As such, a careful analysis of the trace N2O in the matrix gases is required. The amount fraction of N2O in the matrix was determined by standard addition of a 325 nmol mol−1 reference material into a synthetic air prepared with the same argon-in-nitrogen premix and the same oxygen and nitrogen cylinders. This method, as described in Hill-Pearce et al. (2018), determined 0.75 ± 0.09 nmol mol−1 N2O in the synthetic air matrix.1 The zero offset of the analyser was determined by removal of trace N2O in the matrix gas (SAES Getter/Entegris PS15 GC-50).
2.2 Preparation of reference materials for studying the influence of pressure on composition
Aluminium cylinders (0.85 L, Luxfer) were filled to 30–35 bar with a 325 nmol mol−1 N2O in synthetic air reference material. Within 1 week of filling, the cylinders were sampled at an excess flow rate of 0.5 L min−1 into the CRDS analyser (Picarro G5131-i), until the cylinders were at ambient pressure. The cylinder pressure was monitored during sampling with a pressure transducer (Omega PXM 319), and data were recorded via LabVIEW.
In a second approach, 325 nmol mol−1 N2O in synthetic air reference materials were prepared from the same 500 µmol mol−1 N2O reference material in 10 L cylinders with three different commercially available internal passivation processes. The cylinders were sampled into the CRDS analyser following the same procedure as for the 0.85 L cylinders.
2.3 Analytical methods
A cavity ring-down spectrometer (Picarro G5131-i) was used for the analysis of the ambient amount fraction N2O mixtures. The instrument allows simultaneous monitoring of N2O amount fraction and isotopic composition through measurement of the bulk δ15N, δ18O, and site-specific δ15Nα and δ15Nβ. Bulk δ15N is calculated as the average of the site-specific δ15Nα and δ15Nβ. The instrument comprises an internal pump and a critical orifice to reduce the gas flow into the cavity of the analyser. An excess flow was provided to the instrument (0.5 L min−1), and the excess was vented to the atmosphere to ensure stable (atmospheric) inlet pressure and no contamination with ambient air.
Analysis of the amount fraction of argon in the 30 % argon-in-nitrogen pre-mixture cylinders was performed by gas chromatography with a thermal conductivity detector (GC–TCD; Agilent 6890) using a capillary column (Molsieve 5A, 30 m × 0.53 mm × 0.50 µm) operated isothermally at 30 ± 1 ∘C.
3.1 Analytical uncertainty
Allan deviation
A 325 nmol mol−1 N2O-in-synthetic-air reference material was analysed continuously over 25 h, collecting temporal trends of N2O amount fractions and isotope delta values. The Allan deviation was calculated to assess the optimum averaging time and the maximum precision (Fig. 1).

Figure 1Typical Allan deviation plot for a CRDS N2O isotope analyser (G5131-i) as a function of averaging time for a 325 nmol mol−1 N2O reference material.
The Allan deviation initially decreases with an increase in the averaging time and reaches a minimum for N2O amount fractions (0.036 nmol mol−1) and delta values δ15N (0.37 ‰), δ15Nα (0.67 ‰), δ15Nβ (0.33 ‰) and δ18O (0.89 ‰) for averaging times of around 15 min. For longer averaging times, an increase in the Allan deviation is shown and likely to be a result of analyser drift. An averaging time of 10 min was adopted to ensure both minimal uncertainty for comparing the reference gas to a sample gas and efficient use of the reference material. Achieved precisions for N2O amount fraction and isotope ratios are in agreement with the typical precisions reported by Picarro in the instrument specification of < 0.05 nmol mol−1 N2O and < 0.7 ‰ for δ15N, δ15Nα, δ15Nβ and δ18O for a 10 min averaging period (Picarro, 2017).
3.2 Characterisation of the CRDS for reported delta values with N2O amount fraction
The characterisation of the CRDS for reported delta values with N2O amount fraction was assessed with both statically and dynamically generated reference materials. Dynamic reference materials were produced in the amount fraction range 150–1100 nmol mol−1 by dilution from a 320 µmol mol−1 N2O-in-synthetic-air reference material with synthetic air using a dynamic dilution device comprising one diluent and three standard critical flow orifices (Hill-Pearce et al., 2018). The static and dynamic reference materials were generated alternately for four iterations, with synthetic air measured between each set. Due to the large number of measurements recorded, a reduced sampling time of 5 min was adopted for each measurement interval, resulting in a slightly lower standard deviation of 0.03 nmol mol−1 for amount fractions.
3.3 Delta 15N
The δ15N values analysed by the G5131-i analyser were recorded for each static and dynamic reference material for four repetitions of 5 min. The mean value of the stable response was calculated. The change in reported delta value with amount fraction was assessed and found to vary with a linear function with respect to the reciprocal of N2O amount fraction as reported by Harris et al. (2020) for the same CRDS model, with a different year of manufacture. Figure 2 shows the CRDS analyser response to δ15N for static and dynamic reference materials prepared from the same pure N2O source in the amount fraction range of 300–1500 nmol mol−1. Winther et al. (2018) reported the same trend for dependence of reported δ15N on N2O amount fraction, attributing the amount fraction dependence to offsets in the measurement of 14N15N16O and 15N14N16O. The agreement between static and dynamic reference materials is discussed in the results section.
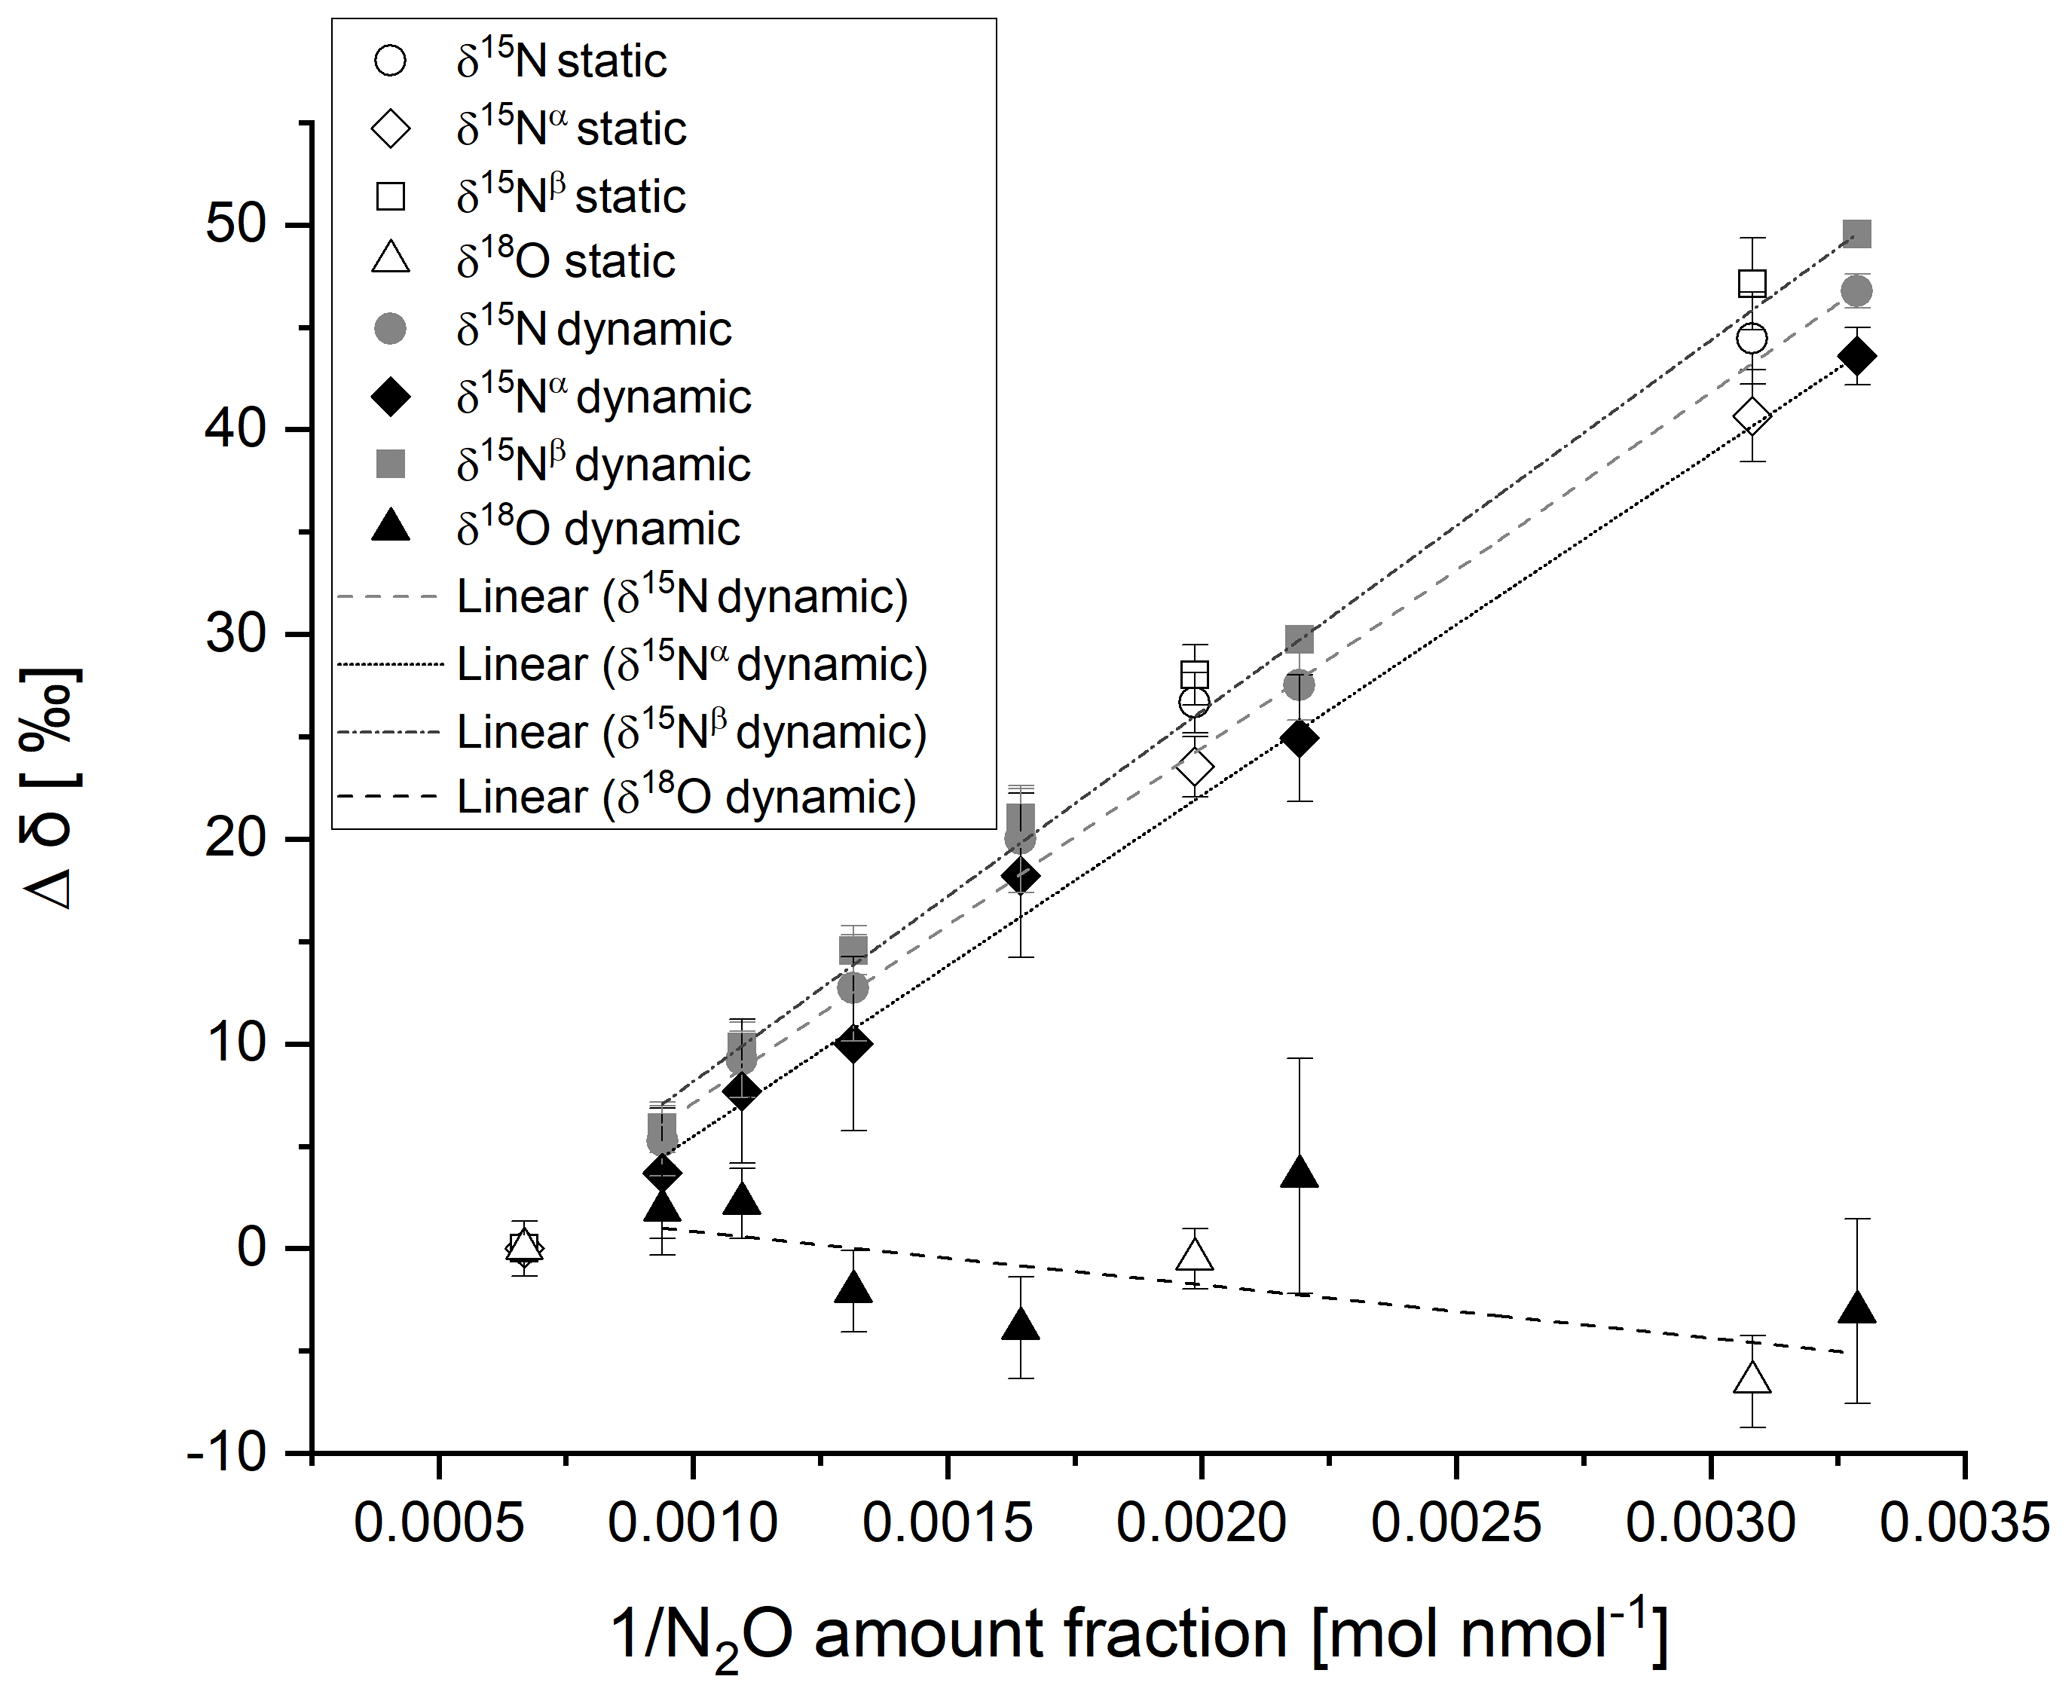
Figure 2CRDS analyser response for δ15N (circles), δ15Nα (diamonds), δ15Nβ (squares) and δ18O (triangles) with the reciprocal of N2O amount fraction for static (open data labels) and dynamic (filled data labels) reference materials in the amount fraction range of 300–1500 nmol mol−1. Error bars represent the repeatability in per mille between the four repetitions of a 5 min average. The dotted and dashed lines represent the linear regression of dynamic reference materials for each isotopocule.
3.4 Delta 18O
Similarly, the δ18O channel response was recorded for static and dynamic reference materials. No variation in reported δ18O was observed between the analyser response of the static and dynamic reference materials beyond the measurement uncertainty for N2O amount fractions over the range of 300–1500 nmol mol−1 (Fig. 2). Harris et al. (2020) reported a linear increase in δ18O of ∼ 4 ‰ with the reciprocal of N2O amount fraction over a similar N2O amount fraction range for the same model analyser (2015 model) but stated that the change in delta value with amount fraction might vary between different analysers of the same model.
The agreement in δ15N and δ18O between static and dynamic reference materials (shown in Fig. 2) indicates minimal fractionation of isotopocules on dilution through a critical flow orifice-based dynamic system or on production of the reference materials by filling though an intermediate vessel and dilution. No variation in reported delta values beyond the measurement uncertainty for N2O amount fractions over the range of 300–1500 nmol mol−1 was observed between the analyser response of the static and dynamic reference materials (Fig. 2). However, the large uncertainty makes comparisons of the delta value between similar amount fractions challenging. The uncertainty would be reduced by increasing the averaging time.
4.1 Uncertainty in N2O amount fraction
Uncertainty in the amount fraction of N2O in a reference material has several sources including uncertainty due to gravimetric preparation (weighing uncertainties), uncertainty in the purity of the gases used (e.g. amount fraction of N2O in the matrix), cylinder effects such as adsorption of the gas molecules onto the walls of the cylinder and valve, uncertainties in amount fraction due to the stability of the gas reference material, and analytical precision of the measurement technique. Each uncertainty contribution is discussed below.
4.1.1 Uncertainty and reproducibility in the amount fraction of reference materials due to gravimetric production
To assess the uncertainty in the amount fraction from production of N2O reference materials, eight reference materials were produced by two separate operators from two separate 500 µmol mol−1 N2O-in-nitrogen reference materials but the same matrix gases and pure N2O source. Four of the reference materials were produced at 337 nmol mol−1 and four were produced at 326 nmol mol−1.
The combined contribution to the uncertainty due to gravimetry and purity of the components for the ambient amount fraction N2O in synthetic air reference materials produced, as detailed above, is 0.08 % (k=2) 0.28 nmol mol−1. This uncertainty is within the WMO-GAW extended compatibility goals of ±0.3 nmol mol−1.
Table 1Sources of uncertainty and their relative contribution to the combined expanded uncertainty (k=2) for the preparation of a 325 nmol mol−1 N2O-in-synthetic-air reference material.
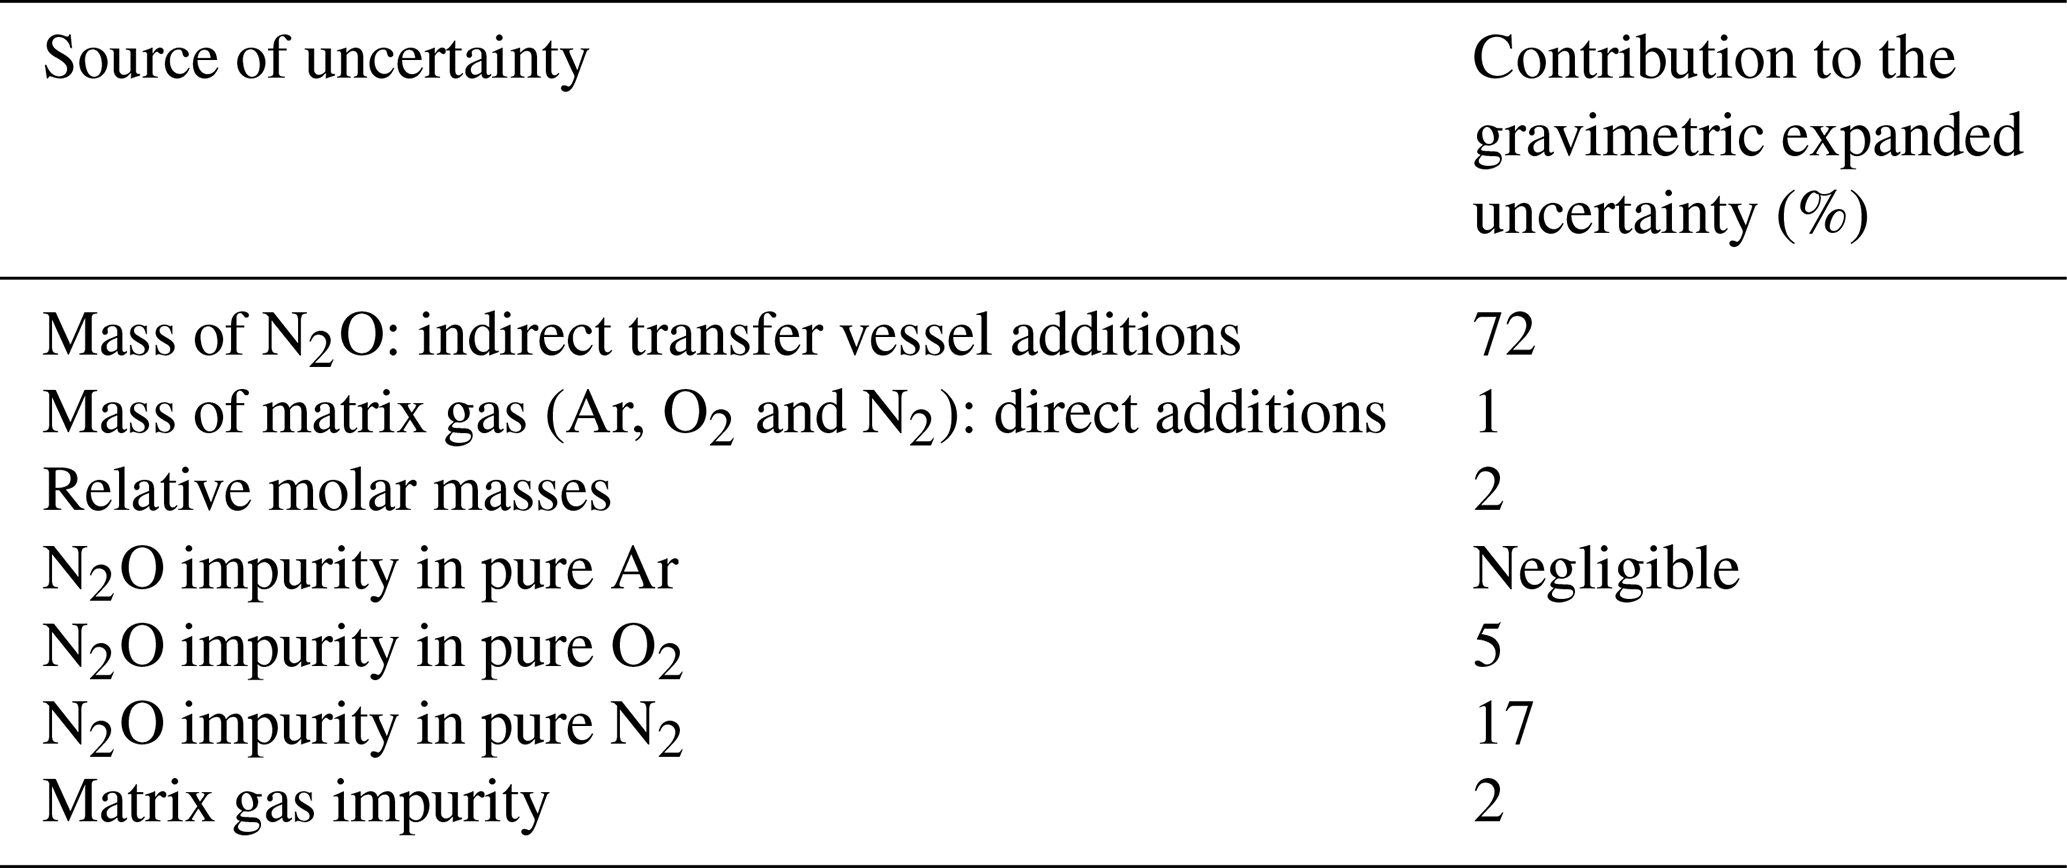
The sources of uncertainty and their contribution to the combined gravimetric uncertainty (k=2) are detailed in Table 1. The uncertainty is dominated by the 0.3 mg uncertainty on the mass of N2O added in the indirect transfer vessel additions to prepare the 500 µmol mol−1 N2O intermediate and 325 nmol mol−1 reference material.
4.1.2 Uncertainty in the amount fraction of reference materials for validation measurements
The amount fraction of N2O in a prepared mixture was validated through comparison to National Physical Laboratory (NPL) in-house PRMs. The PRMs used for validation were derived from different parent mixtures which are, where possible, produced by different operators in order to provide a greater degree of independence from errors in amount fraction of a parent mixture. In-house PRMs and unknown mixtures were measured alternately for 10 min periods. To determine the certified amount fraction of the unknown mixture (Y), the gravimetric amount fraction of the in-house PRM (X1) is multiplied by the mean ratio in analyser response (X2), as shown in Eq. 3. Four repetitions provide four distinct measurements of this ratio.
Input quantities (X1,X2) have associated uncertainties that are combined to give a combined standard uncertainty for the measurement of N2O amount fraction derived from each validation. The standard uncertainty associated with the gravimetric amount fraction u(x1) is provided by the software Gravcalc2 (Brown, 2009). The standard uncertainty in the ratio measurement u(x2) is the standard deviation of the mean of the four ratios. Both input quantities were modelled with normal distributions, and sensitivity coefficients (c1,c2) were taken as the partial derivatives with respect to each input quantity.
Standard uncertainties were multiplied by respective sensitivity coefficients and combined in quadrature to provide a combined standard uncertainty for each validation. To combine the standard uncertainty from each validation, a sensitivity coefficient was applied to each, providing equal weighting to the final analytical uncertainty.
Expanded analytical uncertainties of 0.07 % (k=2) were demonstrated using this approach. The final combined expanded uncertainty contains the contributions from gravimetric and analytical uncertainty. The combined expanded uncertainty of ambient amount fraction N2O reference materials is calculated to be 0.11 % (k=2) or 0.36 nmol mol−1.
4.1.3 Reproducibility of reference gas production
The WMO-GAW has published an amount fraction range of 325–335 nmol mol−1 representative of the unpolluted troposphere, while the range of N2O amount fractions covered by the WMO scale is somewhat broader (260–370 nmol mol−1). The linearity of the CRDS analyser response to changes in amount fraction and the influence of amount fraction on apparent isotope delta values were investigated in the amount fraction range 320 to 360 nmol mol−1 using a set of gravimetric prepared reference materials. The lower boundary for amount fraction was defined by the CRDS analyser (Picarro G5131-i) N2O amount fraction range for measurement of delta values.
The gravimetrically prepared reference materials were validated against a reference material prepared at 325 nmol mol−1. Figure 3 shows the residual of the linear regression of the certified amount fraction as a function of the gravimetric amount fraction for each reference material. The deviation from the linear regression does not show any obvious trend with gravimetric amount fraction and falls within the extended WMO-GAW compatibility goal for all reference materials of ±0.3 nmol mol−1, demonstrating the suitability and linearity of the CRDS analytical technique for certifying N2O reference materials in this range and the reproducibility of the reference materials produced.
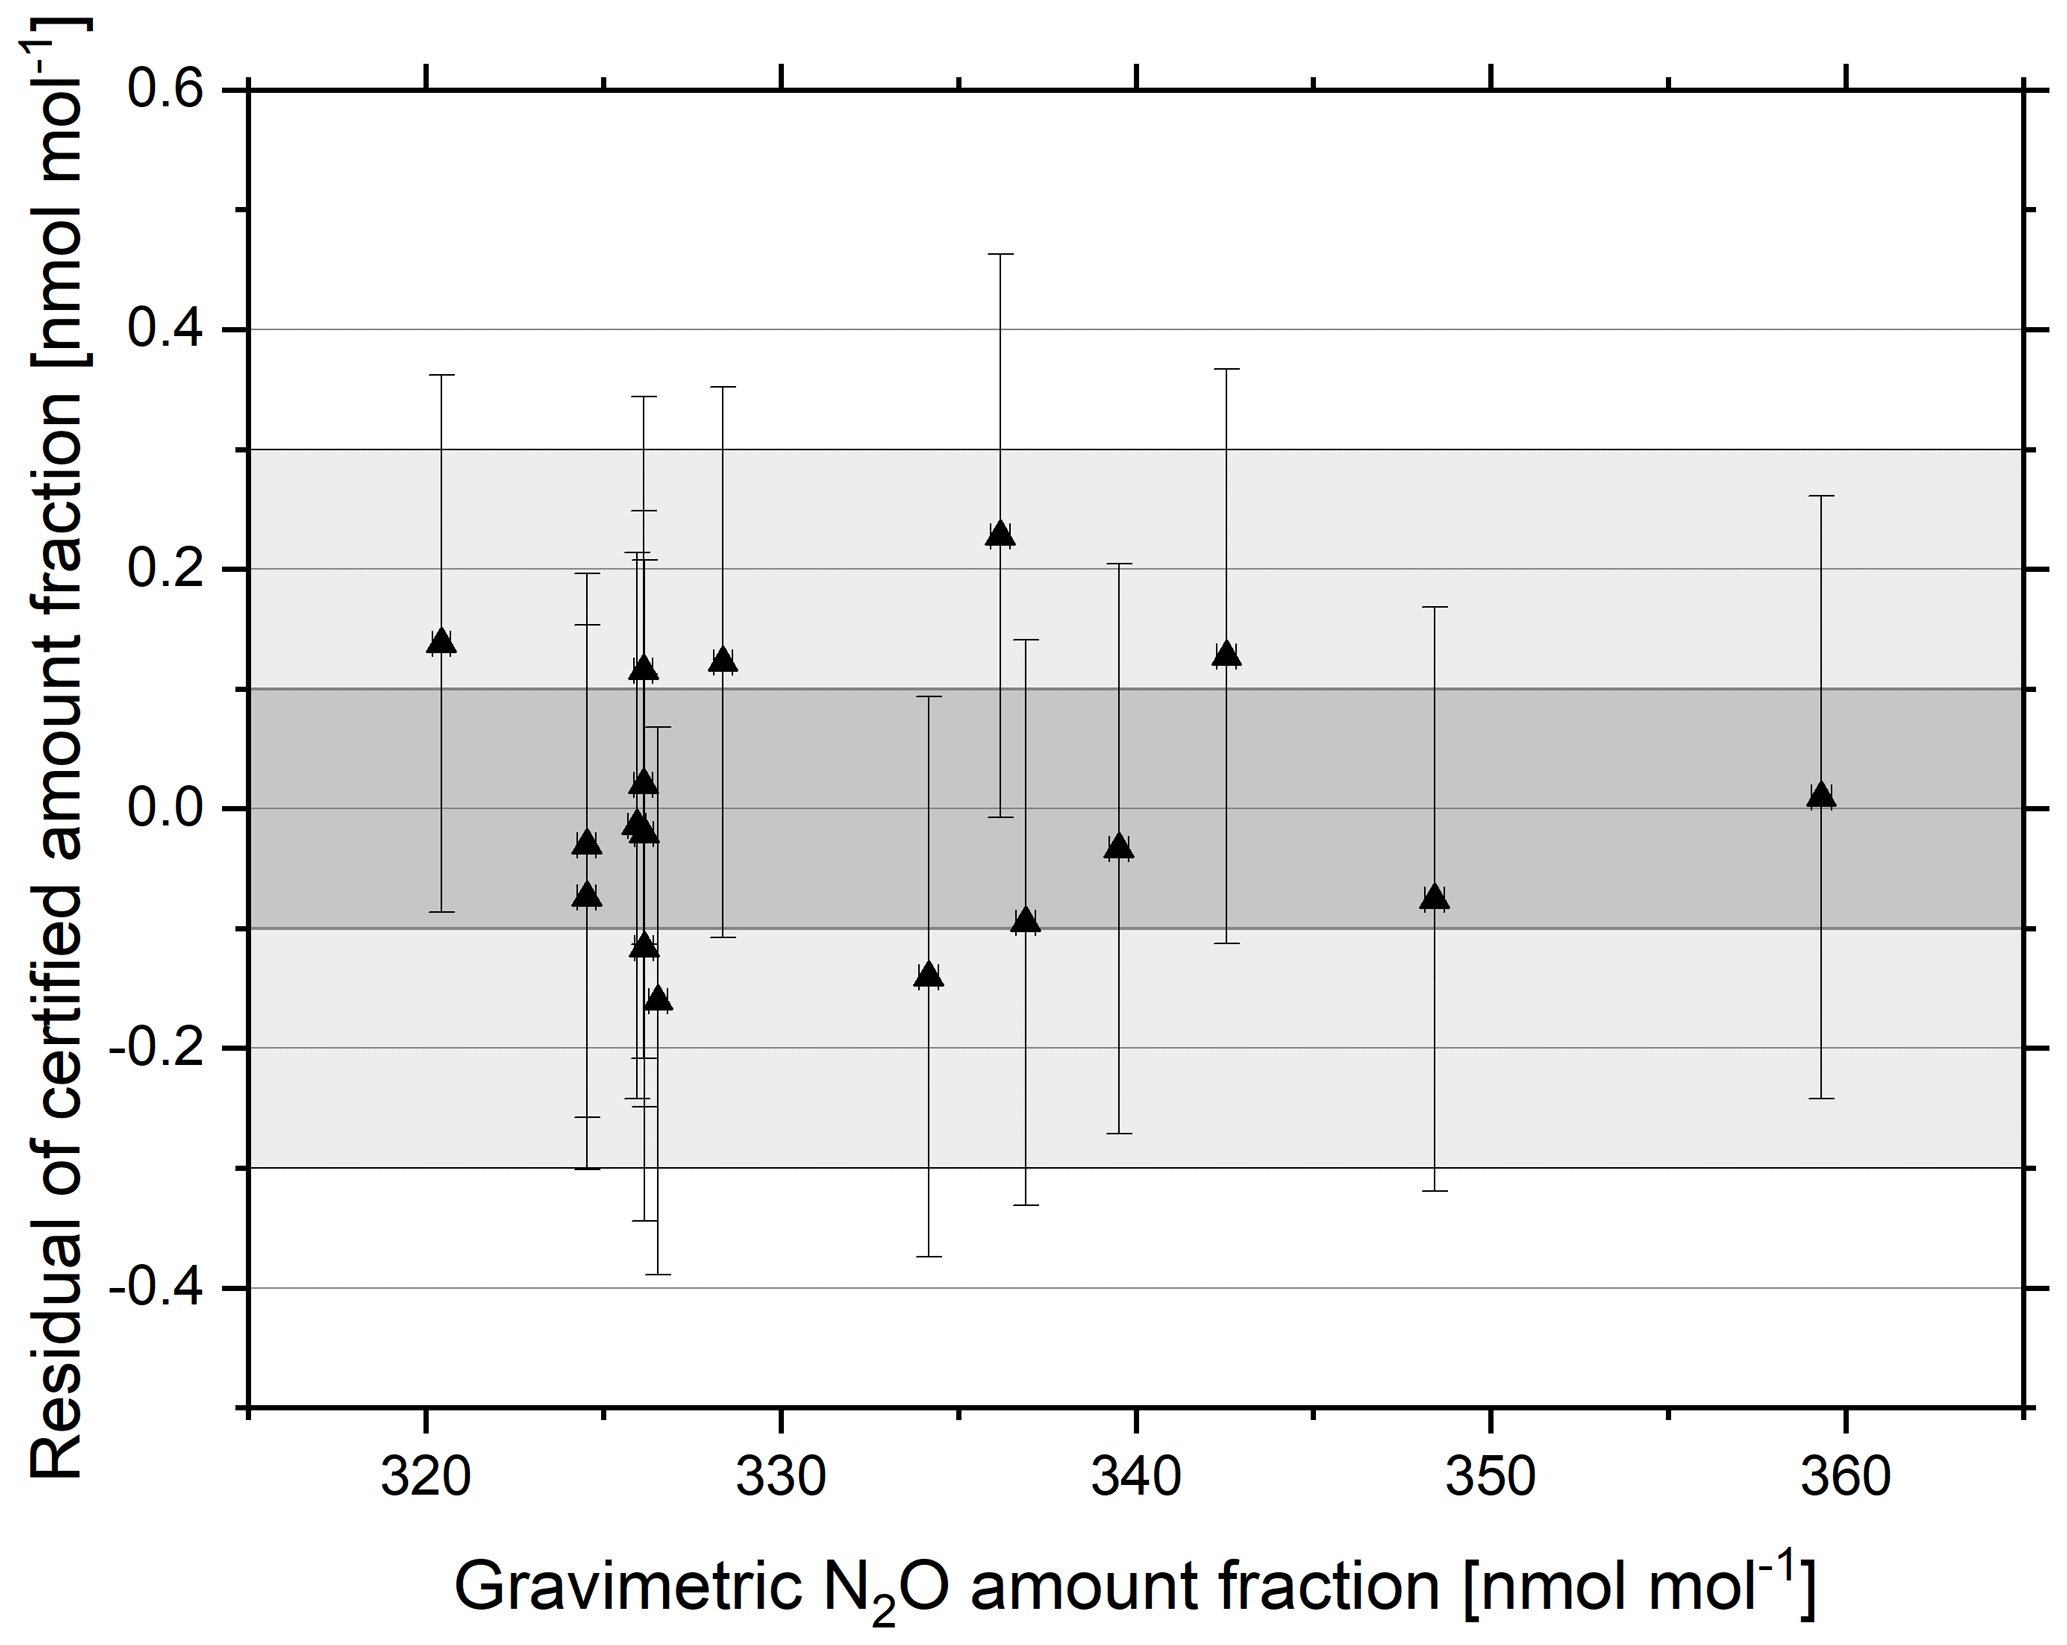
Figure 3Residuals of the linear regression of the certified amount fraction as a function of the gravimetric amount fraction for N2O reference materials in the amount fraction range 320–360 nmol mol−1 certified against a 325 nmol mol−1 reference material. The WMO-GAW Data Quality Objective (DQO) (±0.1 nmol mol−1) is indicated within the dark grey shading, and the extended DQO (±0.3 nmol mol−1) is indicated within the lighter grey shading. Error bars represent the combined (k=2) analytical (y axis) and gravimetric (x axis, not visible) uncertainty.
4.2 Stability of N2O reference materials for amount fraction and isotopic composition
The demonstration of stability is important to achieve measurements of amount fraction and isotope ratio in the field with low uncertainty and also safeguards against drift in measurements as a result of changes in the reference material. The effect of storage of reference materials of N2O in synthetic air, with and without other greenhouse gas components in cylinders with different surface treatments, was investigated.
4.2.1 Stability of reference materials for extended storage times
The stability of a 325 nmol mol−1 N2O-in-synthetic-air reference material was assessed over a 3-year period by comparison with freshly prepared binary reference materials comprising N2O in synthetic air prepared in the amount fraction range 300–360 nmol mol−1 and reference materials containing N2O in synthetic air and trace gases CO2 (290–800 µmol mol−1), CH4 (1.8–3.0 µmol mol−1) and CO (0.07–1.00 µmol mol−1) (Fig. 4). All validations within this period demonstrated agreement of amount fraction within the extended WMO compatibility goal of ±0.3 nmol mol−1 and thus demonstrate the stability of the 325 nmol mol−1 N2O reference material. The linearity of response of the CRDS in this amount fraction range is detailed above. No clear distinction between agreement of validation of N2O in synthetic air and N2O within multi-component gas mixtures was observed, suggesting minimal interference of these gases on the CRDS analyser response to the total reported amount fraction of N2O. The findings show agreement with those of Erler et al. (2015) and Harris et al. (2020) where no significant effect of CH4, CO or CO2 at atmospheric amount fraction was found on the reported N2O amount fraction. In contrast, the authors reported a strong effect of O2 amount fractions on apparent N2O amount fraction, which they attribute to changes in the pressure broadening. Similar effects on the CO2 and CH4 reported amount fractions with changing matrix composition when using CRDS have been observed earlier by Nara et al. (2012).
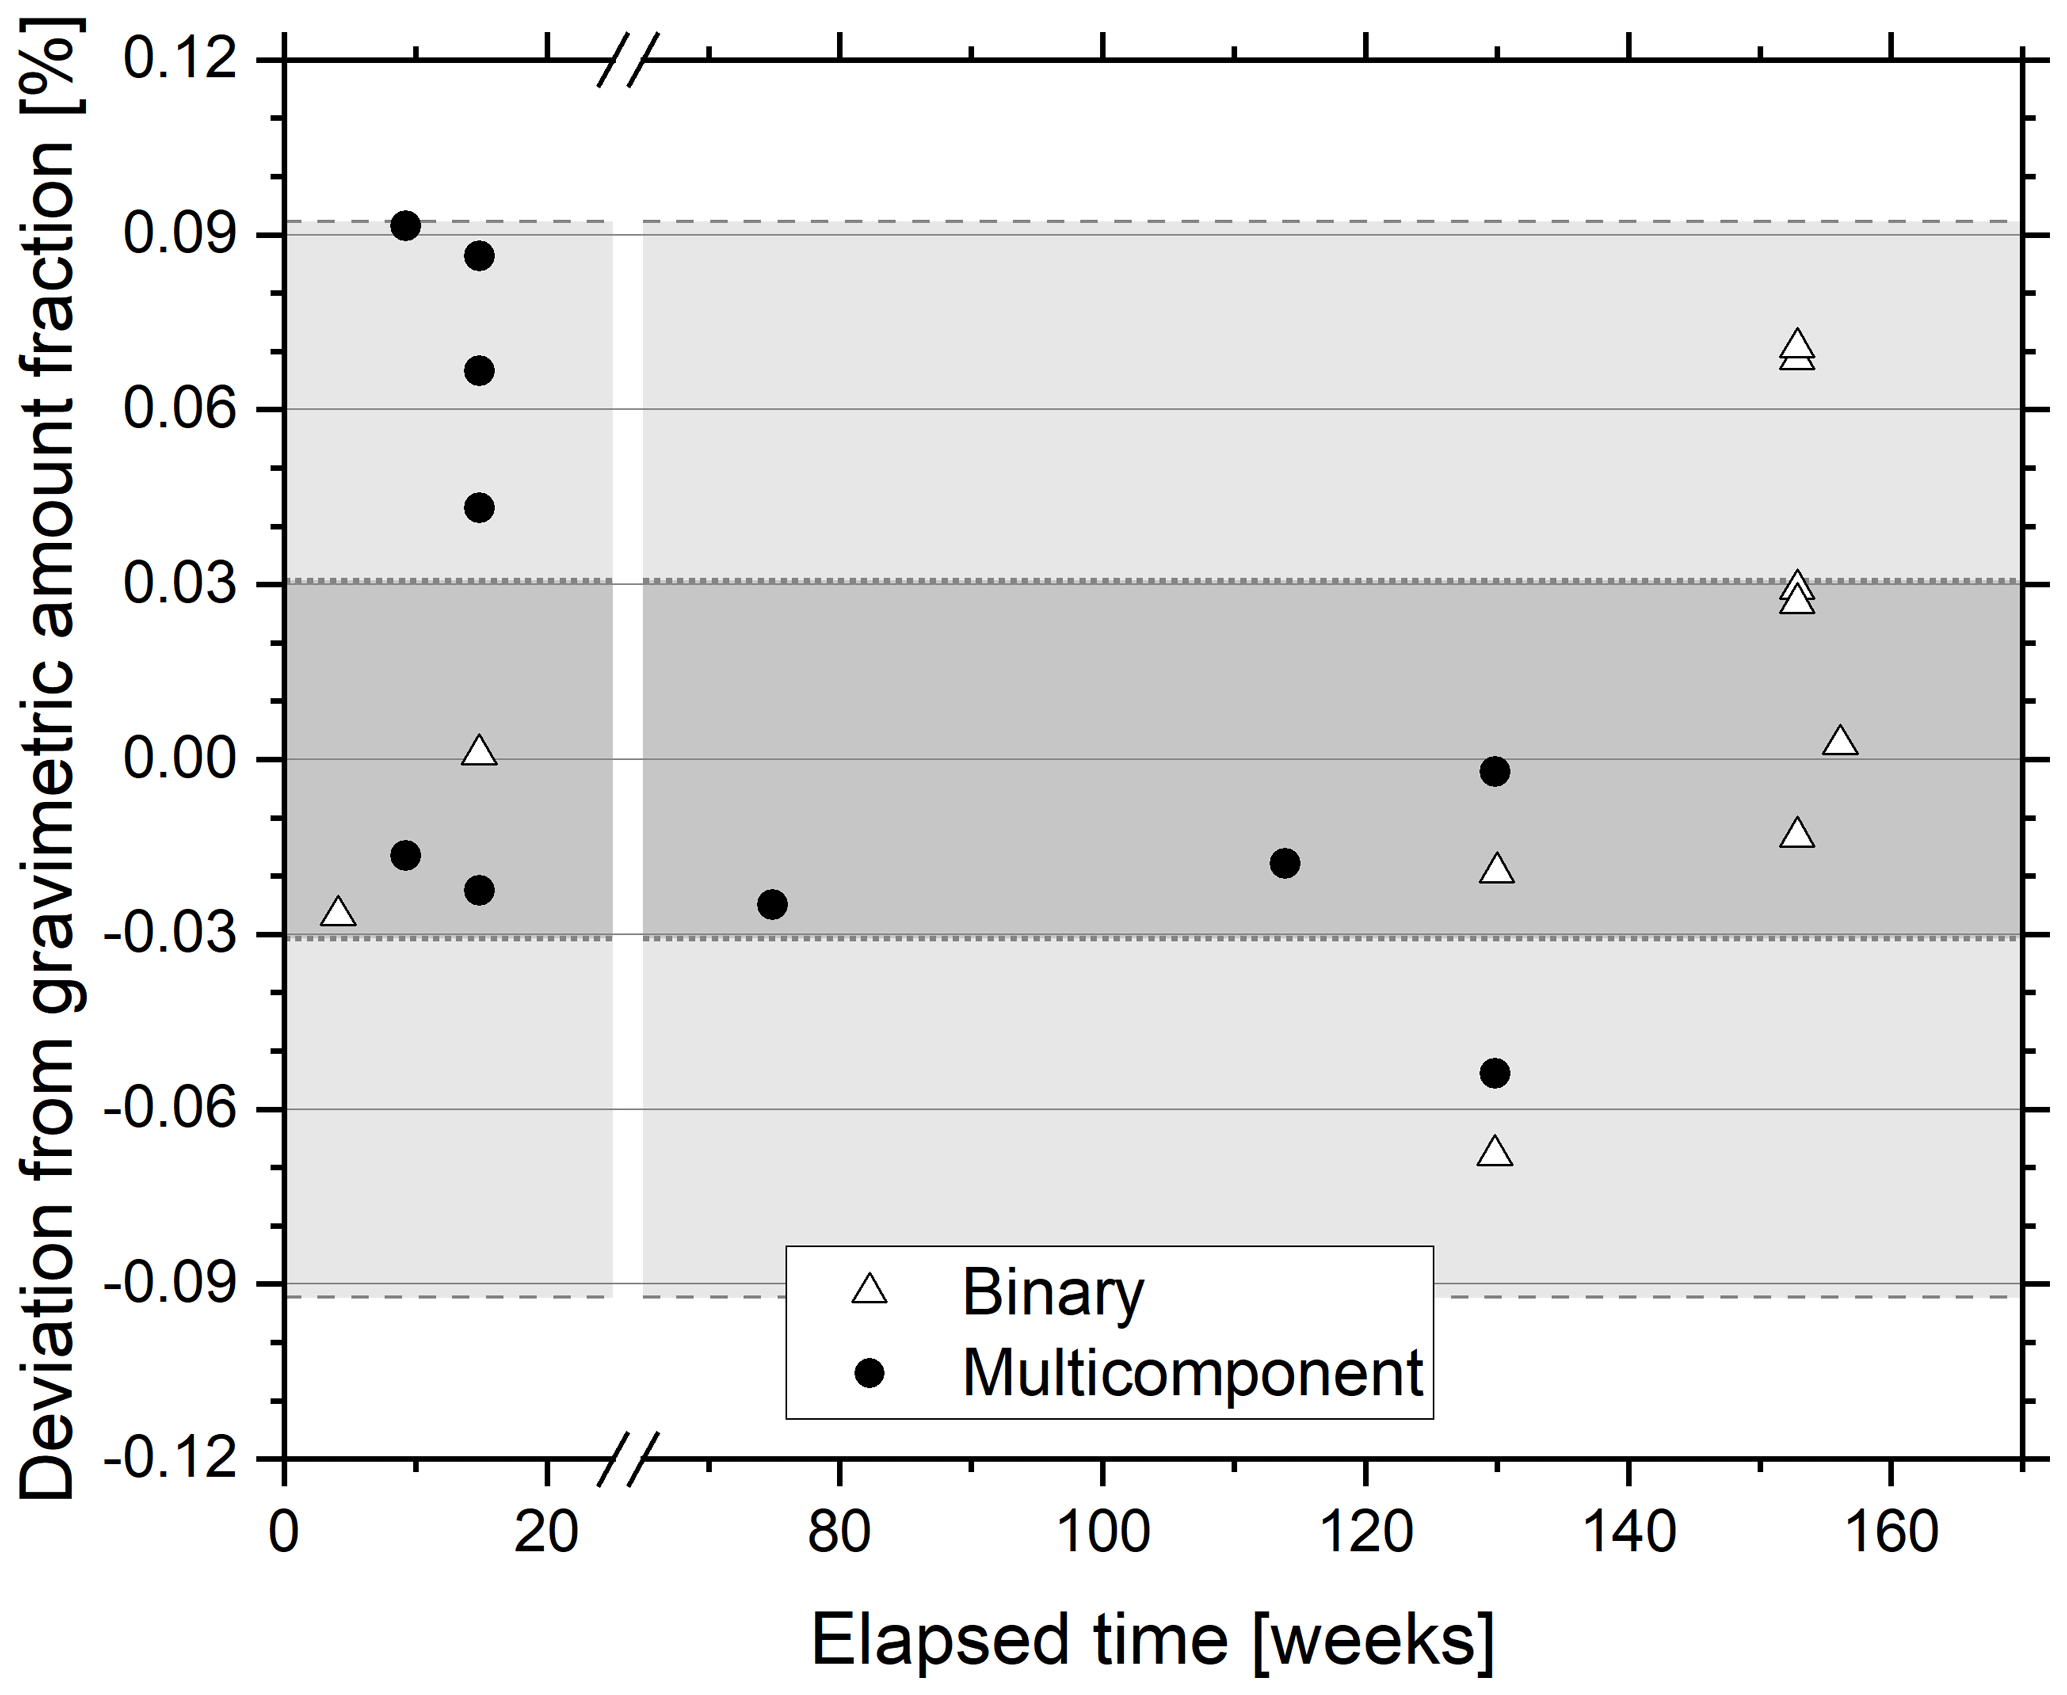
Figure 4Percentage difference between gravimetric and certified N2O amount fraction of a 325 nmol mol−1 reference material as a function of storage time. The reference material was certified against freshly prepared N2O reference materials in the amount fraction range 320–360 nmol mol−1. The freshly prepared reference materials were either diluted in synthetic air (open triangle) or contained other greenhouse gases (filled circle). The WMO-GAW compatibility goal is indicated on the plot in dark grey shading, and the extended compatibility goal is indicated by lighter grey shading.
4.2.2 Stability of reference materials with reducing cylinder pressure
Figure 5 shows 5 min averages for amount fraction, δ15Nα, δ15Nβ and δ18O with reducing pressure. No statistically relevant trend for N2O amount fraction or delta value was observed as the cylinder pressure decreases. The experiment was conducted over 1.5 h. During venting of the cylinder through the analyser, a small excess flow rate of between 0.3 and 0.5 L min−1 was maintained to optimise the pressure through the analyser, reduce back diffusion into the analyser and ensure thermodynamic effects do not occur. A drift correction was conducted on the N2O amount fraction and isotope delta values through subtraction of analyser response against a linear regression of the N2O parent cylinder analysed immediately before and after each of the 0.85 L cylinders. There is good agreement within the standard deviation of the 5 min responses between the amount fraction and delta values of the four cylinders and the parent cylinder. The data indicate that adsorption onto cylinder walls causes negligible changes in amount fraction and delta value with pressure. The findings show agreement with Lushozi et al. (2019) and Brewer et al. (2019b) where no adsorption losses were identified in cylinder-to-cylinder transfer of a 330 nmol mol−1 reference material.
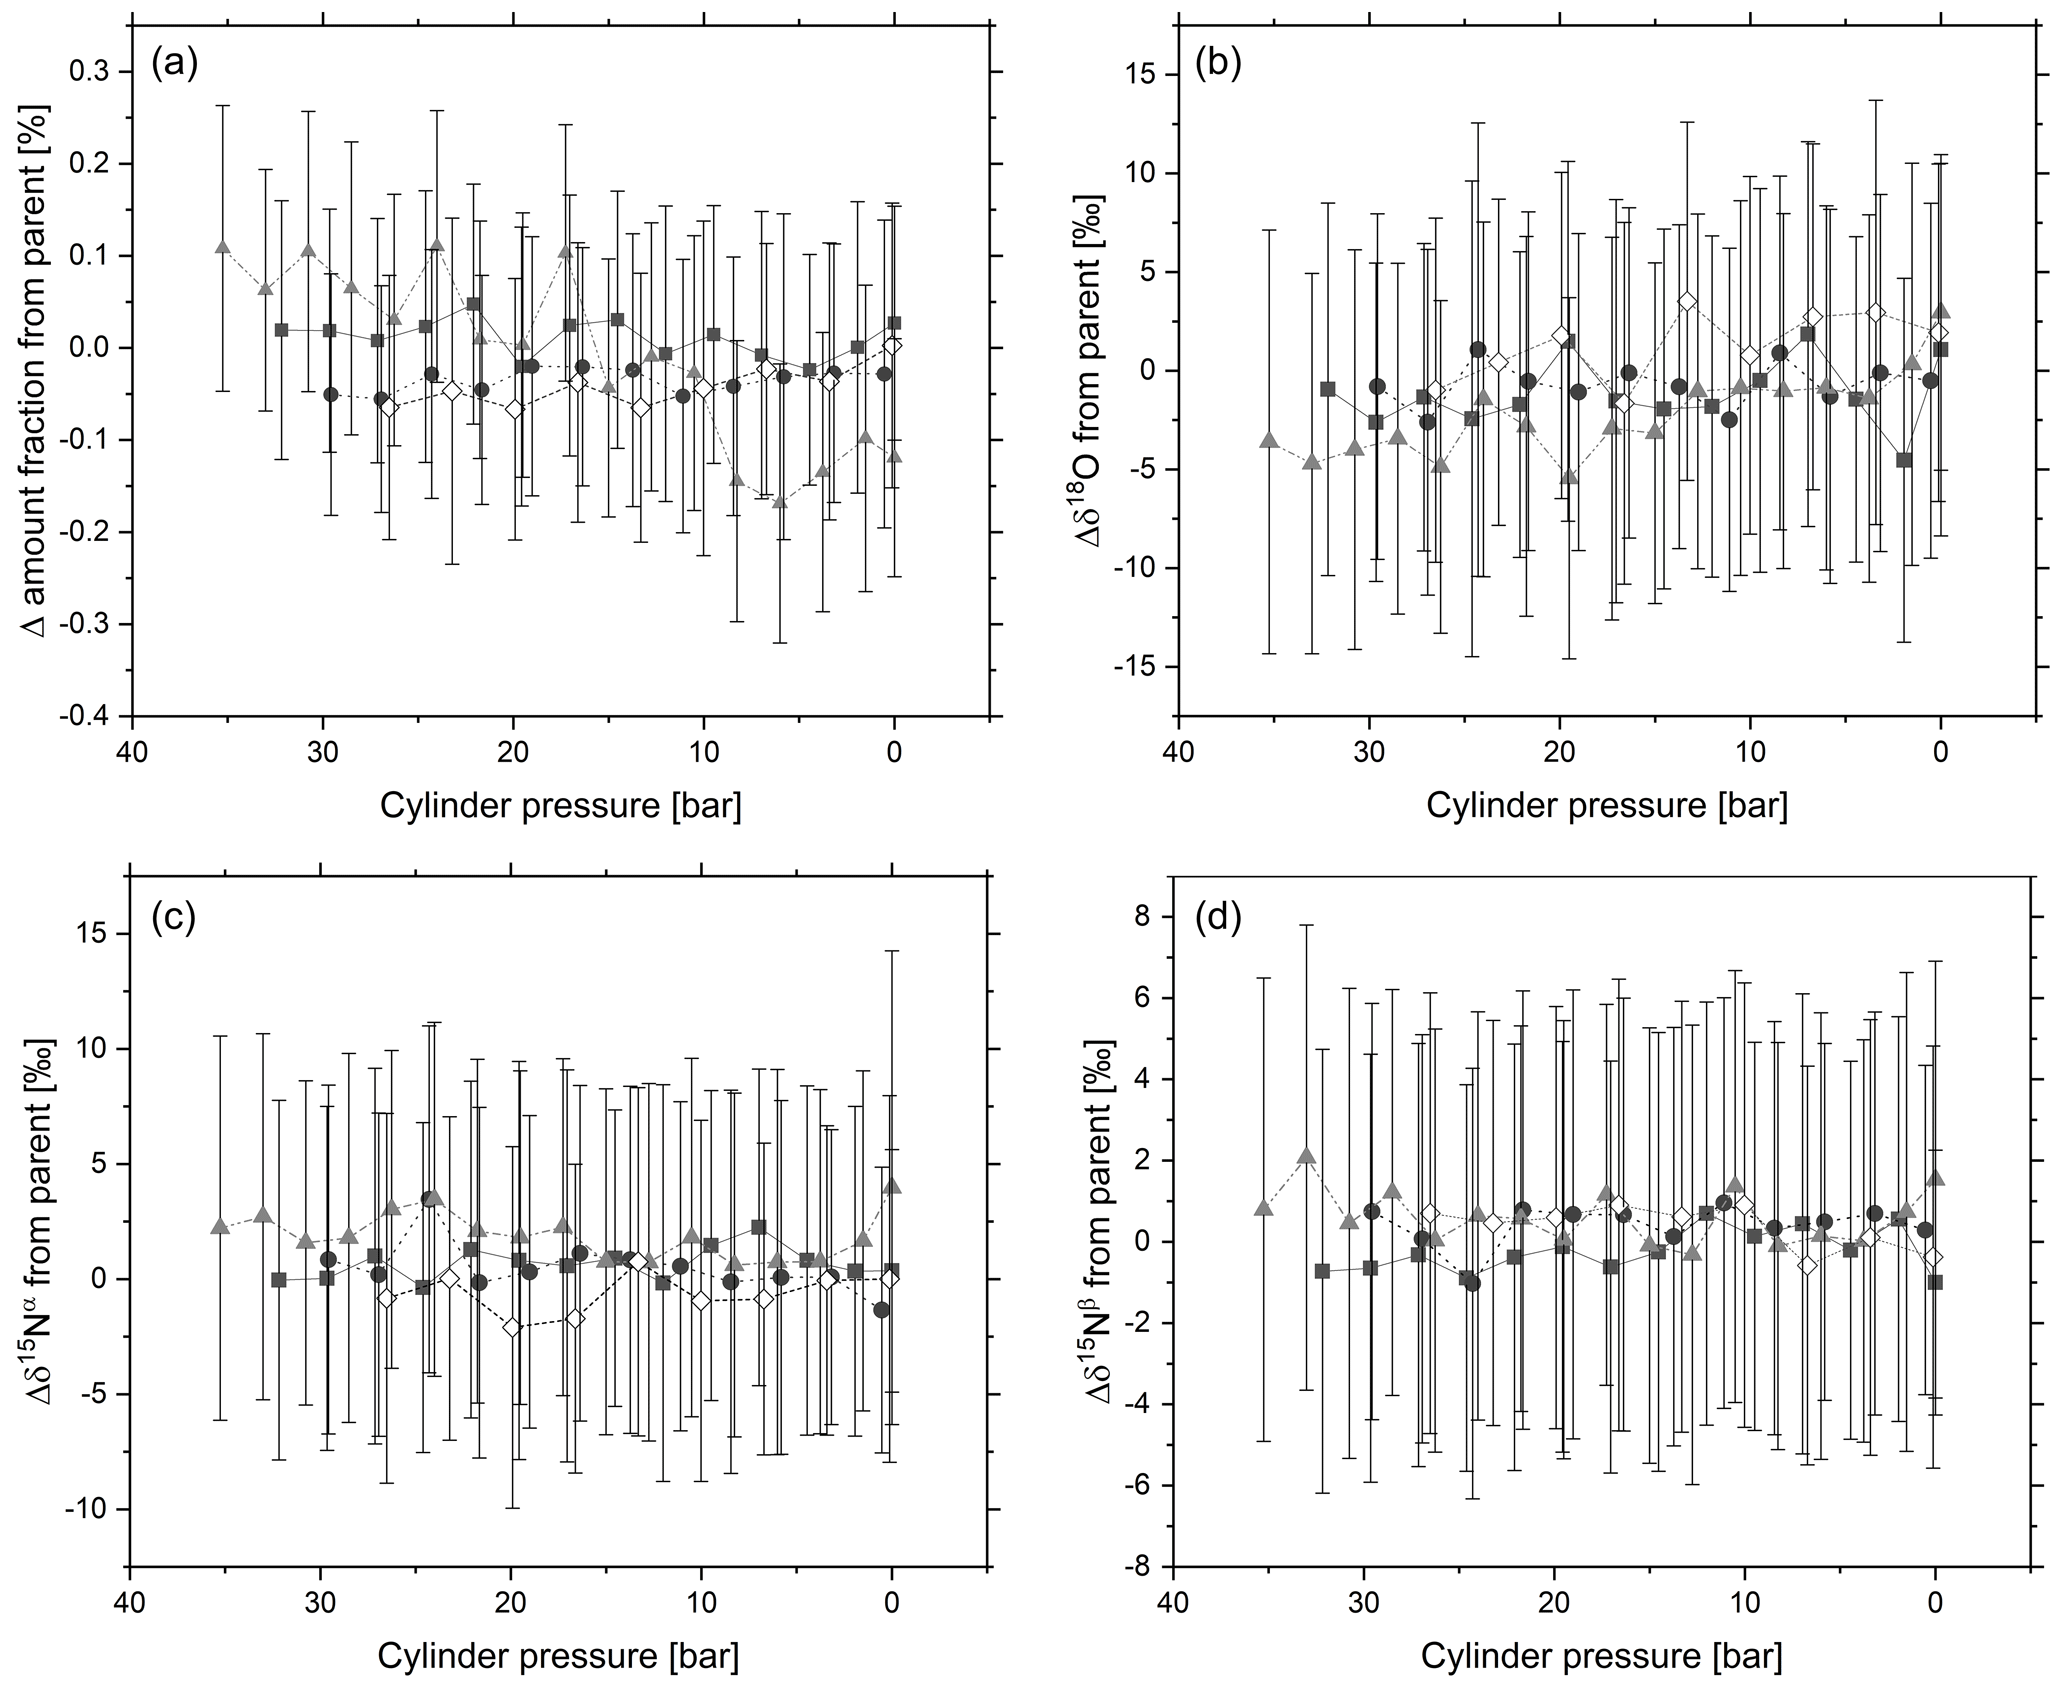
Figure 5Temporal change in (a) N2O amount fraction and delta values: (b) δ18O, (c) δ15Nα and (d) δ15Nβ in response to changes in cylinder pressure of four 0.85 L aluminium cylinders. Each data point represents a 5 min average of analyser response, and error bars represent 1 standard deviation across the 5 min average.
4.2.3 Cylinder treatments for enhanced stability with pressure
Greenhouse gas reference materials are prepared at NPL in passivated cylinders to inhibit the adsorption of target components. While adsorption of N2O is not expected to be as large as adsorption of CO2 (Brewer et al., 2019a), it is nevertheless of interest to investigate the effects of cylinder passivation.
Figure 6 shows the 5 min average of the response of N2O amount fraction with pressure relative to initial amount fraction for the three cylinders with different passivation processes. There is no difference in the reported N2O amount fraction between the three passivation processes, with all stable to within 0.05 nmol mol−1. The data demonstrate that the internal passivation process causes negligible changes to the N2O analyser response for amount fraction with changes in cylinder pressure. The water vapour content of similar mixtures in synthetic air was measured to be around 0.5 µmol mol−1 (Hill-Pearce et al., 2018).
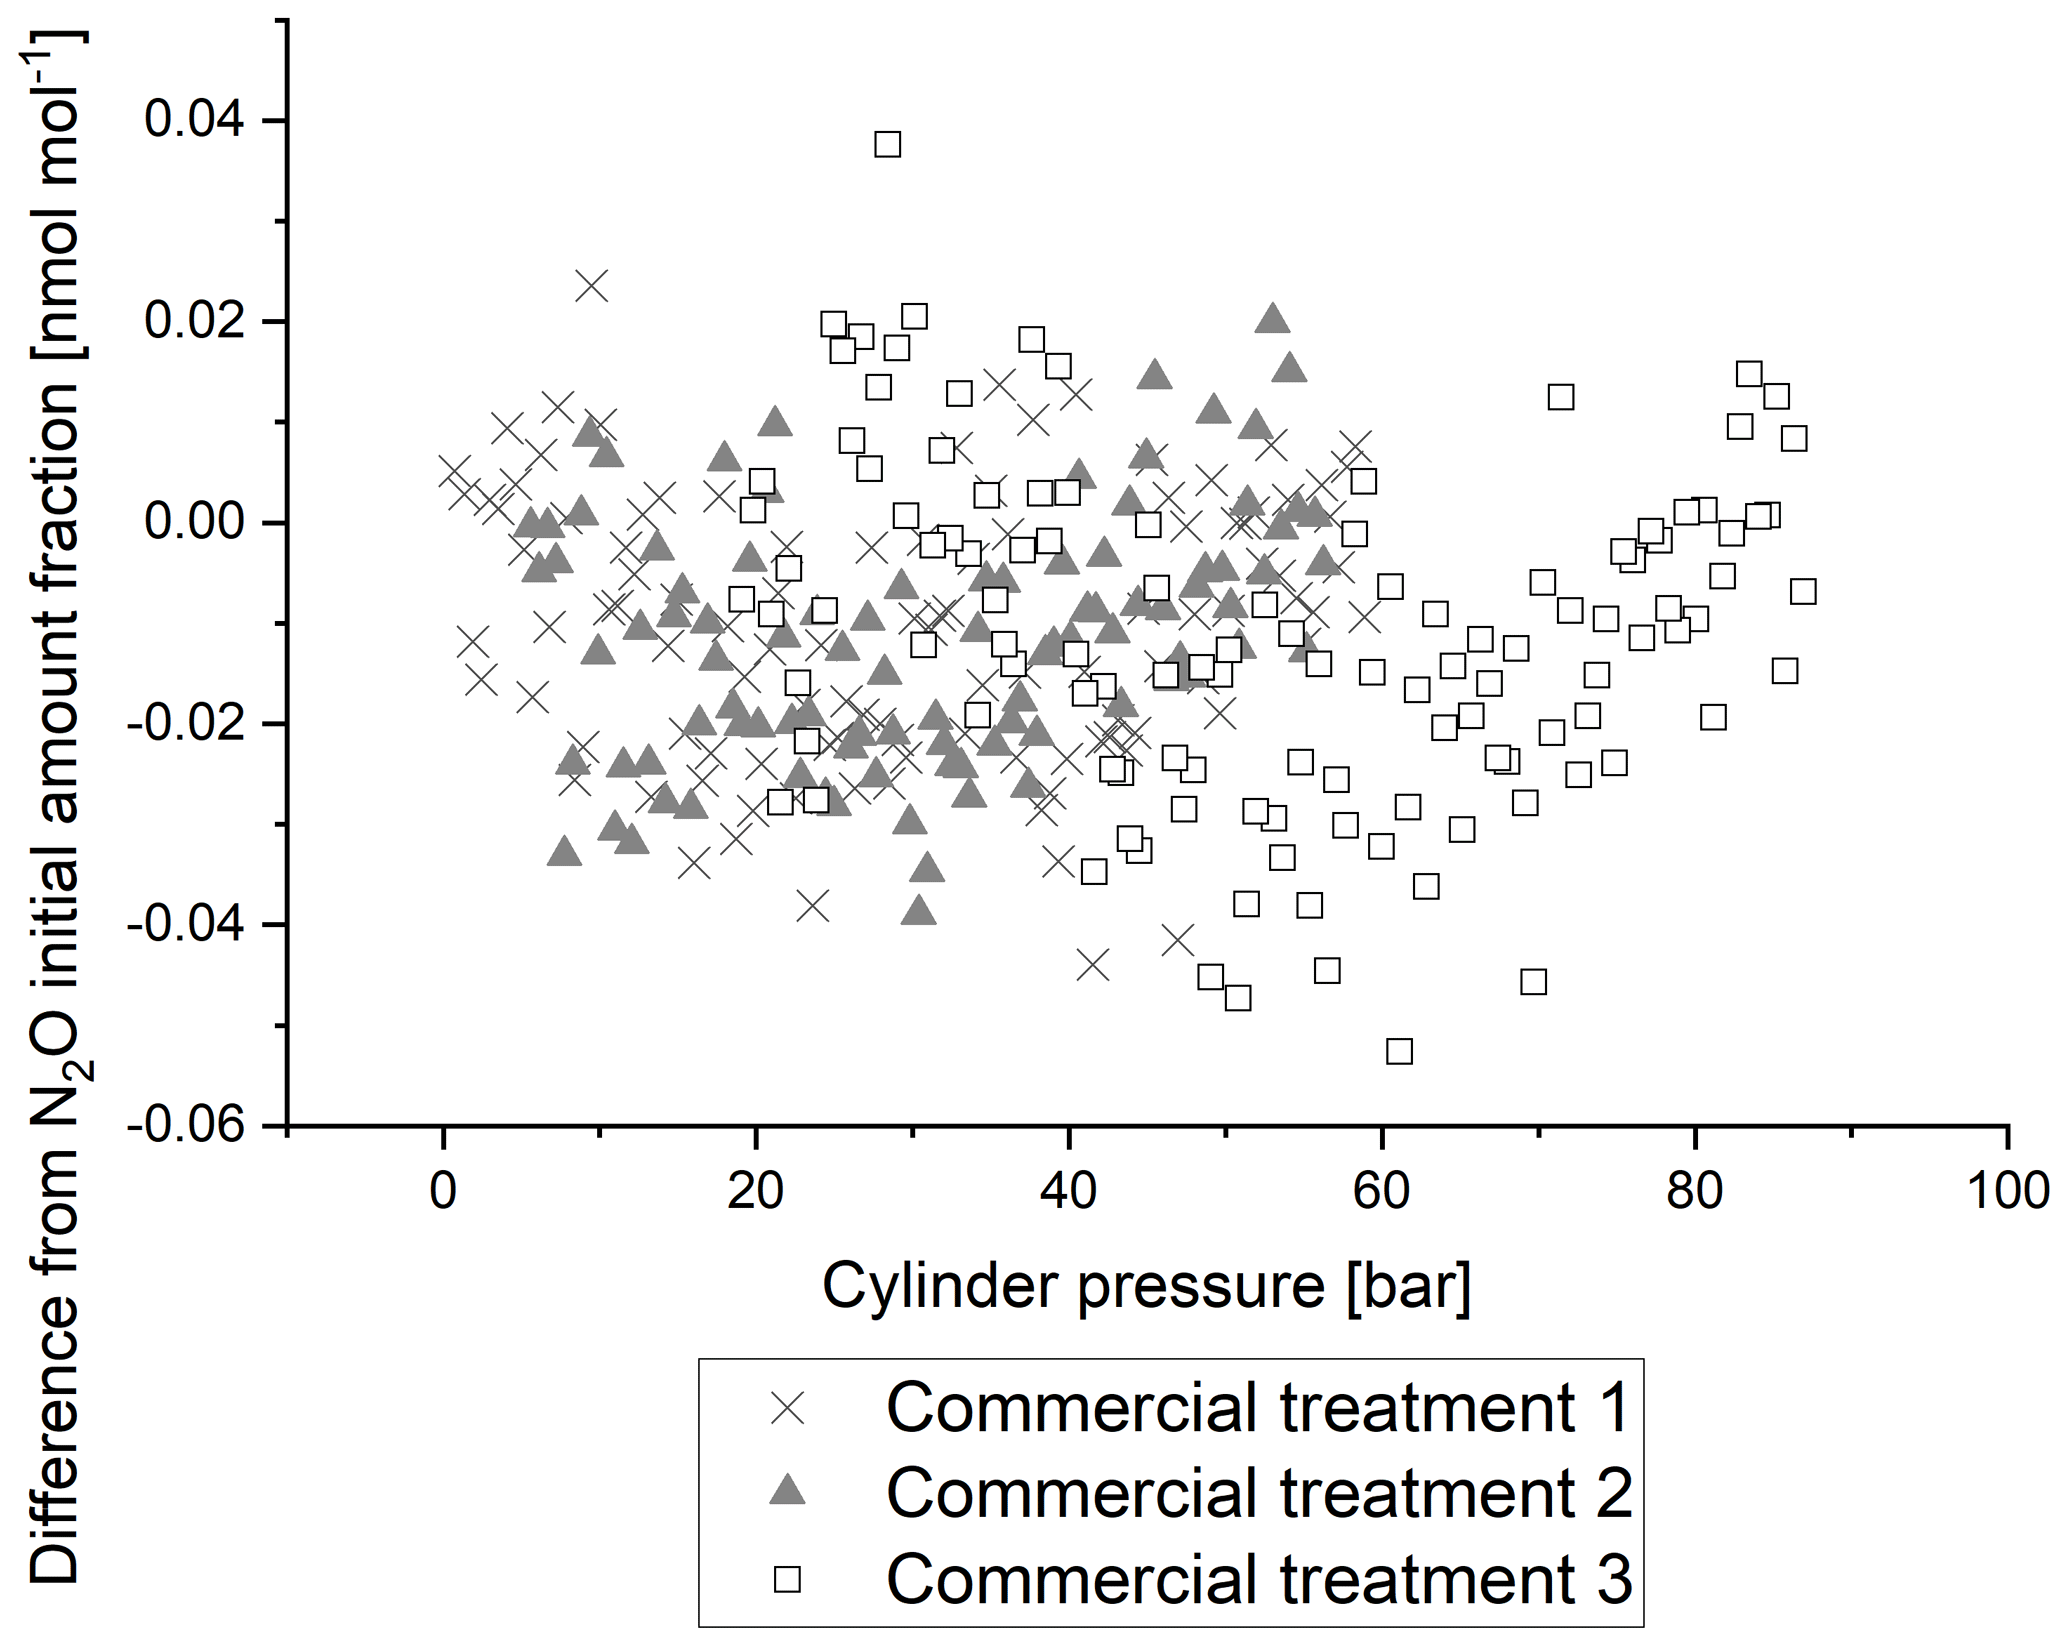
Figure 6Difference from initial N2O amount fraction with reducing cylinder pressure for three 325 nmol mol−1 N2O-in-synthetic-air reference materials produced in 10 L cylinders with three different commercially available cylinder passivation processes.
4.3 Absence of fractionation effects for static mixture production
The effects of the production and storage of ambient amount fraction N2O in synthetic air reference materials in cylinders on the reported amount fraction and delta value were compared to reported values for dynamic reference materials produced from the same pure N2O source diluted with synthetic air (Fig. 7). Dynamic reference materials demonstrate reduced adsorption effects compared to static standards, particularly for low-amount-fraction reference materials (Platonov et al., 2018). Differences in reported delta value for static and dynamic standards of the same amount fraction would indicate fractionation events in either production method.
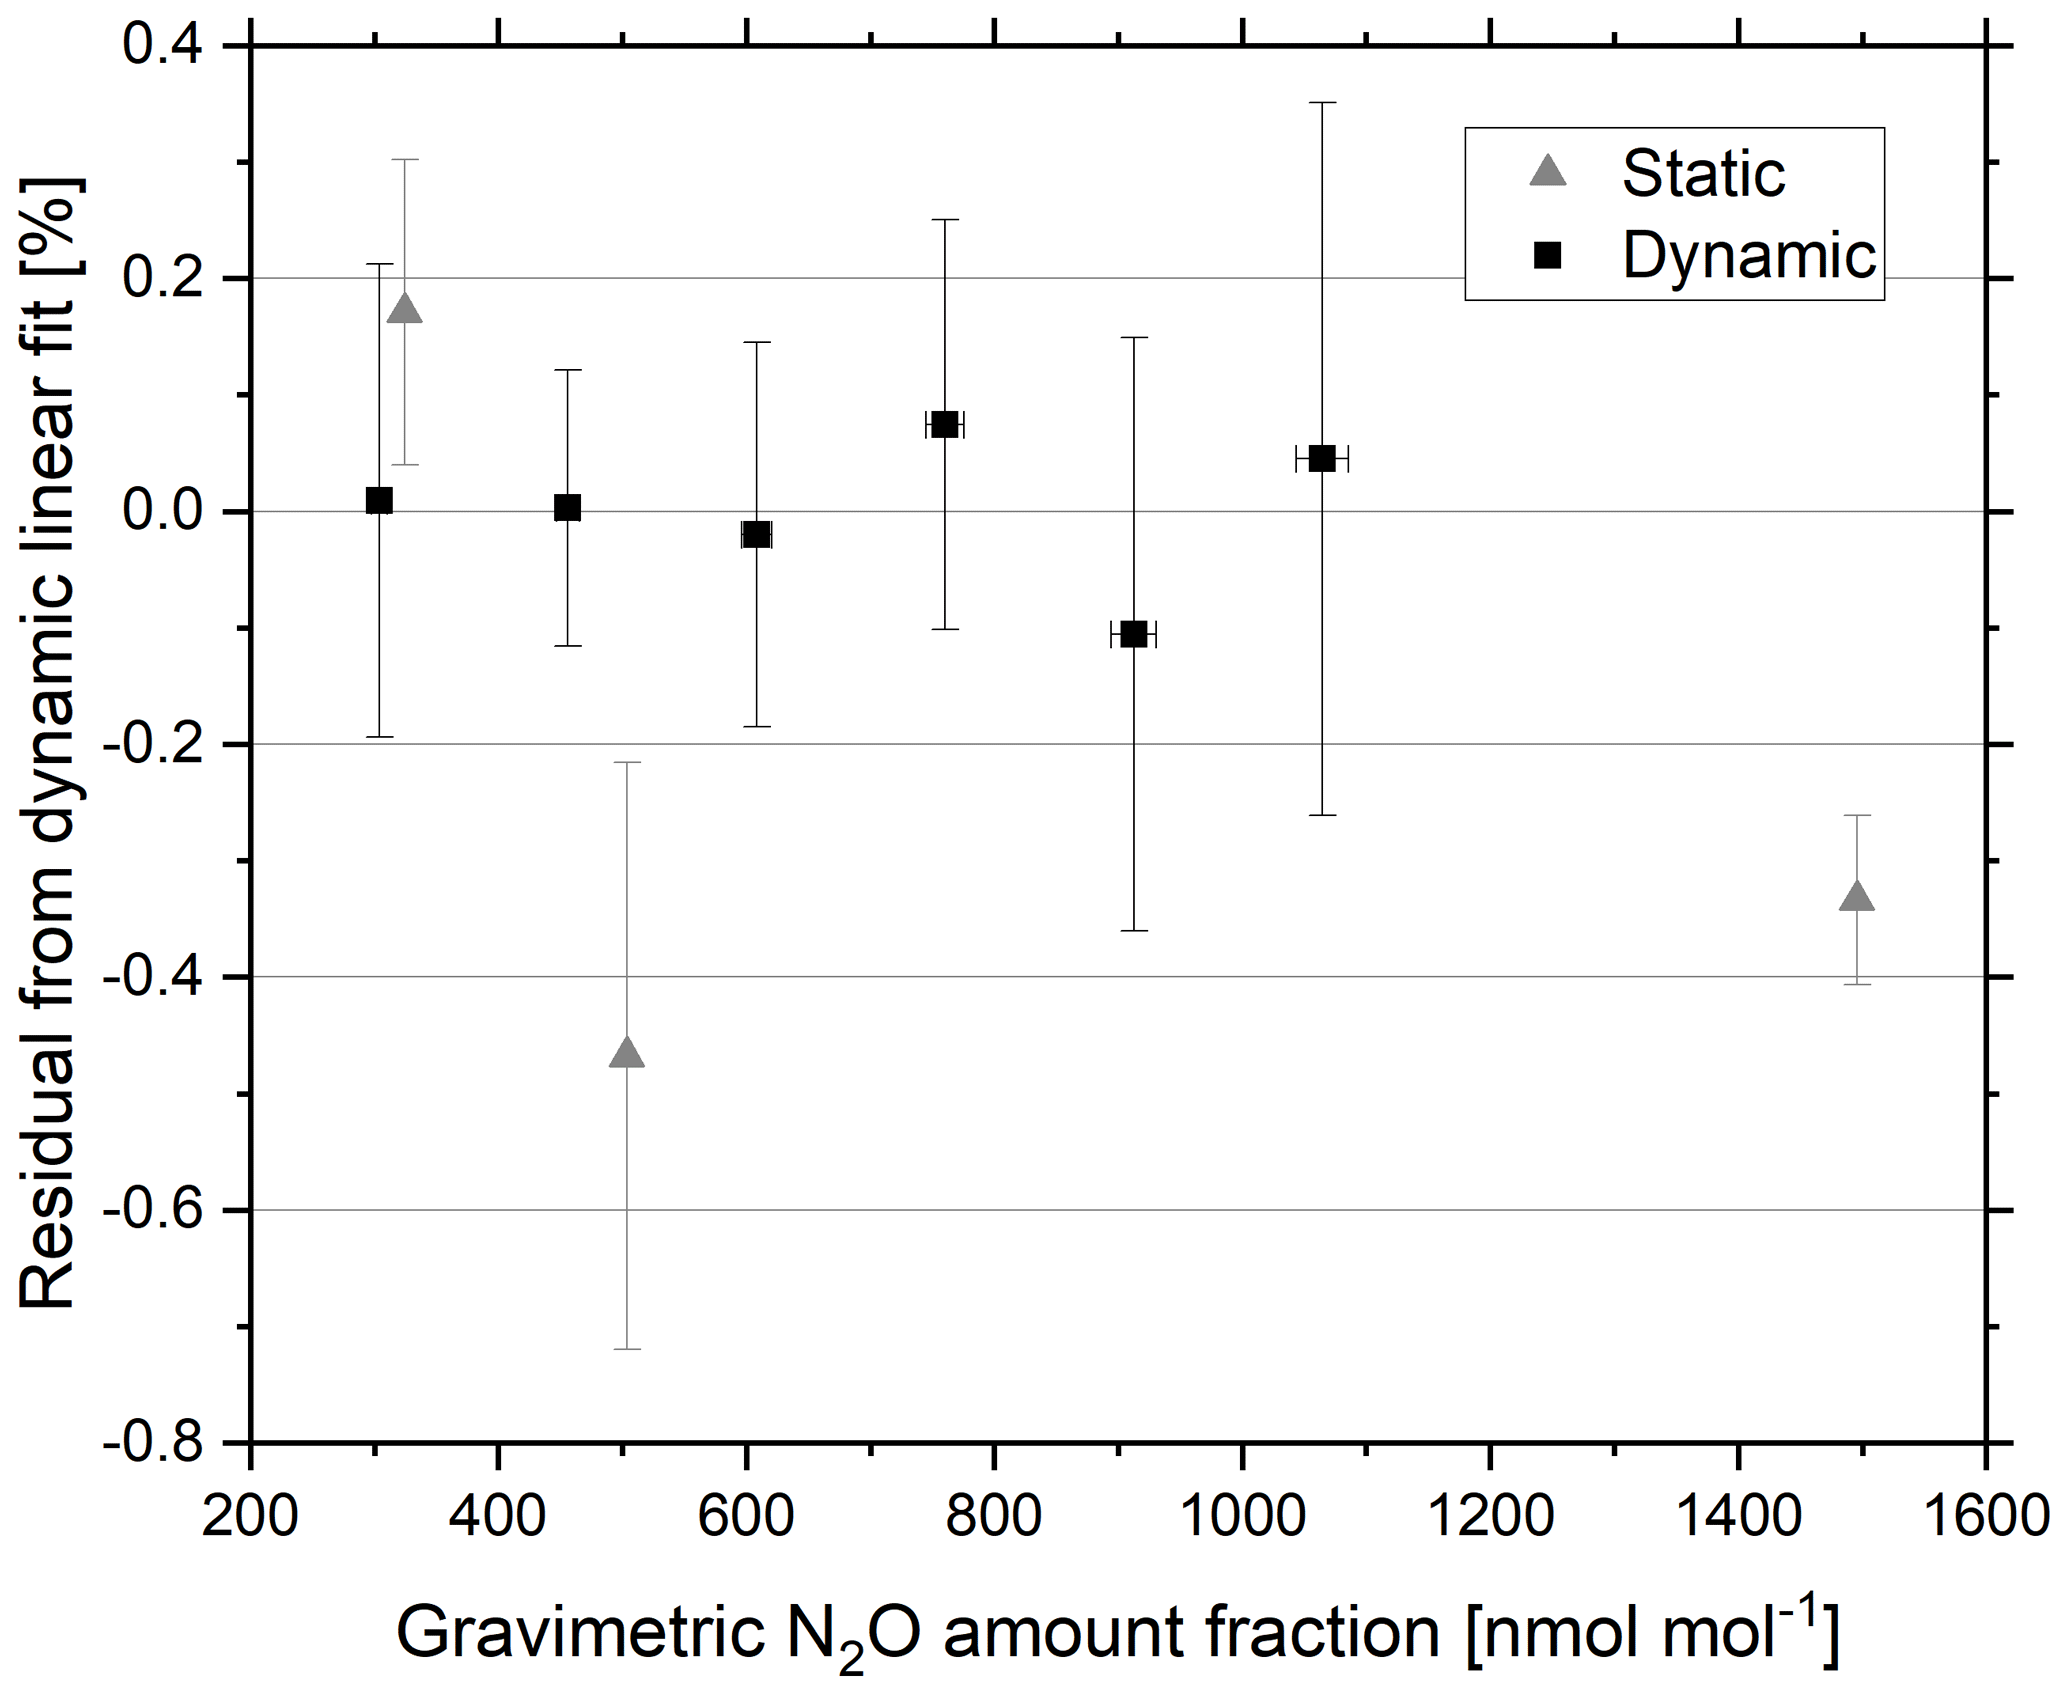
Figure 7Residuals from the linear regression of analyser response with increasing gravimetric amount fraction of the dynamic reference materials. Static (triangles) and dynamic (squares) reference materials in the amount fraction range 300–1500 nmol mol−1 N2O in synthetic air. Error bars represent the gravimetric uncertainty (k=2) (x axis) and the percent reproducibility between the four repetitions of a 5 min average (y axis).
The generated dynamic reference materials were validated against static reference materials of a similar amount fraction. The residuals of the static and dynamic linear regression of analyser response as a function of increasing gravimetric amount fraction of dynamic reference materials are shown in Fig. 7. Agreement within 0.05 % (0.16 nmol mol−1) was achieved between the static and dynamic reference materials at 325 nmol mol−1.
4.4 Comparison with existing scales
Two comparisons of amount fraction were carried out between NPL and the WMO-GAW World Calibration Centre (WCC-Empa) on reference materials prepared at Empa and NPL.
In a first approach, five reference materials were prepared by Empa containing N2O in the amount fraction range 290–370 nmol mol−1 and certified against reference materials on the WMO-X2006A calibration scale (Hall et al., 2007; NOAA/ESRL, 2011) via quantum cascade laser absorption spectroscopy (QCLAS, model: QC-TILDAS-CS, 2200 cm−1, Aerodyne Inc., USA). The Empa reference materials contained greenhouse and reactive gas components CO2 (360–800 µmol mol−1), CH4 (1.7–3.2 µmol mol−1) and CO (120–560 nmol mol−1). The reference materials were validated over a period of 6 months prior to analysis at NPL and were re-validated afterwards at Empa with a linear interpolation applied to account for any drift in amount fraction.
The reference materials were certified at NPL via CRDS against NPL in-house PRMs static reference materials in the amount fraction range of 325–360 nmol mol−1. Each sample was averaged across four 10 min repetitions. Agreement within the WMO-GAW compatibility goal was achieved for amount fractions at 330 nmol mol−1 (Fig. 8) and within the extended WMO-GAW compatibility goal at 337 nmol mol−1. Reference materials with amount fractions within the range 295–345 nmol mol−1 were verified within the experimental extended combined standard uncertainty (k=2) for NPL certified amount fraction. A trend was observed with lower NPL amount fractions certifying lower and higher NPL amount fractions certifying higher.
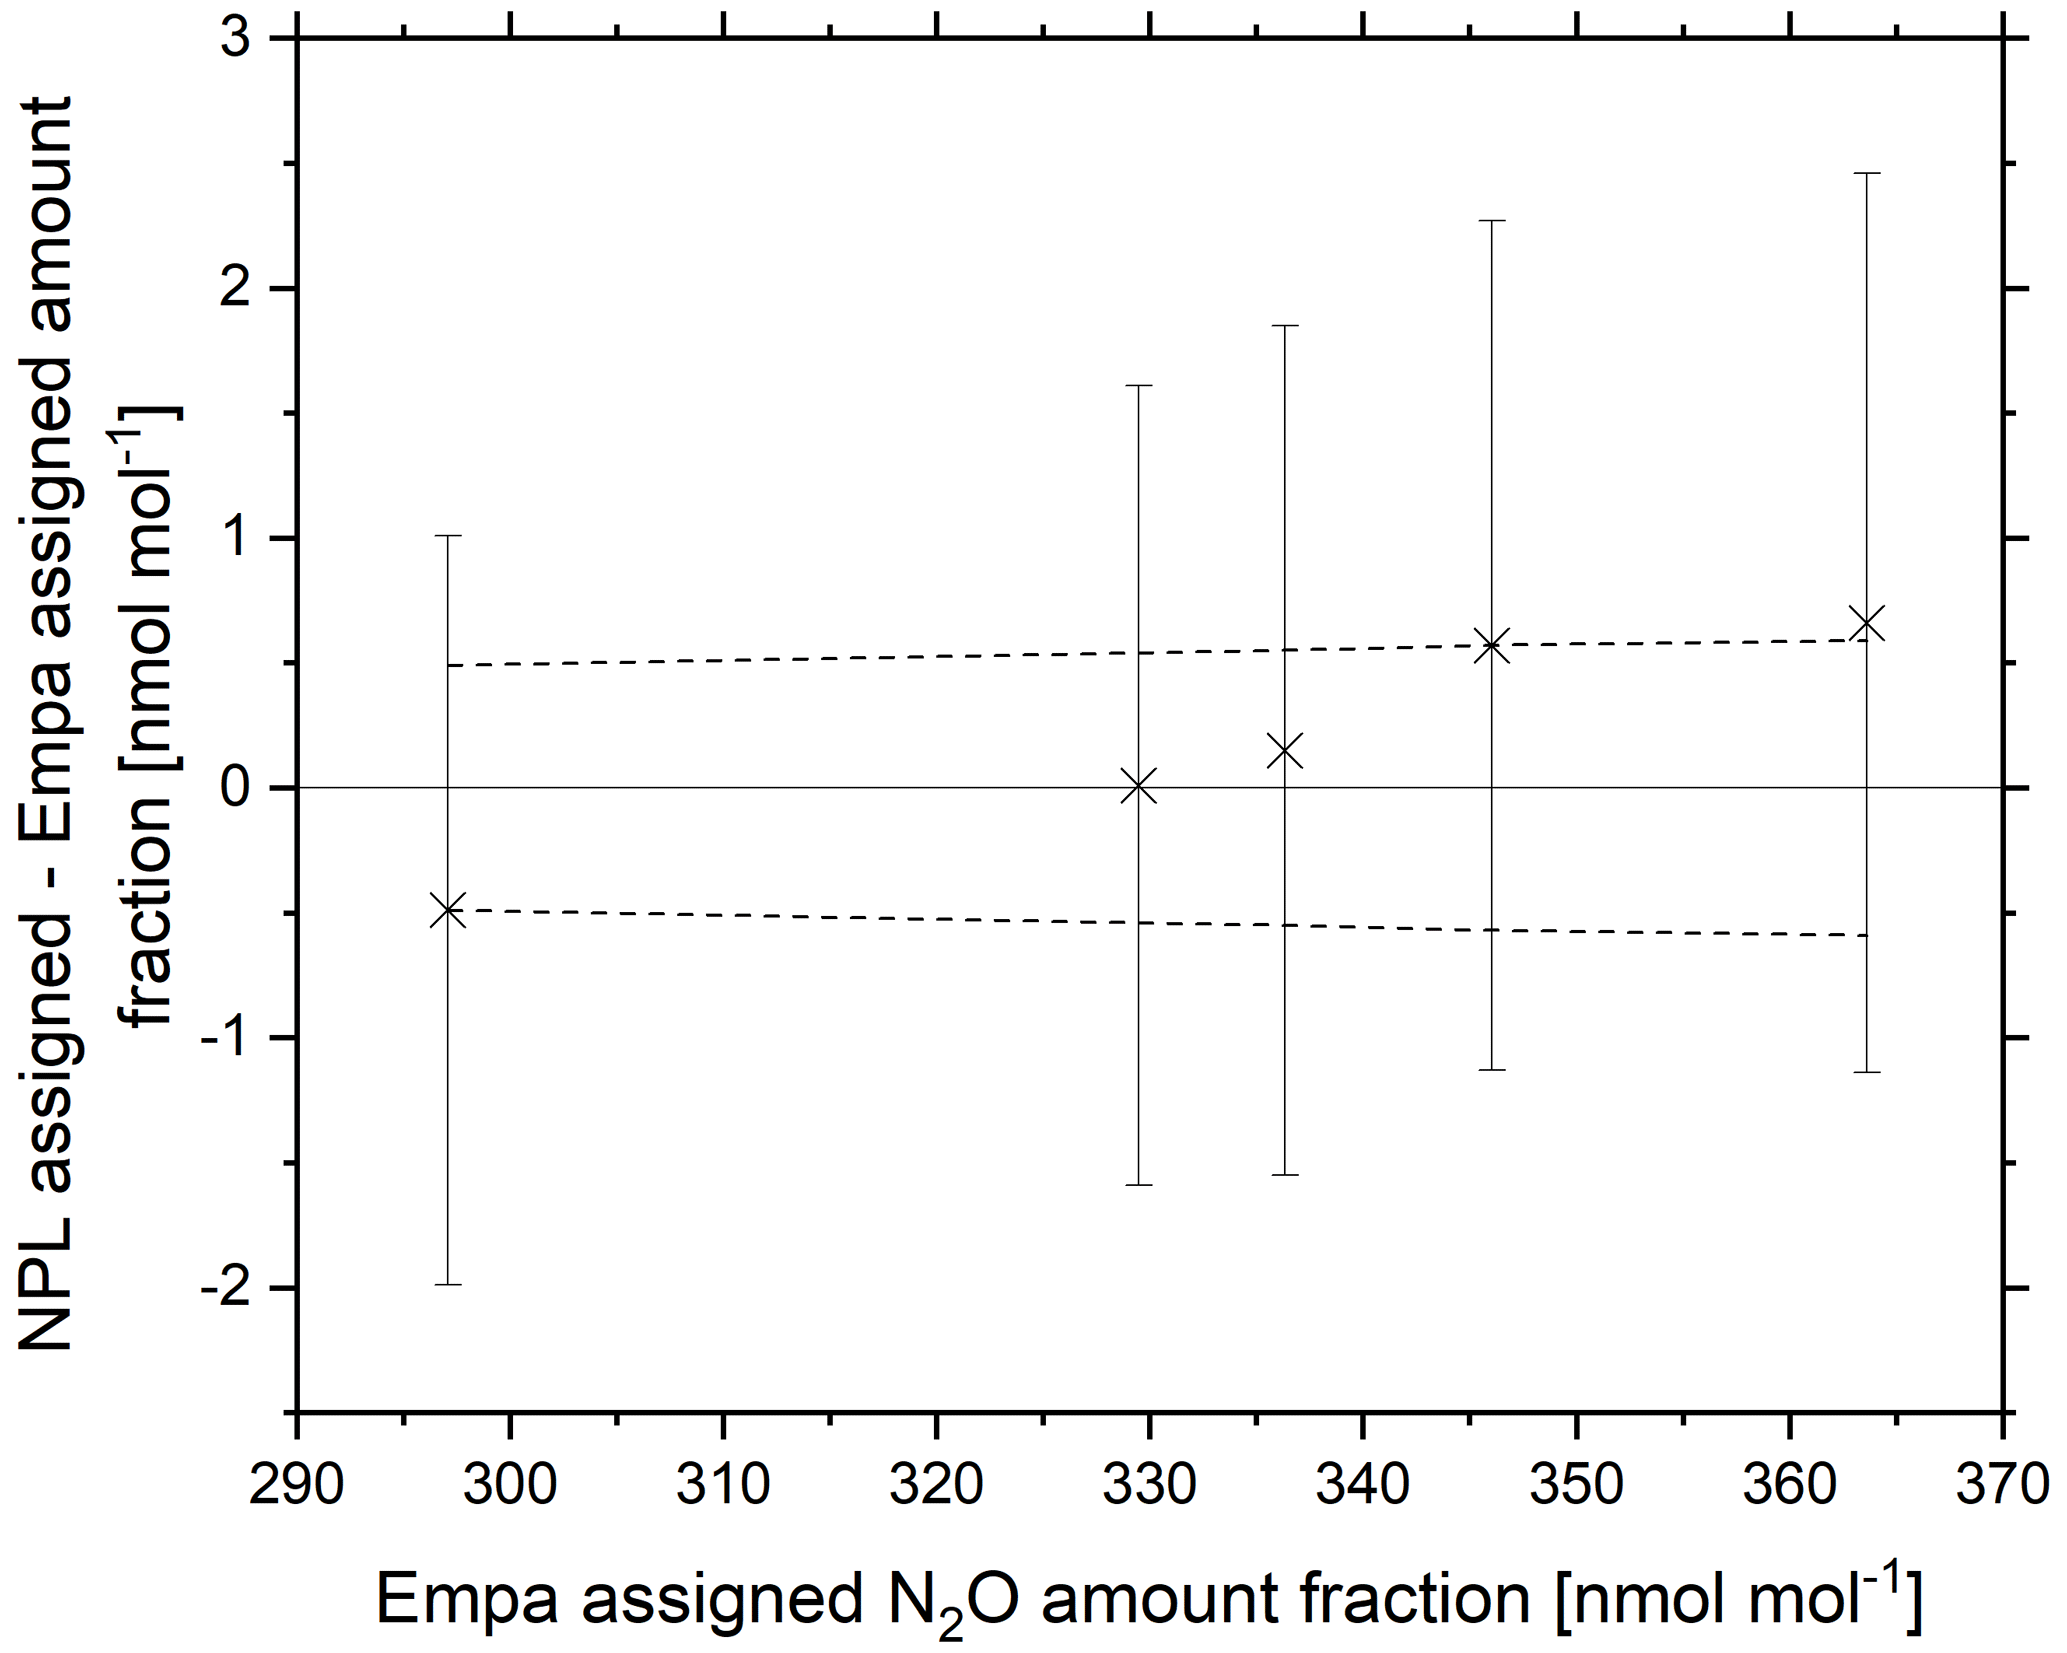
Figure 8Certified NPL amount fraction minus the certified Empa amount fraction of five N2O reference materials in the range 290–370 nmol mol−1 (crosses). Error bars represent the extended combined standard uncertainty (k=2) for NPL certified amount fraction. The Empa certified amount fraction is marked by a solid line at y=0, and dashed lines represent the Empa measurement uncertainty.
In a second approach, a 325 nmol mol−1 N2O-in-synthetic-air reference material containing 526 nmol mol−1 CO was prepared at NPL using the method described above and analysed at the World Calibration Centre (WCC-Empa) against NOAA/GMD reference materials on the WMO-X2006A calibration scale. Validations were performed via quantum cascade laser absorption spectroscopy (QCLAS, model: QC-TILDAS-CS, 2200 cm−1, Aerodyne Inc., USA).
Agreement within the combined gravimetric uncertainty (k=2) was achieved for the 325 nmol mol−1 reference material (Fig. 9). The uncertainty in the analytical amount fraction certified by Empa combines uncertainty contributions from traceability to the NOAA scale, scale propagation and repeatability of the analytical system from analyser drift and pressure changes. For the Aerodyne analyser used in the comparison to validate the 325 nmol mol−1 N2O reference material, the sources of uncertainty were combined to the combined standard uncertainty () as shown in Eq. (6).
where c refers to the amount fraction of N2O in the reference material in nmol mol−1. The term combines the uncertainty contributions from uncertainty in NOAA scale propagation and uncertainty due to pressure changes. The term 0.06 nmol mol−1 combines the concentration-independent uncertainty contributions from scale propagation and analyser drift.
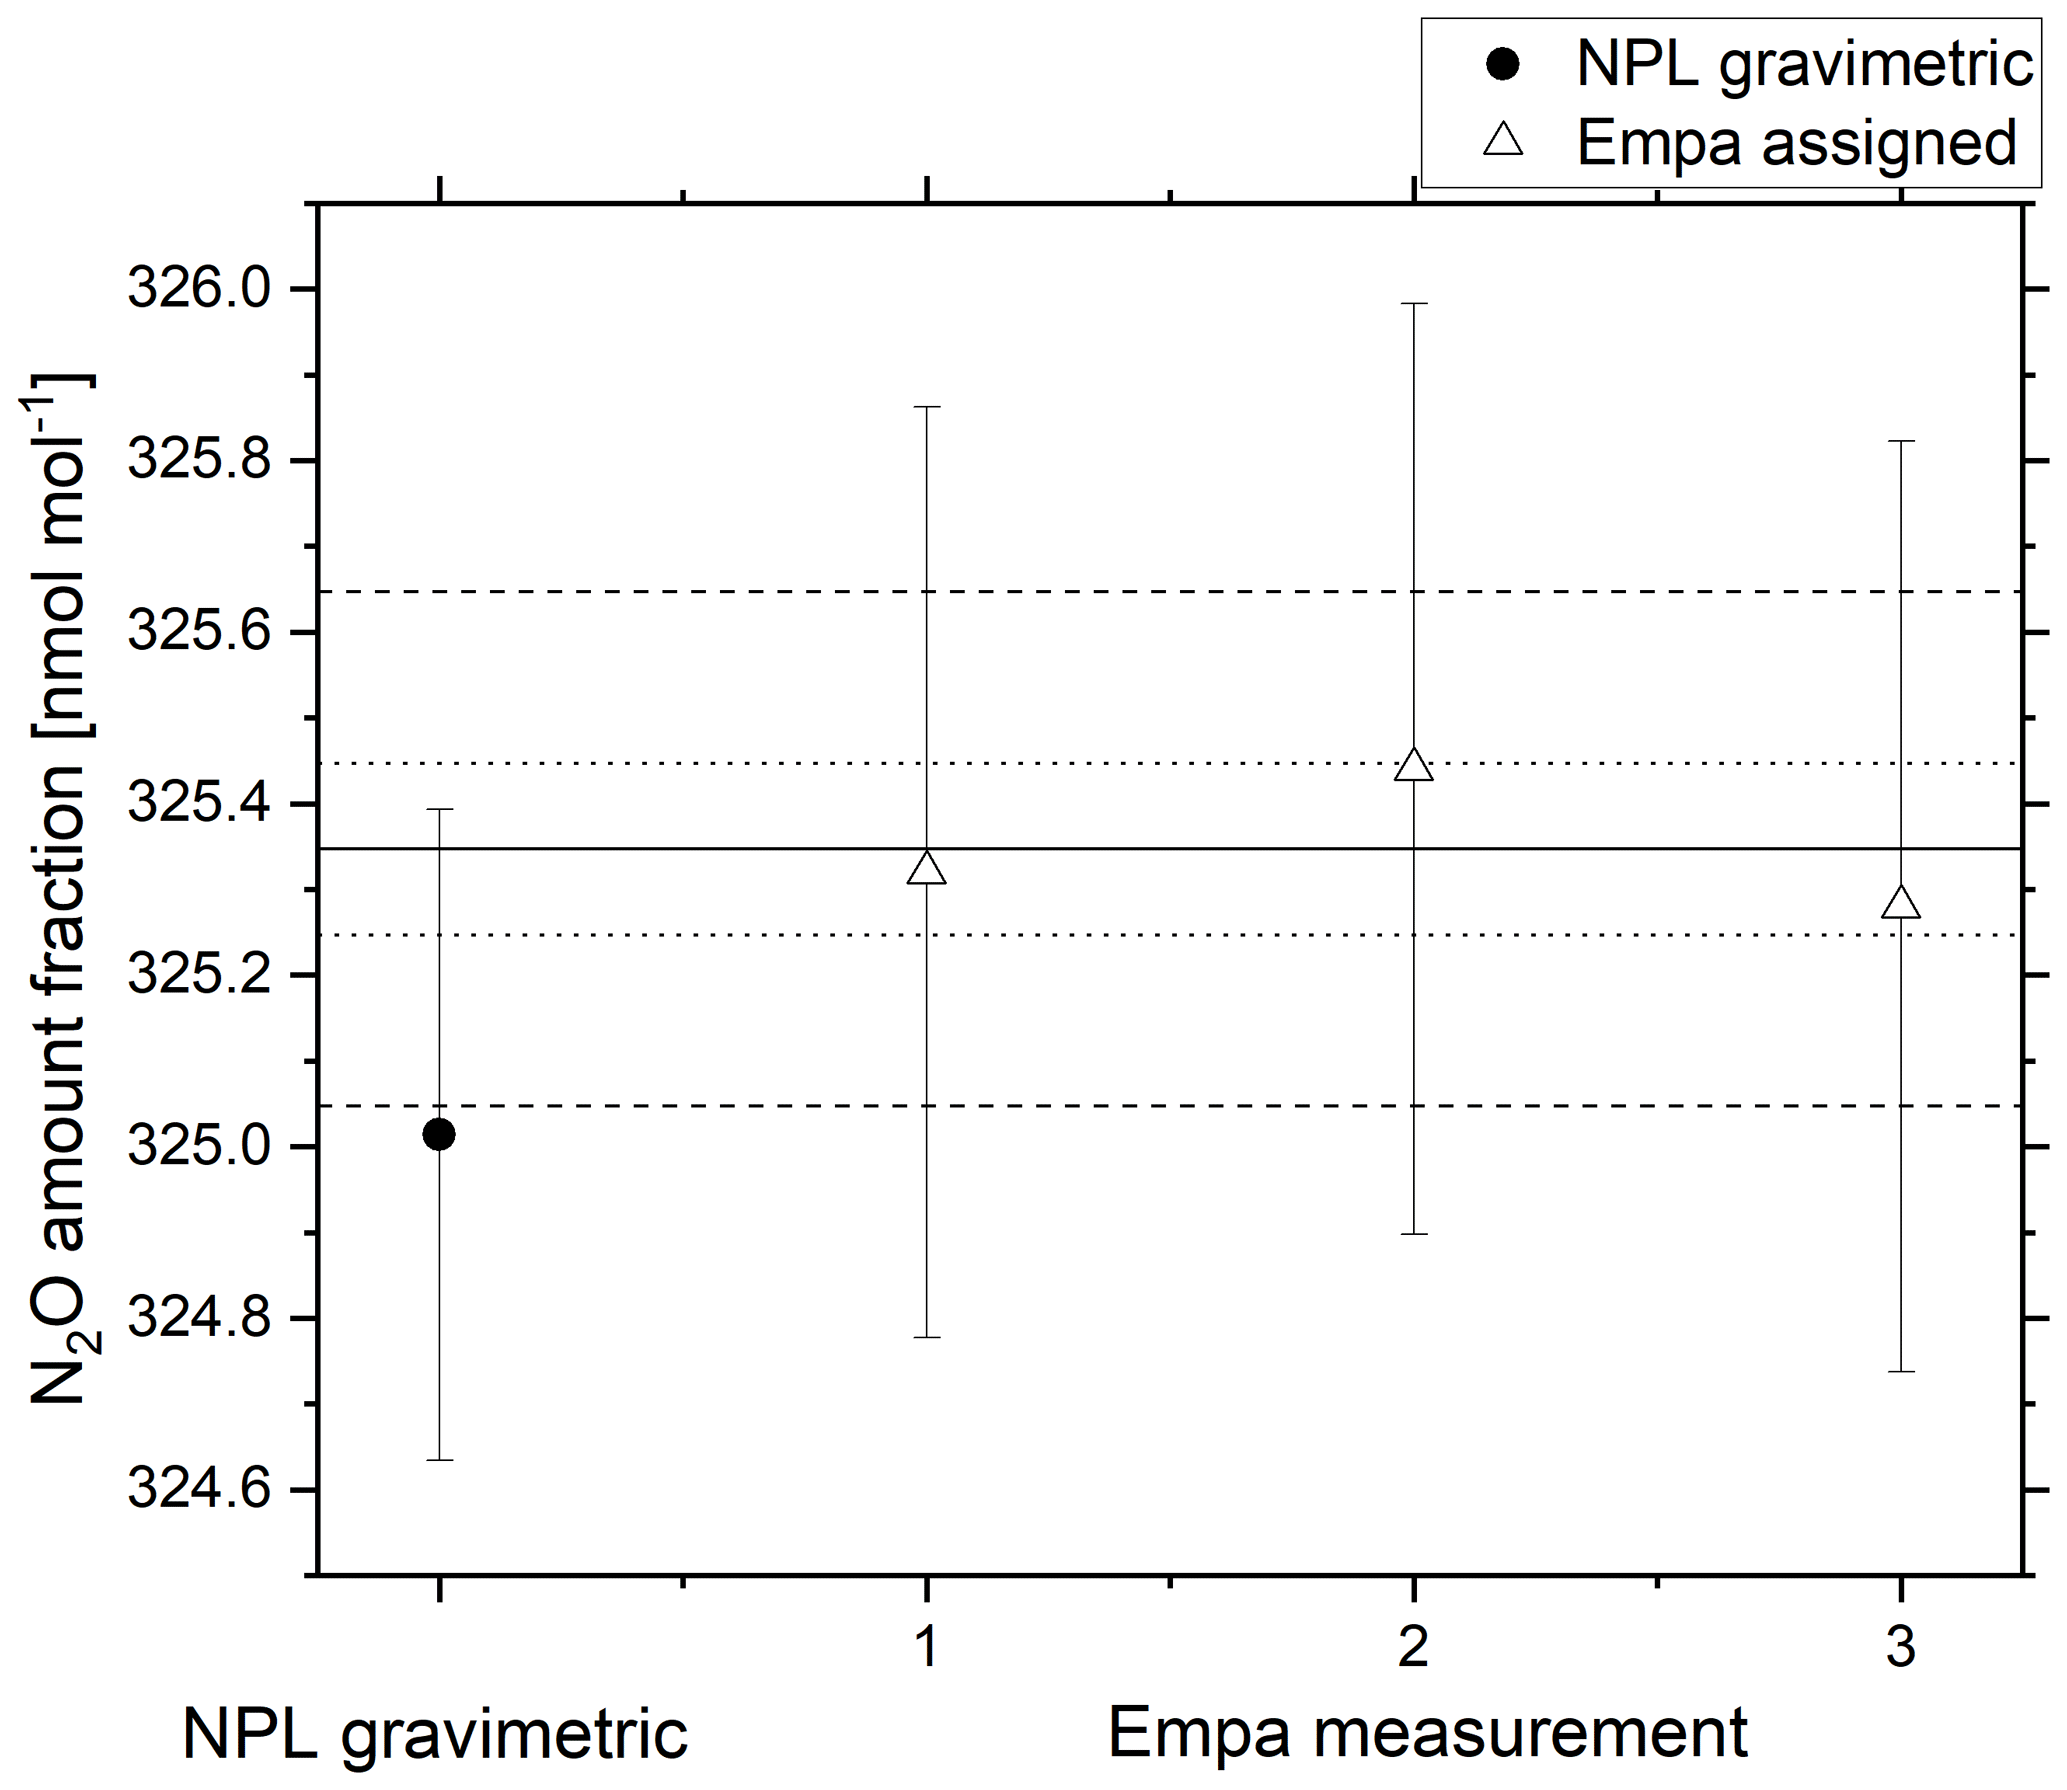
Figure 9Gravimetric amount fraction (filled circle) and amount fraction certified by Empa (open triangle) against the NOAA/GMD reference scale for a 325 nmol mol−1 reference material. The solid black line represents the average value certified by Empa, the dotted lines represent the WMO-GAW DQO and the dashed lines represent the extended WMO-GAW DQO. Error bars represent the combined expanded uncertainty (k=2).
The expanded uncertainty () (k=2) was determined from the standard uncertainty as shown in Eq. (7).
N2O reference materials with low uncertainty in amount fraction and isotope ratio are required for atmospheric monitoring. The stability of these reference materials is crucial to achieve these low uncertainties. We have demonstrated the production of atmospheric amount fraction N2O reference materials with a gravimetric uncertainty within the WMO DQO for compatibility. Repeatability of the amount fraction of these reference materials was also within ±0.3 nmol mol−1. Gravimetry is the largest source of uncertainty for these reference materials; reducing the uncertainty further would require the use of lower uncertainty balances for the indirect transfer of N2O. The effect of including other greenhouse gases at atmospheric amount fractions in the reference materials did not significantly affect the amount fraction recorded by CRDS. Agreement between static and dynamic reference materials of 0.05 % was achieved between reference materials at 325 nmol mol−1.
The amount fraction of a prepared N2O reference material in synthetic air with atmospheric amount fraction of CO was compared to internationally recognised scales (WMO-X2006A) and found to be in agreement within the gravimetric uncertainty. The amount fraction of reference materials produced at Empa was measured at NPL through comparison with NPL in-house PRMs. For a 330 nmol mol−1, the NPL- and Empa-assigned amount fraction values were in agreement within the WMO DQO for compatibility of ±0.1 nmol mol−1, and the full range of PRMs (290–370 nmol mol−1) were in agreement within the measurement uncertainty of ±0.5 nmol mol−1.
The change in amount fraction of the mixtures with decreasing cylinder pressure was shown to be smaller than measurement uncertainty regardless of cylinder passivation chemistry, and the stability of the mixtures over 3 years was within the expanded WMO-GAW DQO for compatibility. The isotopic composition of the reference mixtures was also demonstrated to be stable with reducing pressure, and agreement of delta values was achieved for static reference materials with dynamic dilutions within the analytical uncertainty. The next steps towards producing reference materials for source apportionment will be to produce reference materials with a range of isotopic values and to verify the assignment of their delta values.
The data underlying the figures in this paper are available upon request to the corresponding author.
The standard preparation and analysis work was undertaken by REHP, AH, EMW and KC, with JM and CZ comparing reference materials to existing scales. All authors (REHP, AH, EMW, KC, SO'D, JM, CZ, DRW, PJB) contributed to discussions and writing of the paper.
The authors declare that they have no conflict of interest.
Publisher's note: Copernicus Publications remains neutral with regard to jurisdictional claims in published maps and institutional affiliations.
This research has been supported by the European Metrology Programme for Innovation and Research (EMPIR) programme co-financed by the participating states and the European Union’s Horizon 2020 research and innovation programme.
This paper was edited by Frank Keppler and reviewed by Stefan Persijn and one anonymous referee.
BIPM, IEC, IFCC, ILAC, ISO, IUPAC, IUPAP, and OIML: Evaluation of measurement data – guide to the expression of uncertainty in measurement, International Bureau of Weights and Measures/Bureau International des Poids et Measures, Working group 1 of the Joint Committee for Guides in Metrology (JCGM 100: 2008, GUM 1995 with minor corrections), available at: http://www.bipm.org/utils/common/documents/jcgm/JCGM 100 2008 E.pdf (last access: 20 January 2021), 2008.
Brewer, P. J., Brown, R. J., Mussell Webber, E. B., van Aswegen, S., Ward, M. K., Hill-Pearce, R. E., and Worton, D. R.: Breakthrough in Negating the Impact of Adsorption in Gas Reference Materials, Anal. Chem., 91, 5310–5315, https://doi.org/10.1021/acs.analchem.9b00175, 2019a.
Brewer, P. J., Kim, J. S., Lee, S., Tarasova, O. A., Viallon, J., Flores, E., Wielgosz, R. I., Shimosaka, T., Assonov, S., and Allison, C. E.: Advances in reference materials and measurement techniques for greenhouse gas atmospheric observations, Metrologia, 56, 034006, https://doi.org/10.1088/1681-7575/ab1506, 2019b.
Brown, A.: GravCalc2 (version 2.3.0) User Guide, National Physical Laboratory (NPL), Teddington, UK, 2009.
Denk, T. R., Mohn, J., Decock, C., Lewicka-Szczebak, D., Harris, E., Butterbach-Bahl, K., Kiese, R., and Wolf, B.: The nitrogen cycle: A review of isotope effects and isotope modeling approaches, Soil Biol. Biochem., 105, 121–137, https://doi.org/10.1016/j.soilbio.2016.11.015, 2017.
Erler, D. V., Duncan, T., Murray, R., Maher, D. T., Santos, I. R., Gatland, J., Mangion, P., and Eyre, B. D.: Applying cavity ring-down spectroscopy for the measurement of dissolved nitrous oxide concentrations and bulk nitrogen isotopic composition in aquatic systems: Correcting for interferences and field application, Limnol. Oceanogr.-Meth., 13, 391–401, https://doi.org/10.1002/lom3.10032, 2015.
Flores, E., Viallon, J., Moussay, P., Griffith, D. W., and Wielgosz, R. I.: Calibration strategies for FT-IR and other isotope ratio infrared spectrometer instruments for accurate δ13C and δ18O measurements of CO2 in air, Anal. Chem., 89, 3648–3655, https://doi.org/10.1021/acs.analchem.6b05063, 2017.
Ganesan, A. L., Chatterjee, A., Prinn, R. G., Harth, C. M., Salameh, P. K., Manning, A. J., Hall, B. D., Mühle, J., Meredith, L. K., Weiss, R. F., O'Doherty, S., and Young, D.: The variability of methane, nitrous oxide and sulfur hexafluoride in Northeast India, Atmos. Chem. Phys., 13, 10633–10644, https://doi.org/10.5194/acp-13-10633-2013, 2013.
Griffith, D. W. T., Deutscher, N. M., Caldow, C., Kettlewell, G., Riggenbach, M., and Hammer, S.: A Fourier transform infrared trace gas and isotope analyser for atmospheric applications, Atmos. Meas. Tech., 5, 2481–2498, https://doi.org/10.5194/amt-5-2481-2012, 2012.
Hall, B., Dutton, G., and Elkins, J.: The NOAA nitrous oxide standard scale for atmospheric observations, J. Geophys. Res.-Atmos., 112, D09305, https://doi.org/10.1029/2006JD007954, 2007.
Harris, S. J., Liisberg, J., Xia, L., Wei, J., Zeyer, K., Yu, L., Barthel, M., Wolf, B., Kelly, B. F. J., Cendón, D. I., Blunier, T., Six, J., and Mohn, J.: N2O isotopocule measurements using laser spectroscopy: analyzer characterization and intercomparison, Atmos. Meas. Tech., 13, 2797–2831, https://doi.org/10.5194/amt-13-2797-2020, 2020.
Hill-Pearce, R. E., Resner, K. V., Worton, D. R., and Brewer, P. J.: Synthetic Zero Air Reference Material for High Accuracy Greenhouse Gas Measurements, Anal. Chem., 91, 1974–1979, https://doi.org/10.1021/acs.analchem.8b04297, 2018.
ISO: 6142-1: Gas analysis-Preparation of calibration gas mixtures – Part 1: Gravimetric method for Class I mixtures, Geneva, Switzerland, 2015.
Kantnerová, K., Tuzson, B., Emmenegger, L., Bernasconi, S. M., and Mohn, J.: Quantifying isotopic signatures of N2O using quantum cascade laser absorption spectroscopy, CHIMIA, 73, 232–238, https://doi.org/10.2533/chimia.2019.232, 2019.
Lewicka-Szczebak, D., Well, R., Köster, J. R., Fuß, R., Senbayram, M., Dittert, K., and Flessa, H.: Experimental determinations of isotopic fractionation factors associated with N2O production and reduction during denitrification in soils, Geochim. Cosmochim. Ac., 134, 55–73, https://doi.org/10.1016/j.gca.2014.03.010, 2014.
Lim, J. S., Lee, J., Moon, D., Kim, J. S., Lee, J., and Hall, B. D.: Gravimetric standard gas mixtures for global monitoring of atmospheric SF6, Anal. Chem., 89, 12068–12075, https://doi.org/10.1021/acs.analchem.7b02545, 2017.
Lopez, M., Schmidt, M., Ramonet, M., Bonne, J.-L., Colomb, A., Kazan, V., Laj, P., and Pichon, J.-M.: Three years of semicontinuous greenhouse gas measurements at the Puy de Dôme station (central France), Atmos. Meas. Tech., 8, 3941–3958, https://doi.org/10.5194/amt-8-3941-2015, 2015.
Lushozi, S., Tshilongo, J., and Chimuka, L.: Verification of nitrous oxide primary standard gas mixtures by gas chromatography and cavity ring-down spectroscopy for ambient measurements in South Africa, Accredit. Qual. Assur., 24, 203–214, https://doi.org/10.1007/s00769-019-01375-x, 2019.
Mohn, J., Wolf, B., Toyoda, S., Lin, C. T., Liang, M. C., Brüggemann, N., Wissel, H., Steiker, A. E., Dyckmans, J., and Szwec, L.: Interlaboratory assessment of nitrous oxide isotopomer analysis by isotope ratio mass spectrometry and laser spectroscopy: current status and perspectives, Rapid Commun. Mass Sp., 28, 1995–2007, https://doi.org/10.1002/rcm.6982, 2014.
Myhre, G., Shindell, D., Bréon, F., Collins, W., Fuglestvedt, J., Huang, J., Koch, D., Lamarque, J., Lee, D., and Mendoza, B.: Anthropogenic and Natural Radiative Forcing, Climate Change 2013: The Physical Science Basis. Contribution of Working Group I to the Fifth Assessment Report of the Intergovernmental Panel on Climate Change, edited by: Stocker, T. F., Qin, D., Plattner, G.-K., Tignor, M., Allen, S. K., Boschung, J., Nauels, A., Xia, Y., Bex, V., and Midgley, P. M., Cambridge University Press, Cambridge, UK and New York, NY, USA, 659–740, https://doi.org/10.1017/CBO9781107415324.018, 2013.
Nara, H., Tanimoto, H., Tohjima, Y., Mukai, H., Nojiri, Y., Katsumata, K., and Rella, C. W.: Effect of air composition (N2, O2, Ar, and H2O) on CO2 and CH4 measurement by wavelength-scanned cavity ring-down spectroscopy: calibration and measurement strategy, Atmos. Meas. Tech., 5, 2689–2701, https://doi.org/10.5194/amt-5-2689-2012, 2012.
NOAA/ESRL: Nitrous oxide (N2O) WMO scale: https://www.esrl.noaa.gov/gmd/ccl/n2o_scale.html (last access: 21 December 2020), 2011.
Ostrom, N. E. and Ostrom, P. H.: Mining the isotopic complexity of nitrous oxide: a review of challenges and opportunities, Biogeochemistry, 132, 359–372, https://doi.org/10.1007/s10533-017-0301-5, 2017.
Ostrom, N. E., Gandhi, H., Coplen, T. B., Toyoda, S., Böhlke, J. K., Brand, W. A., Casciotti, K. L., Dyckmans, J., Giesemann, A., and Mohn, J.: Preliminary assessment of stable nitrogen and oxygen isotopic composition of USGS51 and USGS52 nitrous oxide reference gases and perspectives on calibration needs, Rapid Commun. Mass Sp., 32, 1207–1214, https://doi.org/10.1002/rcm.8157, 2018.
Picarro: δ15N and δ18O Isotopic and Nitrous Oxide Gas Concentration Analyzer, available at: https://www.picarro.com/support/library/documents/g5131i_analyzer_datasheet (last access: 20 January 2021), 2017.
Platonov, I., Rodinkov, O., Gorbacheva, A., Moskvin, L., and Kolesnichenko, I.: Methods and devices for the preparation of standard gas mixtures, J. Anal. Chem., 73, 109–127, https://doi.org/10.1134/S1061934818020090, 2018.
Snider, D. M., Venkiteswaran, J. J., Schiff, S. L., and Spoelstra, J.: From the ground up: Global nitrous oxide sources are constrained by stable isotope values, PloS one, 10, e0118954, https://doi.org/10.1371/journal.pone.0118954, 2015.
Tohjima, Y., Katsumata, K., Morino, I., Mukai, H., Machida, T., Akama, I., Amari, T., and Tsunogai, U.: Theoretical and experimental evaluation of the isotope effect of NDIR analyzer on atmospheric CO2 measurement, J. Geophys. Res.-Atmos., 114, D13302, https://doi.org/10.1029/2009JD011734, 2009.
Toyoda, S. and Yoshida, N.: Determination of nitrogen isotopomers of nitrous oxide on a modified isotope ratio mass spectrometer, Anal. Chem., 71, 4711–4718, https://doi.org/10.1021/ac9904563, 1999.
Toyoda, S., Yoshida, N., and Koba, K.: Isotopocule analysis of biologically produced nitrous oxide in various environments, Mass Spectrom. Rev., 36, 135–160, https://doi.org/10.1002/mas.21459, 2017.
van der Schoot, M., Langenfelds, R., Fraser, P., Krummel, P., Ward, J., and Somerville, N.: The WMO/GAW Cape Grim Baseline Air Pollution Station Air Archive, Asia-Pacific GAW on Greenhouse Gases, Korea Metrological Administration (KMA), vol. 6. 13–20, 2015.
Winther, M., Balslev-Harder, D., Christensen, S., Priemé, A., Elberling, B., Crosson, E., and Blunier, T.: Continuous measurements of nitrous oxide isotopomers during incubation experiments, Biogeosciences, 15, 767–780, https://doi.org/10.5194/bg-15-767-2018, 2018.
WMO: 20th WMO/IAEA Meeting on Carbon Dioxide, Other Greenhouse Gases and Related Tracers Measurement Techniques (GGMT-2019), World Meteorological Organization, Geneva, Switzerland, 2019a.
WMO: Greenhouse Gas Bulletin (GHG Bulletin) – No. 15: The State of Greenhouse Gases in the Atmosphere Based on Global Observations through 2018, World Meteorological Organization, Geneva, Switzerland, available at: https://public.wmo.int/en/resources/library/wmo-greenhouse-gas-bulletin-no-15 (last access: 13 January 2021), 2019b.
WMO: Carbon dioxide levels continue at record levels, despite COVID-19 lockdown, available at: https://public.wmo.int/en/media/press-release/carbon-dioxide- levels-continue-record-levels-despite-covid-19-lockdown (last access: 13 January 2021), 2020.
There is ongoing research to improve the accuracy of the quantification of trace N2O in the synthetic air matrix which may form the basis of a future publication.