the Creative Commons Attribution 4.0 License.
the Creative Commons Attribution 4.0 License.
 | 31 Aug 2021
Long-term column-averaged greenhouse gas observations using a COCCON spectrometer at the high-surface-albedo site in Gobabeb, Namibia
Matthias M. Frey
Frank Hase
Thomas Blumenstock
Darko Dubravica
Jochen Groß
Frank Göttsche
Martin Handjaba
Petrus Amadhila
Roland Mushi
Isamu Morino
Kei Shiomi
Mahesh Kumar Sha
Martine de Mazière
David F. Pollard
In this study, we present column-averaged dry-air mole fractions of CO2 (XCO2), CH4 (XCH4) and CO (XCO) from a recently established measurement site in Gobabeb, Namibia. Gobabeb is a hyperarid desert site at the sharp transition zone between the sand desert and the gravel plains, offering unique characteristics with respect to surface albedo properties. Measurements started in January 2015 and are performed utilizing a ground-based Fourier transform infrared (FTIR) EM27/SUN spectrometer of the COllaborative Carbon Column Observing Network (COCCON). Gobabeb is the first measurement site observing XCO2 and XCH4 on the African mainland and improves the global coverage of ground-based remote-sensing sites. In order to achieve the high level of precision and accuracy necessary for meaningful greenhouse gas observations, we performed calibration measurements for 8 d between November 2015 and March 2016 with the COCCON reference EM27/SUN spectrometer operated at the Karlsruhe Institute of Technology. We derived scaling factors for XCO2, XCH4 and XCO with respect to the reference instrument that are close to 1.0. We compare the results obtained in Gobabeb to measurements from the Total Carbon Column Observing Network (TCCON) sites at Réunion Island and Lauder. We choose these TCCON sites because, while 4000 km apart, the instruments at Gobabeb and Réunion Island operate at roughly the same latitude. The Lauder station is the southernmost TCCON station and functions as a background site without a pronounced XCO2 seasonal cycle. We find a good agreement for the absolute Xgas values, apart from an expected XCH4 offset between Gobabeb and Lauder due to significantly different tropopause height, as well as representative intraday variability between TCCON and COCCON. Together with the absence of long-term drifts, this highlights the quality of the COCCON measurements. In the southern hemispheric summer, we observe lower XCO2 values at Gobabeb compared to the TCCON stations, likely due to the influence of the African biosphere. We performed coincident measurements with the Greenhouse Gases Observing Satellite (GOSAT), where GOSAT observed three nearby specific observation points, over the sand desert south of the station, directly over Gobabeb and over the gravel plains to the north. GOSAT H-gain XCO2 and XCH4 agree with the EM27/SUN measurements within the 1σ uncertainty limit. The number of coincident soundings is limited, but we confirm a bias of 1.2–2.6 ppm between GOSAT M-gain and H-gain XCO2 retrievals depending on the target point. This is in agreement with results reported by a previous study and the GOSAT validation team. We also report a bias of 5.9–9.8 ppb between GOSAT M-gain and H-gain XCH4 measurements which is within the range given by the GOSAT validation team. Finally, we use the COCCON measurements to evaluate inversion-optimized CAMS model data. For XCO2, we find high biases of 0.9 ± 0.5 ppm for the Orbiting Carbon Observatory-2 (OCO-2) assimilated product and 1.1 ± 0.6 ppm for the in situ-driven product with R2 > 0.9 in both cases. These biases are comparable to reported offsets between the model and TCCON data. The OCO-2 assimilated model product is able to reproduce the drawdown of XCO2 observed by the COCCON instrument at the beginning of 2017, as opposed to the in situ-optimized product. Also, for XCH4, the observed biases are in line with prior model comparisons with TCCON.
- Article
(6413 KB) - Full-text XML
- BibTeX
- EndNote


The concentrations of the most important anthropogenic greenhouse gases (GHGs), carbon dioxide (CO2) and methane (CH4), have risen to values unprecedented since the beginning of high-frequency observational records (Dlugokencky et al., 2019a, b). Additionally, recently fossil CO2 emissions exceeded 10 Gt C yr−1 for the first time in history (Friedlingstein et al., 2019). Precise and accurate global observations of GHGs are therefore important for the estimation of emission strengths, flux changes (Olsen and Randerson, 2004) and model evaluation. Furthermore, these measurements can be used for the verification of climate mitigation actions as demanded by international treaties, e.g., the Paris Agreement (COP21) (https://unfccc.int/files/essential_background/convention/application/pdf/english_paris_agreement.pdf, last access: 15 October 2020).
Satellites like the Greenhouse Gases Observing Satellite (GOSAT) (Kuze et al., 2009; Morino et al., 2011; Yoshida et al., 2013), Orbiting Carbon Observatory-2 (OCO-2) (Frankenberg et al., 2015; Crisp et al., 2017; Eldering et al., 2017), Orbiting Carbon Observatory-3 (OCO-3) (Eldering et al., 2019), Sentinel-5 Precursor (S5P) (Veefkind et al., 2012) or Greenhouse Gases Observing Satellite-2 (GOSAT-2) (Suto et al., 2021) are well-suited candidates for this task, as they retrieve total column abundances of atmospheric GHGs on a global scale. However, current satellites, while offering quasi-global spatial coverage, have coarse temporal resolution. The OCO-2 repeat cycle is 16 d; the GOSAT-2 repeat cycle is 6 d. S5P offers daily global coverage of CH4 and CO; however, the measurements are mostly around local noontime. Future geostationary satellites will likely help to overcome this shortcoming (Moore et al., 2018; Nivitanont et al., 2019). Due to the fact that satellites measure backscattered sunlight from the surface of the Earth and its atmosphere, retrievals of GHGs are complicated and biases can easily occur, which need to be recognized and – if possible – corrected. Therefore, satellite measurements are commonly validated against ground-based remote-sensing instruments, as these measurements are not influenced by surface albedo effects and only minimally affected by aerosols (Dils et al., 2014; Wunch et al., 2017). The Total Carbon Column Observing Network (TCCON) is a ground-based network retrieving total columns of GHGs with reference precision and accuracy utilizing high-resolution solar-viewing Fourier transform infrared (FTIR) spectrometers (Wunch et al., 2011; Washenfelder et al., 2006). TCCON is the reference network and primary validation source for current satellites (Inoue et al., 2016; Wu et al., 2018; Borsdorff et al., 2018; Sha et al., 2021).
Recently, in an effort to further improve the global coverage of ground-based observations, the COllaborative Carbon Column Observing Network (COCCON) was established (Frey et al., 2019). This network employs compact, portable FTIR spectrometers. The spectrometers used have been developed by KIT in cooperation with Bruker (Gisi et al., 2012; Hase et al., 2016) and have been commercially available since 2014 (type designation EM27/SUN spectrometer). Lately, a COCCON spectrometer was used in combination with two TCCON instruments to validate OCO-2 (Jacobs et al., 2020) and study boreal forests (Tu et al., 2020), and Velazco et al. (2019) performed a campaign to validate GOSAT in central Australia. Apart from these studies, until now, the major activity of the emerging network was to create the capability of permanent COCCON measurements at remote sites as a supplement to the existing TCCON stations. To this end, procedures for ensuring proper calibration were developed and evidence of the long-term stability of the EM27/SUN spectrometer was provided (Frey et al., 2015, 2019; Sha et al., 2020). Tasks that can be accomplished by performing differential measurements using several spectrometers which can be calibrated side by side in the framework of campaigns are easier to achieve. Many successful campaigns for quantifying GHG emission strengths from regions of interest, like cities, coal mines, large dairy farms, etc., by arranging several spectrometers around the source have been performed successfully using EM27/SUN spectrometers in the recent past (Hase et al., 2015; Vogel et al., 2019; Makarova et al., 2021; Viatte et al., 2017; Kille et al., 2019; Butz et al., 2017; Luther et al., 2019). In this work, we introduce a COCCON station in Gobabeb, Namibia, where measurements have been conducted since January 2015. We demonstrate the excellent long-term stability of the COCCON instrument and its usefulness for satellite and model validation studies. The remainder of this paper is structured as follows. In Sect. 2, we describe the measurement site, used instrumentation and data analysis, focusing on the COCCON EM27/SUN spectrometer. In Sect. 3, we present the measurement results obtained over the last 4 years. In Sect. 4, a comparison with respect to TCCON stations at Réunion Island and Lauder is conducted to illustrate the feasibility of our results. Additionally, the COCCON instrument is used to validate specific target mode observations from GOSAT, confirming a previously reported bias between GOSAT M-gain and H-gain soundings for XCO2 (Velazco et al., 2019) and for the first time also reporting a bias in XCH4 for the different gain settings. We also compare our measurements to CAMS inversion-optimized model data. In Sect. 5, we investigate the influence of the African biosphere on the observations performed in Gobabeb. In Sect. 6, the results are discussed and an outlook for further studies is given.
2.1 Gobabeb site description
In 2015, we installed an EM27/SUN spectrometer of the COCCON network at the Gobabeb Namib Research Institute in Namibia (23.561∘ S, 15.042∘ E; 410 m a.s.l.); see the inset of Fig. 1. Gobabeb is located at the center of the hyperarid Namib Desert. Moreover, Gobabeb is positioned next to the Kuiseb River, which marks the sharp transition zone between the gravel plains to the north and the sand desert to the south of the station; see Fig. 1. Gobabeb is situated 60 km east of the Atlantic Ocean and the site is approximately 80 km southeast of the closest town, Walvis Bay, with a population of about 50 000. The site is uninfluenced by nearby local emission sources of GHGs. Southwesterly winds prevail during austral summer, whereas in winter easterly winds are predominant. The maximum temperature in summer can exceed 40 ∘C. Gobabeb is a high-albedo station, with a surface albedo derived from GOSAT retrievals at 1.6 µm of 0.4 for the sand desert and 0.45 for the gravel plains. Together with the changing terrain, this results in unique site characteristics desirable especially for satellite validation studies. In Fig. 2, we show the COCCON Gobabeb station in a broader context on a global map together with the TCCON Réunion Island and Lauder stations used in this study.
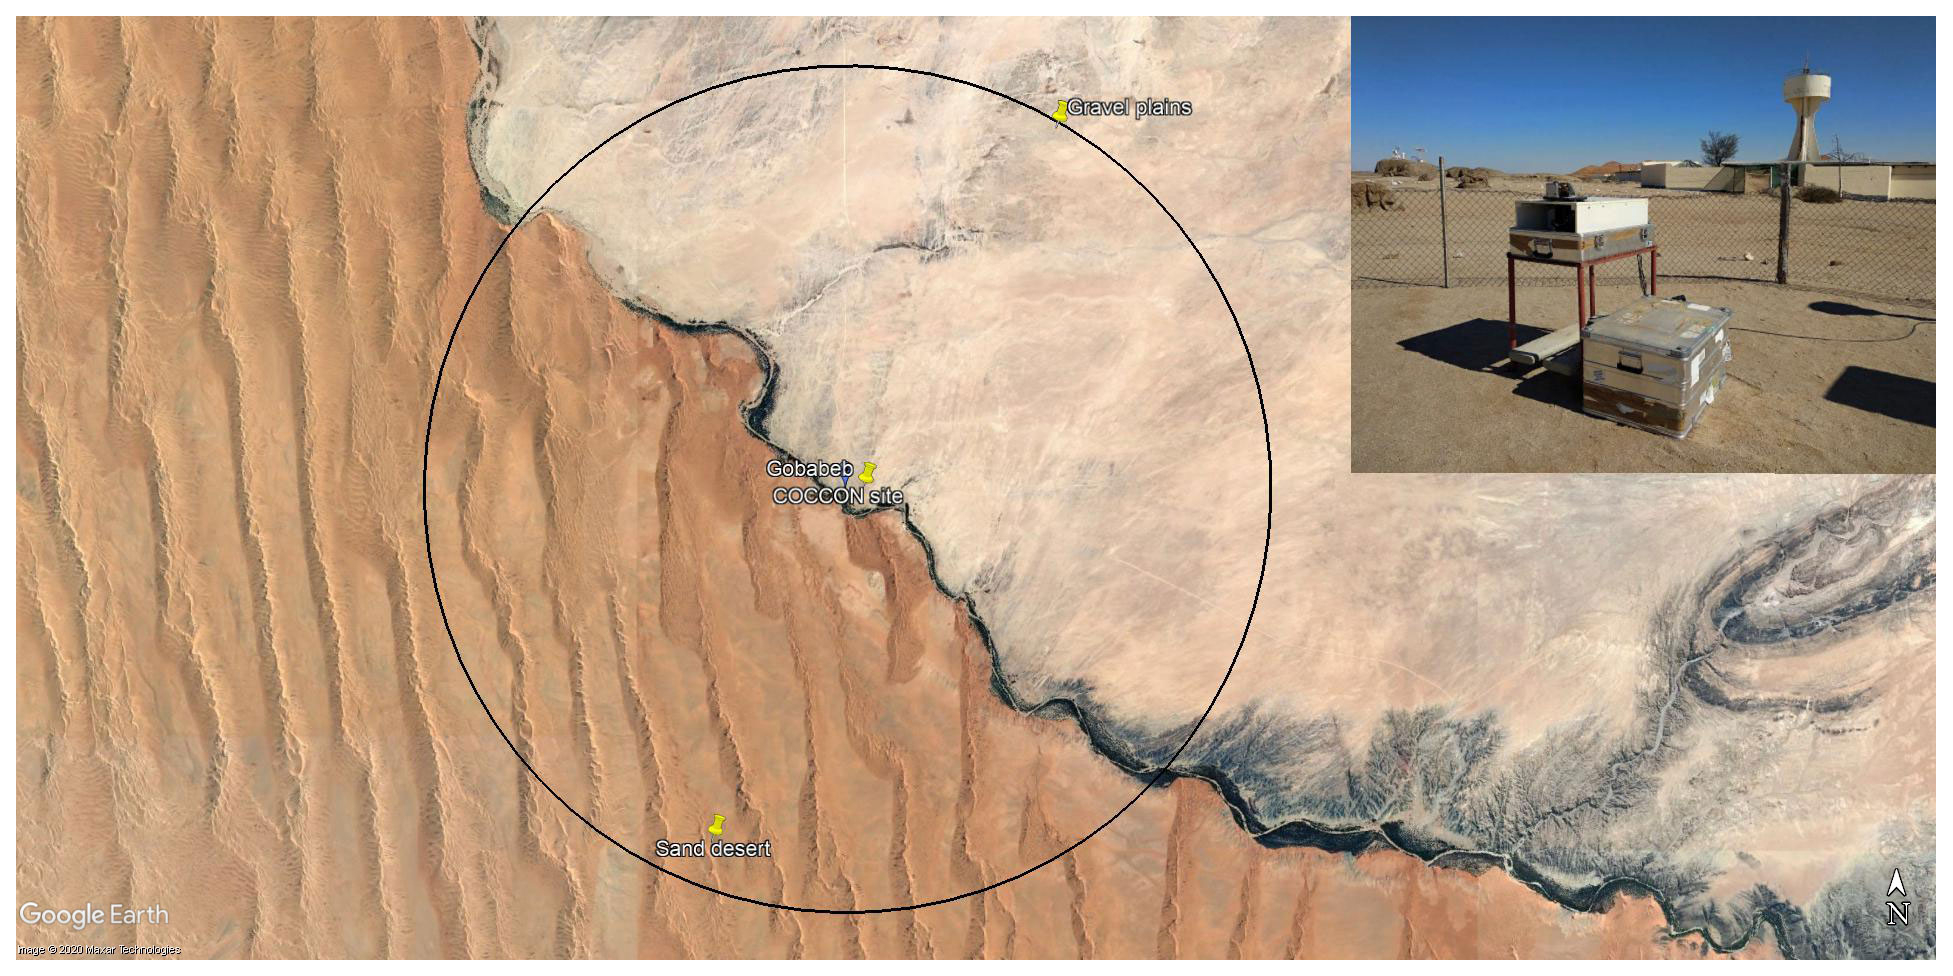
Figure 1© Google Earth image (map data: Google, Maxar technologies) of the measurement site at Gobabeb, Namibia. The blue pin denotes the position of the COCCON instrument. The yellow points show the positions of the GOSAT target observation points. A black circle with a radius of 10 km has been drawn around the COCCON site for visual reference. The inset in the upper right corner shows the EM27/SUN spectrometer at Gobabeb.
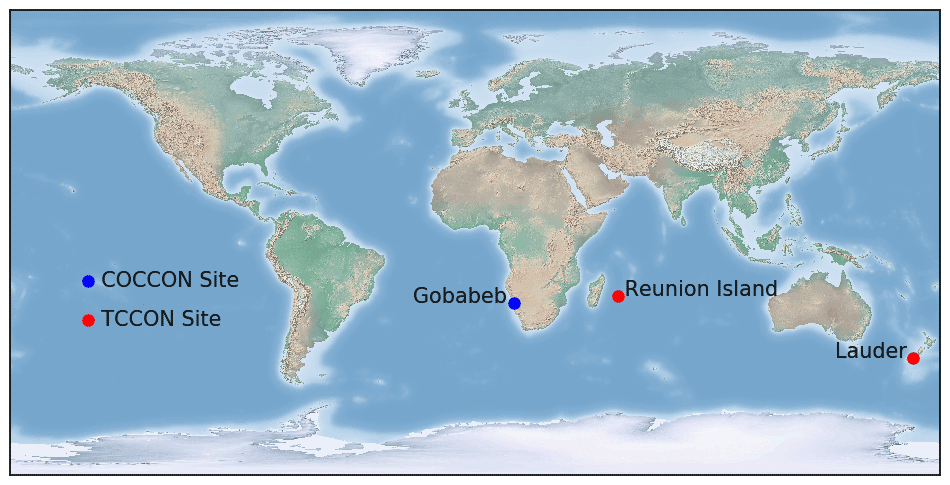
Figure 2Global map showing the COCCON Gobabeb, TCCON Réunion Island and Lauder sites used in this study.
2.2 Description and history of the COCCON spectrometer operated at Gobabeb
The EM27/SUN spectrometer as used by COCCON has been described in great detail in the works of Gisi et al. (2012), Frey et al. (2015) and Hase et al. (2016). As a concise summary, the EM27/SUN is a solar-viewing FTIR spectrometer measuring in the near-infrared spectral range (5500–11 000 cm−1) with a spectral resolution of 0.5 cm−1. One measurement takes 58 s and consists of 10 individual double-sided scans. This allows the retrieval of total column abundances, VCgas, of the target gases O2, CO2, CH4 and H2O. In 2018, the spectrometer used in this study was upgraded in Karlsruhe and a second, extended room temperature (RT) indium, gallium and arsenide (InGaAs) detector (4000–5500 cm−1) was added, allowing the detection of CO. During this service at KIT, the gold coating of the tracker mirrors was found to be degraded and therefore was removed (the mirror substrate is aluminum, so the operation was continued with aluminum mirrors since then). Finally, the mechanical parts of the solar tracker attached to the spectrometer were serviced, as the very fine wind-blown dust particles tend to enter the motor stages during longer operation in the desert.
The retrieved total column abundances of the trace gases are converted into column-averaged dry-air mole fractions (DMFs), where the DMF of a gas is denoted X. Here, both the column amounts of the target gas and O2 are derived from the same spectroscopic observation reducing several potential error sources (Wunch et al., 2010). Furthermore, the dependence on the ground pressure is reduced, improving comparability between different sites. A sensitive measure of the stability of a spectrometer is the column-averaged amount of dry air (Xair) because for Xair there is no compensation of possible instrumental problems, in contrast to Xgas, where errors can partially cancel out. Xair compares the measured oxygen column (VC) with surface pressure measurements (PS):
Here, and denote the molecular masses of dry air and water vapor, respectively, g is the column-averaged gravitational acceleration, and VC is the total column of water vapor. The correction with VC is necessary as the surface pressure instruments measure the pressure of the total air column, including water vapor. Sudden changes in Xair indicate instrumental problems, e.g., errors with the surface pressure, pointing errors, timing errors or changes in the optical alignment of the instrument.
Frey et al. (2019) present a comprehensive characterization for EM27/SUN spectrometers used by the COCCON network, which included the instrument with serial number 51 deployed in Gobabeb. In short, the instrumental line shape (ILS) of the EM27/SUN was optimized and characterized using open-path measurements as described in Frey et al. (2015), using version 14.5 of the LINEFIT retrieval software (Hase et al., 1999). Other detrimental effects, for example, double-passing or channeling, were corrected if found. For more details, see Sect. 4.2 of Frey (2018). After this initial check in December 2014, side-by-side measurements with the reference EM27/SUN and the nearby TCCON instrument were performed on the observation platform of the Institute for Meteorology and Climate Research (IMK-ASF) at the Karlsruhe Institute of Technology (KIT), Campus North (CN) near Karlsruhe (49.100∘ N, 8.439∘ E; 133 m a.s.l.). These measurements took place from November 2015 to March 2016 and once more in 2018 and 2019 in order to trace the results to TCCON (and thereby the WMO scale). This rigorous calibration routine is necessary in order to fulfill the high precision and accuracy requirements for GHG measurements. After the initial alignment check, no realignment was performed during the whole observation period.
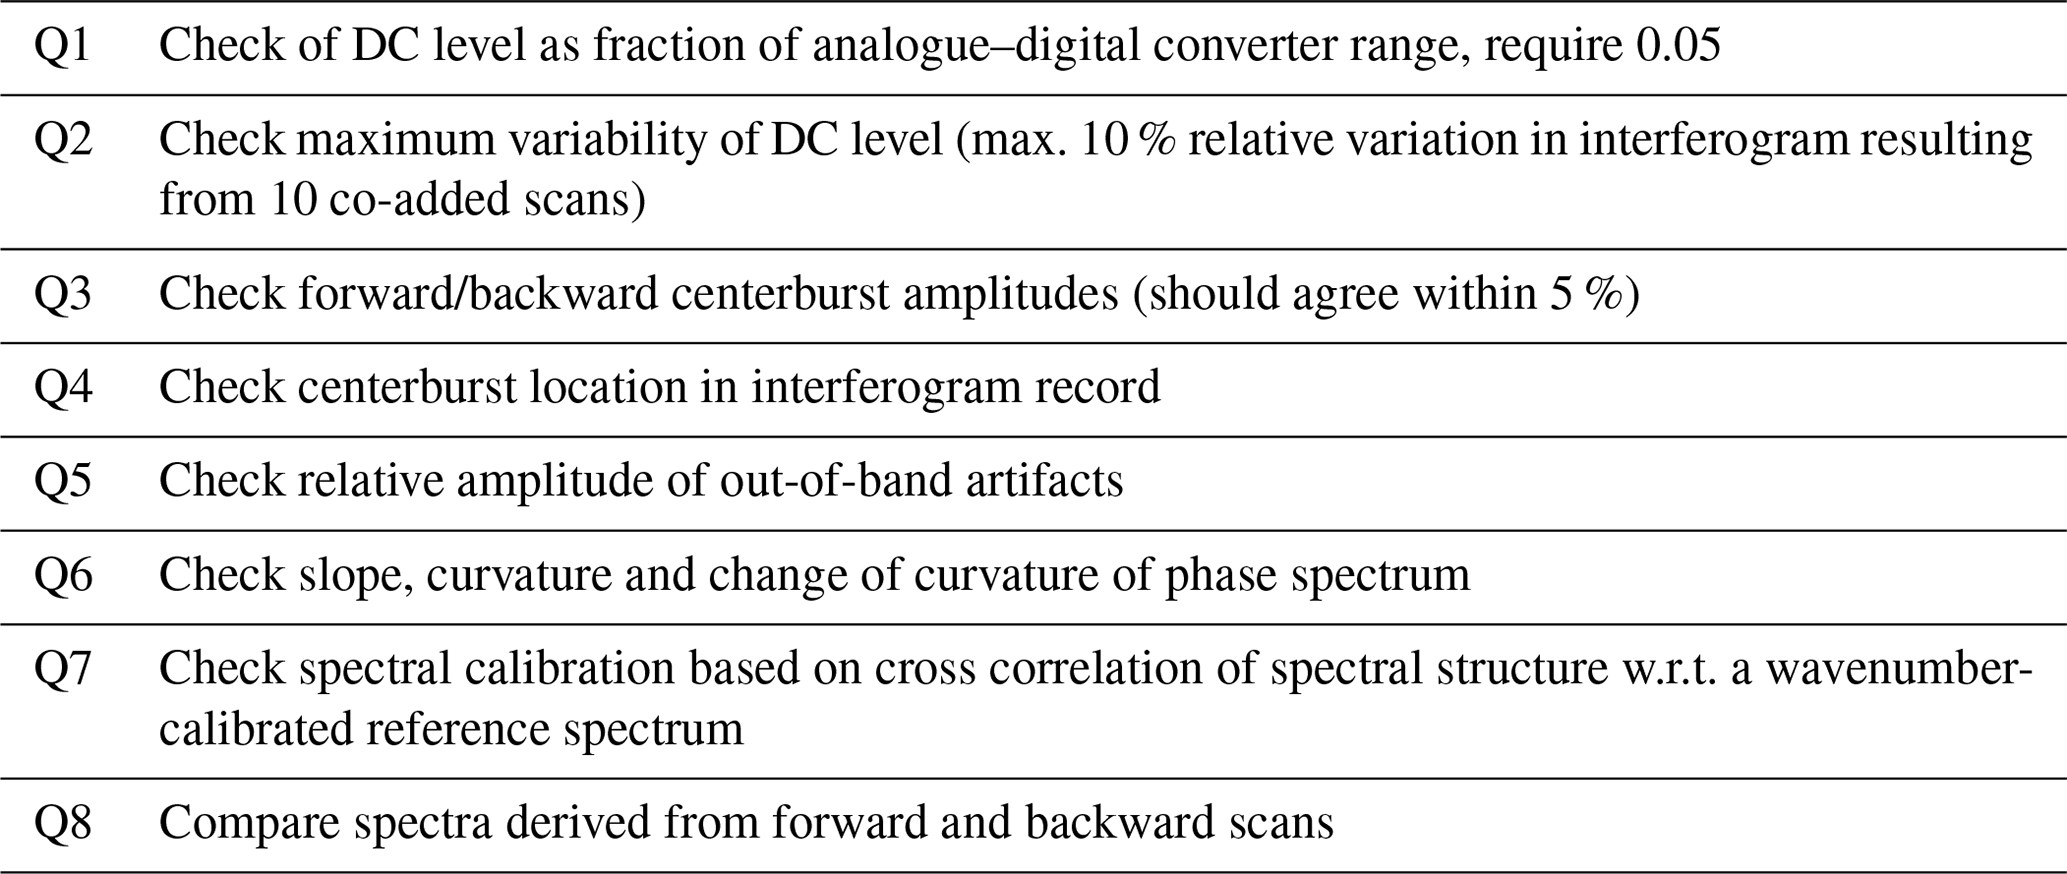
The data analysis is performed differently from Frey et al. (2019). Spectra are generated from the raw interferograms (IFGs) using a FORTRAN 2003 preprocessing tool developed in the framework of the COCCON-PROCEEDS project and extensions (http://www.imk-asf.kit.edu/english/COCCON.php, last access: 30 July 2021) of the European Space Agency (ESA). The IFGs are read from the OPUS file, the solar position is calculated, a correction for direct current (DC) fluctuations following Keppel-Aleks et al. (2007) is performed, the IFGs are truncated to the nominal resolution of 0.5 cm−1, a numerical apodization function is applied, and a fast Fourier transformation including a phase correction routine and resampling scheme is implemented. Several quality filters are applied, for example, requiring a minimum DC level of 5 % of the maximum detector signal level, restricting the tolerable DC variation to 10 % of the measured level, checking the centerburst location in the IFG and the centerburst amplitudes of forward and backward scans and the relative amplitude of out-of-band artifacts. All quality filters are summarized in Table 1.
Table 1This table summarizes the quality filters applied in the FORTRAN-based preprocessing tool.
For the retrieval of the EM27/SUN spectra, we do not use the PROFFIT 9.6 retrieval algorithm (Schneider and Hase, 2009; Kiel et al., 2016; Chen et al., 2016). Here, we use the recently developed non-linear least-squares PROFFAST retrieval algorithm, which fits atmospheric spectra by scaling a priori trace gas profiles. PROFFAST is a source-open code for quantitative trace gas analysis, mainly intended for the use with low-resolution FTIR spectrometers. Particular attention has been paid to achieve high processing speed without compromising the high level of accuracy required in the analysis of column-averaged greenhouse gas abundances. For achieving this goal, several measures are taken: (1) PROFFAST uses daily precalculated and tabulated molecular cross sections derived from line-by-line calculations. (2) Instead of storing the cross sections per discrete layers, the cross sections are expanded as function of solar zenith angle (SZA), which allows downsizing of the lookup tables by a factor of about 5 and accelerating the subsequent calculation of atmospheric spectral transmission as a function of SZA. (3) The process of convolution of the monochromatic spectrum with the instrumental line shape (ILS) is formulated as a two-step procedure; the first step thins the spectral grid before the convolution is performed. (4) The state vector of the previous solution is maintained for fitting the next spectrum, as typically the atmospheric variations from spectrum to spectrum are rather small. This strategy allows reducing the number of required iterations to typically two. (5) PROFFAST provides averaging kernels not for each measurement but as function of a set of SZA values for each measurement day. Evaluation of data quality achieved with a COCCON spectrometer operated in Finland using the PROFFAST data analysis chain has been investigated in the framework of ESA's FRM4GHG project and results are reported by Sha et al. (2020). The analysis of 4 years of Gobabeb data consisting of around 120 000 spectra took about 40 h, which is approximately 30 times faster than the previously used PROFFIT 9.6 retrieval algorithm. In order to be consistent with TCCON, the GGG2014-generated a priori files (Wunch et al., 2015) are used for trace gases as well as for temperature and pressure. The ground pressure was recorded using a MHB-382SD data logger with a pressure accuracy of 3 hPa (> 1000 hPa) or 2 hPa (< 1000 hPa) and a precision of 0.07 hPa. In order to increase the level of accuracy, we calibrate our sensor against a co-located CS 100 pressure sensor from the Southern African Science Service Centre for Climate Change and Adaptive Land Management (SASSCAL) network with a long-term stability better than 0.1 hPa yr−1 and a stated accuracy of 0.5 hPa at 20 ∘C and 1.0 hPa for temperatures between 0 and 40 ∘C. We do not directly use the data from the CS 100 pressure sensor for our analysis as only hourly data are available (http://www.sasscalweathernet.org/weatherstat_infosheet_we.php?loggerid_crit=8893, last access: 7 May 2021).
We use the spectroscopic line lists and retrieval windows as described in Frey et al. (2019). The resulting XCO2 and XCH4 products are bias-corrected with respect to TCCON based on long-term comparisons between COCCON data products analyzed with PROFFAST and official TCCON data products from Karlsruhe (2014–ongoing) and Sodankylä (2017–2019). In the future, it is planned to incorporate comparisons from additional stations to improve the basis of the bias correction. For Xair, a scaling factor of 0.9737 is derived from the long-term observations performed in Karlsruhe and Sodankylä centering the Xair data around 1.
2.3 TCCON Réunion Island and Lauder
Measurement procedures and data analysis at both sites follow TCCON protocol (Wunch et al., 2011) using the GGG2014 software package (Wunch et al., 2015). As required by TCCON, the instrumentation consists of a high-resolution FTIR spectrometer, model BRUKER IFS 125HR, which is routinely operated at a spectral resolution of 0.02 cm−1. The instrument is housed inside a temperature-controlled building. The TCCON station in Réunion Island, France (20.901∘ S, 55.485∘ E; 87 m a.s.l.) is located on the university campus of the Université de La Réunion in St. Denis, approximately 2000 km east of the African mainland. The data are available via De Mazière et al. (2017). The TCCON station in Lauder, New Zealand (45.038∘ S, 169.684∘ E; 370 m a.s.l.), is situated in a sparsely populated environment on the South Island of New Zealand (Pollard et al., 2017). The data are available via Sherlock et al. (2014) and Pollard et al. (2019). In October 2018, a new TCCON instrument was installed at Lauder (Pollard et al., 2021). For this study, we combine the datasets of both spectrometers, and for the overlap period (October 2018), we use the data from the old TCCON instrument.
2.4 GOSAT specific target observations
A detailed description of the GOSAT instrumental features and data analysis is given in Kuze et al. (2009) and Yoshida et al. (2013). GOSAT detects shortwave-infrared radiation in three narrow bands (0.76, 1.6 and 2.0 µm) with a resolution of 0.2 cm−1. Additionally, it is equipped with a sensor measuring in the thermal infrared range. The Thermal And Near infrared Sensor for carbon Observation Fourier transform spectrometer (TANSO-FTS) footprint diameter is about 10.5 km at sea level. The nominal single-scan acquisition time is 4 s. For this study, the GOSAT FTS shortwave infrared (SWIR) level 2 data version V02.81 from NIES is used. The satellite is flying at an altitude of 666 km with a repeat cycle of 3 d. From May 2016, GOSAT performed specific target mode observations over Gobabeb by performing observations at three distinct points (Fig. 1), directly at the Gobabeb COCCON site, approximately 10 km northeast over the gravel plains and around 10 km southwest over the sand desert. These points were chosen because of their different surface reflectance in order to study the sensitivity of the GOSAT retrieval with respect to the surface albedo. The satellite performed measurements with different gain settings: M gain and H gain. M-gain soundings are generally performed over surfaces that are bright in the near infrared. For M-gain observations, other validation sites with ground-based FTIR measurements are sparse. Yoshida et al. (2013) found no suitable TCCON site for the validation of GOSAT M-gain observations. In recent years, GOSAT M-gain soundings are mainly compared to the Edwards TCCON station, which was established 2013. More recently, Velazco et al. (2019) performed a campaign to validate GOSAT in central Australia using an EM27/SUN.
2.5 CAMS global CO2 and CH4 atmospheric inversion products
The CAMS model has been described previously in great detail, e.g., Agustí-Panareda et al. (2014), Massart et al. (2016) and Inness et al. (2019). Here, we utilize the CAMS global inversion-optimized column-averaged DMFs for CO2 and CH4. For CO2, we use an inversion product (FT19r1) (Chevallier, 2020a) assimilating OCO-2 satellite observations (O'Dell et al., 2018; Kiel et al., 2019) as well as an in situ-driven inversion product (v18r3) (Chevallier, 2019). More details can be found in Chevallier et al. (2019) and Chevallier (2020b). For CH4, an inversion product v18r1s assimilating a combination of surface and GOSAT satellite observations (Detmers and Hasekamp, 2016) as well as one product v18r1s using only surface observations are analyzed (Segers and Houweling, 2020a). A description of the inversion procedure together with comparisons against independent observational datasets is given in Segers and Houweling (2020b).
3.1 Side-by-side measurements at Karlsruhe
ILS measurements were carried out seven times since December 2014. This is depicted in Fig. 3. The modulation efficiency (ME) at maximum optical path difference (MOPD) ranges between 0.979 and 0.986 with a mean value of 0.983 and a standard deviation of 0.002. The mean phase error is 0.0019 ± 0.0003. No drift is apparent and the ILS is stable. The spread in the ME is in good agreement with the error budget of 0.003 given in Frey et al. (2019). This high instrumental stability is remarkable considering that between measurements the EM27/SUN was shipped from Karlsruhe to Gobabeb, including airlift and transport by car on bumpy gravel roads.
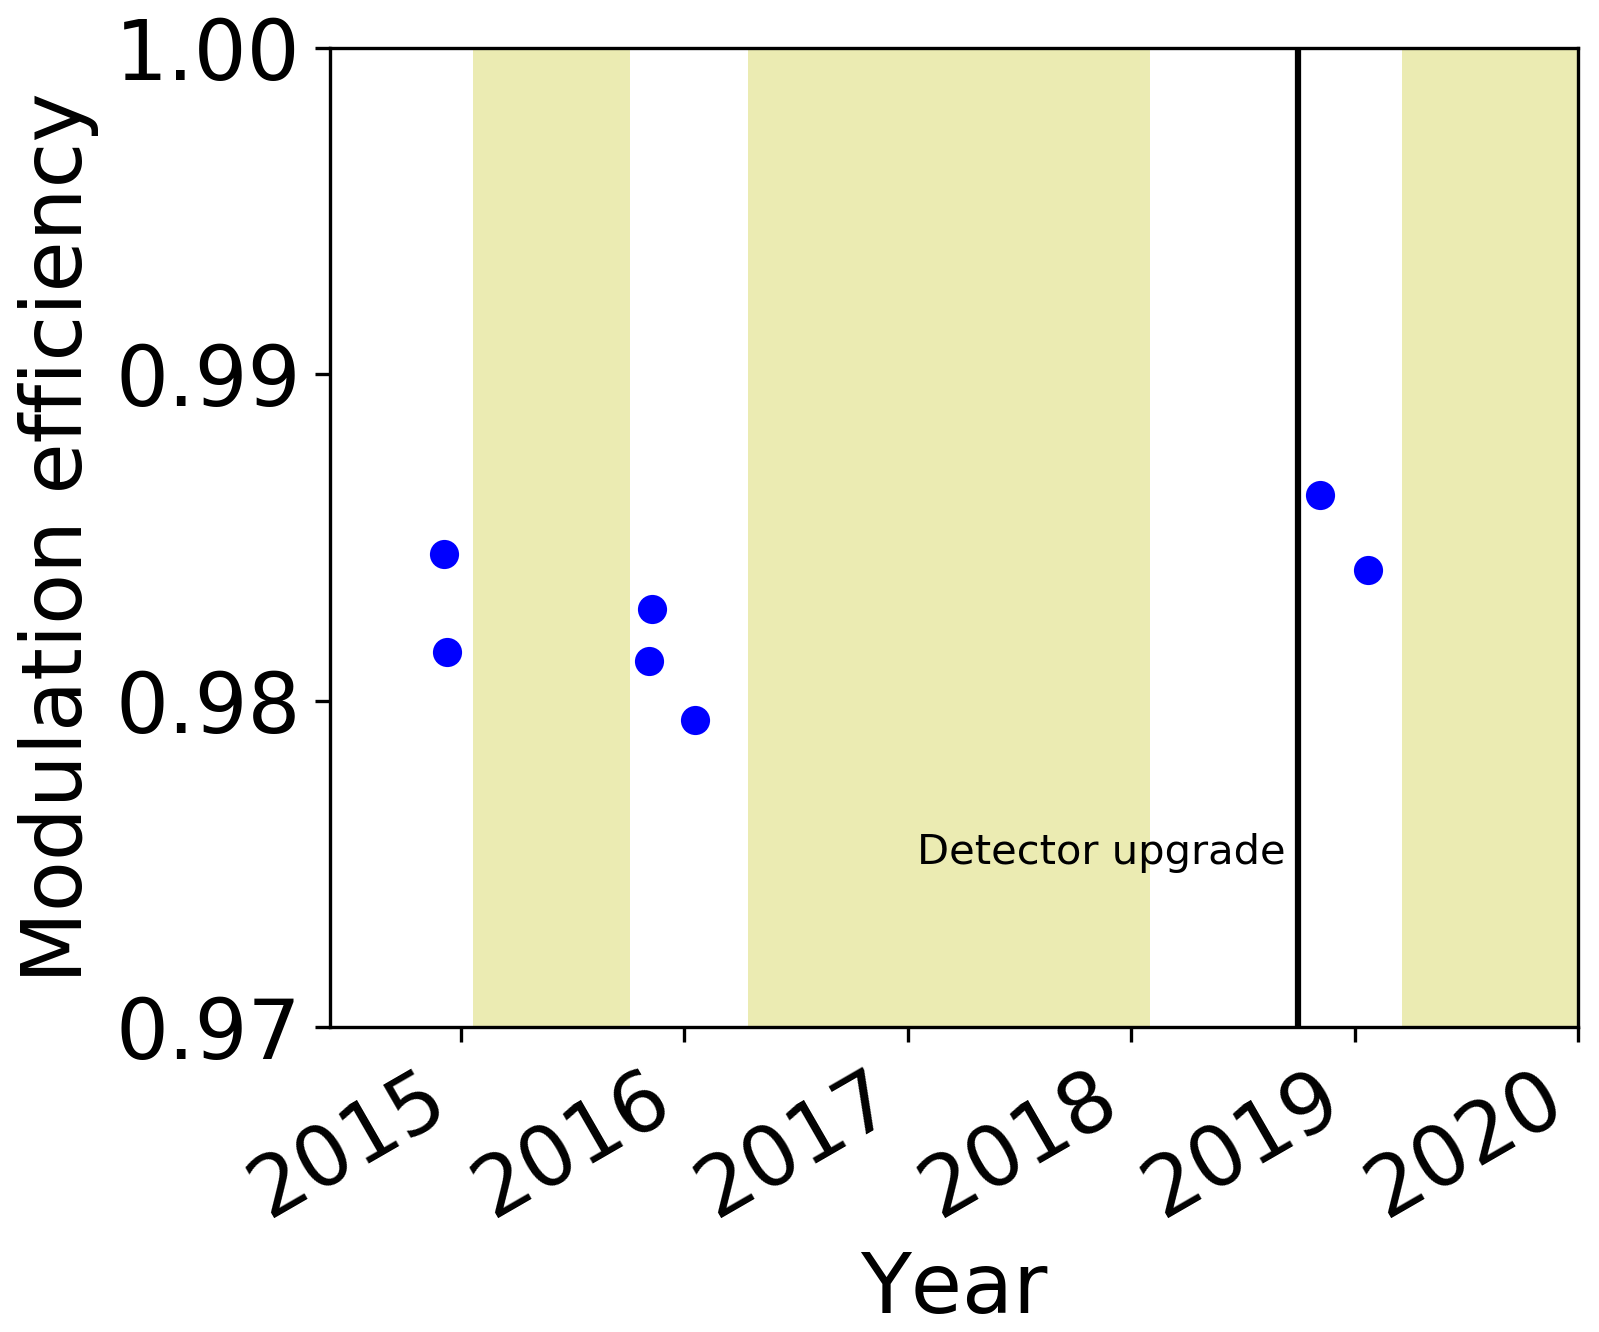
Figure 3Time series of the modulation efficiency at MOPD of the EM27/SUN used in this study. ILS measurements were performed during periods when the instrument was in Karlsruhe for maintenance or detector upgrade. Yellow areas denote measurement periods in Gobabeb. The black bar denotes the time of the detector upgrade.

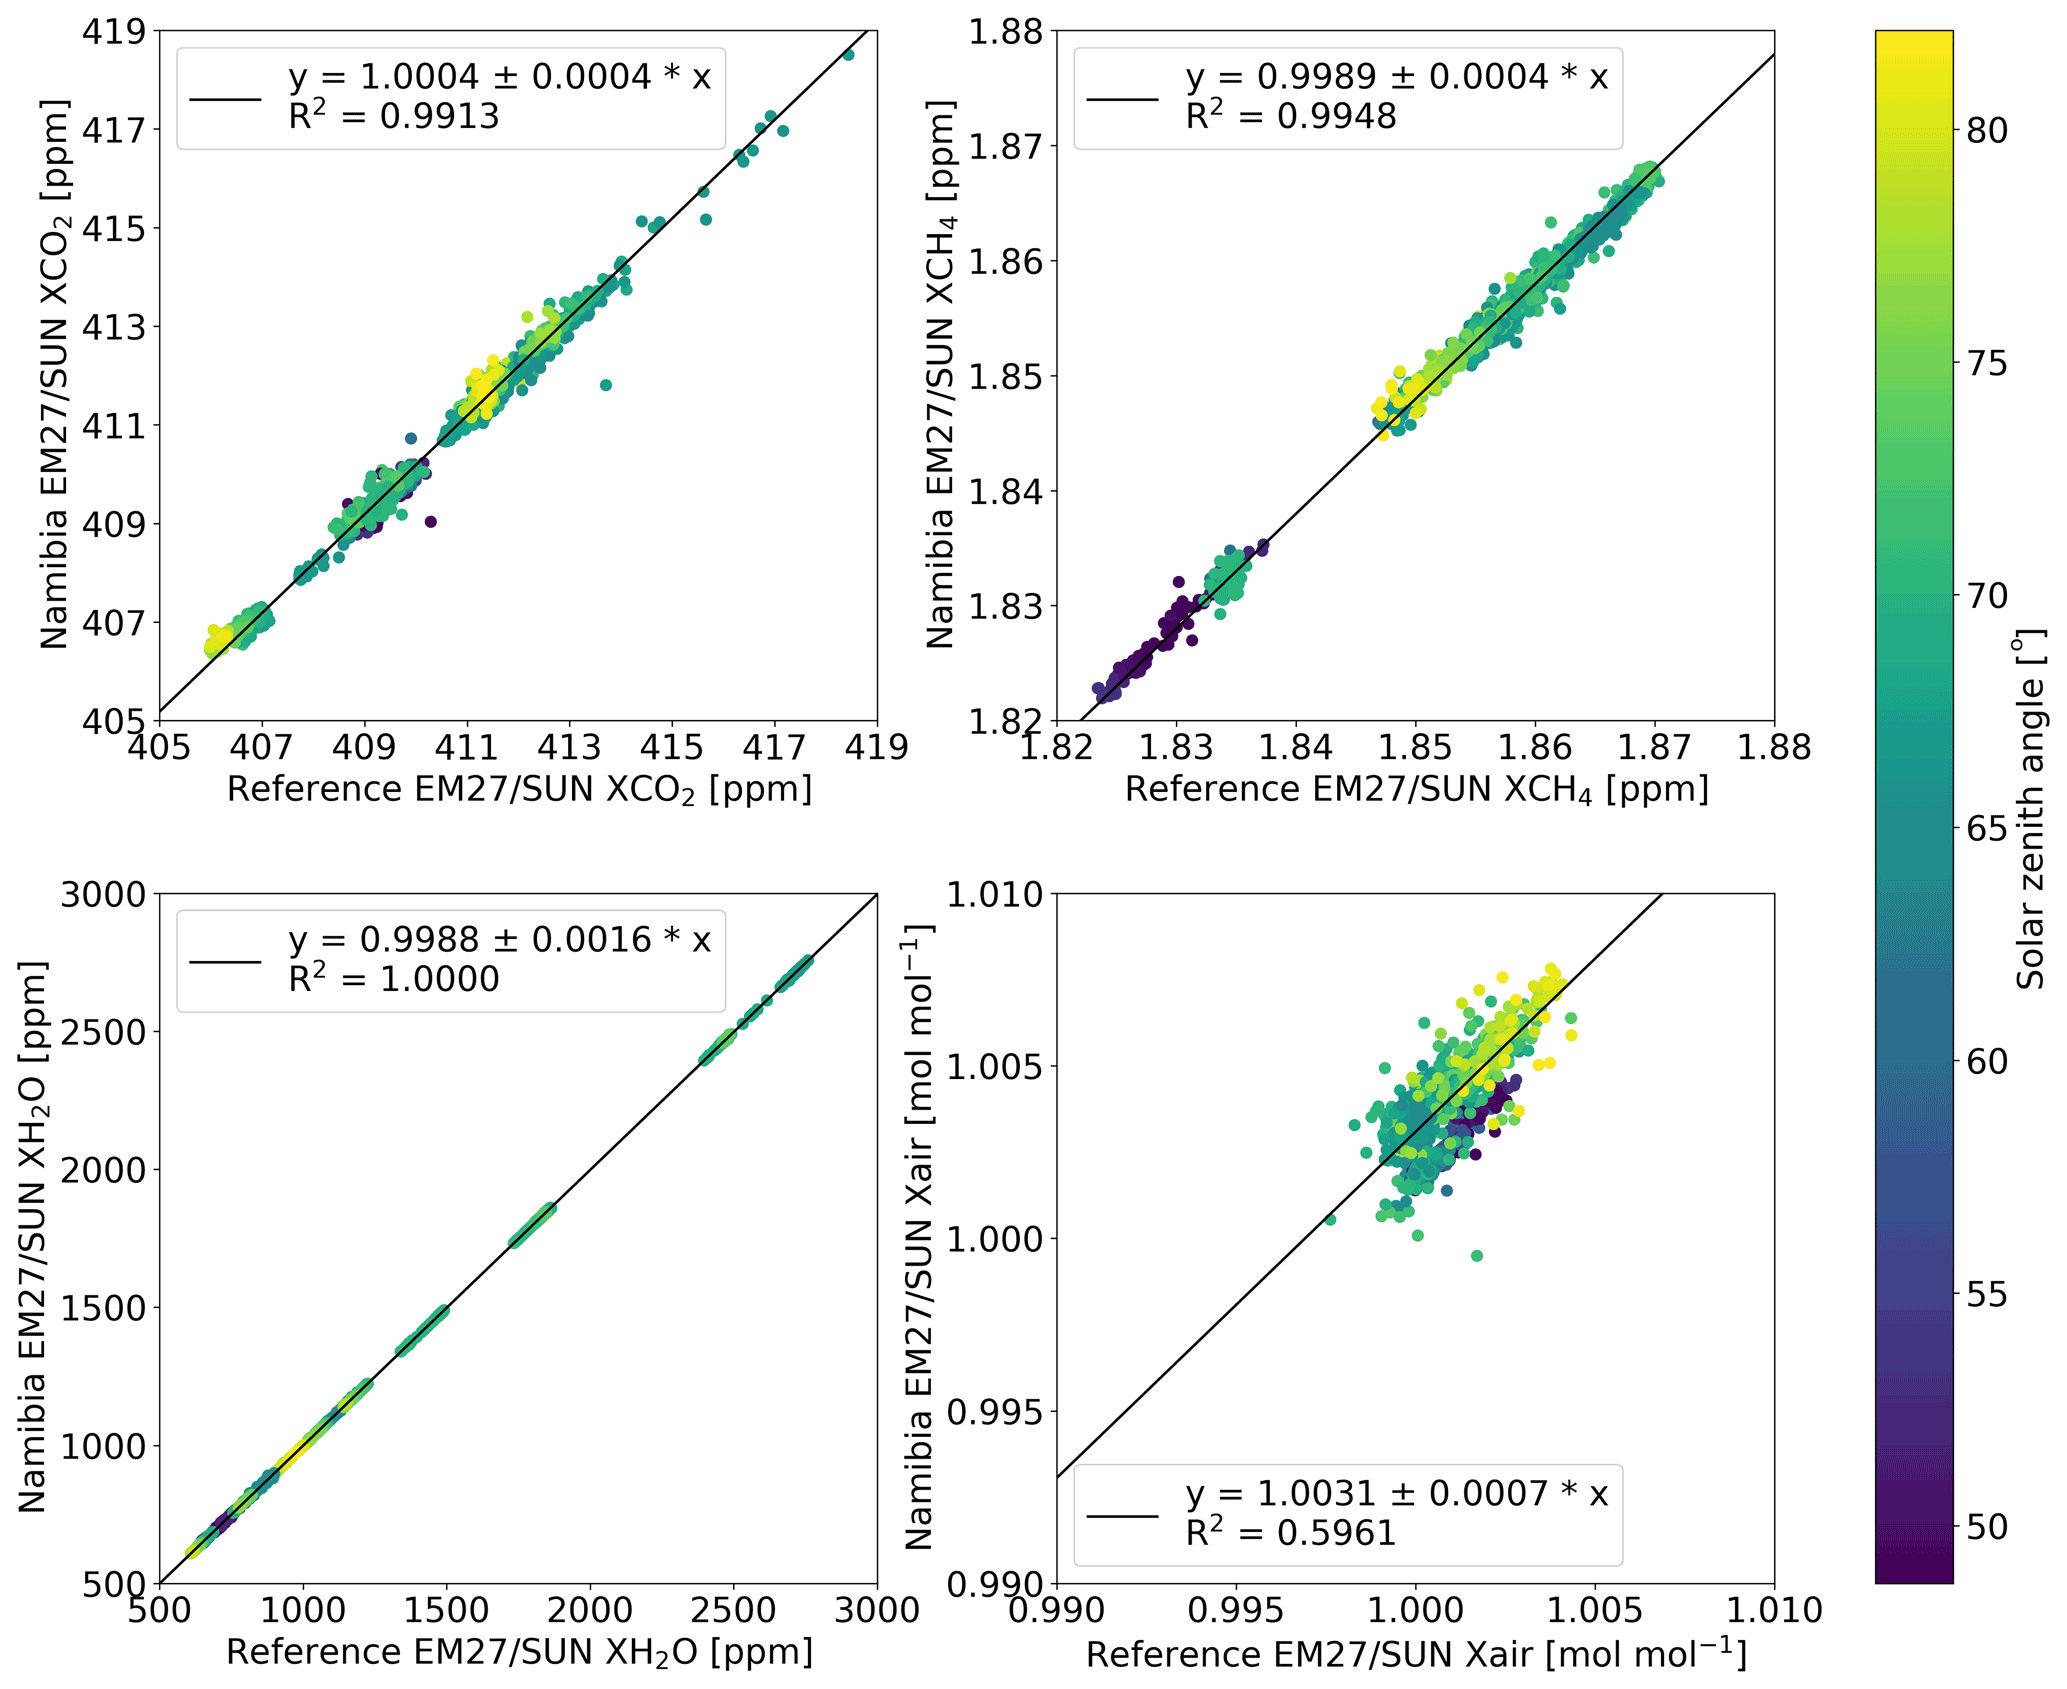
Figure 4Side-by-side measurements between the reference EM27/SUN and the instrument deployed in Namibia performed between November 2015 and March 2016 in Karlsruhe. From left to right, the panels show correlation plots for XCO2 (a), XCH4 (b), XH2O (c) and Xair (d). The coincident criterion is that measurements for both instruments occurred within 1 min. The color bar denotes the solar zenith angle. For the analysis, only measurements with zenith angles below 85∘ are considered.
Between November 2015 and March 2016, side-by-side comparison measurements with the reference EM27/SUN were conducted on 8 d to derive calibration factors for the different trace gases for this spectrometer and thereby removing possible instrument-dependent biases. Some data had to be filtered out for different reasons. Because most measurements were performed during winter, the solar elevation was low, which sometimes led to a partially obstructed view due to railings and a metal frame on the terrace where the observations took place. In the morning, the first measurements were omitted due to unusually high scatter caused by the quickly changing temperature of the helium–neon (HeNe) laser, which is not frequency stabilized as already reported by Gisi et al. (2012). In rare cases, the tracking software failed, resulting in corrupted spectra that were also filtered out. For this analysis, only observations from the two instruments performed within 1 min and SZAs below 85∘ are taken into account, resulting in 1209 coincident measurements. The results are shown in Fig. 4. The derived instrument-specific calibration factors are 1.0002 ± 0.0003 for XCO2, 1.0005 ± 0.0004 for XCH4, 1.0011 ± 0.0029 for XH2O and 0.9995 ± 0.0005 Xair between the reference instrument and the instrument deployed in Namibia. Although the scaling factors are close to nominal for all species, to avoid biases due to instrumental differences, these calibration factors are taken into account in the analysis of the Namibia dataset.
Additional side-by-side measurements were performed in February and March 2018 after the instrument came back from Namibia as well as between November 2018 and February 2019 after the dual-channel upgrade and mirror exchange. The combined results are shown in Appendix A. A slight variation in the calibration factors is detectable; for XCH4 and Xair, the change is significant at the 1σ level. The numeric values for the scaling factors are 1.0004 ± 0.0004 for XCO2, 0.9989 ± 0.0004 for XCH4, 0.9988 ± 0.0016 for XH2O and 1.0031 ± 0.0007 for Xair. For the period between November 2018 and February 2019, we also derive a calibration factor of 0.9940 ± 0.0050 for XCO. As the bias between the calibration factors obtained during the two side-by-side measurement periods is within 0.1 ppm for XCO2, 3 ppb for XCH4 and 3 ppm for XH2O, for the analysis of the Namibia data, we will only use the mean calibration factors derived from these observation periods.
In order to investigate if the difference in the calibration factors is linked to the upgrade of the EM27/SUN in 2018, we average the ME at MOPD obtained from the ILS measurements before (0.982) and after (0.985) the upgrade. The ME increased by 0.3 %, which is within the uncertainty budget of 0.3 % using this method. Therefore, we conclude that the changes in the instrumental line shape due to the upgrade of the COCCON instrument might contribute to the slightly different scaling factors, but they are not the main reason for the changes.
3.2 Gobabeb Xgas time series
For the subsequent analysis, only observations with SZAs not exceeding 80∘ are taken into account, resulting in 113 049 individual measurements on 319 d between 2015 and 2019. In Fig. 5, we present the XCO2, XCH4, XCO, XH2O and Xair retrieval results from the COCCON Gobabeb observations. For better visibility, daily mean values are shown. Error bars denote the 1σ standard deviation of the daily mean values. Between February and May 2015, no measurements could be performed due to software problems. In October 2015, the spectrometer was shipped back to Karlsruhe due to customs requirements. Observations in Gobabeb were continued from April 2016. In February 2018, the spectrometer was shipped to Karlsruhe for the dual-channel upgrade. COCCON measurements were restarted in March 2019.
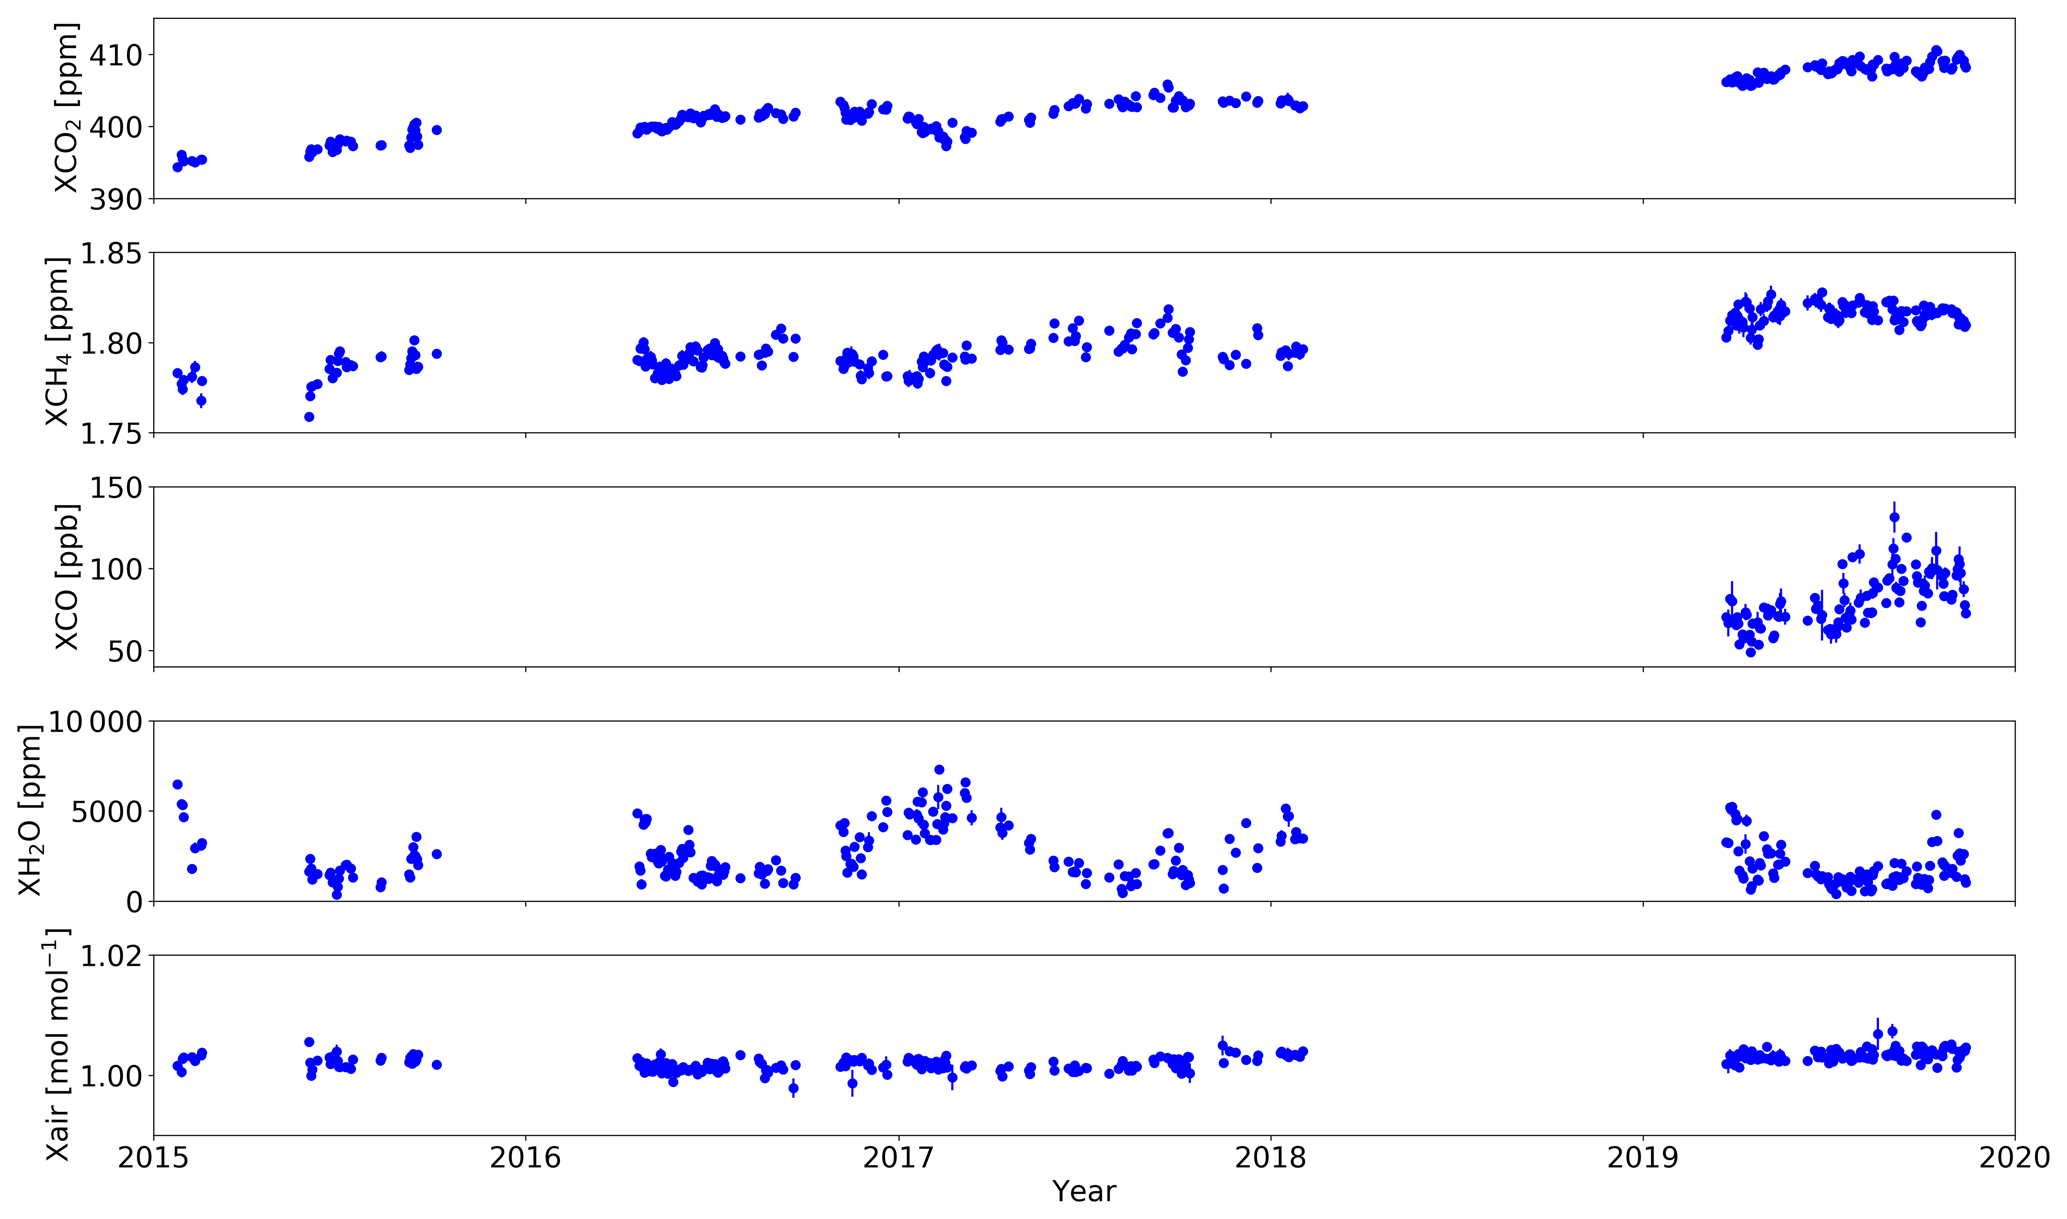
Figure 5Column-averaged dry-air mole fraction time series for XCO2, XCH4, XCO, XH2O and Xair measured at the COCCON site in Gobabeb, Namibia, from January 2015 until November 2019. Daily mean values are shown for better visibility. Error bars denote the 1σ standard deviation of the daily mean values. In 2018, the instrument was upgraded with a second channel. Therefore, XCO observations only started in 2019.
For XCO2, the underlying trend of about 2 ppm yr−1 can be seen. Correspondingly, a daily minimum value was observed at the beginning of the measurements on 24 January 2015 with 394.3 ± 0.2 ppm and the maximum daily value was observed on 15 October 2019 (410.6 ± 0.2 ppm). A seasonal cycle is also detectable, with a peak-to-peak amplitude of 5.3 ppm in 2017. Here, it is calculated as the difference between the maximum monthly mean of 404.0 ± 1.1 ppm in September and the minimum monthly mean of 398.0 ± 0.5 in March. This amplitude is higher than observed in other Southern Hemisphere TCCON stations in Australia and New Zealand (Deutscher et al., 2014), owing to a rather sharp drawdown of XCO2 in February and March 2017. However, this is probably a real signal as the impact of the biosphere in Africa might lead to a larger seasonal cycle in Gobabeb. Also Olsen and Randerson predict a rather prominent XCO2 seasonal cycle on the order of 5 ppm in southern Africa; see Fig. 5 of Olsen and Randerson (2004). For XCH4, daily mean values range between 1759 ± 1 ppb (2 June 2015) and 1828 ± 1 ppb (25 June 2019). The trend is roughly 0.01 ppm yr−1. The XCH4 seasonal cycle has lowest values in southern hemispheric summer (January 2017: 1783 ± 5 ppb) and highest values throughout winter and early spring (September 2017: 1808 ± 5 ppb) resulting in a peak-to-peak amplitude of 25 ppb. Regarding XCO, the time series is limited to 2019 due to the fact that the dual-channel upgrade was only performed in 2018. At this point, it can already be seen that this site observes highly variable amounts of carbon monoxide, ranging from very clean background conditions with daily mean XCO values as low as 49 ± 1 ppb (16 April 2019) to elevated results of up to 131 ± 9 ppb (4 September 2019). XH2O is very low during large parts of the year, as expected for a desert site. The lowest value was reached on 29 June 2015 (357 ± 10 ppm). During late southern hemispheric summer and early spring, XH2O can reach up to several thousand ppm. As mentioned in Sect. 2.2, Xair is an important parameter to monitor the instrumental stability. For the whole time series, daily Xair results are stable within 1 %. No apparent drift of Xair is visible during the four years of measurements performed at the COCCON Gobabeb station.
4.1 TCCON Réunion Island and Lauder
In this section, we compare the results obtained in Gobabeb with results from the TCCON stations at Réunion Island and Lauder. Although this is not a side-by-side comparison, Réunion Island as the second closest TCCON station is approximately 4000 km east of Gobabeb; this comparison will give us a measure of the feasibility of our results. The observations should be comparable qualitatively as the variation of XCO2 is relatively low in the Southern Hemisphere compared to the Northern Hemisphere (Olsen and Randerson, 2004). Moreover, Gobabeb (24∘ S) and Réunion Island (21∘ S) are at roughly the same latitude. The TCCON Ascension Island station is slightly closer to Gobabeb with a distance of approximately 3600 km, but the latitudinal difference is larger. Due to the latitudinal gradient in XCH4, we chose to compare our COCCON measurements to Réunion Island rather than Ascension Island. Lauder is the southernmost TCCON station and functions as a background site without a pronounced XCO2 seasonal cycle.

Figure 6Column-averaged dry-air mole fraction daily mean time series for XCO2, XCH4, XCO and XH2O measured at the COCCON site in Gobabeb, Namibia (blue dots), and at the TCCON sites Réunion Island (black dots) and Lauder (red dots). Error bars denote the 1σ standard deviation of the daily mean values. Additionally, the difference XCO2, XCH4, XCO and XH2O time series between Gobabeb and Réunion Island (black dots) and between Gobabeb and Lauder (red dots) are shown in separate panels.
Daily mean XCO2, XCH4, XCO and XH2O results are shown in Fig. 6 from COCCON Gobabeb (blue dots), TCCON Réunion Island (black dots) and TCCON Lauder (red dots) stations. Error bars denote the 1σ standard deviation of the daily mean values. Difference time series between the stations are shown in separate panels. For XCO2, we see a good agreement between the sites, given the fact that they are spatially far apart. The annual increase of XCO2 is similar for all stations. For Réunion Island and Lauder, no pronounced seasonal cycle is visible. The most prominent difference is the sharp decrease of XCO2 at Gobabeb beginning of 2017, most pronounced in March. This is not seen for the TCCON data at the two other sites. There is no conspicuous change in Xair during this period for the COCCON instrument, and the other gases do not deviate. We therefore do not think that instrumental issues are the cause of the difference. As discussed in the previous section, this difference is probably due to the impact of the African biosphere on the measurements in Gobabeb. To a smaller extent, this difference can also be seen at the beginning of 2018. Despite the similarities, it can also be seen that the Réunion Island values at the beginning of 2018 and then at the end of 2019 somewhat diverge from the Gobabeb and Lauder values. XCH4 at the Gobabeb and Réunion Island sites is similar, with lower absolute values at Lauder. The annual increase and the seasonal variability are similar at all sites. Unlike XCO2, there is no conspicuous difference between the datasets at the beginning of 2017. For XCO, the sites do not have a long observation overlap; it seems that the variability is slightly larger in the COCCON data. Regarding XH2O, the seasonality is similar between the sites, with highest values at Réunion Island throughout the year.
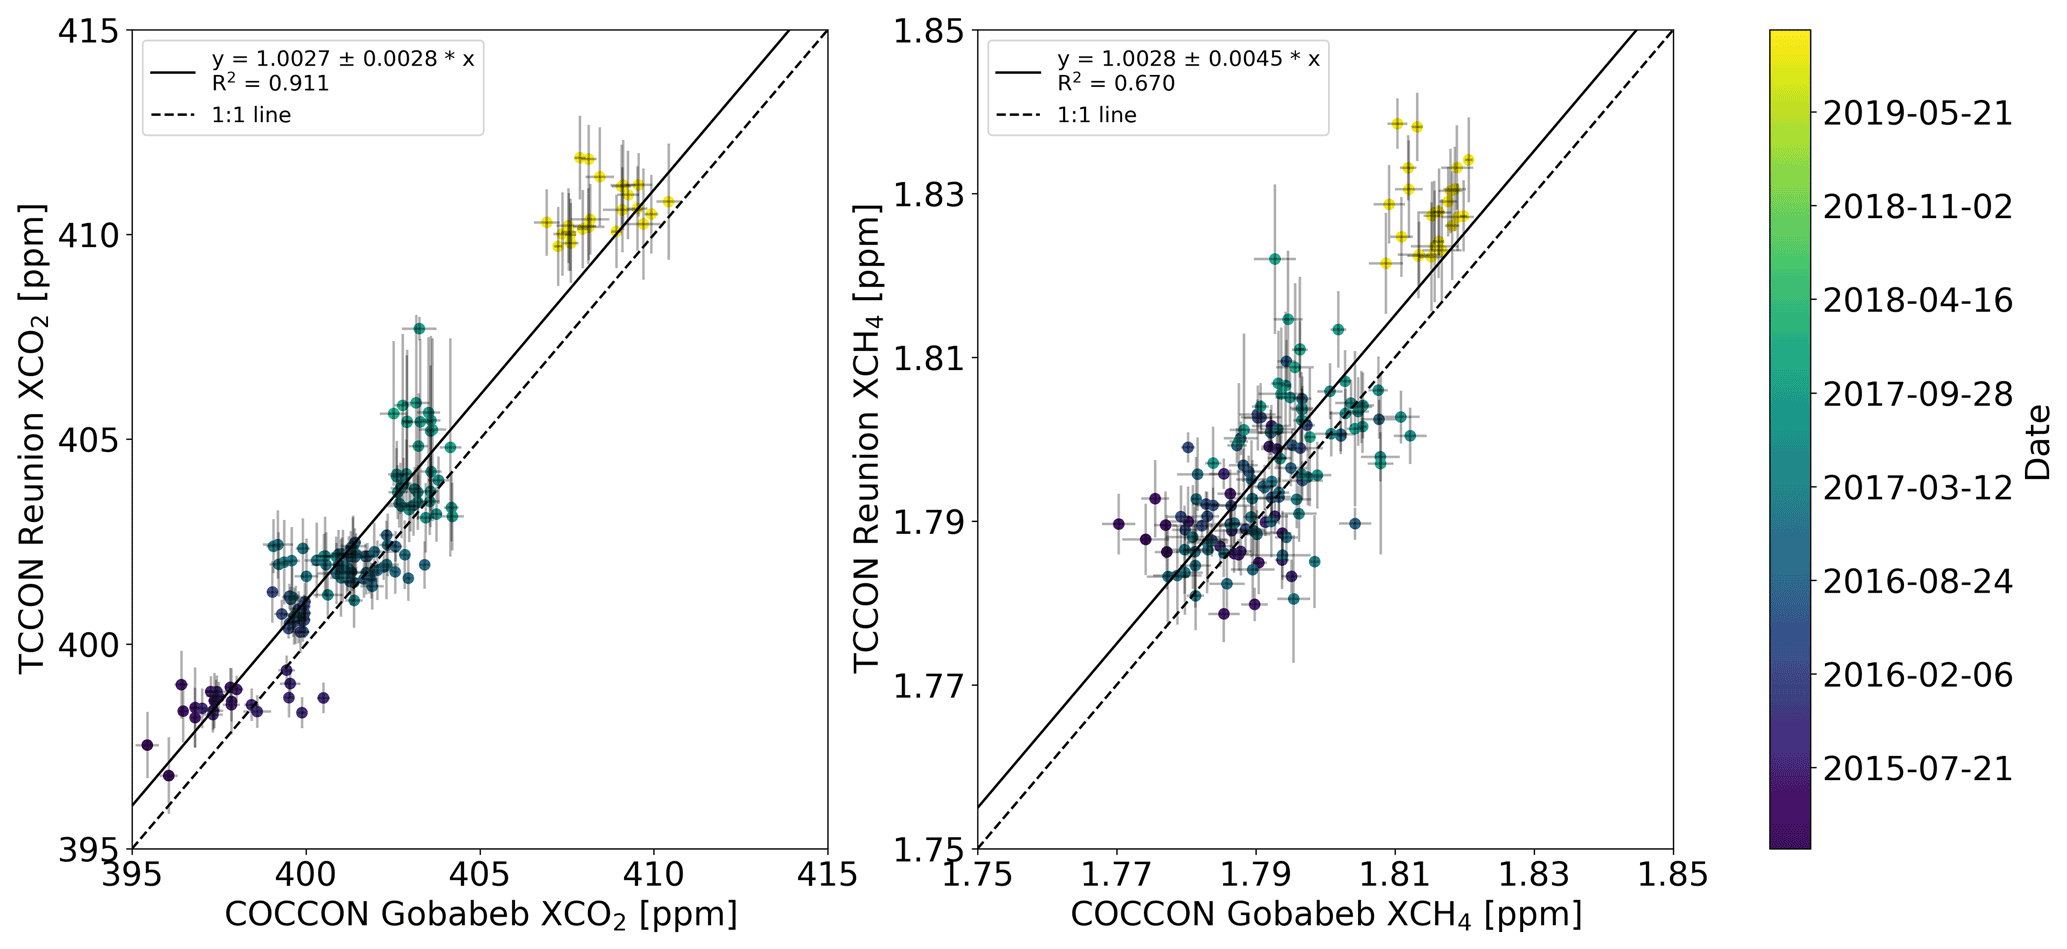
Figure 7Correlation plots between the COCCON Gobabeb and TCCON Réunion Island stations for XCO2 and XCH4 from 2015 to 2019. Shown are daily mean values; error bars denote the 1σ standard deviation. The color bar denotes the date of the measurement.
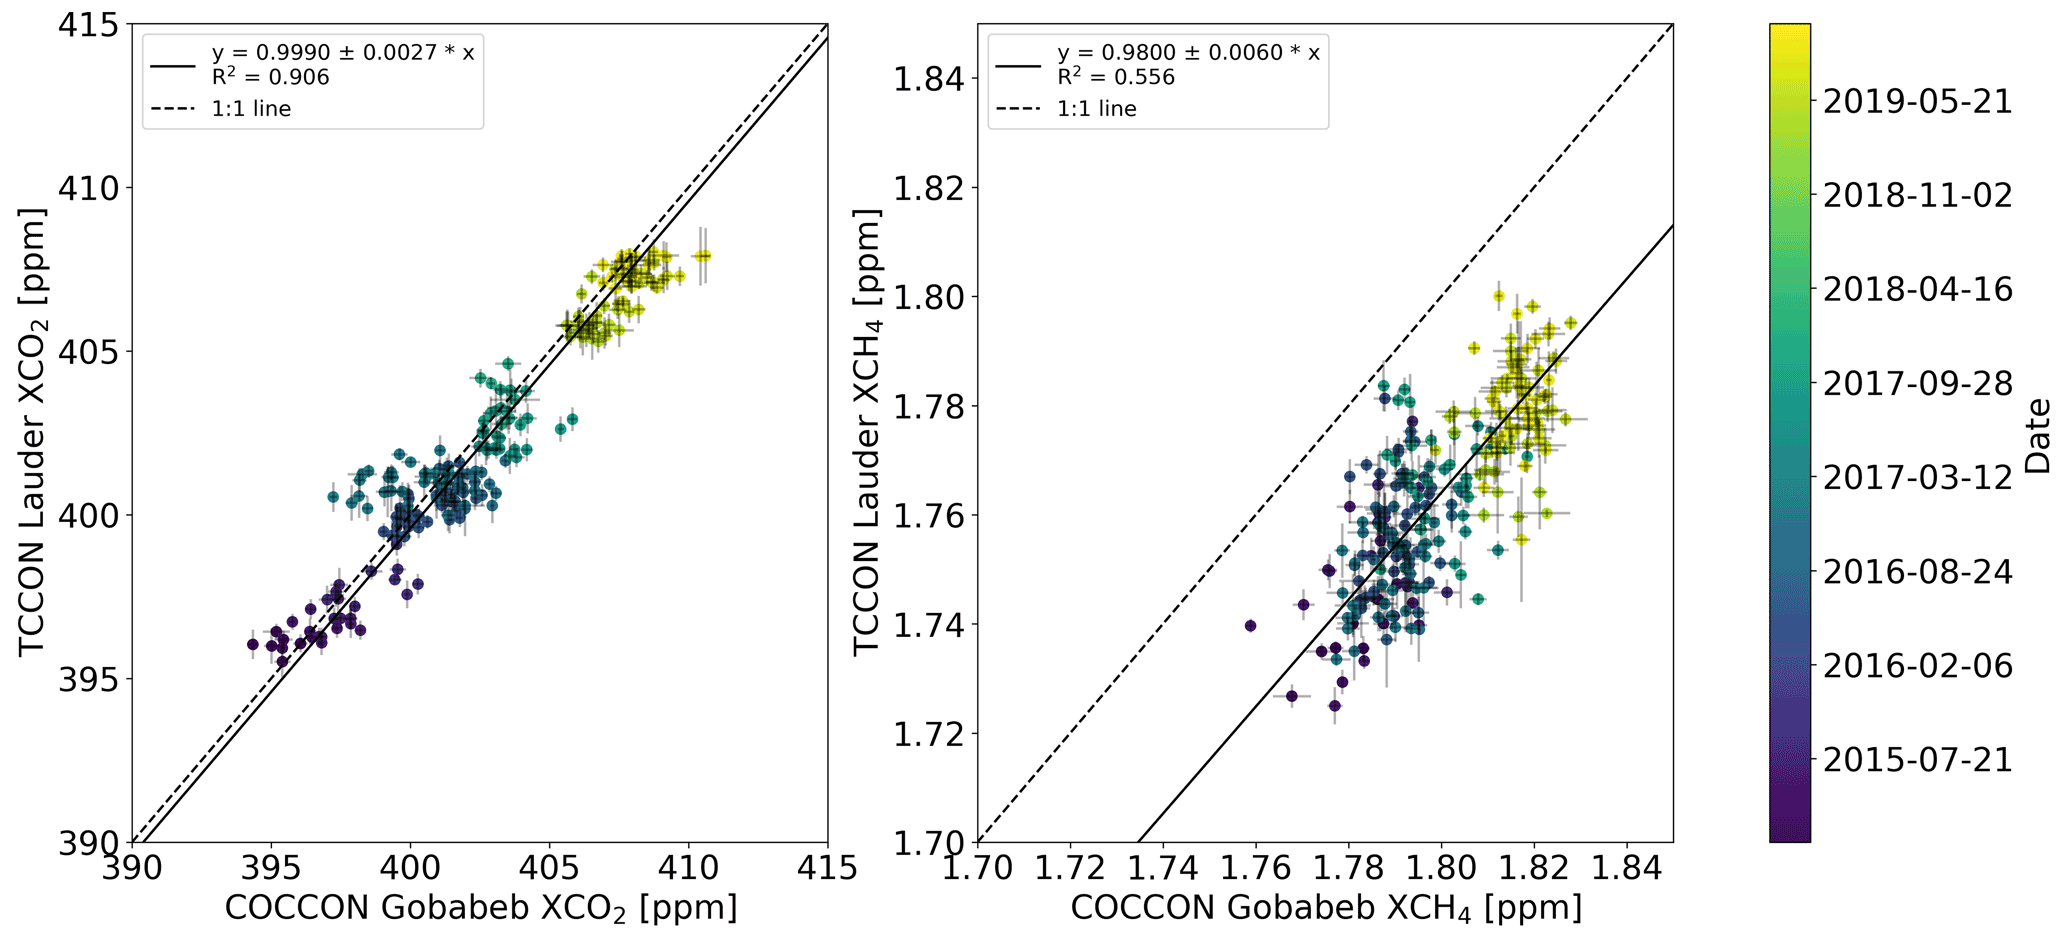
Figure 8Correlation plots between the COCCON Gobabeb and TCCON Lauder stations for XCO2 and XCH4 from 2015 to 2019. Shown are daily mean values; error bars denote the 1σ standard deviation. The color bar denotes the date of the measurement.
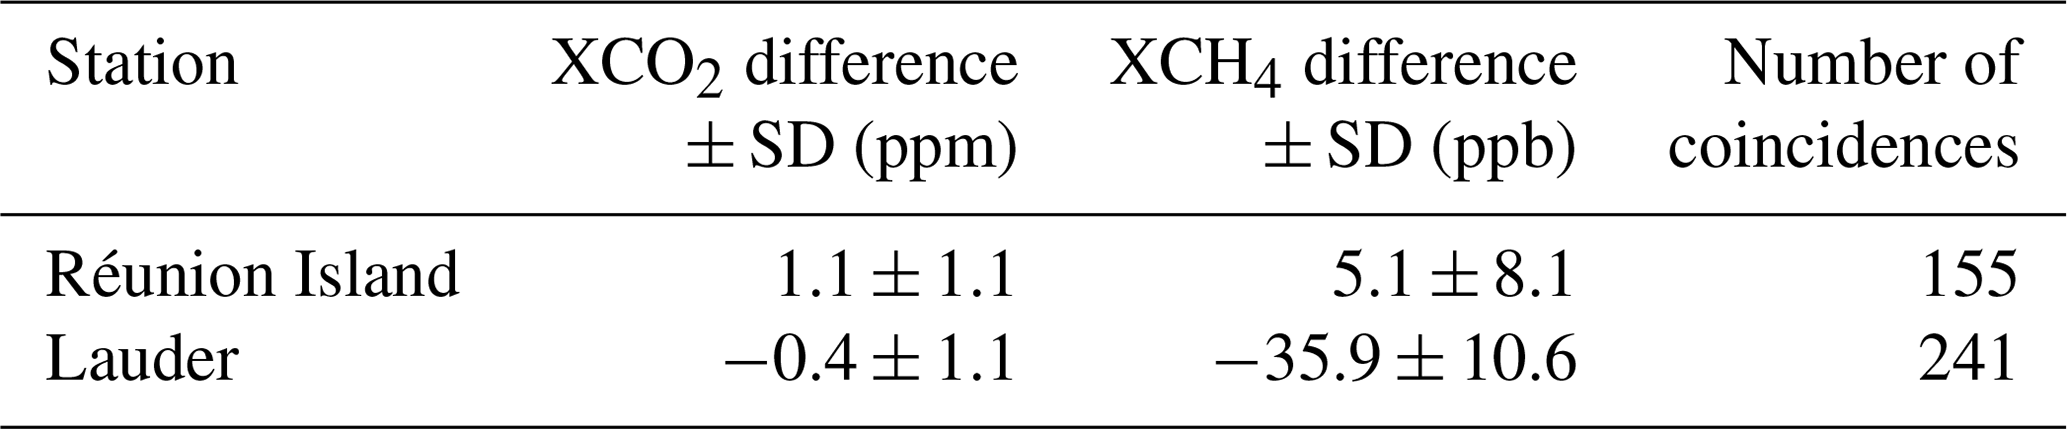
In a next step, we show correlation plots for the COCCON site with respect to the TCCON sites for XCO2 and XCH4 in Figs. 7 and 8. Error bars denote the 1σ standard deviation (SD) of the daily mean values. The color bar denotes the measurement date. Focusing first on the comparison between Gobabeb and Réunion Island in Fig. 7, we find an agreement within 1 standard deviation of the averaged daily mean values for both gases. For XCO2, a scaling factor of 1.0027 ± 0.0028 and a correlation coefficient R2 of 0.911 are derived. For XCH4, the scaling factor is 1.0028 ± 0.0045 and R2 of 0.670. Bias and SD in absolute values are given in Table 2. Despite this good agreement, especially for XCO2, there is some divergence between the data before and after 2018, corresponding to larger scatter in the TCCON Réunion Island dataset, as can be seen by the larger error bars for the 2018 and 2019 data. For 2018, the reason for the increased scatter was continued mirror degradation as a result of sea salt deposition from the ocean. In Fig. 8, we see an excellent agreement between the COCCON Gobabeb and TCCON Lauder data for XCO2 with a scaling factor of 0.9990 ± 0.0027 and a correlation coefficient R2 of 0.906. The only discernible anomaly are the lower COCCON values beginning of 2017, which is also seen in the time series in Fig. 6. Otherwise, no temporal drift between the two datasets is apparent. For XCH4, a scaling factor of 0.9800 ± 0.0060 with R2 = 0.556 is found. The large bias is to be expected due to the latitudinal gradient in atmospheric methane concentrations (Saeki et al., 2013).
Table 2This table presents the results of the comparison between the COCCON station in Gobabeb and the TCCON stations in Lauder and Réunion Island. Difference and SD are given as the mean difference and 1 standard deviation between the coincident daily TCCON and COCCON XCO2 and XCH4 values.
4.2 GOSAT validation
In this section, we validate specific target mode observations from the GOSAT satellite around Gobabeb at three distinct points with different surface albedo properties against COCCON Gobabeb observations. Target mode measurements started in 2016 and are ongoing. The time series of the GOSAT observations is shown in Fig. 9. Measurements over the gravel plains are displayed in red, observations directly at Gobabeb are in black, and measurements over the sand desert are presented in gold, with 59, 78 and 85 successful observations, respectively. In general, the agreement between GOSAT observations and COCCON measurements is reasonable, GOSAT data seem to be slightly biased high both in XCO2 and XCH4. An interesting anomaly is observed in the GOSAT data, there seems to be a small decrease both in XCO2 and XCH4 during southern hemispheric winter, which is not observed by the COCCON instrument. However, for a rigorous assessment, the data are too sparse. An additional difference is that the drawdown of XCO2 values at the beginning of 2017 is more pronounced for COCCON compared to the satellite data.
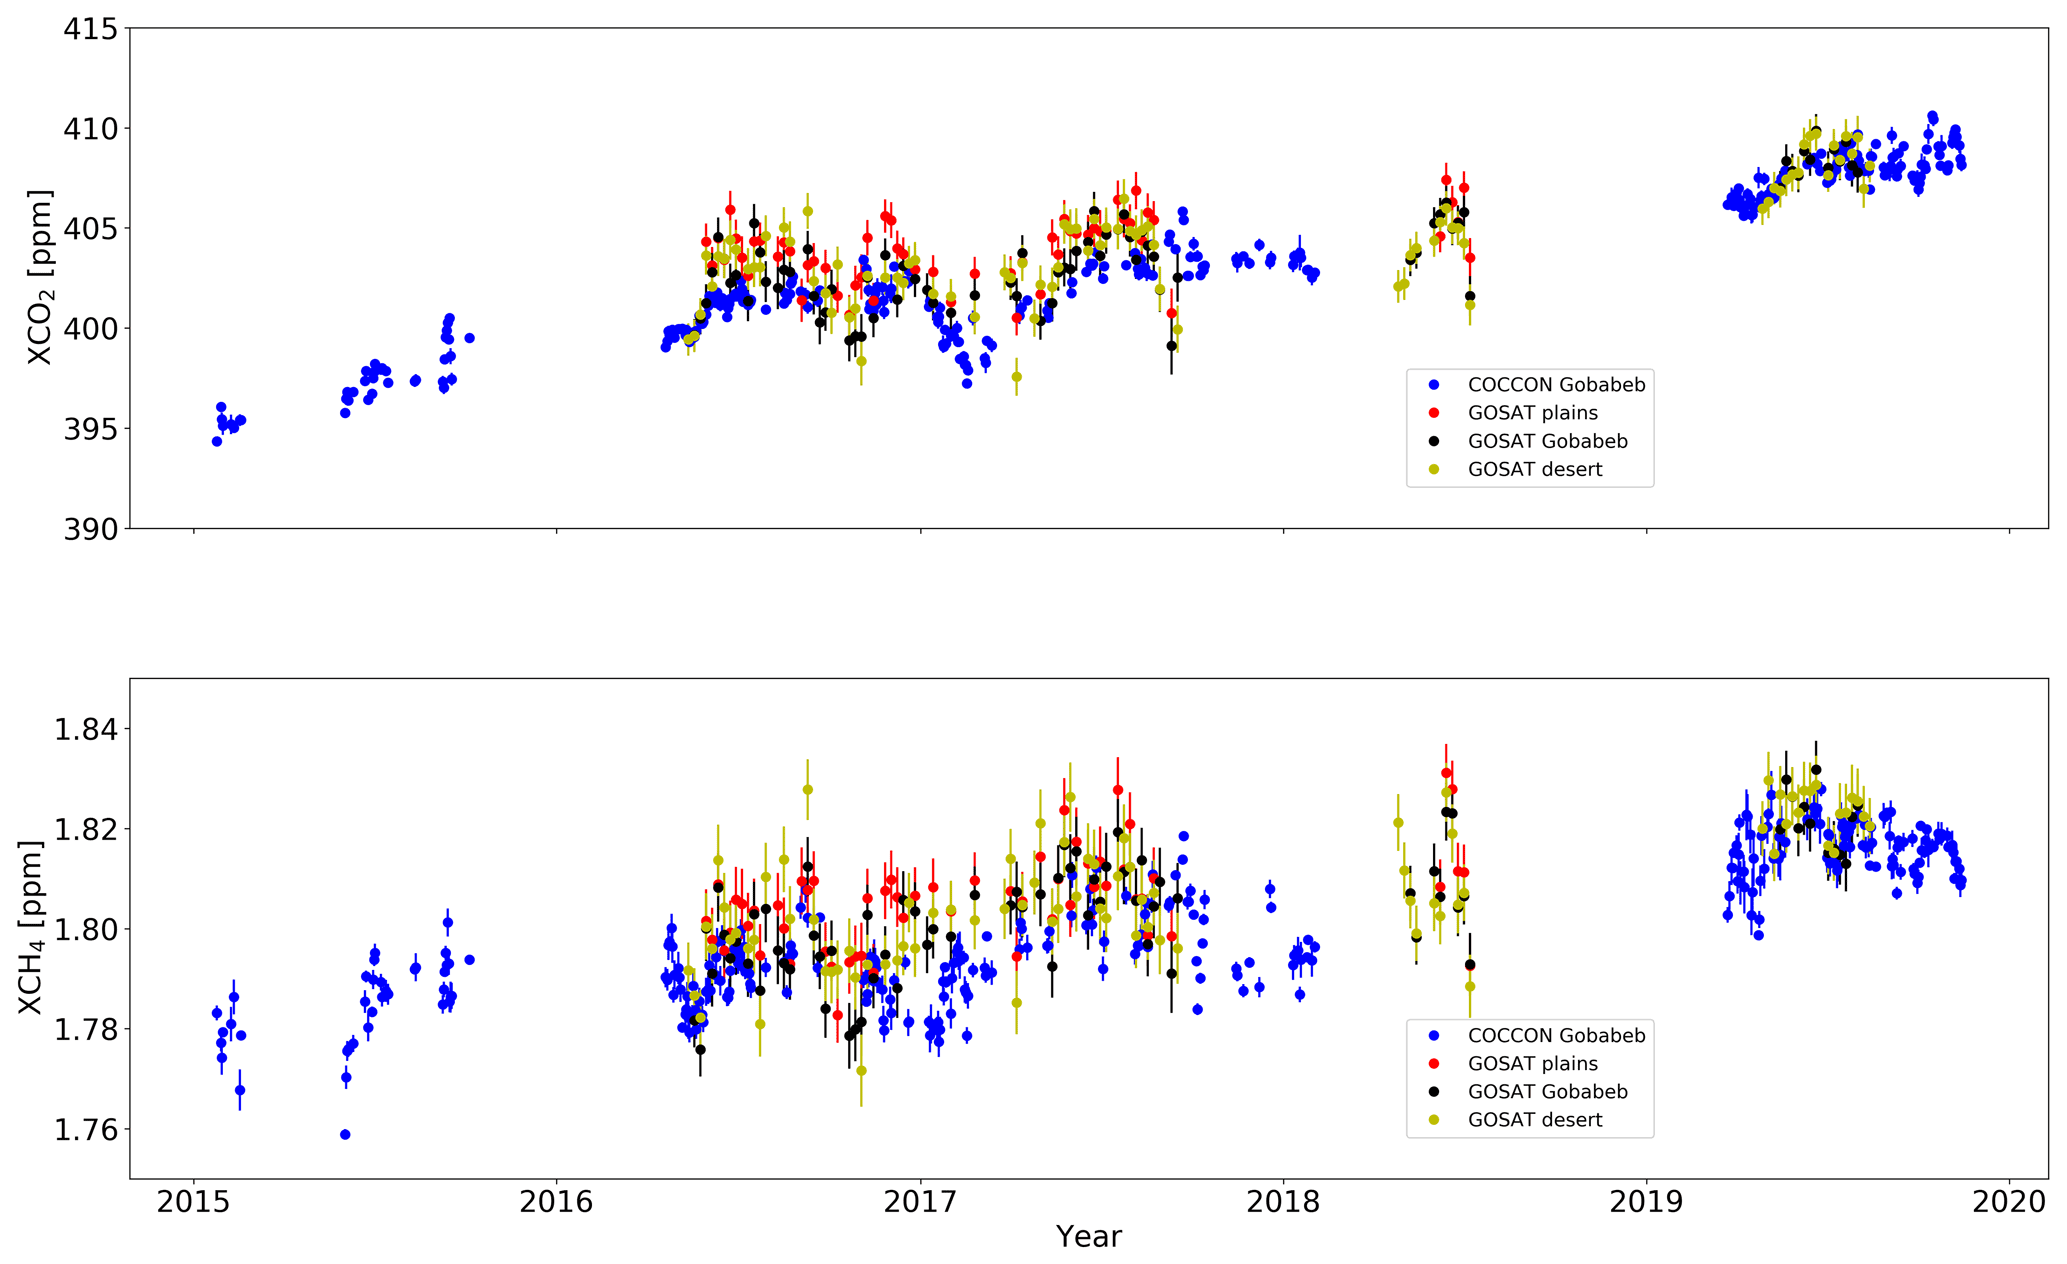
Figure 9Column-averaged dry-air mole fraction daily mean time series for XCO2 and XCH4 measured at the COCCON site in Gobabeb (blue dots) and GOSAT observations from the three specific target observation points with different surface albedos close to Gobabeb are shown (red dots: gravel plains, black dots: COCCON site, golden dots: sand desert). Error bars denote the 1σ standard deviation of the daily mean values for COCCON measurements and the measurement error for the GOSAT soundings.

Figure 10XCO2 and XCH4 column-averaging kernels for the COCCON Gobabeb and GOSAT observations. The color bar denotes the SZA. For the COCCON instrument, SZAs from 0 to 85∘ are depicted, whereas for GOSAT only the averaging kernels for the actual measurements are shown, with SZAs approximately between 10 and 50∘.
For a quantitative analysis, we analyze coincident observations between GOSAT and COCCON. To make the datasets comparable, we correct for the influence of the different a priori profiles following Rodgers and Connor (2003). We adjust the GOSAT values to the ensemble profile, which we assume to be the GGG2014-generated a priori profile. In Fig. 10, we present the XCO2 and XCH4 COCCON and GOSAT averaging kernels for different SZAs. Although the COCCON averaging kernels are shown for SZAs in the range of 0 and 85∘, for all coincident overpasses, the SZA was between 10 and 50∘. Due to the similarities of the averaging kernels, we neglect the smoothing error in the following analysis.
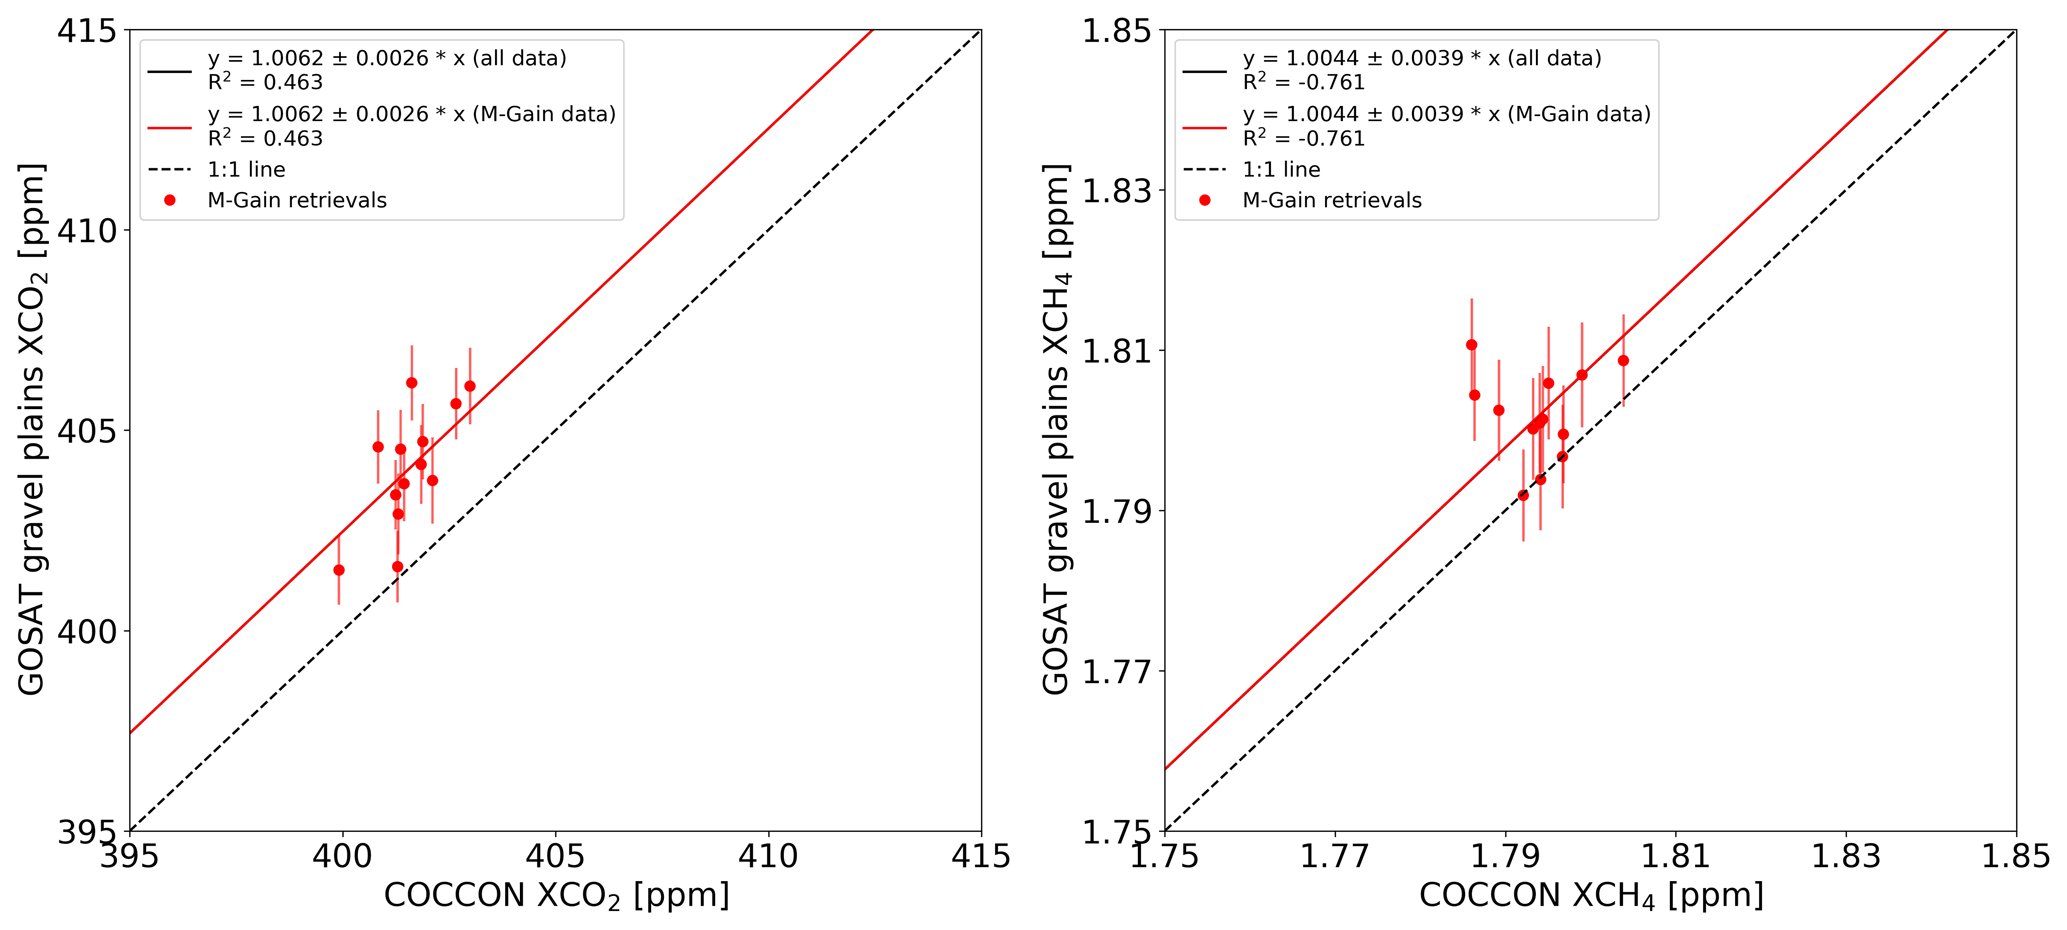
Figure 11Correlation plots between coincident COCCON Gobabeb observations and GOSAT measurements over the gravel plains between 2016 and 2019. For this area, GOSAT only performed M-gain soundings (red dots). The solid red line is the best-fit line through all M-gain data points. The dotted black line is the 1 : 1 line. Error bars denote the 1σ standard deviation of the hourly mean values for COCCON measurements and the measurement error for the GOSAT soundings.
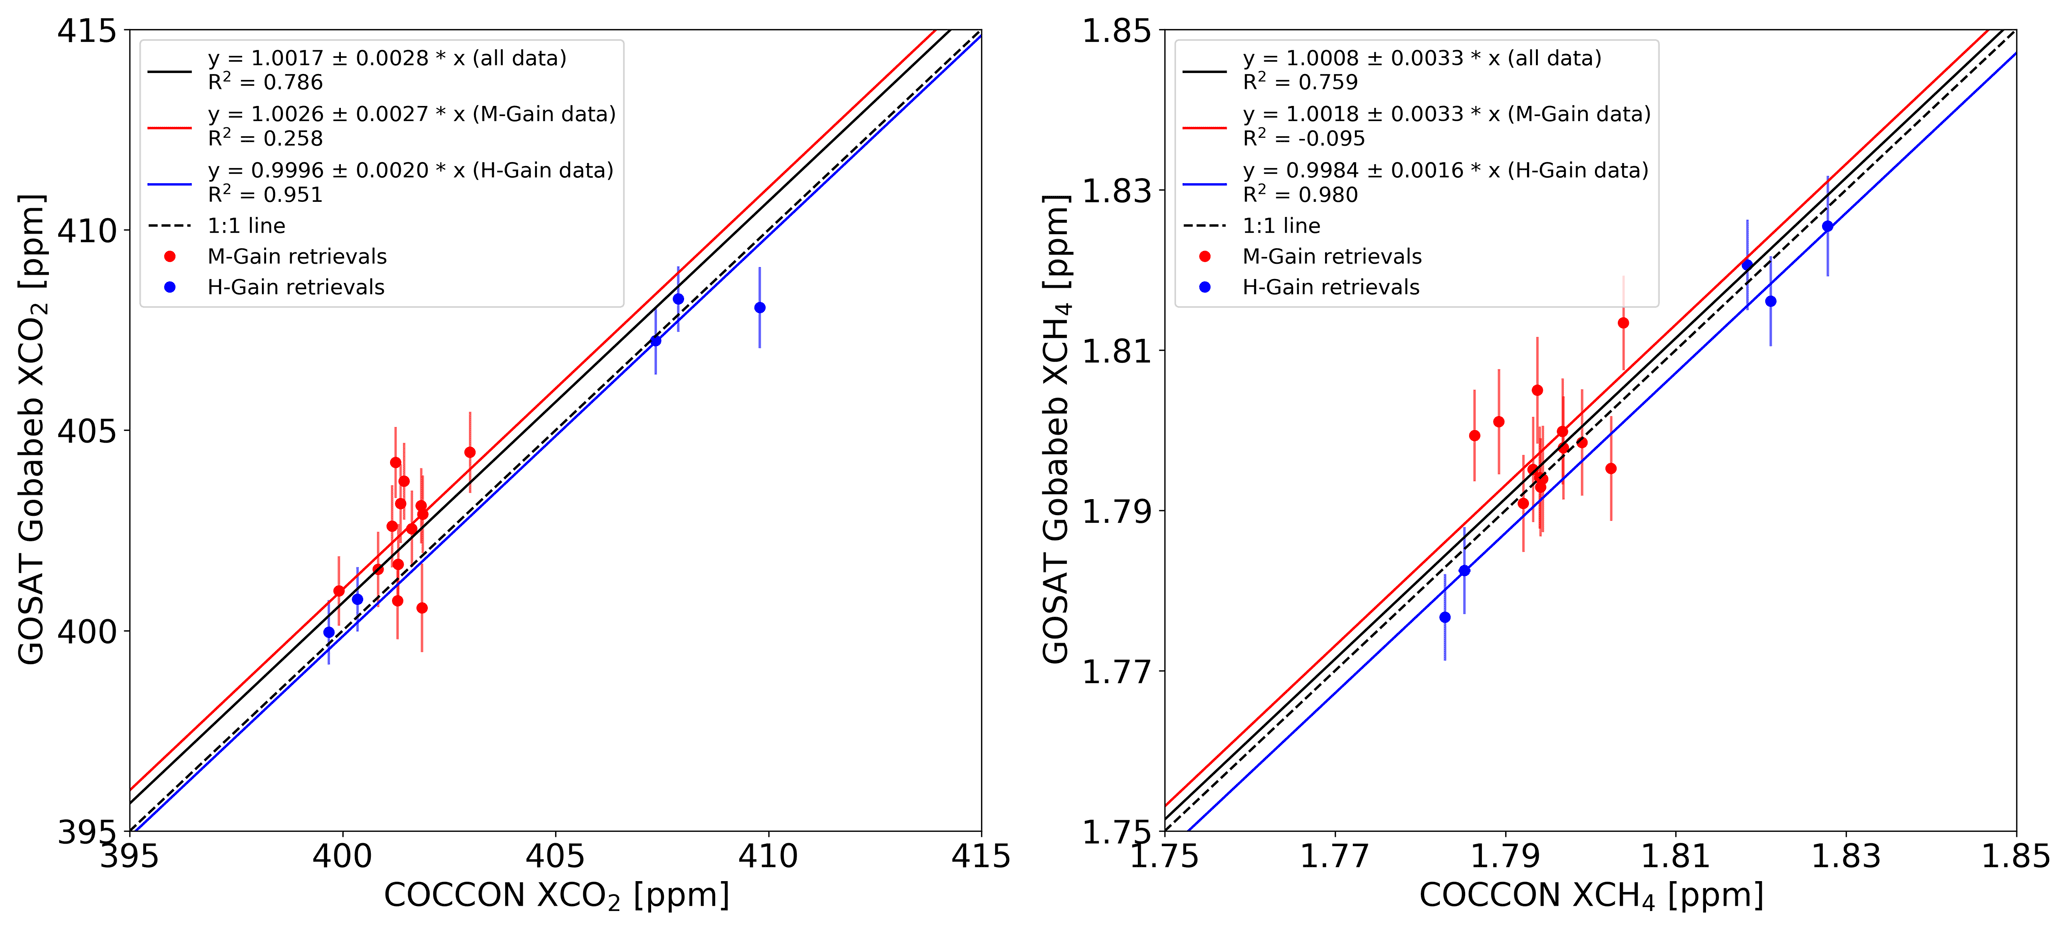
Figure 12Correlation plots between coincident COCCON Gobabeb observations and GOSAT measurements over the COCCON site between 2016 and 2019. For this area, GOSAT performed M-gain (red dots) and H-gain (blue dots) soundings. The solid red line is the best-fit line through all M-gain data points, the solid blue line is the best-fit line through all H-gain data points and the solid black line is the best-fit line through all data points. The dotted black line is the 1 : 1 line. Error bars denote the 1σ standard deviation of the hourly mean values for COCCON measurements and the measurement error for the GOSAT soundings.
The number of coincident measurements with COCCON observations is 13, 18 and 20 for the three specific observation points and the chosen coincidence criterion is that COCCON observations were performed within 30 min of the satellite overpass. Of these coincident measurements, the vast majority occurred in 2016. The correlation graphs for these three target points are presented in Figs. 11, 12 and 13. GOSAT M-gain observations are color coded in red, while H-gain observations are shown in blue. Error bars denote the 1σ standard deviation of the hourly mean values for COCCON measurements and the measurement error for the GOSAT soundings.
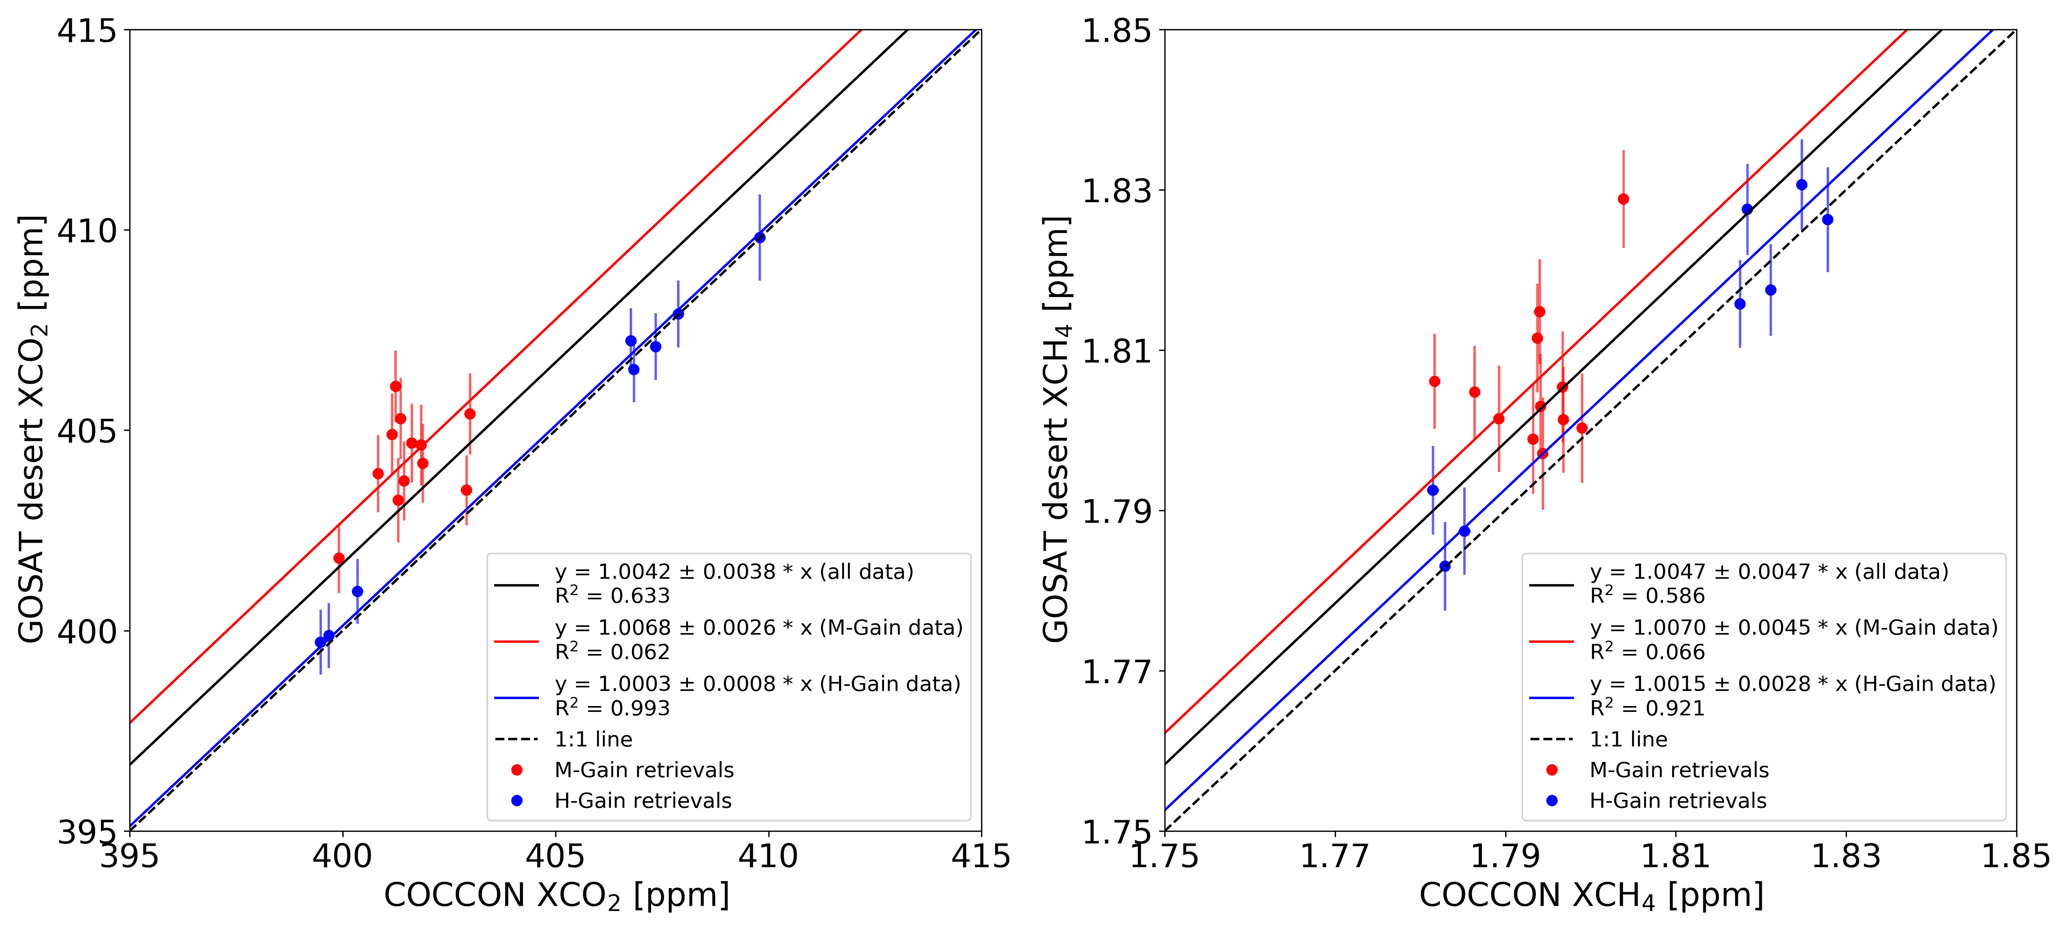
For the GOSAT observations over the gravel plains, only GOSAT M-gain soundings were performed. The spread of the dataset is relatively large, GOSAT is biased high and we derive a scaling factor with respect to the COCCON observations of 1.0062 ± 0.0026 and 1.0044 ± 0.0039 for XCO2 and XCH4, where the difference is statistically significant at the 1σ level. This corresponds to a high bias of 2.5 ± 1.1 ppm for XCO2 and 7.9 ± 7.1 ppb for XCH4. In Table 3, the absolute values of the GOSAT – COCCON comparison are summarized. Directly over Gobabeb, GOSAT M-gain as well as H-gain soundings were performed. Between COCCON and GOSAT M-gain data, we derive a scaling factor of 1.0026 ± 0.0027 for XCO2 and 1.0018 ± 0.0033 for XCH4, corresponding to a high bias of 1.0 ± 1.1 ppm for XCO2 and 3.1 ± 6.0 ppb for XCH4. For H-gain observations, we derive a scaling factor of 0.9996 ± 0.0020 for XCO2 and 0.9984 ± 0.0016 for XCH4, corresponding to a low bias of 0.2 ± 0.8 ppm for XCO2 and 2.8 ± 2.9 ppb for XCH4. The differences between GOSAT and COCCON are not statistically different at the 1σ level. Over the sand desert, the GOSAT M-gain data are biased high with respect to the COCCON data with a scaling factor of 1.0068 ± 0.0026 for XCO2 and 1.0070 ± 0.0045 for XCH4, corresponding to a high bias of 2.7 ± 1.1 ppm for XCO2 and 12.5 ± 8.1 ppb for XCH4. The H-gain data are in very good agreement with the COCCON observations with a scaling factor of 1.0003 ± 0.0008 for XCO2 and 1.0015 ± 0.0028 for XCH4, corresponding to a high bias of 0.1 ± 0.3 ppm for XCO2 and a high bias of 2.7 ± 5.1 ppb for XCH4.
Table 3This table presents the results of the comparison between the COCCON station in Namibia and the GOSAT M-gain and H-gain specific target observations. Bias and SD are given as the mean difference and 1 standard deviation between the coincident GOSAT and COCCON observations.
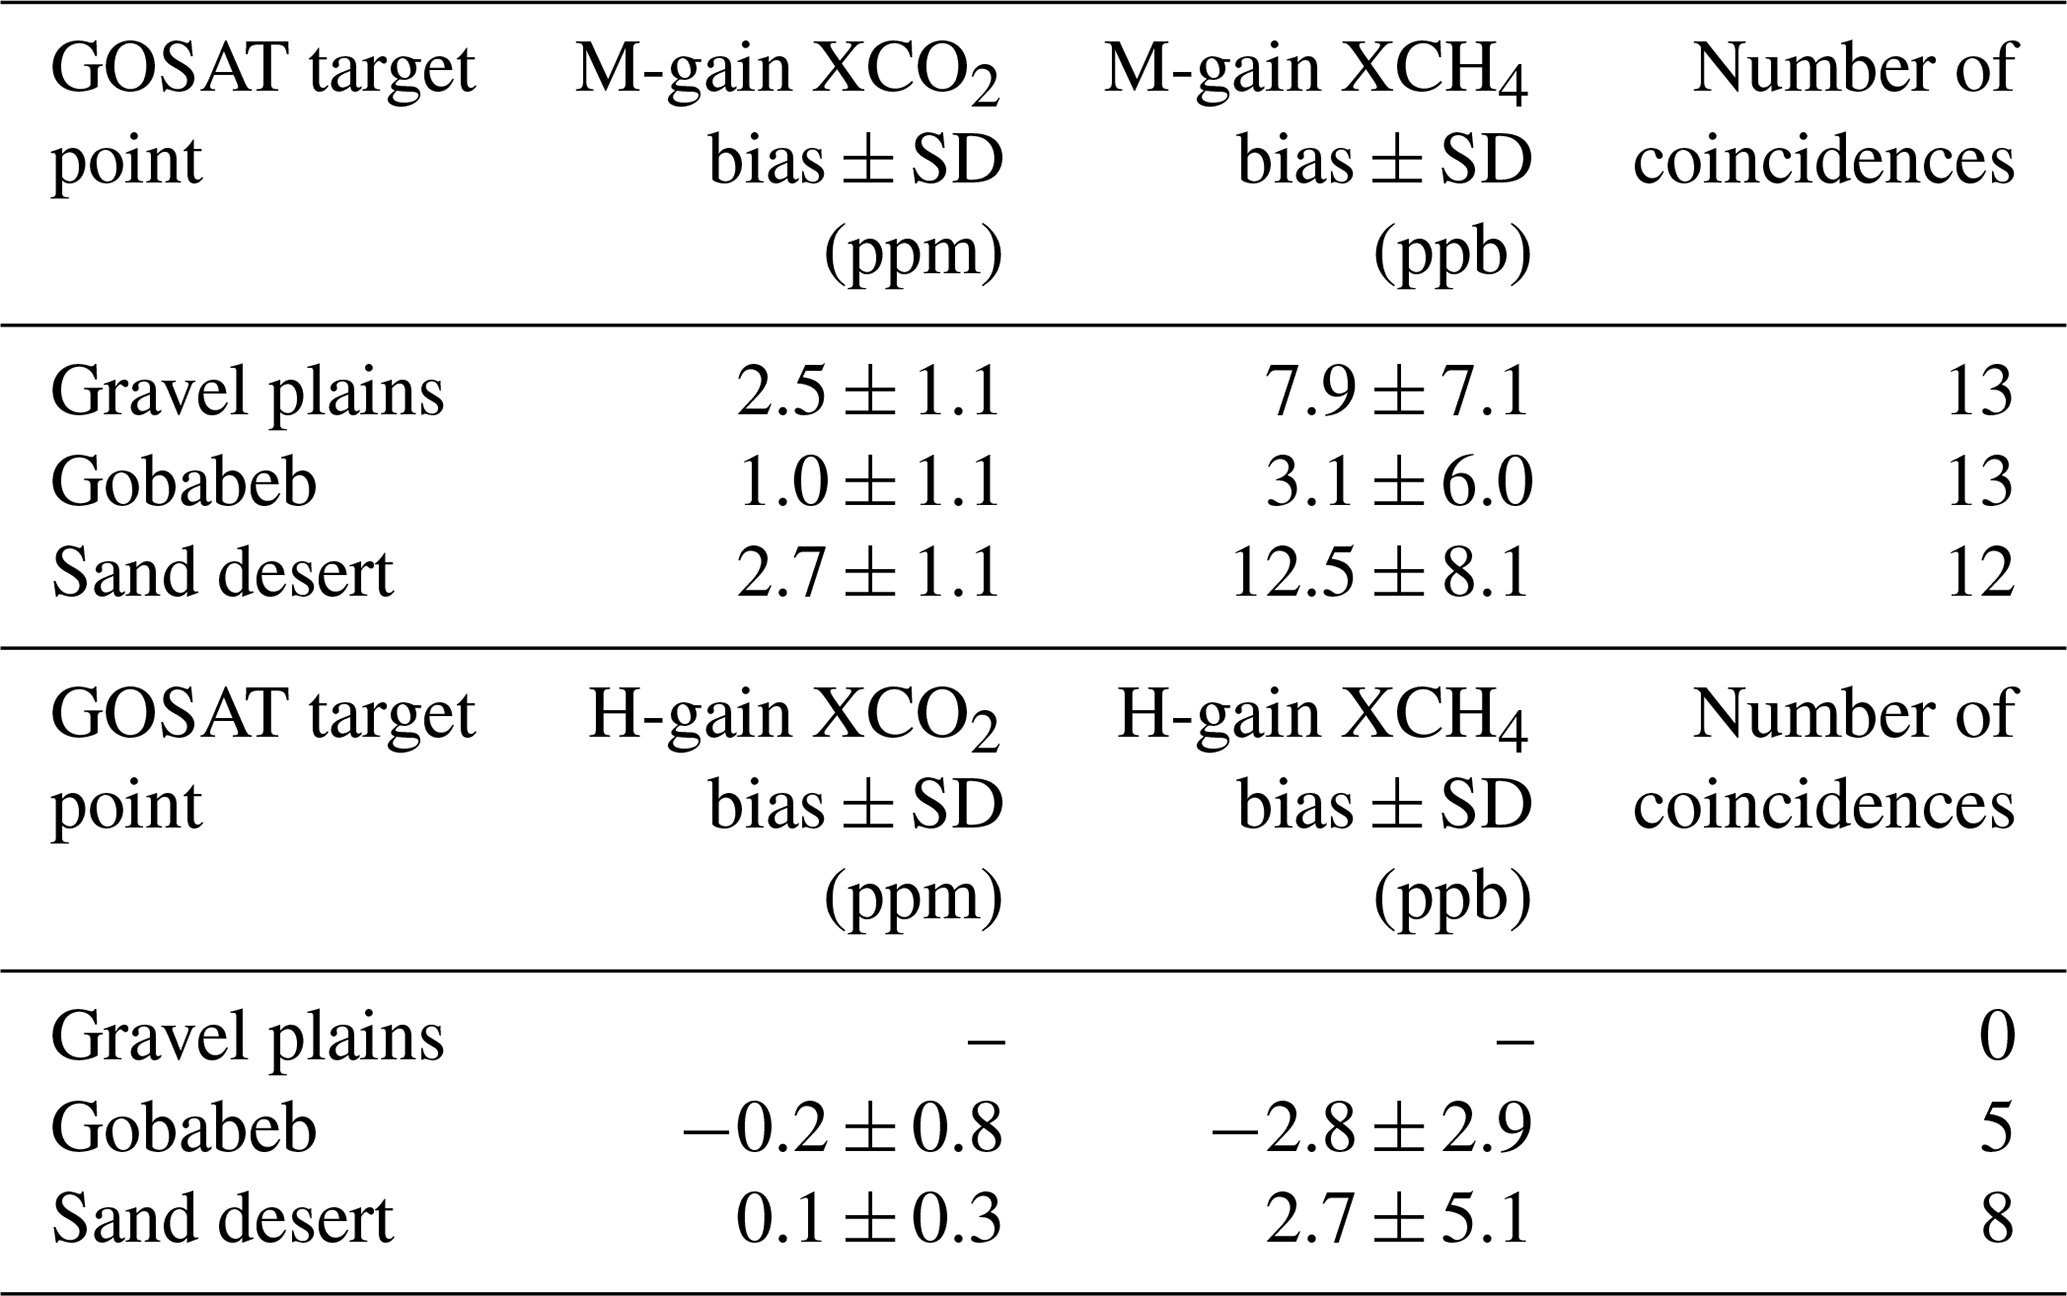
Although not always statistically significant at the 1σ level, clear differences are discernible between the different GOSAT gain settings. This is in agreement with results reported by Velazco et al. (2019) and the GOSAT validation team. For the H-gain soundings, we report a good agreement with the COCCON observations within the 1σ level for XCO2 as well as XCH4 with high correlation coefficients (R2 > 0.9).
4.3 CAMS evaluation
COCCON and CAMS XCO2 and XCH4 time series are provided in Fig. 14. Hourly mean COCCON data are shown as blue dots, CAMS data as red (satellite data assimilation) and black dots (in situ data assimilation) with 3-hourly model output for XCO2 and 6-hourly model output for XCH4. For XCO2, note that the OCO-2 assimilated data are available until 2019 and the in situ assimilated data are available until 2018. For XCH4, both CAMS datasets are available until 2018.
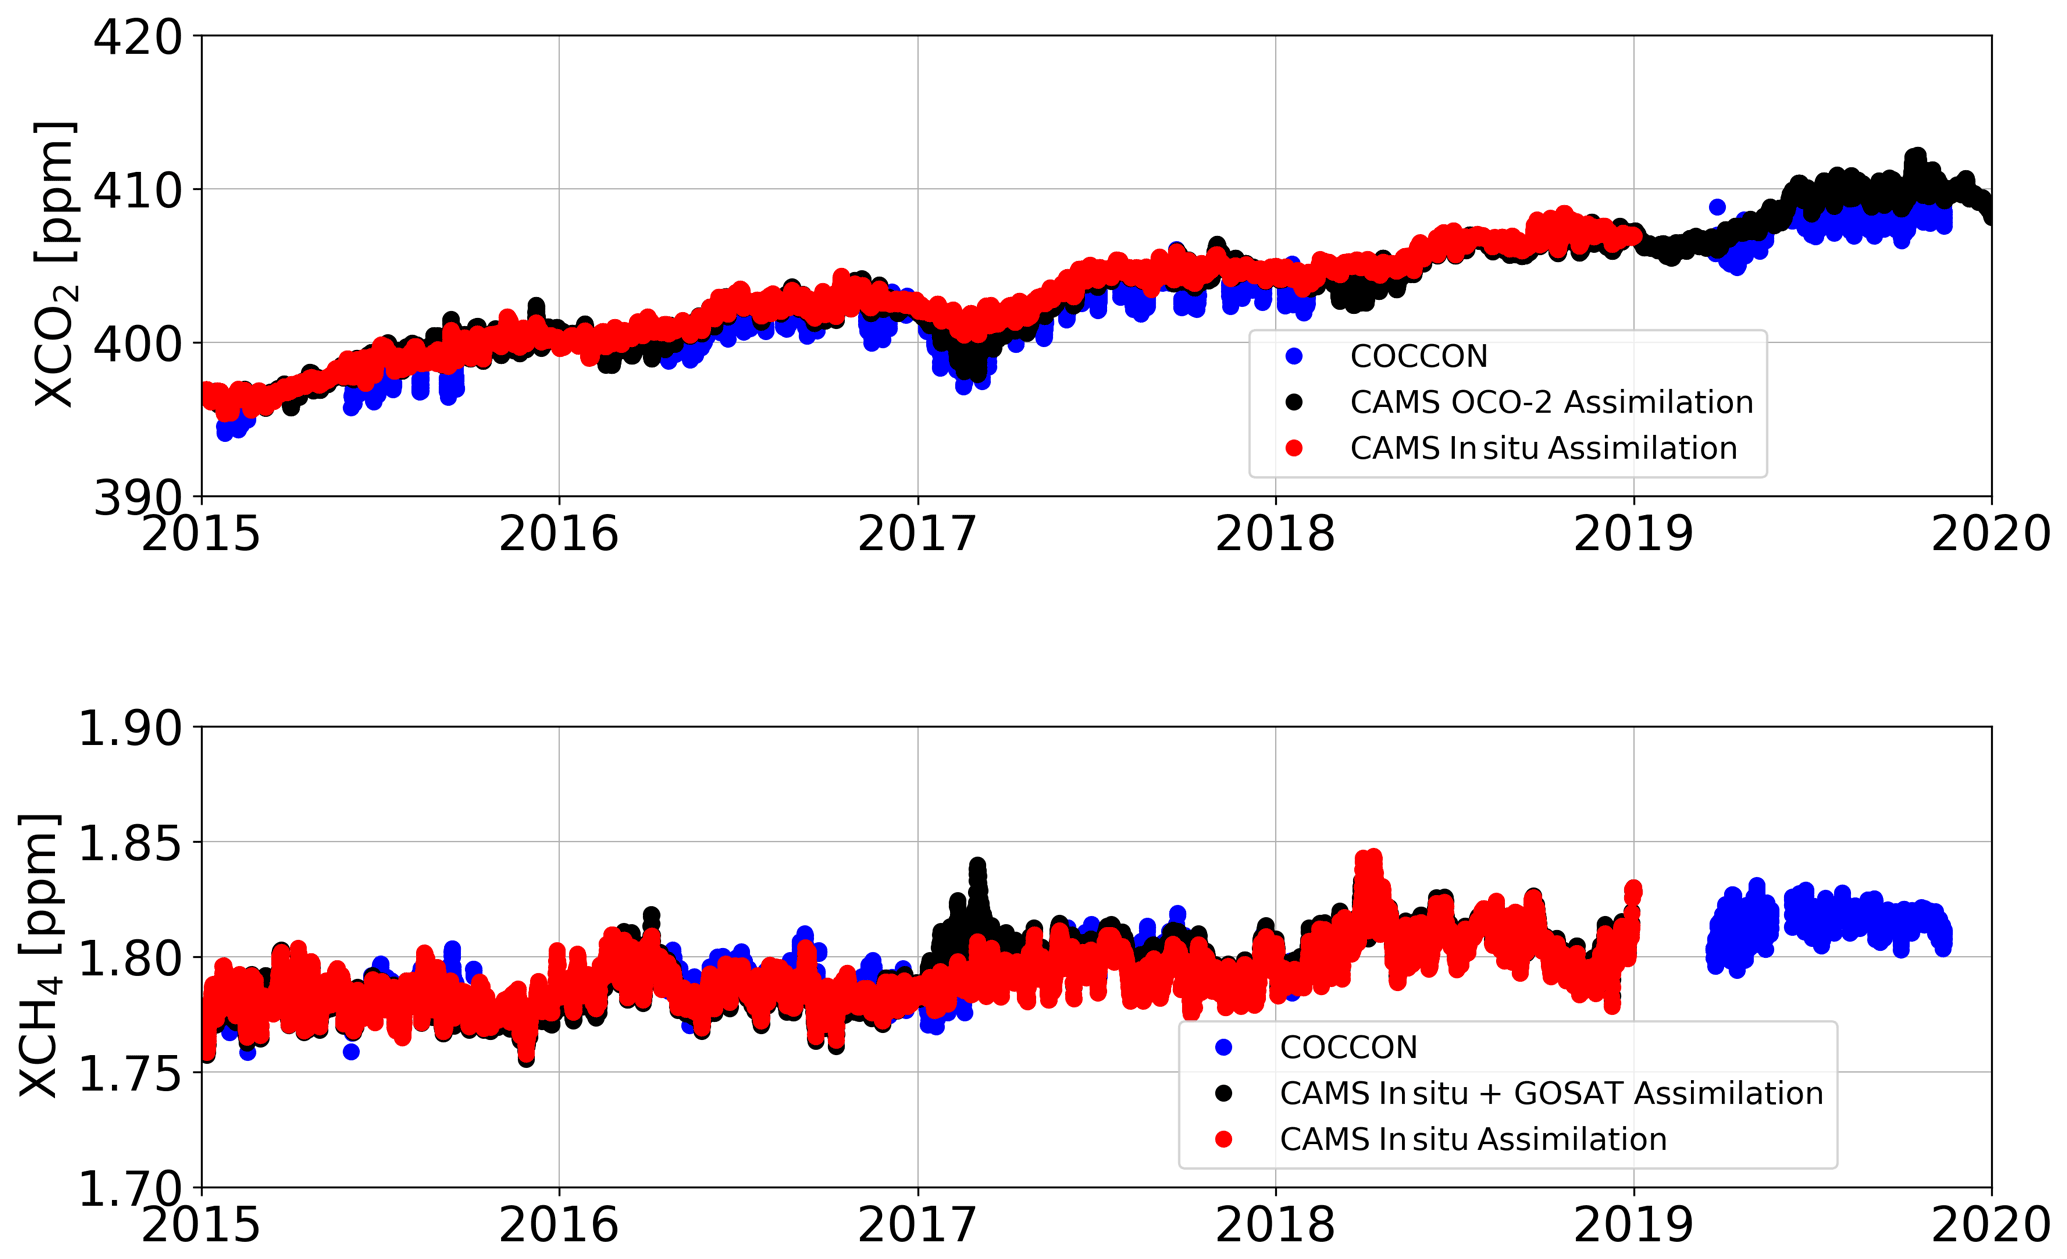
Figure 14Column-averaged dry-air mole fraction daily mean time series for XCO2 and XCH4 at Gobabeb, Namibia. COCCON measurements are shown as blue dots, CAMS model data as red and black dots. For COCCON, we show hourly pooled data; for CAMS, we show 3-hourly model output for XCO2 and 6-hourly model output for XCH4.
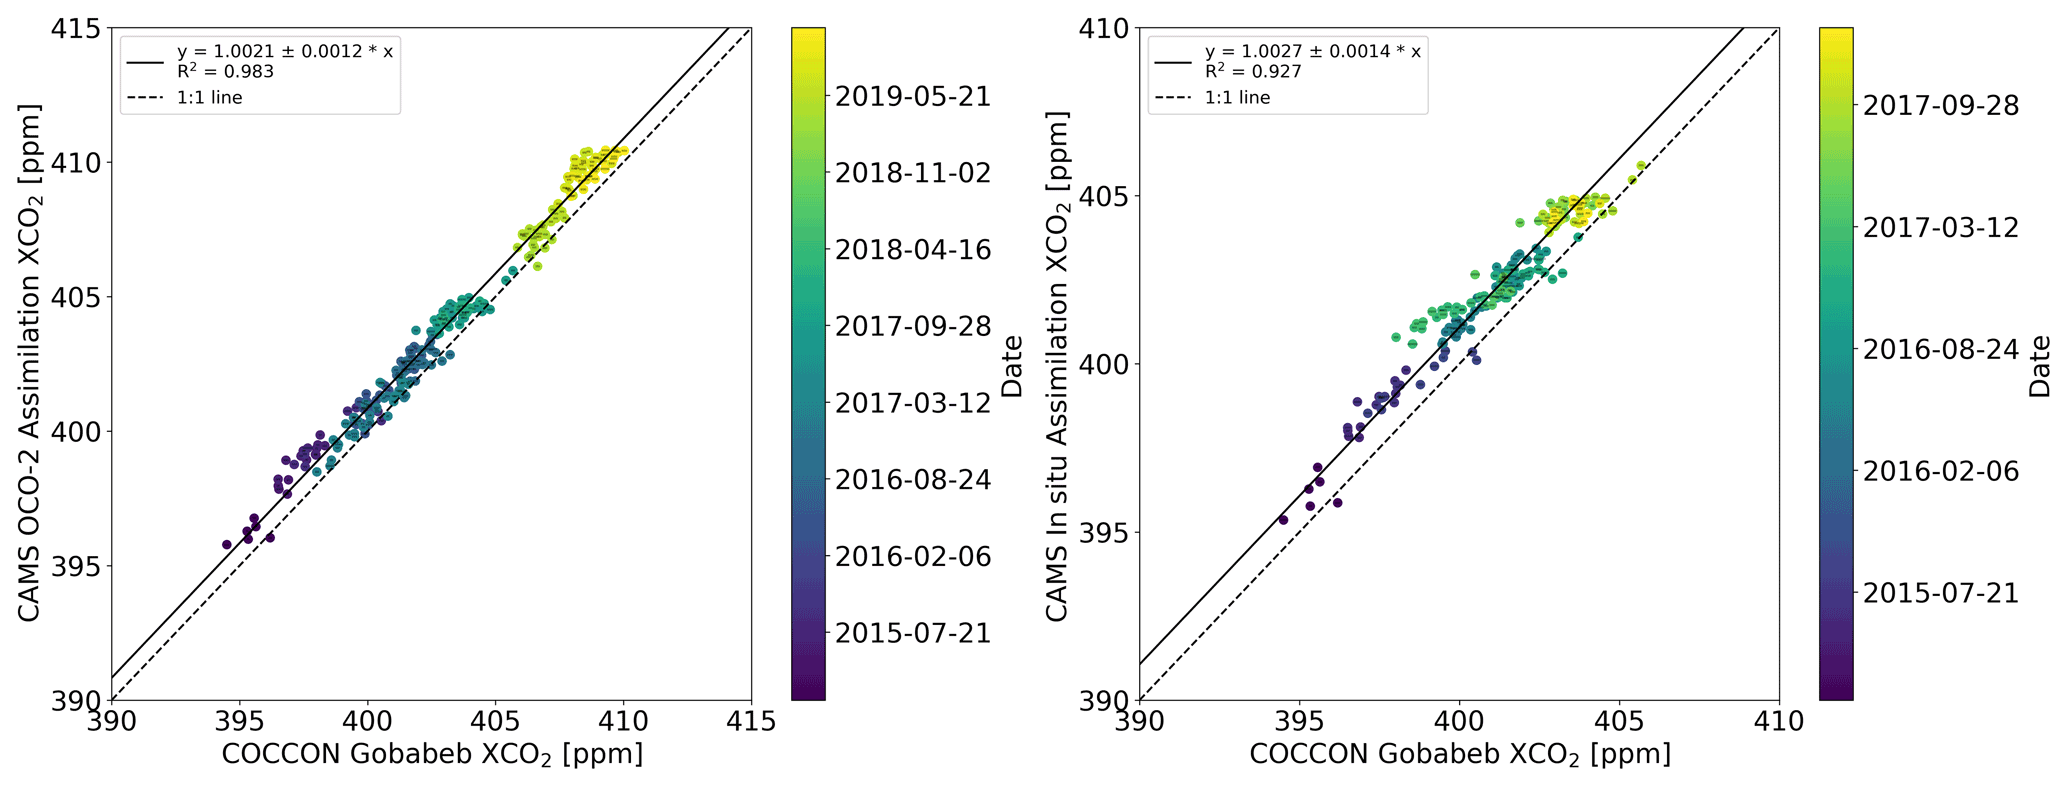
Figure 15XCO2 correlation plots between coincident COCCON Gobabeb observations and CAMS model data. The left panel shows the OCO-2 assimilated model data; the right panel shows the in situ assimilated model data. Note that the OCO-2 assimilated data are available until 2019 and the in situ assimilated data are available until 2018. Error bars denote the 1σ standard deviation of the hourly mean values for COCCON measurements.
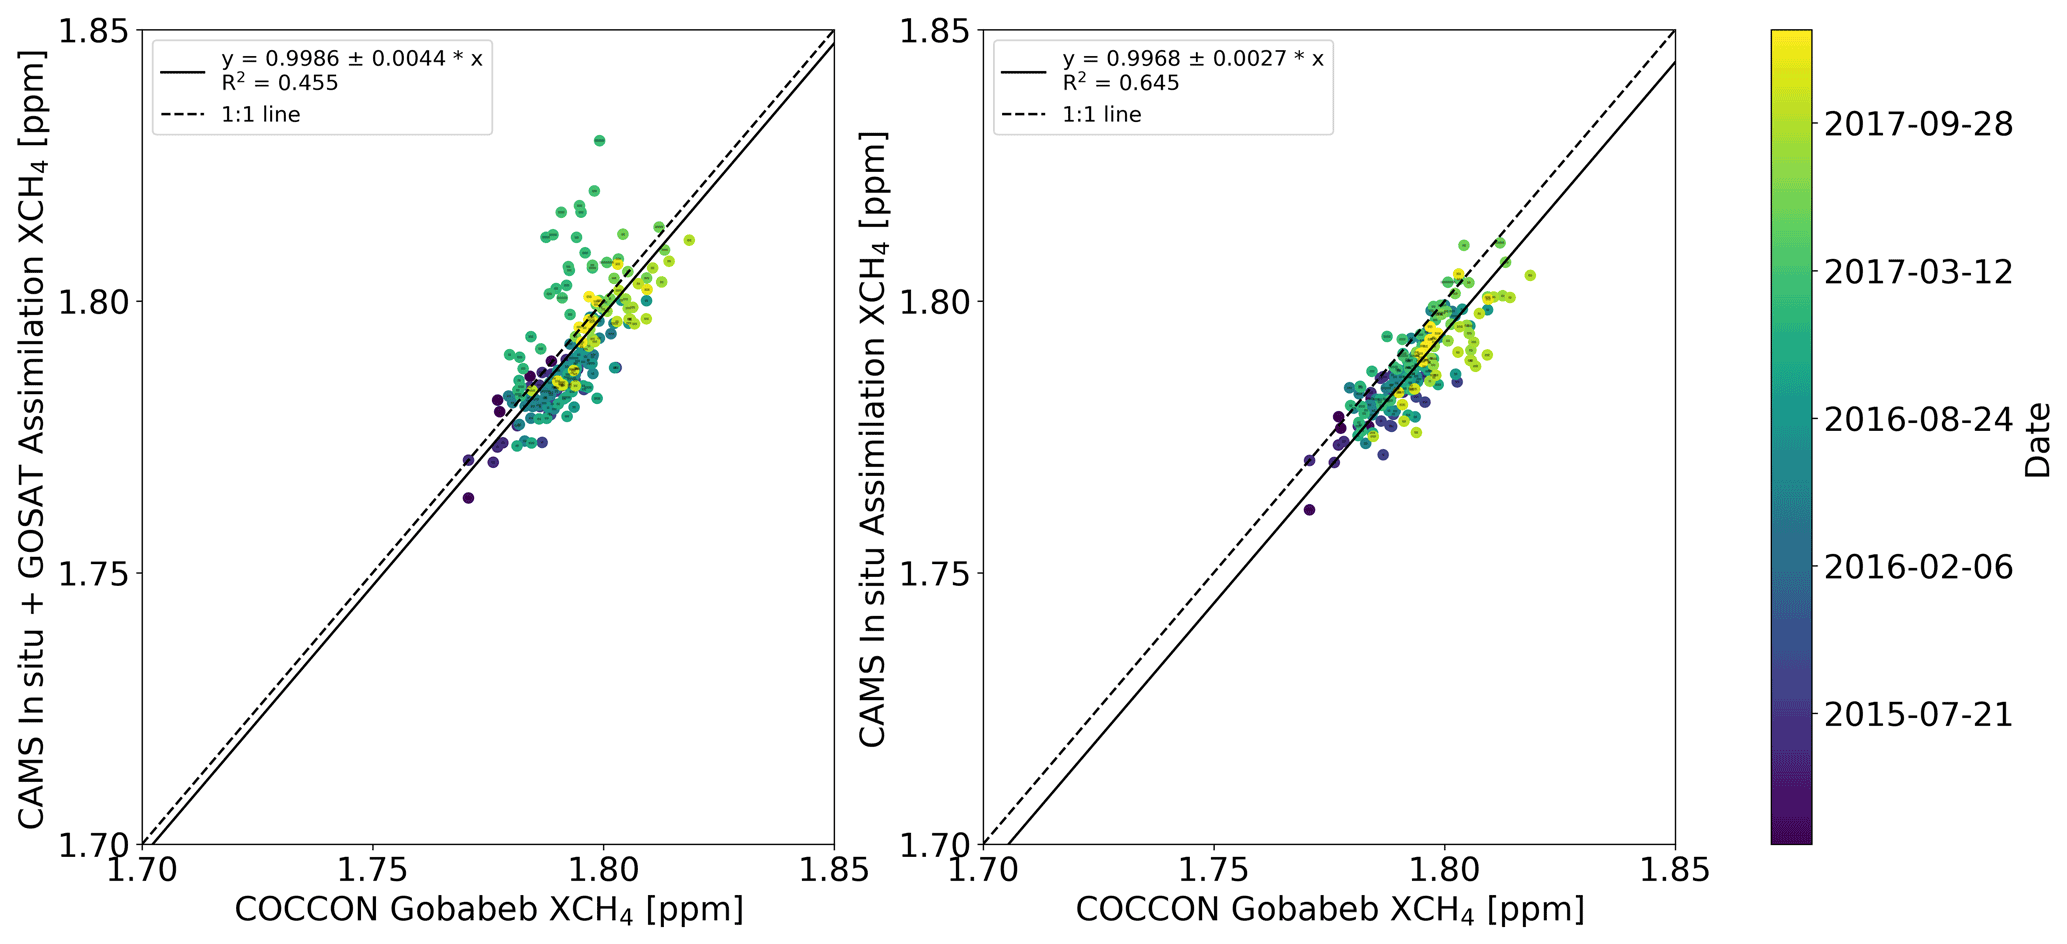
Figure 16XCH4 correlation plots between coincident COCCON Gobabeb observations and CAMS model data. The left panel shows the model data assimilated with in situ and GOSAT data; the right panel shows the in situ assimilated model data. Error bars denote the 1σ standard deviation of the hourly mean values for COCCON measurements.
As was shown in Sect. 4.1, the COCCON measurements exhibit a small but discernible parabola shape during the day. For better comparability, we therefore only compare COCCON measurements around local noon with the CAMS model data. Although using all COCCON data results in only a small bias of 0.2 ppm for XCO2 and 2 ppb for XCH4 relative to the noon-only data, we feel that this is the more consistent comparison. The resulting correlation plots for XCO2 and XCH4 are presented in Figs. 15 and 16. The left panel of Fig. 15 shows the OCO-2 assimilated model data. We see an excellent agreement between the two datasets with a bias of 0.9 ± 0.5 ppm and a correlation coefficient R2 of 0.983. This offset agrees well with the bias between CAMS model and TCCON data presented in Chevallier (2020a). We do not observe an increased bias at the beginning of 2017. This means that the OCO-2 assimilated model reproduces the drawdown of XCO2 seen in the COCCON time series in Fig. 5 during this time. In contrast, we see an increased bias during the beginning of 2017 in the in situ assimilated data in the right panel. Apart from this anomaly, the agreement between the two datasets is good. The CAMS model has a high bias of 1.1 ± 0.6 ppm and R2 = 0.927. The biases between the CAMS model simulation and the COCCON Gobabeb measurements are presented in Table 4.
Table 4This table presents the results of the comparison between the COCCON station in Namibia and the assimilated CAMS model data. Bias and SD are given as the mean difference and 1 standard deviation between the coincident hourly pooled local noon COCCON and CAMS XCO2 and XCH4 values.
For XCH4, both the combined GOSAT and in situ assimilated data and the in situ assimilated data are available until 2018. The GOSAT and in situ assimilated CAMS data exhibit a low bias of 2.4 ± 8.0 ppb, R2 = 0.455. From the end of 2016 to the beginning of 2017, an anomaly is discernible with higher CAMS values. This is not seen in the comparison with the in situ assimilated dataset. The anomaly corresponds to a period of increased scatter in the GOSAT and in situ assimilated CAMS time series itself; see Fig. 14. Therefore, we attribute this anomaly to the influence of the GOSAT observations. For the in situ assimilated data, we find a low bias of 5.8 ± 4.8 ppb and R2 = 0.645. This is consistent with the low bias of CAMS with respect to TCCON measurements in the latitude band between 20 and 30∘ S of around 10 ppb, as shown in Fig. 17 of Segers and Houweling (2020a).
From the end of 2016 until the beginning of 2017, the XCO2 values at the COCCON station at Gobabeb were significantly lower compared to the TCCON stations Réunion Island and Lauder; see Sect. 4.1. We rule out instrumental problems as the reason, as Xair is stable and the other observed gases do not show abnormal variations during this period. In order to investigate whether the drawdown of XCO2 at the beginning of 2017 at the Gobabeb station is linked to the African biosphere, in Fig. 17, we present global OCO-2 assimilated CAMS a posteriori surface carbon fluxes for 16 February 2017 at 12:00 UTC, the day with the lowest XCO2 values in 2017. We find that in the direct vicinity of Gobabeb, no strong negative carbon fluxes are apparent. From this, we deduce that air parcels with low CO2 concentrations are transported to Gobabeb from other regions of the African mainland with negative surface fluxes. We therefore expect that the drawdown of XCO2 is driven by low CO2 concentrations in higher layers of the atmosphere that are representative for medium- or long-range transport. This is in agreement with the results of Sect. 4.3, where a comparison between COCCON data with CAMS model data shows that the CAMS model version assimilating total column data reproduces the XCO2 drawdown, in contrast to the version assimilating in situ data only. We grant the possibility that the discrepancy between the different CAMS products could also stem from imperfections of the CAMS model.

Figure 17Global map showing OCO-2 assimilated CAMS a posteriori surface carbon fluxes for 16 February 2017 at 12:00 UTC.
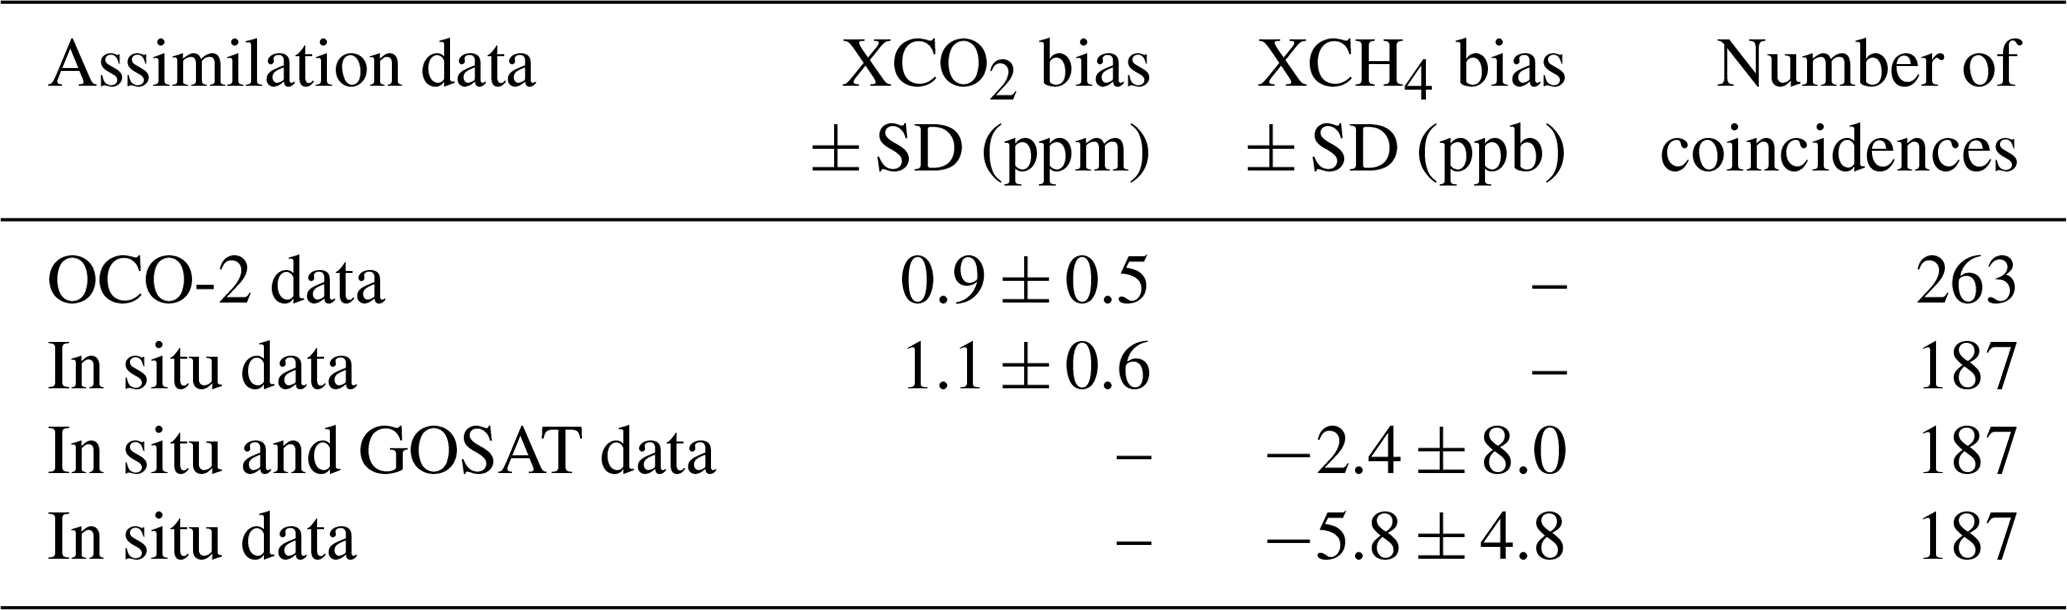
In Fig. 18, we show 10 d backward trajectory ensemble simulations from the National Oceanic and Atmospheric Administration (NOAA) Hybrid Single-Particle Lagrangian Integrated Trajectory (HYSPLIT) model (Stein et al., 2016) for 16 February 2017. Initial 3-hourly meteorological input data are provided by the NCEP Global Data Assimilation System (GDAS) model on a 1∘ latitude–longitude grid. The end point of the trajectory analysis is chosen at a height of 5000 m above ground level. All trajectories exhibit a long dwell time over the African continent in regions with strong negative carbon surface fluxes; see Fig. 17. This corroborates the conjecture that the low XCO2 values at Gobabeb are due to the influence of the African biosphere. Most of the trajectories that arrive at 5000 m height at Gobabeb originate from significantly lower levels of the atmosphere, close to the surface, and are then uplifted, as can be seen in the lower panel of Fig. 18.
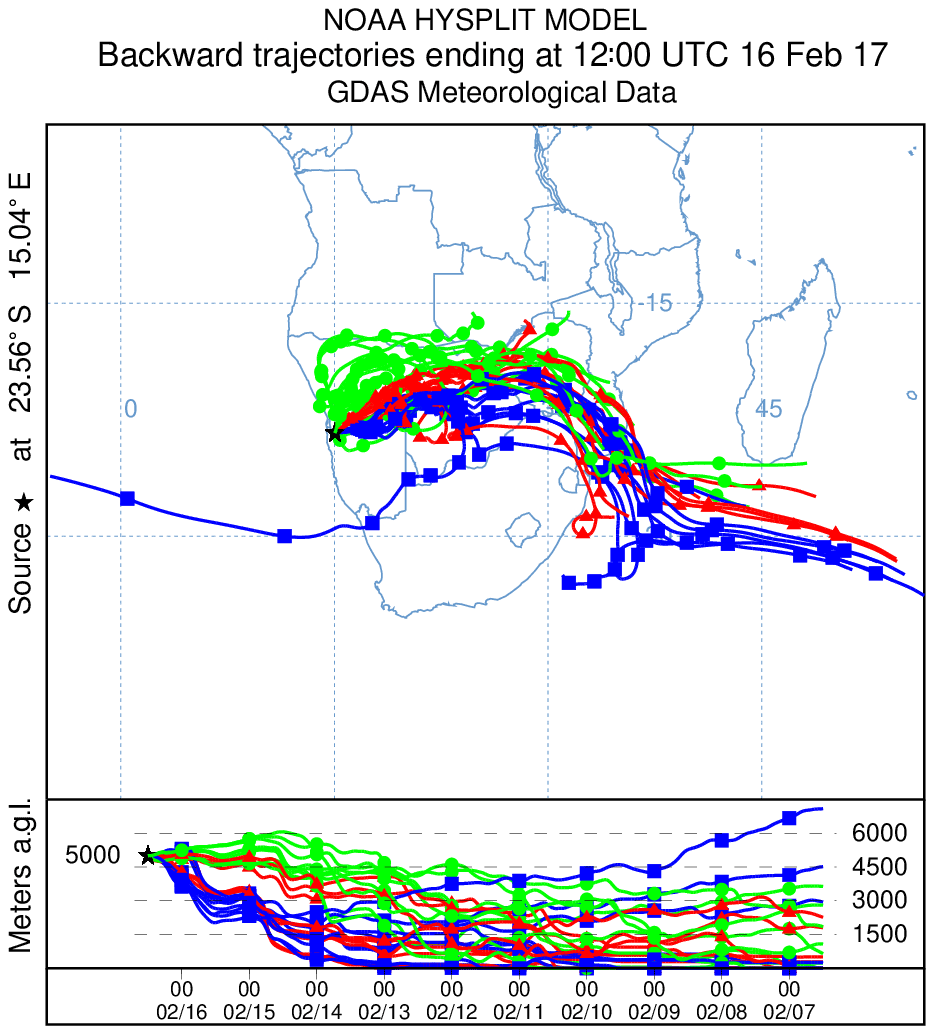
Figure 18NOAA HYSPLIT backward trajectory ensemble simulations on 16 February 2017. The endpoint of the backward trajectories is the COCCON Gobabeb station, 5000 m above ground level. The colors and symbols are used to make the different trajectories of the ensemble distinguishable.
In contrast, the backward trajectories for Réunion Island shown in Fig. 19 dwell almost exclusively over the ocean. In Fig. 20, we additionally provide backward trajectories for Gobabeb ending at 1000 m above ground level. In contrast to the trajectories at 5000 m, these originate from the ocean.
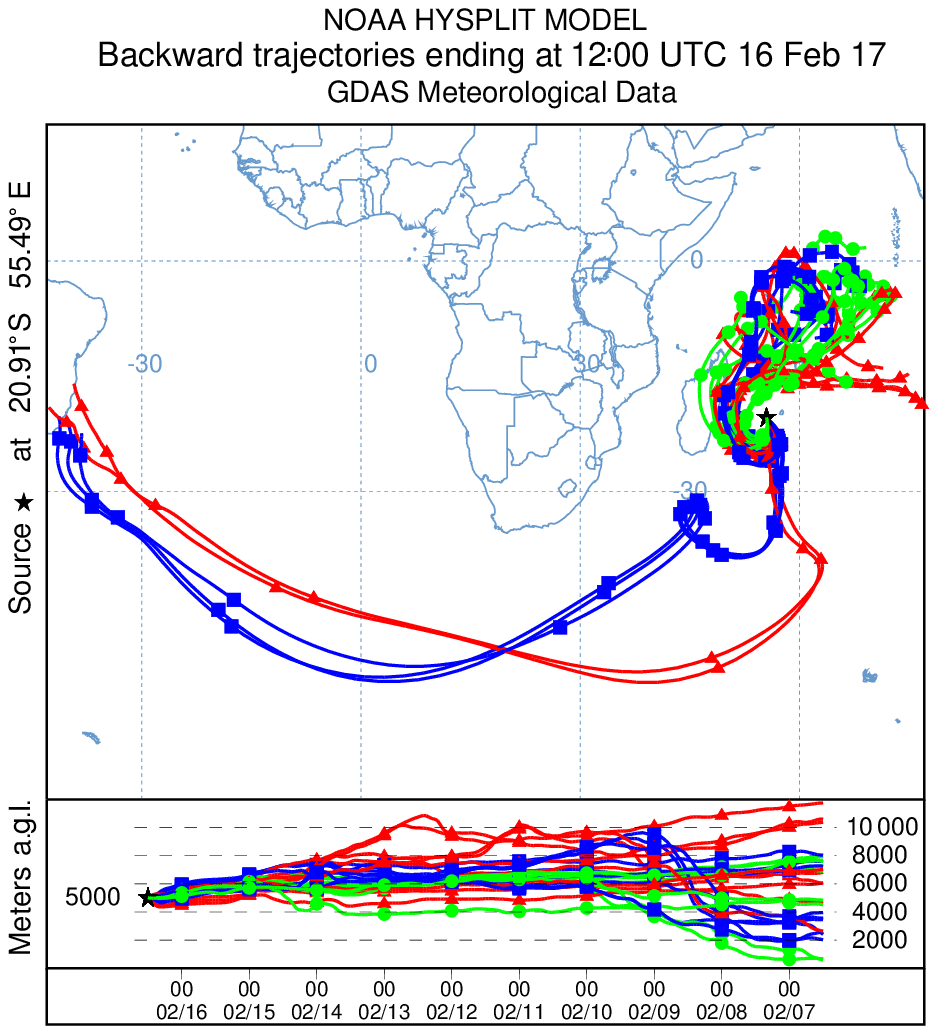
Figure 19Same as Fig. 18 but for the TCCON Réunion Island station.
Figure 20Same as Fig. 18 but with the endpoint of the backward trajectories at 1000 m above ground level.
We present measurements from a new ground-based remote-sensing COCCON station in Namibia, the first FTIR site measuring GHGs on the African continent. We performed a thorough calibration scheme carried out in Karlsruhe in order to make the results traceable to TCCON (and thereby the WMO scale), including ILS measurements and side-by-side comparisons with a reference COCCON spectrometer. The results from Namibia show a typical global annual increase rate for both XCO2 as well as XCH4. In contrast to comparable FTIR measurements in the Southern Hemisphere, we observe a pronounced seasonal variability for XCO2 with a peak-to-peak amplitude of 5.3 ppm in 2017, in agreement with OCO-2 assimilated CAMS model data and global transport model predictions (Olsen and Randerson, 2004). As expected for a desert site, we observe very low values of XH2O, with a minimum value of 357 ppm. For the whole time series, daily Xair results are stable within 1 %. No apparent drift of Xair is visible during the 4 years of measurements performed at the COCCON Gobabeb station.
To put our results in the broader geophysical context, we compare the COCCON Namibia results to measurements from the TCCON stations Réunion Island and Lauder. Given the fact that the stations are spatially far apart, the results are in good agreement. For XCO2, both TCCON Lauder (−0.4 ± 1.1 ppm) and Réunion Island (1.1 ± 1.1 ppm) show biases compared to COCCON Gobabeb within the 1σ uncertainty range and correlation coefficients R2 > 0.9. For XCH4, TCCON Réunion Island and COCCON Gobabeb data agree within the 1σ uncertainty range (5.1 ± 8.1 ppb), while a large bias (−35.9 ± 10.6 ppb) is observed with respect to the Lauder data. This is a direct result of the strong latitudinal gradient in total column-averaged methane concentrations. We further investigate the diurnal variations from TCCON Réunion Island and COCCON Gobabeb for XCO2 and XCH4. Both share a small but systematic downward parabola shape, probably the result of a combination of non-perfect a priori profiles, residual air-mass dependency and intraday changes of atmospheric temperature. From a comparison of the two datasets, we also deduce that the Réunion Island dataset shows increased scatter during some time periods due to the degrading mirror quality as a result of sea salt deposition from the ocean. Compared to the TCCON results, the COCCON observations are of comparable quality.
We show the usefulness of our station for satellite validation by comparing the COCCON results to GOSAT specific target mode observations at three points with different surface albedos close to or directly at the site. The satellite performed measurements with different gain settings. Ground-based validation of the different gain settings is difficult as very few sites worldwide have the necessary surface characteristics, further supporting the importance of this new station. We find a good agreement between GOSAT H-gain and COCCON observations within the 1σ uncertainty range with low biases of −0.2 ± 0.8 ppm for XCO2 and −2.8 ± 2.9 ppb for XCH4 at Gobabeb and high biases of 0.1 ± 0.3 ppm for XCO2 and 2.7 ± 5.1 ppb for XCH4 over the sand desert approximately 15 km southeast of the station. For M-gain soundings, GOSAT measurements are always biased high with respect to the COCCON measurements, the differences over the gravel plains and the sand desert are statistically significant at the 1σ level. Thereby, we show the capability of this site to validate satellite measurements for different high-albedo surfaces.
Then we evaluate the performance of the inversion-optimized CAMS model data against our ground-based COCCON data. For XCO2, we find high biases of 0.9 ± 0.5 ppm for the OCO-2 assimilated product and 1.1 ± 0.6 ppm for the in situ-driven product with R2 > 0.9 in both cases. These biases are comparable to offsets between the model and TCCON data. The OCO-2 assimilated model product is able to reproduce the drawdown of XCO2 beginning of 2017, as opposed to the in situ-optimized product. Also for XCH4, the biases found are in line with prior model comparisons with TCCON.
With this work, we show the potential of the COCCON network for satellite validation and atmospheric transport model validation. We expect that the availability of additional COCCON sites in the near future will be a great asset for future satellite and model studies as they are easy to deploy. In the course of the ESA-funded COCCON PROCEEDS project, COCCON data from several sites will be made available via a web portal. We conclude that instruments from the COCCON network offer stable long-term records of GHGs in remote environments and can be used to close gaps in the global distribution of ground-based remote-sensing sites.
We examine several measurement days between Gobabeb and Réunion Island, 1 d each year, where data are available for both sites. The results for XCO2 and XCH4 are shown in Fig. B1, COCCON measurements are shown as blue dots, and TCCON measurements as black dots. In contrast to other graphs, here we show local time data, for better comparability of the measurement days. For XCO2, the curvature for both COCCON and TCCON is relatively flat; however, a slight parabola shape is discernible. For southern hemispheric summer, compared to TCCON Réunion, COCCON Gobabeb values are slightly lower as was already seen in the time series analysis. XCH4 variations are similar for both sites; also the absolute values are in perfect agreement. A common feature for both datasets is the apparent parabola shape on most days. This is probably the result of a combination of non-perfect a priori profiles, residual air-mass dependency and intraday changes of atmospheric temperature. In the next version of the TCCON trace gas retrieval algorithm, updated a priori profiles will be used that will help to further reduce these unwanted effects. For 13 July 2015, it seems that this effect is slightly more pronounced for the COCCON instrument. For the other days, this is hard to assess as the scatter of the TCCON Réunion Island data continuously increases with time due to degrading mirror quality. This finding is true for both XCO2 and XCH4.

Figure B1Comparisons of intraday XCO2 and XCH4 variability for 1 d in 2015, 2016, 2017, 2018 and 2019 between the COCCON station Gobabeb (blue dots) and the TCCON Réunion Island station (black dots).
COCCON data will be made available in the near future through a web portal hosted at the Karlsruhe Institute of Technology. TCCON Réunion Island and Lauder data can be obtained via https://tccondata.org (last access: 20 October 2020; Reunion: https://doi.org/10.14291/tccon.ggg2014.reunion01.r1, De Mazière et al., 2017; Lauder: https://doi.org/10.14291/TCCON.GGG2014.LAUDER02.R0/1149298, Sherlock et al., 2014; https://doi.org/10.14291/TCCON.GGG2014.LAUDER03.R0, Pollard et al., 2019). The GOSAT TANSO-FTS SWIR L2 data are available from the GOSAT Data Archive Service (GDAS) at https://data2.gosat.nies.go.jp/ (last access: 20 October 2020, NIES GOSAT Project, 2020).
MMF, TB and FH planned the study. MMF and TB installed the COCCON station in Gobabeb with help from FH, FG and JG. RM, MH and PA performed the day to day COCCON measurements. MKS and MdM provided the TCCON Réunion Island data. DFP provided the TCCON Lauder data. DD provided the COCCON Gobabeb data. IM provided the GOSAT data. KS organized the GOSAT specific target mode observations over Gobabeb. MMF performed the data analysis and wrote the paper. All authors reviewed, edited and approved the paper.
The authors declare that they have no conflict of interest.
Publisher’s note: Copernicus Publications remains neutral with regard to jurisdictional claims in published maps and institutional affiliations.
CAMS data were generated using Copernicus Atmosphere Monitoring Service Information 2020. The authors acknowledge support by the ACROSS research infrastructure of the Helmholtz Association of German Research Centres (HGF). The authors acknowledge support by the MOSES research infrastructure of the HGF. The Réunion Island station is operated by the Royal Belgian Institute for Space Aeronomy with financial support since 2014 by the EU project ICOS-Inwire and the ministerial decree for ICOS (FR/35/IC1 to FR/35/IC5) and local activities were supported by LACy/UMR8105 – Université de La Réunion. The authors gratefully acknowledge the NOAA Air Resources Laboratory (ARL) for the provision of the HYSPLIT transport and dispersion model used in this publication.
This research has been supported by the European Space Agency (grant agreement no. ESA-IPL-POE-LG-cl-LE-2015-1129; ESA/contract no. 4000127561/19/INS, project FRM4GHG; ESA/contract no. 4000121212/17/I-EF, project COCCON-PROCEEDS; ESA/contract no. 4000121212/17/I-EF CCN1, project COCCON-PROCEEDS II; and ESA/contract no. 4000128426/19/NL/FF/ab, project QA4EO).
The article processing charges for this open-access publication were covered by the Karlsruhe Institute of Technology (KIT).
This paper was edited by Ilse Aben and reviewed by two anonymous referees.
Agustí-Panareda, A., Massart, S., Chevallier, F., Boussetta, S., Balsamo, G., Beljaars, A., Ciais, P., Deutscher, N. M., Engelen, R., Jones, L., Kivi, R., Paris, J.-D., Peuch, V.-H., Sherlock, V., Vermeulen, A. T., Wennberg, P. O., and Wunch, D.: Forecasting global atmospheric CO2, Atmos. Chem. Phys., 14, 11959–11983, https://doi.org/10.5194/acp-14-11959-2014, 2014. a
Borsdorff, T., aan de Brugh, J., Hu, H., Hasekamp, O., Sussmann, R., Rettinger, M., Hase, F., Gross, J., Schneider, M., Garcia, O., Stremme, W., Grutter, M., Feist, D. G., Arnold, S. G., De Mazière, M., Kumar Sha, M., Pollard, D. F., Kiel, M., Roehl, C., Wennberg, P. O., Toon, G. C., and Landgraf, J.: Mapping carbon monoxide pollution from space down to city scales with daily global coverage, Atmos. Meas. Tech., 11, 5507–5518, https://doi.org/10.5194/amt-11-5507-2018, 2018. a
Butz, A., Dinger, A. S., Bobrowski, N., Kostinek, J., Fieber, L., Fischerkeller, C., Giuffrida, G. B., Hase, F., Klappenbach, F., Kuhn, J., Lübcke, P., Tirpitz, L., and Tu, Q.: Remote sensing of volcanic CO2, HF, HCl, SO2, and BrO in the downwind plume of Mt. Etna, Atmos. Meas. Tech., 10, 1–14, https://doi.org/10.5194/amt-10-1-2017, 2017. a
Chen, J., Viatte, C., Hedelius, J. K., Jones, T., Franklin, J. E., Parker, H., Gottlieb, E. W., Wennberg, P. O., Dubey, M. K., and Wofsy, S. C.: Differential column measurements using compact solar-tracking spectrometers, Atmos. Chem. Phys., 16, 8479–8498, https://doi.org/10.5194/acp-16-8479-2016, 2016. a
Chevallier, F.: Validation report for the CO2 fluxes estimated by atmospheric inversion, v18r3. CAMS deliverable CAMS73_2018SC1_D73.1.4.1-2018-v2_201911, available at: https://ads.atmosphere.copernicus.eu/ (last access: 30 July 2021), 2019. a
Chevallier, F.: Evaluation and Quality control document for the OCO-2-driven CO2 inversion FT19r1. CAMS deliverable CAMS73_2018SC2_D73.4.3.1-2020-v1_202004_v1_Validation FT inversion CO2 fluxes_v1, available at: https://ads.atmosphere.copernicus.eu/ (last access: 30 July 2021), 2020a. a, b
Chevallier, F.: Description of the CO2 inversion production chain 2020. CAMS deliverable CAMS73_2018SC2_ D5.2.1-2020_202004_ CO2 inversion production chain_v1, available at: https://ads.atmosphere.copernicus.eu/ (last access: 30 July 2021), 2020b. a
Chevallier, F., Remaud, M., O'Dell, C. W., Baker, D., Peylin, P., and Cozic, A.: Objective evaluation of surface- and satellite-driven carbon dioxide atmospheric inversions, Atmos. Chem. Phys., 19, 14233–14251, https://doi.org/10.5194/acp-19-14233-2019, 2019. a
Crisp, D., Pollock, H. R., Rosenberg, R., Chapsky, L., Lee, R. A. M., Oyafuso, F. A., Frankenberg, C., O'Dell, C. W., Bruegge, C. J., Doran, G. B., Eldering, A., Fisher, B. M., Fu, D., Gunson, M. R., Mandrake, L., Osterman, G. B., Schwandner, F. M., Sun, K., Taylor, T. E., Wennberg, P. O., and Wunch, D.: The on-orbit performance of the Orbiting Carbon Observatory-2 (OCO-2) instrument and its radiometrically calibrated products, Atmos. Meas. Tech., 10, 59–81, https://doi.org/10.5194/amt-10-59-2017, 2017. a
De Mazière, M., Sha, M. K., Desmet, F., Hermans, C., Scolas, F., Kumps, N., Metzger, J.-M., Duflot, V., and Cammas, J.-P.: TCCON data from Réunion Island (RE), Release GGG2014.R1, https://doi.org/10.14291/tccon.ggg2014.reunion01.r1, 2017. a, b
Detmers, R. and Hasekamp, O.: Product User Guide (PUG) for the RemoTeC XCH4 PROXY GOSAT Data Product v2.3.8, available at: ftp://ftp.sron.nl/pub/pub/RemoTeC/ECV2/CRDP4/DOCS_GOSAT/PUGv4p0_CH4_GOS_SRPR.pdf (last access: 30 July 2021), 2016. a
Deutscher, N. M., Sherlock, V., Mikaloff Fletcher, S. E., Griffith, D. W. T., Notholt, J., Macatangay, R., Connor, B. J., Robinson, J., Shiona, H., Velazco, V. A., Wang, Y., Wennberg, P. O., and Wunch, D.: Drivers of column-average CO2 variability at Southern Hemispheric Total Carbon Column Observing Network sites, Atmos. Chem. Phys., 14, 9883–9901, https://doi.org/10.5194/acp-14-9883-2014, 2014. a
Dils, B., Buchwitz, M., Reuter, M., Schneising, O., Boesch, H., Parker, R., Guerlet, S., Aben, I., Blumenstock, T., Burrows, J. P., Butz, A., Deutscher, N. M., Frankenberg, C., Hase, F., Hasekamp, O. P., Heymann, J., De Mazière, M., Notholt, J., Sussmann, R., Warneke, T., Griffith, D., Sherlock, V., and Wunch, D.: The Greenhouse Gas Climate Change Initiative (GHG-CCI): comparative validation of GHG-CCI SCIAMACHY/ENVISAT and TANSO-FTS/GOSAT CO2 and CH4 retrieval algorithm products with measurements from the TCCON, Atmos. Meas. Tech., 7, 1723–1744, https://doi.org/10.5194/amt-7-1723-2014, 2014. a
Dlugokencky, E. J., Crotwell, A. M., Mund, J. W., Crotwell, M. J., and Thoning, K. W.: Atmospheric Methane Dry Air Mole Fractions from the NOAA ESRL Carbon Cycle Cooperative Global Air Sampling Network 1983–2018, Version: 2019-07, https://doi.org/10.15138/VNCZ-M766, 2019a. a
Dlugokencky, E. J., Mund, J. W., Crotwell, A. M., Crotwell, M. J., and Thoning, K. W.: Atmospheric Carbon Dioxide Dry Air Mole Fractions from the NOAA ESRL Carbon Cycle Cooperative Global Air Sampling Network 1968–2018, Version: 2019-07, https://doi.org/10.15138/wkgj-f215, 2019b. a
Eldering, A., O'Dell, C. W., Wennberg, P. O., Crisp, D., Gunson, M. R., Viatte, C., Avis, C., Braverman, A., Castano, R., Chang, A., Chapsky, L., Cheng, C., Connor, B., Dang, L., Doran, G., Fisher, B., Frankenberg, C., Fu, D., Granat, R., Hobbs, J., Lee, R. A. M., Mandrake, L., McDuffie, J., Miller, C. E., Myers, V., Natraj, V., O'Brien, D., Osterman, G. B., Oyafuso, F., Payne, V. H., Pollock, H. R., Polonsky, I., Roehl, C. M., Rosenberg, R., Schwandner, F., Smyth, M., Tang, V., Taylor, T. E., To, C., Wunch, D., and Yoshimizu, J.: The Orbiting Carbon Observatory-2: first 18 months of science data products, Atmos. Meas. Tech., 10, 549–563, https://doi.org/10.5194/amt-10-549-2017, 2017. a
Eldering, A., Taylor, T. E., O'Dell, C. W., and Pavlick, R.: The OCO-3 mission: measurement objectives and expected performance based on 1 year of simulated data, Atmos. Meas. Tech., 12, 2341–2370, https://doi.org/10.5194/amt-12-2341-2019, 2019. a
Frankenberg, C., Pollock, R., Lee, R. A. M., Rosenberg, R., Blavier, J.-F., Crisp, D., O'Dell, C. W., Osterman, G. B., Roehl, C., Wennberg, P. O., and Wunch, D.: The Orbiting Carbon Observatory (OCO-2): spectrometer performance evaluation using pre-launch direct sun measurements, Atmos. Meas. Tech., 8, 301–313, https://doi.org/10.5194/amt-8-301-2015, 2015. a
Frey, M.: Characterisation and application of portable solar absorption spectrometers for the detection of greenhouse gas emissions from regional anthropogenic sources, PhD thesis, Karlsruhe Institute of Technology, Karlsruhe, https://doi.org/10.5445/IR/1000088312, 2018. a
Frey, M., Hase, F., Blumenstock, T., Groß, J., Kiel, M., Mengistu Tsidu, G., Schäfer, K., Sha, M. K., and Orphal, J.: Calibration and instrumental line shape characterization of a set of portable FTIR spectrometers for detecting greenhouse gas emissions, Atmos. Meas. Tech., 8, 3047–3057, https://doi.org/10.5194/amt-8-3047-2015, 2015. a, b, c
Frey, M., Sha, M. K., Hase, F., Kiel, M., Blumenstock, T., Harig, R., Surawicz, G., Deutscher, N. M., Shiomi, K., Franklin, J. E., Bösch, H., Chen, J., Grutter, M., Ohyama, H., Sun, Y., Butz, A., Mengistu Tsidu, G., Ene, D., Wunch, D., Cao, Z., Garcia, O., Ramonet, M., Vogel, F., and Orphal, J.: Building the COllaborative Carbon Column Observing Network (COCCON): long-term stability and ensemble performance of the EM27/SUN Fourier transform spectrometer, Atmos. Meas. Tech., 12, 1513–1530, https://doi.org/10.5194/amt-12-1513-2019, 2019. a, b, c, d, e, f
Friedlingstein, P., Jones, M. W., O'Sullivan, M., Andrew, R. M., Hauck, J., Peters, G. P., Peters, W., Pongratz, J., Sitch, S., Le Quéré, C., Bakker, D. C. E., Canadell, J. G., Ciais, P., Jackson, R. B., Anthoni, P., Barbero, L., Bastos, A., Bastrikov, V., Becker, M., Bopp, L., Buitenhuis, E., Chandra, N., Chevallier, F., Chini, L. P., Currie, K. I., Feely, R. A., Gehlen, M., Gilfillan, D., Gkritzalis, T., Goll, D. S., Gruber, N., Gutekunst, S., Harris, I., Haverd, V., Houghton, R. A., Hurtt, G., Ilyina, T., Jain, A. K., Joetzjer, E., Kaplan, J. O., Kato, E., Klein Goldewijk, K., Korsbakken, J. I., Landschützer, P., Lauvset, S. K., Lefèvre, N., Lenton, A., Lienert, S., Lombardozzi, D., Marland, G., McGuire, P. C., Melton, J. R., Metzl, N., Munro, D. R., Nabel, J. E. M. S., Nakaoka, S.-I., Neill, C., Omar, A. M., Ono, T., Peregon, A., Pierrot, D., Poulter, B., Rehder, G., Resplandy, L., Robertson, E., Rödenbeck, C., Séférian, R., Schwinger, J., Smith, N., Tans, P. P., Tian, H., Tilbrook, B., Tubiello, F. N., van der Werf, G. R., Wiltshire, A. J., and Zaehle, S.: Global Carbon Budget 2019, Earth Syst. Sci. Data, 11, 1783–1838, https://doi.org/10.5194/essd-11-1783-2019, 2019. a
Gisi, M., Hase, F., Dohe, S., Blumenstock, T., Simon, A., and Keens, A.: XCO2-measurements with a tabletop FTS using solar absorption spectroscopy, Atmos. Meas. Tech., 5, 2969–2980, https://doi.org/10.5194/amt-5-2969-2012, 2012. a, b, c
Hase, F., Blumenstock, T., and Paton-Walsh, C.: Analysis of the instrumental line shape of high-resolution Fourier transform IR spectrometers with gas cell measurements and new retrieval software, Appl. Opt., 38, 3417–3422, https://doi.org/10.1364/AO.38.003417, 1999. a
Hase, F., Frey, M., Blumenstock, T., Groß, J., Kiel, M., Kohlhepp, R., Mengistu Tsidu, G., Schäfer, K., Sha, M. K., and Orphal, J.: Application of portable FTIR spectrometers for detecting greenhouse gas emissions of the major city Berlin, Atmos. Meas. Tech., 8, 3059–3068, https://doi.org/10.5194/amt-8-3059-2015, 2015. a
Hase, F., Frey, M., Kiel, M., Blumenstock, T., Harig, R., Keens, A., and Orphal, J.: Addition of a channel for XCO observations to a portable FTIR spectrometer for greenhouse gas measurements, Atmos. Meas. Tech., 9, 2303–2313, https://doi.org/10.5194/amt-9-2303-2016, 2016. a, b
Inness, A., Ades, M., Agustí-Panareda, A., Barré, J., Benedictow, A., Blechschmidt, A.-M., Dominguez, J. J., Engelen, R., Eskes, H., Flemming, J., Huijnen, V., Jones, L., Kipling, Z., Massart, S., Parrington, M., Peuch, V.-H., Razinger, M., Remy, S., Schulz, M., and Suttie, M.: The CAMS reanalysis of atmospheric composition, Atmos. Chem. Phys., 19, 3515–3556, https://doi.org/10.5194/acp-19-3515-2019, 2019. a
Inoue, M., Morino, I., Uchino, O., Nakatsuru, T., Yoshida, Y., Yokota, T., Wunch, D., Wennberg, P. O., Roehl, C. M., Griffith, D. W. T., Velazco, V. A., Deutscher, N. M., Warneke, T., Notholt, J., Robinson, J., Sherlock, V., Hase, F., Blumenstock, T., Rettinger, M., Sussmann, R., Kyrö, E., Kivi, R., Shiomi, K., Kawakami, S., De Mazière, M., Arnold, S. G., Feist, D. G., Barrow, E. A., Barney, J., Dubey, M., Schneider, M., Iraci, L. T., Podolske, J. R., Hillyard, P. W., Machida, T., Sawa, Y., Tsuboi, K., Matsueda, H., Sweeney, C., Tans, P. P., Andrews, A. E., Biraud, S. C., Fukuyama, Y., Pittman, J. V., Kort, E. A., and Tanaka, T.: Bias corrections of GOSAT SWIR XCO2 and XCH4 with TCCON data and their evaluation using aircraft measurement data, Atmos. Meas. Tech., 9, 3491–3512, https://doi.org/10.5194/amt-9-3491-2016, 2016. a
Jacobs, N., Simpson, W. R., Wunch, D., O'Dell, C. W., Osterman, G. B., Hase, F., Blumenstock, T., Tu, Q., Frey, M., Dubey, M. K., Parker, H. A., Kivi, R., and Heikkinen, P.: Quality controls, bias, and seasonality of CO2 columns in the boreal forest with Orbiting Carbon Observatory-2, Total Carbon Column Observing Network, and EM27/SUN measurements, Atmos. Meas. Tech., 13, 5033–5063, https://doi.org/10.5194/amt-13-5033-2020, 2020. a
Keppel-Aleks, G., Toon, G. C., Wennberg, P. O., and Deutscher, N. M.: Reducing the impact of source brightness fluctuations on spectra obtained by Fourier-transform spectrometry, Appl. Opt., 46, 4774–4779, https://doi.org/10.1364/AO.46.004774, 2007. a
Kiel, M., Hase, F., Blumenstock, T., and Kirner, O.: Comparison of XCO abundances from the Total Carbon Column Observing Network and the Network for the Detection of Atmospheric Composition Change measured in Karlsruhe, Atmos. Meas. Tech., 9, 2223–2239, https://doi.org/10.5194/amt-9-2223-2016, 2016. a
Kiel, M., O'Dell, C. W., Fisher, B., Eldering, A., Nassar, R., MacDonald, C. G., and Wennberg, P. O.: How bias correction goes wrong: measurement of affected by erroneous surface pressure estimates, Atmos. Meas. Tech., 12, 2241–2259, https://doi.org/10.5194/amt-12-2241-2019, 2019. a
Kille, N., Chiu, R., Frey, M., Hase, F., Sha, M. K., Blumenstock, T., Hannigan, J. W., Orphal, J., Bon, D., and Volkamer, R.: Separation of Methane Emissions From Agricultural and Natural Gas Sources in the Colorado Front Range, Geophys. Res. Lett., 46, 3990–3998, https://doi.org/10.1029/2019GL082132, 2019. a
Kuze, A., Suto, H., Nakajima, M., and Hamazaki, T.: Thermal and near infrared sensor for carbon observation Fourier-transform spectrometer on the Greenhouse Gases Observing Satellite for greenhouse gases monitoring, Appl. Opt., 48, 6716–6733, https://doi.org/10.1364/AO.48.006716, 2009. a, b
Luther, A., Kleinschek, R., Scheidweiler, L., Defratyka, S., Stanisavljevic, M., Forstmaier, A., Dandocsi, A., Wolff, S., Dubravica, D., Wildmann, N., Kostinek, J., Jöckel, P., Nickl, A.-L., Klausner, T., Hase, F., Frey, M., Chen, J., Dietrich, F., Nȩcki, J., Swolkień, J., Fix, A., Roiger, A., and Butz, A.: Quantifying CH4 emissions from hard coal mines using mobile sun-viewing Fourier transform spectrometry, Atmos. Meas. Tech., 12, 5217–5230, https://doi.org/10.5194/amt-12-5217-2019, 2019. a
Makarova, M. V., Alberti, C., Ionov, D. V., Hase, F., Foka, S. C., Blumenstock, T., Warneke, T., Virolainen, Y. A., Kostsov, V. S., Frey, M., Poberovskii, A. V., Timofeyev, Y. M., Paramonova, N. N., Volkova, K. A., Zaitsev, N. A., Biryukov, E. Y., Osipov, S. I., Makarov, B. K., Polyakov, A. V., Ivakhov, V. M., Imhasin, H. Kh., and Mikhailov, E. F.: Emission Monitoring Mobile Experiment (EMME): an overview and first results of the St. Petersburg megacity campaign 2019, Atmos. Meas. Tech., 14, 1047–1073, https://doi.org/10.5194/amt-14-1047-2021, 2021. a
Massart, S., Agustí-Panareda, A., Heymann, J., Buchwitz, M., Chevallier, F., Reuter, M., Hilker, M., Burrows, J. P., Deutscher, N. M., Feist, D. G., Hase, F., Sussmann, R., Desmet, F., Dubey, M. K., Griffith, D. W. T., Kivi, R., Petri, C., Schneider, M., and Velazco, V. A.: Ability of the 4-D-Var analysis of the GOSAT BESD XCO2 retrievals to characterize atmospheric CO2 at large and synoptic scales, Atmos. Chem. Phys., 16, 1653–1671, https://doi.org/10.5194/acp-16-1653-2016, 2016. a
Moore III, B., Crowell, S. M. R., Rayner, P. J., Kumer, J., O'Dell, C. W., O'Brien, D., Utembe, S., Polonsky, I., Schimel, D., and Lemen, J.: The Potential of the Geostationary Carbon Cycle Observatory (GeoCarb) to Provide Multi-scale Constraints on the Carbon Cycle in the Americas, Frontiers in Environmental Science, 6, 109, https://doi.org/10.3389/fenvs.2018.00109, 2018. a
Morino, I., Uchino, O., Inoue, M., Yoshida, Y., Yokota, T., Wennberg, P. O., Toon, G. C., Wunch, D., Roehl, C. M., Notholt, J., Warneke, T., Messerschmidt, J., Griffith, D. W. T., Deutscher, N. M., Sherlock, V., Connor, B., Robinson, J., Sussmann, R., and Rettinger, M.: Preliminary validation of column-averaged volume mixing ratios of carbon dioxide and methane retrieved from GOSAT short-wavelength infrared spectra, Atmos. Meas. Tech., 4, 1061–1076, https://doi.org/10.5194/amt-4-1061-2011, 2011. a
NIES GOSAT Project: GOSAT FTS SWIR Level 2 CO2 Product (V02.81), GOSAT Project website, available at: https://data2.gosat.nies.go.jp, release note available at: https://data2.gosat.nies.go.jp/doc/documents/ReleaseNote_FTSSWIRL2_V02.81_en.pdf, last access: 20 October 2020. a
Nivitanont, J., Crowell, S. M. R., and Moore III, B.: A scanning strategy optimized for signal-to-noise ratio for the Geostationary Carbon Cycle Observatory (GeoCarb) instrument, Atmos. Meas. Tech., 12, 3317–3334, https://doi.org/10.5194/amt-12-3317-2019, 2019. a
O'Dell, C. W., Eldering, A., Wennberg, P. O., Crisp, D., Gunson, M. R., Fisher, B., Frankenberg, C., Kiel, M., Lindqvist, H., Mandrake, L., Merrelli, A., Natraj, V., Nelson, R. R., Osterman, G. B., Payne, V. H., Taylor, T. E., Wunch, D., Drouin, B. J., Oyafuso, F., Chang, A., McDuffie, J., Smyth, M., Baker, D. F., Basu, S., Chevallier, F., Crowell, S. M. R., Feng, L., Palmer, P. I., Dubey, M., García, O. E., Griffith, D. W. T., Hase, F., Iraci, L. T., Kivi, R., Morino, I., Notholt, J., Ohyama, H., Petri, C., Roehl, C. M., Sha, M. K., Strong, K., Sussmann, R., Te, Y., Uchino, O., and Velazco, V. A.: Improved retrievals of carbon dioxide from Orbiting Carbon Observatory-2 with the version 8 ACOS algorithm, Atmos. Meas. Tech., 11, 6539–6576, https://doi.org/10.5194/amt-11-6539-2018, 2018. a
Olsen, S. C. and Randerson, J. T.: Differences between surface and column atmospheric CO2 and implications for carbon cycle research, J. Geophys. Res.-Atmos., 109, D02301, https://doi.org/10.1029/2003JD003968, 2004. a, b, c, d
Pollard, D. F., Sherlock, V., Robinson, J., Deutscher, N. M., Connor, B., and Shiona, H.: The Total Carbon Column Observing Network site description for Lauder, New Zealand, Earth Syst. Sci. Data, 9, 977–992, https://doi.org/10.5194/essd-9-977-2017, 2017. a
Pollard, D. F., Robinson, J., and Shiona, H.: TCCON data from Lauder (NZ), Release GGG2014.R0, https://doi.org/10.14291/TCCON.GGG2014.LAUDER03.R0, 2019. a, b
Pollard, D. F., Robinson, J., Shiona, H., and Smale, D.: Intercomparison of Total Carbon Column Observing Network (TCCON) data from two Fourier transform spectrometers at Lauder, New Zealand, Atmos. Meas. Tech., 14, 1501–1510, https://doi.org/10.5194/amt-14-1501-2021, 2021. a
Rodgers, C. D. and Connor, B. J.: Intercomparison of remote sounding instruments, J. Geophys. Res.-Atmos., 108, 4116, https://doi.org/10.1029/2002JD002299, 2003. a
Saeki, T., Saito, R., Belikov, D., and Maksyutov, S.: Global high-resolution simulations of CO2 and CH4 using a NIES transport model to produce a priori concentrations for use in satellite data retrievals, Geosci. Model Dev., 6, 81–100, https://doi.org/10.5194/gmd-6-81-2013, 2013. a
Schneider, M. and Hase, F.: Ground-based FTIR water vapour profile analyses, Atmos. Meas. Tech., 2, 609–619, https://doi.org/10.5194/amt-2-609-2009, 2009. a
Segers, A. and Houweling, S.: Validation of the CH4 surface flux inversion reanalysis 1990–2018. CAMS deliverable CAMS73_2018SC1_D73.2.4.1-2019_202021_validation_CH4_1990-2018_v1, available at: https://ads.atmosphere.copernicus.eu/ (last access: 30 July 2021), 2020a. a, b
Segers, A. and Houweling, S.: Description of the CH4 inversion production chain. CAMS deliverable CAMS73_2018SC1_D73.5.2.2-‐2019_202001_production_chain_v1, available at: https://ads.atmosphere.copernicus.eu/ (last access: 30 July 2021), 2020b. a
Sha, M. K., De Mazière, M., Notholt, J., Blumenstock, T., Chen, H., Dehn, A., Griffith, D. W. T., Hase, F., Heikkinen, P., Hermans, C., Hoffmann, A., Huebner, M., Jones, N., Kivi, R., Langerock, B., Petri, C., Scolas, F., Tu, Q., and Weidmann, D.: Intercomparison of low- and high-resolution infrared spectrometers for ground-based solar remote sensing measurements of total column concentrations of CO2, CH4, and CO, Atmos. Meas. Tech., 13, 4791–4839, https://doi.org/10.5194/amt-13-4791-2020, 2020. a, b
Sha, M. K., Langerock, B., Blavier, J.-F. L., Blumenstock, T., Borsdorff, T., Buschmann, M., Dehn, A., De Mazière, M., Deutscher, N. M., Feist, D. G., García, O. E., Griffith, D. W. T., Grutter, M., Hannigan, J. W., Hase, F., Heikkinen, P., Hermans, C., Iraci, L. T., Jeseck, P., Jones, N., Kivi, R., Kumps, N., Landgraf, J., Lorente, A., Mahieu, E., Makarova, M. V., Mellqvist, J., Metzger, J.-M., Morino, I., Nagahama, T., Notholt, J., Ohyama, H., Ortega, I., Palm, M., Petri, C., Pollard, D. F., Rettinger, M., Robinson, J., Roche, S., Roehl, C. M., Röhling, A. N., Rousogenous, C., Schneider, M., Shiomi, K., Smale, D., Stremme, W., Strong, K., Sussmann, R., Té, Y., Uchino, O., Velazco, V. A., Vrekoussis, M., Wang, P., Warneke, T., Wizenberg, T., Wunch, D., Yamanouchi, S., Yang, Y., and Zhou, M.: Validation of Methane and Carbon Monoxide from Sentinel-5 Precursor using TCCON and NDACC-IRWG stations, Atmos. Meas. Tech. Discuss. [preprint], https://doi.org/10.5194/amt-2021-36, in review, 2021. a
Sherlock, V., Connor, B., Robinson, J., Shiona, H., Smale, D., and Pollard, D. F.: TCCON data from Lauder (NZ), 125HR, Release GGG2014.R0 (Version GGG2014.R0), CaltechDATA [data set], https://doi.org/10.14291/TCCON.GGG2014.LAUDER02.R0/1149298, 2014. a, b
Stein, A. F., Draxler, R. R., Rolph, G. D., Stunder, B. J. B., Cohen, M. D., and Ngan, F.: NOAA’s HYSPLIT Atmospheric Transport and Dispersion Modeling System, B. Am. Meteorol. Soc., 96, 2059–2077, https://doi.org/10.1175/BAMS-D-14-00110.1, 2016. a
Suto, H., Kataoka, F., Kikuchi, N., Knuteson, R. O., Butz, A., Haun, M., Buijs, H., Shiomi, K., Imai, H., and Kuze, A.: Thermal and near-infrared sensor for carbon observation Fourier transform spectrometer-2 (TANSO-FTS-2) on the Greenhouse gases Observing SATellite-2 (GOSAT-2) during its first year in orbit, Atmos. Meas. Tech., 14, 2013–2039, https://doi.org/10.5194/amt-14-2013-2021, 2021. a
Tu, Q., Hase, F., Blumenstock, T., Kivi, R., Heikkinen, P., Sha, M. K., Raffalski, U., Landgraf, J., Lorente, A., Borsdorff, T., Chen, H., Dietrich, F., and Chen, J.: Intercomparison of atmospheric CO2 and CH4 abundances on regional scales in boreal areas using Copernicus Atmosphere Monitoring Service (CAMS) analysis, COllaborative Carbon Column Observing Network (COCCON) spectrometers, and Sentinel-5 Precursor satellite observations, Atmos. Meas. Tech., 13, 4751–4771, https://doi.org/10.5194/amt-13-4751-2020, 2020. a
Veefkind, J. P., Aben, I., McMullan, K., Förster, H., de Vries, J., Otter, G., Claas, J., Eskes, H. J., de Haan, J. F., Kleipool, Q., van Weele, M., Hasekamp, O., Hoogeveen, R., Landgraf, J., Snel, R., Tol, P., Ingmann, P., Voors, R., Kruizinga, B., Vink, R., Visser, H., and Levelt, P. F.: TROPOMI on the ESA Sentinel-5 Precursor: A GMES mission for global observations of the atmospheric composition for climate, air quality and ozone layer applications, Remote Sens. Environ., 120, 70–83, https://doi.org/10.1016/j.rse.2011.09.027, 2012. a
Velazco, V. A., Deutscher, N. M., Morino, I., Uchino, O., Bukosa, B., Ajiro, M., Kamei, A., Jones, N. B., Paton-Walsh, C., and Griffith, D. W. T.: Satellite and ground-based measurements of XCO2 in a remote semiarid region of Australia, Earth Syst. Sci. Data, 11, 935–946, https://doi.org/10.5194/essd-11-935-2019, 2019. a, b, c, d
Viatte, C., Lauvaux, T., Hedelius, J. K., Parker, H., Chen, J., Jones, T., Franklin, J. E., Deng, A. J., Gaudet, B., Verhulst, K., Duren, R., Wunch, D., Roehl, C., Dubey, M. K., Wofsy, S., and Wennberg, P. O.: Methane emissions from dairies in the Los Angeles Basin, Atmos. Chem. Phys., 17, 7509–7528, https://doi.org/10.5194/acp-17-7509-2017, 2017. a
Vogel, F. R., Frey, M., Staufer, J., Hase, F., Broquet, G., Xueref-Remy, I., Chevallier, F., Ciais, P., Sha, M. K., Chelin, P., Jeseck, P., Janssen, C., Té, Y., Groß, J., Blumenstock, T., Tu, Q., and Orphal, J.: XCO2 in an emission hot-spot region: the COCCON Paris campaign 2015, Atmos. Chem. Phys., 19, 3271–3285, https://doi.org/10.5194/acp-19-3271-2019, 2019. a
Washenfelder, R. A., Toon, G. C., Blavier, J.-F., Yang, Z., Allen, N. T., Wennberg, P. O., Vay, S. A., Matross, D. M., and Daube, B. C.: Carbon dioxide column abundances at the Wisconsin Tall Tower site, J. Geophys. Res.-Atmos., 111, D22305, https://doi.org/10.1029/2006JD007154, 2006. a
Wu, L., Hasekamp, O., Hu, H., Landgraf, J., Butz, A., aan de Brugh, J., Aben, I., Pollard, D. F., Griffith, D. W. T., Feist, D. G., Koshelev, D., Hase, F., Toon, G. C., Ohyama, H., Morino, I., Notholt, J., Shiomi, K., Iraci, L., Schneider, M., de Mazière, M., Sussmann, R., Kivi, R., Warneke, T., Goo, T.-Y., and Té, Y.: Carbon dioxide retrieval from OCO-2 satellite observations using the RemoTeC algorithm and validation with TCCON measurements, Atmos. Meas. Tech., 11, 3111–3130, https://doi.org/10.5194/amt-11-3111-2018, 2018. a
Wunch, D., Toon, G. C., Wennberg, P. O., Wofsy, S. C., Stephens, B. B., Fischer, M. L., Uchino, O., Abshire, J. B., Bernath, P., Biraud, S. C., Blavier, J.-F. L., Boone, C., Bowman, K. P., Browell, E. V., Campos, T., Connor, B. J., Daube, B. C., Deutscher, N. M., Diao, M., Elkins, J. W., Gerbig, C., Gottlieb, E., Griffith, D. W. T., Hurst, D. F., Jiménez, R., Keppel-Aleks, G., Kort, E. A., Macatangay, R., Machida, T., Matsueda, H., Moore, F., Morino, I., Park, S., Robinson, J., Roehl, C. M., Sawa, Y., Sherlock, V., Sweeney, C., Tanaka, T., and Zondlo, M. A.: Calibration of the Total Carbon Column Observing Network using aircraft profile data, Atmos. Meas. Tech., 3, 1351–1362, https://doi.org/10.5194/amt-3-1351-2010, 2010. a
Wunch, D., C Toon, G., L Blavier, J.-F., A Washenfelder, R., Notholt, J., J Connor, B., W T Griffith, D., Sherlock, V., and Wennberg, P.: The Total Carbon Column Observing Network, Philos. T. Roy. Soc. A, 369, 2087–112, https://doi.org/10.1098/rsta.2010.0240, 2011. a, b
Wunch, D., Toon, G. C., Sherlock, V., Deutscher, N. M., Liu, X., Feist, D. G., and Wennberg, P. O.: Documentation for the 2014 TCCON Data Release. CaltechDATA [data set], https://doi.org/10.14291/TCCON.GGG2014.DOCUMENTATION.R0/1221662, 2015. a, b
Wunch, D., Wennberg, P. O., Osterman, G., Fisher, B., Naylor, B., Roehl, C. M., O'Dell, C., Mandrake, L., Viatte, C., Kiel, M., Griffith, D. W. T., Deutscher, N. M., Velazco, V. A., Notholt, J., Warneke, T., Petri, C., De Maziere, M., Sha, M. K., Sussmann, R., Rettinger, M., Pollard, D., Robinson, J., Morino, I., Uchino, O., Hase, F., Blumenstock, T., Feist, D. G., Arnold, S. G., Strong, K., Mendonca, J., Kivi, R., Heikkinen, P., Iraci, L., Podolske, J., Hillyard, P. W., Kawakami, S., Dubey, M. K., Parker, H. A., Sepulveda, E., García, O. E., Te, Y., Jeseck, P., Gunson, M. R., Crisp, D., and Eldering, A.: Comparisons of the Orbiting Carbon Observatory-2 (OCO-2) measurements with TCCON, Atmos. Meas. Tech., 10, 2209–2238, https://doi.org/10.5194/amt-10-2209-2017, 2017. a
Yoshida, Y., Kikuchi, N., Morino, I., Uchino, O., Oshchepkov, S., Bril, A., Saeki, T., Schutgens, N., Toon, G. C., Wunch, D., Roehl, C. M., Wennberg, P. O., Griffith, D. W. T., Deutscher, N. M., Warneke, T., Notholt, J., Robinson, J., Sherlock, V., Connor, B., Rettinger, M., Sussmann, R., Ahonen, P., Heikkinen, P., Kyrö, E., Mendonca, J., Strong, K., Hase, F., Dohe, S., and Yokota, T.: Improvement of the retrieval algorithm for GOSAT SWIR XCO2 and XCH4 and their validation using TCCON data, Atmos. Meas. Tech., 6, 1533–1547, https://doi.org/10.5194/amt-6-1533-2013, 2013. a, b, c
- Abstract
- Introduction
- Gobabeb site description, instrumentation and data analysis
- Measurement results
- Gobabeb data comparisons
- Influence of the African biosphere on the Gobabeb observations
- Conclusions and outlook
- Appendix A: Calibration measurements in Karlsruhe (2018 and 2019)
- Appendix B: Intraday XCO2 and XCH4 variability at Gobabeb and Réunion Island
- Data availability
- Author contributions
- Competing interests
- Disclaimer
- Acknowledgements
- Financial support
- Review statement
- References