the Creative Commons Attribution 4.0 License.
the Creative Commons Attribution 4.0 License.
 | 24 Sep 2021
Intercomparison of O2 ∕ N2 ratio scales among AIST, NIES, TU, and SIO based on a round-robin exercise using gravimetric standard mixtures
Shigeyuki Ishidoya
Yasunori Tohjima
Shinji Morimoto
Ralph F. Keeling
Adam Cox
Shuichiro Takebayashi
Shohei Murayama
A study was conducted to compare the δ() scales used by four laboratories engaged in atmospheric δ() measurements. These laboratories are the Research Institute for Environmental Management Technology, Advanced Industrial Science and Technology (EMRI/AIST); the National Institute for Environmental Studies (NIES); Tohoku University (TU); and Scripps Institution of Oceanography (SIO). Therefore, five high-precision standard mixtures for the O2 molar fraction gravimetrically prepared by the National Metrology Institute of Japan, AIST (NMIJ/AIST) with a standard uncertainty of less than 5 per meg (0.001 ‰) were used as round-robin standard mixtures. EMRI/AIST, NIES, TU, and SIO reported the analyzed values of the standard mixtures on their own δ() scales, and the values were compared with the δ() values gravimetrically determined by NMIJ/AIST (the NMIJ/AIST scale). The δ() temporal drift in the five standard mixtures during the intercomparison experiment from May 2017 to March 2020 was corrected based on the δ() values analyzed before and after the laboratory measurements by EMRI/AIST. The scales are compared based on offsets in zero and span. The relative span offsets of EMRI/AIST, TU, NIES, and SIO scales against the NMIJ/AIST scale were , , 3.39 %±0.13 %, and 0.93 %±0.10 %, respectively. The largest offset corresponded to a 0.30 Pg yr−1 decrease and increase in global estimates for land biospheric and oceanic CO2 uptakes based on trends in atmospheric CO2 and δ(). The deviations in the measured δ() values on the laboratory scales from the NMIJ/AIST scale are 65.8±2.2, 425.7±3.1, 404.5±3.0, and 596.4±2.4 per meg for EMRI/AIST, TU, NIES, and SIO, respectively. The difference between atmospheric δ() values observed at Hateruma Island (HAT; 24.05∘ N, 123.81∘ E), Japan, by EMRI/AIST and NIES were reduced from to per meg by converting their scales to the NMIJ/AIST scale.
- Article
(1726 KB) - Full-text XML
- Companion paper
- BibTeX
- EndNote


Observing the long-term change in atmospheric O2 molar fraction combined with CO2 observation enables us to estimate terrestrial biospheric and oceanic CO2 uptakes separately (Manning and Keeling, 2006; Tohjima et al., 2008; Ishidoya et al., 2012a, b). O2 is exchanged with CO2 with distinct stoichiometric ratios for terrestrial biospheric activities and fossil fuel combustion (Keeling, 1988a; Severinghaus, 1995). Meanwhile, the ocean CO2 uptake and O2 emissions are decoupled since the ocean acts as a carbon sink by physicochemically dissolving the CO2 (e.g., Keeling et al., 1993). Various laboratories have performed measurements of atmospheric O2 since the early 1990s (e.g., Keeling et al., 1996; Bender et al., 2005; Manning and Keeling, 2006; Tohjima et al., 2008, 2019; Ishidoya et al., 2012a, b; Goto et al., 2017). Recently, Resplandy et al. (2019) introduced a method to estimate the global ocean heat content (OHC) increase based on atmospheric O2 and CO2 measurements. They extracted solubility-driven components of the atmospheric potential oxygen () (Stephens et al., 1998) by combining their observational results with climate and ocean models. The global OHC change is a fundamental measure of global warming. Indeed, the ocean takes in more than 90 % of the Earth's excess energy as evaluated based on ocean temperature measurements using Argo floats (e.g., Levitus et al., 2012). Thus, the atmospheric O2 measurements are linked to the global CO2 budget and OHC.
The approaches described above rely on precise measurements that can detect micro-mole-per-mole-level changes in the atmospheric O2 molar fraction (∼21 %). After Keeling and Shertz (1992) succeeded in developing the measurement technique based on the interferometer, various measurement techniques have been developed to quantify the atmospheric O2 molar fraction, including using mass spectrometry (Bender et al., 1994; Ishidoya et al., 2003; Ishidoya and Murayama, 2014), a paramagnetic technique (Manning et al., 1999; Ishidoya et al., 2017; Aoki and Shimosaka, 2018), a vacuum-ultraviolet absorption technique (Stephens et al., 2003), gas chromatography (Tohjima, 2000), a method using fuel cells (Stephens et al., 2007; Goto et al., 2013), and a cavity ring-down spectroscopy analyzer (Berhanu et al., 2019). All programs have reported changes in O2 regarding the equivalent changes in the ratio by convention. This is expressed as the relative change compared to an arbitrary reference (Keeling and Shertz, 1992; Keeling et al., 2004) in per meg (one per meg is equal to ).
In the equation, n depicts the molar amount of each substance, and the subscripts sam and ref represent sample and reference air, respectively. The δ() value multiplied by 106 is expressed in per meg. The O2 molar fraction in air for 2015 is 209 339.1±1.1 µmol mol−1 (Aoki et al., 2019). Therefore, adding 1 µmol of O2 to a mole of dry air will increase δ() by 4.8 per meg.
Each laboratory has typically employed its own reference based on natural air compressed and stored in high-pressure cylinders. Each laboratory has also assumed responsibility for calibrating the relationship between the measured instrument response and the reported change per meg units (span sensitivity). Therefore, the reported trends in are potentially biased by any long-term drift in the ratio of the reference cylinders (zero drift) or errors in the calibrated span sensitivity of the instrument (span error). Note that a span stability below 5 per meg is required for global CO2 budget analyses based on δ() observations (Table 2 in Keeling et al., 1993). Challenges in achieving this stability include fractionations of O2 and N2 induced by pressure, temperature, and water vapor gradients (Keeling et al., 2007), adsorption and desorption of the constituents on the cylinder's inner surface (Leuenberger et al., 2015), and permeation and leakage of the constituents from and through the valve (Sturm et al., 2004; Keeling et al., 2007). Tohjima et al. (2005) developed high-precision O2 standard mixtures with 2.9 µmol mol−1 uncertainty for the O2 molar fraction (equivalent to 15.5 per meg uncertainty for δ()) in absolute terms to resolve these problems by preparing gravimetric standard mixtures of pure N2, O2, Ar, and CO2. Their study was significant, but uncertainty larger than those recommended by Keeling et al. (1993) still remains, as mentioned above.
Recently, a technique was developed for preparing high-precision primary standard mixtures with standard uncertainties less than 5 per meg for δ() at the National Metrology Institute of Japan, Advanced Industrial Science and Technology (NMIJ/AIST) (Aoki et al., 2019). The high-precision standard mixtures allow us to evaluate span offset accurately and precisely. Absolute drift of scale zero offset is also able to be evaluated accurately and precisely by periodically comparing laboratory reference air with the high-precision standard mixtures, which are prepared every time for each comparison. In this study, we conducted intercomparison experiments to compare span sensitivities among the scales of the Research Institute for Environmental Management Technology, Advanced Industrial Science and Technology (EMRI/AIST); the National Institute for Environmental Studies (NIES); Tohoku University (TU); and Scripps Institution of Oceanography (SIO) based on a round-robin exercise for laboratory measurements of the developed high-precision standard mixtures in order. Following this, a regression analysis is applied to the intercomparison results to investigate the relationship between the individual laboratory scales. Results showed a slight but significant difference in the span sensitivities of the individual scales. Finally, we compare the atmospheric δ() values observed on the EMRI/AIST scale with those on the NIES scale for the air samples collected at Hateruma Island (HAT; 24∘03' N, 123∘49' E), Japan, using the relationship between the individual laboratory scales obtained in this study.
2.1 NMIJ/AIST scale and round-robin standard mixtures
In this study, five high-precision standard mixtures with standard uncertainties less than 5 per meg for δ() were used as round-robin standard mixtures. The NMIJ/AIST previously mixed them gravimetrically following ISO 6142-1:2015 (Aoki et al., 2019). The details of the gravimetric preparation technique were given in previous papers (Aoki et al., 2019, Matsumoto et al., 2004, 2008). They were contained in 10 L aluminum-alloy cylinders (Luxfer Gas Cylinders, UK) with a diaphragm brass valve (G-55, Hamai Industries Limited, Japan). Table 1 shows the gravimetrically determined molar fractions for N2, O2, Ar, CO2, and δ() in the round-robin standard mixtures. The gravimetric values of N2, O2, Ar, and CO2 molar fractions were recalculated based on the cylinders' updated expansion rate, which was used for the correction of buoyancy acting on a cylinder. The updated rate was determined as 1.62±0.06 mL Mpa−1 (unpublished data), which was determined by measuring the change in water volume with depletion of inner pressure of the cylinders sunk in water since the previous expansion rate (2.2±0.2 mL Mpa−1) was provided by a cylinder supplier. The source gases used are pure CO2 (>99.998 %, Nippon Ekitan Corp., Japan), pure Ar (99.9999 %, G1-grade, Japan Fine Products, Japan), pure O2 (99.99995 %, G1-grade, Japan Fine Products, Japan), and pure N2 (99.99995 %, G1-grade, Japan Fine Products, Japan). Impurities in the source gases were identified and quantified via several techniques. GC equipped with a thermal conductivity detector (GC/TCD) was used to analyze N2, O2, CH4, and H2 in pure CO2. O2 and Ar in pure N2 and N2 in pure O2 were analyzed using GC equipped with a mass spectrometer. A Fourier-transform infrared spectrometer was used to detect CO2, CH4, and CO in pure N2, O2, and Ar. A galvanic cell O2 analyzer was used to quantify O2 in pure Ar. A capacitance-type moisture sensor measured H2O in pure CO2, and a cavity ring-down moisture analyzer measured H2O in pure N2, O2, and Ar.
Table 1The gravimetric values of N2, O2, Ar, and CO2 molar fractions and δ() in five round-robin standard mixtures prepared by the NMIJ/AISTa.
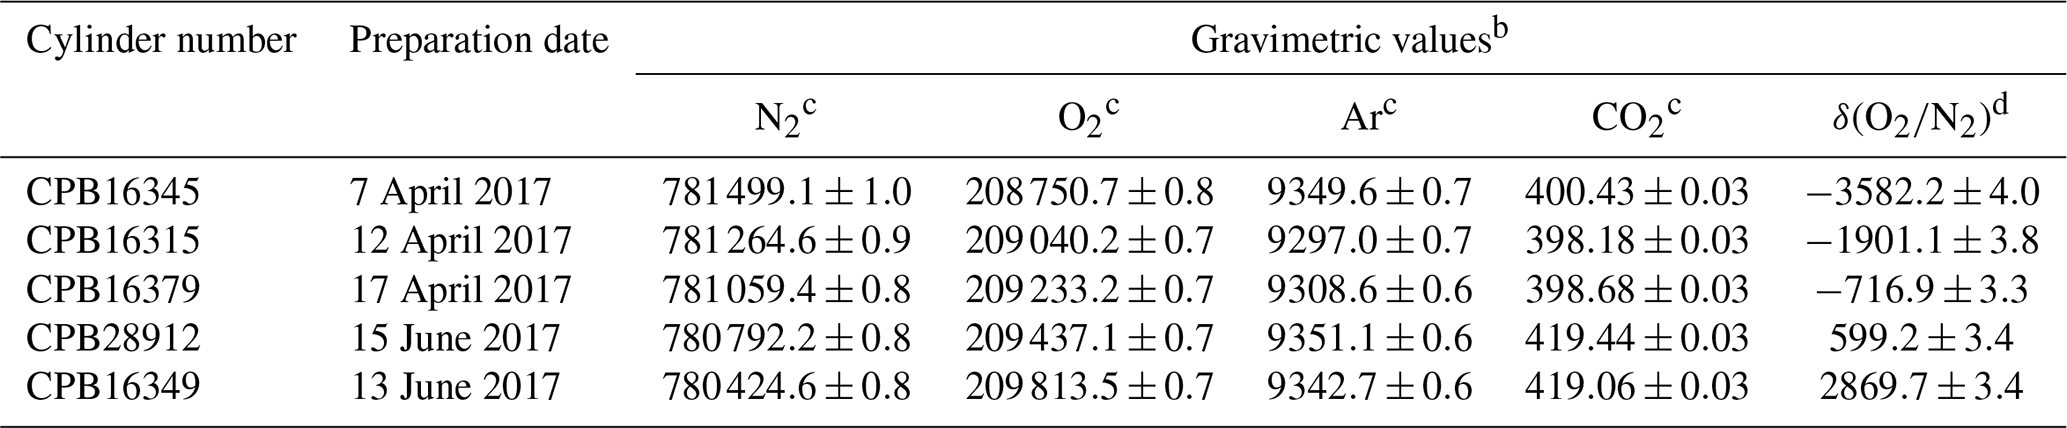
a The high-precision standard mixtures were prepared in a previous study (Aoki et al., 2019). However, the gravimetric values of N2, O2, Ar, and CO2 molar fractions were recalculated based on the cylinders' expansion rate, which was determined by measuring the change in water volume with depletion of inner pressure of the cylinders sunk in water from 110 to 1 bar. The value was determined as 1.62±0.06 mL MPa−1 by our experiment (unpublished data) and used to correct the buoyancy of cylinders. b The numbers following the symbol ± denote the standard uncertainty of the gravimetric value, which was calculated according to the law of propagation of uncertainties. c Figures are given in the unit of µmol mol−1 in dry air. d Figures are given in the unit of per meg. These values were calculated against the ratio, which assigned a value of zero on the NMIJ/AIST scale to correspond to a ratio in the atmosphere value in 2015 () (Aoki et al., 2019).
In this study, the absolute scale determined using the gravimetric values in the round-robin standard mixtures is hereafter called the NMIJ/AIST scale. The NMIJ/AIST scale is presented only for scientific research and is uncertified by NMIJ. Here, δ()NMIJ/AIST represents δ() on the NMIJ/AIST scale. We arbitrarily assigned zero on the NMIJ/AIST scale to be a ratio of , which corresponds to the atmospheric ratio for 2015 (Aoki et al., 2019). The range of δ()NMIJ/AIST values for the round-robin standard mixtures was −3600 to 2900 per meg in order to evaluate the difference of the individual span sensitivities accurately, although it is larger than their variation in air. The standard uncertainties of the δ()NMIJ/AIST values were 3.3 to 4.0 per meg.
2.2 Procedure of intercomparison
The EMRI/AIST, NIES, TU, and SIO conducted the intercomparison experiment. Five round-robin standard mixtures were analyzed in the order of EMRI/AIST (May to July 2017), NIES (September to November 2017), TU (December 2017 to January 2018), and SIO (May to December 2018). Each lab reported the δ()round-robin values as determined against their scales to the NMIJ/AIST. The δ()round-robin hereafter represents the δ() values measured by individual laboratories. Each lab analyzed air delivered from the cylinders after placing them horizontally for more than 5 d after their transport to avoid a change in δ() values in the standard mixtures by thermal diffusion and gravitational fractionation. The δ()round-robin values determined by the individual laboratories using their methods were compared with the δ()NMIJ/AIST values. EMRI/AIST and TU used mass spectrometry, NIES used GC, and SIO used the interferometric method, as summarized in Table 2. The stability of ratios in the round-robin standard mixtures during the intercomparison experiment was evaluated by measuring their δ()round-robin values using a mass spectrometer (Delta-V, Thermo Fisher Scientific Inc., USA) (Ishidoya and Murayama, 2014) at EMRI/AIST during the intercomparison experiment.
Table 2Measurement techniques, measurement species, and reported values of EMRI/AIST, NIES, TU, and SIO.
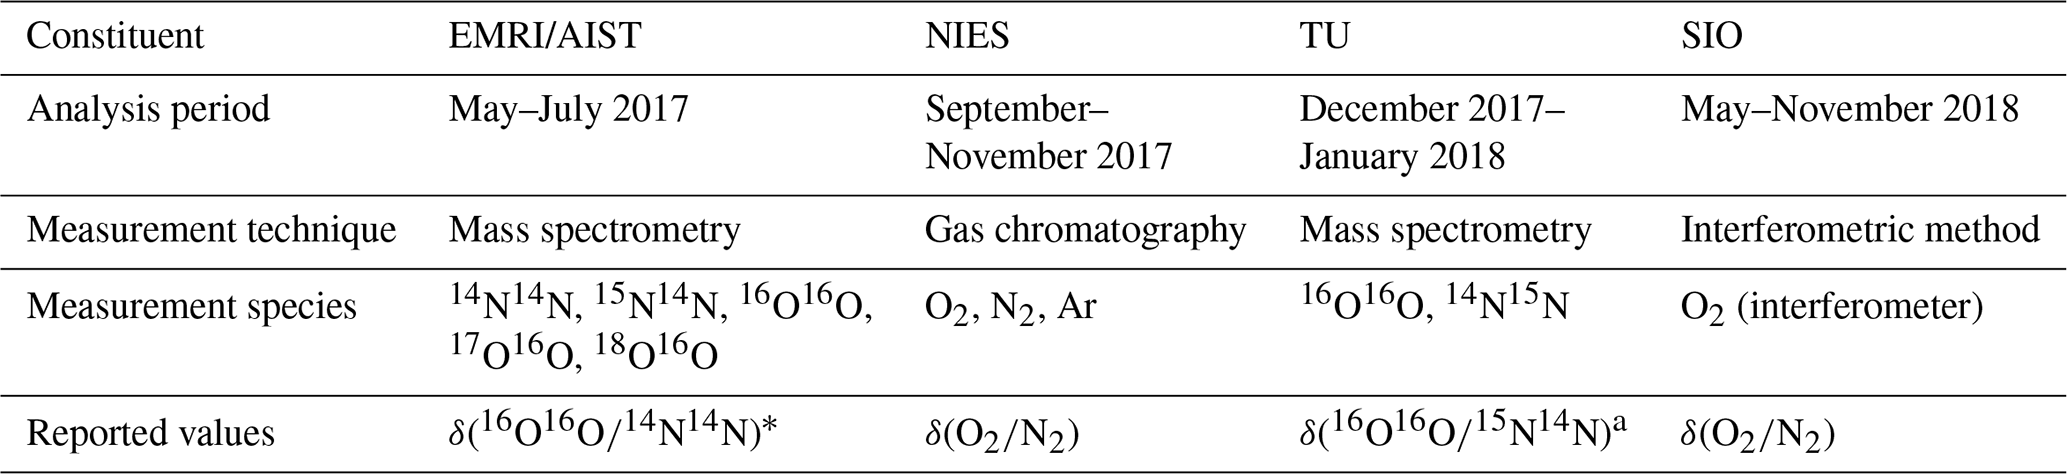
∗ The δ() values of EMRI/AIST and TU were computed using δ(), δ(), and δ() measured by EMRI/AIST (see text). CO2 molar fractions measured by EMRI/AIST were used to correct δ() values.
Ar molar fractions in the round-robin standard mixtures were from 9297 to 9351 µmol mol−1, which are much larger than variations in the tropospheric air (less than 1 µmol mol−1) (Keeling et al., 2004). Isotopic ratios of δ(), δ(), and δ() in the round-robin standard mixtures were determined by the mass spectrometer at EMRI/AIST to be 4.7 ‰ , 9 ‰ , and 2.4 ‰ , which are larger than in the atmosphere. The atmospheric value is used as a primary standard (De Laeter et al., 2003; Wieser and Berglund, 2009). δ(), δ(), and δ() are expressed as follows.
Here, the isotopic ratios of δ(), δ(), and δ() were approximately equal to those of δ(), δ(), and δ(). This is because , , and tended to be lower than , , and by 5000, 1000, and 500 times, respectively, which were roughly calculated based on the abundances of 17O17O and 17O16O, 18O18O and 18O16O, and 15N15N and 15N14N.
Values of δ() in sample air have generally been determined on the assumption that Ar molar fractions and isotopic ratios of N2 and O2 in reference air and sample air are identical. However, the round-robin standard mixtures had differences in the Ar molar fraction and the isotopic ratios from reference air. We applied the following corrections to the measured δ()round-robin values from the individual laboratories by considering the deviations in the Ar molar fraction and the isotopic ratios in the round-robin standard mixtures from the atmospheric level. The δ()round-robin values reported by EMRI/AIST and TU were corrected based on the deviation in the isotope ratio from the atmospheric level using isotopic ratios of N2 and O2 measured simultaneously at EMRI/AIST. This is because EMRI/AIST and TU measured the values of δ() and δ(), respectively. NIES corrected δ()round-robin using the Ar molar fraction difference from its atmospheric level since the O2 peak obtained in GC included the Ar peak. SIO also corrected δ()round-robin using the difference in the Ar molar fraction from its atmospheric level since they only measured O2 molar fractions. The measurement techniques and calculation procedures of the δ()round-robin values for individual laboratories are detailed in the next section.
2.3 Analytical and calculation methods of δ() values
2.3.1 EMRI/AIST
The δ()round-robin values for EMRI/AIST were calculated based on the δ()round-robin values measured using the mass spectrometer. The δ()round-robin values were calculated against the reference air on the EMRI/AIST scale, which is natural air filled in a 48 L aluminum cylinder with a diaphragm valve (G-55, Hamai Industries Limited, Japan). The EMRI/AIST scale's long-term stability is described in Sect. 3.1. The measurement technique details are given in Ishidoya and Murayama (2014). The mass spectrometer was adjusted to measure ion beam currents for masses 28 (14N14N), 29 (15N14N), 32 (16O16O), 33 (17O16O), 34 (18O16O), and 44 (12C16O16O). The δ()NMIJ/AIST values comprising all isotopes of N2 and O2 are not equivalent to the isotopic ratios of δ()round-robin measured using the mass spectrometer since the isotope ratios of N2 and O2 in the round-robin standard mixtures are different from those in the reference air. Thus, mass-spectrometry-based isotopic ratios must be converted to values equivalent to the δ()NMIJ/AIST values. The δ()round-robin values were corrected based on isotopic ratios of , , and in the round-robin standard mixtures and reference air, as shown in Eq. (5).
Here, isotopic species of 17O17O, 18O17O, 18O18O, and 15N15N were negligible since their abundance was sufficiently smaller than those of 17O16O, 18O16O, and 15N15N. The isotopic ratios of , , and in the round-robin standard mixtures were calculated using Eqs. (6), (7), and (8):
The isotopic ratios of δ()round-robin, δ()round-robin, and δ()round-robin were determined to be 4.7 ‰, 9 ‰, and 2.4 ‰ against the EMRI/AIST reference air as mentioned above. Values of ()ref, ()ref, and ()ref refer to ratios of , , and in the reference air. We regard the isotopic ratios in the EMRI/AIST reference air as atmospheric values since differences between N2, O2, and Ar in the AIST reference air and air samples at Hateruma were small enough to be negligible. Therefore, the corresponding atmospheric values were used to calculate the ratios of ()ref, ()ref, and ()ref, which can be taken as globally constant because atmospheric mixing is very rapid compared to the processes altering the oxygen isotopic composition (Junk and Svec, 1958; Baertschi, 1976; Li et al., 1988; Barkan and Luz, 2005).
2.3.2 NIES
NIES reported the δ()round-robin values based on the δ{(O2+Ar)N2}round-robin values measured using a GC/TCD (Tohjima, 2000). The δ{(O2+Ar)N2}round-robin values were calculated against the reference air on the NIES scale, which is natural air filled in a 48 L aluminum cylinder. A column separates the (O2+Ar) and N2 in the air sample, and a TCD detected the individual peaks. The reference and sample air were repeatedly measured using the GC/TCD, and the δ{(O2+Ar)N2}round-robin values were calculated based on the ratios of the (O2+Ar) peak area to N2 peak area using Eq. (9).
The δ()round-robin value is given by Eq. (10):
where the coefficient a is defined by a=k(Ar/O2)ref. k represents the TCD sensitivity ratio of Ar relative to O2, and the value was evaluated as 1.13 by comparing gravimetric mixtures of O2+N2 and (Tohjima et al., 2005). Natural air is used for the reference air. Therefore, the value of a is calculated as 0.050 (Ar=0.93 % and O2=20.94 %). For NIES, the δ(ArN2)round-robin value was calculated using the gravimetric values of N2 and Ar in the round-robin standard mixtures.
The NIES scale is related to a set of 11 primary reference air cylinders. The NIES scale's long-term stability has been maintained within ±0.45 per meg yr−1 with respect to these cylinders by analyzing the relative differences in the ratios in the primary and working reference air (Tohjima et al., 2019). Details of the analytical methods and the NIES scale are given in Tohjima et al. (2005, 2008).
2.3.3 TU
The δ()round-robin values for TU were calculated based on the δ()round-robin values measured using a mass spectrometer (Finnigan MAT-252). The δ()round-robin values were calculated against the reference air on the TU scale, which is natural air filled in a 47 L manganese steel cylinder in 1998. The measurement technique details were given by Ishidoya et al. (2003). The TU scale's stability was evaluated by measuring the values of δ() in six working reference air samples against the primary reference air from 1999 to 2020. The changing rate and standard deviation of δ() in the working reference air were per meg yr−1 on average. The mass spectrometer was adjusted to measure ion beam currents for masses 29 (15N14N) and 32 (16O16O) because the spread of both ion beams for mass 28 and 32 was too wide to measure simultaneously. The δ()NMIJ/AIST values are not equivalent to the isotopic ratios of δ()round-robin measured by TU for the reason described above. Therefore, the δ()round-robin values were calculated using the isotopic ratios of , , and , as shown in Eq. (11).
The isotopic ratios in the round-robin standard mixtures were calculated using Eqs. (6), (7), and (12).
In this study, we used the values of δ()round-robin, δ()round-robin, and δ()round-robin measured by EMRI/AIST, rather than by TU, to reduce the uncertainties of the δ()round-robin values associated with the isotope ratio measurements. The ()ref, ()ref, and ()ref values were calculated based on the corresponding atmospheric values, similar to the EMRI/AIST values.
2.3.4 SIO
SIO reported the δ() values based on measurements using a two-wavelength interferometer (Keeling et al., 1998). The SIO reference, the scale of which is defined as , is based on a suite of 18 primary reference gases stored in high-pressure cylinders (aluminum or steel, volumes ranging from 29 to 47 L) filled with natural air (Keeling et al., 2007). The SIO scale's long-term stability has been maintained within ±0.4 per meg yr−1 with respect to these cylinders by analyzing the relative differences in the ratios in the primary reference air. Differences between the round-robin cylinders and the SIO reference were determined from
where is the difference in refractivity ratio between the round-robin cylinder and the SIO reference, determined via interferometric comparisons with secondary reference gases linked to the primary suite. is a constant sensitivity factor, is the molar fraction of the SIO reference, is a constant (1.0919 per meg ppm−1), and ΔCO2 is the difference in CO2 molar fraction from the SIO reference (363.29 µmol mol−1). SIO data are routinely corrected for CO2 interference. The sensitivity and interference factors (e.g., ) in Eq. (13) are based on refractivity data for the pure gases and natural air (Keeling, 1988b, Keeling et al., 1998). SIO applies additional corrections for ArN2, Ne, He, Kr, Xe, CH4, N2O, and CO. The additional corrections are effectively constant (or small) in natural air. They can usually be neglected in comparisons of natural air samples. However, these corrections cannot be neglected in relating the SIO scale to an absolute reference based on the round-robin cylinders, which differ in their ArN2 ratios from natural air and which lack constituents other than N2, O2, Ar, and CO2. These corrections require estimates of the molar ArN2 ratio and other gases' abundances in typical background air. Notably, the primary reference gases are relevant in Eq. (13) as references for relative refractivity. Therefore, the exact ArN2 ratio and abundances of other gases in the SIO reference are not directly relevant. For background air, the following values were adopted: , , , , , CH4=1.8, N2O=0.3, . Here, ArN2 is from Aoki et al. (2019), and the other (noble gas)N2 ratios are from Glueckhauf (1951) using Xe data from Kronjäger (1936) (see also Keeling et al., 2020). The quantity δ(ArN2) was computed using the AIST gravimetric data, ).
The ArN2 interference ranges from −55 to +24 per meg depending on the round-robin cylinder. The sum of the remaining interferences, other than for CO2 (− other interferences), is effectively constant at −14.3 per meg. The largest individual contributions are from Ne (−32.8) and CH4 (+11.9 per meg).
3.1 Stability of δ() during intercomparison
The δ()round-robin values were measured four times using the mass spectrometer by EMRI/AIST to evaluate the stability of the ratios of the standard mixtures during the intercomparison experiment. The initial δ()round-robin values in the four measurements were used as the EMRI/AIST assigned values. The δ()round-robin values were calculated against the EMRI/AIST scale. The EMRI/AIST scale's stability was evaluated by measuring the values of δ() in three working reference air samples against the primary reference air from 2012 to 2020. The changing rate and standard deviation of δ() in the respective cylinders were 0.08±0.11 per meg yr−1 on average. Therefore, the working standards show no systematic trend in δ() regarding the primary reference air.
Figure 1 shows the temporal drifts of the δ()round-robin values from the initial values determined by the mass spectrometer at EMRI/AIST. The first measurement was conducted immediately after preparing the round-robin standard mixtures: May 2017 for three cylinders (CPB16345, CPB16315, CPB16379) and July 2017 for the other cylinders (CPB28912, CPB16349). The temporal drifts analyzed in March 2018 (before shipment) ranged from −5.9 to 5.5 per meg. This range was within the expanded uncertainty (6.4 per meg) of the measurement, which was estimated based on the standard uncertainty of the δ() value measured using the mass spectrometer of EMRI/AIST. Here the expanded uncertainty (a coverage factor of 2) represents an approximately 95 % level of confidence. The temporal drifts analyzed in March 2019 (after the cylinders' return from SIO) ranged from −16.4 to 2.9 per meg. This range was larger than the expanded uncertainty of the measurement.
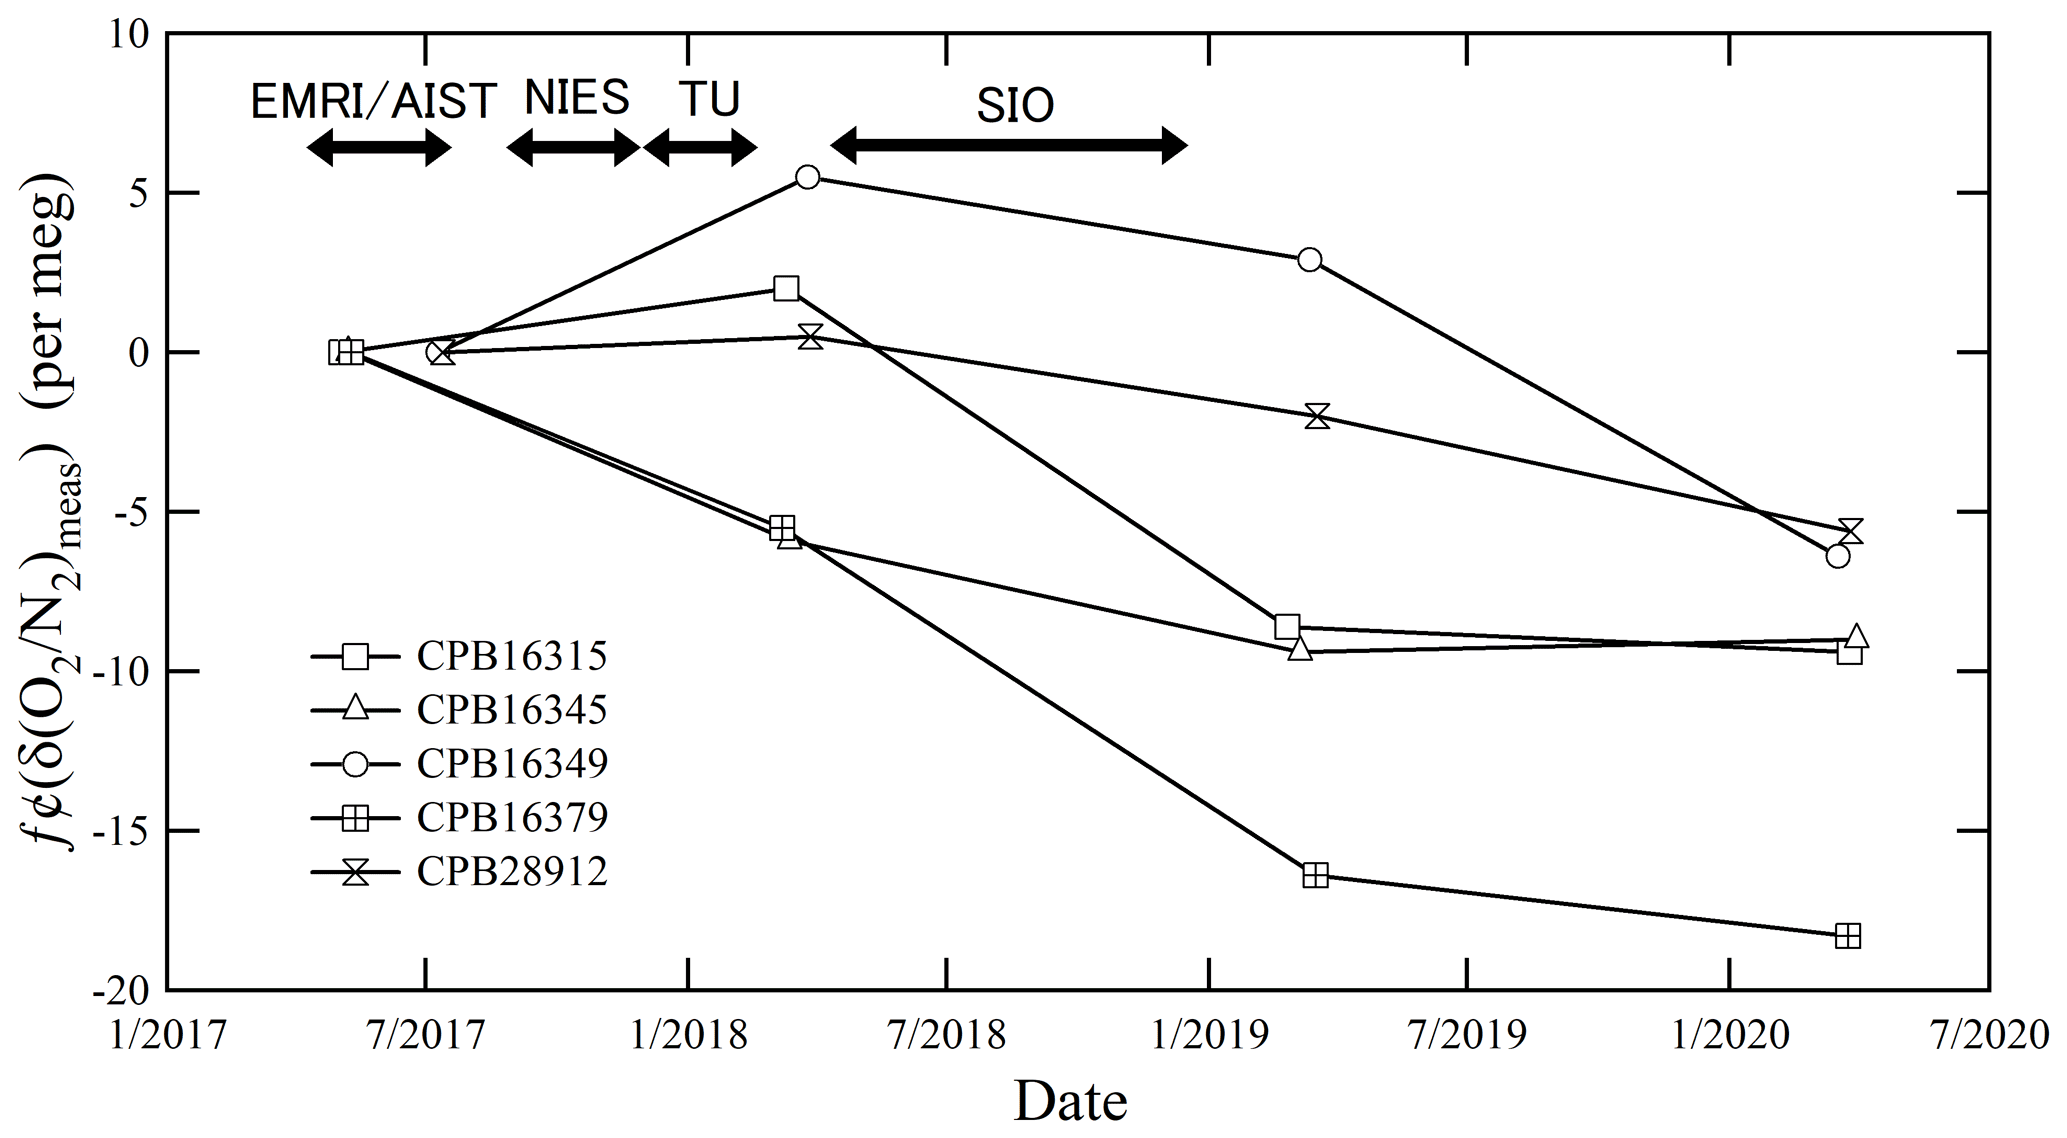
Figure 1The temporal drift of δ()round-robin values from the initial values was measured using a mass spectrometer at EMRI/AIST after preparing the round-robin standard mixtures before the shipment of the cylinders to SIO, after the return of the cylinders from SIO, and a year after the return.
We also analyzed the round-robin standard mixtures in March 2020 (a year after return) and found that the temporal drifts ranged from −18.3 to −5.6 per meg. The δ()round-robin values decreased with time in all cylinders, especially for cylinder no. CPB16379. The average decreasing rate of the δ()round-robin values in the cylinders, except for CPB16379, was per meg yr−1. Meanwhile, that of the CPB16379 cylinder was per meg yr−1. The decreasing rates and standard deviations were calculated from least-square fitting. The decrease in the δ()round-robin values during the intercomparison experiment are thought to be caused by O2 consumption by the oxidation of residual organic material, oxidation of the inner surface of the cylinders, and the difference in adsorption and desorption between N2 and O2 on the inner surface of the cylinders rather than the fractionation of N2 and O2 since the escape of gas from the cylinder generally increases the in a cylinder (Langenfelds et al., 1999). We corrected the temporal drifts during the intercomparison experiment by linearly interpolating the δ()NMIJ/AIST value of the date analyzed by individual laboratories using the temporal drifts measured before and after the analysis of individual laboratories. The correction was performed in each cylinder separately. Following this, we compared the interpolated δ()NMIJ/AIST value with the measured δ()round-robin value.
We evaluated the NMIJ/AIST scale's reproducibility at EMRI/AIST using nine high-precision standard mixtures prepared in different periods (from April 2017 to February 2020). Figure 2 shows the relations between the δ()NMIJ/AIST values gravimetrically determined by NMIJ/AIST and the δ() values measured using the mass spectrometer at EMRI/AIST. The lines in Fig. 2a represent the Deming least-square fit to the data, and Fig. 2b shows residuals of δ()NMIJ/AIST from the line. The error bar represents the expanded uncertainty of the δ()NMIJ/AIST values. All residuals were within the expanded uncertainties of less than 8 per meg, which showed that the NMIJ/AIST scale could be reproduced any time by preparing high-precision standard mixtures. This shows that an absolute long-term temporal stability of each laboratory's δ() scale, which is determined against a reference natural air in a high-pressure cylinder, can be evaluated by comparing the reference air with high-precision standard mixtures prepared by NMIJ/AIST at intervals.

Figure 2(a) Relationships between the gravimetric values of δ() in nine high-precision standard mixtures prepared from April 2017 to February 2020 and the δ() values measured using the mass spectrometer at EMRI/AIST. (b) Residuals from the line of the Deming least-square fit to the plots. The error bar represents the expanded uncertainty of the δ()NMIJ/AIST values.
3.2 Intercomparison between laboratory scales and their span sensitivities
Table 3 summarizes the δ()round-robin values measured by individual laboratories. Notably, δ()round-robin values shown in Table 3 are corrected for the deviations in ArN2 ratios and isotopic ratios of N2 and O2 in the round-robin standard mixtures from the atmospheric values and determined against their scales, as described in Sect. 2.3.
Table 3δ()round-robin values in the round-robin standard mixtures reported by EMRI/AIST, NIES, TU, and SIO.
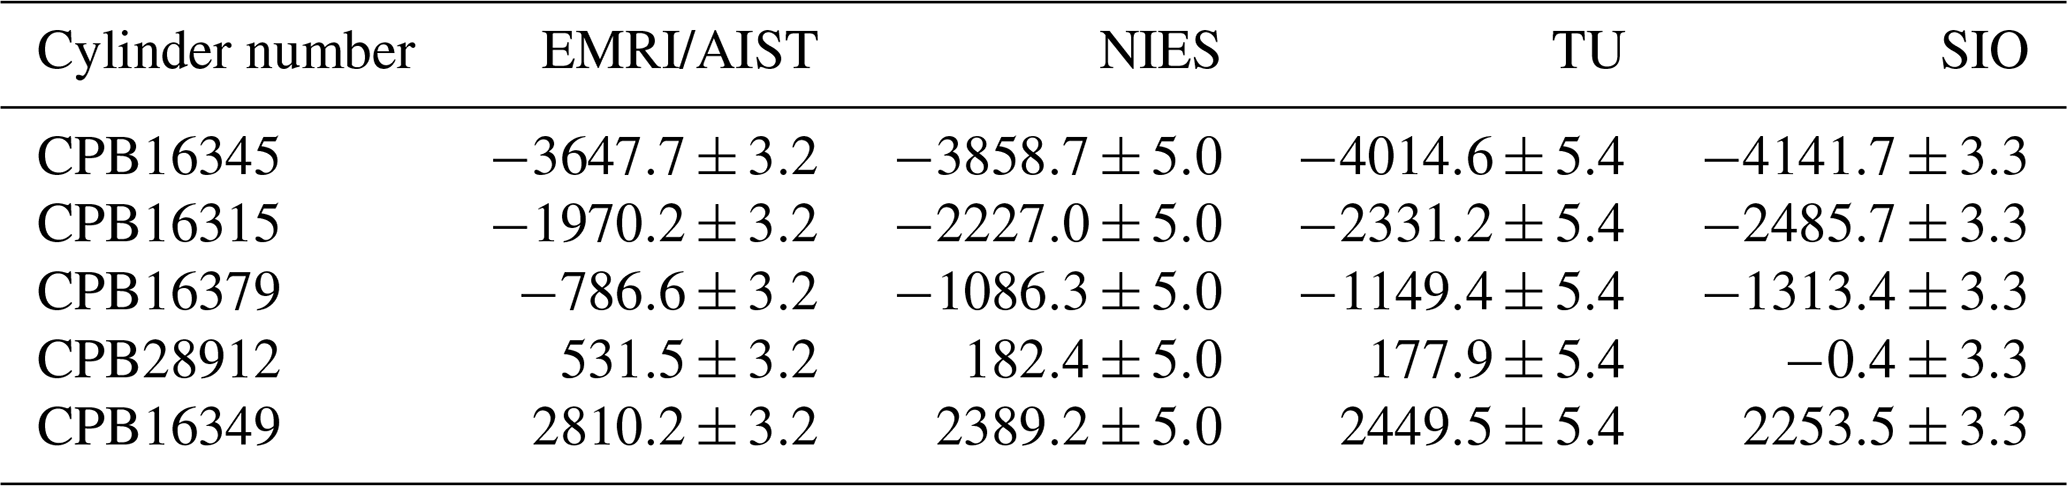
Numbers are given in the unit of per meg. The numbers following the symbol ± denote the standard uncertainty, which was calculated based on measurement standard uncertainty of δ() for individual laboratories. δ()round-robin values reported by individual laboratories were determined based on their own scales.
Table 4Slopes and intercepts of the lines obtained by the Deming least-square fit to the reported δ()round-robin values for individual laboratories and deviation in the individual scales from SIO in this study and the GOLLUM.
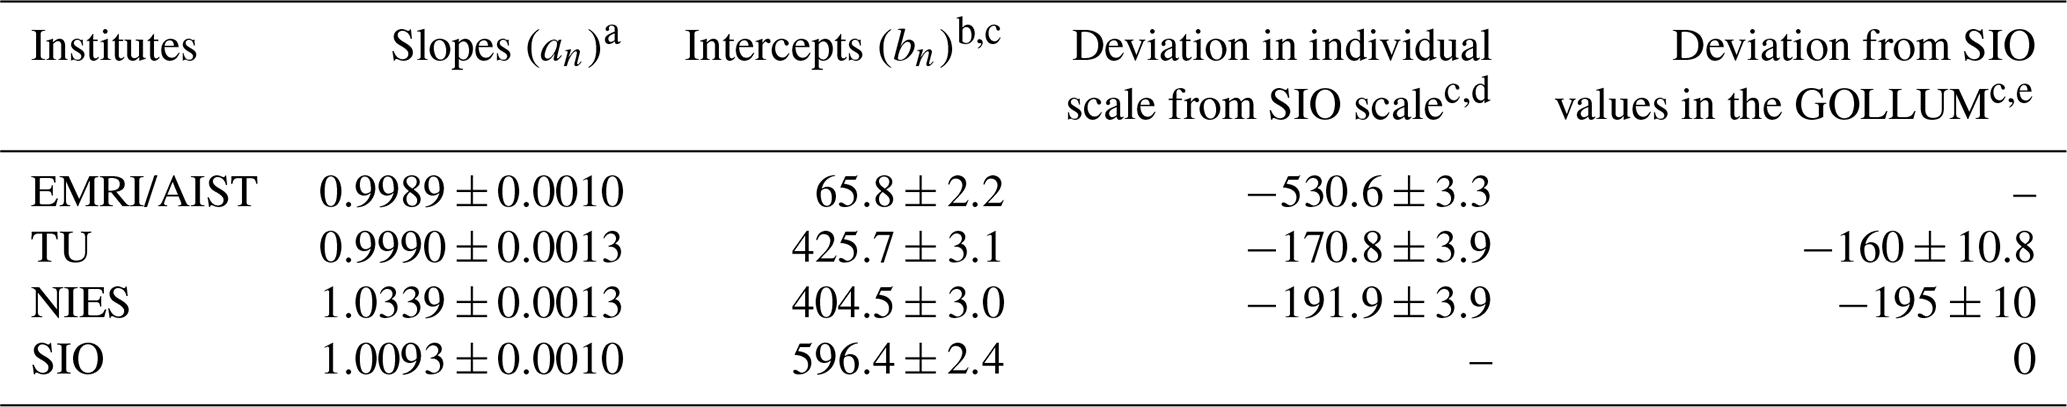
Numbers following the symbol ± denote the standard uncertainty. The uncertainties of slopes and intercepts were calculated based on the Deming least-square fit. a Slope represents the difference in span sensitivity between individual laboratory scales and the NMIJ/AIST scale. b Intercept represents a deviation in individual laboratory scale from the NMIJ/AIST scale corresponding to δ()NMIJ/AIST=0. c Figures are given in the unit of per meg. d Standard uncertainties were calculated by combining the standard uncertainties of the individual laboratory intercepts. e Figures were provided by Andrew Manning (GOLLUM, 2015; WMO, 2005; Andrew Manning, personal communication, 2021). EMRI/AIST did not participate in the GOLLUM.
Figure 3a represents the relations between the δ()NMIJ/AIST and δ()round-robin values of individual laboratories. The δ()NMIJ/AIST values were interpolated to correct the temporal drifts of δ(), as described in Sect. 3.1. The lines represent a Deming least-square fit to the plotted data for individual laboratories. The slopes and their standard uncertainty for EMRI/AIST, TU, NIES, and SIO were 0.9989±0.0010, 0.9990±0.0013, 1.0339±0.0013, and 1.0093±0.0010, respectively (Table 4). The deviations from 1 for the slopes of the lines represent the differences from the NMIJ/AIST scale's span sensitivity, the relative values of which were , , 3.39 %±0.13 %, and 0.93 %±0.10 % for EMRI/AIST, TU, NIES, and SIO, respectively. The intercepts of the lines represent the differences between individual laboratory scales and the NMIJ/AIST scale corresponding to δ()NMIJ/AIST=0: 65.8±2.2, 425.7±3.1, 404.5±3.0, and 596.4±2.4 per meg for EMRI/AIST, TU, NIES, and SIO, respectively. The numbers following the symbol ± represent the standard uncertainties, which were calculated based on the Deming least-square fit. The differences in intercepts between individual scales reflect those of O2 mole fractions in the laboratory's reference air.
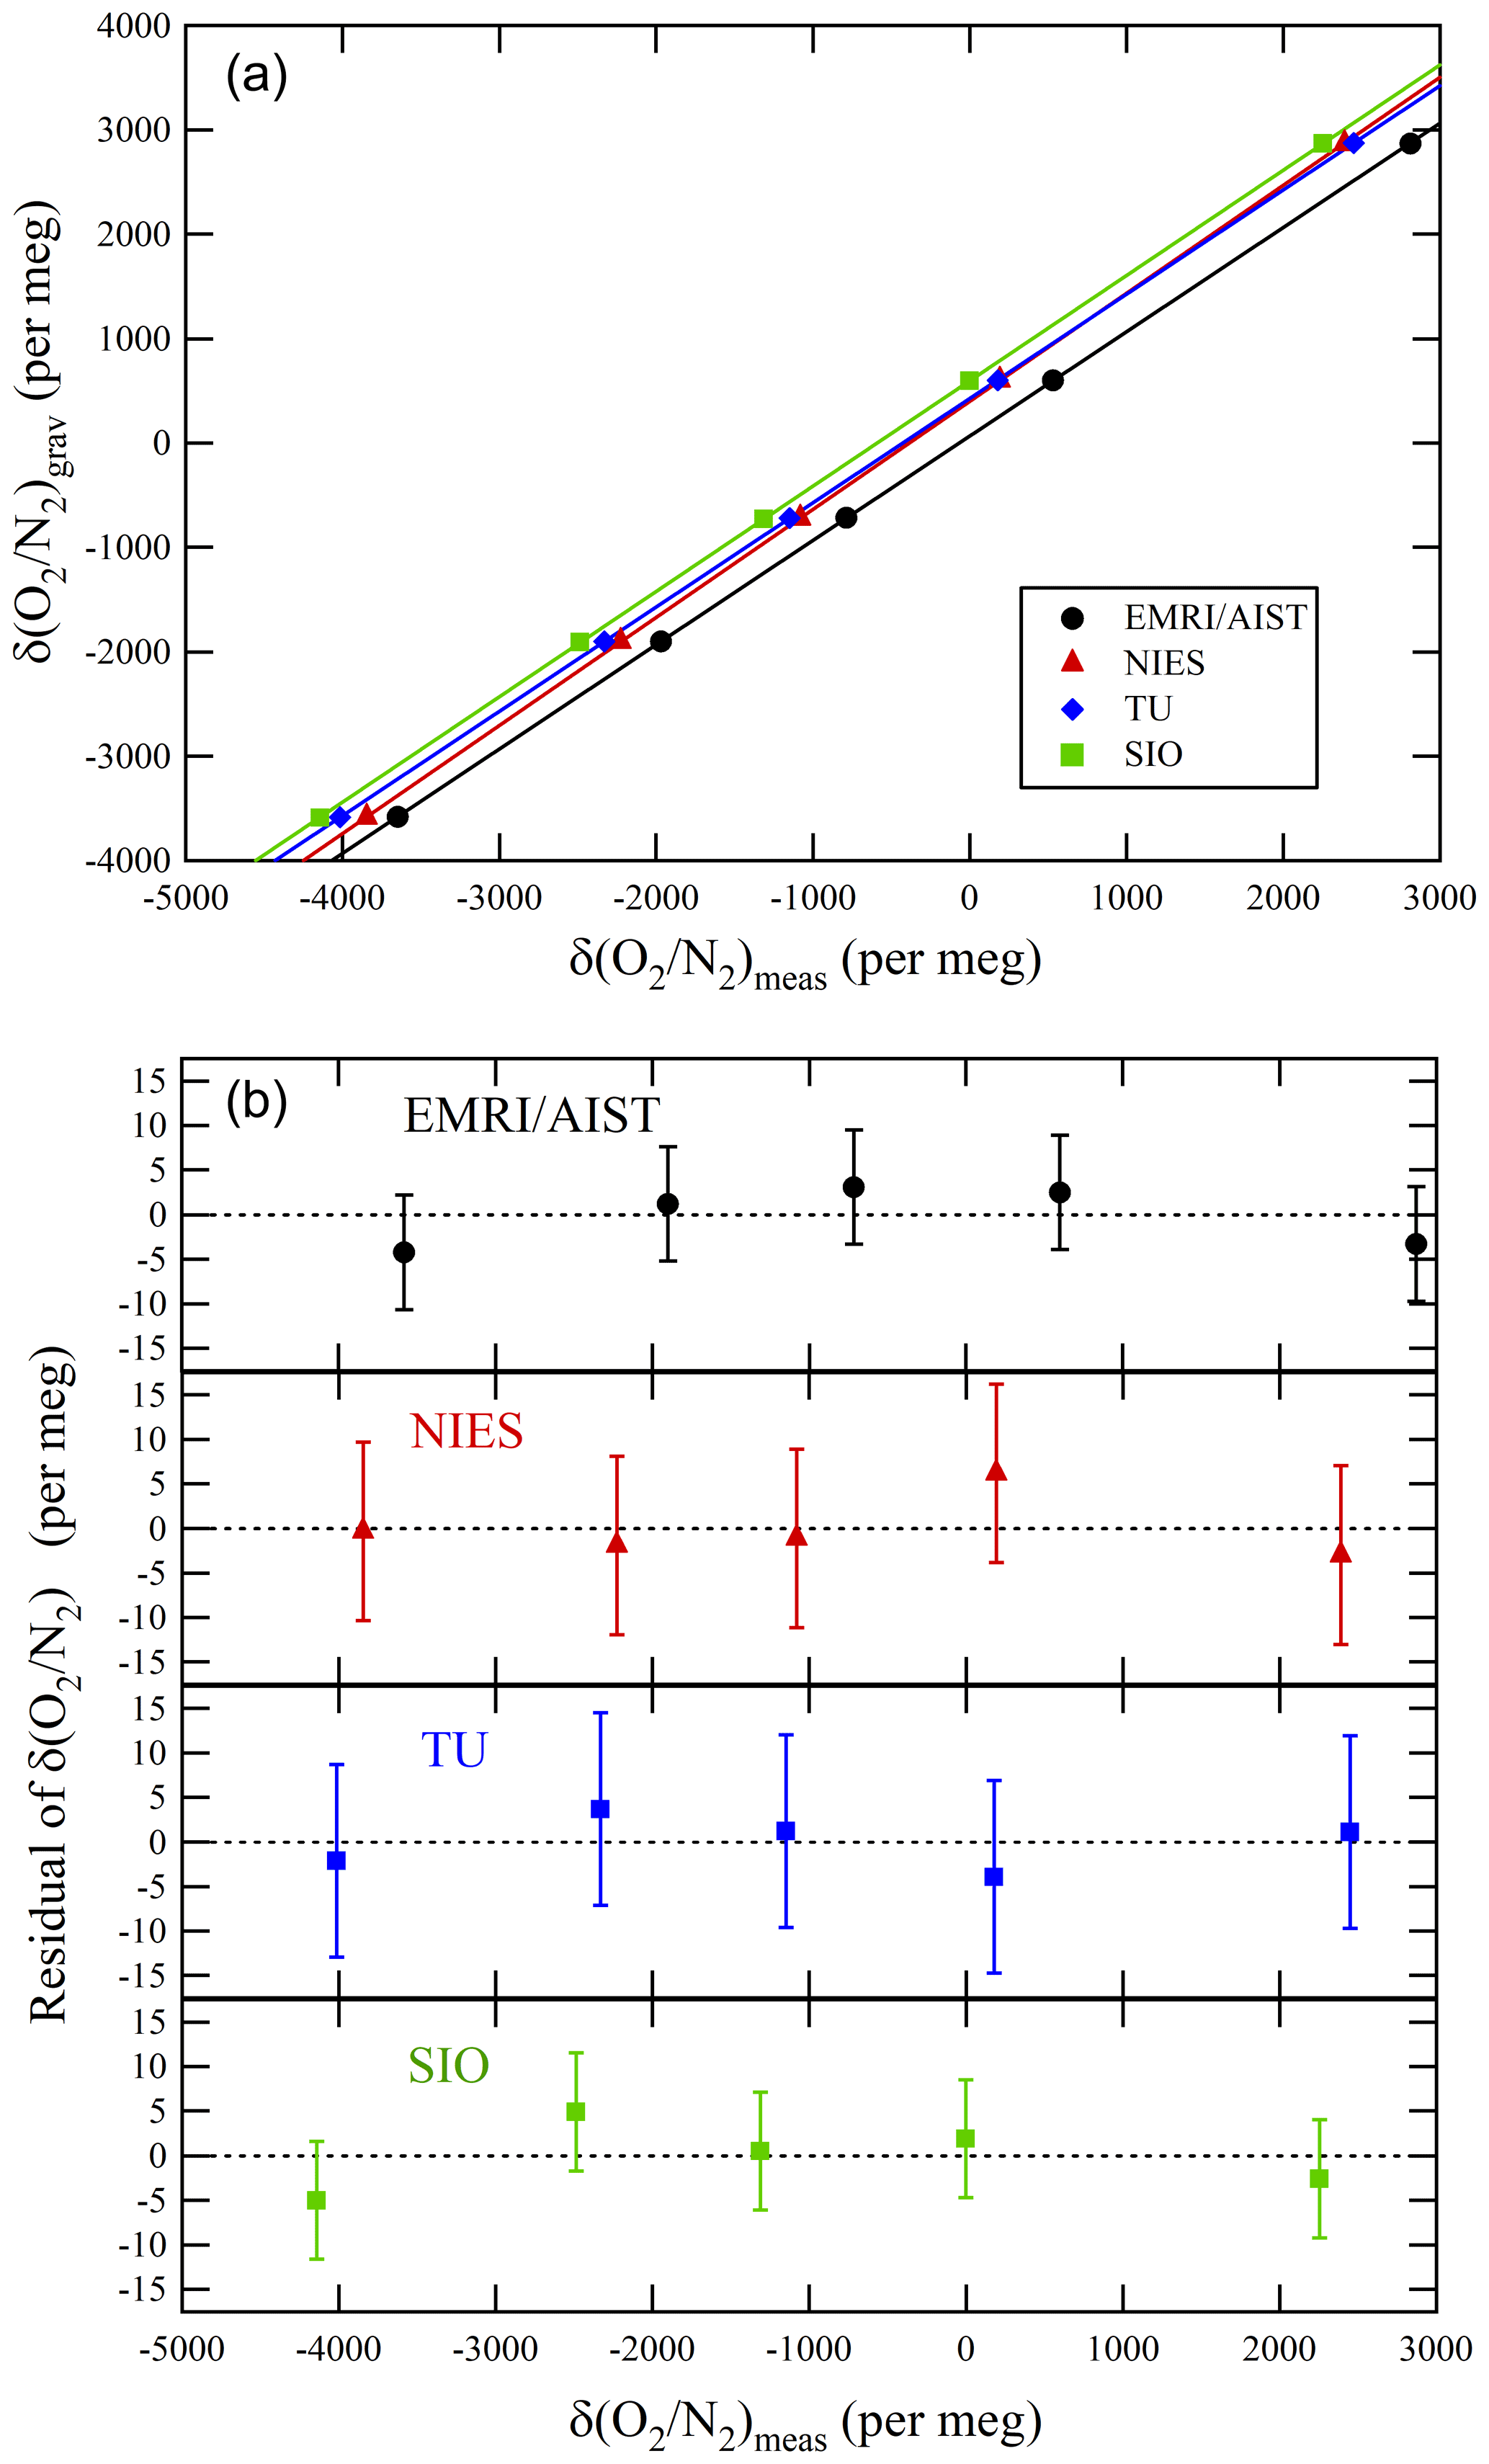
Figure 3(a) Relationships between the gravimetric δ() values by NMIJ/AIST and the δ() values measured by EMRI/AIST, NIES, TU, and SIO as well as lines obtained from the Deming least-square fit to the plotted data. (b) Residuals of the measured δ() values from the lines. The error bar represents expanded uncertainty, which was calculated based on the measurement uncertainty for individual laboratories.
The differences in the intercepts between SIO and other laboratories were , , and per meg for EMRI/AIST, TU, and NIES, respectively. The differences of NIES and TU from SIO were consistent with those obtained from a past intercomparison experiment, which is the Global Oxygen Laboratories Link Ultra-precise Measurements (GOLLUM) exercise coordinated by SIO and the University of East Anglia from 2003–2014 (GOLLUM, 2015; WMO, 2005; Andrew Manning, personal communication, 2020), within their uncertainties (Table 4). Figure 3b shows the residuals from the fitting lines. The error bar represents the expanded uncertainty, which was calculated based on the standard uncertainties of δ() values measured by individual laboratories. All of them fall within expanded uncertainties.
3.3 Compatibility of the atmospheric data between the laboratories and implications for the global CO2 budget analysis
The goal of this study is to make the observational data from different laboratories directly comparable. We compared the ratios measured by EMRI/AIST and NIES based on flask samples collected at HAT from October 2015 to December 2019 (Tohjima et al., 2008). The values of NIES after March 2018 represent preliminary data. The air samples were collected twice monthly into two Pyrex glass flasks arranged in series (one for AIST and the other for NIES). We confirmed that the isotopic ratios of N2 and O2 in the reference air of EMRI/AIST and NIES did not significantly differ from the atmospheric values for the HAT air samples. The δ() and δ() values in the air samples were in a range from 0 to 10 per meg on the EMRI/AIST scale, suggesting that the difference in isotopic ratios of N2 and O2 between the air samples and the reference air of the EMRI/AIST scale was significantly small. Therefore, we regard the values of δ() and δ{(O2 + Ar)N2}, which were measured using the mass spectrometer and GC/TCD, as equal to δ() in Eq. (1). Figure 4a shows the δ() values reported on the NIES and EMRI/AIST scales. The average difference in the δ() between the two scales was per meg (subtracting the δ() values of EMRI/AIST from those of NIES). The uncertainty represents the standard deviation of the differences. Both values of δ() were converted to the NMIJ/AIST scale using Eq. (14):
where an and bn are the slope and intercept of each laboratory's line (n) obtained in Sect. 3.2. Figure 4b shows the converted δ() values. The average difference and the standard deviation in the converted δ() between the two scales were per meg, which showed that this scale conversion reduced the bias between the δ() values of EMRI/AIST and NIES. The bias dropped within the standard deviation, although it was more than the compatibility goal of 5 per meg for the ratio measurement. Figure 5a and b plot values of δ() both before and after the scale conversion, confirming the compatibility between the span sensitivities on the EMRI/AIST and NIES scales. The lines represent a Deming least-square fit to the scatter plots. The slope of the line before scale conversion and its standard uncertainty are 0.956±0.015, consistent with the difference in the span sensitivity between the two scales within uncertainty. After the scale conversion, the slope and its standard uncertainty are 0.990±0.015, demonstrating that the scale conversion improved the difference in the span sensitivity between the EMRI/AIST and NIES scales to the NMIJ/AIST scales.
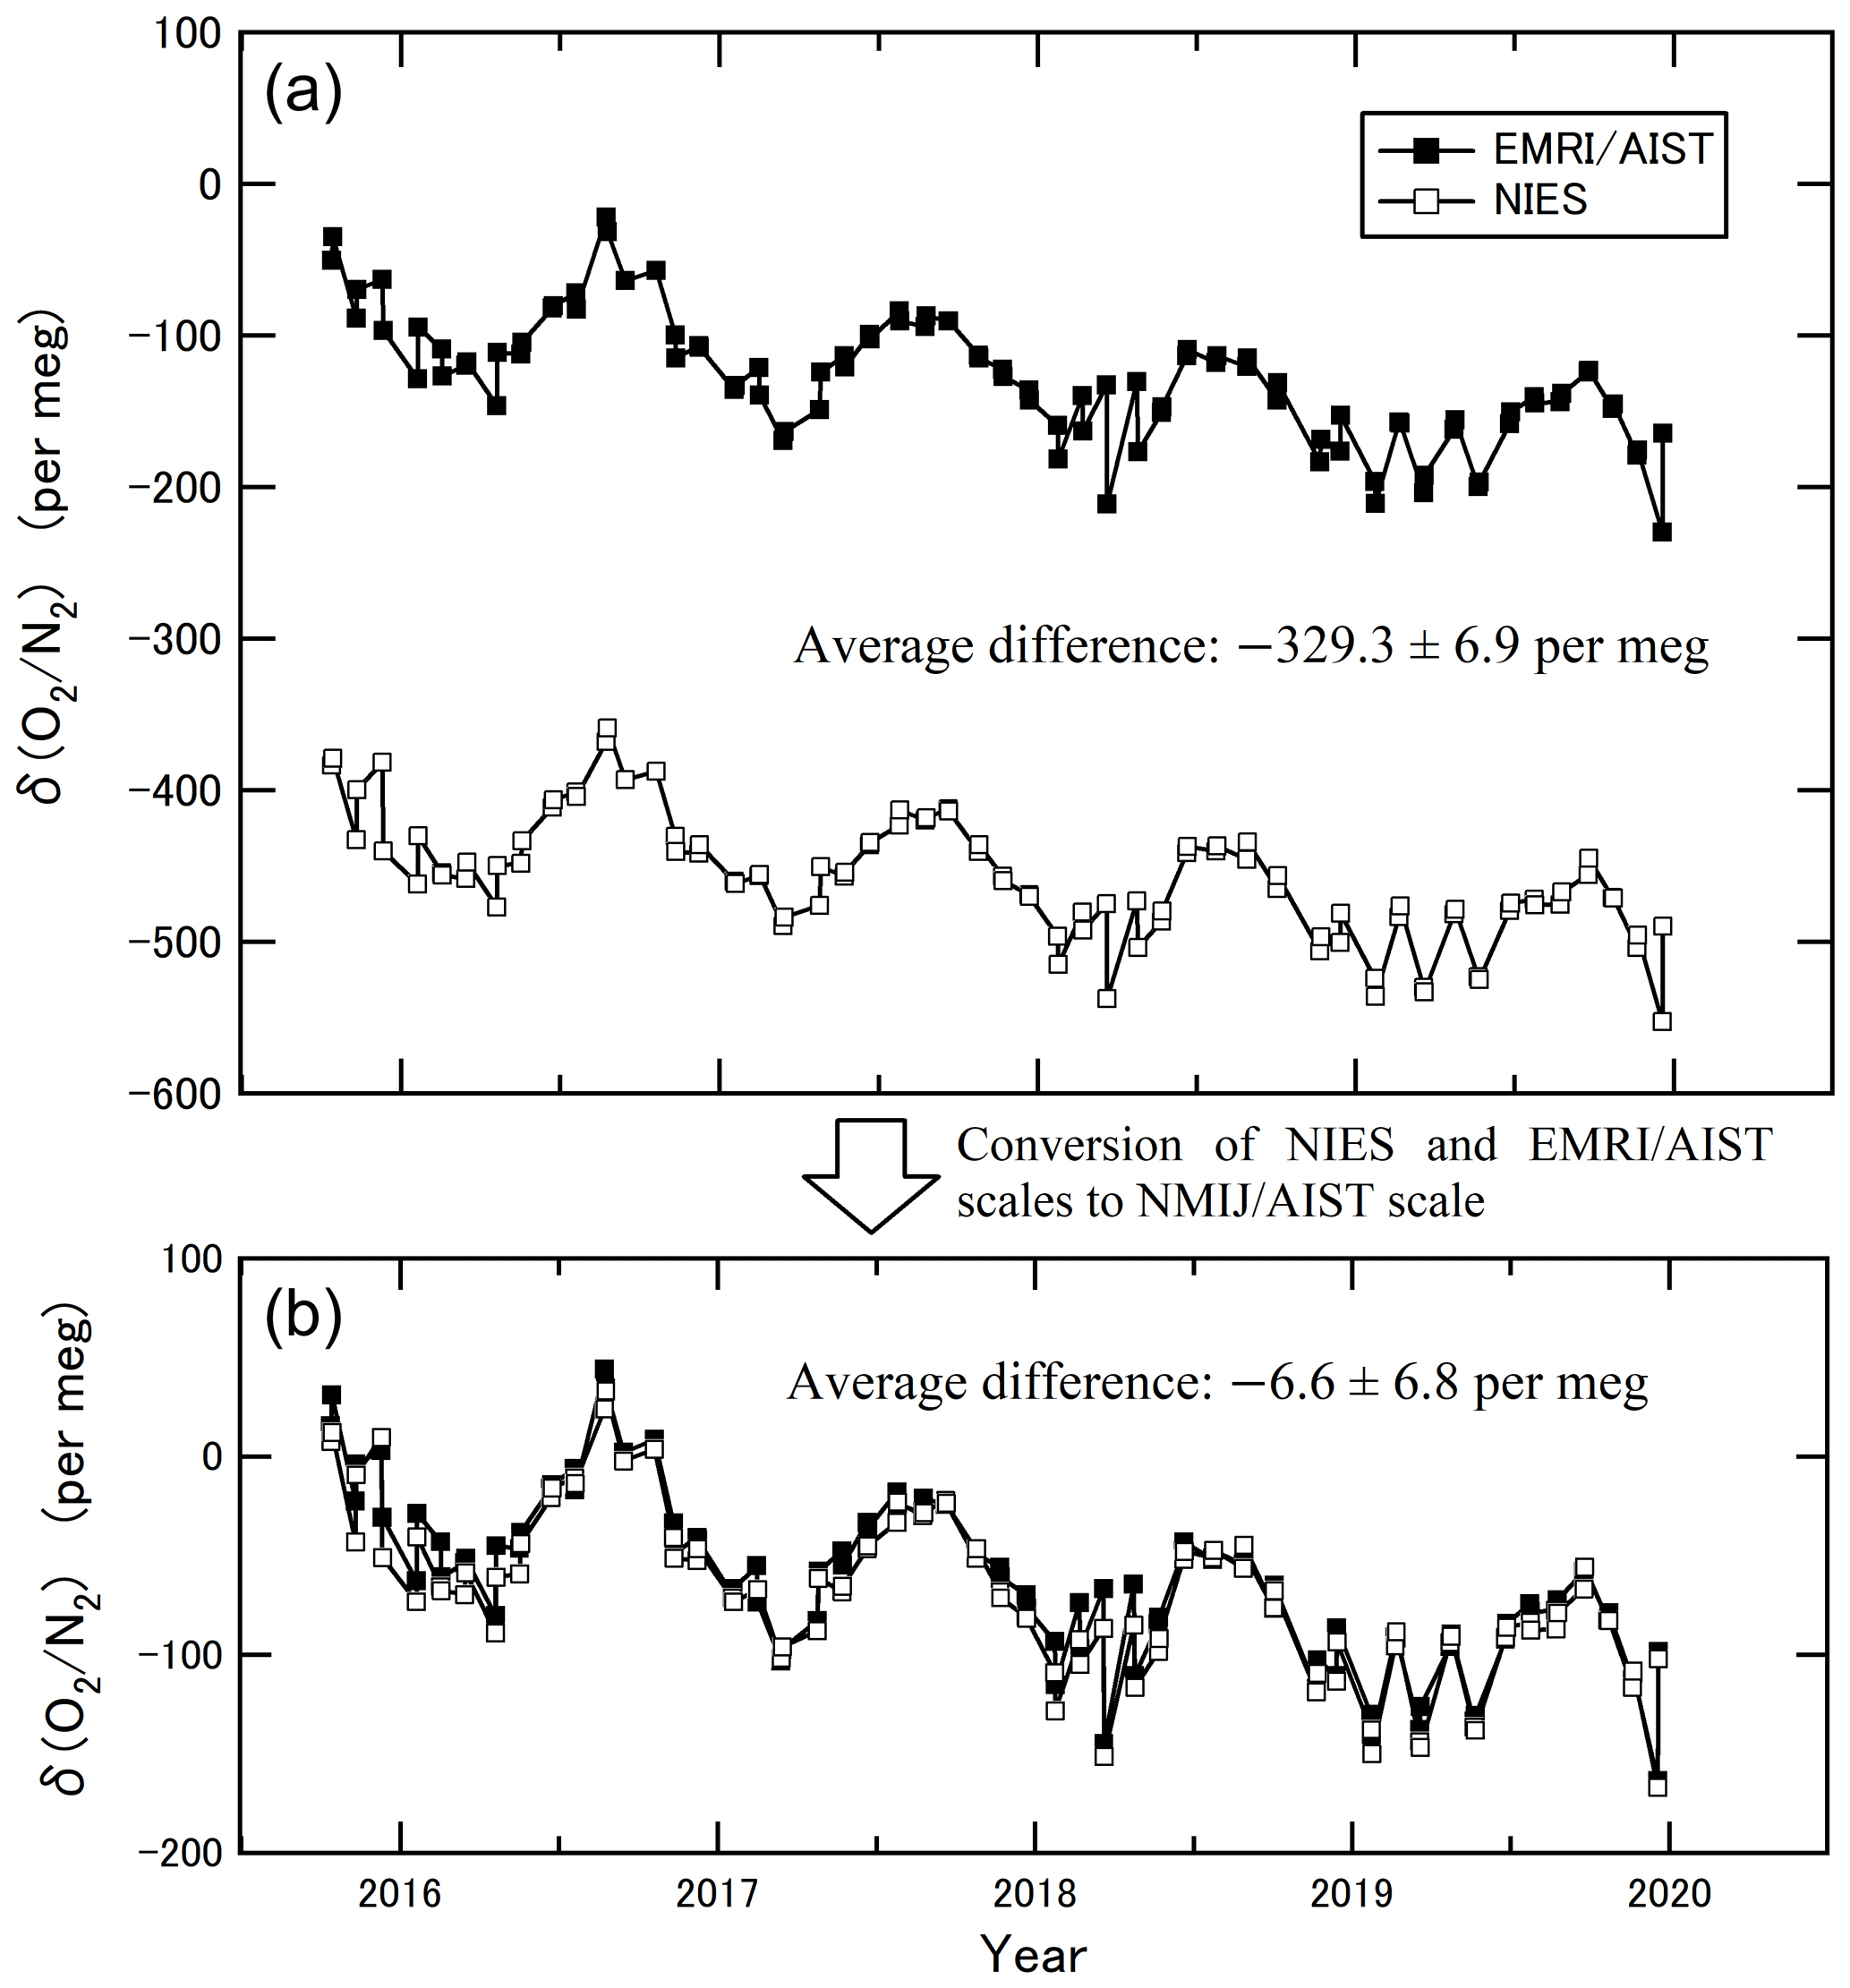
Figure 4(a) The δ() values obtained from the duplicate air samples collected at Hateruma Island for 4 years (2015–2019) measured by EMRI/AIST and NIES. (b) The δ() values at Hateruma converted from EMRI/AIST and NIES scales to the NMIJ/AIST scale.
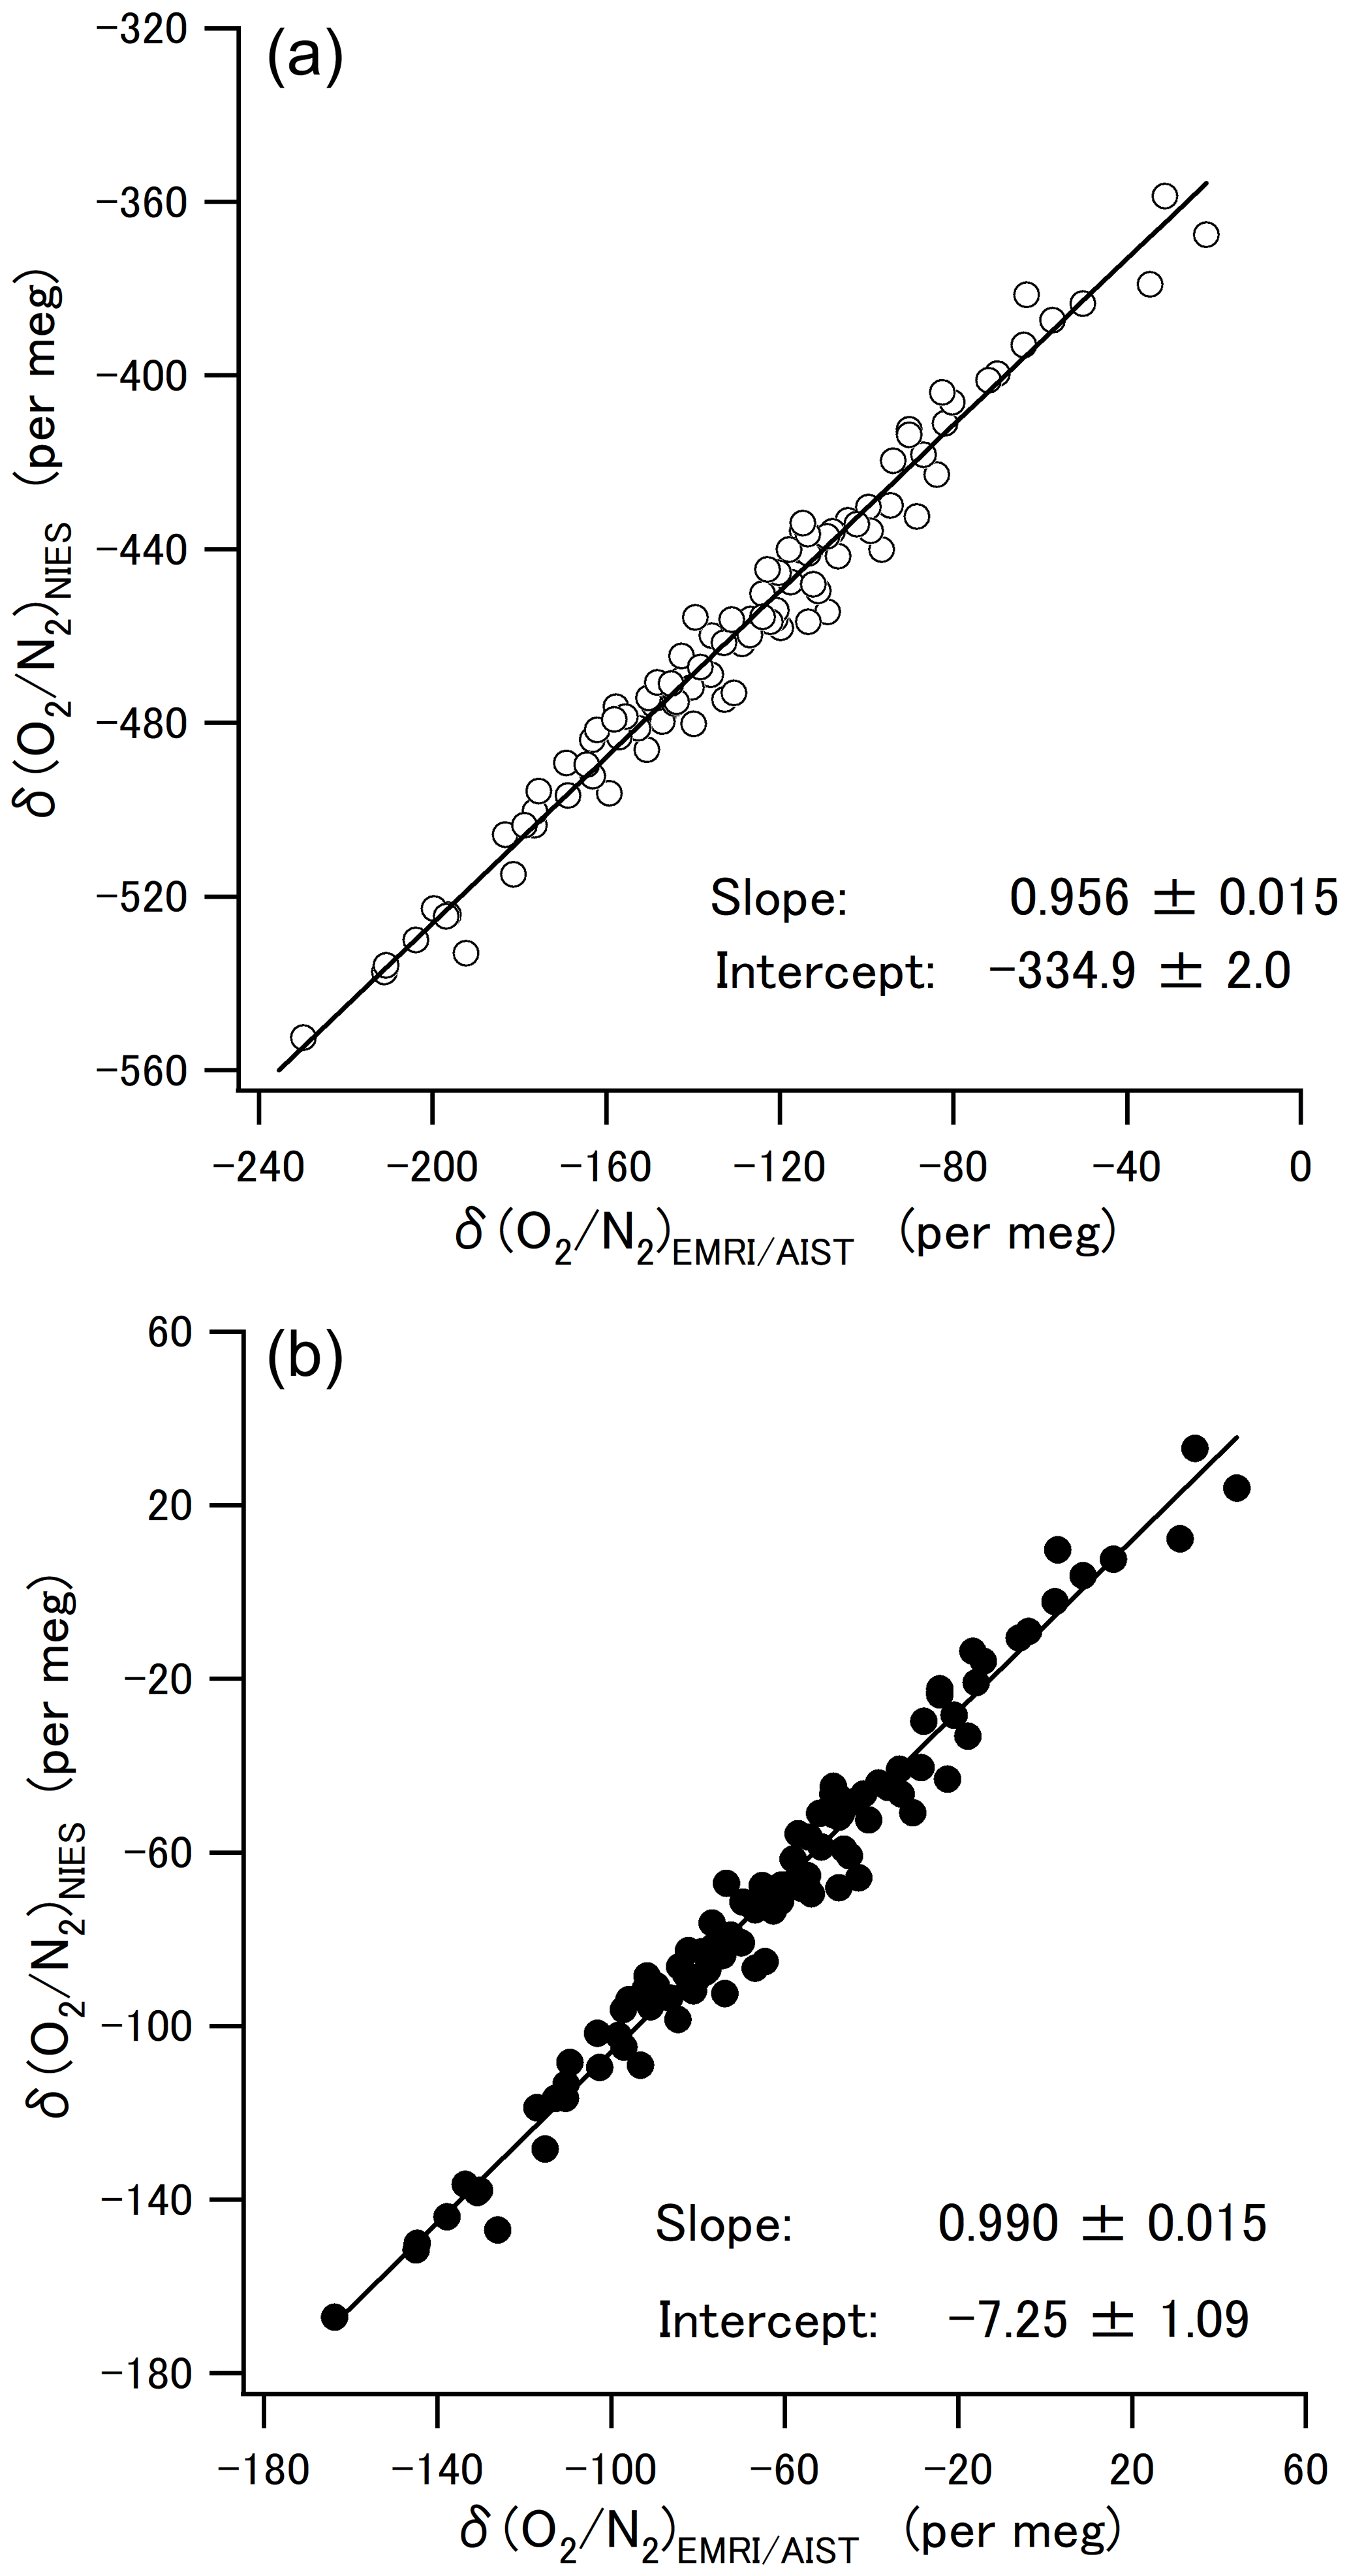
Figure 5(a) Scatter plots of the δ() values at Hateruma for 4 years (2015–2019) on the EMRI/AIST and NIES scales. The line represents the Deming least-square fit to the plots. (b) Scatter plots between the δ() values for EMRI/AIST and NIES after conversion to the NMIJ/AIST scale. The line represents the Deming least-square fit to the plots.
Table 5Land biospheric and oceanic CO2 uptakes from 2000 to 2016 reported by Tohjima et al. (2019) using the NMIJ/AIST and NIES scales (see text for more details).
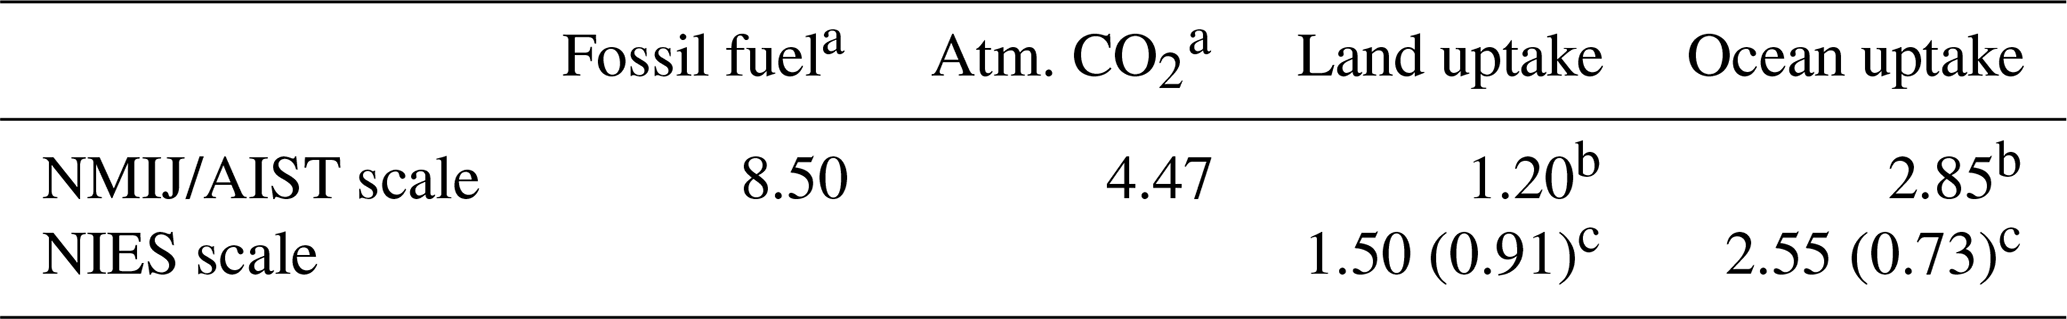
Figures are given in units of PgC yr−1. a These figures are from the Global Carbon Project (Friedlingstein et al., 2020). b NMIJ/AIST values were recalculated based the average secular changing rate of δ() converted from the NIES scale to the NMIJ/AIST scale. c NIES values were computed based on the average secular changing rate of δ() on the NIES scale reported by Tohjima et al. (2019). The figures in parentheses represent the uncertainties.
Observing the long-term trend in atmospheric δ() provides critical information on the global CO2 budget (Manning and Keeling, 2006). Recently, Tohjima et al. (2019) estimated the land biospheric and oceanic CO2 uptakes using the average changing rate of the atmospheric ratio and CO2 molar fraction reported on the NIES scale. We converted the changing rate of δ() on the NIES scale to that on the NMIJ/AIST scales and recalculated the global CO2 budgets from 2000 to 2016 using the converted rates. Table 5 summarizes the CO2 budgets reported by Tohjima et al. (2019) and recalculated by this study. Notably, the fossil-fuel-derived CO2 emissions and the global average of the atmospheric CO2 molar fractions used for the CO2 budget calculation are the same as those used in the Global Carbon Project for estimating the global carbon budget in 2020 (Friedlingstein et al., 2020).
We found a decrease and increase of 0.30 Pg yr−1 in the land biospheric and oceanic CO2 uptakes due to the scale conversions as shown in Table 5. These amounts correspond to 20 % and 12 % of the land biospheric and oceanic carbon budgets estimated by NIES and are not negligible. Results show that the span sensitivities of the scale are critical to accurately estimating carbon budgets. Moreover, Resplandy et al. (2019) estimated an increase in the global ocean heat content (OHC) based on atmospheric O2 and CO2 measurements. They reported that the largest single source of uncertainty in their estimation is the scale error from the span calibration of the analyzer, which is 2 % for the δ() contribution. They also mentioned that the error would be reduced via within-lab and inter-lab comparisons. Therefore, if the scale error is corrected using the span offset and the standard uncertainty of SIO scales against the NMIJ/AIST absolute scale obtained from the intercomparison experiment, the scale error may be reduced from 2 % to 0.1 %, which should significantly improve the accuracy of the OHC increase estimate.
The intercomparison experiment was used to evaluate the relationship between the measured δ() values and span sensitivities of the individual laboratory scales from the NMIJ/AIST scale using gravimetrically prepared high-precision standard mixtures. The relative deviations in span sensitivity of the EMRI/AIST, TU, NIES, and SIO scales against the NMIJ/AIST scale were , , 3.39 %±0.13 %, and 0.93 %±0.10 %, which were quantified for the first time. The largest offset corresponded to the 0.30 Pg yr−1 decrease and increase in global estimates for land biospheric and oceanic CO2 uptakes, which are not negligible. The deviations in the measured δ() values on the EMRI/AIST, TU, NIES, and SIO scales from the NMIJ/AIST scale corresponding to δ()NMIJ/AIST=0 were 65.8±2.2, 425.7±3.1, 404.5±3.0, and 596.4±2.4 per meg, respectively. The differences between individual absolute values were consistent with the results from the GOLLUM round-robin cylinder comparison. However, the δ() values in the five round-robin standard mixtures decreased at rates of per meg yr−1 for one cylinder and per meg yr−1 for the other four cylinders. The decrease suggests that it is necessary to evaluate the long-term stability of a laboratory's scale absolutely to link future δ() values. The ratios in high-precision standard mixtures prepared in different periods by NMIJ/AIST are reproduced within the ratios' uncertainty, confirming that the NMIJ/AIST scale can be reproduced any time by preparing high-precision standard mixtures. Further, a long-term temporal drift of each laboratory's scale can be evaluated by comparing the reference air with high-precision standard mixtures prepared by NMIJ/AIST. Finally, we demonstrated that the differences between δ() on the EMRI/AIST and NIES scales in flask samples collected at HAT became consistent within uncertainty by converting both scales to the NMIJ/AIST scale, although the bias of per meg is not negligible. The results obtained in this study should improve the estimation method of carbon budgets and OHC increase through more precise estimation of the atmospheric δ() trend. The span sensitivities of the laboratory scales will be able to be absolutely evaluated by calibrating the cylinders based on the NMIJ/AIST scale if the GOLLUM is performed using cylinders with sufficiently different ratios. We expect that the compatibility goal of 5 per meg for the measurement will be accomplished by comparing individual laboratory scales with an absolute scale such as the NMIJ/AIST scale.
The data used for the round-robin exercise presented in this study can be accessed by contacting the corresponding author.
NA and SI designed the round-robin exercise. NA prepared the standard gas mixtures and drafted the manuscript. SI carried out measurements at EMRI/AIST. YT carried out measurements at NIES. SMo and ST carried out measurements at TU. RFK and AC carried out measurements at SIO. SI, YT, SMo, ST, RFK, AC and SMu examined the results and provided feedback on the manuscript. All the authors approved the final manuscript.
The authors declare that they have no conflict of interest.
Publisher's note: Copernicus Publications remains neutral with regard to jurisdictional claims in published maps and institutional affiliations.
We thank the Global Environmental Forum (GEF) staff for their work in collecting the air samples at the Hateruma station. Andrew Manning of the University of East Anglia coordinated the GOLLUM cylinder comparison program and supported the data acquisition. Our research has been financially supported by the Global Environmental Research Coordination System from Ministry of the Environment of Japan (METI1454, METI1953) and the JSPS KAKENHI under grant number 19K05554.
This research has been supported by the Global Environmental Research Coordination System from the Japanese Ministry of the Environment (grant nos. METI1454 and METI1953) and the JSPS KAKENHI (grant no. 19K05554).
This paper was edited by Thomas Röckmann and reviewed by Britton Stephens and one anonymous referee.
Aoki, N. and Shimosaka, T.: Development of an analytical system based on a paramagnetic oxygen analyzer for atmospheric oxygen variations, Anal. Sci., 34, 487–493, https://doi.org/10.2116/analsci.17P380, 2018.
Aoki, N., Ishidoya, S., Matsumoto, N., Watanabe, T., Shimosaka, T., and Murayama, S.: Preparation of primary standard mixtures for atmospheric oxygen measurements with less than 1 µmol mol−1 uncertainty for oxygen molar fractions, Atmos. Meas. Tech., 12, 2631–2646, https://doi.org/10.5194/amt-12-2631-2019, 2019.
Baertschi, P.: Absolute 18O content of standard mean ocean water, Earth Planet. Sc. Lett., 31, 341–344, https://doi.org/10.1016/0012-821X(76)90115-1, 1976.
Barkan, E. and Luz, B.: High precision measurements of and ratios in H2O, Rapid Commun. Mass Sp., 19, 3737–3742, https://doi.org/10.1002/rcm.2250, 2005.
Bender, M. L., Tans, P. P., Ellis, J. T., Orchard, J., and Habfast, K.: High precision isotope ratio mass spectrometry method for measuring the ratio of air, Geochim. Cosmochim. Ac., 58, 4751–4758, https://doi.org/10.1002/(SICI)1096-9888(199603)31:3<225::AID-JMS319>3.0.CO;2-L, 1994.
Bender, M. L., Ho, D. T., Hendricks, M. B., Mika, R., Battle, M. O., Tans, P. P., Conway, T. J., Sturtevant, B., and Casser, N.: Atmospheric changes, 1993–2002: Implications for the partitioning of fossil fuel CO2 sequestration, Global Biogeochem. Cy., 19, GB4017, https://doi.org/10.1029/2004GB002410, 2005.
Berhanu, T. A., Hoffnagle, J., Rella, C., Kimhak, D., Nyfeler, P., and Leuenberger, M.: High-precision atmospheric oxygen measurement comparisons between a newly built CRDS analyzer and existing measurement techniques, Atmos. Meas. Tech., 12, 6803–6826, https://doi.org/10.5194/amt-12-6803-2019, 2019.
De Laeter, J. R., Böhlke, J. K., De Bièfre, P., Hidaka, H., Peiser, H. S., Rosman, K. J. R., and Taylor P. D. P.: Atomic weights of the elements: Review 2000 (IUPAC Technical Report), Pure Appl. Chem., 75, 683–800, 2003.
Friedlingstein, P., O'Sullivan, M., Jones, M. W., Andrew, R. M., Hauck, J., Olsen, A., Peters, G. P., Peters, W., Pongratz, J., Sitch, S., Le Quéré, C., Canadell, J. G., Ciais, P., Jackson, R. B., Alin, S., Aragão, L. E. O. C., Arneth, A., Arora, V., Bates, N. R., Becker, M., Benoit-Cattin, A., Bittig, H. C., Bopp, L., Bultan, S., Chandra, N., Chevallier, F., Chini, L. P., Evans, W., Florentie, L., Forster, P. M., Gasser, T., Gehlen, M., Gilfillan, D., Gkritzalis, T., Gregor, L., Gruber, N., Harris, I., Hartung, K., Haverd, V., Houghton, R. A., Ilyina, T., Jain, A. K., Joetzjer, E., Kadono, K., Kato, E., Kitidis, V., Korsbakken, J. I., Landschützer, P., Lefèvre, N., Lenton, A., Lienert, S., Liu, Z., Lombardozzi, D., Marland, G., Metzl, N., Munro, D. R., Nabel, J. E. M. S., Nakaoka, S.-I., Niwa, Y., O'Brien, K., Ono, T., Palmer, P. I., Pierrot, D., Poulter, B., Resplandy, L., Robertson, E., Rödenbeck, C., Schwinger, J., Séférian, R., Skjelvan, I., Smith, A. J. P., Sutton, A. J., Tanhua, T., Tans, P. P., Tian, H., Tilbrook, B., van der Werf, G., Vuichard, N., Walker, A. P., Wanninkhof, R., Watson, A. J., Willis, D., Wiltshire, A. J., Yuan, W., Yue, X., and Zaehle, S.: Global Carbon Budget 2020, Earth Syst. Sci. Data, 12, 3269–3340, https://doi.org/10.5194/essd-12-3269-2020, 2020.
GOLLUM: Manning, A. C., Keeling, R. F., Etchells, A. J., Hewitt, M., Bender, M. L., Bracchi, K., Brailsford, G. W., Brand, W. A., Cassar, N., Cox, A. C., Leuenberger, M., Meijer, H. A. J., Morimoto, S., Nakazawa, T., Neubert, R. E. M., Paplawsky, W. J., Richter, J. M., Stephens, B. B., Tohjima, Y., van der Laan, S., van der Laan-Luijkx, I. T., Watt, A., and Wilson, P. A.: The “GOLLUM” O2 intercomparison programme: Latest results and next step, Second APO Workshop, La Jolla, California, USA, 18–20 September 2015, https://gollum.uea.ac.uk/apo-2015.shtml (last access: 30 August 2021), 2015.
Glueckauf, E.: The composition of atmospheric air, in: Compendium of Meteorology, Malone, T. (Ed.), American Meteorological Society, Boston, pp. 3–10, https://doi.org/10.1007/978-1-940033-70-9_1, 1951.
Goto, D., Morimoto, S., Ishidoya, S., Ogi, A., Aoki, S., and Nakazawa, T.: Development of a high precision continuous measurement system for the atmospheric ratio and its application at Aobayama, Sendai, Japan, J. Meteorol. Soc. Jpn., 91, 179–192, https://doi.org/10.2151/jmsj.2013-206, 2013.
Goto, D., Morimoto, S., Ishidoya, S., Aoki, S., and Nakazawa, T.: Terrestrial biospheric and oceanic CO2 uptakes estimated from long-term measurements of atmospheric CO2 molar fraction, δ13C, and δ() at Ny-Ålesund, Svalbard, J. Geophys. Res., 122, 1192–1202, https://doi.org/10.1002/2017JG003845, 2017.
Ishidoya, S. and Murayama, S.: Development of a new high precision continuous measuring system for atmospheric and ArN2 and its application to the observation in Tsukuba, Japan, Tellus B, 66, 22574, https://doi.org/10.3402/tellusb.v66.22574, 2014.
Ishidoya, S., Aoki, S., and Nakazawa T.: High precision measurements of the atmospheric ratio on mass spectrometer, J. Meteorol. Soc. Jpn., 81, 127–140, https://doi.org/10.2151/jmsj.81.127, 2003.
Ishidoya, S., Morimoto, S., Aoki, S., Taguchi, S., Goto, D., Murayama, S., and Nakazawa, T.: Oceanic and terrestrial biospheric CO2 uptake estimated from atmospheric potential oxygen observed at Ny-Ålesund, Svalbard, and Syowa, Antarctica, Tellus B, 64, 18924, https://doi.org/10.3402/tellusb.v64i0.18924, 2012a.
Ishidoya, S., Aoki, S., Goto, D., Nakazawa, T., Taguchi, S., and Patra, P. K.: Time and space variations of the ratio in the troposphere over Japan and estimation of global CO2 budget, Tellus B, 64, 18964, https://doi.org/10.3402/tellusb.v64i0.18964, 2012b.
Ishidoya, S., Tsuboi, K., Murayama, S., Matsueda, H., Aoki, N., Shimosaka, T., Kondo, H., and Saito, K.: Development of a continuous measurement system for atmospheric ratio using a paramagnetic analyzer and its application on Minamitorishima Island, Japan, SOL, 13, 230–234, https://doi.org/10.2151/sola.2017-042, 2017.
ISO 6142-1:2015, Gas analysis-preparation of calibration gas mixtures-part 1: gravimetric method for class i mixtures, International Organization for Standardization, ISO 6142-1:2015, 2015.
Junk, G. A. and Svec, H. J.: The absolute abundance of the nitrogen isotopes in the atmosphere and compressed gas from various sources, Geochim. Cosmochim. Ac., 14, 234–243, https://doi.org/10.1016/0016-7037(58)90082-6, 1958.
Keeling, R. F.: Development of an interferometric oxygen analyzer for precise measurement of the atmospheric O2 mole fraction, PhD thesis, Harvard University, Cambridge, 1988a.
Keeling, R. F.: Measuring correlations between atmospheric oxygen and carbon-dioxide mole fractions – a preliminary-study in urban air, J. Atmos. Chem., 7, 153–176, https://doi.org/10.1007/BF00048044, 1988b.
Keeling, R. F. and Shertz, S. R.: Seasonal and interannual variations in atmospheric oxygen and implications for the global carbon cycle, Nature, 358, 723–727, https://doi.org/10.1038/358723a0, 1992.
Keeling, R. F., Bender, M. L., and Tans, P. P.: What atmospheric oxygen measurements can tell us about the global carbon cycle, Global Biogeochem. Cy., 7, 37–67, https://doi.org/10.1029/92GB02733, 1993.
Keeling, R. F., Piper, S. C., and Heimann, M.: Global and hemispheric CO2 sinks deduced from changes in atmospheric O2 concentration, Nature, 381, 218–221, https://doi.org/10.1038/381218a0, 1996.
Keeling, R. F., Manning, A. C., McEvoy, E. M., and Shertz, S. R.: Methods for measuring changes in atmospheric O2 concentration and their application in southern hemisphere air, J. Geophys. Res., 103, 3381–3397, https://doi.org/10.1029/97JD02537, 1998.
Keeling, R. F., Blaine, T. Paplawsky, B, Katz, L., Atwood, C., and Brockwell, T.: Measurement of changes in atmospheric ArN2 ratio using a rapid-switching, single-capillary mass spectrometer system, Tellus B, 56, 322–338, https://doi.org/10.3402/tellusb.v56i4.16453, 2004.
Keeling, R. F., Manning, A. C., Paplawsky, W. J., and Cox, A.: On the long-term stability of reference gases for atmospheric and CO2 measurements, Tellus B, 59, 3–14, https://doi.org/10.1111/j.1600-0889.2006.00196.x, 2007.
Keeling, R. F., Walker, S. J., and Paplawsky, B.: Span sensitivity of the Scripps interferometric oxygen analyzer, SIO Reference Series, Scripps Institution of Oceanography, UC San Diego, 1–49, 2020.
Kronjäger, W.: Dispersion von Luft, Krypton und Xenon im kurzwelligen Ultraviolett, Z. Phys., 98, 17–22, https://doi.org/10.1007/BF01337441, 1936.
Langenfelds, R. L., Francey, R. J., Steele, L. P., Battle, M., Keeling, R. F., and Budd, W. F.: Partitioning of the global fossil CO2 sink using a 19 year trend in atmospheric O2, Geophys. Res. Lett., 26, 1897–1900, https://doi.org/10.1029/1999GL900446,1999.
Leuenberger, M. C., Schibig, M. F., and Nyfeler, P.: Gas adsorption and desorption effects on cylinders and their importance for long-term gas records, Atmos. Meas. Tech., 8, 5289–5299, https://doi.org/10.5194/amt-8-5289-2015, 2015.
Levitus, S., Antonov, J. I., Boyer, T. P., Baranova, O. K., Garcia, H. E., Locarnini, R. A., Mishonov, A. V., Reagan, J. R., Seidov, D., Yarosh, E. S., and Zweng, M. M.: World ocean heat content and thermosteric sea level change (0–2000 m), 1955–2010, Geophys. Res. Lett., 39, L10603, https://doi.org/10.1029/2012GL051106, 2012.
Li, W., Ni, B., Jin, D., and Chang, T. L.: Measurement of the absolute abundance of oxygen-17 in V-SMOW, Kexue Tongbao, 33, 1610–1613, 1988.
Manning, A. C. and Keeling, R. F.: Global oceanic and land biotic carbon sinks from the Scripps atmospheric oxygen flask sampling network, Tellus B, 58, 95–116, https://doi.org/10.1111/j.1600-0889.2006.00175.x, 2006.
Manning, A. C., Keeling, R. F., and Severinghaus, J. P.: Precise atmospheric oxygen measurements with a paramagnetic oxygen analyzer, Global Biogeochem. Cy., 13, 1107–1115, https://doi.org/10.1029/1999GB900054, 1999.
Matsumoto, N., Watanabe T., Maruyama, M., Horimoto Y., T. Maeda, T., and Kato, K.: Development of mass measurement equipment using an electronic mass-comparator for the gravimetric preparation of reference gas mixtures, Metrologia, 41, 178–188, https://doi.org/10.1088/0026-1394/41/3/011, 2004.
Matsumoto, N., Shimosaka, T., Watanabe, T., and Kato, K.: Evaluation of error sources in a gravimetric technique for preparation of a reference gas mixture (carbon dioxide in synthetic air), Anal. Bioanal. Chem., 391, 2061–2069, https://doi.org/10.1007/s00216-008-2107-8, 2008.
Rasplandy, L., Keeling, R. F., Eddebbar, Y., Brooks, M. Wang, R., Bopp, L. Long, M. C., Dunne, J. P., Koeve, W., and Oschlies, A.: Quantification of ocean heat uptake from changes in atmospheric O2 and CO2 composition, Nat. Res., 9, 20244, https://doi.org/10.1038/s41598-019-56490-z, 2019.
Severinghaus, J.: Studies of the terrestrial O2 and carbon cycles in sand dune gases and in biosphere 2, PhD thesis, Columbia University, New York, https://doi.org/10.2172/477735, 1995.
Stephens, B. B., Keeling, R. F., Heimann, M., Six, K. D., Mumane, R., and Caldeira, K.: Testing global ocean carbon cycle models using measurements of atmospheric O2 and CO2 concentration, Global Biogeochem. Cy., 12, 213–230, https://doi.org/10.1029/97GB03500, 1998.
Stephens, B. B., Keeling, R. F., and Paplawsky, W. J.: Shipboard measurements of atmospheric oxygen using a vacuum-ultraviolet absorption technique, Tellus B, 55, 857–878, https://doi.org/10.3402/tellusb.v55i4.16386, 2003.
Stephens, B. B., Bakwin, P. S., Tans, P. P., Teclaw, R. M., and Baumann, D.: Application of a differential fuel-cell analyzer for measuring atmospheric oxygen variations, J. Atmos. Ocean. Tech., 24, 82–94, https://doi.org/10.1175/JTECH1959.1, 2007.
Sturm, P., Leuenberger, M., Sirignano, C., Neubert, R. E. M., Meiger, H. A. J., Langenfelds, R., Brand, W. A., and Tohjima, Y.: Permeation of atmospheric gases through polymer O-rings used in flasks for air sampling, J. Geophys. Res., 109, D04309, https://doi.org/10.1029/2003JD004073, 2004.
Tohjima, Y.: Method for measuring changes in the atmospheric ratio by a gas chromatograph equipped with a thermal conductivity detector, J. Geophys. Res., 105, 14575–14584, https://doi.org/10.1029/2000JD900057, 2000.
Tohjima, Y., Machida, T., Watai, T., Akama, I., Amari, T., and Moriwaki, Y.: Preparation of gravimetric standards for measurements of atmospheric oxygen and reevaluation of atmospheric oxygen concentration, J. Geophys. Res., 110, D1130, https://doi.org/10.1029/2004JD005595, 2005.
Tohjima, Y., Mukai, H., Nojiri, Y., Yamagishi, H., and Machida, T.: Atmospheric measurements at two Japanese sites: Estimation of global oceanic and land biotic carbon sinks and analysis of the variations in atmospheric potential oxygen (APO), Tellus B, 60, 213–225, https://doi.org/10.1111/j.1600-0889.2007.00334.x, 2008.
Tohjima, Y., Mukai, H., Machida, T., Hoshina, Y., and Nakaoka, S.-I.: Global carbon budgets estimated from atmospheric and CO2 observations in the western Pacific region over a 15 year period, Atmos. Chem. Phys., 19, 9269–9285, https://doi.org/10.5194/acp-19-9269-2019, 2019.
Wieser, M. E. and Berglund, M.: Atomic weights of the elements 2007 (IUPAC Technical Report), Pure Appl. Chem., 81, 2131–2156, 2009.
WMO: Global Atmosphere Watch, 12th WMO/IAEA Meeting of Expert on Carbon Dioxide Concentration and Related Tracers Measurements Techniques, Toronto, Canada, 15–18 September 2003, GAW Report no. 161, WMO TD no. 1275, Geneva, Switzerland, 2005.