the Creative Commons Attribution 4.0 License.
the Creative Commons Attribution 4.0 License.
 | 28 Sep 2021
Effect of snow-covered ground albedo on the accuracy of air temperature measurements
Chiara Musacchio
Gaber Begeš
Christina Hofstätter-Mohler
Laura Massano
Guido Nigrelli
Francesca Sanna
Andrea Merlone
Solar radiation is one of the main factors which introduce significant deviations between thermometers reading and true air temperature value. Techniques to protect the sensors from direct radiative influence have been adopted almost since the beginning of meteorological observations. Reflected radiation from a snow-covered surface can also cause extra warming to thermometers hosted in solar shields, which are not always optimised to protect the sensors from this further radiative heat transfer. This phenomenon can cause errors in near-surface temperature measurements results, with a relevant impact on the quality of data records and series. This study experimentally evaluates the effect of reflected radiation from a snow-covered surface on the accuracy of air temperature measurements. The investigation is based on the evaluation of temperature differences between pairs of identical instruments, positioned above ground covered by natural vegetation, with one instrument in snow-free conditions and the other above a snow-covered surface, at the same time and at the same site. The work involved a representative number of sensors and shields, in terms of different typologies, technologies and engineering solutions, from different manufacturers. A mountain site with acceptable field conditions, offering long-lasting snow presence to maximise data availability, was selected to perform the experiment. Quantities of influence, such as relative humidity, wind speed and direction and solar radiation (global and reflected), were constantly measured. The main findings of this work show that none of the involved instruments were immune to the extra heating due to the snow-reflected radiation. Excluding nighttimes and days of high wind or low incident radiation, the differences among sensors positioned above natural soil and identical ones exposed to snow albedo ranged up to more than 3 ∘C. Solar screens with forced ventilation showed a partially reduced effect compared to most of the naturally ventilated ones. A full data analysis is reported here, together with complete results and uncertainties.
Please read the corrigendum first before continuing.
-
Notice on corrigendum
The requested paper has a corresponding corrigendum published. Please read the corrigendum first before downloading the article.
-
Article
(9849 KB)
-
The requested paper has a corresponding corrigendum published. Please read the corrigendum first before downloading the article.
- Article
(9849 KB) - Full-text XML
- Corrigendum
- BibTeX
- EndNote


The World Meteorological Organization (WMO), Commission for Climatology and the Global Climate Observing System (GCOS) recommend the study and definition of measurement methods for reference-grade networks and installations to generate top quality data for meteorology and climate studies (GCOS, 2019). A key requirement for a station taking part in a reference network is a documented traceability and the understanding of the total measurement uncertainty (Thorne et al., 2018). Consistent uncertainty calculations need complete knowledge of the measurement system, sensors' calibration uncertainty, characteristics of the site and effects of environmental parameters such as wind, solar radiation and precipitation. Among the numerous observed essential climate variables (ECVs), near-surface (1.25–2 m; WMO, 2012) atmospheric air temperature measurements have been collected for 150 years. Such data series form the basis of scientific knowledge on local and global climate trends (Camuffo and Jones, 2002). Land-based stations are equipped with different kinds of thermometers whose performances have constantly improved. Today, top quality instruments involve platinum resistance sensors and high-level reading and recording electronics. Many efforts have also been made to minimise the effect of the quantities of influence on measurement results, with the aim to reduce the associated errors and measurement uncertainty. Solar radiation is one of the main factors influencing the instruments, causing significant deviations between sensors' readings and real air temperature. Techniques to protect sensors have been adopted almost since the beginning of meteorological observations. Shields to avoid direct solar radiation reaching the sensing element have been developed, from Stevenson screens (Stevenson, 1864) and modern pagodas to naturally or mechanically ventilated solar shields. Recent intercomparisons were organised by WMO (Lacombe et al., 2011) to evaluate the performances and differences among the numerous solutions adopted by manufacturers. While the practical/technical features offered by these shields are now optimised and prescribed (WMO, 2012), their capability to protect the thermometers from radiation reflected by the ground is rarely evaluated or taken into account in measurements or documented in data sheets. This is dependent on the so called albedo, indicated with α, which is the ratio of reflected radiation with respect to the global radiation received by the ground that, in the case of snow cover, is increased up to 95 % (Barry and Blanken, 2016). Like global radiation, this reflected component can cause extra warming of instruments, introducing errors in near-surface temperature data series, with a relevant impact on detected maximum values and anomalies. Such instrumental errors have different magnitudes, depending on the equipment and the technical solutions adopted in manufacturing thermometers and shields. This phenomenon is particularly relevant in monitoring mountain climate, where the duration of snow cover is high (Nigrelli et al., 2018).
Only few studies in the literature evaluate the effect of the albedo of snow-covered land on temperature sensors; among them, the most significant work is from Huwald et al. (2009), which is based on a different approach and is limited to a single typology of sensor and screen.
The task of the present work is to observe, measure and quantify the effect of extra heating on different kinds of instruments positioned above snow-covered land in terms of deviations of the sensors' readings from actual temperature values. This work is the result of a seasonal in-field experiment, following a metrological protocol and experimental method defined and described in a previous study (Musacchio et al., 2019). The investigation is addressed at the evaluation of relative difference between the readings of pairs of identical sensors protected by solar shields as provided by manufacturers. One pair is positioned above a snow-covered surface, while the other is above grass-covered ground, at the same site and at the same time and under equal environmental and topoclimatic conditions.
The problem of albedo effect on air temperature instruments can be included as part of the general study on assessing data quality and uncertainty in near-surface air temperature measurements. This wider subject is now being analysed and discussed by the WMO expert teams of the Infrastructure Commission (INFCOM) and is a key aspect in the creation of the Climate Reference Networks for the Global Climate Observing System (GCOS). The complete knowledge and evaluation of uncertainty budget components on air temperature measurement is also included in the roadmaps of scientific activities of the working group for environment of the Comité Consultatif de Thermométrie (CCT; Consultative Committee for Thermometry) of the Bureau International des Poids et Mesures (BIPM; International Bureau of Weights and Measures; CCT, 2017).
The activities reported here have been carried out in the framework of the MeteoMet project (Merlone et al., 2015a, b, 2018), a funded joint research initiative of the European Metrology Research Project (EMRP), grouping a wide consortium of National Metrology Institutes (NMIs), research institutes, universities and national meteorological and hydrological services (NMHSs).
The experiment presented here follows the prescriptions and assumptions proposed by Musacchio et al. (2019), where a measurement protocol is presented, following a theoretical study on the influence of various parameters such as wind speed and direction, snow cover thickness, incident solar radiation, snow conditions and humidity on air temperature measurements above snow-covered ground. In the cited work, the authors also give guidelines on the experiment design and the evaluation of uncertainty components, as well as laboratory characterisations of instruments and the treatment of all identified quantities of influence, both instrumental and environmental. Based on these considerations, a measurement protocol, prescribing the following, was prepared for the realisation of the field experiment:
-
design of the experimental set-up and definition of site requirements
-
evaluation of the quantities of influence
-
characterisation of the sensors in laboratory and in field
-
evaluation of uncertainty components.
2.1 Experimental set-up and site requirements
The albedo effect investigated here is defined as is the sensors' overheating due to reflected radiation from snow, and it is measured as differences in air temperature readings tair between pairs of identical sensors inside identical shields, with one at point a, above snow, and the other at a second point b, in the snow-free area. This difference is indicated here as follows:
including all the corrections evaluated for each pair of sensors during the laboratory and field characterisations described in the following sections.
These two measurement points are arranged in close vicinity and on a flat surface, free from obstacles, and are thus exposed to the same topoclimatic conditions; however, they are far enough apart to accommodate a significant area covered by snow at one point and a sufficient area (at least 5 m of radius) with natural ground left free from snow at the other point. Readings from each pair of sensors are recorded by means of a single data logger. The investigated effect is, therefore, the result of a relative analysis of temperature differences involving identical instruments and single reading unit; this allows for the minimisation of influencing factors and uncertainties. Halfway between the two measurement points, other instruments are deployed to measure the quantities of influence, which contribute as components to the uncertainty budget.
Following the experimental protocol described in Musacchio et al. (2019), the site hosting the experiment requires a number of specific features. It must be an open, flat surface of at least 50 m in diameter with a minimum presence of obstacles (e.g. trees, buildings or roads in the surrounding area) and have spatially uniform solar exposure during the daytime central hours. Snow must be present for a significant amount of time; underneath it, the ground must be covered with natural low vegetation. Other characteristics are related to logistic aspects such as electrical power being available throughout the winter, easy access for maintenance, no agricultural or sport activities, strictly reduced access to the public and no presence of vehicles. The experimental site scheme is described in Fig. 1.
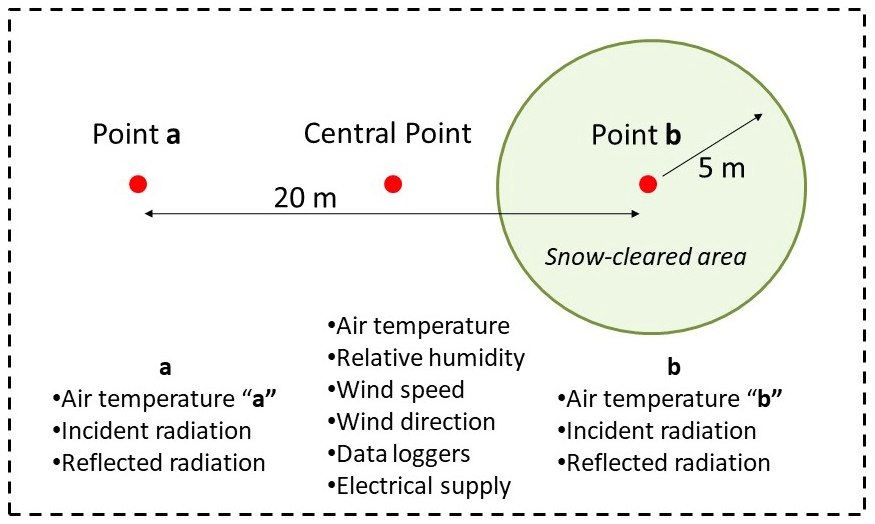
Figure 1Experiment layout scheme. Points a and b host the pairs of identical thermometers and shields. The central point hosts auxiliary equipment, data loggers and sensors for measuring quantities of influence.
2.2 Quantities of influence
The main quantities of influence on temperature measurements for the evaluation of the albedo effect must be constantly monitored during the experiment. Musacchio et al. (2019) identified wind speed, air relative humidity and solar radiation as possible major contributors. As a matter of fact, as stated in the cited work, humidity should not have a measurable influence on the albedo effect; it was included in the present experiment simply because hygrometers are commonplace in weather stations, and its monitoring does not significantly increase the workload. A simple preliminary analysis of the humidity ruled out any contributions of it to the albedo effect.
Global (downward) and reflected (upward) solar radiations were measured in the same position of each temperature sensor to associate the temperature differences to the radiative budget. Without going into too much detail, which is available in the cited work, other quantities were identified as being important, like snow depth and conditions; they influence the albedo effect in terms of functional evaluation, but since this work aims at detecting the maximum value of the effect, they have been monitored (see Sect. 3.2) but are excluded from the analysis. Some other quantities, like snow density and solar zenith angle, have been considered but ultimately not monitored, e.g. following, for example, the findings of Bohren and Beschta (1979), who concluded that snowpack albedo was only weakly dependent upon snow density, and the theoretical study of Xiong et al. (2015), who showed that, at high values of albedo like those typical of snow, the dependence on the solar zenith angle is basically flat, while, at lower values, the dependence steepens, after ∼ 60∘ which is basically never achieved at our site given its particular orography. As a general consideration, solar zenith angle should be taken into consideration in wider locations, given that, at very large angles, broadband albedo tends to increase.
It is still possible that very thin snow covers of low density may be influenced by the dark ground surface. In this case, density could be a significant influencing quantity; however, this should reflect in lower values of reflected radiation (thus albedo) and is easy to spot during the analysis. As a matter of fact, no instances of this kind have happened in the days selected for data analysis.
2.3 Sensor characterisation
Before starting the experimental activities in the field, temperature sensors have been characterised in order to understand their behaviour in different situations. The experimental protocol prescribes two different characterisation phases, i.e. in laboratory and in field conditions.
The laboratory characterisation is needed to evaluate possible systematic differences between pairs of sensors exposed to the same temperature under controlled conditions. Since the investigation is based only on relative temperature differences among pairs of identical instruments, the sensors' calibration is not strictly necessary as no traceable absolute temperature measurements are required for the evaluation of the albedo effect in field. This avoids the inclusion of the calibration uncertainty in the overall uncertainty budget and makes the adoption of this procedure easier, also for users willing to make similar analysis without the calibration costs and time required. Laboratory-controlled conditions also allow the evaluation of the sensors' stability and sensitivity and the resolution of the readout.
Different systematic biases can arise when the sensors are deployed in the field, due to environmental factors. For this reason, an in-field characterisation of the sensors is also needed to evaluate their behaviour in such conditions. Performing an estimation of the uncertainty components of on-site measurements is necessary to quantify the accuracy reached in the experiment. For more details, Musacchio et al. (2019) give an in-depth description of the whole method together with its assumptions and prescriptions.
The experimental activity reported in the present work was carried out in the framework of the MeteoMet2 project. Pairs of systems composed of different sensors and shields of different shapes and dimensions, either mechanically aspirated or naturally ventilated, were lent to us directly by the manufacturers, along with their data loggers, in order to have as many commonly used devices in as broad a range as possible. In the end, six different pairs of systems from four different producers were selected for the experiment and labelled from A to F; their main characteristics are described in Table 1.
Table 1Selected air temperature instruments and their main characteristics.
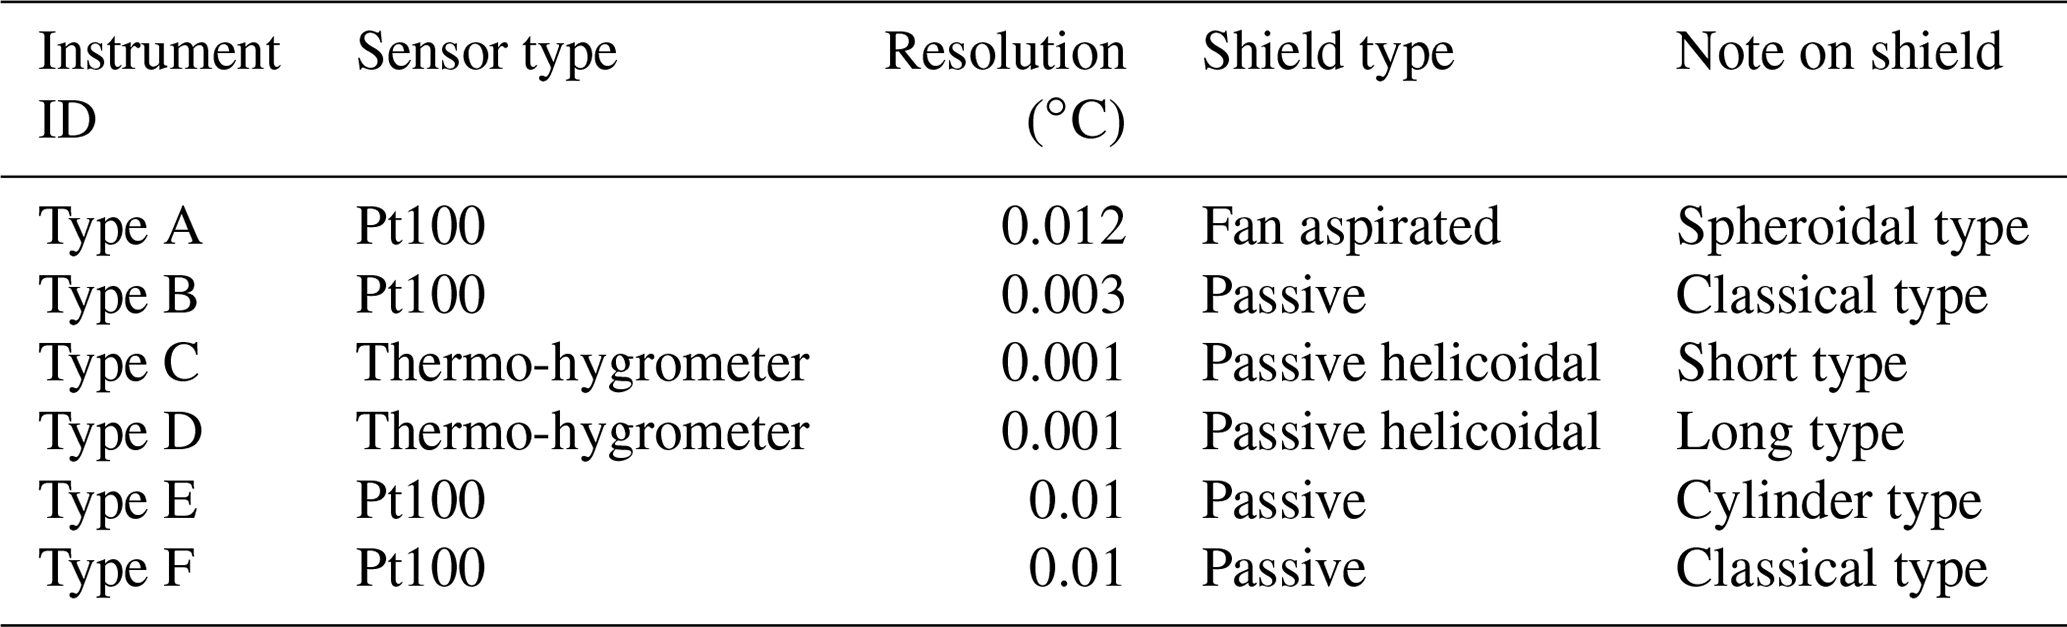
Table 2Ancillary measurement sensors and their positioning with reference to the scheme in Fig. 1.

Additional sensors for the measurement of the quantities of influence were installed, including a cup-and-vane anemometer, a thermo-hygrometer (both positioned in the central measurement point of the experimental area) and two albedometers, one for each measurement point (Table 2). The air temperature measured in the central point is neither included in the evaluation of the differences among the pairs of sensors under test, nor does it contribute to the uncertainty budget. This further air temperature value is recorded as another potential quantity of influence, both in terms of further possible dependence of the temperature differences on the temperature itself and, in addition, to the one investigated in laboratory.
3.1 Laboratory tests and characterisation
Tests on the selected sensors were performed in the laboratory for the characterisation of the sensors and the complete system. This part of the work was performed in the new Climate Data Quality Laboratory of the Istituto di Ricerca per la Protezione Idrogeologica – Consiglio Nazionale delle Ricerche (IRPI-CNR). During this phase, a study of the different data loggers' working principles was also made, together with the evaluation of best mounting solutions.
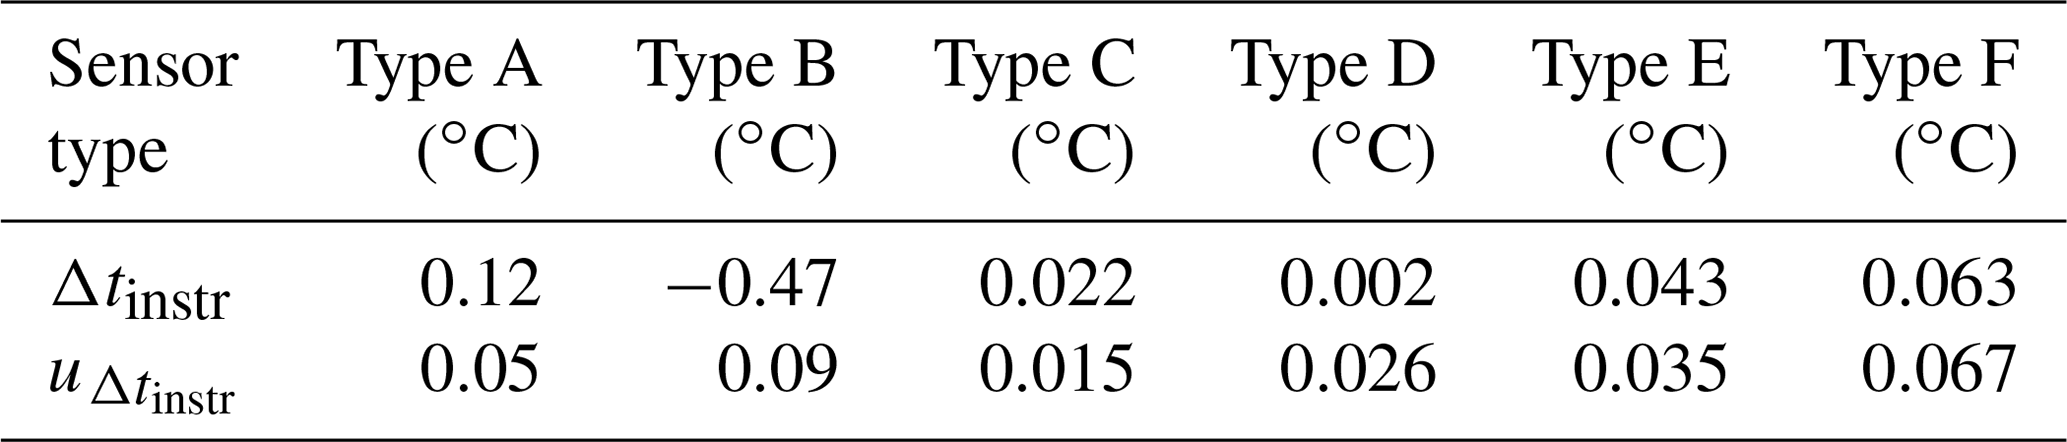
The activities started with an evaluation of the differences between readings by each pair of sensors, without shields, in stable temperature conditions, to check for systematic biases. The sensors were then assembled in the shields, and all the temperature measurements differences of each pair of instruments, Δtinstr, were measured. The characterisation was then performed in a controlled environment with a slow temperature change to take into account possible effects without being affected too much by the sensors' dynamics (intended as the behaviour of the sensor exposed to changes in temperature, i.e. the time response, and to the changes in other influence quantities). Rapid air temperature transients (implying thermodynamic non-equilibrium with the environment), both in the lab and on site, will in fact not be included in the final data analysis, since the sensors' dynamics can predominantly influence the trueness of the analysis (Burt and de Podesta, 2020). All sensors (except for two pairs, namely E and F, which joined the experiment later) underwent this laboratory characterisation in order to obtain the information reported in Table 3 along with their uncertainties , as evaluated in Sect. 3.1.2.
Table 3Results of the evaluation of Δtinstr and the associated uncertainties for each instrument type.
Stability of the instruments was also tested in the laboratory, during a 1 month continuous acquisition, to check for longer-term drifts and potential maintenance required in the field. No failures or significant effects were observed.
3.1.1 Laboratory
The laboratory-controlled experimental conditions have been evaluated in the testing zone, using traceable reference sensors.
Room temperature drift was found to be <0.02 ∘C for 1 d and <0.05 ∘C over 1 week. For time intervals corresponding to the data loggers' acquisition and recording times (tens of minutes), the laboratory air temperature stability was evaluated as being ustab=1 mK.1
The temperature homogeneity was measured and found to be <0.05 ∘C m−1. Sensors were positioned at a distance of about 20 cm from one another, as a compromise between minimising the gradient and avoiding mutual influences such as heating from the electronics or fan motors. The uncertainty due to the laboratory temperature homogeneity was therefore evaluated as uhom=0.01 ∘C.
The total uncertainty contribution due to laboratory conditions was evaluated as ∘C for all the sensors.
3.1.2 Instruments
The evaluation of possible systematic differences, Δtinstr, among pairs of identical sensors kept at the same temperature (within the laboratory homogeneity uncertainty) was performed by repeated readings over several intervals of about 1 h. As shown in Fig. 2, all sensor pairs were found to have systematic differences Δtinstr, which have to be taken into account for the correction of field data. Associated uncertainty values are reported in Table 3. The repeatability of temperature differences Δtinstr contributes to the uncertainty budget with a component reported as .
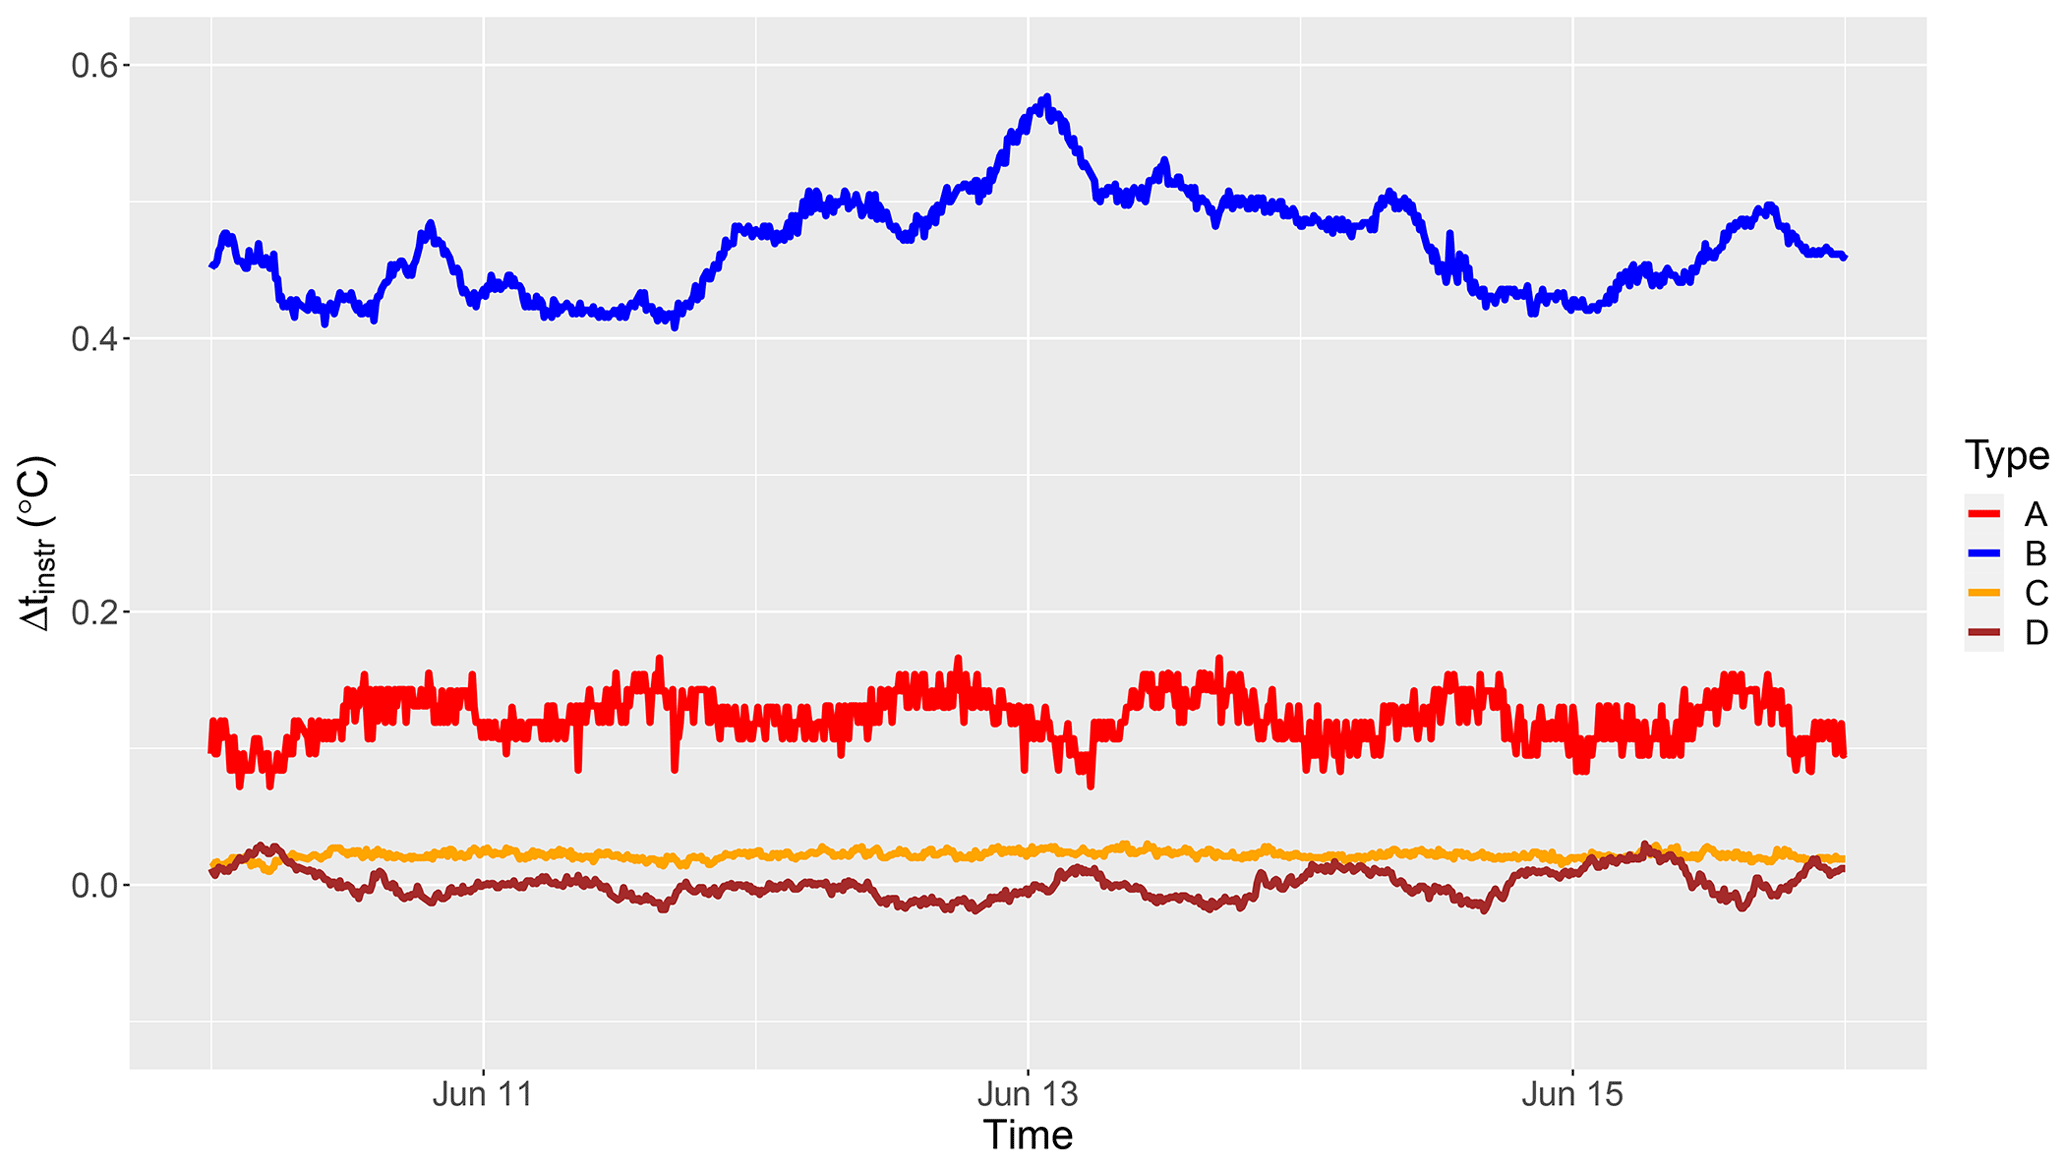
Figure 2Example of laboratory characterisation. Shown is a 1-week acquisition, at 10 min sampling rate, of the differences between the readings of the two sensors of the pair. The E and F systems were not available at the time of the laboratory characterisation.
Finally, a check for possible sensor drifts was performed after the field campaign and exposure to meteorological conditions. In particular, the drift of Δtinstr was evaluated again in stable laboratory conditions. The drift was then evaluated as the differences in the systematic differences measured before and after the field campaign; values were found to be of the same order of magnitude as the instruments' noise. This is an expected result, since only high-performance temperature sensors have been selected, as these are normally produced to guarantee top level stability in time and low drifts, to reduce maintenance and recalibration by the users. The drift in the relative difference becomes, therefore, negligible for the duration of the experiment, and no correction or uncertainty components have been included.
3.2 Measurement site and experimental set-up
Since significant snow cover was needed for the experiment, a mountain site in the Alps was chosen to assure the presence of snow cover throughout the winter.
The measurement site, selected to meet the logistical and experimental requirements, was found in the municipality of Balme at 1410 m elevation (45∘18′9.31′′N, 7∘13′19.18′′ E), in the Ala Valley northwest of Turin, Italy (Fig. 3).

Figure 3(a) Local topographic map (© Geoportale Regione Piemonte, 2021) of the area (∼ 2 × 1.5 km) surrounding the measurement site. The Ala Valley is aligned from east–west with mountains close to the valley in the north, while in the south a small lateral valley opens up the horizon to other high mountains. The measurement site is marked with a red inverted teardrop. The inset shows the position of the measurement site in the Western Alps and in relation to Turin. (b) Magnified (∼ 200 × 100 m) Google Earth (© Google 2017) picture of the experimental site. The approximate positions of the two measurement stations are marked by the yellow spots.
Only a 3 m wide local road with almost no traffic and a small unoccupied building were present in the area at a distance of more than 50 m from the measuring point. Coppa et al. (2021b) performed a metrological quantification of the influences on air temperature measurements introduced by the proximity of roads that revealed a significant effect only at closer distances (less than 50 m) and mainly at very low or even null values of incident radiation; the presence of this infrastructure was therefore considered negligible. According to a similar experiment for the evaluation of the effect of buildings (Garcia Izquierdo et al., 2021), a building of the size of the hut and at that distance causes no influence in air temperature records. Moreover, during the experimental set-up, great care has been taken in order to place both measurement points at similar distances from each possible source of heat and disturbance; thus, their potential influences affect both measurement points in the same way, cancelling out external influences during relative differential evaluations. It is possible that, due to asymmetrical winds, the building can sometimes influence one of the sites more than the other; however, this should affect only few measurements because strong winds were almost absent at that location.
Even though not perfect in terms of siting, the chosen area turned out to be a reasonable compromise between the necessity of an alpine location in terms of snow cover presence and duration and the logistics of an instrumented research site.
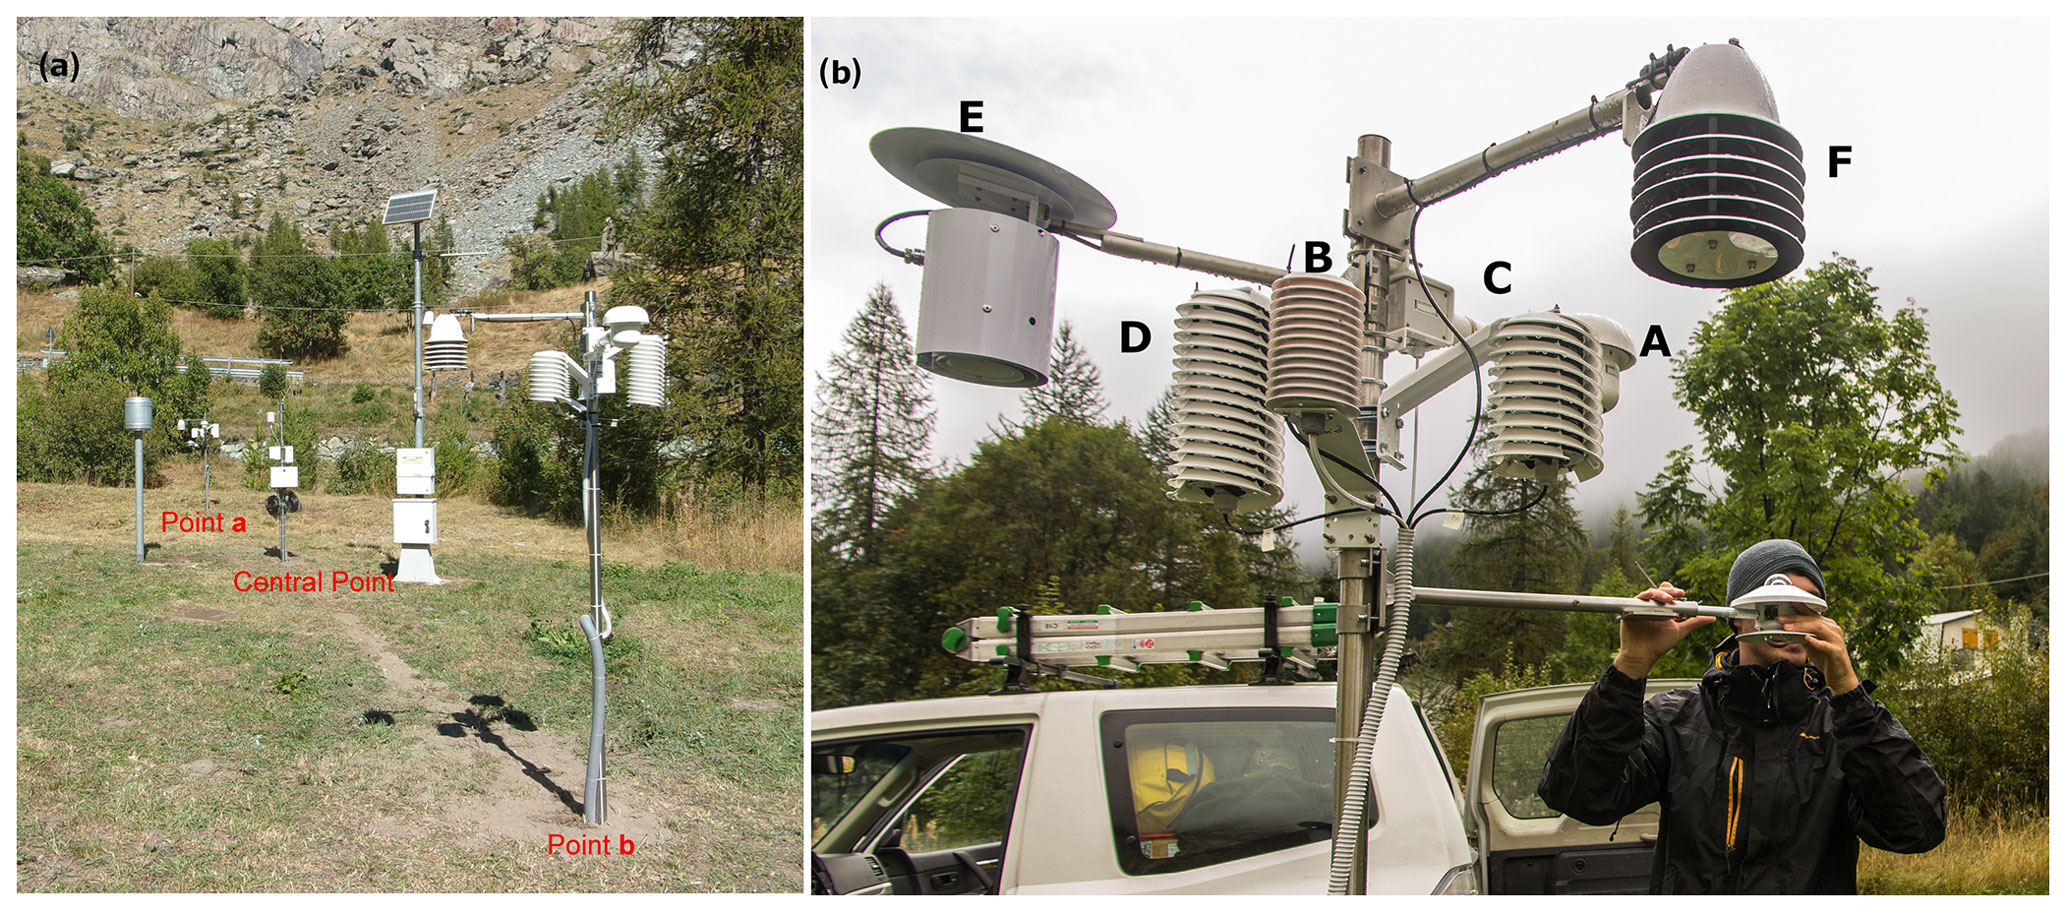
Figure 4(a) The experimental site in summer, during the instruments' installation. Albedometers and systems E and F were not yet installed at the time that this picture was taken. (b) Close-up of one experimental station, during the final phase of installation, with all systems labelled as in Table 1. Visible in the lower-right part of the picture is one of the albedometers.
The equipment was installed following the protocol described in Musacchio et al. (2019). The experimental scheme in Fig. 1 was followed, with two external poles hosting the pairs of identical shielded thermometers and the albedometers and a central pole with the data loggers, the electric power connection to conduct the auxiliary measurements of humidity, wind speed, wind direction and central air temperature (Fig. 4a and b). The two instruments of each pair were positioned in the same orientation, in case of asymmetric shapes, following the manufacturers' specifications (i.e., ventilation aperture facing north).
After significant precipitation events, the snow was removed from a 5 m radius area centred in point b (Fig. 5a and b, respectively, show the site before and after the removal of snow); the site and instruments were constantly supervised and meteorological conditions recorded. In order to select periods when the albedo effect could be better detected in its maximum values, as defined in the model described in Musacchio et al. (2019), a selection of the ideal meteorological conditions was necessary. The 5 m radius was decided as a compromise between maximising the snow-free area under the sensor and having the measurement points close enough to keep the assumption of homogeneity of local weather conditions. This radius could not be expanded because the third measurement point, i.e. the one carrying control and ancillary measurements, would fall in the snow-free area, while it was important that these measurements were representative of the natural state of the site. This set-up limits the albedometer to a footprint of 146∘, out of the theoretical 180∘ (and effective ∼ 170∘) that it is able to cover; this was deemed acceptable, considering, for instance, that doubling the snow-free radius would have quadrupled the area to be freed, while merely adding 16∘ to the footprint. Temperature sensors are much less influenced by the snow-free radius, given that shields have a smaller angle of view.
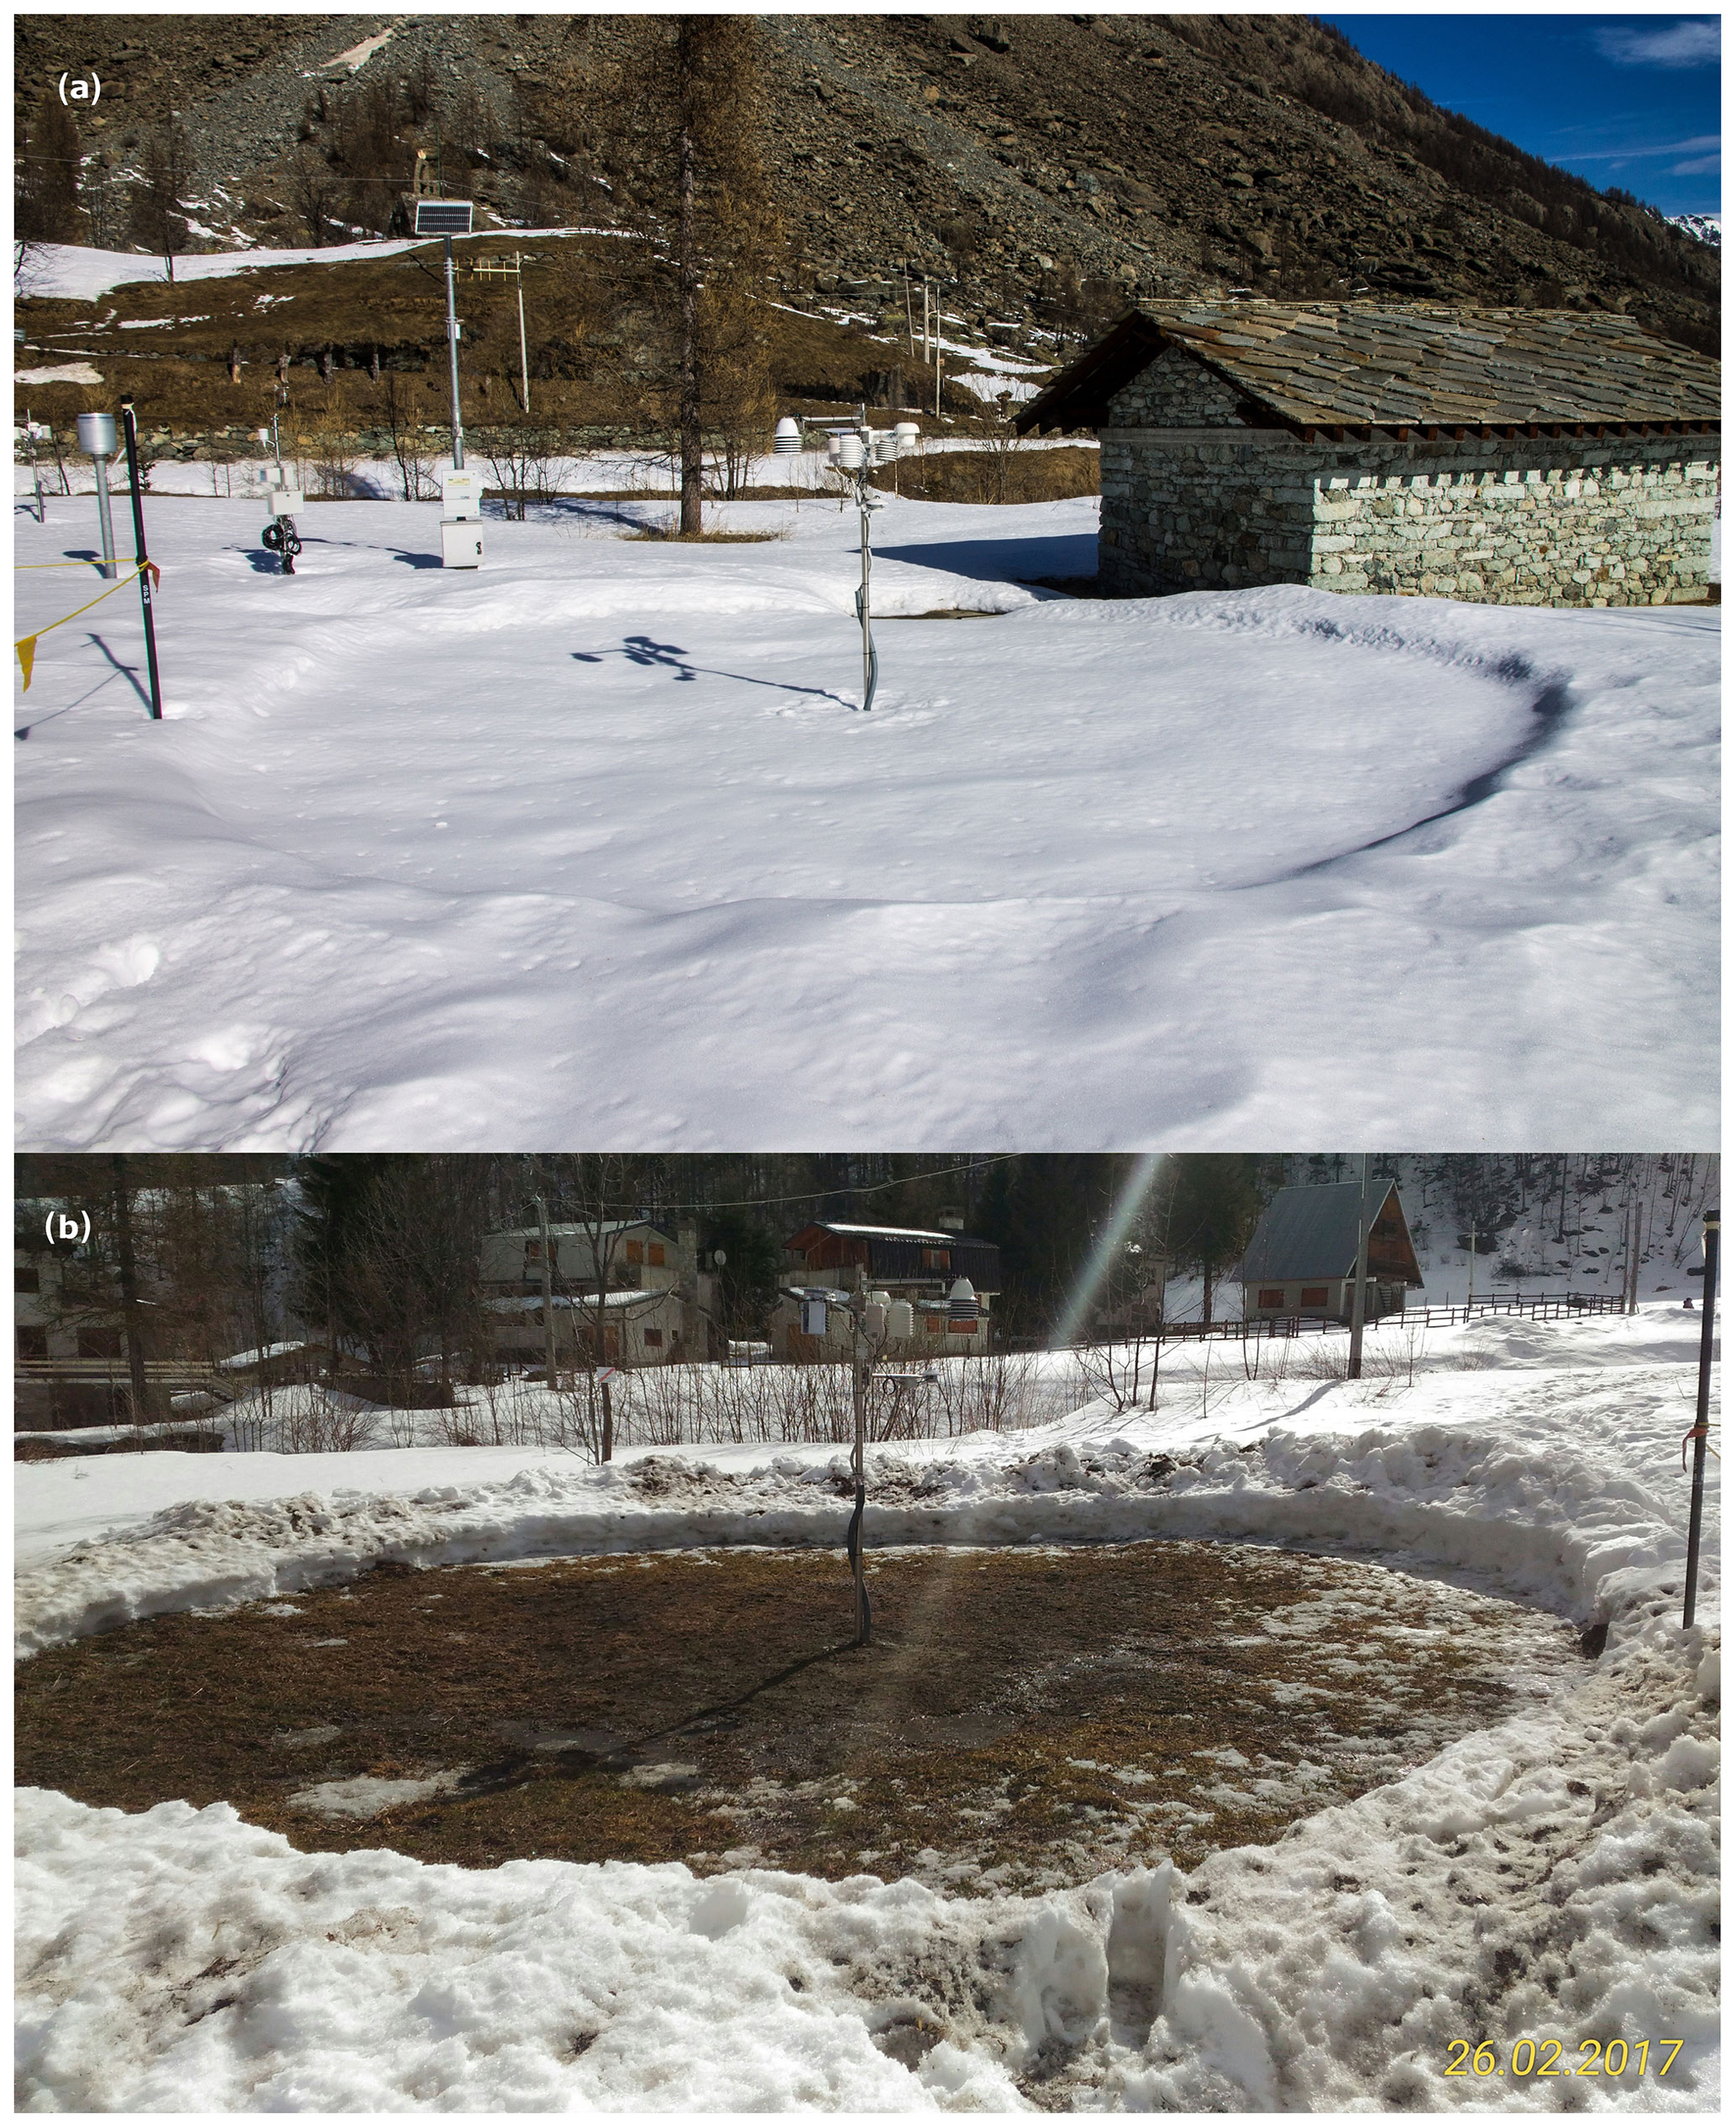
Figure 5(a) The measurement site in its snow-covered state. Shown in the background is position a, where snow will be left. In the foreground, position b is shown, with the snow still to be removed. (b) Point b in a snow-free condition.
As mentioned in Sect. 2.2, the experimental protocol mandates an evaluation of snow depth and conditions for a full understanding of the quantities of influence. Instruments have been positioned at 2 m from the ground, and during the whole measurement campaign, the snow thickness never surpassed 40 cm (measured by a simple ruler), thus keeping sensors at a distance of at least 1.5 m from the surface below (both above the natural soil and snow-covered area). In the measurement protocol, a recommendation to remove data in case of snow depth over 1 m was included to avoid other effects (extra cooling and turbulence) from introducing errors or uncertainties. Observing snow conditions was deemed unnecessary because observations were only used following snowfall and after site clearing; therefore, snow conditions at site a, which was never managed, were assumed to be always at their best, fresh snow conditions.
3.3 Characterisation of sensors on site
The theoretical method assumption is that, under the same conditions of snow cover, the difference in air temperature measurements between the two sensors at position a and position b (Δtsite) is zero. Undesired perturbations from nearby objects or topography should not be a factor for perfectly homogeneous sites. In real conditions, such factors can hardly be neglected, and a compromise is needed to minimise their influences from one side and have logistical opportunities (access, power and maintenance) on the other. To take this issue into account, the specific site conditions and environmental factors have been evaluated and a correction adopted. Non-symmetries can occur, for instance, in cases of variable wind direction and speed, asymmetric shadows or other non-homogeneous atmospheric or surface conditions, causing a non-null temperature difference between sensors in a pair.
A specific measurement campaign was therefore performed on site, after each snow event, before the snow removal from point b, to evaluate such possible systematic temperature differences Δtsite and their repeatability among the pairs of instruments. The following considerations were taken into account:
-
data were recorded when snow was present below both the measurement points
-
data were selected during the daytime, with incident solar radiation greater than zero
-
data were selected when the reflected radiation difference was zero (identical readings of the two radiometers facing the soil).
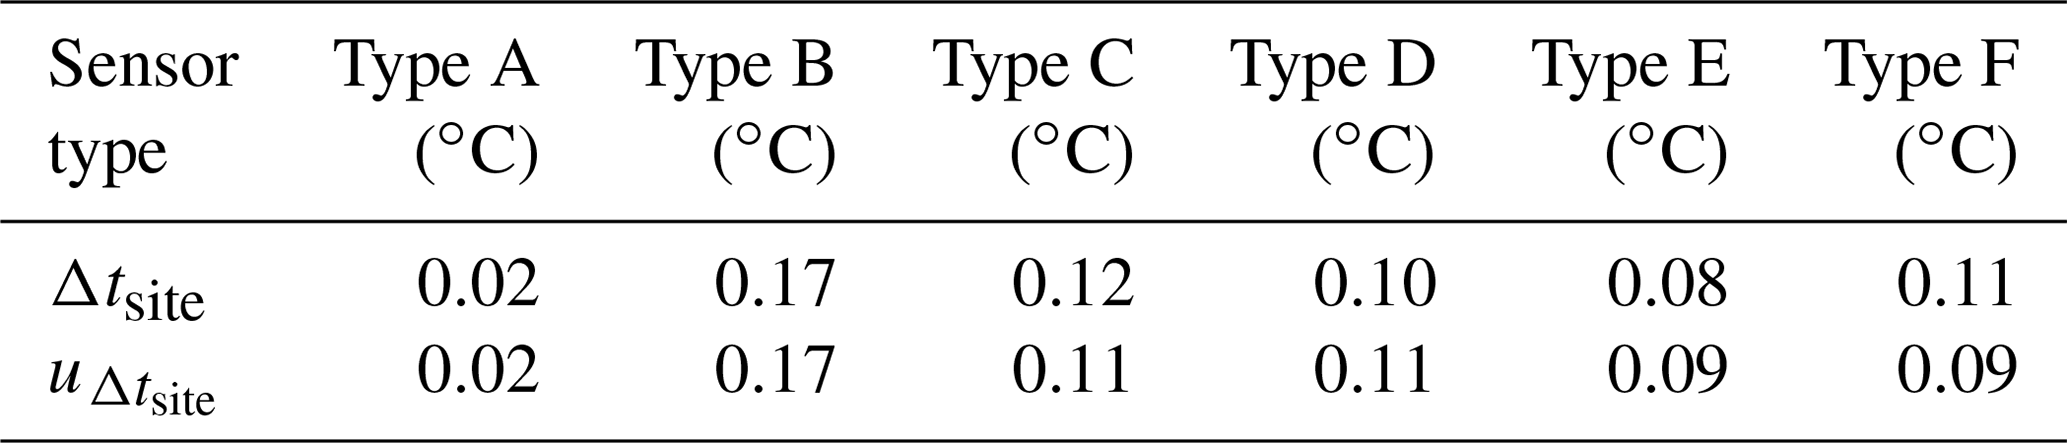
The readings of the sensor pairs under these conditions have been recorded and systematic values Δtsite have been evaluated and used to correct the raw data recorded on site with an associated uncertainty . This uncertainty was evaluated in terms of the repeatability of the differences and was deemed constant during the measurement campaign (November to March) because no significant changes in the nearby water flows (small rivers) was found, and the pine tree vegetation remained constant. Events of asymmetric shadows cast only over one of the two measurement points, due to a mountain peak occasionally projecting its shadow during the period of shortest daytime (December to January), were also identified. The records associated to this shadowing effect were omitted from the data analysis and, thus, also from the evaluation of . No mutual shadowing among instruments was observed, since the Sun elevation and position over the surrounding mountain skyline was enough to avoid this phenomenon. Results of this characterisation are presented in Table 4.
Table 4Results of the evaluation of Δtsite and the associated uncertainties for each instrument type.
3.4 Uncertainty budget
The overall uncertainty budget for the temperature differences Δtair has been derived according to the Guide to the expression of Uncertainty in Measurement (GUM; BIPM and Joint Committee For Guides In Metrology, 2008), from the instruments characteristics and experimental conditions. As reported above, no calibration uncertainty components are introduced here since the measurand is a relative difference which does not require absolute accuracy.
The expression for the evaluation of overall uncertainty is defined as follows:
where ures is due to the resolution of instruments and data loggers, as provided by the manufacturers. ulab is the component of uncertainty due to laboratory conditions and is composed of temperature uniformity and the stability of the laboratory itself. was evaluated during the laboratory testing of thermometers and is mainly ascribed to sensors' short-term stability and statistical contributions. is related to the non-ideal characteristic of the site conditions.
Table 5Contributions to the uncertainty budget evaluated in the laboratory and in-field characterisation.
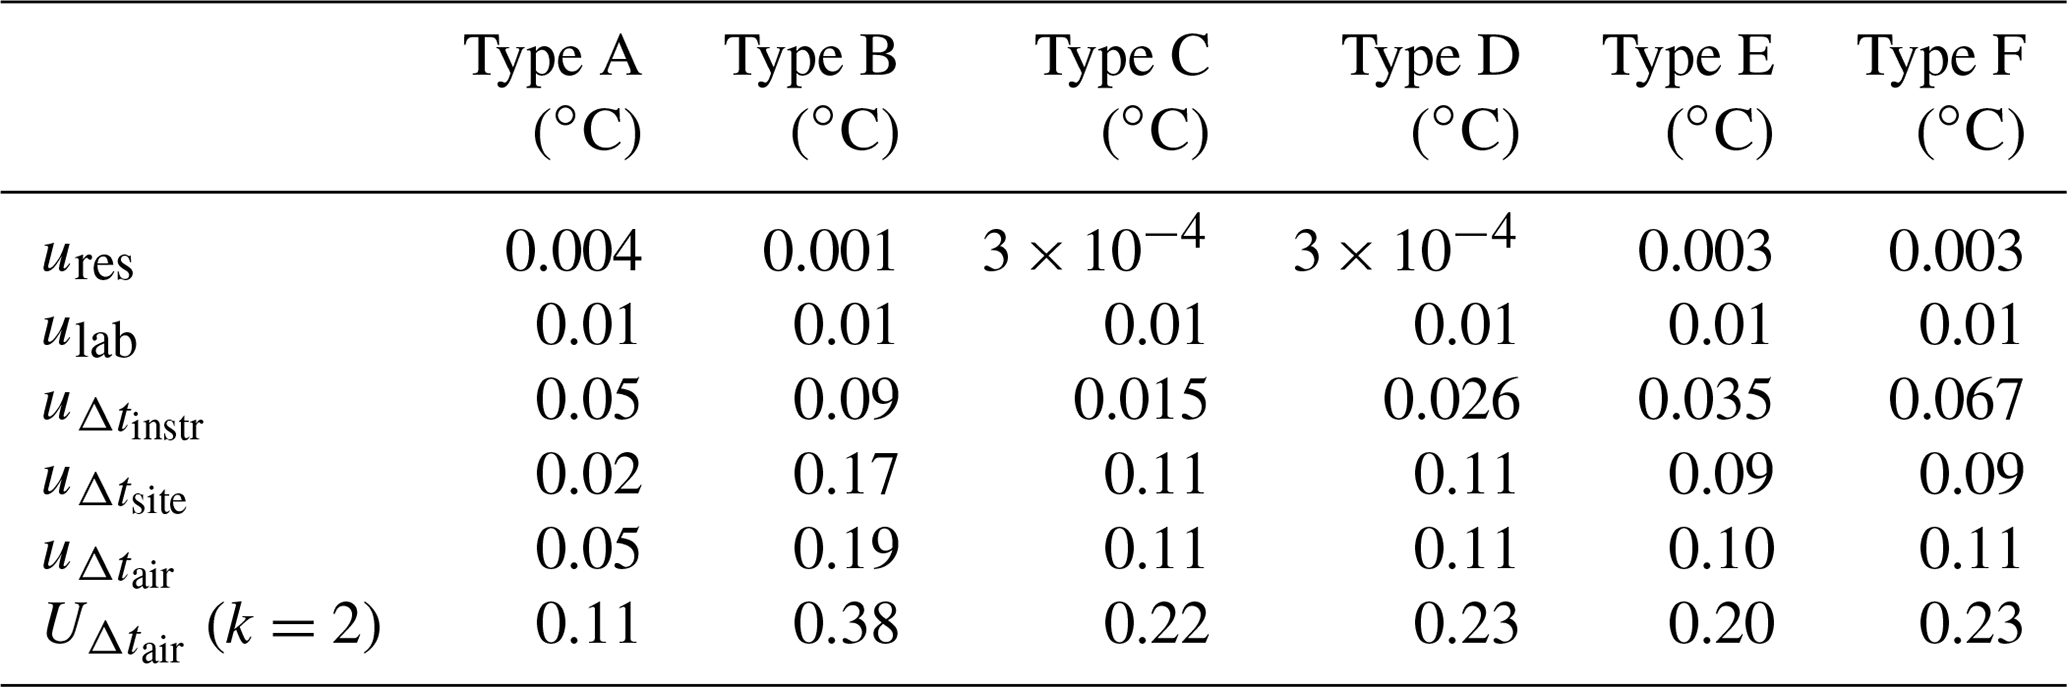
As used in metrology, uncertainty is described in terms of the coverage factor (a number larger than one by which a combined standard measurement uncertainty is multiplied to obtain an expanded measurement uncertainty; BIPM and Joint Committee For Guides In Metrology, 2008). Table 5 summarises the components of uncertainty, with the expanded uncertainty reported with the coverage factor k=2, meaning a confidence level of 95 %.
4.1 Data selection and method
The measurement campaign was performed between 8 September 2016 and 24 March 2017.
The sampling frequency of each pair of sensors was different, but in order to retain comparability, recording frequency was set to 10 min for all of them. During the campaign, an operator constantly accessed the experimental site and marked the best days for the analysis, both in terms of sunny days (maximum radiation conditions) and after a snowfall (highest albedo), when the snow below instruments at point b had recently been removed (maximum expected differences).
Snow was removed on 4 different days, namely 30 November and 22 December 2016 and 20 January and 23 February 2017. Each time, the snow was completely removed within the radius of 5 m, leaving the natural soil exposed. Salt was used to prevent the formation of ice, which would have changed the natural soil reflectivity, and to make snow removal easier and more complete. The data analysis was limited to measurements recorded in the days immediately after snow removal from point b.
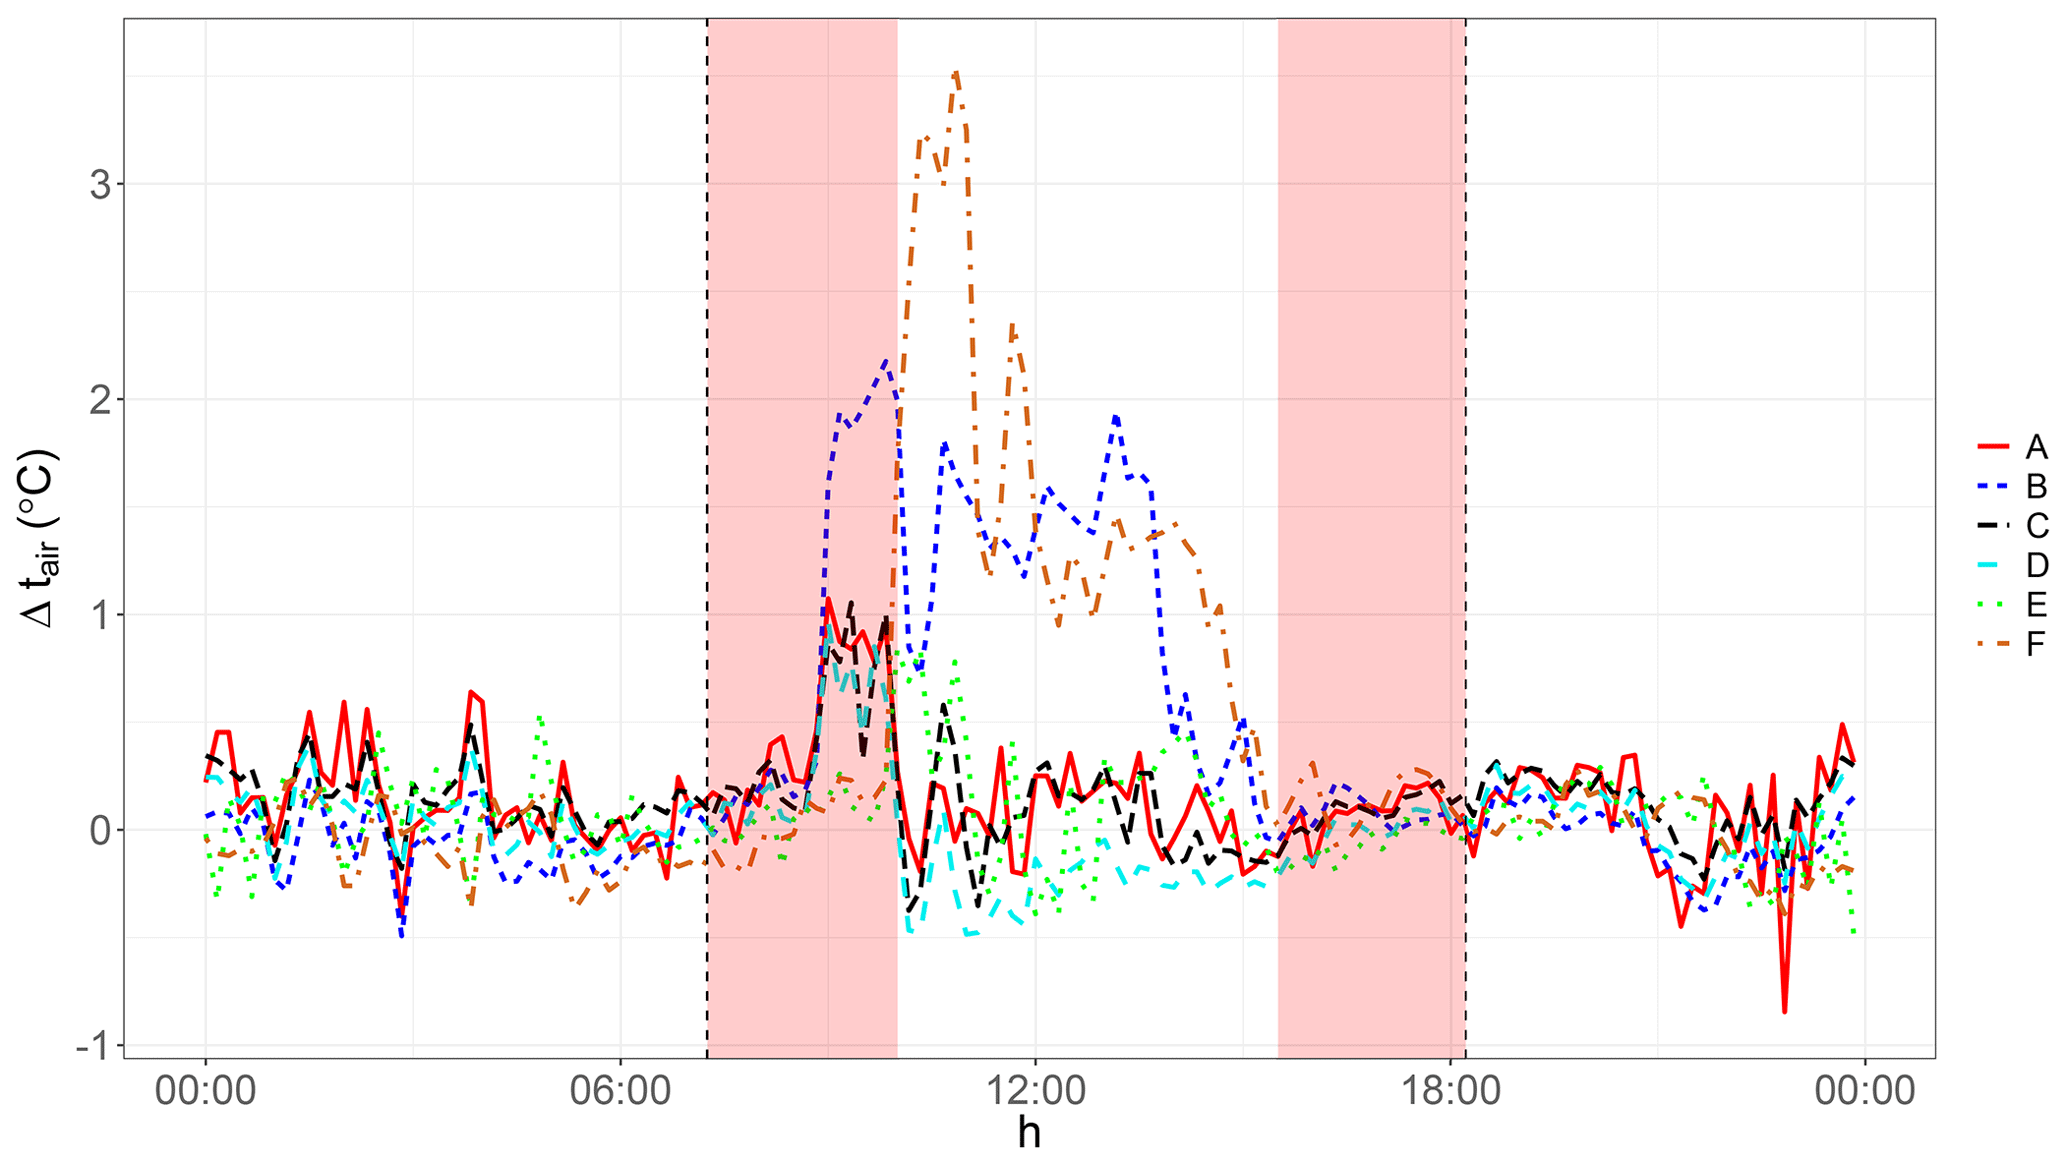
Figure 6A typical plot of a 1 d long acquisition (25 February 2017), showing the effect in terms of temperature differences Δtair (defined in the text as Eq. 1) among pairs of identical sensors (reported in the legend shown in Fig. 4b and with the properties stated in Table 1). This day has been selected as a representative example, with snow having been removed a few days before. The weather was mainly sunny, with a maximum incident radiation of 700 W m−2, a maximum reflected radiation of 500 W m−2 in snow conditions and less than 100 W m−2 in the snow-free area. Vertical dashed lines represent the sunset and sunrise times, while shaded areas mark the periods when incident radiation on the sensors was < 300 W m−2 (no or faint direct sunlight). Hours are reported in local time (central European time – CET).
Results showed that the albedo effect leads to larger Δtair values during the central hours of days with high values of solar radiation and no wind. The effect was negligible or hidden under the general thermal noise and under uncertainties in days characterised by fog, cloud cover or wind. In favourable weather conditions, daily measurements present a similar trend to the one shown in the example in Fig. 6, with nighttime differences close to zero and a noise coherent with the instrumental relative uncertainty. In the daytime, the effect emerges differently among the different systems.

Figure 7Plots of albedo α (in logarithmic scale), calculated as a ratio of reflected and incident radiation, for the (a) snow-covered and (b) snow-cleared sites. The horizontal black lines represent the theoretical maximum value of albedo (α=1), while vertical dashed lines mark the snow removal events. Data points are coded in greyscale as a function of reflected radiation, with a 35 W m−2 threshold on global radiation to exclude outliers measured below the uncertainty of the instrument.
Figure 7 shows the evolution of albedo with time, for the whole duration of the experiment, at both sites a and b. Differences are apparent, especially right after the four snow removals (marked as vertical dashed lines). The presence of outliers (which make up ∼ 7% of the total) that fall above the theoretical albedo α=1 line can be explained in two ways, i.e. most of them happen when radiation values are low and uncertainties in their measurement are larger (black dots). Others, at higher values of radiation (light dots), are due to snow covering the incident radiation detector; in fact, these values happen before a snow-clearing event (marked as vertical dashed lines) and are absent in the following days. The plot also shows, indirectly, the times of first snow and its complete natural thawing.
Mean albedo of site a is > 0.8, without significant variations, while that of site b (when snow is cleared) is ∼ 0.3–0.5. The last snow clearing, just before the beginning of March, reached values down to 0.1–0.2 because the temperatures allowed us for a much more thorough removal of all the snow and ice underneath.
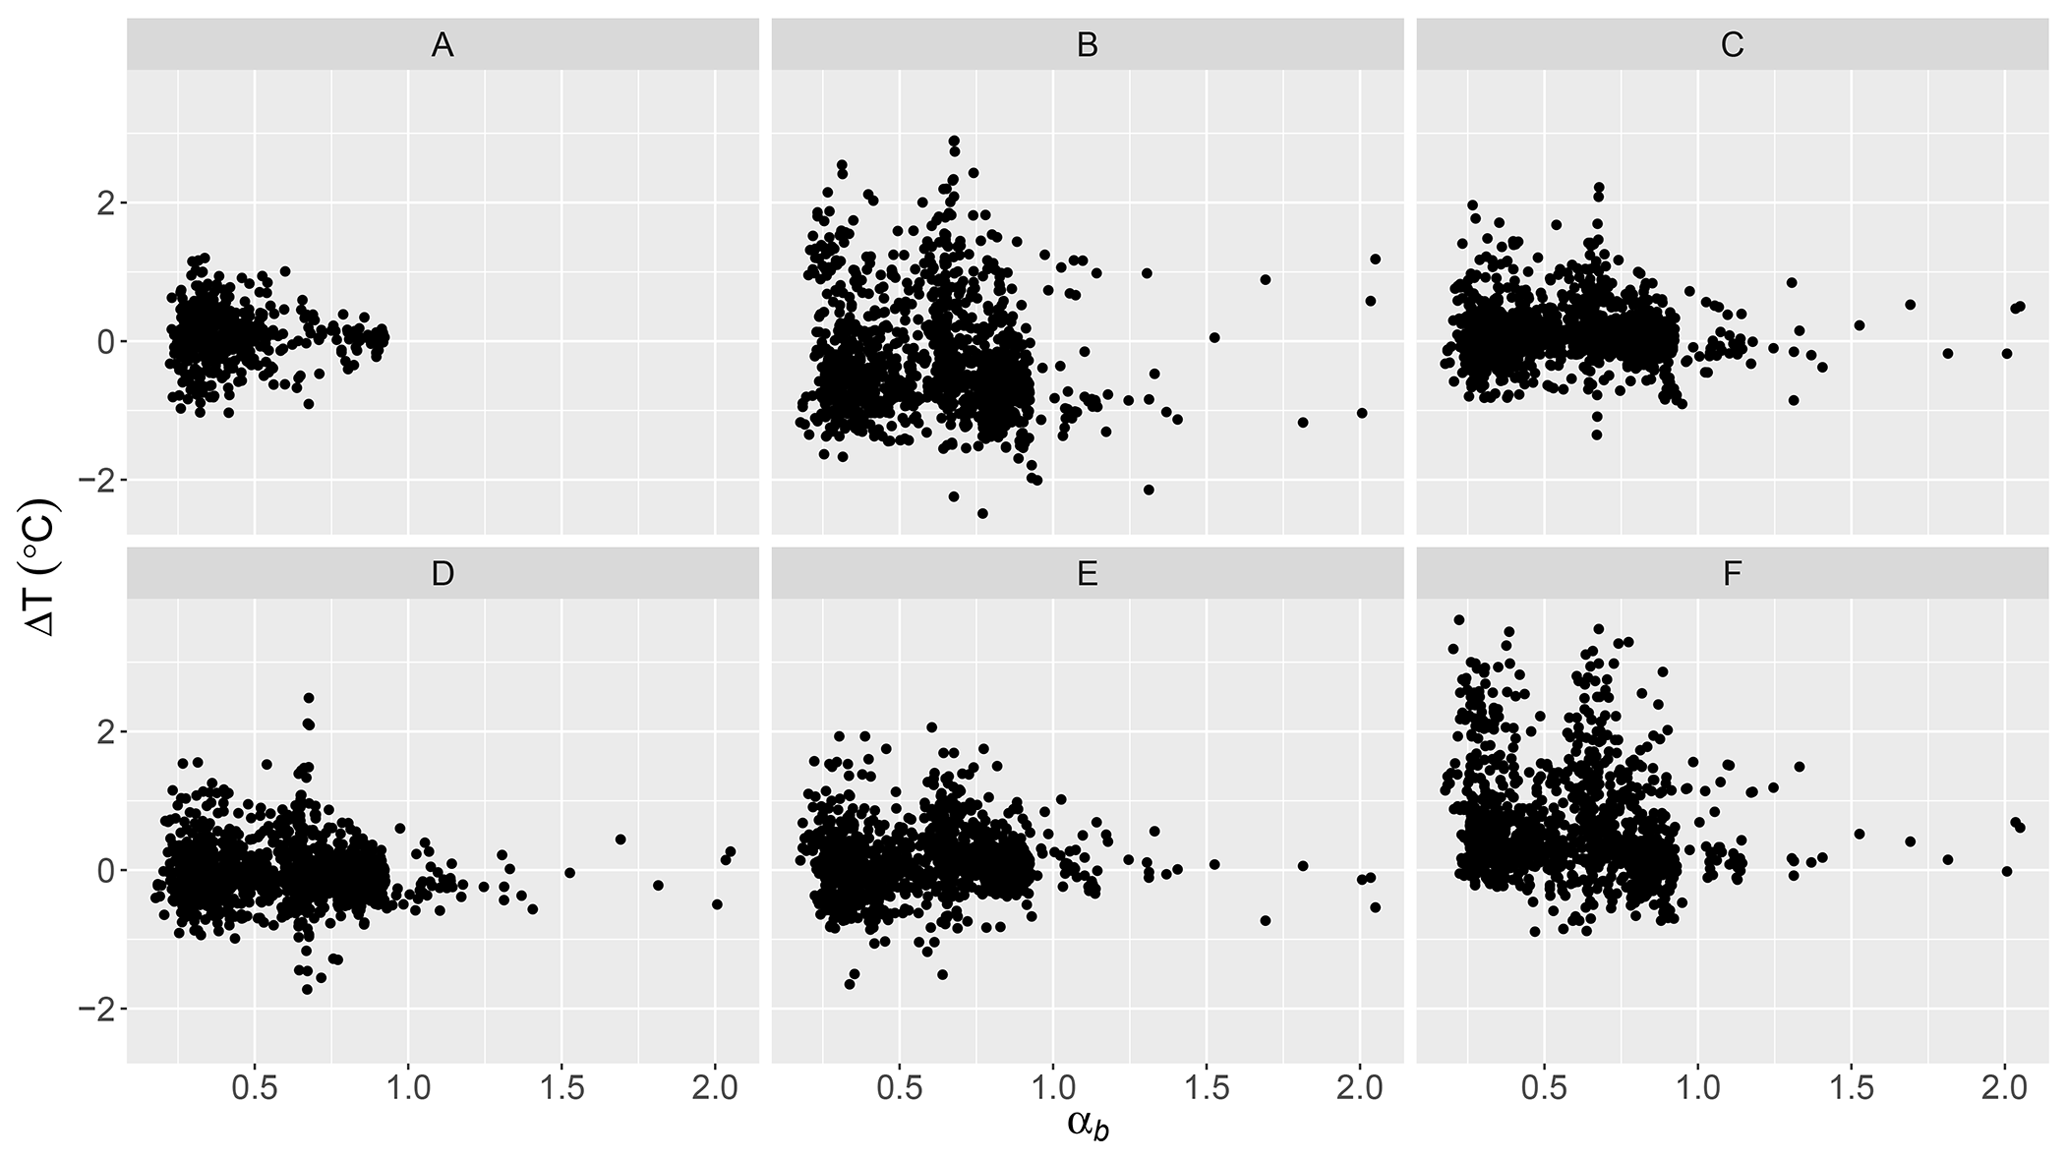
Figure 8Plots of the albedo of site b(αb) vs. temperature differences between instruments in each pair. The two aggregations of data visible in some plots are due to the bimodality of albedo values (with or without snow).
There seem to be no direct relationship between albedo and temperature differences, as they tend to be quite stable (at least during the few days of the analysis); absolute values of radiation (global or reflected) seem to be more important. Figure 8 shows that there is basically no relationship between albedo and temperature differences as the two concentrations of data shown by some instruments are due to the two values that the albedo assumes to be in site b (with or without snow). For this reason, the remainder of the analysis will focus on radiation values rather than their ratio as albedo.
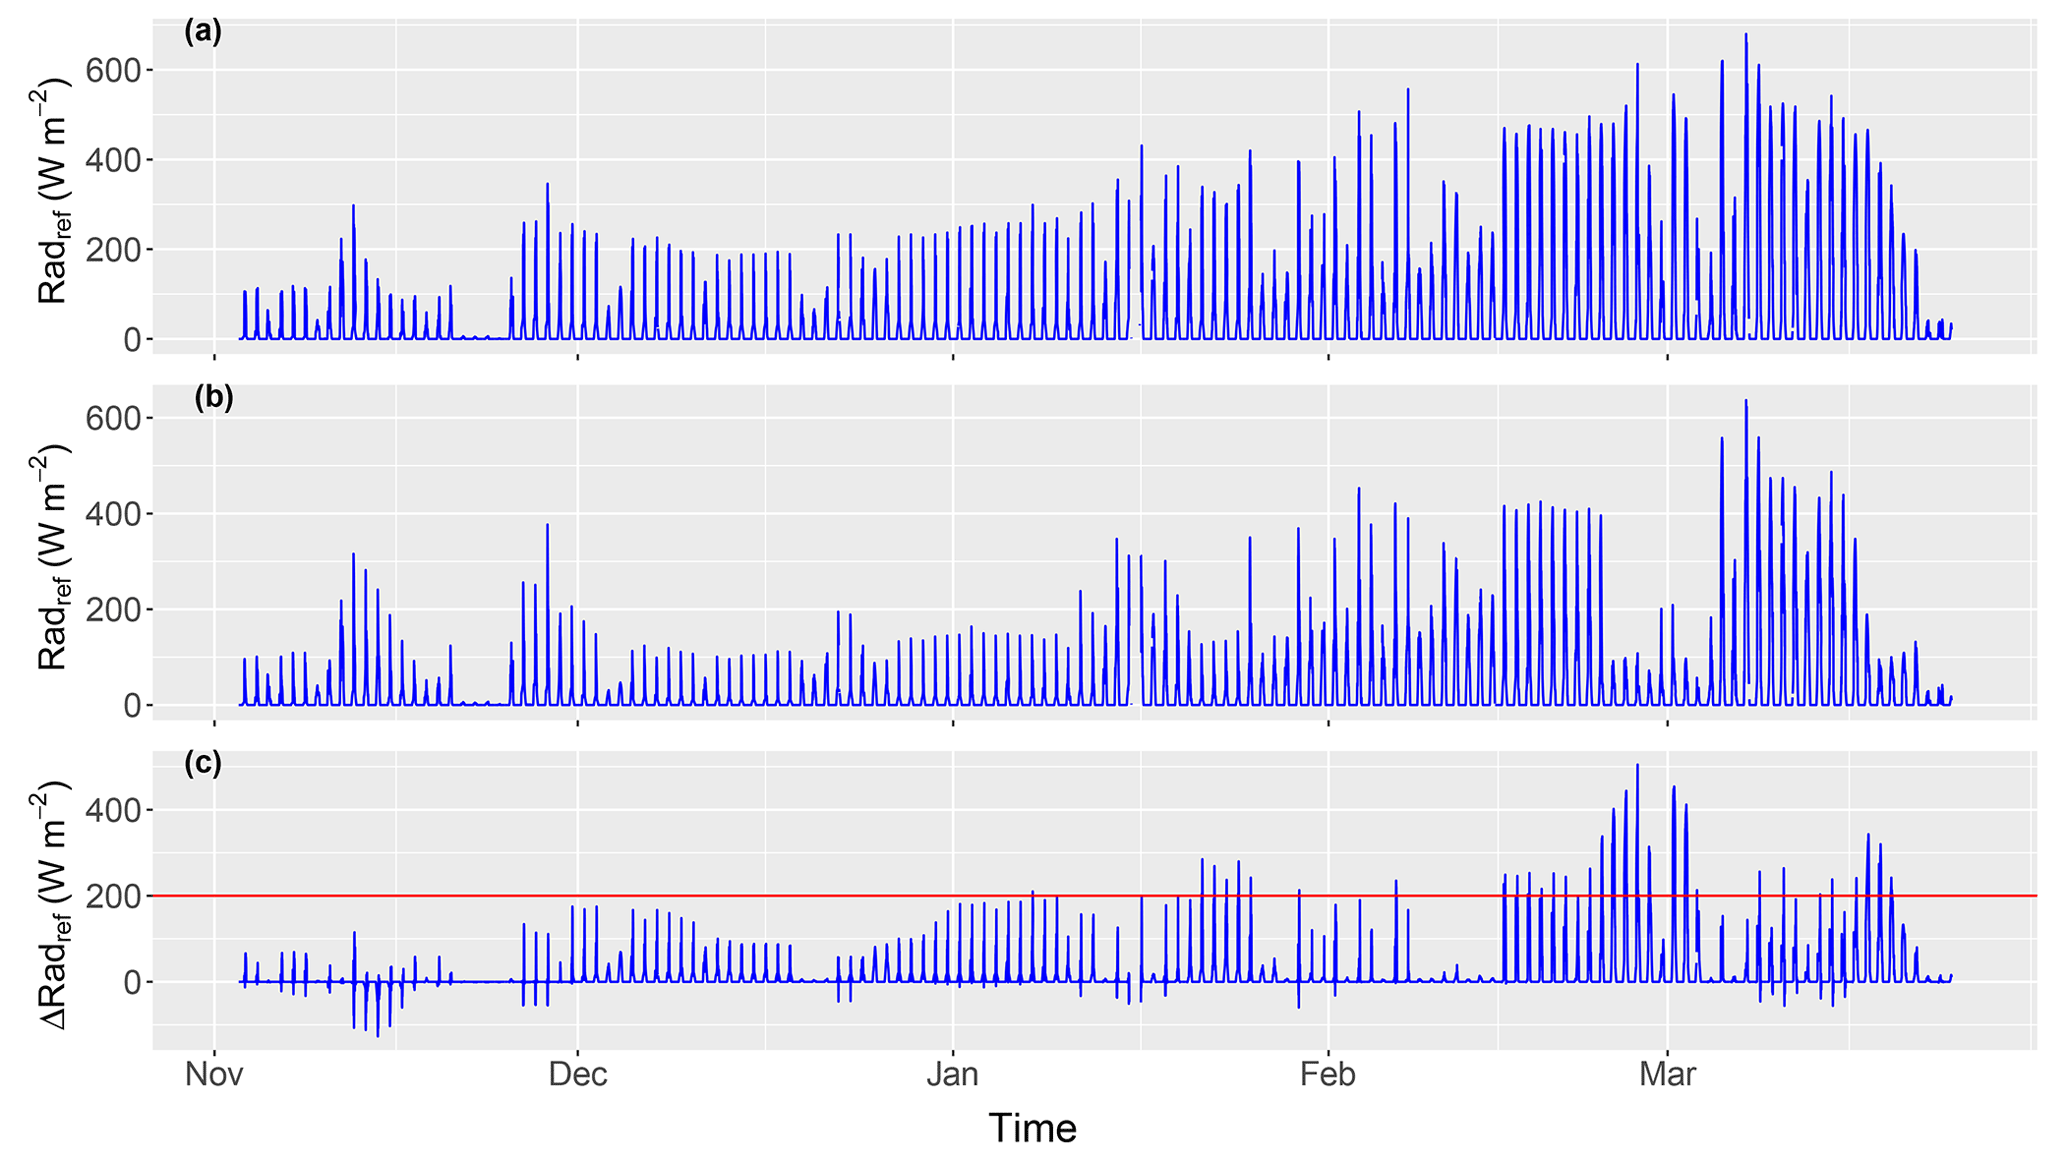
Figure 9Results of measured reflected radiation (the whole 10 min sampled data set) recorded in position a, the sensor above snow (a), and b, the sensor above the snow-cleared area (b), during the entire period of the experiment. Differences in reflected radiation recorded in position a and b (ΔRadref) are shown in panel (c), where the horizontal line represents the 200 W m−2 threshold chosen to better discriminate the temperature differences from the overall uncertainty in temperature records. Negative values in panel (c) are mostly due to errors in radiation measurements being larger than the measurement values themselves, as shown in Fig. 7. The cluster of negative values reaching −100 W m−2 around 14 November happened before the first snow event, so these are not due to snow.
Differences in incident radiation at the two measurement points have also been evaluated and taken into account, in order to exclude the cases when these differences were significant and due, for example, to asymmetric shadows from clouds or occurrences of the mountain peak shadow, as mentioned in Sect. 3.3. Having already excluded those values, measurements of incident radiation were mostly consistent within instrumental uncertainty, which was evaluated to be 35 W m−2 on the basis of the sensors' characteristics, such as sensitivity, repeatability and resolution. Records of temperature differences have been included in the data analysis only when the associated radiation difference was within this uncertainty value. As expected, due to the vicinity of the two measurement points, only a few records were excluded due to larger incident radiation differences. On the other hand, reflected radiation in the two measurement points show very large differences due to the difference in the reflectivity between snow-covered areas and the snow-cleared area on point a (Fig. 9).
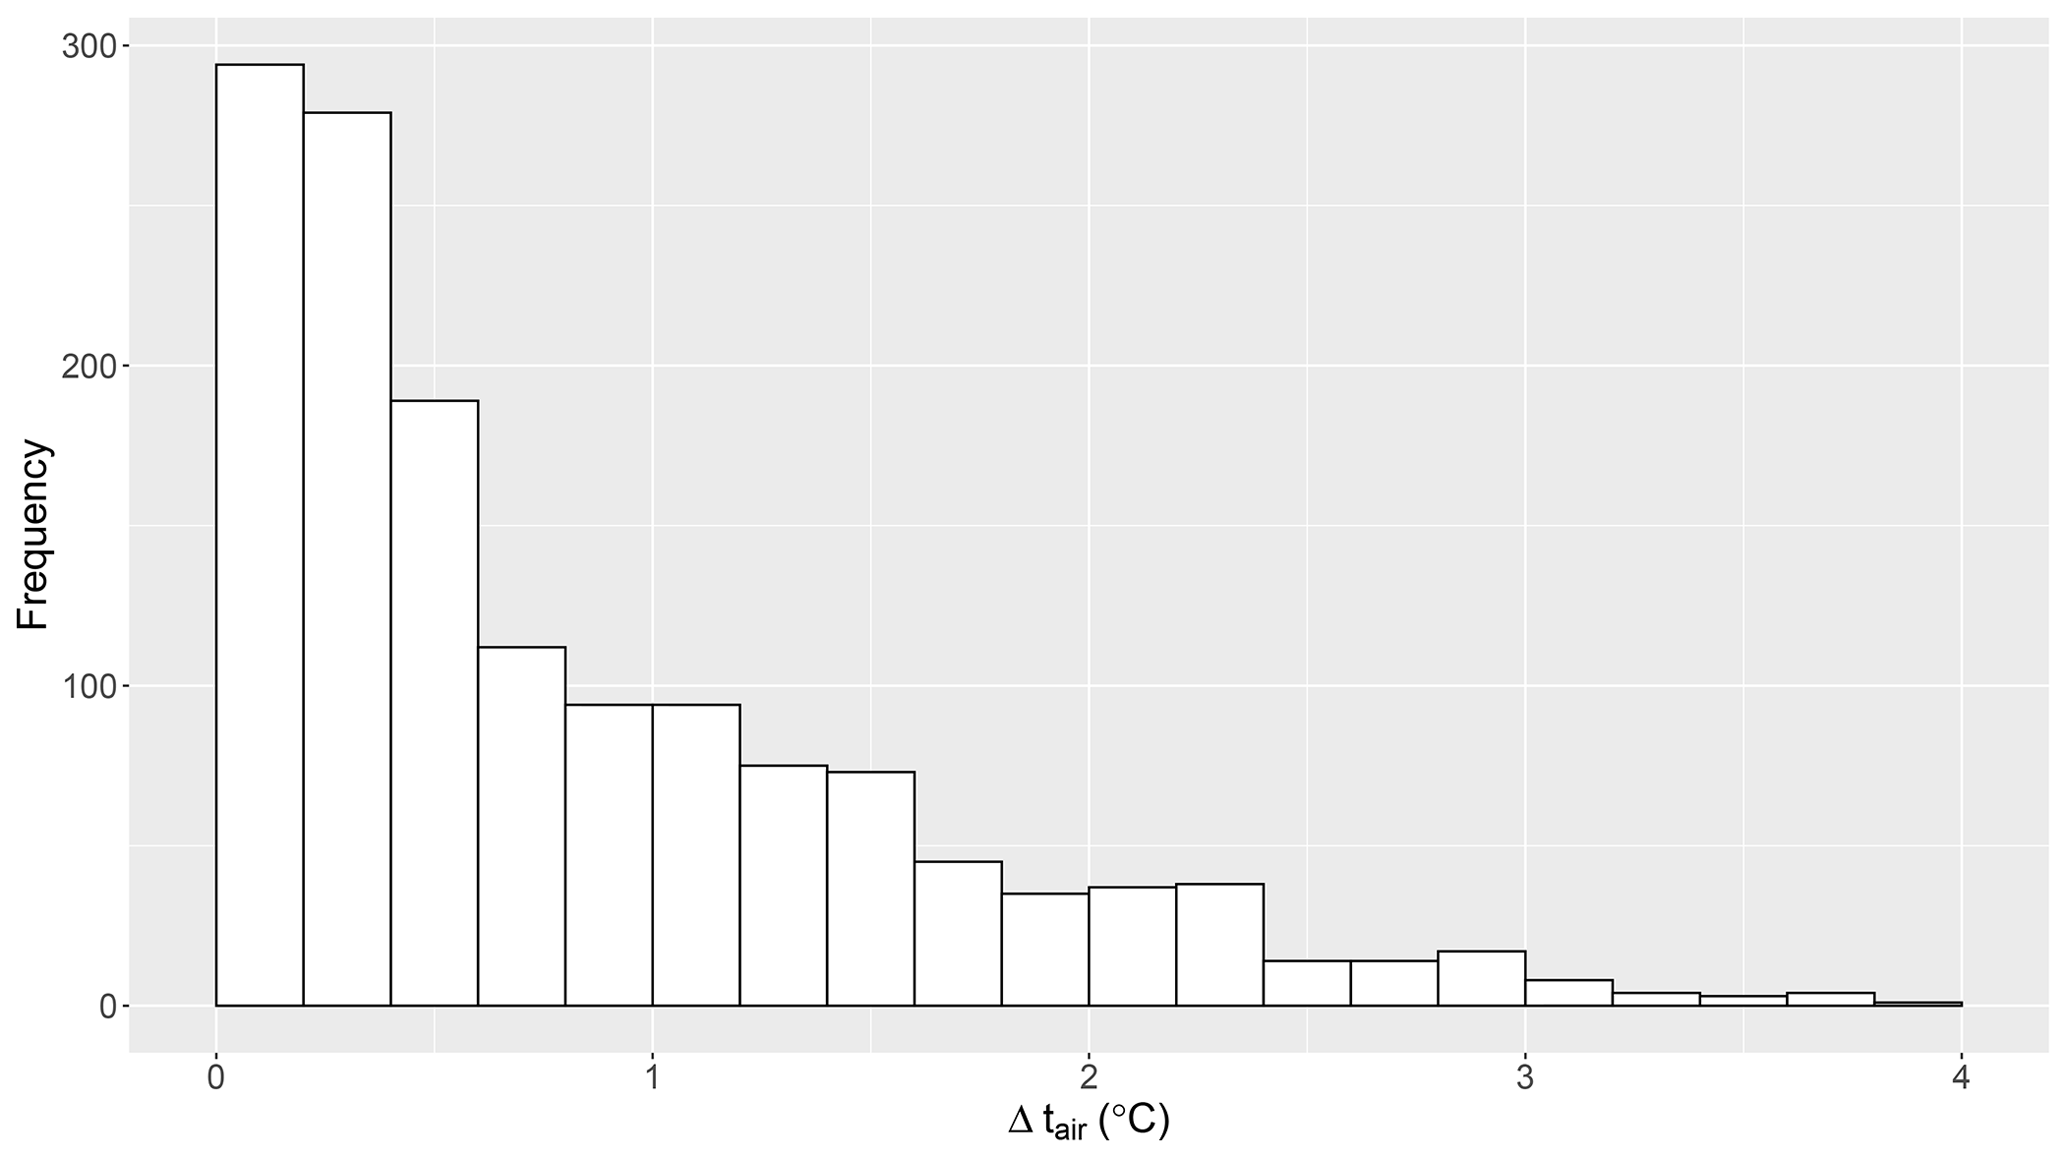
Figure 10Frequency of temperature differences, Δtair, considering all pairs of instruments, of the records exceeding the selected threshold for reflected short-wave radiation of 200 W m−2.
A threshold on the difference of reflected radiations, ΔRadref=200 W m−2, was chosen in the selection of records with significant temperature differences, in order to better identify the largest values of the investigated effect. The threshold was chosen by observing that, below that value, the distribution of temperature differences between the two measuring points matched the overall measurement uncertainty. An attempt to include data below this threshold limit was conducted, resulting in a large amount of data with temperature differences below 0.1 ∘C, thus extending the 0–0.2 ∘C range (first bar of the graph in Fig. 10), and the resulting plot was very difficult to read. Moreover, below such a threshold it was impossible to discriminate among the different kind of sensors and shields.
Figure 9a and b show the reflected radiation recorded in position a and b during the entire period. Figure 9c shows the differences in the reflected radiation recorded with and without snow with a threshold value (straight horizontal line).
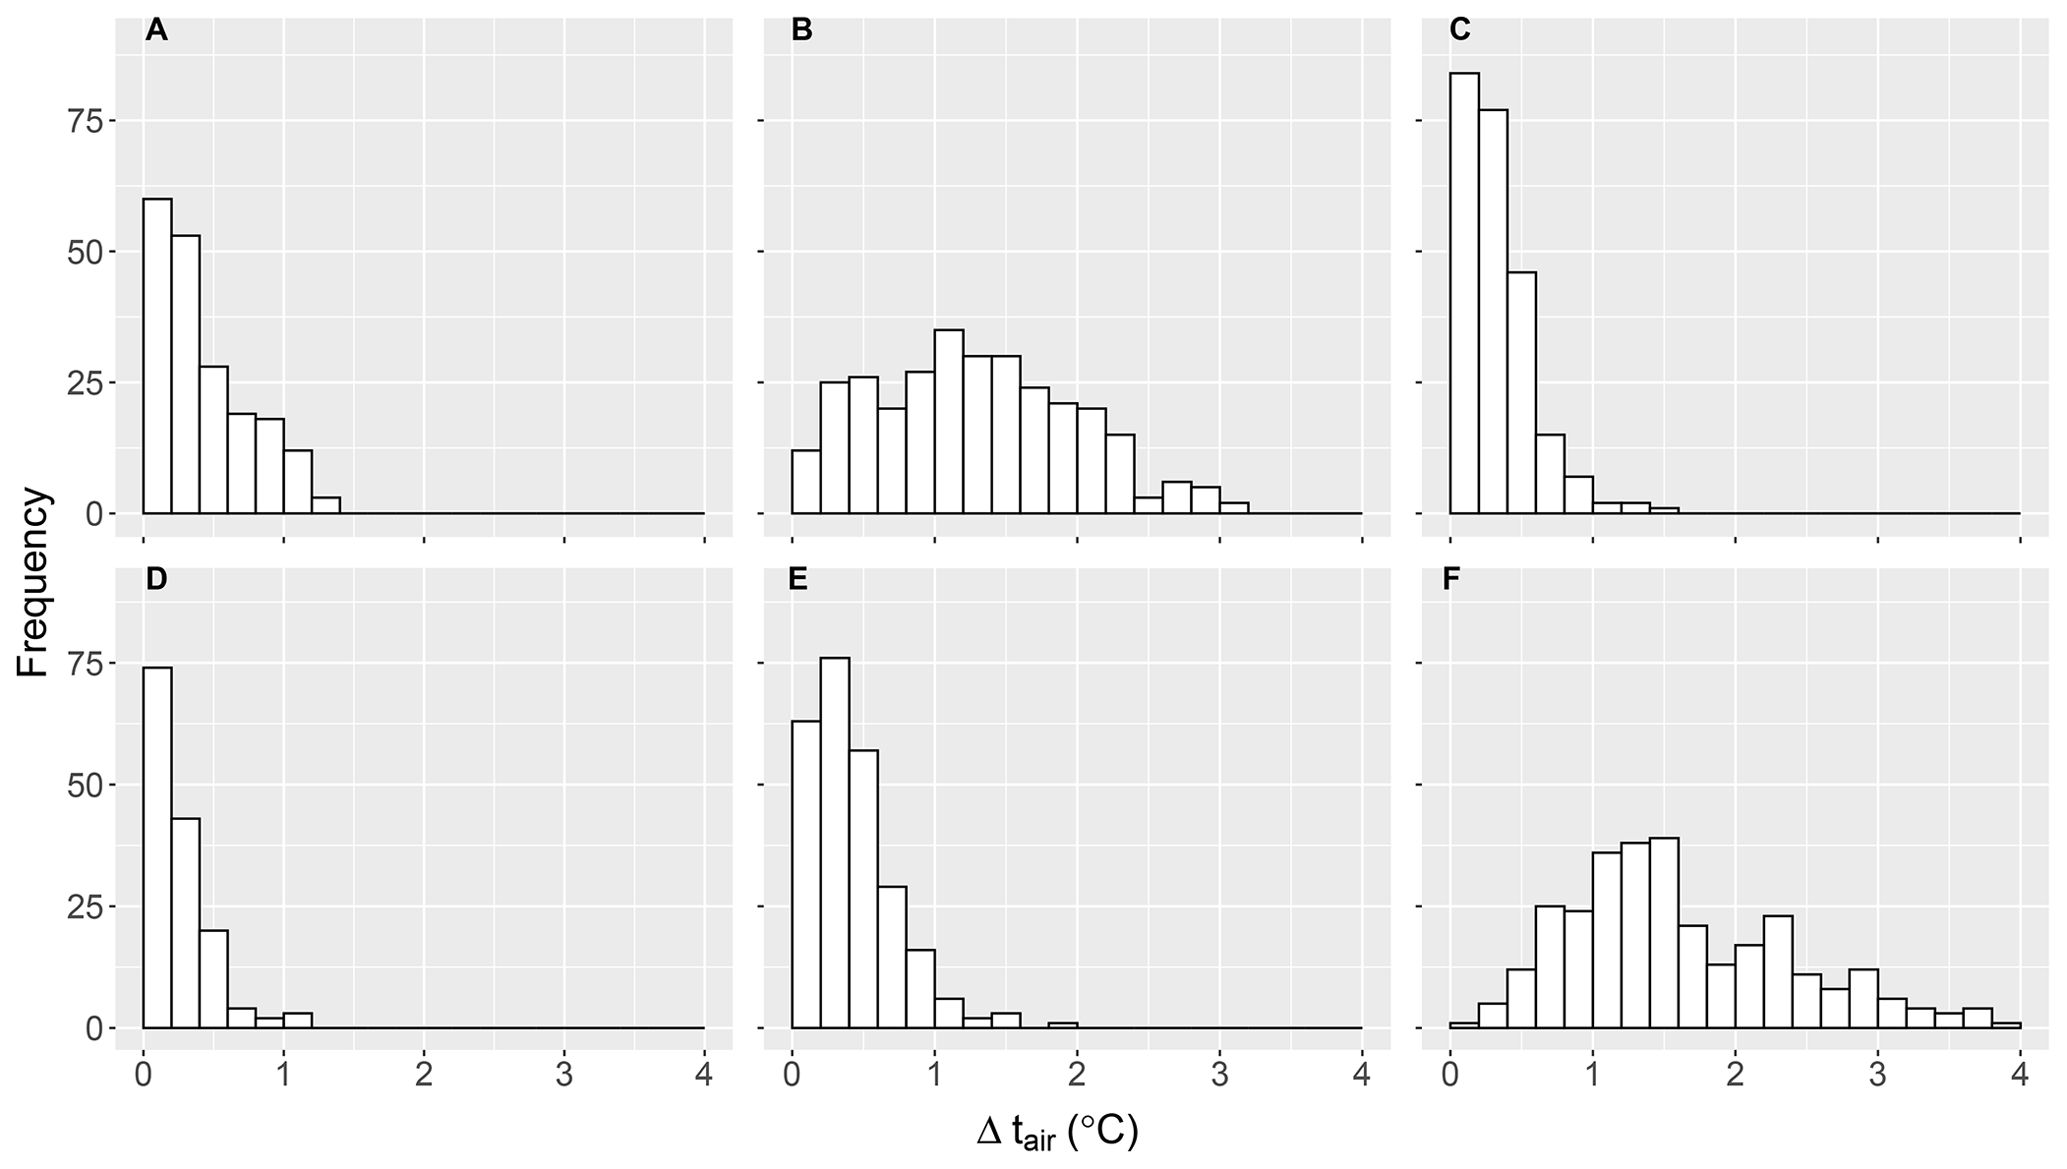
Figure 11Results of the evaluation of Δtair for each pair of sensors. System types are identified with letters (from A to F; refer to Table 1 for identification). The histogram is divided in bins of 0.2 ∘C, and the number of occurrences of Δtair is shown for each instrument.
On this subset, a further data selection is applied by excluding the values of temperature differences among pairs of sensors that fall below the Δtsite. This is the reason why the total number of significant records is not the same for all pairs of instruments. The amount of available data for each pair was found to be proportional to the amplitude of the albedo effect. This result is not surprising since, when the differences distribution is skewed towards larger values, it follows that more temperature differences are found above the Δtsite limit. This is clearly evidenced in Fig. 11.
4.2 Results
As a preliminary analysis, records from the deployed instruments were initially considered as a single set. The plot in Fig. 10 shows the distribution of Δtair grouped in bins of 0.2 ∘C, regardless of the sensor typologies.
The most frequent values of Δtair are found between 0 and 0.4 ∘C, with a significant number of records between 0.4 and 1.6 ∘C. The least populated classes are from 2 to 4 ∘C. Maximum Δtair values ranged up to 3.8 ∘C, while 95 % of the values were found to be within 2.4 ∘C, which can be considered the highest significant value for this specific experiment.
Records were then segregated according to system types, as reported in the following plots (Fig. 11). The analysis shows that no instrument is immune to the effect, resulting in different values of Δtair depending on the different technical features. As in the previous histogram (Fig. 10), most records are concentrated between 0 and 2 ∘C. Looking at each pair of instruments (intended as a sensor and shield configuration), it is clear that types B and F show the widest ranges of Δtair, reaching up to, respectively, 3.1 and 3.8 ∘C. The temperature differences for types A, C and D were always under 1.5 ∘C, while type E reaches 2 ∘C; almost all records of these four types, though, were concentrated between 0 and 1 ∘C.
Given that we had only one type of actively ventilated shield, and many passively ventilated shields with different designs, it does not seem fair to draw general conclusions about actively vs. passively ventilated shields. As a matter of fact, there is no physical reason why actively ventilated shields should outperform passive ones. The albedo effect investigated here is purely radiative, so the amount of air flowing inside the shield should not influence the radiative heating that the sensor experiences. It is interesting to note, in fact, that actively ventilated shields are not necessarily the best performers; for instance, the type D system performance with a passive screen is similar to that of a type A system. It must be kept in mind, though, that A and D systems feature different screens but also different sensors (Pt100 vs. thermo-hygrometer), so a straightforward comparison is difficult. Helical shields may perform better with respect to other multi-plate shields, possibly because they maximise air intake and effectively cool down the sensor inside; this is something, however, to be investigated – perhaps with a theoretical study.
Table 6 summarises the maximum Δtair for each instrument type, with the associated uncertainty.
Table 6Maximum difference, Δtair, for each manufacturer with the associated uncertainty from Table 5. Values are rounded at the first decimal, and is rounded up according to normative standards (EA-4/02).

Wind speed and radiation effects
Further data analysis was addressed to evidence the relations between temperature differences and the main quantities of influence, such as wind speed and radiation.

Figure 12Temperature differences Δtair measured as a function of wind speed for all the instrument types (A–F). A cyan scale is used to show the value of the difference of reflected radiation, ΔRadref, in relation to each value of Δtair reported.
Figure 12 shows Δtair values as a function of wind speed. Values between 0 and 5 m s−1 were observed; as expected, stronger winds significantly reduce the albedo effect due to air mixing in the sensor area and to the increase in heat dissipation by convection. For speeds greater than 3 m s−1, the effect was clearly reduced in all systems. In other, similar, experiments about obstacle effects on near-surface temperature measurements, it often emerges that wind dominates radiation. For instance, Coppa et al. (2021b) showed that, in the case of strong winds, turbulent mixing of heat to higher atmospheric layers has an influence on temperature 2 m lower than where the sensors are located. Differently from the passive screen systems, fan-aspirated type A seems to be independent from wind speed (Fig. 12a) and reflected radiation (Fig. 13a). As already pointed out, while it seems not to be the best performer in absolute terms, this uniform behaviour may help in the characterisation of associated uncertainty for operators in the field (see Sect. 6).
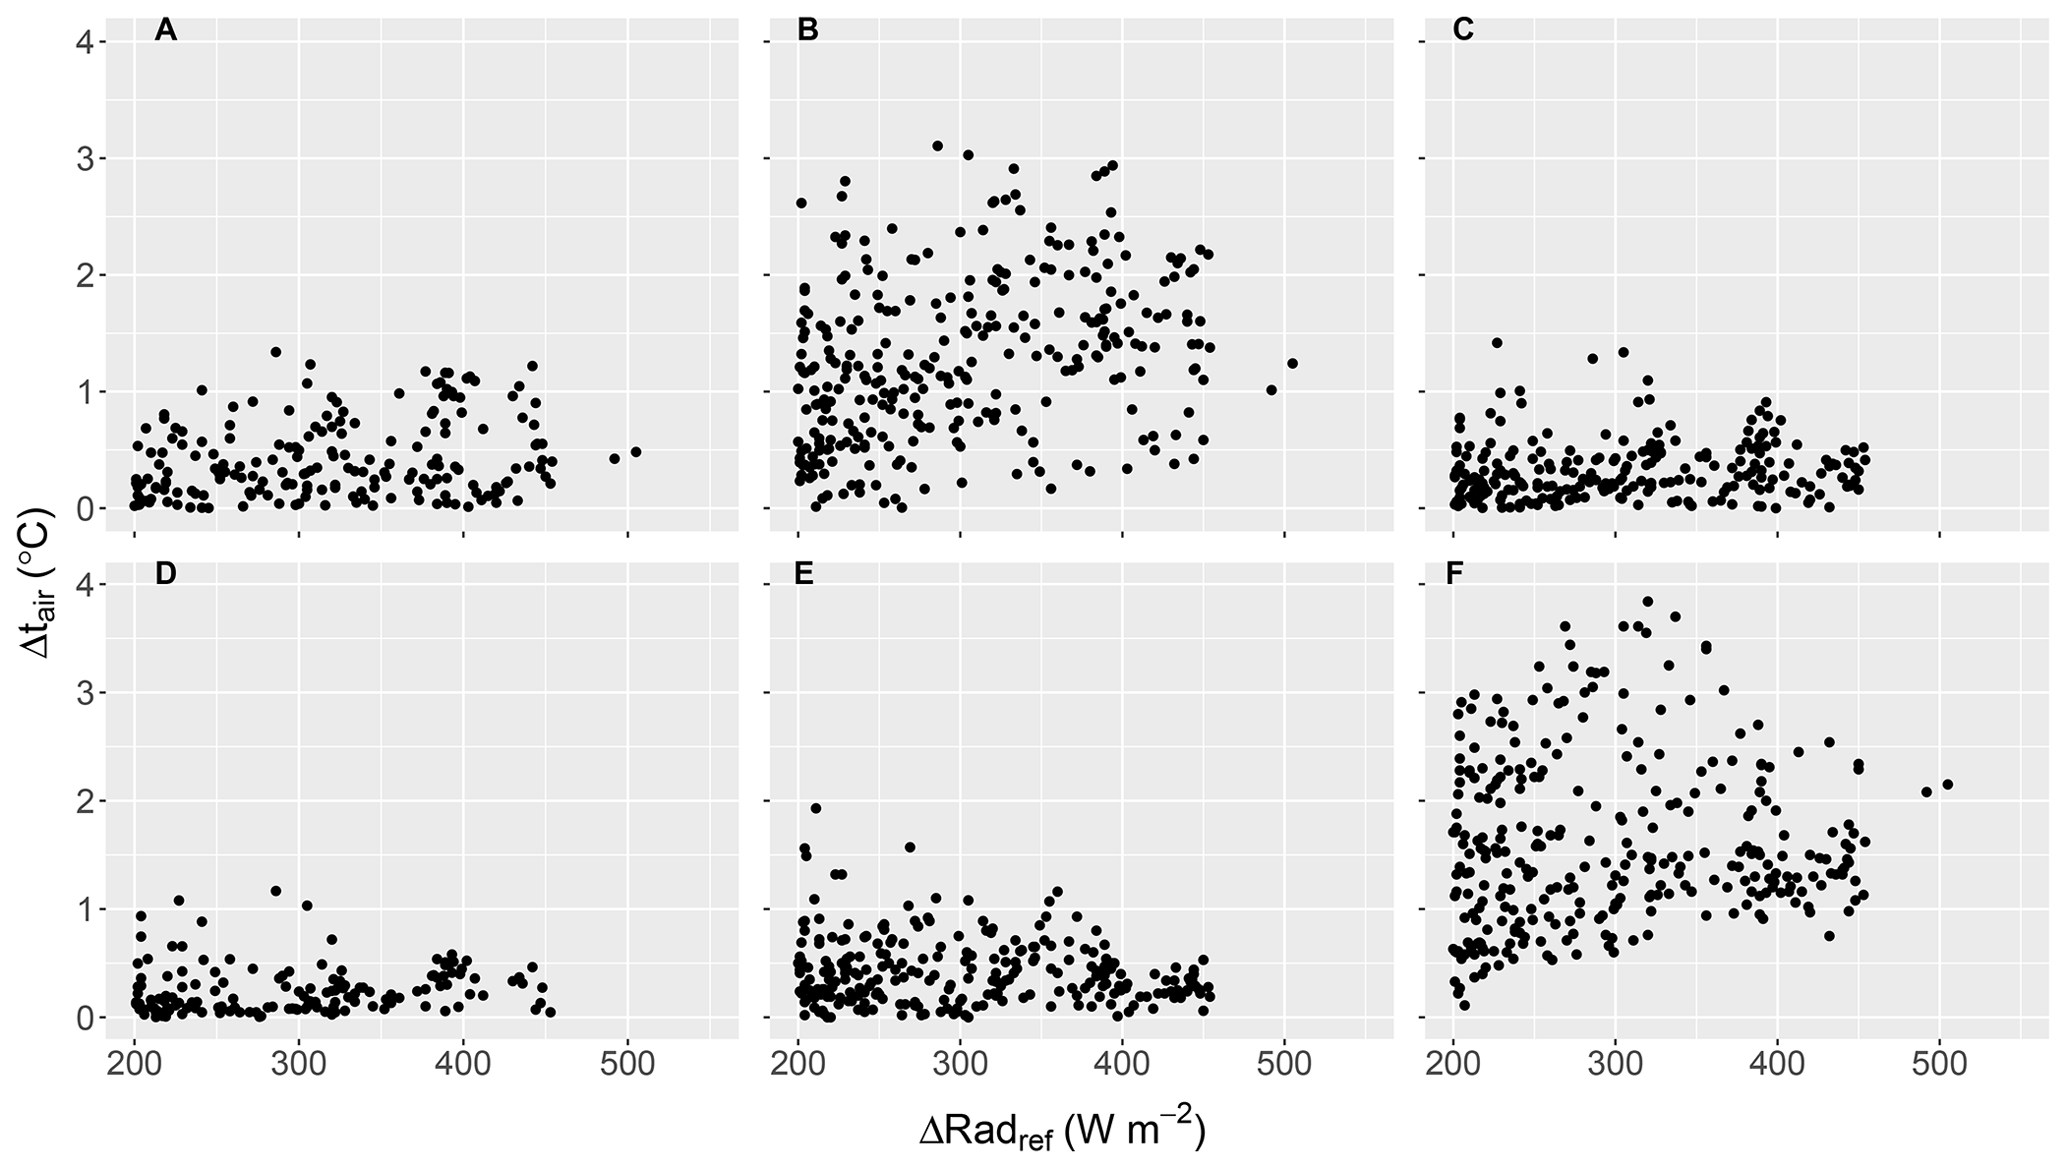
Figure 13Temperature differences Δtair plotted as a function of reflected radiation differences between points a and b. Labels from A to F identify the instrument type.
In the same plot, measurements are coded in a cyan scale to underline the difference in reflected radiation, ΔRadref, associated to each Δtair. In general, large ΔRadref are associated to large Δtair and are especially associated to winds between 1 and 2 m s−2; this may be due to a selection bias, given that stronger winds are more frequent in the central hours of the day when incident radiation (and therefore ΔRadref) is higher. To better evidence the behaviour of the albedo effect, Fig. 13 shows values of Δtair as being a function of ΔRadref. In the plots, a positive trend of Δtair is apparent for types B and F instruments, but the large scatter masks the relation.
The analysis presented here shows that the reflected radiation from a snow-covered surface affects the reliability of meteorological thermometers by transferring extra heat. This effect results in a temperature increase, here evaluated between identical co-located sensors over snow-free ground.
The main considerations are summarised as follows:
-
Some typologies of instruments are more influenced than others, with significant differences (over 3 ∘C).
-
Out of the whole group of instruments, 95 % of temperature differences were found to be within 2.4 ∘C.
-
The lowest temperature mean differences have been recorded by forced ventilated shields, among naturally ventilated shields and by those with helical shapes.
-
Most of the largest temperature differences were found in conjunction with the maximum reflected radiation differences between the two positions, as expected.
-
The wind has the effect of reducing the highest temperature differences.
-
The overall uncertainty on temperature differences in field conditions ranged between 0.1 and 0.4 ∘C in k=2.
-
The distribution of differences as a function of the reflected radiation was found, for most instruments, to be uniform; some instruments show a large scatter in this relation.
Although limited in number, the selected instruments covered most commercial configurations of modern meteorological sensors, with a reasonable balance of fan-aspirated, naturally ventilated and alternative designs. While the duration of the experiment was limited by the duration of the funded project that backed it, almost all meteorological conditions in the site were met, including radiation and wind variability, during the November to March time span. Moreover, an appropriate site with easy access for maintenance, a long-lasting presence of snow, electric power and staff presence is not an easy find, especially in Alpine valleys. Considerations on possible effects of the site features (trees, a small building and shadow) were made in any case to select data and correct for systematic effects.
For these reasons, these results are considered valid for understanding the order of magnitude of the effect. This work also gives an example of how to evaluate this phenomenon and take it into account in terms of correction and associated uncertainty. Following these guidelines, manufacturers and end-users are encouraged to characterise their own instruments to evaluate the albedo effect as a function of reflected radiation, wind speed, etc., to obtain a correction function. Since there is no certainty that a complete correction function can be calculated, also in the case of a single instrument, the level of approximation that can be achieved must be taken into account.
Very few are the examples in the scientific literature of similar evaluations, methods or prescriptions to quantify the studied effect on near-surface thermometers. The work by Huwald et al. (2009), mentioned in the introduction, where one meteorological station (featuring, among other ancillary sensors, albedometers, platinum thermometers and several three-dimensional sonic anemometers used as temperature references) was installed on a Swiss glacier, reaches the same conclusions in the sense that “Temperature errors decrease with decreasing solar radiation and increasing wind speed” and that this effect ranges in the order of degrees Celsius. With respect to the aforementioned study, the key improvement in the work presented here was the use of different sets of identical instruments; the effect is evaluated in a relative way, without the assumption that a sonic anemometer can be used as unbiased reference. It is agreed that non-contact thermometry is immune from some effects of the influencing quantities, but the accuracy achieved by using anemometers as thermometers is not sufficient for being considered a reference instrument (Burns et al., 2012; Richiardone et al., 2012). The method proposed here can be adopted just by using a second identical thermometer and shield, significantly reducing costs. The resulting uncertainties are reduced with respect to comparing different systems and even different physical principles in measuring air temperature. Finally, in this analysis, the investigation was extended to several different kinds of sensors and shields, thus making the results representative of a wider typology of solutions adopted in meteorology.
It must be noted that, since no reference air temperature independent from radiation errors is available, the total uncertainty due to heating of the sensor by solar radiation cannot be accurately and absolutely quantified. As a matter of fact, albedo-induced uncertainty does not include radiative errors due to heating of the sensor shield from incident solar radiation; this should be added to determine a complete short-wave radiation-induced uncertainty of air temperature measurements. In any case, this would go beyond the scope of the work, given that it focused on relative differences caused by reflected radiation only, and that there is much more literature dealing with the effect of incident radiation. Erell et al. (2005), for instance, showed that no shield provides complete protection from incident radiation, with relative uncertainties up to 1.5 ∘C. Lopardo et al. (2014), showed that an aged, darkened screen can introduce uncertainties up to a similar values, especially at daily maxima.
Beside delivering the numerical results, the key output of this work is a methodology for evaluating a factor affecting temperature data in climatology (and meteorology) and giving an example of how this can be implemented and adopted when selecting instruments and shields as in the case of surface stations of climatological networks.
The main purpose of the paper is to quantify the albedo effect involving different configurations to obtain a result that is as general as possible. However, the analysis is still limited to some possible configurations, and the aim of the work is not to influence or direct the choice of a configuration. For this reason, no recommendation on which system to buy will be given in this paper because no general rule can be drawn; for instance, the fan-aspirated system performed generally well, but it was outperformed by some of the passive screens, especially at winds around 2 m s−1, and size does not seem crucial (systems C and D), while shape does (systems E and F); on the other hand, similar shapes can give very different results (systems B and C).
One of the main tasks of the MeteoMet project was to give metrological support to the meteo-climatology community, including data users, station staff and manufacturers (Merlone et al., 2018). A summary of the outcomes of this work has been presented at the WMO Technical Conference on Meteorological and Environmental Instruments and Methods of Observation (CIMO TECO-2018; Musacchio et al., 2018) and sent to the WMO Commission for Instruments and Methods of Observation (CIMO) expert team on observation in situ technologies (now the expert teams on surface and subsurface measurements and on measurement uncertainties of the infrastructure commission, respectively).
Following the publication of the experimental method (Musacchio et al., 2019), indications on how to design and implement a field experiment for this purpose have been prepared and sent to WMO expert teams on Metrology, Surface Measurements and Measurement Uncertainties. Manufacturers should also evaluate and declare this effect on their product data sheets and, where possible, adopt solutions to minimise it.
The report to WMO is summarised as follows.
To evaluate the amplitude of the error due to reflected radiation from snow-covered soil on specific instruments, it is recommended that a specific analysis is performed, following the procedure reported here:
- a.
Two identical systems (thermometers and shield, possibly using the same data logger) must be installed in proximity (between 20 and 50 m in distance), with one positioned above a snow-covered area and one above an area where snow is removed after any snow event.
- b.
Further instrumentation is required to constantly record and monitor the environmental factors of influence, including global and reflected radiation in both areas, wind speed and direction and humidity.
- c.
Readings should be recorded for at least one full snow season to meet most meteorological conditions of the sites and to evaluate the associated effects and factors of influence.
- d.
A correction can then be generated in terms of the relationship between temperature reading differences with respect to the reflected radiation, wind speed and air temperature.
- e.
The uncertainty budget associated to the correction is then evaluated through Gaussian propagation, where components of uncertainty are calculated by field analysis of systematic differences in temperature and by knowledge of each involved instrument performance, including radiometers and anemometers, and from the statistical analysis and interpolation.
The objective of the recommendation is to report and inform users and instrument manufacturers of what to consider, what to include in data products and possibly minimise and what the effect of reflected radiation from a snow-covered surface on has their systems. While the present study involved different typologies of solar shields as an overall analysis with a significant variety of systems available in the market, the recommendations are addressed to users and manufacturers for a direct evaluation of their specific system. More detailed analysis can then be adopted, and a correction curve, with associated uncertainty, can be obtained and applied to post-processed data. This correction can compensate only the relative differences, with and without snow, and not the overall radiation-induced biases.
The procedure and error evaluation processes are also relevant for the definition of data quality and instrument features by the GCOS and the WMO in promoting climatological reference stations, such as the GCOS Surface Reference Network (GSRN). For high-quality installations and climate reference stations, the analysis presented here can lead to data quality improvement by adding an evaluated relative correction and associated uncertainty.
The study presented here was performed to evaluate the accuracy of near-surface air temperature data series recorded by thermometers in radiation shields positioned above snow. The study strictly followed an already published method and its associated experimental protocol. It involved a representative number of modern sensors and solar shields, including naturally ventilated, fan-aspirated and helical shields, provided as commercially offered by manufacturers, equipped with dedicated data loggers. The warming effect produced by reflected radiation was apparent for all the systems, with maximum Δtair values observed in absence of wind and at high reflected radiation conditions such as on sunny days with clean fresh snow. The maximum Δtair ranged from 1.2 to 3.8 ∘C, with the latter value achieved by type F in conditions of low wind (∼ 1 m s−1), large differences between reflected and incident radiation (∼ 350 W m−2) and high incident radiation (> 500 W m−2).
The method was validated by the experimental results and can be considered a procedure for further similar investigations involving other typologies of sensors. This process can be adopted by manufacturers to test and characterise their product, as well as by station staff and data users to include this effect, correction and associated uncertainty to the records. A similar analysis should be performed when selecting instruments to use in a climate reference network, such as the planned GCOS Surface Reference Network GSRN, for those stations positioned on sites with snow presence.
Finally, further work can be done to evaluate correction curves in the form of the temperature difference relationship with reflected radiation and wind conditions. The calculation of a correction function requires longer time of field activities to meet the wider range of atmospheric conditions and having more data available for statistical analysis. The uncertainty budget associated to the curve will then be completed by including the statistical analysis and all components from the instruments involved (thermometers, anemometers and radiometers).
In a site where a high-quality installation is planned to be permanent, a study like this is recommended among the overall efforts to increase data quality and understand uncertainties in meteorological observations for climate.
Original raw data are available at https://doi.org/10.5281/zenodo.5126973 (Coppa et al., 2021a).
CM, GC and AM designed and ran the experiment, with contributions by all co-authors. CM, AM, GB, GN and FS worked on the set-up of the installation. GN and CHM worked on finding a suitable site and were responsible for logistic organizing of the experiment, with contributions from AM. LM performed the data analysis, with contributions from CM and GC. CM prepared the paper, with contributions from all co-authors. Revisions were handled by GC, with contributions from CM and AM.
The authors declare that they have no conflict of interest.
Publisher’s note: Copernicus Publications remains neutral with regard to jurisdictional claims in published maps and institutional affiliations.
The authors wish to thank the Agenzia Regionale per la Protezione Ambientale del Piemonte, the Municipality of Balme and the Les Montagnards mountain hut, for the valuable support, as well as the manufacturers who took part in the experiment by providing the instrumentation.
This work is being developed within the framework of the EMRP (European Metrology Research Programme) joint research project of MeteoMet2. The EMRP is jointly funded by the EMRP-participating countries within EURAMET (European Association of National Metrology) and the European Union.
This research has been supported by the European Association of National Metrology Institutes (grant no. ENV58; MeteoMet2).
This paper was edited by Daqing Yang and reviewed by Hendrik Huwald and Craig Smith.
Barry, R. and Blanken, P.: Microclimate and Local Climate, Cambridge University Press, Cambridge, UK, 2016.
BIPM: Le Système International d'unités, available at: https://www.bipm.org/documents/20126/41483022/SI-Brochure-9.pdf/fcf090b2-04e6-88cc-1149-c3e029ad8232 (last access: 20 September 2021), 2019 (in French).
BIPM and Joint Committee For Guides In Metrology: Evaluation of measurement data – Guide to the expression of uncertainty in measurement, available at: https://www.bipm.org/en/committees/jc/jcgm/publications (last access: 20 September 2021), 2008.
Bohren, C. F. and Beschta, R. L.: Snowpack albedo and snow density, Cold Reg. Sci. Technol., 1, 47–50, https://doi.org/10.1016/0165-232X(79)90018-1, 1979.
Burns, S. P., Horst, T. W., Jacobsen, L., Blanken, P. D., and Monson, R. K.: Using sonic anemometer temperature to measure sensible heat flux in strong winds, Atmos. Meas. Tech., 5, 2095–2111, https://doi.org/10.5194/amt-5-2095-2012, 2012.
Burt, S. and de Podesta, M.: Response times of meteorological air temperature sensors, Q. J. R. Meteorol. Soc., 146, 2789–2800, https://doi.org/10.1002/qj.3817, 2020.
Camuffo, D. and Jones, P.: Improved Understanding of Past Climatic Variability from Early Daily European Instrumental Sources, edited by: Camuffo, D. and Jones, P., Springer Netherlands, Dordrecht, the Netherlands, 2002.
CCT: Strategy Document for Rolling Programme Development for 2018 to 2027, The Consultative Committee for Thermometry, available at: https://www.bipm.org/documents/20126/41598583/CCT+Strategy/145827b2-4f6a-42ed-bd77-bbffa782e2f7 (last access: 20 September 2021), 2017.
Coppa, G., Musacchio, C., and Merlone, A.: Albedo effect experiment, Zenodo [data set], https://doi.org/10.5281/zenodo.5126973, 2021a.
Coppa, G., Quarello, A., Steeneveld, G., Jandrić, N., and Merlone, A.: Metrological evaluation of the effect of the presence of a road on near-surface air temperatures, Int. J. Climatol., 41, 3705–3724, https://doi.org/10.1002/joc.7044, 2021b.
Erell, E., Leal, V., and Maldonado, E.: Measurement of air temperature in the presence of a large radiant flux: An assessment of passively ventilated thermometer screens, Bound.-Lay. Meteorol., 114, 205–231, https://doi.org/10.1007/s10546-004-8946-8, 2005.
Carmen García Izquierdo, Graziano Coppa, Sonia Hernández, Alicia González, Andrea Merlone, Dolores del Campo, Metrological evaluation of the building influence on air temperature measurements, in preparation, 2021.
GCOS: GCOS Surface Reference Network (GSRN): Justification, requirements, siting and instrumentation options, available at: https://library.wmo.int/doc_num.php?explnum_id=6261 (last access: 20 September 2021), 2019.
Huwald, H., Higgins, C. W., Boldi, M. O., Bou-Zeid, E., Lehning, M., and Parlange, M. B.: Albedo effect on radiative errors in air temperature measurements, Water Resour. Res., 45, 1–13, https://doi.org/10.1029/2008WR007600, 2009.
Lacombe, M., Bousri, D., Leroy, M., and Mezred, M.: Instruments and Observing Methods report No. 106 WMO Field Intercomparison of Thermometer Screens/Shields and Humidity Measuring Instruments, WMO/TD- No. 1579, IOM Report No. 106, World Meteorological Organization, Geneva Switzerland, 2011.
Lopardo, G., Bertiglia, F., Curci, S., Roggero, G., and Merlone, A.: Comparative analysis of the influence of solar radiation screen ageing on temperature measurements by means of weather stations, Int. J. Climatol., 34, 1297–1310, https://doi.org/10.1002/joc.3765, 2014.
Merlone, A., Lopardo, G., Sanna, F., Bell, S., Benyon, R., Bergerud, R. A. A., Bertiglia, F., Bojkovski, J., Böse, N., Brunet, M., Cappella, A., Coppa, G., del Campo, D., Dobre, M., Drnovsek, J., Ebert, V., Emardson, R., Fernicola, V., Flakiewicz, K., Gardiner, T., Garcia-Izquierdo, C., Georgin, E., Gilabert, A., Grykalowska, A., Grudniewicz, E., Heinonen, M., Holmsten, M., Hudoklin, D., Johansson, J., Kajastie, H., Kaykisizli, H., Klason, P., Kňazovická, L., Lakka, A., Kowal, A., Müller, H., Musacchio, C., Nwaboh, J., Pavlasek, P., Piccato, A., Pitre, L., de Podesta, M., Rasmussen, M. K., Sairanen, H., Smorgon, D., Sparasci, F., Strnad, R., Szmyrka-Grzebyk, A., and Underwood, R.: The MeteoMet project – metrology for meteorology: Challenges and results, Meteorol. Appl., 22, 820–829, https://doi.org/10.1002/met.1528, 2015a.
Merlone, A., Musacchio, C., and Sanna, F.: The Metrology for Meteorology Conference: MMC 2014, Meteorol. Appl., 22, 817–819, https://doi.org/10.1002/met.1548, 2015b.
Merlone, A., Sanna, F., Beges, G., Bell, S., Beltramino, G., Bojkovski, J., Brunet, M., del Campo, D., Castrillo, A., Chiodo, N., Uytun, A., Voldan, M., Colli, M., Coppa, G., Cuccaro, R., Dobre, M., Drnovsek, J., Ebert, V., Fernicola, V., Garcia-Benadí, A., Garcia-Izquierdo, C., Gardiner, T., Georgin, E., Gonzalez, A., Groselj, D., Heinonen, M., Hernandez, S., Högström, R., Hudoklin, D., Kalemci, M., Kowal, A., Lanza, L., Miao, P., Musacchio, C., Nielsen, J., Nogueras-Cervera, M., Oguz Aytekin, S., Pavlasek, P., de Podesta, M., Rasmussen, M. K., Del-Río-Fernández, J., Rosso, L., Sairanen, H., Salminen, J., Sestan, D., Šindelářová, L., Smorgon, D., Sparasci, F., Strnad, R., Underwood, R., Uytun, A., and Voldan, M.: The MeteoMet2 project – highlights and results, Meas. Sci. Technol., 29, 025802, https://doi.org/10.1088/1361-6501/aa99fc, 2018.
Musacchio, C., Massano, L., Coppa, G., Merlone, A., and Hofstaetter, C.: Effect of snow-reflected radiation in near surface air temperature, in: The 2018 WMO/CIMO Technical Conference on Meteorological and Environmental Instruments and Methods of Observation, Amsterdam, the Netherlands, 8–11 October 2018, CIMO TECO-2018, 2, 2018.
Musacchio, C., Coppa, G., and Merlone, A.: An experimental method for evaluation of the snow albedo effect on near-surface air temperature measurements, Meteorol. Appl., 26, 161–170, https://doi.org/10.1002/met.1756, 2019.
Nigrelli, G., Fratianni, S., Zampollo, A., Turconi, L., and Chiarle, M.: The altitudinal temperature lapse rates applied to high elevation rockfalls studies in the Western European Alps, Theor. Appl. Climatol., 131, 1479–1491, https://doi.org/10.1007/s00704-017-2066-0, 2018.
Richiardone, R., Manfrin, M., Ferrarese, S., Francone, C., Fernicola, V., Gavioso, R. M., and Mortarini, L.: Influence of the Sonic Anemometer Temperature Calibration on Turbulent Heat-Flux Measurements, Bound.-Lay. Meteorol., 142, 425–442, https://doi.org/10.1007/s10546-011-9688-z, 2012.
Stevenson, T. C. E.: New description of box for holding thermometers, J. Scottish Meteorol. Soc., 1, 122, available at: https://babel.hathitrust.org/cgi/pt?id=nyp.33433110019654&view=1up&seq=150 (last access: 21 September 2021), 1864.
Thorne, P. W., Diamond, H. J., Goodison, B., Harrigan, S., Hausfather, Z., Ingleby, N. B., Jones, P. D., Lawrimore, J. H., Lister, D. H., Merlone, A., Oakley, T., Palecki, M., Peterson, T. C., de Podesta, M., Tassone, C., Venema, V., and Willett, K. M.: Towards a global land surface climate fiducial reference measurements network, Int. J. Climatol., 38, 2760–2774, https://doi.org/10.1002/joc.5458, 2018.
WMO: WMO/CIMO #8 Guide to meteorological instruments and methods of observation, available at: https://library.wmo.int/index.php?id=12407&lvl=notice_display (last access: 20 September 2021), 2012.
Xiong, C., Shi, J., Ji, D., Wang, T., Xu, Y., and Zhao, T.: A New Hybrid Snow Light Scattering Model Based on Geometric Optics Theory and Vector Radiative Transfer Theory, IEEE Trans. Geosci. Remote Sens., 53, 4862–4875, https://doi.org/10.1109/TGRS.2015.2411592, 2015.
Metrological convention allows for temperature to be expressed in degrees Celsius and temperature differences in Kelvin (BIPM, 2019).
- Abstract
- Introduction
- Measurement protocol and experimental method
- Experimental set-up, characterisations of site and instruments and uncertainty components
- Data analysis and results
- Discussion
- Recommendations to users and manufacturers
- Conclusions
- Data availability
- Author contributions
- Competing interests
- Disclaimer
- Acknowledgements
- Financial support
- Review statement
- References
The requested paper has a corresponding corrigendum published. Please read the corrigendum first before downloading the article.
- Article
(9849 KB) - Full-text XML
- Abstract
- Introduction
- Measurement protocol and experimental method
- Experimental set-up, characterisations of site and instruments and uncertainty components
- Data analysis and results
- Discussion
- Recommendations to users and manufacturers
- Conclusions
- Data availability
- Author contributions
- Competing interests
- Disclaimer
- Acknowledgements
- Financial support
- Review statement
- References