the Creative Commons Attribution 4.0 License.
the Creative Commons Attribution 4.0 License.
 | 28 Jan 2021
Effect of polyoxymethylene (POM-H Delrin) off-gassing within the Pandora head sensor on direct-sun and multi-axis formaldehyde column measurements in 2016–2019
Elena Spinei
Martin Tiefengraber
Moritz Müller
Manuel Gebetsberger
Alexander Cede
Luke Valin
James Szykman
Andrew Whitehill
Alexander Kotsakis
Fernando Santos
Nader Abbuhasan
Xiaoyi Zhao
Vitali Fioletov
Sum Chi Lee
Robert Swap
Analysis of formaldehyde measurements by the Pandora spectrometer systems between 2016 and 2019 suggested that there was a temperature-dependent process inside the Pandora head sensor that emitted formaldehyde. Some parts in the head sensor were manufactured from the thermal plastic polyoxymethylene homopolymer (E.I. Du Pont de Nemour & Co., USA; POM-H Delrin®) and were responsible for formaldehyde production. Laboratory analysis of the four Pandora head sensors showed that internal formaldehyde production had exponential temperature dependence with a damping coefficient of 0.0911±0.0024 ∘C−1 and the exponential function amplitude ranging from 0.0041 to 0.049 DU. No apparent dependency on the head sensor age and heating and cooling rates was detected.
The total amount of formaldehyde internally generated by the POM-H Delrin components and contributing to the direct-sun measurements were estimated based on the head sensor temperature and solar zenith angle of the measurements. Measurements in winter, during colder (< 10 ∘C) days in general, and at high solar zenith angles (> 75∘) were minimally impacted. Measurements during hot days (> 28 ∘C) and small solar zenith angles had up to 1 DU (2.69×10¹⁶ molec. cm−2) contribution from POM-H Delrin parts. Multi-axis differential slant column densities were minimally impacted (<0.01 DU) due to the reference spectrum being collected within a short time period with a small difference in head sensor temperature.
Three new POM-H Delrin free Pandora head sensors (manufactured in summer 2019) were evaluated for temperature-dependent attenuation across the entire spectral range (300 to 530 nm). No formaldehyde absorption or any other absorption above the instrumental noise was observed across the entire spectral range.
- Article
(3790 KB) - Full-text XML
- BibTeX
- EndNote


The importance of formaldehyde (HCHO) in tropospheric chemistry arises from its participation in radical formation and recycling, including HOx (HO+HO2) (Liu et al., 2007; Alicke, 2002). The HOx budget, in its turn, determines the oxidation capacity of the atmosphere and formation of photochemical smog (O3) in the lower troposphere in the presence of NOx and sunlight. Since the major path of HCHO into the atmosphere is through oxidation of non-methane volatile organic compounds (NMVOCs) and daylight removal is mostly through the photolysis and oxidation by HO, daytime HCHO abundances above background levels are mainly indicative of local emissions and the local oxidizing capacity of the atmosphere.
The most efficient way to monitor geographical and temporal variability of HCHO on a global scale is from satellite platforms. Satellite observations of HCHO from sun-synchronous polar orbits started with GOME in 1995. Since then several instruments have provided global coverage with various spatial and temporal resolution (Zhu et al., 2016; Wang et al., 2017): SCIAMACHY (10:00 LT, 32 × 215 km2, 2002–2012, De Smedt et al., 2008), GOME-2A and -2B (09:30 LT, 40 × 40 km2, since 2007 and continuing as of 2021; Pinardi et al., 2020; De Smedt et al., 2015, 2012; Hewson et al., 2013), OMI (13:30 LT, 13 × 24 km2, since 2004 and continuing as of 2021; Herman et al., 2018; Pinardi et al., 2020; De Smedt et al., 2015), and TROPOMI (13:30 LT, 3.5 × 7 km2, since 2018 and continuing as of 2021; Verhoelst et al., 2020; De Smedt et al., 2018; Vigouroux et al., 2018). Next-generation air quality instruments, positioned in geostationary orbit, will provide unprecedented temporal coverage over Asia (GEMS, operating since 18 February 2020; Kwon et al., 2019), North America (TEMPO, estimated launch in early 2022), and Europe (Sentinel-4, estimated launch in 2023).
Current and future satellite HCHO observations require routine and systematic validation through the use of independent measurements to assess biases and uncertainties and encourage full utilization of satellite data to support both science and applications. Validation of satellite HCHO products, however, is challenging due to spatial and temporal sampling differences among the satellite, ground-based (e.g., FTIR, Vigouroux et al., 2009; DOAS, Chan et al., 2020), and airborne platforms (Zhu et al., 2016). Ideally, it involves data from ground-based networks of identical instrumentation with continuous measurements and uniform data analysis and wide global distribution. To meet current and future satellite validation needs (e.g. TEMPO, TROPOMI) ground-based HCHO column measurements should have an accuracy better than 0.1 DU (1 DU = 2.69×10¹⁶ molec. cm−2, expected nominal TEMPO precision over 3 h is 1.95×10¹⁵ molec. cm−2).
Pandonia Global Network (PGN) is a NASA and ESA sponsored ground-based network of standardized and homogeneously calibrated Pandora instruments focused on air quality (AQ) and atmospheric composition measurements. The main objective of PGN is to provide systematic data processing and data dissemination to the greater global community in support of in situ and remotely sensed AQ monitoring (Szykman et al., 2019). One of the PGN's major objectives is the validation of satellite-based UV-visible sensors, specifically, Sentinel 5P, TEMPO, GEMS, and Sentinel 4. PGN is focused on providing measurements of the total column and vertically resolved concentrations of a range of trace gases (e.g., ). Pandora total NO2 column measurements have been extensively used for OMI validation (Herman et al., 2009; Pinardi et al., 2020; Herman et al., 2019; Verhoelst et al., 2020) and atmospheric composition studies during multi-agency-supported field campaigns such as DISCOVER-AQ (Reed et al., 2015), KORUS-AQ (Spinei et al., 2018), OWLETS (Gronoff et al., 2019), and LISTOS (https://www-air.larc.nasa.gov/missions/listos, last access: 21 January 2021).
The Pandora spectrometer system, deployed within PGN, is a cost-effective ground-based instrument, operating on the principle of the passive UV-visible differential optical absorption spectroscopy technique (DOAS). Pandora systems undergo extensive laboratory characterization and have a robust data acquisition and analysis software package, Blick Software Suite (Cede, 2019). Pandora instruments are fully automated and fully programmable to perform all types of DOAS observation geometries (e.g., direct sun, multi-axis, and target) from sunrise to sunset and overnight for moon measurements. Pandora systems have no consumables and are designed for unattended operation in outdoor environments. Measured spectra are automatically collected and submitted to the PGN server via an internet connection for centralized uniform real-time processing by the Blick Software Suite. Pandora instrument consists of a small Avantes low stray light spectrometer (280–530 nm with 0.6 nm full-width-at-half-maximum spectral resolution) connected to a telescope assembly by a 400 µm core diameter single-strand fiber-optic cable. The telescope assembly (head sensor) is attached to a two-axis positioner (SciGlob), capable of accurate pointing (±0.1∘). A diffuser is included in the optical path to minimize the effect of small pointing errors for direct-sun measurements with a 2.5∘ full-width-at-half-maximum (FWHM) field of view (FOV). Pandora systems measure scattered solar photons without the diffuser with 1.5∘ FWHM FOV.
Table 1Pandora instruments used in this study.
ECCC: Environment and Climate Change Canada; KNMI: Royal Netherlands Meteorological Institute; EPA: US Environmental Protection Agency; NASA: US National Aeronautics and Space Administration
Here we present (a) the discovery of the Pandora instrument artifact due to polyoxymethylene homopolymer (POM-H) Delrin plastic off-gassing impacting the Pandora HCHO measurements up to 2019 (Sect. 2), (b) a laboratory and field characterization of the interference on direct-sun and multi-axis results (Sects. 3, 4, 5), and (c) a characterization of the interference following an engineered solution (Sects. 3, 4). Results presented in this study show that plastic-related HCHO off-gassing significantly impacted direct-sun total columns and minimally impacted multi-axis retrievals (Sect. 5). Due to strong temperature dependence of HCHO off-gassing the largest interference was observed in summer. Extensive analysis of the Pandora instruments, after the engineering solution was implemented, shows no interference and strengthens confidence in future direct-sun measurements. Table 1 lists the Pandora instrument description and contribution to this study.
Pandora instruments were first field deployed in 2006 with the main focus on direct-sun O3 and NO2 total columns measurements. Retrieval of weak absorbers such as HCHO was not possible from the pre-2016 Pandora direct-sun measurements due to the telescope assembly front window etaloning. Window-introduced interference was larger than the background HCHO absorption level and is not correctable in the pre-2016 measurements such as those by Park et al. (2018).
Pinardi et al. (2013)Park et al. (2018)Kreher et al. (2020)Spinei et al. (2018)Herman et al. (2018)Spinei and Kocur (2021)Nowak et al. (2021)Table 2History of Pandora hardware changes related to direct-sun HCHO measurements.
Note that HCHO from direct sun is not a standard PGN product and was not provided by the NASA and Luftblick PGN groups outside of the KORUS-AQ study (Spinei et al., 2018; Herman et al., 2018). Park et al. (2018) performed HCHO analysis independently and were not aware of any PGN discoveries.
∗ Wedged windows are installed on new instruments. If the instruments are not returned to NASA or SciGlob, they are not upgraded; therefore, some instruments probably still have degrading ARC windows
Pandora instrumentation has undergone several design changes that significantly improved HCHO direct-sun measurements (e.g., 64-row charge-coupled device, CCD, new tracker). In spring 2016, the telescope assembly front window was replaced with a window containing an anti-reflective coating (ARC). This reduced the etaloning interference and improved the ability to retrieve formaldehyde columns from the Pandora direct-sun measurements. Due to ARC degradation, the front window was again replaced in 2018 with a wedged window, which practically removed the etaloning interference. Table 2 lists the relevant head sensor hardware changes.
Figure 1HCHO vertical columns during KORUS-AQ near Olympic Park, South Korea, derived from direct-sun Pandora measurements, DC-8 in situ measurements integrated from surface to 8 km, and surface measurements scaled up to tropopause assuming various profile shapes (green: box with a median mixing layer height (MLH); grey: box with a measured MLH; light blue: box and exponential profile with a median MLH; and black: box and exponential profile with a measured MLH, modified from Spinei et al., 2018).
The May–June 2016 Korea–United States Air Quality Study (KORUS-AQ) offered the first opportunity to evaluate direct-sun observations of HCHO total column densities with the improved Pandora systems (ARC window and 64 row CCDs; Spinei et al., 2018; Herman et al., 2018). Comparison between the HCHO total columns derived from the Pandora direct-sun measurements and the integrated in situ aircraft measurements by Spinei et al. (2018) (Fig. 1) showed that Pandora systems overestimated the aircraft-derived columns by 16 % on average, with an offset of 0.22 DU. However, a point-to-point comparison shows that the measurements agreed on a cold and breezy day (4 May 2016) and on most mornings. Pandora systems measured up to 0.8 DU larger columns than DC-8 on hot days during early afternoon hours (12:00 to 16:00 LT, Fig. 1). Measured surface concentrations scaled up to the total columns, assuming different profiles (black, grey, and green lines in Fig. 1), and mixing layer height from Ceilometer data agreed with DC-8 measurements better than with Pandora measurements.
Figure 2(a) HCHO direct-sun total columns (red) and multi-axis tropospheric columns (blue) as retrieved from Pandora 108 near Toronto, Canada, for a 10-month time series in 2018–2019. The significant overestimation of direct-sun HCHO in summer months is evident. Reference spectrum for direct-sun DOAS analysis was collected during a cold winter day. Multi-axis analysis was done with zenith reference spectra measured within 2–3 min of the rest of the spectra. (b) Mean diurnal temperature and maximum wind speed measured near Pandora 108.
Pandora direct-sun HCHO total columns were also larger than the multi-axis measured columns during short-term field campaigns (e.g., CINDI-2, LISTOS 2018) and during summer versus winter comparisons for long-term routine observations. Since HCHO is mostly located in the lower troposphere, multi-axis and direct-sun measurements should result in HCHO columns that closely match (assuming sampling of the same air masses). DOAS implementation of multi-axis retrieval is significantly less sensitive to instrumental changes. This is due to the fact that single-scan sky-scattered solar spectra are analyzed using a zenith reference spectrum taken within a maximum of 10–15 min from the scan measurements. Direct-sun spectra, on the other hand, are analyzed using a single reference spectrum that was potentially taken months apart from the rest of the spectra. Figure 2 shows an example of HCHO columns derived from Pandora 108 direct-sun and multi-axis measurements in Egbert, Canada (44.23∘ N, −79.78∘ W), from May 2018 to March 2019. Significant differences (up to 1.5 DU) were observed in retrievals by direct-sun measurements in summer during hot days versus the multi-axis measurements.
Comparisons of multiple Pandora data sets covering a variety of ambient conditions led us to conclude that there was an intrinsic property of Pandora that interfered with its HCHO measurements at higher ambient temperatures. The most likely source of the observed interference was the Pandora telescope assembly (further referred to as a head sensor). This is the only part of the instrument that was consistently exposed to the ambient conditions without any temperature control.
2.1 Pandora head sensor
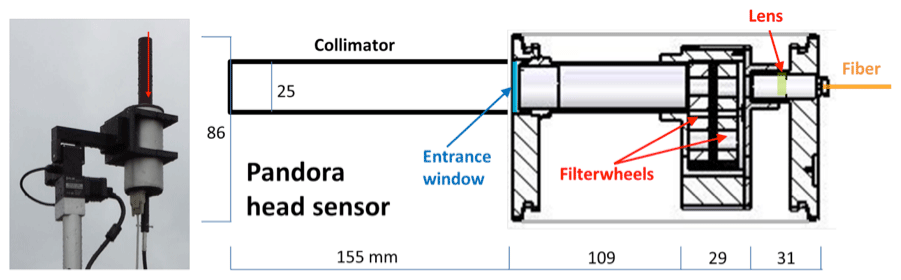
The main purpose of the Pandora head sensor is to collect light within a specific field of view, transmit light through optical filters (e.g., U340 to block visible part of solar spectrum), and focus it onto the fiber-optics patch cable for transmission to the spectrometer. The Pandora head sensor consists of several components: sealed aluminum cylindrical housing, a wedged fused-silica entrance window (25 mm in diameter), two filter wheels with motors, baffle holding tubes, a lens, a fiber-optics cable, an electronics board (Fig. 3), and a desiccator bag. The baffle holding tube, the two filter wheels, and the dark filter wheel plug were machined from POM-H Delrin, a trade name for polyoxymethylene, engineering thermoplastic up to March of 2019. The desiccant bags (McMaster-CARR model 2189K76, manufacturer Multisorb Technologies, model name MINIPAX) contain activated carbon (43 %–48 % by weight) and silica gel (43 %–48 % by weight) enclosed in Tyvec material (high-density polyethylene fiber, 5 %–15 % by weight) and are designed to remove moisture as well as some VOCs including HCHO.
2.2 Polyoxymethylene (POM) Pandora head sensor parts
Polyoxymethylene (POM) has a wide range of applications due to (1) excellent mechanical (high tensile strength, rigidity, and toughness) and electrical properties at temperatures from −40 to 130 ∘C (short-term); (2) low reactivity with and low permeability to many chemicals including organic solvents, fuels, and gases at room temperature; and (3) ease of processing on standard thermoplastics equipment (Luftl et al., 2014). Six major manufacturers produce about 70 % of POM worldwide, and each company has its own trade name (e.g., Ticona GmbH, Germany: Celcon®; Polyplastics Co., Ltd., Japan: POM-C Duracon®, Tepcon®; E.I. Du Pont de Nemour & Co., USA: POM-H Delrin®).
POM-H Delrin used for Pandora head sensor parts is a homopolymer POM (POM-H, Ensinger Hyde: black Delrin ecetal resin II150ebk602sheet ) purchased from McMaster Carr (part nos. 8575K145 and 8576K21). POM-H is produced by polymerization of purified gaseous formaldehyde in an organic liquid reaction medium in the presence of polymerization catalysts. The resulting polymer has a crystalline granular structure with macromolecules ending in at least one unstable hydroxyl group. These hydroxyl groups are responsible for POM-H thermal instability. POM deterioration occurs mainly due to the following processes:
-
depolymerization (unzipping),
-
auto-oxidative scission,
-
degradation by secondary products of the auto-oxidative scission,
-
hydrolysis and acidolysis,
-
photo-oxidation at wavelength 200–800 nm,
-
thermal degradation.
HCHO is a byproduct of most POM degradation processes. Considering the function of the head sensor, we suspect that more than one degradation process will impact POM-H Delrin Pandora head sensor components over their lifetime (several years). POM deterioration studies are typically performed at elevated temperatures (>90 ∘C) and focus on mass loss and physical and mechanical property degradation measurements (Grajales et al., 2015). Review of such literature during the initial Pandora design stage led to the assumption by the NASA and SciGlob teams that HCHO was not emitted from POM-H Delrin under ambient conditions.
It may be worth noting that paraformaldehyde and high-purity α-polyoxymethylene have been used to generate known concentrations of HCHO in gaseous mixtures for various applications (Ho, 1985). They are commonly used in permeation tubes and other permeation devices at elevated temperatures (50–80 ∘C) as a stable source of HCHO for instrument calibrations (Gilpin et al., 1997; Ho, 1985). At elevated temperatures (>50 ∘C) paraformaldehyde or α-polyoxymethylene thermally depolymerizes to produce HCHO vapor that diffuses through the permeation tube membrane.
2.3 Pandora internal head sensor temperature
We hypothesized that the thermal instability of POM-H Delrin resulted in HCHO release at higher temperature and was the source of the temperature-dependent formaldehyde interference in Pandora direct-sun HCHO. To test this hypothesis, we added an internal temperature sensor in April 2019 to monitor the internal head sensor temperature in a few instruments. We have evaluated the range of internal head sensor temperatures measured at various sites: Pandora 2 (Greenbelt, MD), 148 (Blacksburg, VA; Rotterdam and Cabauw, the Netherlands) and 155 (Boston, MA) (with an emphasis on the US East Coast where several intergovernmental field campaigns took place; see Table 1). Figure 4 shows that internal head sensor temperatures ranged between 20–25 ∘C during the nighttime hours and up to 45–50 ∘C during the daytime hours in summer months. During colder months, the temperature ranged between 0 to 25 ∘C. These data suggested that HCHO generation was potentially relevant at internal to head sensor temperatures between 20 and 50 ∘C.

Figure 4Internal head sensor temperatures for Pandora 2 (Greenbelt, MD), 148 (Blacksburg, VA; Rotterdam and Cabauw, the Netherlands) and 155 (Boston, MA).
Internal to head sensor temperatures are determined by the following heat transfer processes between the head sensor and the surrounding environment: (a) convective heat transfer (natural and forced) due to wind; (b) radiant heat transfer due to shortwave absorption, longwave emission, and longwave absorption; (c) conduction between the head sensor and the tracker brackets; and (d) energy generation inside the head sensor.
Since multiple processes are potentially responsible for POM-H Delrin deterioration leading to HCHO generation (see Sect. 2.2) over the instrument lifetime, four Pandora head sensors of various ages were evaluated: 21 (made in 2011), 46 (made in 2015), 118 (made in 2016), and 148 (made in 2018). Pandora 148 was equipped with the internal temperature sensor in April 2019. The other three Pandora head sensors had no internal temperature measurements.
To evaluate the HCHO columns inside the Pandora head sensor as a function of internal temperature, the Pandora head sensor was placed inside a temperature-controlled enclosure (±0.1 ∘C) with a window. Enclosure temperature was varied from 10 up to 45–55 ∘C, kept at 45–55 ∘C for 0.5–1 h, and back to 10 ∘C at different rates. Since POM-H Delrin thermal degradation at higher temperatures is heating rate dependent (e.g., Pielichowska, 2015), we tested atmospheric relevant heating and cooling rates: 3, 3.5, 5, 8, 8.2 ∘C h−1. Pandora 148 was also tested at 50 ∘C for 9 h to determine the time needed to reach steady state conditions.
The DOAS technique was used to analyze laboratory measurements to determine differential HCHO columns at various temperatures with respect to the lowest temperature. The experiments were mimicking temperature ranges and DOAS analysis during a typical summer field campaign but without the actual atmosphere. Since the laboratory measurements were performed under tightly controlled conditions (e.g., a stable 1000 W quartz halogen lamp (QHL), constant spectrometer temperature, single gas), the DOAS equation is simplified to Eq. (1) for such conditions:
where I(λ) is the measured attenuated QHL intensities (corrected for instrumental properties) within the wavelength fitting window between 332 to 360 nm at an internal head sensor temperature T, Io(λ) is the measured QHL intensities at internal head sensor temperature To corresponding to ambient temperature 10 ∘C, σ(λ,298 K) is the HCHO molecular absorption cross section at temperature 298 K (Meller and Moortgat, 2000), the polynomial order PL=5, and the offset order is 1. This approach estimates differential slant column densities of HCHO along the head sensor length (153.5 mm) from the front window to the lens ().
3.1 Experimental setup
The head sensor collimator was protruded through the enclosure window to avoid measuring any potential HCHO outgassing inside the enclosure itself (e.g., paint). The laboratory hosting the measurements was temperature controlled (20–23 ∘C) and had both an air supply and air intake, and the door to the room was open to improve ventilation.
The collimator was pointed at the Gooch and Housego 1000 W QHL controlled by the current precision source (OL 410-1000). The QHL was operated at 8 A. The distance between the QHL and the collimator was 50 cm.
The enclosure temperature was controlled by NesLab 7 recirculating bath and a LYTRON heat exchanger with two fans to ±0.1 ∘C. The NesLeb 7 temperature sensor was placed near the Pandora head sensor. Enclosure air temperature near the head sensor, front plate Pandora head sensor temperature, and Pandora head side temperature were recorded during all the measurements using fast response stick-on surface thin film Platinum Resistance Temperature Detectors (Pt100 RTDs; 3-Wire, The Sensor Connection). An ADAM-4015 six-channel RTD Module with Modbus digitized the RTD signal. The temperature inside the newer-generation head sensor (since April 2019) was measured using the preinstalled Bosch BME280 digital humidity, pressure, and temperature sensor on a SparkFun Atmospheric Sensor Breakout Board. PT100 RTD elements were inter-calibrated. They agreed within the manufacturer specifications (<0.15 ∘C). The accuracy of BME280 was harder to verify due to Pandora head internal power generation of 2 W (manufacturer reported accuracy is ±1.0 ∘C between 0 and 65 ∘C).
Since only one of the tested Pandora head sensors was equipped with the internal temperature sensor, we determined an outside measurement that is the most representative of the internal temperature. This was done by comparing surface temperature measurements by the PT100 RTD elements at various locations on the Pandora head sensor versus the internal to head sensor temperature. As expected, there is some time delay in response between the surface measurements and the internal temperature. This delay is rate specific. Strong linear correlation between the surface measurements and internal temperature measurements (accounting for transient heat transfer) was observed for both front plate (slope = 0.970; intercept = 4.74 ∘C; RMSE = 0.059 ∘C) and side (slope = 0.999; intercept = 6.79 ∘C; RMSE = 0.087 ∘C). Since the electronics board heat sink is connected to the front, we use the front plate surface temperature as the proxy for the internal temperature.
The Pandora spectrometer temperature was controlled using a Pandora thermoelectric controller at the set temperature of 15 ∘C. The measurements were averaged over 40 s sequentially switching between open, plug, U340, plug filter wheel positions to simulate direct-sun measurements.
In addition to the QHL one head sensor (Pandora 118) was also analyzed using a 300 nm LED (Thorlabs M300L4) controlled by a high-precision LED driver (Thorlabs DC2200). In the case of the LED source, the Pandora collimator pointed into an 8.3 cm Labsphere Spectralon® reflectance material integrating sphere illuminated by the LED.
3.2 Post-summer 2019: “POM-H Delrin free” Pandora head sensors
Since summer 2019, new Pandora head sensors are POM-H Delrin free. POM-H Delrin was replaced with molybdenum disulfide (MoS2)-filled easy-to-machine wear-resistant cast nylon 6/6 also purchased from McMaster (Tecamid 66 MO, polyamide >90 % by weight, MoS2<10 % by weight, manufactured by ENSINGER INC). To evaluate potential thermal oxidation of polyamide and MoS2 by air oxygen, three new head sensors (Pandora 165, 167 and 168, manufactured at the end of 2019) upgraded with the nylon parts were tested using QHL (1000 W) and 300 nm LED sources. The enclosure temperature varied from 10 to 55 ∘C over 8 h, with 1 h at 55∘ and 8 h cooling from 55 to 10 ∘C. This translated to internal temperatures from 17 to 60 ∘C. The QHL current was set at 7.5 A. Pandora spectra were binned within 40 s for measurements with no filters (open, single-spectrum integration time 2.4 ms, about 12 550 cycles per measurement and dark 2320 cycles); 240 s with a U340 filter (integration time 12.9 ms, about 15335 cycles per measurement and dark 2835 cycles); and 240 s with a BP300 filter (integration time 117 ms, about 1730 cycles per measurement and dark 320 cycles). The spectrometer electronics board temperature was maintained at 12.9 ∘C (controller set temperature 5 ∘C). We also repeated the test with 300 nm LED at a constant current of 350 mA with no filters for 100 s total integration time. The experiments were designed to ensure low noise in case of small emissions of HCHO or presence of other species.
The reference spectrum was collected at the lowest internal head sensor temperature (about 17 ∘C). DOAS fitting included only HCHO and sulfur dioxide, SO2, molecular absorption cross sections (Vandaele et al., 1998), the polynomial order for the broadband attenuation (PL) was set to 5, and a 0-order polynomial represented the offset. Only the dark current spectrum was subtracted from the data since all other parameters are expected to be constant (e.g., no wavelength shift in the temperature-controlled lab, no need for nonlinearity correction, no need for pixel response non-uniformity correction, etc.). The DOAS fitting was performed using QDOAS v3.2 program. SO2 was fitted as a precaution since sulfur contained in MoS2 has been reported to oxidize to SO2 at temperatures higher than 140 ∘C (https://core.ac.uk/download/pdf/10884897.pdf, last access: 21 January 2021).
4.1 POM Pandora head sensor HCHO dynamics rates
Analysis of Pandora 148 data over a 9 h period showed that the equilibrium between HCHO generation and removal processes inside the head sensor is reached almost instantaneously (at the DOAS fitting accuracy). Investigation of the actual process mechanisms are outside of the scope of this paper. However, it is probably also controlled by desiccant-activated carbon adsorption as a function of temperature, in addition to “pure” solid POM-H vapor-phase processes (Sect. 2.2).
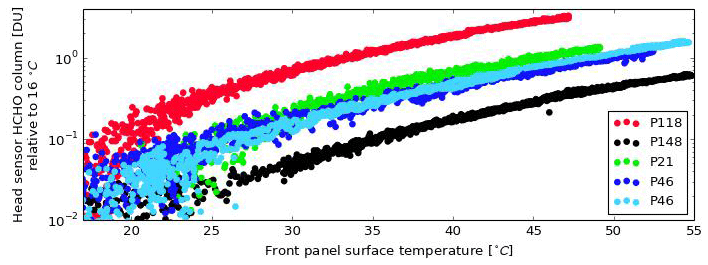
Figure 5HCHO formation and deposition inside Pandora 118, 148, 21, and 46 as a function of front panel outside surface temperature relative to the individual head sensor measurements at 16 ∘C. Pandora 46 was tested twice with a combination of temperature change rates (3 and 8.2 ∘C h−1 in light blue and 3.5 ∘C h−1 in dark blue).
Figure 5 shows that HCHO columns inside Pandora head sensors follow exponential dependence on temperature irrelevant of heating or cooling rates for all four tested head sensors (Eq. 2). This temperature dependence does not show any hysteresis at the timescales relevant to this study. HCHO columns in all four sensors had the same exponential function damping ( ∘C−1) but different amplitudes (and most likely absolute offsets).
The newest head sensor (Pandora 148) produced the lowest amount of HCHO (about 0.3 DU) at an internal temperature of about 50 ∘C (front panel external temperature 45 ∘C). Pandora 118 generated the largest – about 3 DU at the same temperature. Pandora 46 and 21 were in between. No clear trend was observed between the age of the instruments and the HCHO amount produced in the head sensor. Pandora 148 head sensor was evaluated for temperature dependence of HCHO several times over 5 months and did not show any difference in the HCHO generation during that period.
4.2 POM-H Delrin free Pandora head sensors – no HCHO production
Initially we conducted DOAS fitting of HCHO and SO2 absorption within their standard fitting windows 332–359 and 307–328 nm (Spinei et al., 2010), respectively. No HCHO or SO2 was detected above the optical depth rms noise level of from the new “POM-H Delrin free” head sensors as a function of internal head sensor temperature relative to 17 ∘C. To consolidate HCHO∕SO2 results for both species and to evaluate residuals we have done DOAS fitting at a broader fitting window: 300–350 nm. Figure 6 shows a retrieval example for Pandora 167 (300–350 nm fitting window from spectra collected with U340 filter). The spectra were also evaluated for any absorption across the entire instrument wavelength range from 300 to 530 nm by only taking the radiance ratio but not fitting any trace gases. We did not see any signatures above the instrumental noise level.
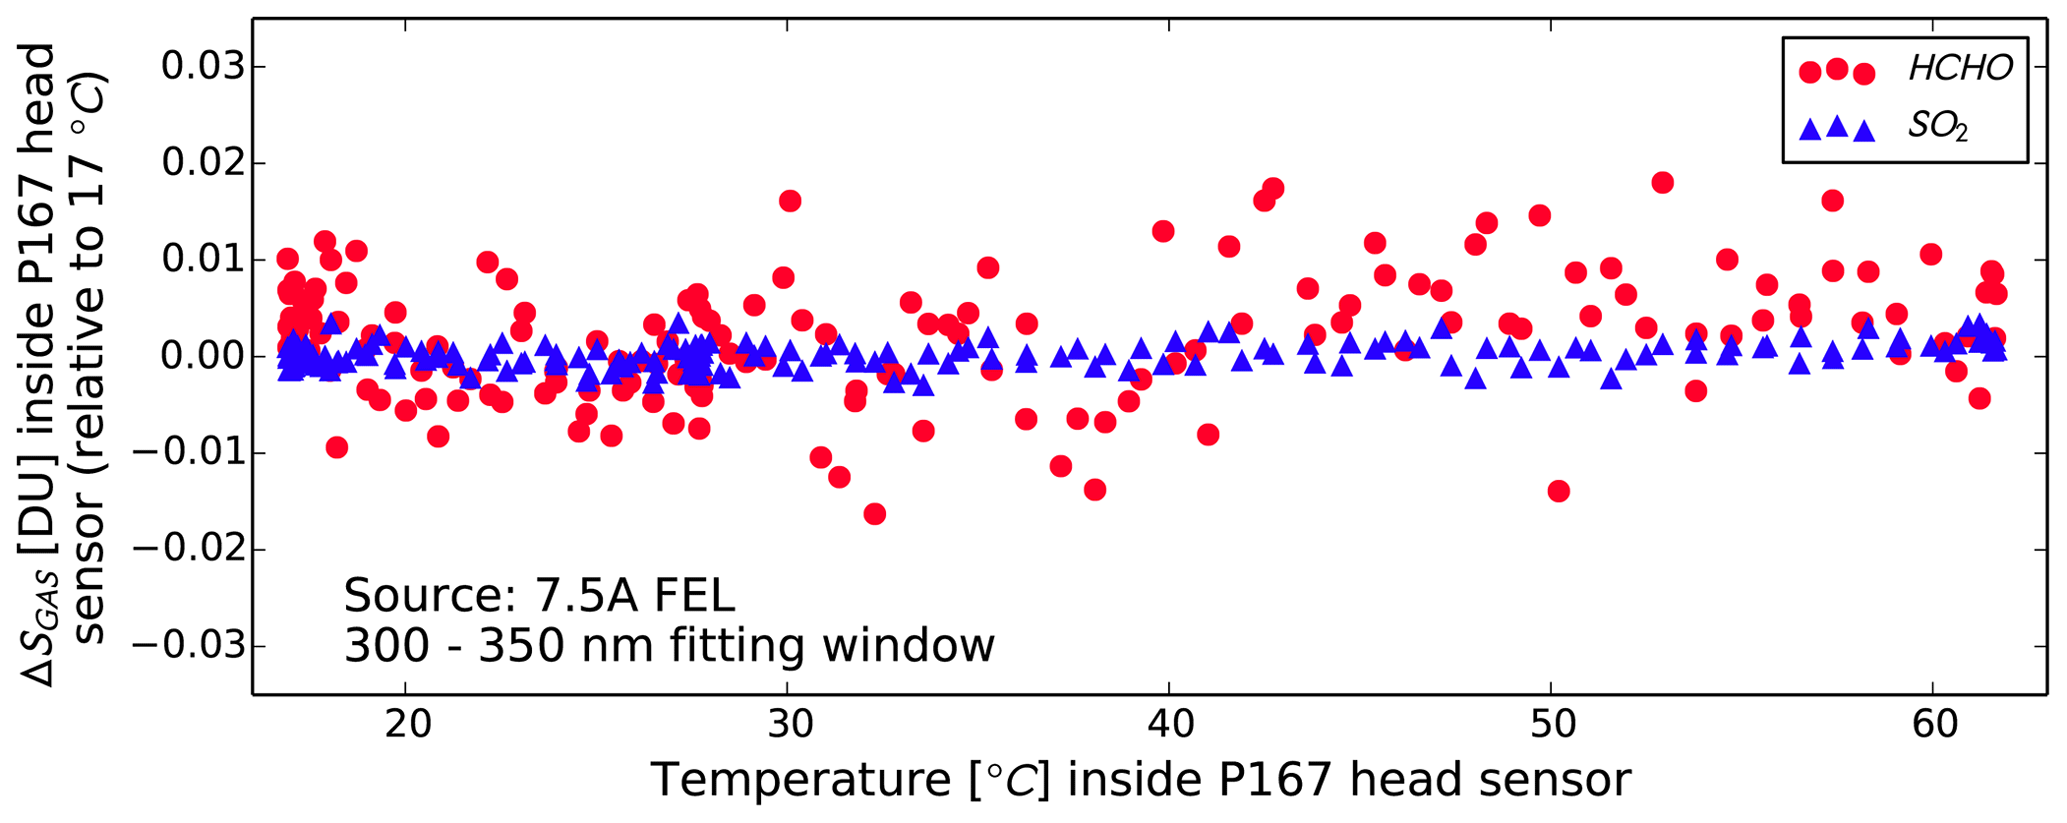
Figure 6ΔS of HCHO and SO2 retrieved from POM-H Delrin free Pandora 167 head sensor at internal temperatures from 17 to 61 ∘C using QHL at 7.5 A (see text for information about thermal rates). Individual spectra integration time 12.9 ms, and total exposure per measurement 240 s. Fitting window 300 to 350 nm. Fitting residual optical depth rms was during the entire measurement period.
In general, DOAS analysis will cancel any instrumental “artifacts” if they are the same in the reference spectrum and the rest of the spectra. As applied to the internally generated HCHO, it will cancel if the reference spectrum and the rest of the spectra are measured at the same head sensor temperature. DOAS fitting results from direct-sun or multi-axis measurements () accounting for internal to the head sensor HCHO () can be described by the following equation:
where a is a head-sensor-dependent amplitude and is not known for instruments not tested in the laboratory and b is constant damping for all tested systems and is ≈0.10 ∘C−1.
For multi-axis observations where spectra measured at low elevation angles (μ) are analyzed using a zenith (μref) reference spectrum measured within a few minutes when , HCHO amount due to POM-H Delrine emission is about the same and mostly cancels (see Sect. 5.2).
During the CINDI-2 campaign, however, the data analysis protocol for ΔSHCHO that was intercompared between the instruments was to use a reference spectrum collected around the local noon for all spectra measured throughout the entire day (Kreher et al., 2020). In this case, and the retrieved ΔSHCHO are impacted by the internally generated HCHO (see Sect. 5.3).
In the case of direct-sun measurements, a single reference spectrum at a specific temperature is applied to analyze the data over extended periods. In this case and total vertical column (C) derived from direct-sun measurements is impacted differently depending on the actual head sensor temperature and air mass factor (AMF), according to Eq. (4). It is assumed that the calibration approach called the “Minimum Langley Extrapolation Method” (Herman et al., 2009) is capable of estimating the amount in the reference spectrum (including the head sensor amount).
5.1 Case study: direct-sun measurements using colocated POM- and POM-H Delrin free instruments
Since direct measurements of HCHO in the head sensor are harder to perform during routine direct-sun observations, we evaluate the head sensor HCHO production effect using two instruments: Pandora 32 and Pandora 2 (neither was evaluated in the laboratory according to Sect. 3) during outdoor operation. Both instruments operated side-by-side at the NASA Goddard Space Flight Center in Greenbelt, MD (38.9926∘ N, 76.8396∘ W, 90 m a.s.l.), in direct-sun mode during July 2019–January 2020. Pandora 2, originally built in 2009 with the standard POM-H Delrin components, was upgraded in June 2019 with POM-H Delrin free components and internal temperature sensor (see Sect. 3.2). The Pandora 32 head sensor, originally built in 2012, still contains the original POM-H Delrin components and does not have an internal temperature sensor. To evaluate the effect of internally generated HCHO on the direct-sun total column measurements during a “typical” field campaign study, we used 1.5 months of data from 30 August to 15 October 2019, when both instruments had minimal instrumental issues.
The evaluation consists of several steps.
-
Use Pandora 32 and 2 data to estimate the exponential HCHO production amplitude inside Pandora 32 during the selected 1.5 months:
-
Calculate the HCHO column produced in the head sensor, knowing the Pandora 2 head sensor temperature and exponential damping and amplitude for Pandora 32 head sensor () for 7 months (17 July 2019–7 February 2020).
-
Apply an air mass factor to the amount in the head sensor to evaluate diurnal and seasonal contribution to the total column measurements from direct-sun data during 7 months (17 July 2019–7 February 2020).
The assumption about the same internal temperature for Pandora 32 and 2 is based on almost identical head sensor designs, collocation and the same mode of operation. The derived HCHO production amplitude for Pandora 32 is 0.0133 DU. DOAS analysis to calculate HCHO columns was performed in the fitting window 332–359 nm with PL=4 and an offset and wavelength shift of polynomial order 1. In addition to HCHO at 298 K (Meller and Moortgat, 2000), absorption by ozone (O3, at 223 and 243 K, Malicet et al., 1995), nitrogen dioxide (NO2, a linear temperature model, Vandaele et al., 1998), an oxygen collision complex (O2O2, at 294 K; Thalman and Volkamer, 2013), and bromine monoxide (BrO, at 223 K; Fleischmann et al., 2004) were fitted. Their high-resolution molecular absorption cross sections were convolved with the Pandora instrument transfer function prior to DOAS fitting (for convolution details, see Cede, 2019). The reference spectrum was created by averaging all spectra within of the minimum solar zenith angle (SZA) on a cloud-free day 15 October 2020 with an average internal head sensor temperature of ≈29 ∘C.
Figure 7 shows a linear correlation between ΔSHCHO measured by Pandora 32 and differential columns estimated from Pandora 2 measurements and HCHO produced by the Pandora 32 head sensor. The linear regression analysis between these data sets shows that the exponential function represents a reasonable estimation of the internally generated HCHO by Pandora 32 head sensor measurement during direct-sun measurements (slope = 1.00, intercept = −0.03 DU and R2 = 0.92). Deviations between the true Pandora 32 measurements and simulated from Pandora 2 measurements and internally produced HCHO are also due to small differences in Pandora 32 and 2 fields of view, diffusers, and pointing accuracy.
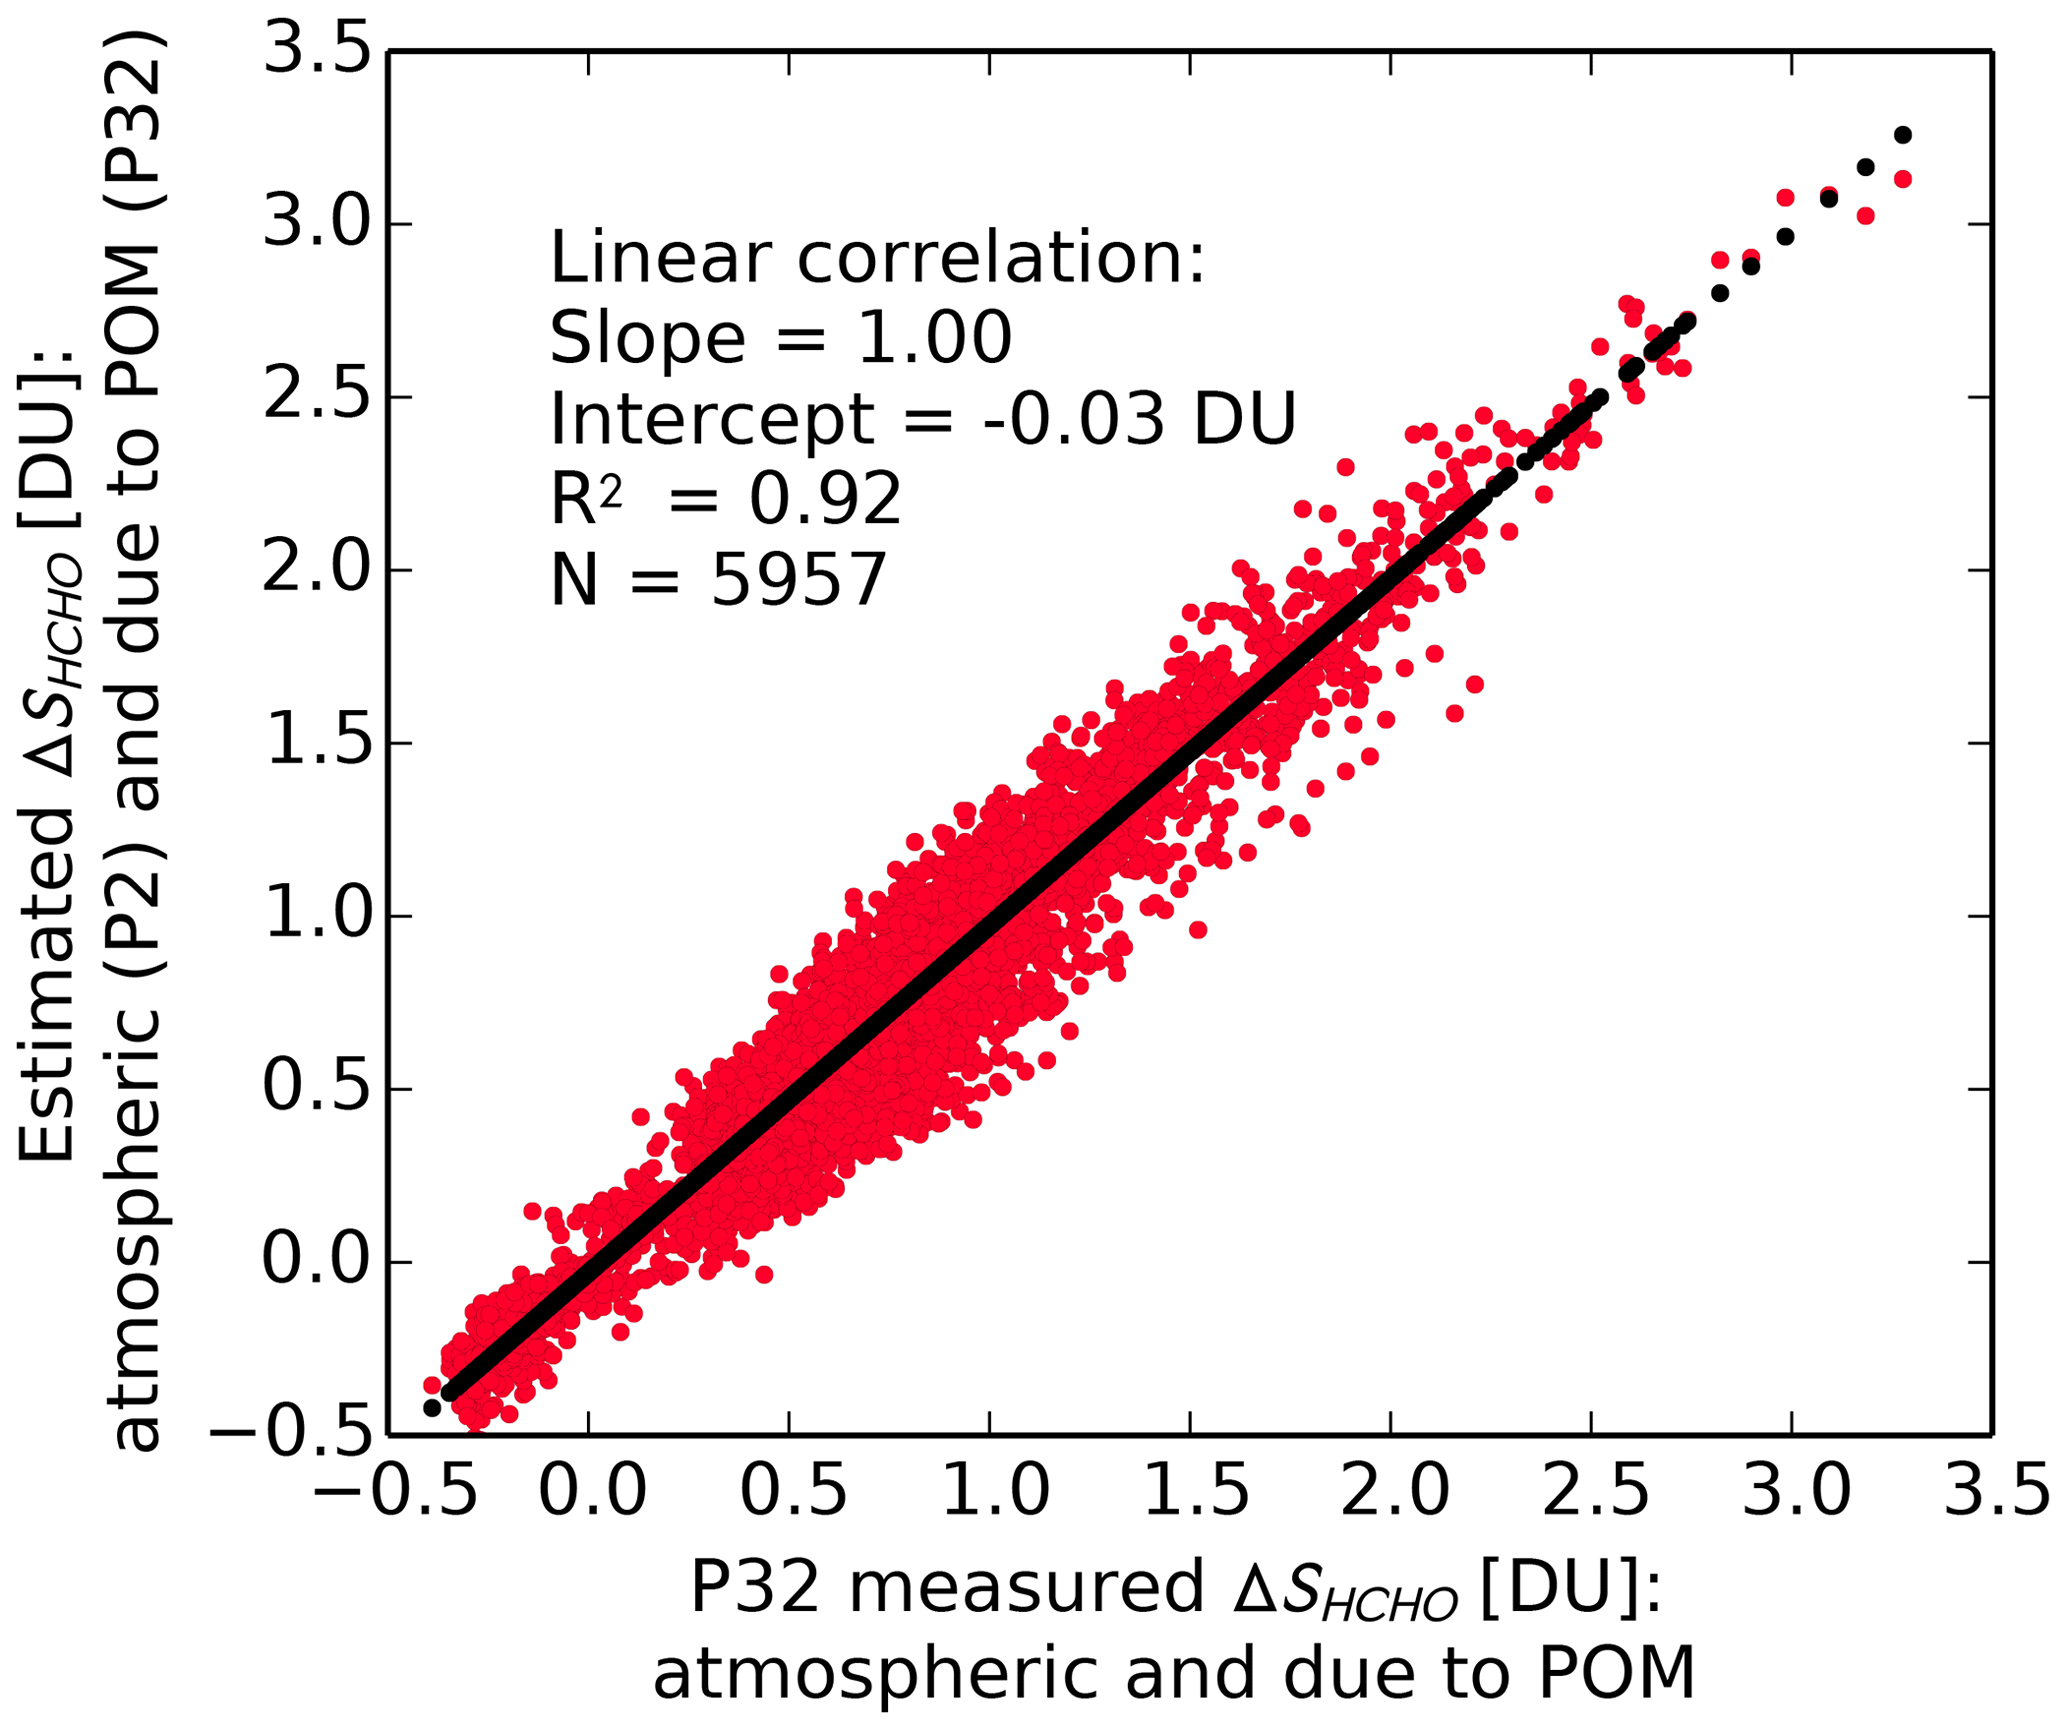
Figure 7Linear regression analysis of the estimated and measured ΔSHCHO by Pandora 32, including true atmospheric and POM-H Delrine-emitted HCHO. Pandora 2 (POM free) measured only atmospheric HCHO. Pandora 32 measured both true atmospheric abundance and POM-H Delrine-emitted HCHO. Instruments were colocated at NASA-GSFC and made direct-sun measurements from 30 August to 15 October 2019. The reference spectrum was collected around local noon on 15 October 2019: DU.
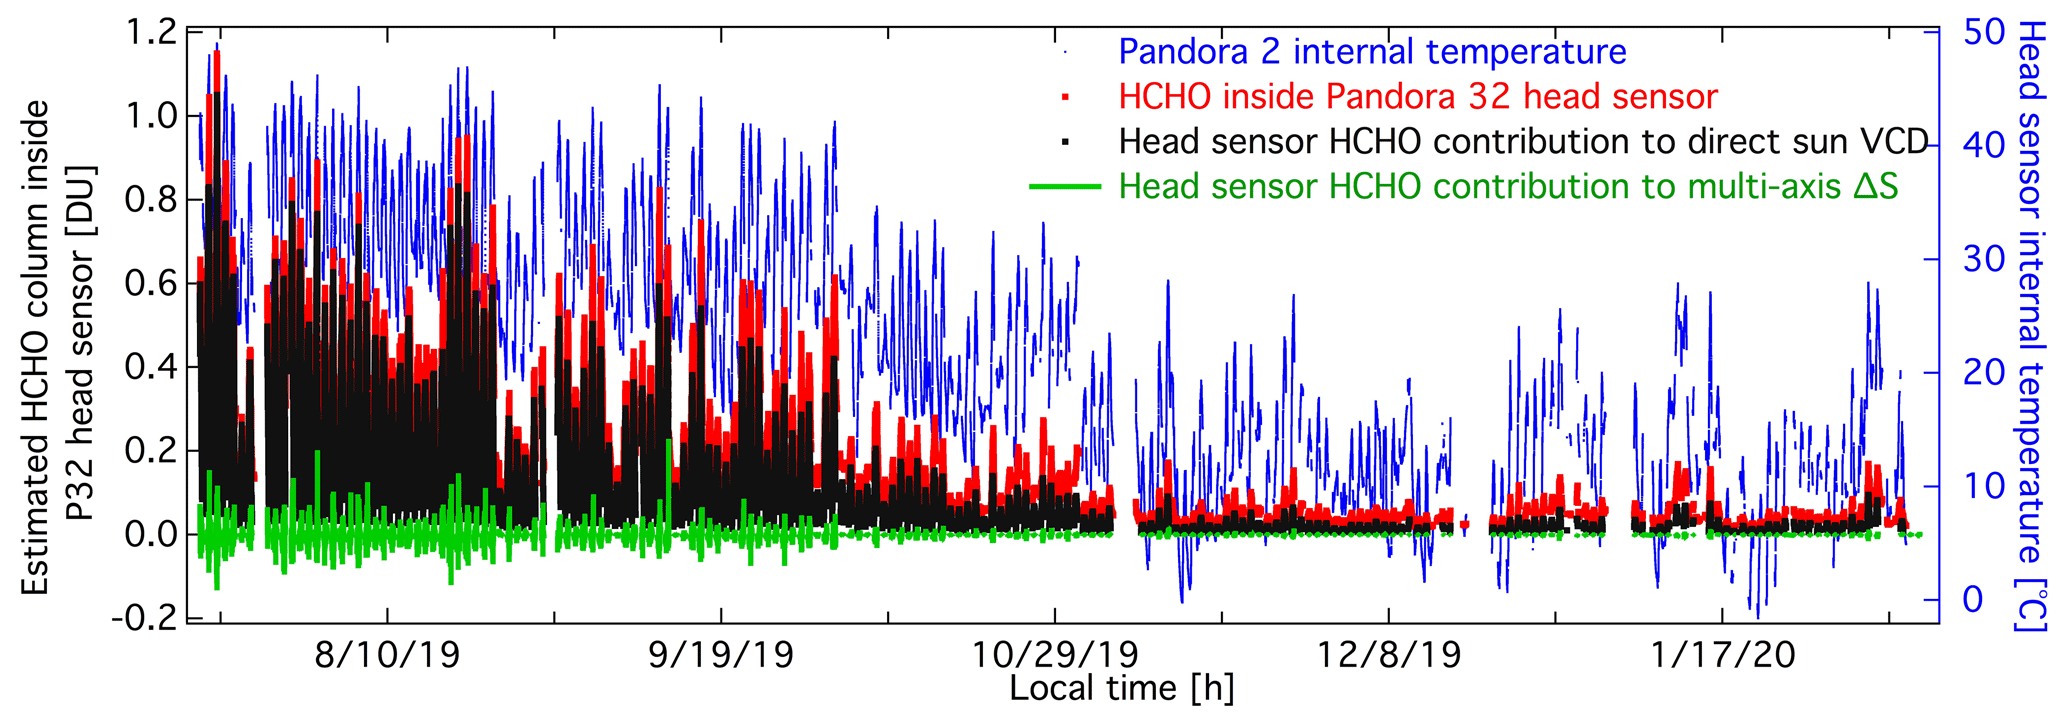
Figure 8Estimated HCHO column density inside Pandora 32 head sensor during deployment at NASA-GSFC, Greenbelt, MD. Estimation is based on the exponential function amplitude derived from Pandora 32 and Pandora 2 direct-sun measurements of HCHO (0.0133 DU) and exponential function damping coefficient derived from the laboratory measurements of four other instruments (0.091). Direct-sun air mass factors used to calculate HCHO are limited to solar zenith angles smaller than 80∘.
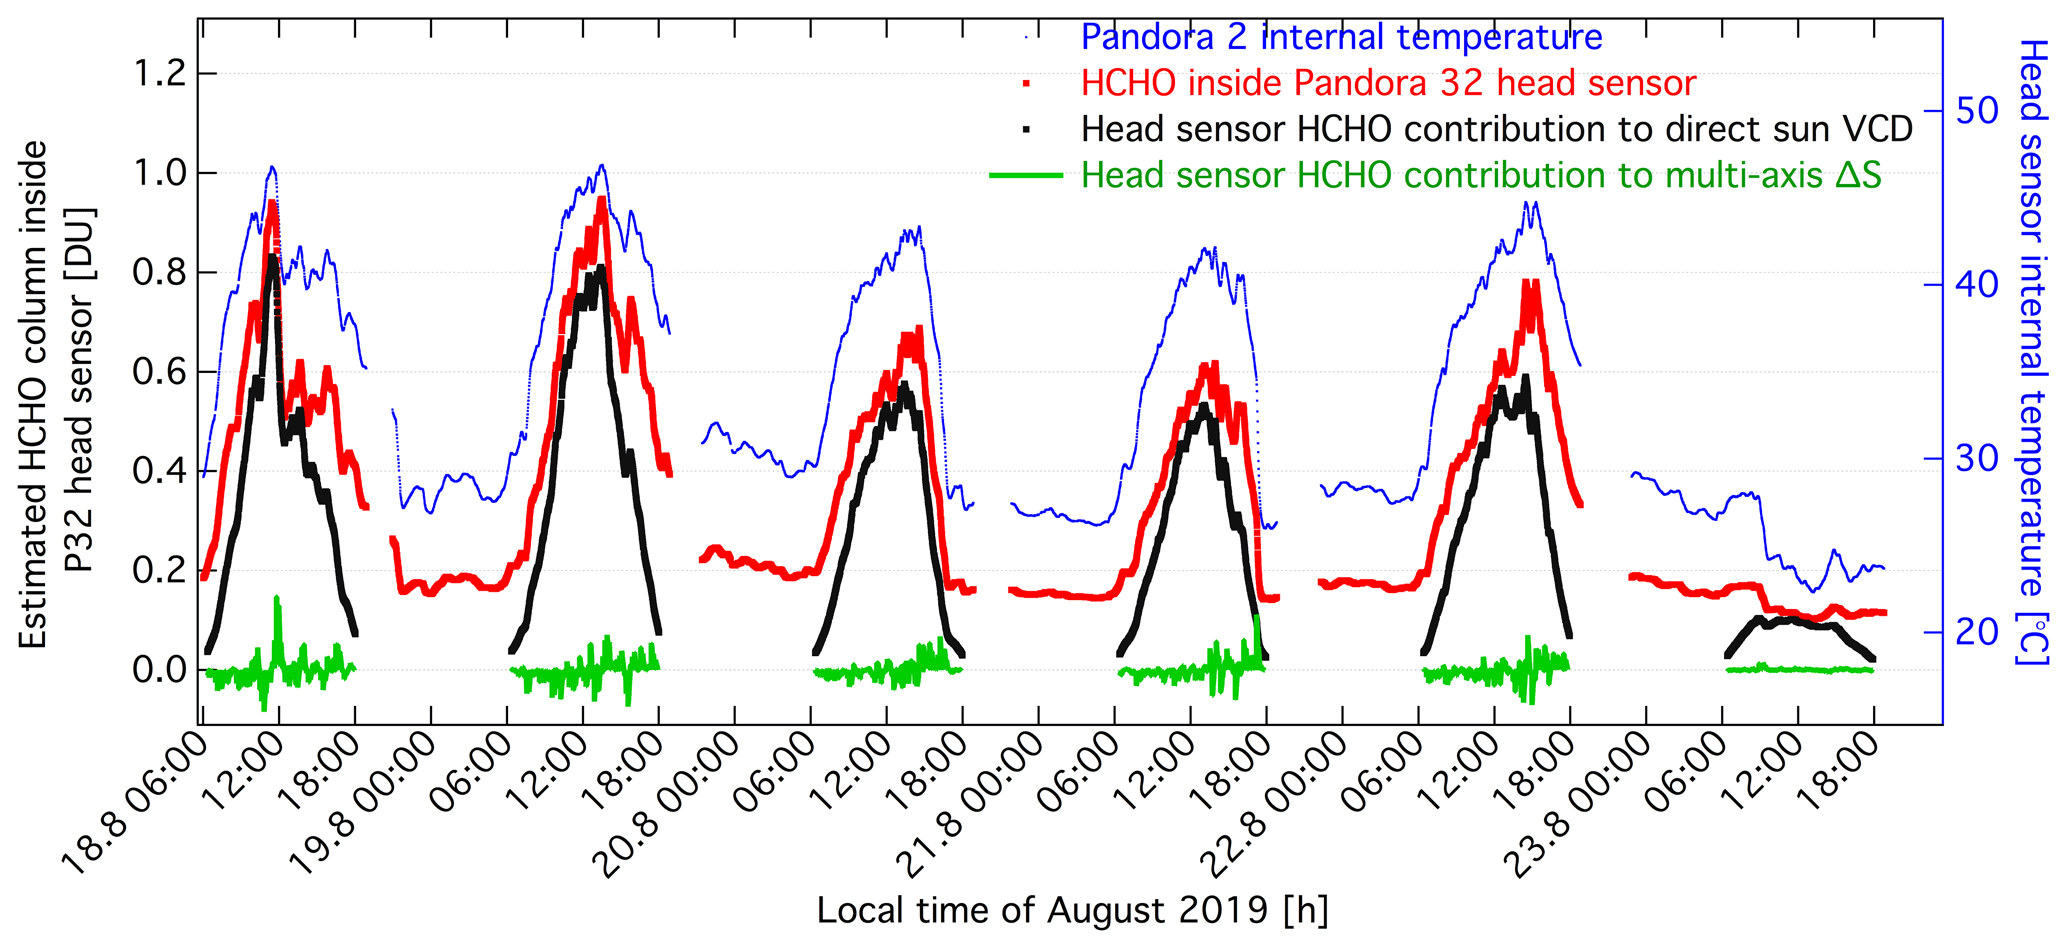
Figure 9Subset of data from Fig. 8: estimation of HCHO column density inside Pandora 32 head sensor during deployment at GSFC/NASA, Greenbelt, MD, in August 2019 and its contribution to HCHO vertical column density measured in direct-sun and multi-axis modes.
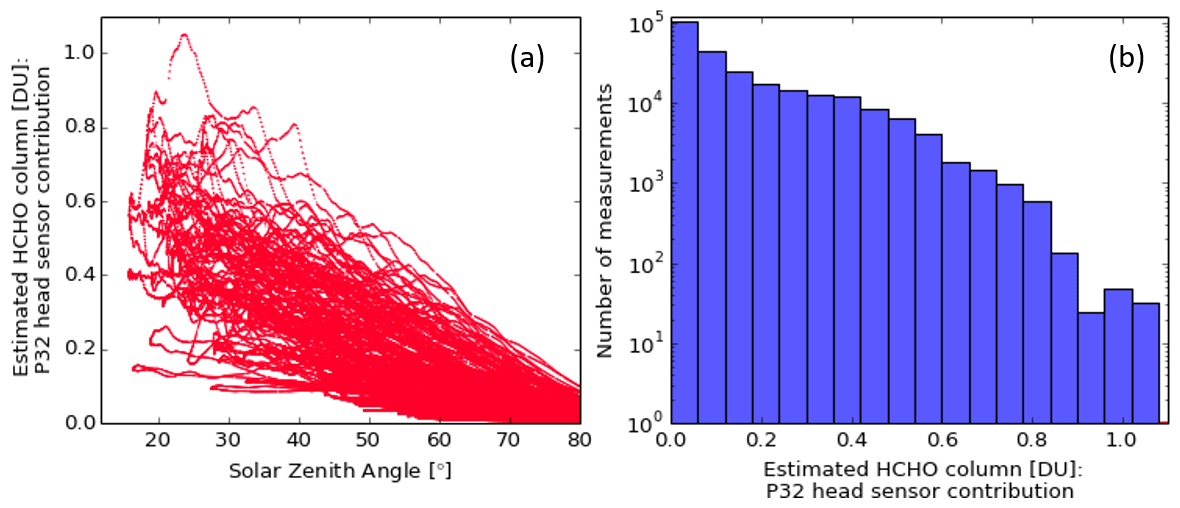
Figure 10Estimated HCHO column density inside Pandora 32 head sensor during deployment at NASA-GSFC, Greenbelt, MD (17 July 2019–7 February 2020). Estimation is based on the exponential function amplitude derived from Pandora 32 and Pandora 2 direct-sun measurements of HCHO (0.0133 DU) and the exponential function damping coefficient derived from the laboratory measurements of four other instruments (0.091). Direct-sun air mass factors used to calculate HCHO are limited to solar zenith angles smaller than 80∘.
Figure 8 shows estimated HCHO column density inside Pandora 32 head sensor (red) based on the exponential function coefficients (a = 0.0133 DU; b = 0.0911 ∘C−1) and colocated Pandora 2 internal temperature. Internally generated HCHO amount is smaller during the winter months (<0.2 DU) and reaches up to 1.15 DU during hot summer days for the Pandora 32 head sensor. Since the total SHCHO is divided by the direct-sun air mass factor, the head sensor contribution to the total vertical column is also solar zenith angle dependent in addition to the internal head sensor temperature (this should not be confused with the actual amount in the head sensor). Its contribution is the largest during the middle of the day near the summer solstice and smallest at large solar zenith angles (80∘ in this study). Due to colder temperatures and larger AMFs during winter months over non-tropical regions, head-sensor-generated HCHO contribution to the vertical column is small (<0.1 DU for this instrument). Figure 9 shows that during the cooler and windy summer days (e.g., 23 August 2019), head sensor HCHO can result in a relatively small amount contributing to the total direct-sun column. Similar behavior was observed during the KORUS-AQ field campaign (Spinei et al., 2018) when altitude integrated in situ aircraft measurements mostly agreed with Pandora columns in the morning at higher solar zenith angles and disagreed during the middle of the day. Figure 10a shows that warm-season measurements at solar zenith angle <60∘ are most impacted. Figure 10b shows that a significant number of measurements have a contribution to the order of background level (≈0.5 DU) or higher, which significantly impacts the accuracy of direct-sun observations.
5.2 Case study: effect of internally generated HCHO on multi-axis measurements during the TROLIX'19 field campaign
In this section we evaluate the variability of internally generated HCHO and its effect on MAX-DOAS retrievals using “closest” in time (<10 min) zenith reference spectra during the TROLIX'19 campaign. Pandora instruments 148 and 118 participated in the TROLIX'19 campaign. The main goal of TROLIX'19 was validation of TROPOMI L2 main data products including UV aerosol index (UVAI), aerosol layer height, NO2, O3, and HCHO under a wide range of atmospheric conditions. Pandora 148 has been tested in the laboratory (see Sect. 4.1) three times over the period of 5 months and showed no changes in internally produced HCHO as a function of temperature. We use Pandora 148 data collected during the TROLIX'19 campaign to estimate the effect of internally produced HCHO on the multi-axis ΔSHCHO retrieved with individual scan reference. Pandora 148 was equipped with an internal temperature sensor and had well characterized internal HCHO temperature dependence before deployment in western Rotterdam metropolitan area (51.9172∘ N, 4.4066∘ E, 7 m a.s.l.) during September 2019. Pandora 118 was characterized for temperature-dependent HCHO production in December 2019, 3 months after the TROLIX'19 deployment.
The effect of internally generated HCHO on multi-axis ΔSHCHO using the reference zenith spectrum that was closest in time collected a maximum of 10 min apart from the rest of the scan spectra is evaluated according to the following steps:
-
calculating the head-sensor-produced amount, SHCHO(Ths(t)), based on the head sensor temperature and Pandora 148 exponential function coefficients: a = 0.0041 DU and b = 0.0911 ∘C−1;
-
calculating the head-sensor-produced HCHO amount at the individual scan reference spectrum time (maximum 10 min) based on the head sensor temperature and Pandora 148 exponential function coefficients: a = 0.0041 DU; b = 0.0911 ∘C−1 ();
-
calculating the amount of HCHO due to POM: .
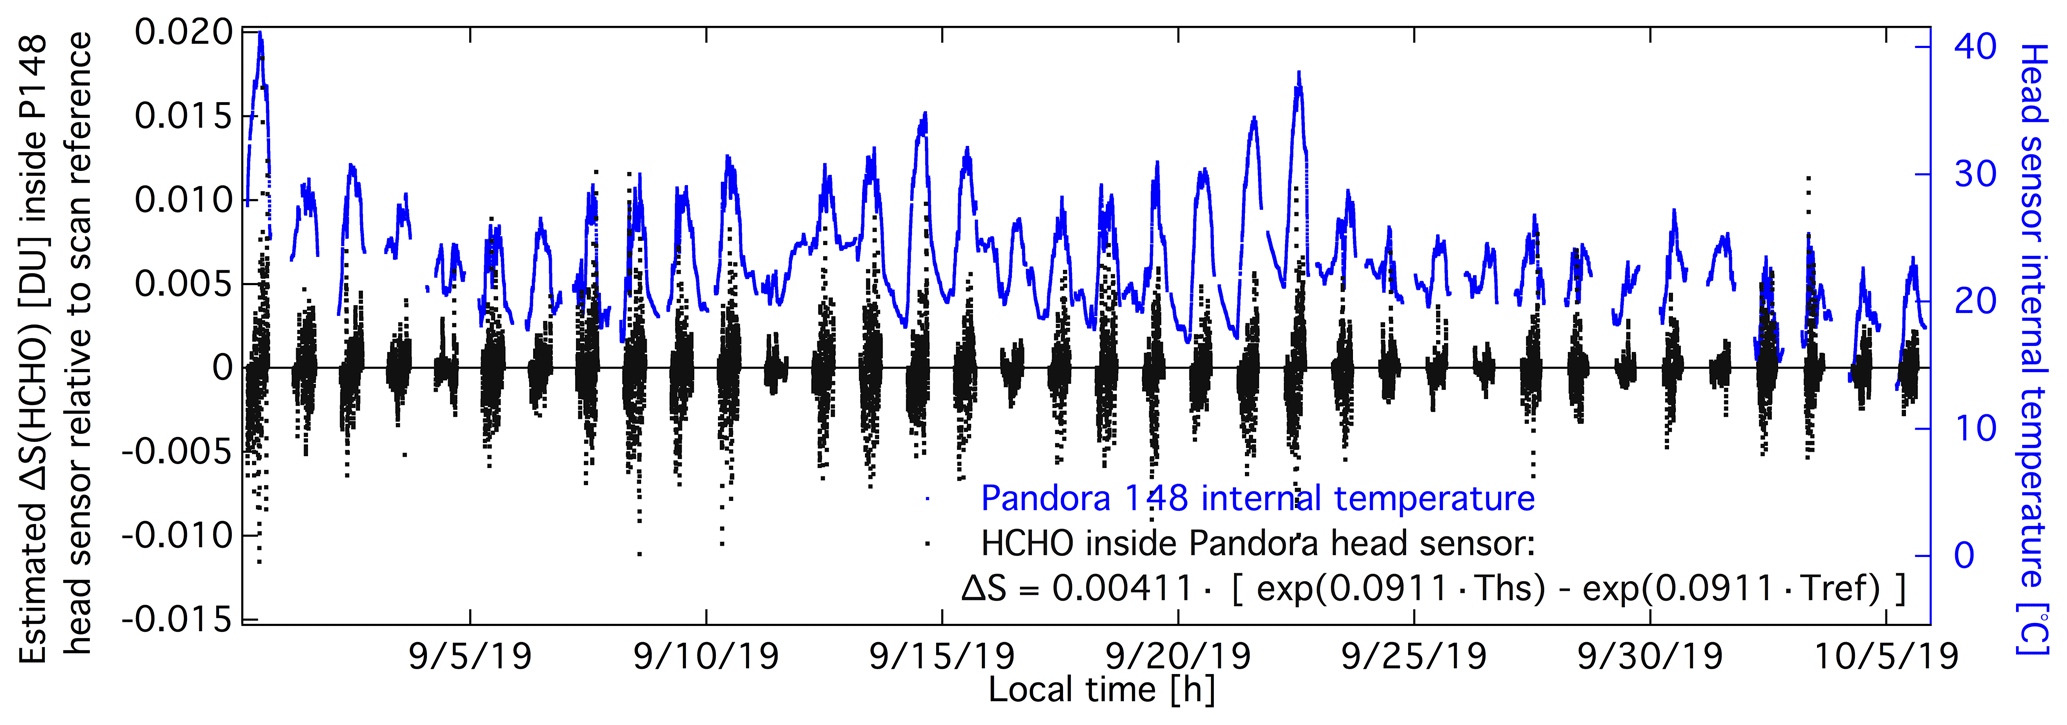
Figure 11Estimated contribution from internally generated HCHO on the multi-axis ΔSHCHO measured by Pandora 148 during TROLIX'19 using individual scan reference spectrum about 10 min apart from the lowest viewing angle.
Figure 11 shows that Pandora 148 internally generated HCHO contribution to the multi-axis ΔSHCHO while using single scan reference is very small (<0.005 DU). As expected, this small contribution is mostly due to lower internal temperature variations within 10 min period and partially due to small generation rates inside Pandora 148 head sensor (a = 0.0041 DU, see Fig. 5). Since Pandora 118 was only characterized once for temperature dependence of HCHO production we do not have high confidence in its temperature dependence “stability”. If we assume that the exponential function amplitude was the same in September as in December (a = 0.049 DU), Pandora 118 head sensor contributed almost 10 times more than Pandora 148 to multi-axis ΔSHCHO. Even in this case, the resulting amount is smaller than 0.05 DU, which is lower than the DOAS fitting noise for most DOAS instruments (0.3 DU = 8×10¹⁵ molecules cm−2, Table 7 in Kreher et al., 2020.)
5.3 Case study: effect of Pandora internally generated HCHO on the CINDI-2 ΔSHCHO intercomparison with other DOAS instruments
Five Pandora instruments participated in the Second Cabauw Intercomparison campaign for Nitrogen Dioxide measuring Instruments (CINDI-2) that took place at Cabauw, The Netherlands (51.97∘ N, 4.93∘ E, September 2016) (Kreher et al., 2020). A formal semi-blind intercomparison exercise was performed to compare ΔSgas of NO2, HCHO, O2O2, and O3 measured by 36 spectroscopic systems from 24 institutes during 17 d in September 2016. To limit any variability due to differences in temporal sampling by each instrument for semi-blind intercomparison exercise, all multi-axis daily scans were analyzed using that day's local noon spectra. This type of analysis results in a stronger contribution of the internally generated HCHO on the Pandora ΔSHCHO that were compared with the rest of DOAS instruments. Since none of the Pandora instruments in September 2016 were equipped with an internal temperature sensor, we use Pandora 148 data during TROLIX'19 measurements as a surrogate for the CINDI-2 campaign. Pandora 148 was deployed at a location about 38 km southwest of the CINDI-2 site during the same month of the year as CINDI-2. While differences in atmospheric conditions are expected between the sites and years (2019 versus 2016), we assume that general trends in internal Pandora head sensor temperature are similar over the measurement periods. Only one Pandora (Pandora 118) was tested for internal HCHO generation, but this was done more than 3 years later. We assume that Pandora 32 exponential amplitude is more representative of a “typical” Pandora rate than Pandora 118.
To evaluate the effect of internally generated HCHO on ΔSHCHO used for semi-blind intercomparison during CINDI-2, a single reference spectrum was used to analyze the entire day of multi-axis data during TROLIX'19 using the following steps:
-
calculating the head sensor produced amount based on Pandora 148 head sensor temperature and Pandora 32 exponential function coefficients: a = 0.013 DU; b = 0.0911 ∘C−1.
-
calculating the head sensor produced amount at the reference spectrum time (local noon at minimum solar zenith angle);
-
calculating due to POM.
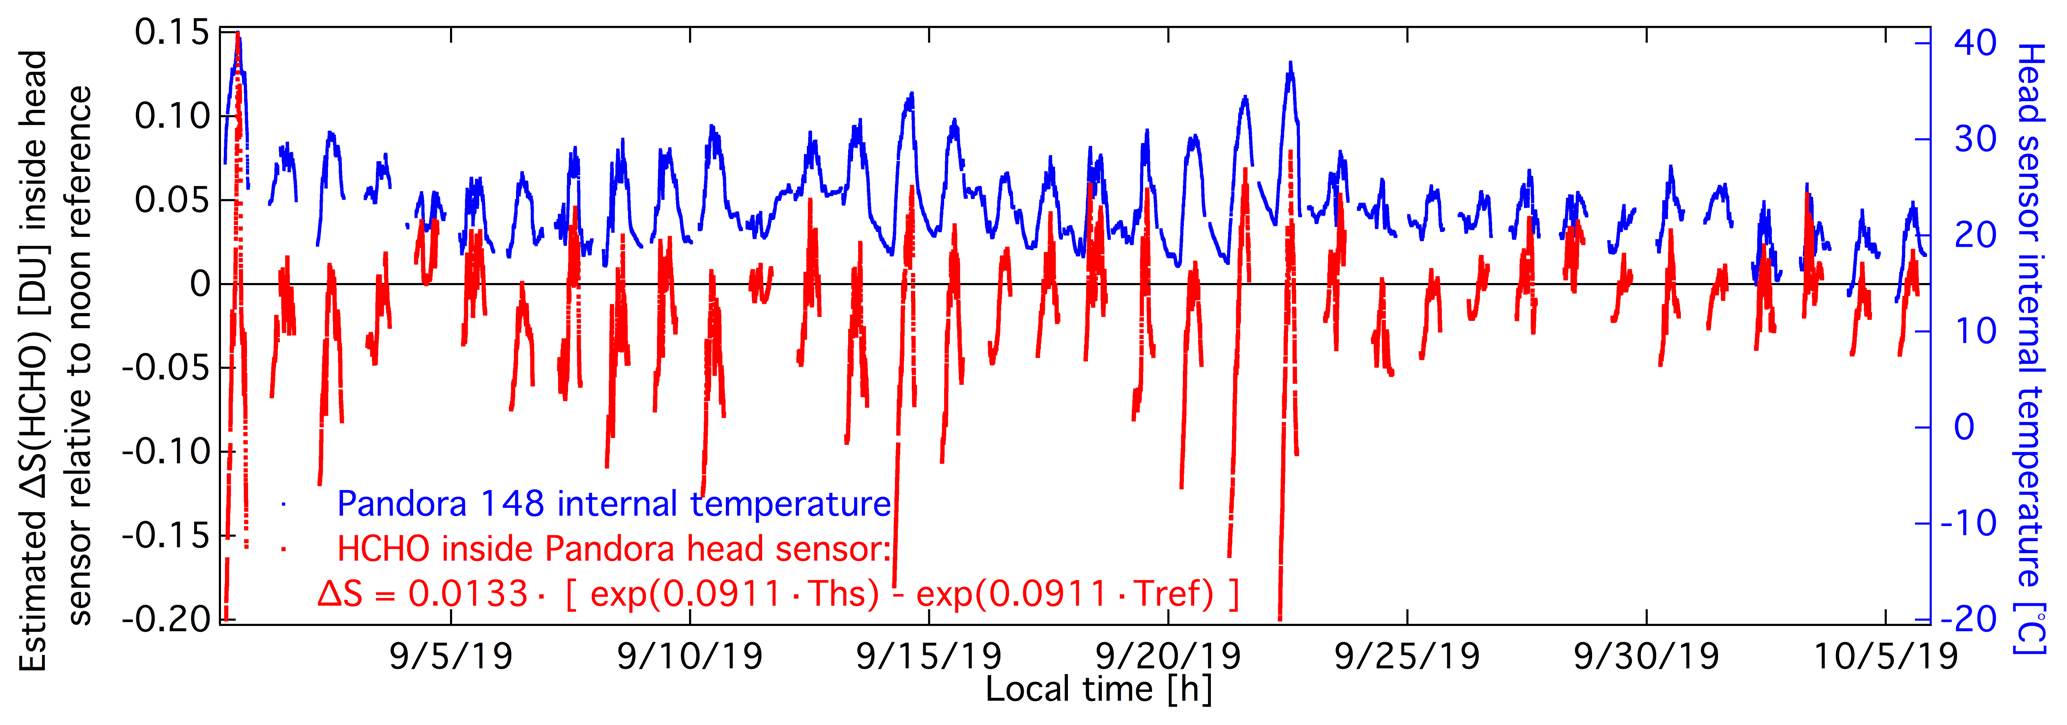
Figure 12Estimated ΔSHCHO contributing to the multi-axis measurements while local noon reference is used. This is relevant only to DOAS instrument intercomparison campaigns such as CINDI-2 since standard data inversion requires individual scan reference. Exponential production amplitude applied is 0.0133 DU; however, the actual amplitude observed in the lab was between 0.0041 and 0.049. ΔSHCHO is calculated based on Pandora 148 head sensor temperature during TROLIX'19 campaign west of Rotterdam, the Netherlands, during 31 August to 5 October 2019.
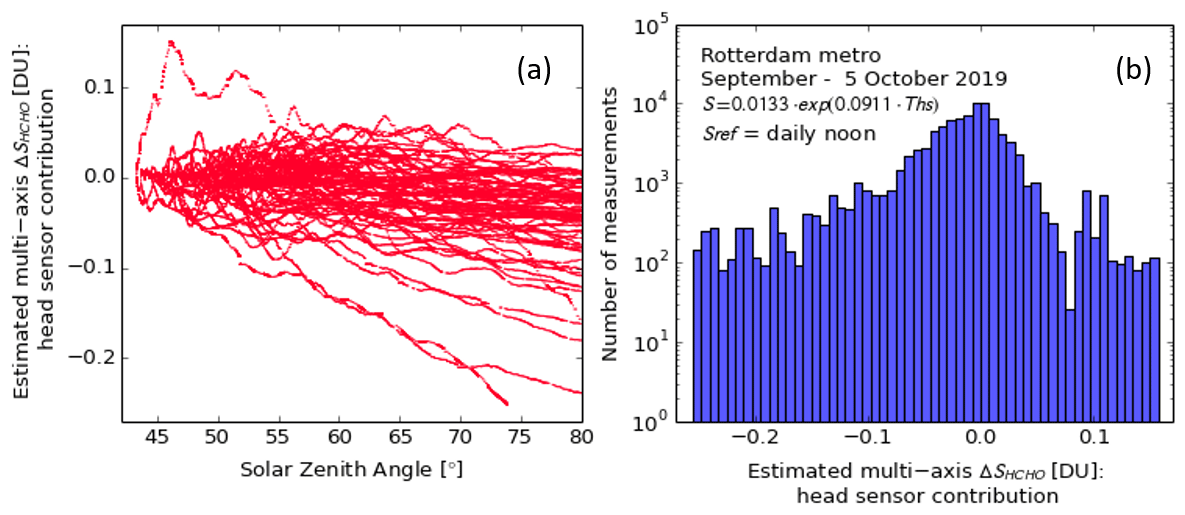
Figure 13(a) Estimated internally generated ΔSHCHO contributing to the multi-axis measurements while local noon reference is used as a function of solar zenith angles. (b) Distribution of ΔSHCHO shown in (a). This is relevant only to DOAS instrument intercomparison campaigns such as CINDI-2 since standard data inversion requires individual scan reference. ΔSHCHO is calculated based on Pandora 148 head sensor temperature during the TROLIX'19 campaign west of Rotterdam, the Netherlands, from 31 August to 5 October 2019, with an exponential production amplitude of 0.0133 DU.
Figure 12 shows that the internally generated HCHO contribution to ΔS is negative before local noon, positive during early afternoon, and negative again during late afternoon. Since the internal temperatures did not vary by more than 15 ∘C during daily measurements and maximum did not exceed 40 ∘C the overall effect is in general small <0.1 DU with slightly negative bias (Fig. 13) for an instrument similar to Pandora 32, 21 and 46. While we do not know the exact HCHO internal generation rates for the Pandora instruments deployed during CINDI-2 we can assume that the minimum corresponds to Pandora 148 and maximum to Pandora 118, which is about 3.2 times smaller or 3.7 times larger than in Fig. 12 and 13.
Note, that DOAS analysis using daily noon zenith reference spectra was implemented only for the formal semi-blind intercomparison of ΔSCD exercise (Kreher et al., 2020). Full data processing and inversion to the final products, tropospheric columns and profiles, was done using individual scan zenith spectra and not daily noon zenith spectra (Tirpitz et al., 2020).
Pandora direct-sun measurements of HCHO were impacted by the internally generated HCHO inside head sensor due to thermal degradation of POM-H Delrin plastic parts up until summer 2019. Direct-sun measurements before spring 2016 were also effected by the etaloning off the front window surfaces. Pandora multi-axis measurements of HCHO were significantly less impacted by the internally generated HCHO. The following list represents the major findings of this work.
-
Exponential temperature dependence of HCHO production was observed for four tested head sensors with a damping coefficient of 0.0911±0.0024 ∘C−1. The exponential function amplitude ranged from 0.0041 DU for P148 to 0.049 DU for P118. No apparent dependency on the head sensor age and heating and cooling rates was observed (Fig. 5).
-
Three new POM-H Delrin free Pandora head sensors (starting from summer 2019) were evaluated for temperature-dependent attenuation across the entire spectral range. The noise was minimized by reducing spectrometer temperature to a 5 ∘C set temperature and averaging more than 10 000 spectra per measurement to allow detection of smaller absorption (Fig. 6). No HCHO or SO2 were detected under the measurement conditions. No other absorptions above the instrumental noise were observed across the entire spectral range.
-
Evaluation of ΔSHCHO measured from two colocated Pandora instruments, one with POM-H Delrin and one without POM-H Delrin parts, operating in direct-sun mode allowed for derivation of exponential production amplitude (0.0133 DU, Fig. 7).
-
The total amount of HCHO internally generated by the POM-H Delrin components and contributing to the direct-sun measurements were estimated based on temperature and solar zenith angle of the measurements. Measurements in winter, during colder days in general, and at high solar zenith angles (>75∘) were minimally impacted. Measurements during hot days and small solar zenith angles had up to 1 DU contribution from POM-H Delrin parts (Figs. 8, 9, 10).
-
Pandora HCHO measurements derived from Pandora direct-sun observations between 2016 and 2019 cannot be used in the current form for any scientific conclusions about atmospheric HCHO. Results presented here most likely are representative of other Pandora instruments operational between 2016 and summer 2019.
Considering that Pandora head sensors have almost identical design from material, shape and thermodynamics point of view, measurements between 2016 and 2019 can be corrected based on (a) meteorological observations (temperature and wind) to estimate internal head sensor temperature and (b) on ΔS measurements to estimate HCHO production amplitude Spinei and Kocur (2021).
-
Multi-axis measurements had a minimal contribution (<0.01 DU) to ΔSHCHO due to the scan reference spectrum and the rest of the scan spectra collected within a short time period with a small difference in head sensor temperature (Fig. 11).
-
CINDI-2 instrument intercomparison data analysis (Kreher et al., 2020) is not representative of the final multi-axis data processing (leading to profile inversion described by Tirpitz et al., 2020) since the noon reference spectrum was used for DOAS fitting and no subsequent subtraction of the scan zenith was done. This resulted in higher internal head sensor contributions to ΔSHCHO that were intercompared with the other instruments (Figs. 12, 13).
All Pandora data are available from http://spinei2021.pandonia-global-network.org/ (Spinei and Tiefengraber, 2021).
ES has conceived the idea of the laboratory testing, performed laboratory data collection and analysis, and took the lead role in writing the manuscript. ES operated Pandora 148 during the TROLIX'19 campaign. MG and MM assured Pandora network data quality and data analysis from multiple instruments and edited the manuscript. MT and AC lead the pre-head-sensor HCHO discovery effort to identify HCHO inconsistency issues and edited the manuscript. AK and FS contributed to writing the introduction, manuscript editing, and manuscript logical flow improvements. NA provided custom modifications to the Pandora head sensor and worked closely with ES to ensure Pandora equipment availability. LV, JS, and AW participated in early problem identification and edited the manuscript. XZ, VF, and SCL operated and managed the Canadian Pandora network, which provided the early field evidence of the problem. RS worked closely with ES to ensure Pandora equipment availability for laboratory testing and participated in strategy development. All co-authors discussed the results.
The authors declare that they have no conflict of interest.
The authors thank the NASA Tropospheric Composition branch for providing Pandora instrumentation for testing; Michel Van Roozendael, at BIRA, for a suggestion to look into the plastic components used in the Pandora head sensor; Ankie Piters, at KNMI, for providing Pandora 118 for testing; Jeffrey Geddes for contributing Pandora 155 head sensor temperature data; Nabil Nowak, Yun Dong, and Nash Kocur, Virginia Tech graduate students, for helping with early testing of Pandora 148; and Jonathan Davies and Ihab Abboud, from the ECCC, for technical support with Pandora 108.
This paper was edited by Jochen Stutz and reviewed by two anonymous referees.
Alicke, B.: Impact of nitrous acid photolysis on the total hydroxyl radical budget during the Limitation of Oxidant Production/Pianura Padana Produzione di Ozono study in Milan, J. Geophys. Res., 107, 8196, https://doi.org/10.1029/2000JD000075, 2002. a
Cede, A.: Manual for Blick Software Suite 1.7, available at: https://www.pandonia-global-network.org/wp-content/uploads/2019/11/BlickSoftwareSuite_Manual_v1-7.pdf (last access: 18 January 2021), 2019. a, b
Chan, K. L., Wiegner, M., van Geffen, J., De Smedt, I., Alberti, C., Cheng, Z., Ye, S., and Wenig, M.: MAX-DOAS measurements of tropospheric NO2 and HCHO in Munich and the comparison to OMI and TROPOMI satellite observations, Atmos. Meas. Tech., 13, 4499–4520, https://doi.org/10.5194/amt-13-4499-2020, 2020. a
De Smedt, I., Müller, J.-F., Stavrakou, T., van der A, R., Eskes, H., and Van Roozendael, M.: Twelve years of global observations of formaldehyde in the troposphere using GOME and SCIAMACHY sensors, Atmos. Chem. Phys., 8, 4947–4963, https://doi.org/10.5194/acp-8-4947-2008, 2008. a
De Smedt, I., Van Roozendael, M., Stavrakou, T., Müller, J.-F., Lerot, C., Theys, N., Valks, P., Hao, N., and van der A, R.: Improved retrieval of global tropospheric formaldehyde columns from GOME-2/MetOp-A addressing noise reduction and instrumental degradation issues, Atmos. Meas. Tech., 5, 2933–2949, https://doi.org/10.5194/amt-5-2933-2012, 2012. a
De Smedt, I., Stavrakou, T., Hendrick, F., Danckaert, T., Vlemmix, T., Pinardi, G., Theys, N., Lerot, C., Gielen, C., Vigouroux, C., Hermans, C., Fayt, C., Veefkind, P., Müller, J.-F., and Van Roozendael, M.: Diurnal, seasonal and long-term variations of global formaldehyde columns inferred from combined OMI and GOME-2 observations, Atmos. Chem. Phys., 15, 12519–12545, https://doi.org/10.5194/acp-15-12519-2015, 2015. a, b
De Smedt, I., Theys, N., Yu, H., Danckaert, T., Lerot, C., Compernolle, S., Van Roozendael, M., Richter, A., Hilboll, A., Peters, E., Pedergnana, M., Loyola, D., Beirle, S., Wagner, T., Eskes, H., van Geffen, J., Boersma, K. F., and Veefkind, P.: Algorithm theoretical baseline for formaldehyde retrievals from S5P TROPOMI and from the QA4ECV project, Atmos. Meas. Tech., 11, 2395–2426, https://doi.org/10.5194/amt-11-2395-2018, 2018. a
Fleischmann, O. C., Hartmann, M., Burrows, J. P., and Orphal, J.: New ultraviolet absorption cross-sections of BrO at atmospheric temperatures measured by time-windowing Fourier transform spectroscopy, J. Photoch. Photobio. A, 168, 117–132, https://doi.org/10.1016/j.jphotochem.2004.03.026, 2004. a
Gilpin, T., Apel, E., Fried, A., Wert, B., Calvert, J., Genfa, Z., Dasgupta, P., Harder, J. W., Heikes, B., Hopkins, B., Westberg, H., Kleindienst, T., Lee, Y.-N., Zhou, X., Lonneman, W., and Sewell, S.: Intercomparison of six ambient [CH2O] measurement techniques, J. Geophys. Res.-Atmos., 102, 21161–21188, https://doi.org/10.1029/97JD01314, 1997. a
Grajales, E. J., Alarcón, E. A., and Villa, A. L.: Kinetics of depolymerization of paraformaldehyde obtained by thermogravimetric analysis, Thermochim. Acta, 609, 49–60, https://doi.org/10.1016/j.tca.2015.04.016, 2015. a
Gronoff, G., Robinson, J., Berkoff, T., Swap, R., Farris, B., Schroeder, J., Halliday, H. S., Knepp, T., Spinei, E., Carrion, W., Adcock, E. E., Johns, Z., Allen, D., and Pippin, M.: A method for quantifying near range point source induced O3 titration events using Co-located Lidar and Pandora measurements, Atmos. Environ., 204, 43–52, https://doi.org/10.1016/j.atmosenv.2019.01.052, 2019. a
Herman, J., Cede, A., Spinei, E., Mount, G., Tzortziou, M., and Abuhassan, N.: NO2 column amounts from ground-based Pandora and MFDOAS spectrometers using the direct-sun DOAS technique: Intercomparisons and application to OMI validation, J. Geophys. Res., 114, D13307, https://doi.org/10.1029/2009JD011848, 2009. a, b
Herman, J., Spinei, E., Fried, A., Kim, J., Kim, J., Kim, W., Cede, A., Abuhassan, N., and Segal-Rozenhaimer, M.: NO2 and HCHO measurements in Korea from 2012 to 2016 from Pandora spectrometer instruments compared with OMI retrievals and with aircraft measurements during the KORUS-AQ campaign, Atmos. Meas. Tech., 11, 4583–4603, https://doi.org/10.5194/amt-11-4583-2018, 2018. a, b, c, d
Herman, J., Abuhassan, N., Kim, J., Kim, J., Dubey, M., Raponi, M., and Tzortziou, M.: Underestimation of column NO2 amounts from the OMI satellite compared to diurnally varying ground-based retrievals from multiple PANDORA spectrometer instruments, Atmos. Meas. Tech., 12, 5593–5612, https://doi.org/10.5194/amt-12-5593-2019, 2019. a
Hewson, W., Bösch, H., Barkley, M. P., and De Smedt, I.: Characterisation of GOME-2 formaldehyde retrieval sensitivity, Atmos. Meas. Tech., 6, 371–386, https://doi.org/10.5194/amt-6-371-2013, 2013. a
Ho, M. H.: Generation of Standard Gaseous Formaldehyde in Test Atmospheres, in: Formaldehyde, edited by: Turoski, V., American Chemical Society, Washington, D.C., vol. 210, 193–214, https://doi.org/10.1021/ba-1985-0210.ch013, 1985. a, b
Kreher, K., Van Roozendael, M., Hendrick, F., Apituley, A., Dimitropoulou, E., Frieß, U., Richter, A., Wagner, T., Lampel, J., Abuhassan, N., Ang, L., Anguas, M., Bais, A., Benavent, N., Bösch, T., Bognar, K., Borovski, A., Bruchkouski, I., Cede, A., Chan, K. L., Donner, S., Drosoglou, T., Fayt, C., Finkenzeller, H., Garcia-Nieto, D., Gielen, C., Gómez-Martín, L., Hao, N., Henzing, B., Herman, J. R., Hermans, C., Hoque, S., Irie, H., Jin, J., Johnston, P., Khayyam Butt, J., Khokhar, F., Koenig, T. K., Kuhn, J., Kumar, V., Liu, C., Ma, J., Merlaud, A., Mishra, A. K., Müller, M., Navarro-Comas, M., Ostendorf, M., Pazmino, A., Peters, E., Pinardi, G., Pinharanda, M., Piters, A., Platt, U., Postylyakov, O., Prados-Roman, C., Puentedura, O., Querel, R., Saiz-Lopez, A., Schönhardt, A., Schreier, S. F., Seyler, A., Sinha, V., Spinei, E., Strong, K., Tack, F., Tian, X., Tiefengraber, M., Tirpitz, J.-L., van Gent, J., Volkamer, R., Vrekoussis, M., Wang, S., Wang, Z., Wenig, M., Wittrock, F., Xie, P. H., Xu, J., Yela, M., Zhang, C., and Zhao, X.: Intercomparison of NO2, O4, O3 and HCHO slant column measurements by MAX-DOAS and zenith-sky UV–visible spectrometers during CINDI-2, Atmos. Meas. Tech., 13, 2169–2208, https://doi.org/10.5194/amt-13-2169-2020, 2020. a, b, c, d, e, f
Kwon, H.-A., Park, R. J., González Abad, G., Chance, K., Kurosu, T. P., Kim, J., De Smedt, I., Van Roozendael, M., Peters, E., and Burrows, J.: Description of a formaldehyde retrieval algorithm for the Geostationary Environment Monitoring Spectrometer (GEMS), Atmos. Meas. Tech., 12, 3551–3571, https://doi.org/10.5194/amt-12-3551-2019, 2019. a
Liu, L., Andreani-Aksoyoglu, S., Keller, J., Ordóñez, C., Junkermann, W., Hak, C., Braathen, G. O., Reimann, S., Astorga-Llorens, C., Schultz, M., Prévôt, A. S. H., and Isaksen, I. S. A.: A photochemical modeling study of ozone and formaldehyde generation and budget in the Po basin, J. Geophys. Res., 112, D22303, https://doi.org/10.1029/2006JD008172, 2007. a
Luftl, S., P. M., V., and Sarathchandran, C. (Eds.): Polyoxymethylene handbook: structure, properties, applications and their nanocomposites, John Wiley & Sons, Scrivener Publishing, Hoboken, New Jersey, USA, Salem, MA, USA, 2014. a
Meller, R. and Moortgat, G. K.: Temperature dependence of the absorption cross sections of formaldehyde between 223 and 323 K in the wavelength range 225-375 nm, J. Geophys. Res.-Atmos., 105, 7089–7101, https://doi.org/10.1029/1999JD901074, 2000. a
Nowak, N., et al.: Pandora MAX-DOAS and in situ formaldehyde surfaceconcentration measurements during LISTOS 2018, in preparation, 2021. a
Park, J., Lee, H., Kim, J., Herman, J., Kim, W., Hong, H., Choi, W., Yang, J., and Kim, D.: Retrieval Accuracy of HCHO Vertical Column Density from Ground-Based Direct-Sun Measurement and First HCHO Column Measurement Using Pandora, Remote Sens., 10, 173–190, https://doi.org/10.3390/rs10020173, 2018. a, b, c
Pielichowska, K.: Thermooxidative degradation of polyoxymethylene homo- and copolymer nanocomposites with hydroxyapatite: Kinetic and thermoanalytical study, Thermochim. Acta, 600, 7–19, https://doi.org/10.1016/j.tca.2014.11.016, 2015. a
Pinardi, G., Van Roozendael, M., Abuhassan, N., Adams, C., Cede, A., Clémer, K., Fayt, C., Frieß, U., Gil, M., Herman, J., Hermans, C., Hendrick, F., Irie, H., Merlaud, A., Navarro Comas, M., Peters, E., Piters, A. J. M., Puentedura, O., Richter, A., Schönhardt, A., Shaiganfar, R., Spinei, E., Strong, K., Takashima, H., Vrekoussis, M., Wagner, T., Wittrock, F., and Yilmaz, S.: MAX-DOAS formaldehyde slant column measurements during CINDI: intercomparison and analysis improvement, Atmos. Meas. Tech., 6, 167–185, https://doi.org/10.5194/amt-6-167-2013, 2013. a
Pinardi, G., Van Roozendael, M., Hendrick, F., Theys, N., Abuhassan, N., Bais, A., Boersma, F., Cede, A., Chong, J., Donner, S., Drosoglou, T., Dzhola, A., Eskes, H., Frieß, U., Granville, J., Herman, J. R., Holla, R., Hovila, J., Irie, H., Kanaya, Y., Karagkiozidis, D., Kouremeti, N., Lambert, J.-C., Ma, J., Peters, E., Piters, A., Postylyakov, O., Richter, A., Remmers, J., Takashima, H., Tiefengraber, M., Valks, P., Vlemmix, T., Wagner, T., and Wittrock, F.: Validation of tropospheric NO2 column measurements of GOME-2A and OMI using MAX-DOAS and direct sun network observations, Atmos. Meas. Tech., 13, 6141–6174, https://doi.org/10.5194/amt-13-6141-2020, 2020. a, b, c
Reed, A. J., Thompson, A. M., Kollonige, D. E., Martins, D. K., Tzortziou, M. A., Herman, J. R., Berkoff, T. A., Abuhassan, N. K., and Cede, A.: Effects of local meteorology and aerosols on ozone and nitrogen dioxide retrievals from OMI and pandora spectrometers in Maryland, USA during DISCOVER-AQ 2011, J. Atmos. Chem., 72, 455–482, https://doi.org/10.1007/s10874-013-9254-9, 2015. a
Spinei, E. and Kocur, N.: Corrected direct sun Pandora formaldehyde column measurements 2016–2019: KORUS-AQ, OWLETS, LISTOS, in preparation, 2021. a, b
Spinei, E. and Tiefengraber, M.: Data used to demonstrate Effect of polyoxymethylene (POM-H Delrin) off-gassing within the Pandora head sensor on direct-sun and multi-axis formaldehyde column measurements in 2016–2019, available at: http://spinei2021.pandonia-global-network.org/, last access: 25 January 2021. a
Spinei, E., Carn, S. A., Krotkov, N. A., Mount, G. H., Yang, K., and Krueger, A.: Validation of ozone monitoring instrument SO 2 measurements in the Okmok volcanic cloud over Pullman, WA, July 2008, J. Geophys. Res., 115, D00L08, https://doi.org/10.1029/2009JD013492, 2010. a
Spinei, E., Whitehill, A., Fried, A., Tiefengraber, M., Knepp, T. N., Herndon, S., Herman, J. R., Müller, M., Abuhassan, N., Cede, A., Richter, D., Walega, J., Crawford, J., Szykman, J., Valin, L., Williams, D. J., Long, R., Swap, R. J., Lee, Y., Nowak, N., and Poche, B.: The first evaluation of formaldehyde column observations by improved Pandora spectrometers during the KORUS-AQ field study, Atmos. Meas. Tech., 11, 4943–4961, https://doi.org/10.5194/amt-11-4943-2018, 2018. a, b, c, d, e, f, g
Szykman, J., Swap, R., Leffer, B., Valin, L., Lee, S. C., Fioletov, V., Zhao, X., Davis, J., Williams, D., Abuhassan, N., Shalaby, L., Cede, A., Tiefengraber, M., Müller, M., Kotsakis, A., Santos, F., and Robinson, J.: Connecting in-situ and Satellite Monitoring in Support of the Canada – U.S. Air Quality Agreement, Environmental Managers magazine, Air & Waste Management Association, 1–7, available at: https://pubs.awma.org/flip/EM-June-2019/szykman.pdf (last access: 27 January 2021), 2019. a
Thalman, R. and Volkamer, R.: Temperature dependent absorption cross-sections of O2–O2 collision pairs between 340 and 630 nm and at atmospherically relevant pressure, Phys. Chem. Chem. Phys., 15, 15371–15381, https://doi.org/10.1039/c3cp50968k, 2013. a
Tirpitz, J.-L., Frieß, U., Hendrick, F., Alberti, C., Allaart, M., Apituley, A., Bais, A., Beirle, S., Berkhout, S., Bognar, K., Bösch, T., Bruchkouski, I., Cede, A., Chan, K. L., den Hoed, M., Donner, S., Drosoglou, T., Fayt, C., Friedrich, M. M., Frumau, A., Gast, L., Gielen, C., Gomez-Martín, L., Hao, N., Hensen, A., Henzing, B., Hermans, C., Jin, J., Kreher, K., Kuhn, J., Lampel, J., Li, A., Liu, C., Liu, H., Ma, J., Merlaud, A., Peters, E., Pinardi, G., Piters, A., Platt, U., Puentedura, O., Richter, A., Schmitt, S., Spinei, E., Stein Zweers, D., Strong, K., Swart, D., Tack, F., Tiefengraber, M., van der Hoff, R., van Roozendael, M., Vlemmix, T., Vonk, J., Wagner, T., Wang, Y., Wang, Z., Wenig, M., Wiegner, M., Wittrock, F., Xie, P., Xing, C., Xu, J., Yela, M., Zhang, C., and Zhao, X.: Intercomparison of MAX-DOAS vertical profile retrieval algorithms: studies on field data from the CINDI-2 campaign, Atmos. Meas. Tech. Discuss., https://doi.org/10.5194/amt-2019-456, in review, 2020. a, b
Vandaele, A., Hermans, C., Simon, P., Carleer, M., Colin, R., Fally, S., Mérienne, M., Jenouvrier, A., and Coquart, B.: Measurements of the NO2 absorption cross-section from 42 000 cm−1 to 10 000 cm−1 (238–1000 nm) at 220 K and 294 K, J. Quant. Spectrosc. Ra., 59, 171–184, https://doi.org/10.1016/S0022-4073(97)00168-4, 1998. a
Verhoelst, T., Compernolle, S., Pinardi, G., Lambert, J.-C., Eskes, H. J., Eichmann, K.-U., Fjæraa, A. M., Granville, J., Niemeijer, S., Cede, A., Tiefengraber, M., Hendrick, F., Pazmiño, A., Bais, A., Bazureau, A., Boersma, K. F., Bognar, K., Dehn, A., Donner, S., Elokhov, A., Gebetsberger, M., Goutail, F., Grutter de la Mora, M., Gruzdev, A., Gratsea, M., Hansen, G. H., Irie, H., Jepsen, N., Kanaya, Y., Karagkiozidis, D., Kivi, R., Kreher, K., Levelt, P. F., Liu, C., Müller, M., Navarro Comas, M., Piters, A. J. M., Pommereau, J.-P., Portafaix, T., Puentedura, O., Querel, R., Remmers, J., Richter, A., Rimmer, J., Rivera Cárdenas, C., Saavedra de Miguel, L., Sinyakov, V. P., Strong, K., Van Roozendael, M., Veefkind, J. P., Wagner, T., Wittrock, F., Yela González, M., and Zehner, C.: Ground-based validation of the Copernicus Sentinel-5p TROPOMI NO2 measurements with the NDACC ZSL-DOAS, MAX-DOAS and Pandonia global networks, Atmos. Meas. Tech. Discuss., https://doi.org/10.5194/amt-2020-119, in review, 2020. a, b
Vigouroux, C., Hendrick, F., Stavrakou, T., Dils, B., De Smedt, I., Hermans, C., Merlaud, A., Scolas, F., Senten, C., Vanhaelewyn, G., Fally, S., Carleer, M., Metzger, J.-M., Müller, J.-F., Van Roozendael, M., and De Mazière, M.: Ground-based FTIR and MAX-DOAS observations of formaldehyde at Réunion Island and comparisons with satellite and model data, Atmos. Chem. Phys., 9, 9523–9544, https://doi.org/10.5194/acp-9-9523-2009, 2009. a
Vigouroux, C., Bauer Aquino, C. A., Bauwens, M., Becker, C., Blumenstock, T., De Mazière, M., García, O., Grutter, M., Guarin, C., Hannigan, J., Hase, F., Jones, N., Kivi, R., Koshelev, D., Langerock, B., Lutsch, E., Makarova, M., Metzger, J.-M., Müller, J.-F., Notholt, J., Ortega, I., Palm, M., Paton-Walsh, C., Poberovskii, A., Rettinger, M., Robinson, J., Smale, D., Stavrakou, T., Stremme, W., Strong, K., Sussmann, R., Té, Y., and Toon, G.: NDACC harmonized formaldehyde time series from 21 FTIR stations covering a wide range of column abundances, Atmos. Meas. Tech., 11, 5049–5073, https://doi.org/10.5194/amt-11-5049-2018, 2018. a
Wang, Y., Beirle, S., Lampel, J., Koukouli, M., De Smedt, I., Theys, N., Li, A., Wu, D., Xie, P., Liu, C., Van Roozendael, M., Stavrakou, T., Müller, J.-F., and Wagner, T.: Validation of OMI, GOME-2A and GOME-2B tropospheric NO2, SO2 and HCHO products using MAX-DOAS observations from 2011 to 2014 in Wuxi, China: investigation of the effects of priori profiles and aerosols on the satellite products, Atmos. Chem. Phys., 17, 5007–5033, https://doi.org/10.5194/acp-17-5007-2017, 2017. a
Zhu, L., Jacob, D. J., Kim, P. S., Fisher, J. A., Yu, K., Travis, K. R., Mickley, L. J., Yantosca, R. M., Sulprizio, M. P., De Smedt, I., González Abad, G., Chance, K., Li, C., Ferrare, R., Fried, A., Hair, J. W., Hanisco, T. F., Richter, D., Jo Scarino, A., Walega, J., Weibring, P., and Wolfe, G. M.: Observing atmospheric formaldehyde (HCHO) from space: validation and intercomparison of six retrievals from four satellites (OMI, GOME2A, GOME2B, OMPS) with SEAC4RS aircraft observations over the southeast US, Atmos. Chem. Phys., 16, 13477–13490, https://doi.org/10.5194/acp-16-13477-2016, 2016. a, b
- Abstract
- Introduction
- Pandora HCHO measurements
- Laboratory studies: HCHO columns as a function of Pandora head sensor internal temperature
- Laboratory studies results
- Effect of internally generated HCHO on direct-sun and multi-axis Pandora HCHO measurements.
- Conclusions
- Data availability
- Author contributions
- Competing interests
- Acknowledgements
- Review statement
- References