the Creative Commons Attribution 4.0 License.
the Creative Commons Attribution 4.0 License.
 | 20 Oct 2021
Estimates of mass absorption cross sections of black carbon for filter-based absorption photometers in the Arctic
Tatsuhiro Mori
Yutaka Kondo
Sangeeta Sharma
Antti Hyvärinen
Elisabeth Andrews
Peter Tunved
Eija Asmi
John Backman
Henri Servomaa
Daniel Veber
Konstantinos Eleftheriadis
Stergios Vratolis
Radovan Krejci
Paul Zieger
Makoto Koike
Yugo Kanaya
Atsushi Yoshida
Nobuhiro Moteki
Yongjing Zhao
Yutaka Tobo
Junji Matsushita
Naga Oshima
Long-term measurements of atmospheric mass concentrations of black carbon (BC) are needed to investigate changes in its emission, transport, and deposition. However, depending on instrumentation, parameters related to BC such as aerosol absorption coefficient (babs) have been measured instead. Most ground-based measurements of babs in the Arctic have been made by filter-based absorption photometers, including particle soot absorption photometers (PSAPs), continuous light absorption photometers (CLAPs), Aethalometers, and multi-angle absorption photometers (MAAPs). The measured babs can be converted to mass concentrations of BC (MBC) by assuming the value of the mass absorption cross section (MAC; MBC= MAC). However, the accuracy of conversion of babs to MBC has not been adequately assessed. Here, we introduce a systematic method for deriving MAC values from babs measured by these instruments and independently measured MBC. In this method, MBC was measured with a filter-based absorption photometer with a heated inlet (COSMOS). COSMOS-derived MBC (MBC (COSMOS)) is traceable to a rigorously calibrated single particle soot photometer (SP2), and the absolute accuracy of MBC (COSMOS) has been demonstrated previously to be about 15 % in Asia and the Arctic. The necessary conditions for application of this method are a high correlation of the measured babs with independently measured MBC and long-term stability of the regression slope, which is denoted as MACcor (MAC derived from the correlation). In general, babs–MBC (COSMOS) correlations were high (r2= 0.76–0.95 for hourly data) at Alert in Canada, Ny-Ålesund in Svalbard, Barrow (NOAA Barrow Observatory) in Alaska, Pallastunturi in Finland, and Fukue in Japan and stable for up to 10 years. We successfully estimated MACcor values (10.8–15.1 m2 g−1 at a wavelength of 550 nm for hourly data) for these instruments, and these MACcor values can be used to obtain error-constrained estimates of MBC from babs measured at these sites even in the past, when COSMOS measurements were not made. Because the absolute values of MBC at these Arctic sites estimated by this method are consistent with each other, they are applicable to the study of spatial and temporal variation in MBC in the Arctic and to evaluation of the performance of numerical model calculations.
- Article
(7776 KB) - Full-text XML
-
Supplement
(5418 KB) - BibTeX
- EndNote


Black carbon (BC) aerosols strongly absorb solar radiation and thereby impact the radiation budget in the Arctic (Bond et al., 2013; AMAP, 2015). In addition, BC deposited on snow decreases the snow surface albedo and accelerates snowmelt (AMAP, 2015; Flanner et al., 2009). According to recent climate model calculations in the sixth phase of the Coupled Model Intercomparison Project (CMIP6; Eyring et al., 2016), BC contributes the second largest positive radiative forcing in the Arctic, after carbon dioxide (CO2) (Oshima et al., 2020). BC is one of the short-lived climate forcers (SLCFs), and reductions of BC emissions can decrease the positive Arctic radiative forcing over much shorter timescales than reductions of CO2 emissions can (Sand et al., 2016). Long-term measurements of mass concentrations of BC in the atmosphere (MBC [µg m−3]) at various locations provide fundamental data for the detection of long-term trends in MBC in the Arctic that are associated with changes in BC emissions. Such MBC data are also useful for validation and improvement of climate models. However, because many long-term surface instruments measure aerosol light absorption coefficient (babs [Mm−1]) rather than MBC, there are large uncertainties in MBC estimated from the measurements of babs; these uncertainties have not been critically evaluated.
A continuous soot monitoring system called COSMOS (Kanomax, Osaka, Japan) has been developed to measure MBC (Miyazaki et al., 2008; Kondo et al., 2009, 2011). This filter-based absorption photometer is equipped with an inlet that is heated to 300 ∘C to remove non-refractory components from the aerosol phase. COSMOS MBC values (MBC (COSMOS)) have been compared with those measured by a single particle soot photometer (SP2; Droplet Measurement Technologies, Longmont, CO, USA; MBC (SP2)), which is based on a laser-induced incandescence technique (Schwarz et al., 2006; Moteki and Kondo, 2010); simultaneous measurements in Asia and at Ny-Ålesund in Svalbard have shown that MBC (SP2) and MBC (COSMOS) agree to within about 10 % (Kondo et al., 2009, 2011; Ohata et al., 2019).
Long-term measurements of babs at various sites have been carried out by other types of filter-based absorption photometers, including the particle absorption soot photometer (PSAP; Radiance Research, Seattle, WA, USA), the continuous light absorption photometer (CLAP; NOAA, Boulder, CO, USA; Ogren et al., 2017), the Aethalometer (Magee Scientific, Berkeley, CA, USA), and the multi-angle absorption photometer (MAAP; Thermo Scientific, Waltham, MA, USA) (e.g., Schmeisser et al., 2018). Measurements of light-absorbing and light-scattering properties of aerosols are important for constraining their interannual and seasonal variability, potential particle sources, and resulting aerosol–radiation interactions in the Earth system (Schmeisser et al., 2018; Bellouin et al., 2020). However, the accuracy and stability of conversion of babs obtained by these instruments to MBC have not yet been fully evaluated, mainly because of a lack of simultaneous and reliable long-term MBC measurements. The relationship between babs obtained by these instruments and MBC is complicated by complex contributions from mixing states of BC (i.e., lensing effect by BC-coating materials; Bond et al., 2006: Lack et al., 2008), other co-existing light-absorbing aerosols such as brown carbon and mineral dust, and measurement artifacts by light-scattering aerosols on filters (Bond et al., 1999). Evaluations that have been completed to date include those of Kanaya et al. (2013, 2020), who compared MBC (COSMOS) with the babs measured by MAAP (babs (MAAP)) on Fukue Island, Japan, and Sinha et al. (2017), who compared babs measured by PSAP (babs (PSAP)) at NOAA Barrow Observatory near Utqiaġvik, Alaska and Ny-Ålesund (Zeppelin station), Svalbard. The results of these studies showed that babs (MAAP) and babs (PSAP) were strongly correlated with MBC (COSMOS), making it possible to convert babs to MBC at these sites with reasonable accuracy. Long-term observations of babs have also been made in the Arctic: Alert in Canada by PSAP and Aethalometer (Sharma et al., 2004, 2006, 2017), Ny-Ålesund by Aethalometer (Eleftheriadis et al., 2009) and MAAP, and Pallastunturi in Finland by MAAP (Hyvärinen et al., 2011; Lihavainen et al., 2015). To investigate the possibility of converting babs to MBC at each of these sites, it is important to simultaneously measure MBC and babs by collocating a COSMOS (or SP2) at each site with each of these filter-based absorption photometer instruments.
The conversion of babs obtained by these instruments to MBC can be made by assuming a reasonable conversion factor, i.e, the value of mass absorption cross section (MAC [m2 g−1]; MBC= babs/MAC). The MAC values can depend on location because the spatiotemporal variations in microphysical properties of BC (i.e., mixing states and size distributions) and properties of co-existing light-absorbing and light-scattering aerosols will affect babs measurements. The plausible MAC values for conversion can also depend on the type of instrument because each instrument uses a different wavelength or wavelengths and adopts various correction methods for quantifying babs. Despite several intercomparisons and field experiments (Asmi et al., 2021) as well as thorough assessment of these techniques (Lack et al., 2008; Moosmüller et al., 2009), the simultaneous changes in aerosol source region, mixing state, concentration, and particle optical size are reflected in the instruments' response in a complex way and with a variable level of uncertainty.
In general, the MAC of BC, here simply denoted as “MACBC” for both bare and internally mixed BC, is a fundamental optical parameter that relates MBC with babs of BC (babs,BC) in climate models (i.e., × MACBC). Bond and Bergstrom (2006) reported the MACBC value of 7.5 m2 g−1 at a wavelength of 550 nm for combusted fresh BC. Cho et al. (2021) estimated MACBC values of 6–12 m2 g−1 at 550 nm in the Asian outflow using aircraft-based SP2 data and Mie theory. Yuan et al. (2021) showed that the MACBC values at 870 nm at a rural site in Germany clearly increased as the coating thickness of BC increased.
However, in this paper we focus on the MAC values mainly from the viewpoint of a conversion factor to obtain error-constrained MBC from the babs measurements by the filter-based absorption photometers because such MBC data will be the observational base for understanding long-term trends and spatial distributions of BC in the Arctic. Detailed investigations of the accuracy of the absolute values of babs measured at each site are beyond the scope of this study.
We critically re-examine the concepts underpinning the use of filter-based instruments to estimate MBC. We derive MAC values for PSAP–CLAP, Aethalometer, and MAAP measurements based on their comparison with COSMOS measurements at the four abovementioned Arctic sites (Alert, Ny-Ålesund, Barrow, and Pallastunturi) and one East Asian site (Fukue). The variability of the derived MAC values and their dependencies on observation site and instrument type are analyzed. We also compare MBC values measured by COSMOS and SP2 at Alert and Fukue to confirm their agreement under different environmental conditions.
2.1 Observation sites
Measurements of babs by the various types of filter-based absorption photometers were compared with measurements of MBC by COSMOS at Arctic sites Alert in Canada (82.5∘ N, 62.5∘ W; Sharma et al., 2017), Ny-Ålesund (Zeppelin station) in Svalbard (78.9∘ N, 11.9∘ E; Sinha et al., 2017), Barrow (NOAA Barrow Observatory) in Alaska (71.3∘ N, 156.6∘ W; Sinha et al., 2017), and Pallastunturi (Pallas, hereafter) in Finland (68.0∘ N, 24.0∘ E; Hyvärinen et al., 2011), as summarized in Table 1 and Fig. 1. Along with these sites, comparisons were also made at a remote site on Fukue Island (32.8∘ N, 128.7∘ E; Kanaya et al., 2020) in Japan, where air masses from the Asian continent are occasionally transported to the site and properties of aerosols should be distinctly different from those at the Arctic sites. Instruments used at each site are listed in Table 1 and described in the following section. Note that measurements at NOAA Barrow Observatory near Utqiaġvik are referred to as measurements at Barrow, using the name of the measurement site hereafter.
Table 1Observation sites, periods, and instruments used in this study.
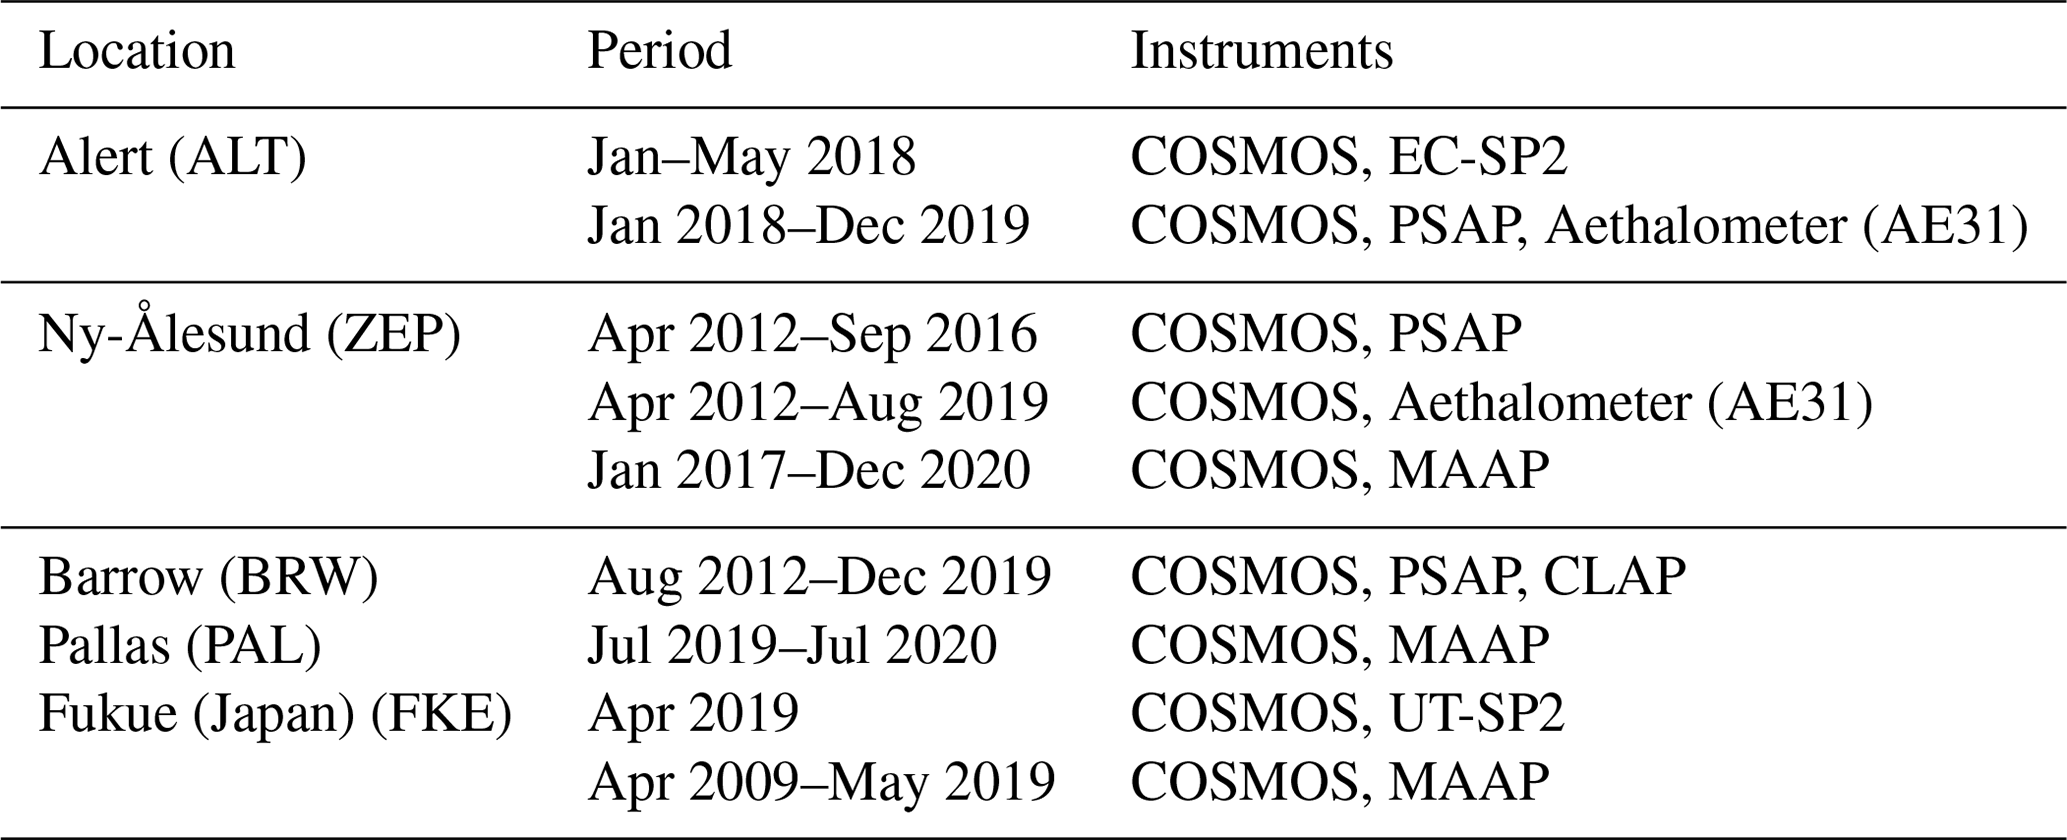

Figure 1Locations of the Arctic sites where MBC and babs were measured for this study.
2.2 Instruments
2.2.1 SP2
In this study we used the SP2 and COSMOS as standard instruments to measure MBC. Detailed descriptions of the SP2, including calibration methods, are given elsewhere (Schwarz et al., 2006; Moteki and Kondo, 2010). Briefly, the SP2 uses the laser-induced incandescence technique and detects BC on a single-particle basis. We used two SP2s in this study: the one installed at Fukue was maintained and calibrated by the University of Tokyo (UT-SP2, hereafter), and the other one at Alert was maintained and calibrated by Environmental and Climate Change Canada (EC-SP2, hereafter). The configuration of the UT-SP2 is identical to that described by Moteki and Kondo (2010). The model designation of the EC-SP2 was “SP2-D” with eight channels. The UT-SP2 and EC-SP2 measured BC size distributions in the mass-equivalent diameter (Dm) range 70–850 and 60–600 nm, respectively. The void-free density of BC was assumed to be 1.8 g cm−3. These SP2s were calibrated using fullerene soot particles (Alfa Aesar, stock no. 40971, lot no. FS12S011; Moteki and Kondo, 2010; Kondo et al., 2011). The laser-induced incandescence signal intensity of the UT-SP2 for the specific mass of ambient BC particles in Tokyo agrees with that of fullerene soot particles to within about 10 % (Kondo et al., 2011). Laborde et al. (2012) reported similar SP2 calibration curves for fullerene soot particles, diesel exhaust, and ambient BC particles in Switzerland. The accuracy of MBC (SP2) estimated from the uncertainty of the calibration and operational conditions of SP2 was about 10 %. No particle size cut was used for the inlet of the UT-SP2, whereas a PM1 cyclone was used for the EC-SP2.
2.2.2 COSMOS
Measurements of MBC by COSMOS
The principles of operation of the COSMOS apparatus are detailed in previous papers (Miyazaki et al., 2008; Kondo et al., 2011; Kondo, 2015; Ohata et al., 2019). Briefly, the COSMOS measures the attenuation coefficient (b0) of aerosols collected on a quartz-fiber filter at a given wavelength (λ= 565 nm). Most previous studies used filters from Pallflex (E70-2075W, Pall, Port Washington, NY, USA), which are no longer available. Consequently, high-efficiency particulate air (HEPA) filters (L-371M) have been used for more recent observations (Irwin et al., 2015), including this study. An important difference between the COSMOS and the other types of filter-based absorption photometer is that the inlet of the COSMOS is heated to 300 ∘C to remove volatile light-scattering particles (LSPs) and coatings of BC from the aerosol phase. Therefore, the effect on b0 of co-existing volatile components externally or internally mixed with BC particles can be ignored. The COSMOS is equipped with a PM1 cyclone to minimize the effect in coarse mode of refractory non-BC particles, such as dust and sea-salt particles. Consequently, the absorption coefficient for the COSMOS is given as
Here, ffil is a factor used to correct for the increase in absorption caused by multiple scattering in the filter medium. It is given by
where Tr is the filter transmission and B is a scaling factor (Bond et al., 1999; Ogren, 2010; Ohata et al., 2019). The MAC for the COSMOS [m2 g−1] is operationally defined as
where the numerator and denominator, respectively, are simultaneous measurements of babs [Mm−1] by COSMOS and MBC [µg m−3] by SP2 for ambient air. The MAC value for a Pallflex filter at λ= 565 nm was previously set at 8.73 [m2 g−1] with B= 1.397 (Sinha et al., 2017). For a HEPA filter, the value of B is about 6 % lower (Irwin et al., 2015). Depending on the filters used (Pallflex or HEPA), the appropriate B value was used in this study.
Once the MAC (COSMOS, SP2) is determined, MBC (COSMOS) [g m−3] at standard temperature and pressure (0 ∘C, 1013 hPa) can be estimated as
One particular purpose of the heating of sampled air to 300 ∘C is to make the MAC (COSMOS, SP2) stable and independent of original mixing states of BC particles. In other words, the heating treatment makes babs (COSMOS) more proportional to BC mass concentrations, compared to the other filter-based absorption photometers described in Sect. 2.2.3. As a consequence, unlike the other filter-based absorption photometers, the absorption coefficient of unheated original aerosols is not provided by COSMOS. Thus, COSMOS has been developed to measure MBC, not babs. In this sense, MBC (COSMOS) is different from “equivalent” BC mass concentrations estimated from the unheated babs measurements (Petzold et al., 2013).
We call the COSMOS that was calibrated by comparison with the SP2 in Tokyo the “standard COSMOS”, described hereafter as Std-COSMOS. Because the MAC of the Std-COSMOS was determined by comparison with SP2 (Eq. 2), it acts as a transfer standard for the SP2. The babs (COSMOS) of each COSMOS manufactured is compared with the Std-COSMOS by sampling ambient BC particles in Osaka, Japan, typically for 1–2 weeks. The comparisons during these periods were statistically reliable partly due to relatively high BC concentrations in Osaka. The babs (COSMOS) of 28 COSMOS instruments manufactured thus far agrees with that of Std-COSMOS to within about ± 7 %, indicating reliable quality control in manufacturing. The small differences originating from the uncertainty of the filter sampling spot size of each unit are corrected for in deriving MBC (COSMOS).
It is important to compare MBC (COSMOS) and MBC (SP2) outside Tokyo and Osaka, to confirm both the strong correlation between MBC (COSMOS) and MBC (SP2) and the long-term stability of the MAC (COSMOS) value. Ohata et al. (2019) made these comparisons at two remote sites: at Cape Hedo (26.9∘ N, 128.3∘ E), Japan, and at Ny-Ålesund. At each of these locations, the concentrations of BC and LSP and the mixing states of BC were considerably different from those in Tokyo and Osaka. MBC (COSMOS) and MBC (SP2) agree to within about 10 % at these sites, thus demonstrating the validity of using the Std-COSMOS to calibrate each of the COSMOS instruments to be used for field observations. Ohata et al. (2019) also showed that the dependencies of MAC (COSMOS) on the thickness of coatings of BC particles, MBC, and volume concentrations of the co-existing LSPs were small. Although the MAC (COSMOS) showed a slight dependence on the mass size distributions of BC, the sensitivity of the MAC (COSMOS) to such variations in microphysical properties of BC was generally less than 10 % (Kondo et al., 2011; Ohata et al., 2019).
Previously estimated uncertainties of MBC (COSMOS) were about 10 % based on the range of agreement between MBC measurements by COSMOS and UT-SP2 (Kondo et al., 2011; Ohata et al., 2019). It may be more appropriate to estimate the absolute accuracy of MBC (COSMOS) to be about 15 %, including the abovementioned 10 % uncertainty of MBC (SP2). This 15 % uncertainty also covers the range of agreement between MBC (COSMOS) and MBC (SP2) previously reported by other groups at Ny-Ålesund (Zanatta et al., 2018) and at Fukue (Miyakawa et al., 2017).
Although we used the SP2 and COSMOS as standard instruments to measure MBC in this study, thermal–optical analysis, which quantifies elemental carbon (EC) mass concentrations (MEC), has also been a traditional standard method to measure BC. Measurements of MEC can depend on the temperature protocol and optical charring correction method used (e.g., Bond et al., 2013). Agreements within 10 % of MBC (SP2), MBC (COSMOS), and MEC were reported by Kondo et al. (2011), whereas systematic differences between MBC (SP2) and MEC up to a factor of 2 were found by Pileci et al. (2021). Although the difference between MBC (COSMOS) and MEC was generally lower than 5 ng m−3 at the Arctic site Barrow (Sinha et al., 2017), this difference can be important for pristine summer Arctic conditions (MBC (COSMOS) <20 ng m−3). Considering these previously reported agreements and discrepancies between MBC (SP2 or COSMOS) and MEC, in some cases the MAC values determined by babs and MBC measurements (this study) can differ from those determined by babs and MEC measurements (Zanatta et al., 2016).
Effect of light-absorbing FeOx particles on MBC (COSMOS)
Light-absorbing iron oxide (FeOx) aerosols such as magnetite, which the SP2 can distinguish from BC (Yoshida et al., 2016; Lamb, 2019), can affect MBC measured by filter-based absorption photometers. FeOx aerosols are emitted from both anthropogenic sources (e.g., motor vehicle exhaust) and natural sources (e.g., windblown mineral dust). Within the detectable diameter range of the UT-SP2 (Dm= 70–850 nm for BC and Dm = 170–2100 nm for FeOx), the mass concentration ratios of FeOx to BC were typically ∼ 0.4 in East Asia and ∼ 0.2 in the Arctic; they were mainly of anthropogenic origin in the form of aggregated magnetite nanoparticles in both regions (Moteki et al., 2017; Ohata et al., 2018; Yoshida et al., 2018, 2020). FeOx aerosols contribute at least 4 %–7 % of the short-wave absorbing powers of BC in Asian continental outflows (Moteki et al., 2017), and their direct radiative forcing has been estimated to be 0.22 W m−2 over East Asia (Matsui et al., 2018). Here, we estimate the effect of light absorption by FeOx on MBC measured by the COSMOS. The ratio of light absorbed by FeOx to that absorbed by BC at a wavelength λ (ε(λ)) is given by
where Dm is mass-equivalent diameter of bare BC or FeOx; DL and DU are the lower and upper limits, respectively, of the diameter for the integral calculus; d dlogDm and d dlogDm are the mass size distributions of BC and FeOx, respectively; and MACMie_BC (Dm, λ) and MACMie_FeOx (Dm, λ) are the MAC values of bare BC and FeOx, respectively, for Dm and λ calculated by Mie theory.
The mass size distributions of BC and FeOx at Fukue and Ny-Ålesund (Fig. 2) were obtained by fitting monomodal and bimodal lognormal functions to the average mass size distributions measured by the SP2 during each observation campaign (Yoshida et al., 2020). The measurements at Fukue were made in April 2019 and those at Ny-Ålesund in March 2017. The MACMie_BC (Dm, λ) and MACMie_FeOx (Dm, λ) data (Fig. 2) were calculated by Mie theory for λ= 565 nm (wavelength used for COSMOS). For this calculation, we assumed BC and FeOx to be in the form of bare spheres with void-free densities of 1.80 g cm−3 and 5.17 g cm−3, respectively. The refractive index of BC we used was 1.99 + 0.64i, which is the value for BC at λ= 600 nm (Bergstrom, 1972). The refractive index of FeOx we used was 2.56 + 0.57i, which is the value for magnetite at λ= 600 nm (Huffman and Stapp, 1973).

Figure 2Mass size distributions of BC (black line) and FeOx (red line) and mass absorption cross sections calculated by Mie theory for bare BC (black dashed line) and bare FeOx (red dashed line) at (a) Fukue in April 2019 and (b) Ny-Ålesund in March 2017. Dm is the mass-equivalent diameter of bare BC or FeOx. Assumptions for the Mie calculations are given in Sect. 2.
From Eq. (4), the ε values at Fukue and Ny-Ålesund were calculated to be 3.6 % and 1.9 %, respectively, for (DL, DU)= (30, 1000 nm). These ε values became 4.6 % and 2.6 % for (DL, DU)= (30, 2500 nm). Because COSMOS is equipped with a PM1 cyclone, we estimated the effect of light absorption by FeOx on MBC measured by COSMOS to be <4 % in East Asia and <2 % in the Arctic. Note that these estimates are upper limits of the effect of FeOx because the PM1 cyclone is designed to remove particles of >1 µm aerodynamic diameter (Da). Due to the fractal shape and high density of FeOx particles (Moteki et al., 2017), Dm is considerably smaller than Da for FeOx particles, and thus DU in Eq. (4) should be less than 1 µm.
The effect of FeOx on MBC (COSMOS) should be even smaller considering that the mass concentration of anthropogenic FeOx is correlated with MBC, as mentioned above. Even if babs (COSMOS) is enhanced by FeOx by a few percent, this effect is already incorporated to some extent, by operationally defining MAC (COSMOS, SP2) by Eq. (2).
The effect of FeOx on babs may be somewhat higher for the other filter-based absorption photometers than for COSMOS if they are equipped with a larger particle size cut (PM2.5 or PM10). For accurate measurements of MBC, the use of a PM1 cyclone or impactor is recommended to minimize the effects of FeOx, as well as other refractory particles such as natural dust and sea-salt particles.
2.2.3 Filter-based absorption photometers other than COSMOS
PSAP and CLAP
The principle of operation of the PSAP is similar to those of COSMOS (Bond et al., 1999; Sinha et al., 2017). In this study, we also used babs data obtained with a CLAP (Ogren et al., 2017). The CLAP is conceptually similar to the PSAP but uses solenoid valves to cycle through eight sample filter spots. The PSAP and CLAP both utilize the Pallflex filters. The unit-to-unit variations in the PSAP and CLAP were reported to be within 6 % (Bond et al.,1999) and 4 % (Ogren et al., 2017), respectively. The wavelengths of the light absorption measured by either PSAP or CLAP at Barrow, Ny-Ålesund, and Alert were about 467, 530, and 660 nm. The major difference of PSAP and CLAP from COSMOS is that the sample air inlets of PSAP and CLAP are not heated to 300 ∘C. Therefore, the effect of the attenuation of light by LSPs is corrected for by using the aerosol light-scattering coefficient simultaneously measured by an integrating nephelometer (Bond et al., 1999; Ogren, 2010). This correction adjusts for measurement artifacts but introduces uncertainties in the estimate of babs (PSAP or CLAP). At the above three sites, light-scattering coefficients measured by nephelometers at wavelengths of 450, 550, and 700 nm were used for this correction. The babs for the PSAP or CLAP (hereafter, babs (PSAP–CLAP)) at λ= 550 nm was obtained by adjusting measured absorption at 530 to 550 nm by using the λ−1 relationship (Sinha et al., 2017; Sharma et al., 2017). Schmeisser et al. (2017) reported that the median value of the absorption Ångström exponent at Arctic sites was 1.04, which supports our assumption of the λ−1 relationship. The accuracy of the babs measured by PSAP ranges between 20 % and 30 % (Bond et al., 2013). Note that a custom-built PSAP (Krecl et al., 2007) was used at Ny-Ålesund, and commercial ones were used at Alert and Barrow.
Aethalometer
An AE-31 Aethalometer (Hansen et al., 1984) has been used for measurements of babs at Alert without any particle size cut (Sharma et al., 2017). This Aethalometer measures the attenuation (ATN) of light transmitted through particles accumulating on a quartz fiber filter at seven wavelengths (370, 470, 520, 590, 660, 880, and 950 nm). In deriving babs (Aethalometer) from ATN data, the correction factor Cf= 3.45 (Backman et al., 2017) was applied. This correction factor is very close to the correction factor C0= 3.5 recommended by the World Meteorological Organization/Global Atmosphere Watch (WMO/GAW, 2016). The uncertainty of C0 is approximately 25 % (WMO/GAW, 2016).
Another AE-31 Aethalometer has also been used at Ny-Ålesund (Zeppelin station) (Eleftheriadis et al., 2009), where the sampling inlet was equipped with a calculated PM10 size cut. Data post-processing included flagging based on Zeppelin station logs, Ny-Ålesund harbor logs, and diagnostics reported by the instrument (flow rate, raw attenuation, zero signal, etc). A correction factor C0= 3.5 was used to compensate for the multiple-scattering effect.
The filter loading effect is not significant for Arctic aerosol, as reported by Backman et al. (2017). For Alert, the slope of the correction factor Cf to ATN is k = 0.00074, indicating a 5 % difference at an ATN value of 80. For Zeppelin, the loading effect causes a 2 % difference in Cf at an attenuation value of 80. These uncertainties are considered small compared to the overall babs uncertainty, which is 20 %–30 % (Bond et al., 2013). Therefore, the loading correction is not applied to the AE31 measurements. Corrections for light scattering by using nephelometer data were also not applied. One of the manufacturer's suggested values of MAC (Aethalometer) is given by (λ [nm] ×C0) [m2 g−1], which corresponds to 7.1 m2 g−1 for λ = 590 nm and C0= 3.5.
MAAP
Detailed descriptions of the MAAP are given elsewhere (Petzold et al., 2002, 2005; Petzold and Schönlinner, 2004; Kanaya et al., 2013). In brief, the MAAP monitors the transmittance of light through a glass-fiber tape and measures reflectance at two angles. To remove the influence of LSPs, babs (MAAP) from particles deposited on the filter is derived by radiative transfer calculations. The uncertainty of babs (MAAP) was estimated by Petzold and Schönlinner (2004) to be 12 %. The unit-to-unit variation in the MAAP was reported to be within 5 % (Müller et al., 2011). The MAC values for the MAAP (MAC (MAAP)) for λ= 637 nm were determined by comparing babs (MAAP) and MBC measured at four sites in Germany by the German reference method VDI2465 Part 1 (GRM; Schmid et al., 2001), represented by
For the measurements of MBC (GRM), organic carbon was removed by solvent extraction and the residual BC particles on the filters were oxidized to CO2 and quantified by coulometric titration. The measurement uncertainty of MBC (GRM) was about 25 % (Petzold and Schönlinner, 2004). The MAC of 6.6 m2 g−1 is the default setting by the manufacturer based on their study. In determining MAC (MAAP, GRM), an SP2 was not used to measure MBC, and this is a potential source of discrepancy in this value of MAC, as discussed in Sect. 3.4.1 and 3.5.2. A correction factor of 1.05 due to the wavelength shift from the nominal value (Müller et al., 2011) was applied in this study. Note that the measured peak wavelength of the light source of the MAAP at Fukue was 639 nm (Kanaya et al., 2013), which is very slightly different from the previously reported value (637 nm; Müller et al., 2011).
3.1 Alert
3.1.1 COSMOS–SP2 comparison
Long-term measurements of BC using different model versions of SP2s have been conducted at Alert since 2011 (Sharma et al., 2017). In this study, we used the data obtained by an EC-SP2 (model “SP2-D” with eight channels; see Sect. 2.2.1) from January to May 2018 for comparison with the COSMOS data. The EC-SP2 and COSMOS aspired sample air from a common inlet with a PM1 size cut. Figure 3a shows the number and mass size distributions of BC averaged over the observation period. The mode diameter of the average mass size distribution of BC was ∼ 210 nm in mass-equivalent diameter, which is similar to that previously reported at Alert (Sharma et al., 2017) and to that observed by aircraft-based measurements over Alert (Schulz et al., 2019). Because the upper limit of the detectable diameter range of BC was ∼ 600 nm for the EC-SP2, we have estimated MBC (SP2) over the range up to 1000 nm by fitting lognormal functions to the measured mass size distributions. The time series of hourly values of MBC (COSMOS) and MBC (SP2) (Fig. 3b) were strongly correlated (r2= 0.92; r2 is the square of the correlation coefficient), and the slope of the regression forced through the origin was 1.02 (Fig. 3c). Based on the slope value of the regression for all MBC ranges observed, the agreement between MBC (COSMOS) and MBC (SP2) at Alert was generally within 10 %. The degree of agreement between MBC (COSMOS) and MBC (SP2) was also examined on a logarithmic scale in Fig. S1a in the Supplement. When MBC (SP2) is relatively low (MBC <10 ng m−3), which corresponds to the monthly-averaged MBC ranges in summer at Arctic sites (Sinha et al., 2017), MBC (COSMOS) tended to be higher than MBC (SP2) by about 1–2 ng m−3. This small absolute difference is consistent with the previously reported difference between MBC (COSMOS) and MEC at Barrow (Sinha et al., 2017).
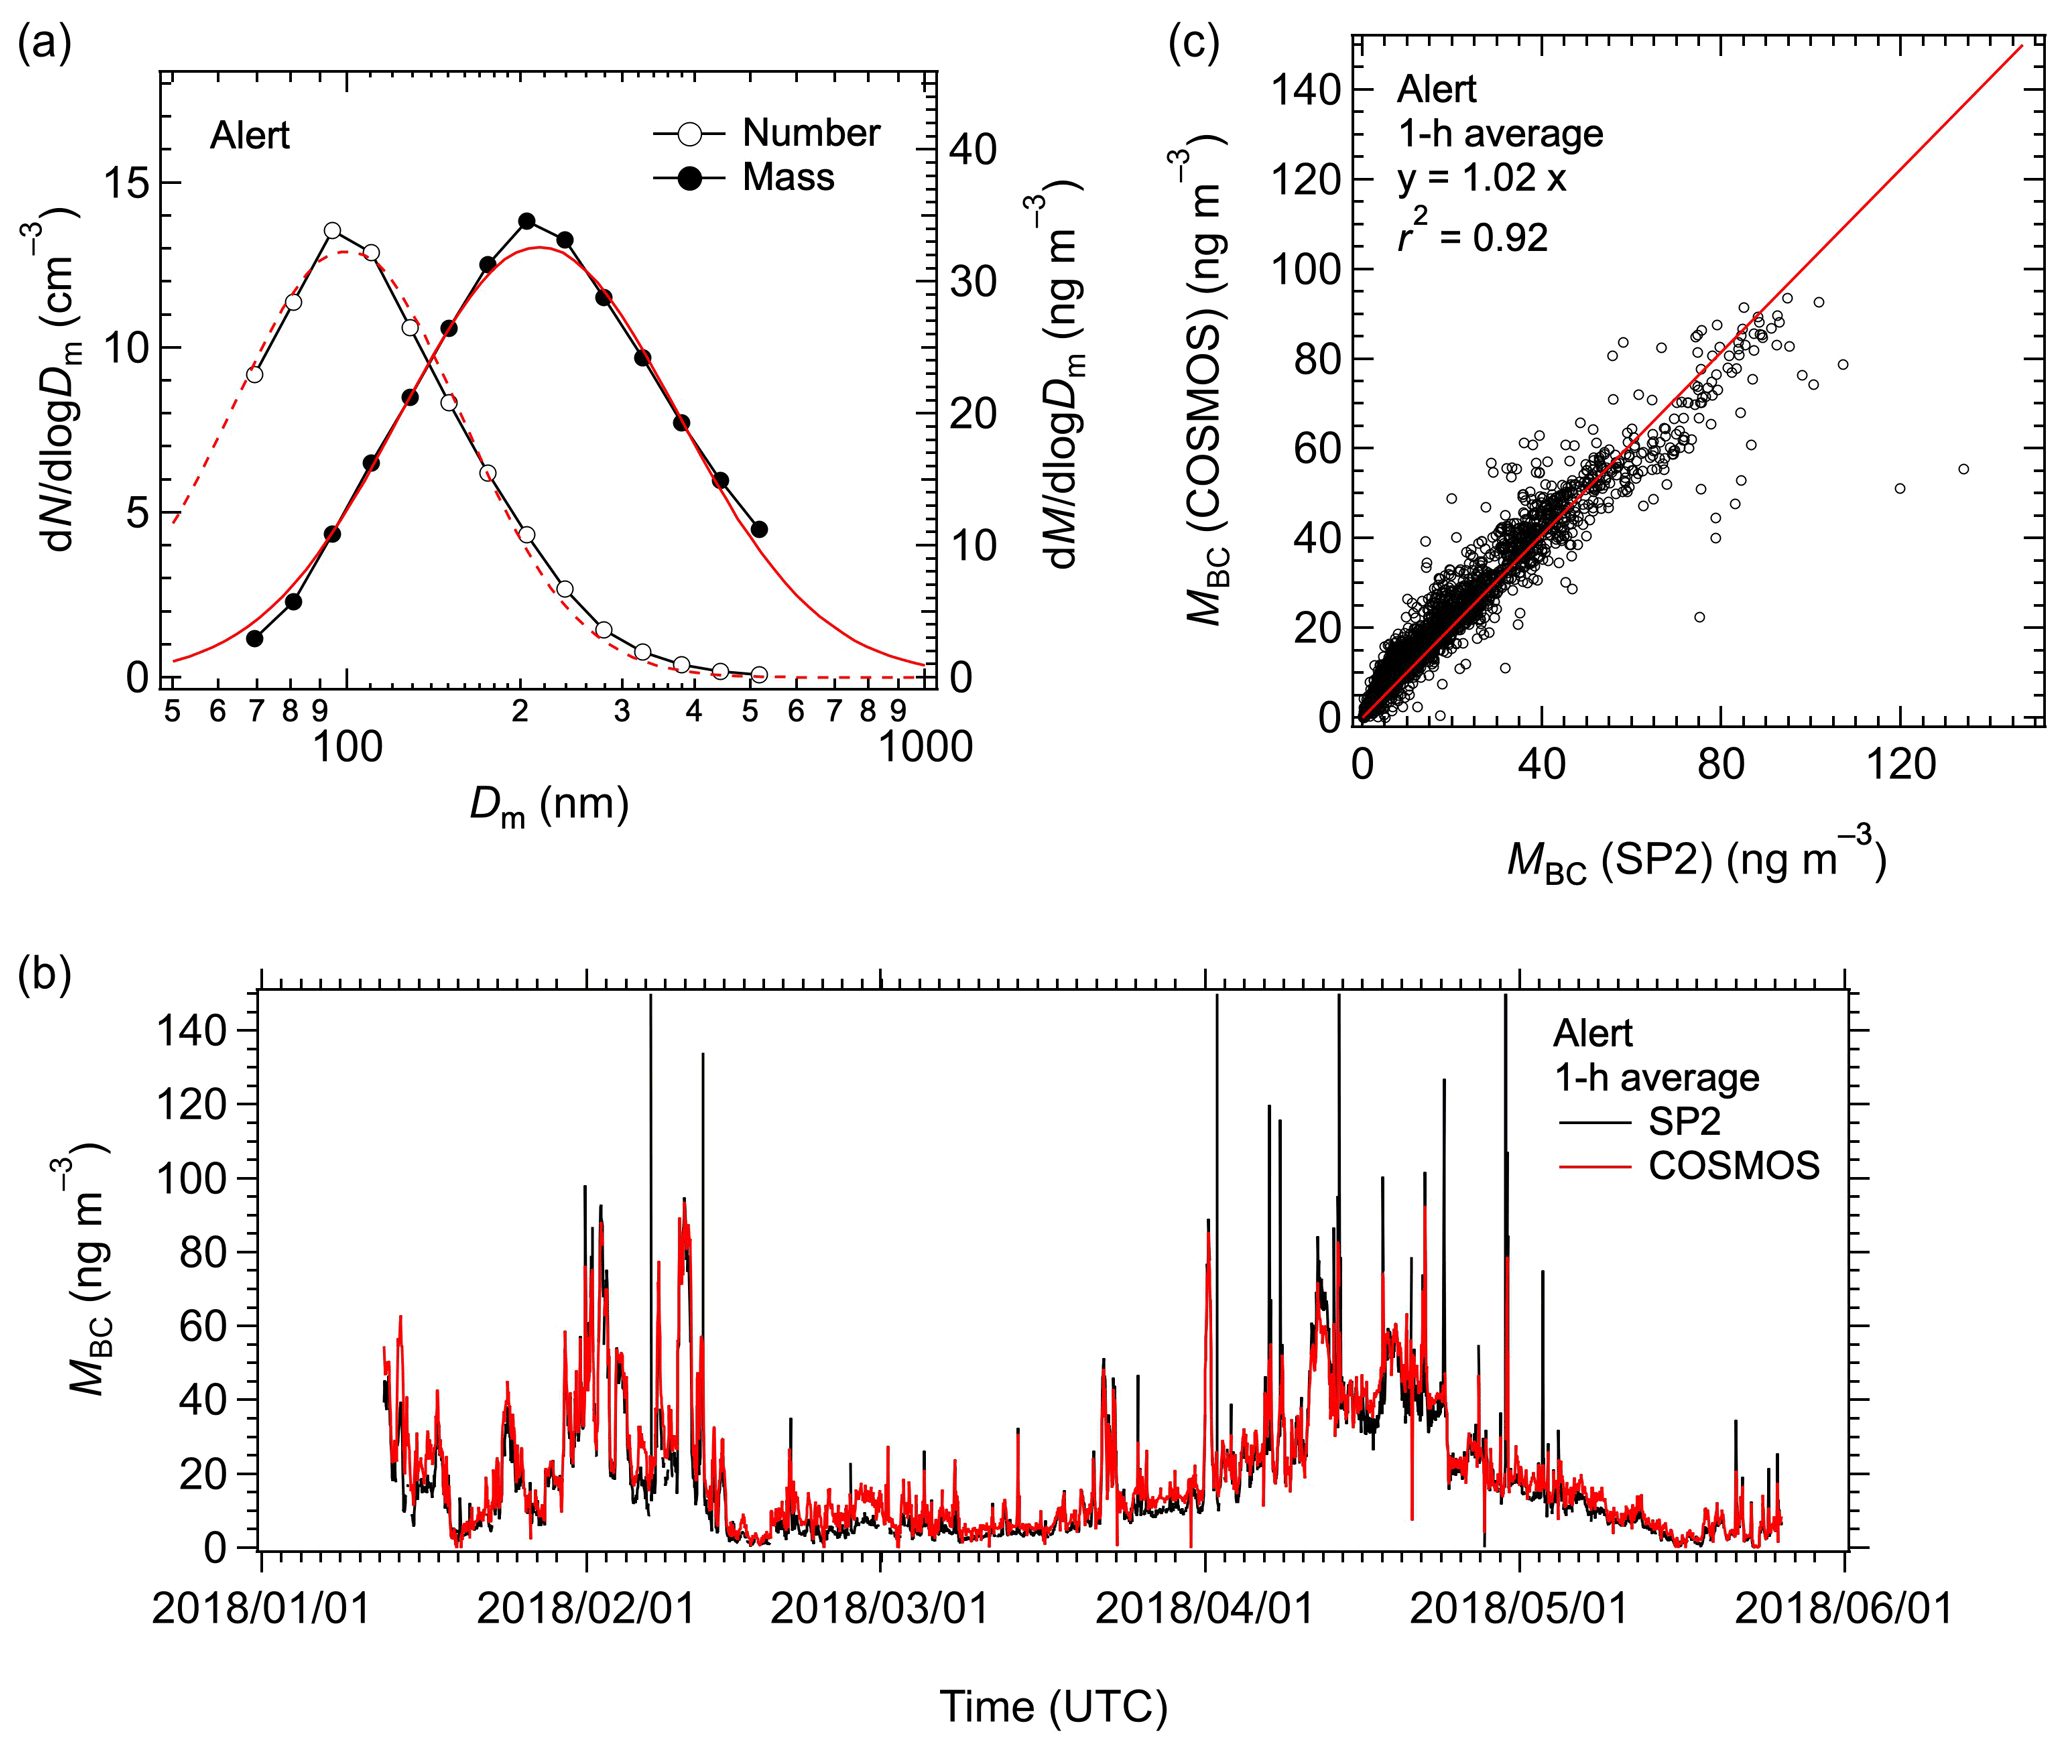
Figure 3(a) Number and mass size distributions of BC averaged over the observation period at Alert from January to May 2018. The dashed (solid) red line is the lognormal fit to the number (mass) size distribution. (b) Time series (1 h data) and (c) correlation of MBC measured by COSMOS and SP2. The solid red line in the correlation plot is the least-squares regression forced through the origin.
Although this agreement between MBC (COSMOS) and MBC (SP2) at Alert was consistent with those reported in previous studies using UT-SP2 (Kondo et al., 2011; Ohata et al., 2019), note that there were some differences between MBC (SP2) measured by the EC-SP2 and that by the UT-SP2. The EC-SP2 was calibrated using Aquadag samples at Alert during the observation period and also calibrated using fullerene soot samples at the Paul Scherrer Institute in Switzerland after the observation period. Because the sensitivity of the incandescence signals of the SP2 to Aquadag is higher than that to fullerene soot, the calibration curve for Aquadag needs correction to obtain the fullerene-soot-equivalent calibration curve (Baumgardner et al., 2012). Additionally, to make this correction, assumptions of the effective density (ρeff) values of Aquadag (Moteki and Kondo, 2010; Gysel et al., 2011), which depend on the mobility diameter of Aquadag, are needed since a differential mobility analyzer (DMA) is used for the on-site calibration at Alert instead of an aerosol particle mass analyzer (APM) or a centrifugal particle mass analyzer. The ρeff values of Aquadag samples can depend on their batches (Gysel et al., 2011). In the previous study by Sharma et al. (2017), the constant value of ρeff (= 0.7 g cm−3) for Aquadag was assumed in order to derive MBC (SP2) at Alert. However, we have found that MBC (SP2) at Alert was highly dependent on the assumed ρeff values of Aquadag used for the on-site calibration with a DMA. Because of this, we used the calibration curve obtained by fullerene soot with an APM at the Paul Scherrer Institute after the observation period for this study. The conditions of the EC-SP2 might have differed slightly during and after the observation period, which may lead to additional uncertainties for MBC (SP2) at Alert, although the difference between Aquadag calibrations made before and after the campaign was less than about 10 %. In addition, the upper limit of the detectable diameter of BC for the EC-SP2 (Dm ∼ 600 nm) was lower than that for the UT-SP2 (Dm ∼ 850 nm), although the abovementioned extrapolation up to 1000 nm was made to derive MBC (SP2) at Alert. Despite these differences between EC-SP2 and UT-SP2, MBC (COSMOS) and MBC (SP2) agree to within 10 % at Alert, consistent with previous studies that reported the stability of the relationship between MBC (COSMOS) and MBC (SP2) at various sites (Kondo et al., 2011; Ohata et. al., 2019).
3.1.2 COSMOS–PSAP comparison
Measurements of MBC (COSMOS) at Alert began in January 2018. A PM1 cyclone was used for COSMOS, and a PM1 impactor was used for PSAP and two CLAP instruments (CLAP1, CLAP2). The time series of 1 and 24 h averaged MBC (COSMOS) were strongly correlated with babs (PSAP; λ = 550 nm) for 2018–2019 (r2 ∼ 0.96; Fig. 4a–d). In this study, we define the MAC value, MACcor, as the slope of the least-squares regression forced through the origin in the correlation plot. The values of MACcor (PSAP; λ= 550 nm) for the whole period were 13.9 and 14.0 m2 g−1 for the 1 and 24 h averaged data, respectively, as summarized in Table 2. The results of the same analyses for other wavelengths of the PSAP and the two CLAPs show that the strength of the correlation depended little on wavelength (Table 2). The babs, and therefore the MAC, for the PSAP and the two CLAP instruments (CLAP1, CLAP2) agree to within 13 % at λ= 550 nm, indicating a small difference in the performance of these instruments.
Table 2MACcor (PSAP–CLAP; λ) values at Alert during 2018–2019. r2 is the square of the correlation coefficient.
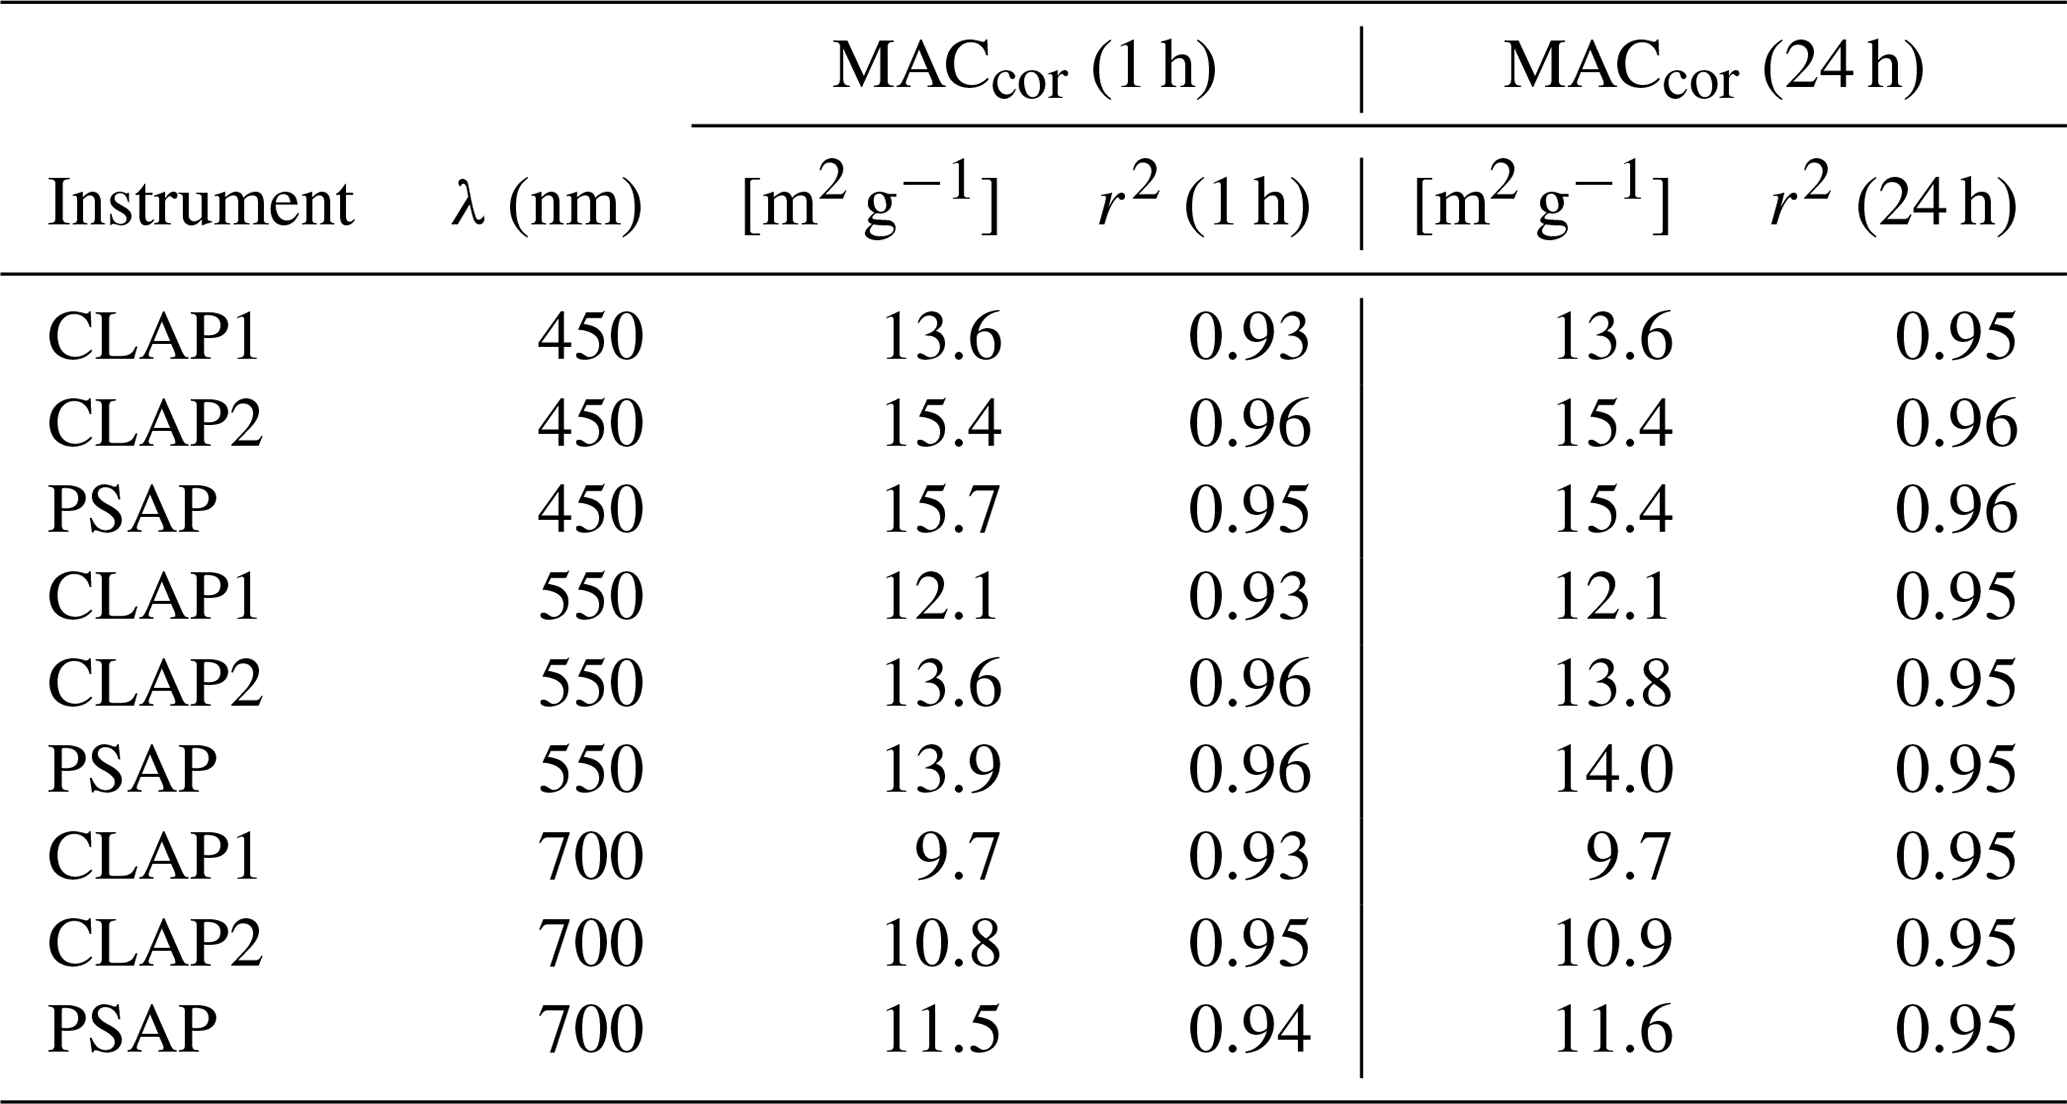
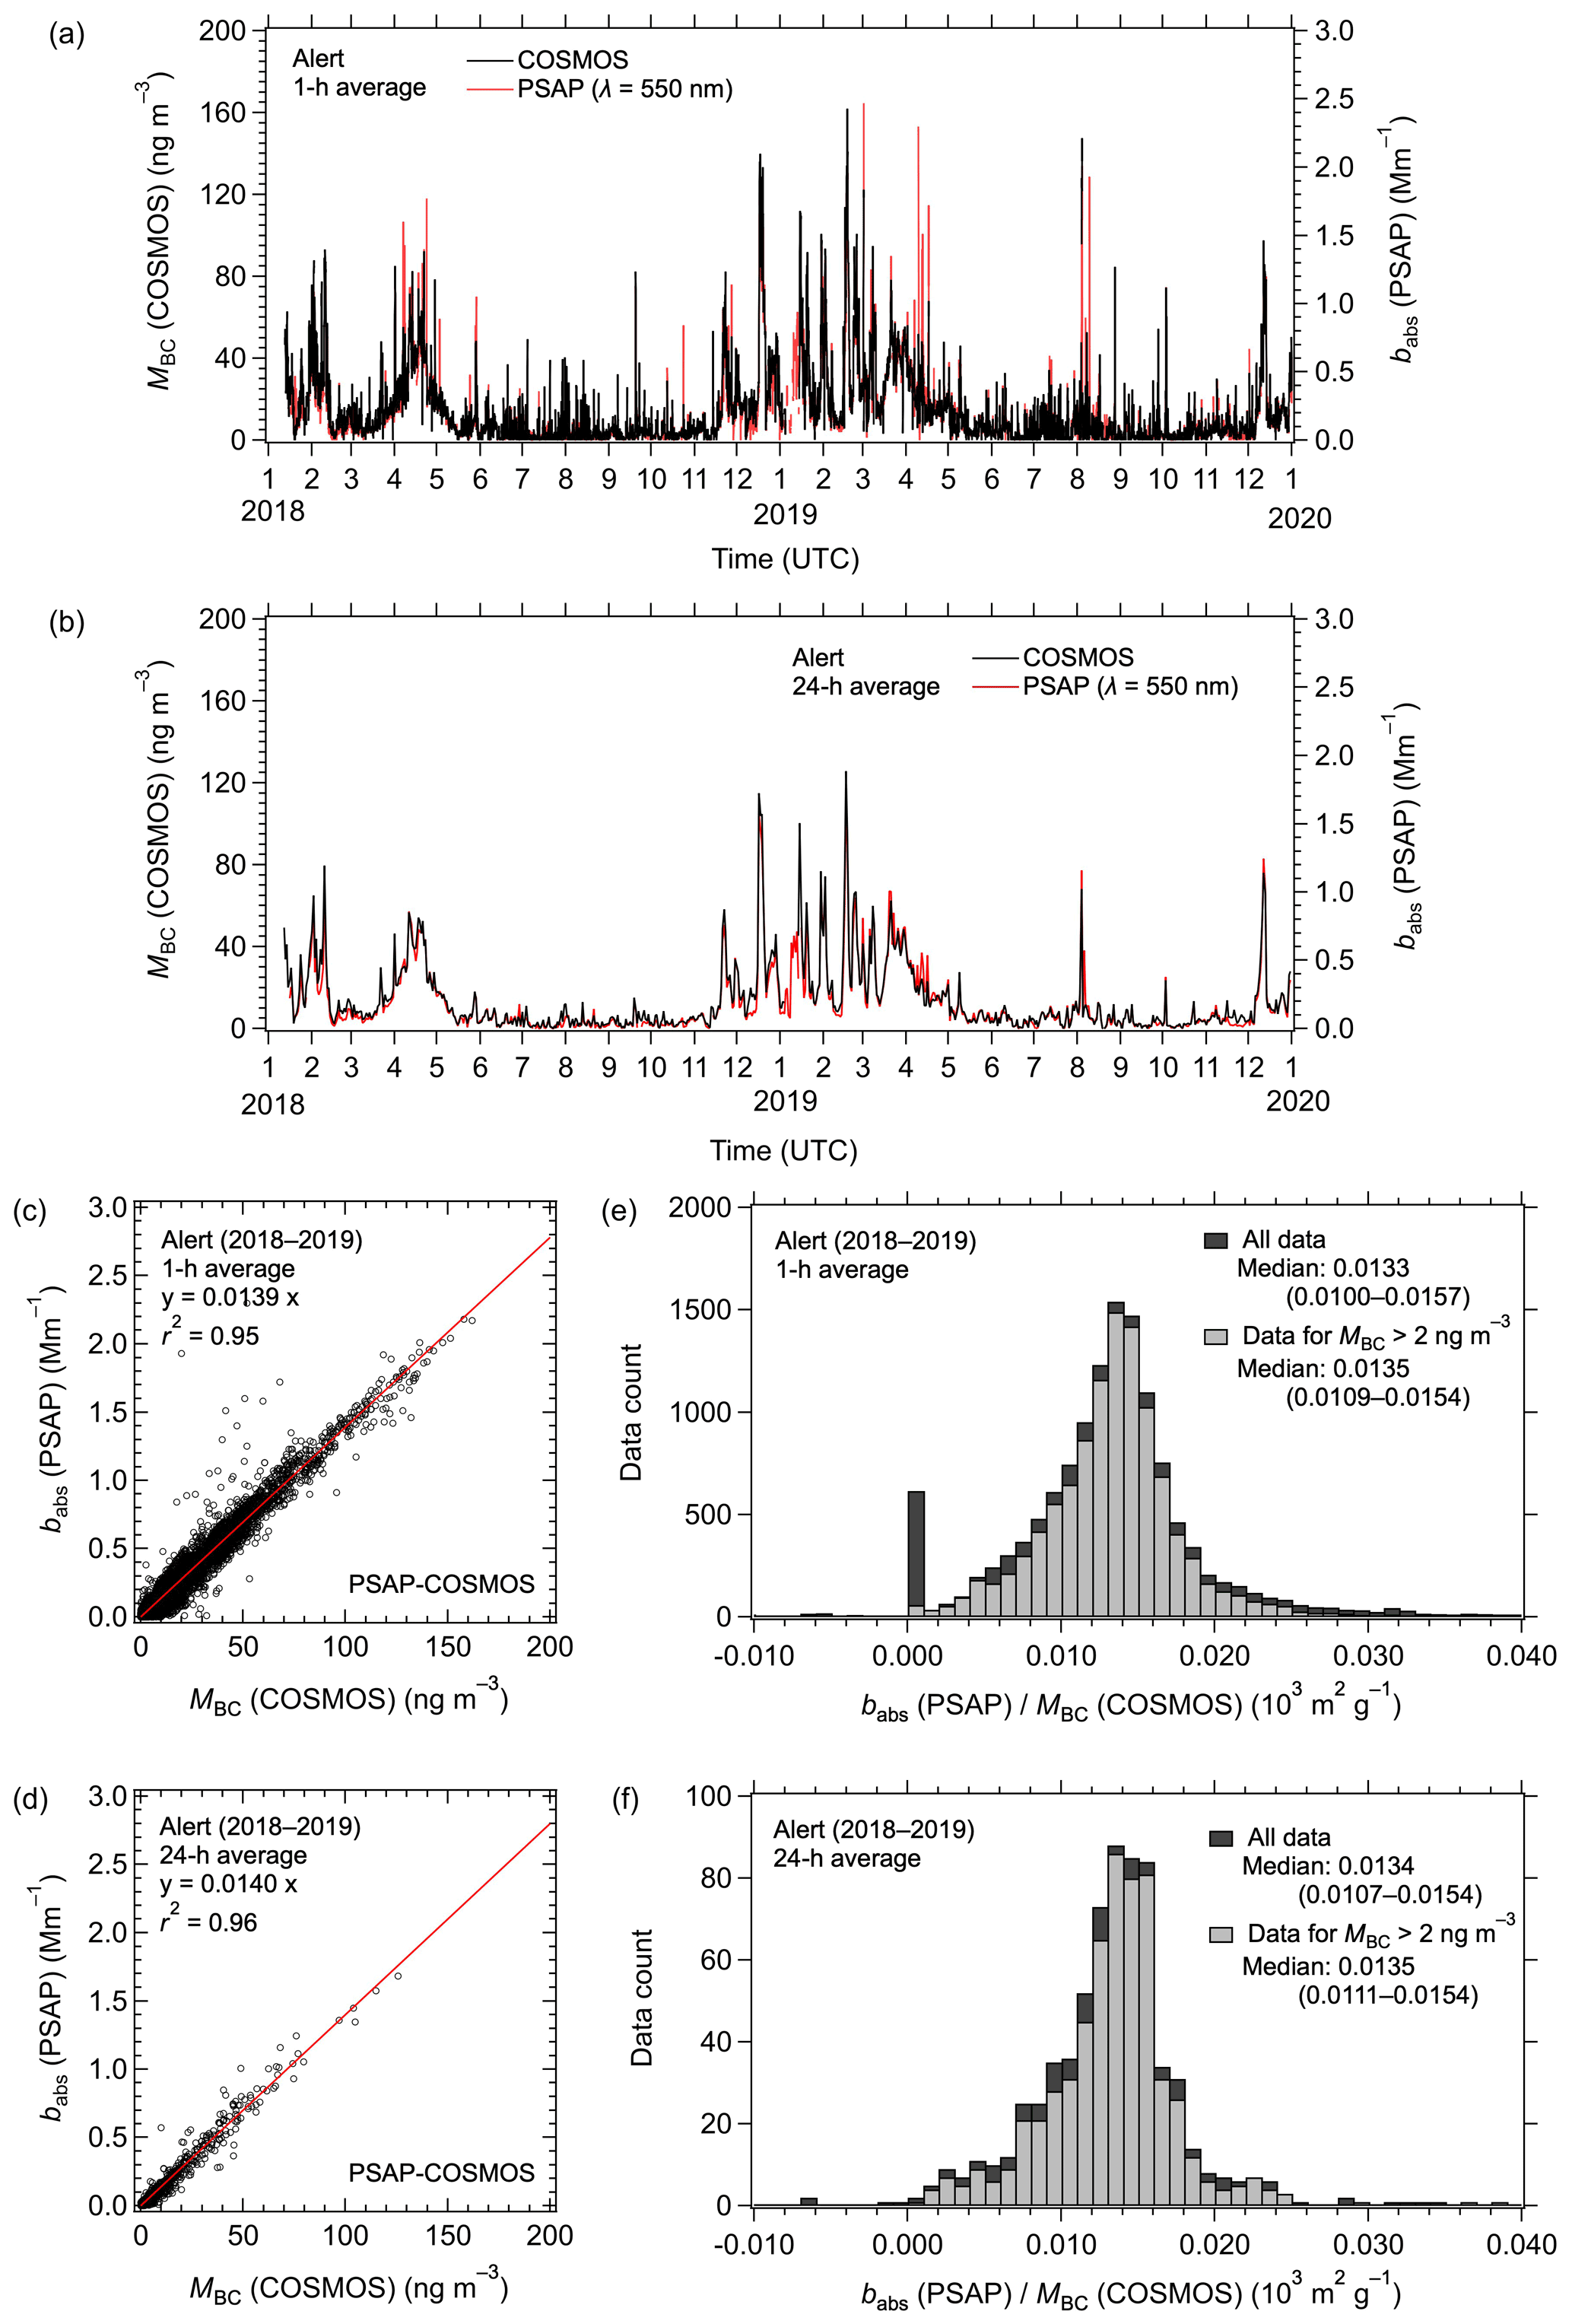
Figure 4Time series of MBC (COSMOS) and babs (PSAP; λ= 550 nm) from January 2018 to December 2019 at Alert for (a) 1 h averaged and (b) 24 h averaged data. (c, d) Corresponding correlations of MBC (COSMOS) and babs (PSAP). The solid red lines are the least-squares regressions forced through the origin. (e, f) Corresponding histograms of babs (PSAP) (COSMOS) ratios for all data and data with MBC (COSMOS) >2 ng m−3. The interquartile ranges are shown in parentheses.
Along with the correlation analysis, variability of the babs (PSAP) MBC (COSMOS) ratio was also analyzed for the 1 and 24 h data (Fig. 4e and f). This ratio can be interpreted as an hourly or daily MAC value at each time. Because this ratio tends to be unstable when the MBC (COSMOS) values are very low, we set a threshold MBC (COSMOS) value of 2 ng m−3 in this analysis, as shown in these figures. The median ratio, defined as median MAC and denoted as MACmed, was 13.5 m2 g−1 for both 1 and 24 h data, which is very close to MACcor (13.9 and 14.0 m2 g−1 for the 1 and 24 h data, respectively) (Table 3). The difference between MACcor and MACmed was about 4 %, leading to the same difference between the estimated MBC values if these MAC values are used for conversion of babs (PSAP) to MBC. Based on the interquartile ranges of the babs (PSAP) MBC (COSMOS) ratios (Fig. 4e and f), variations in the ratios (with an MBC threshold of 2 ng m−3), denoted as VMAC, were within 19 % and 18 % of the MACmed values for the 1 and 24 h data, respectively (Table 3). Therefore, conversion of 1 and 24 h averaged babs (PSAP; λ = 550 nm) data to MBC by assuming a constant MACmed leads to uncertainty of about 19 % at Alert. We used the same method in estimating MACcor, MACmed, and VMAC for other instruments and other locations, as summarized in Table 3. Note that this estimated uncertainty can depend on the threshold value of MBC (COSMOS) assumed in the analysis. Figure S2 in the Supplement shows histograms of the babs (PSAP) MBC (COSMOS) ratios for MBC (COSMOS) <10 ng m−3. While similar MACmed values were obtained for data with MBC (COSMOS) <10 ng m−3 and for all datasets, the interquartile ranges of the babs (PSAP) MBC (COSMOS) ratios are larger for MBC (COSMOS) <10 ng m−3. The relative uncertainty becomes higher (lower) in summer (winter–spring) when the MBC values tend to be low (high) (Fig. 4a and b).
Table 3MAC, r2, and variability of MAC (VMAC; interquartile range in relative terms) of MAAP, PSAP–CLAP, and Aethalometer at observation sites in this study.
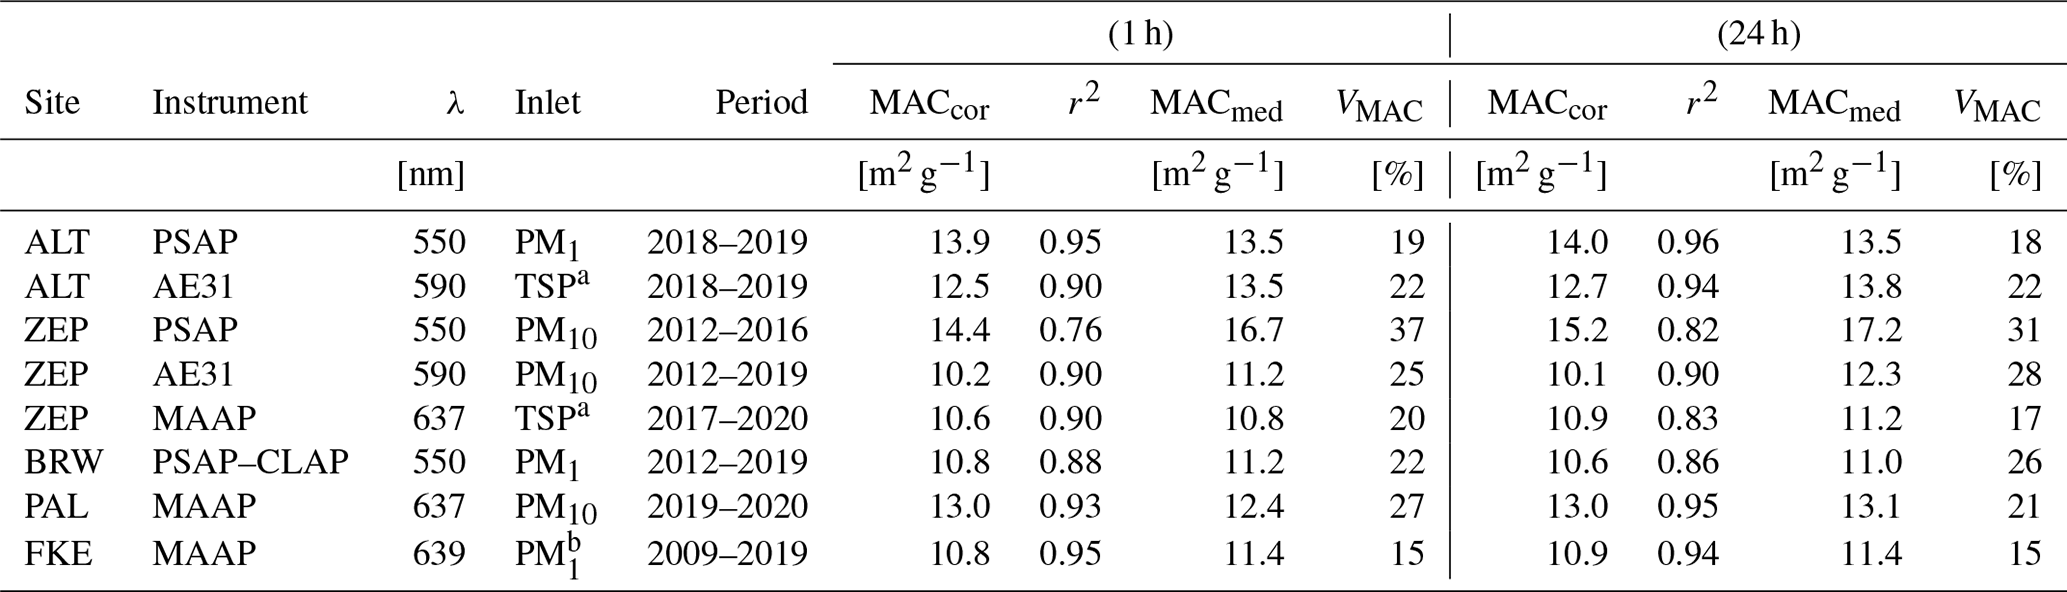
a Total suspended particles. b A PM2.5 cyclone was used before November 2011.
3.1.3 COSMOS–Aethalometer comparison
Measurements of babs at Alert were made by an Aethalometer at wavelengths of 370, 470, 520, 590, 660, 880, and 950 nm without any particle size cut. Time series of babs (Aethalometer; λ= 590 nm) and MBC (COSMOS) in 2018–2019 are shown in Fig. S3a and b in the Supplement. babs (Aethalometer; λ= 590 nm) was highly correlated (r2>0.90) with MBC (COSMOS) (Fig. 5a and b). The MACcor (Aethalometer; λ= 590 nm) values were 12.5 and 12.7 m2 g−1 for the 1 and 24 h data, respectively. The MACmed values of the babs (Aethalometer) MBC (COSMOS) ratios were 13.5 and 13.8 m2 g−1 for the 1 and 24 h data, respectively (Fig. 5c and d), which agree with the MACcor values to within 8 %. Therefore, depending on the MAC values used, the estimated MBC values can differ by about 8 %. Because the interquartile ranges of the babs (Aethalometer) (COSMOS) ratios were 11.4–16.5 m2 g−1 (1 h data) and 12.1–15.7 m2 g−1 (24 h data), the VMAC was about 22 % (with an MBC threshold of 2 ng m−3) for babs (Aethalometer; λ= 590 nm) at Alert (Table 3). The MACmed values for low MBC data (MBC (COSMOS) <10 ng m−3) agree with those for all datasets to within 10 % (Fig. S3c and d in the Supplement).
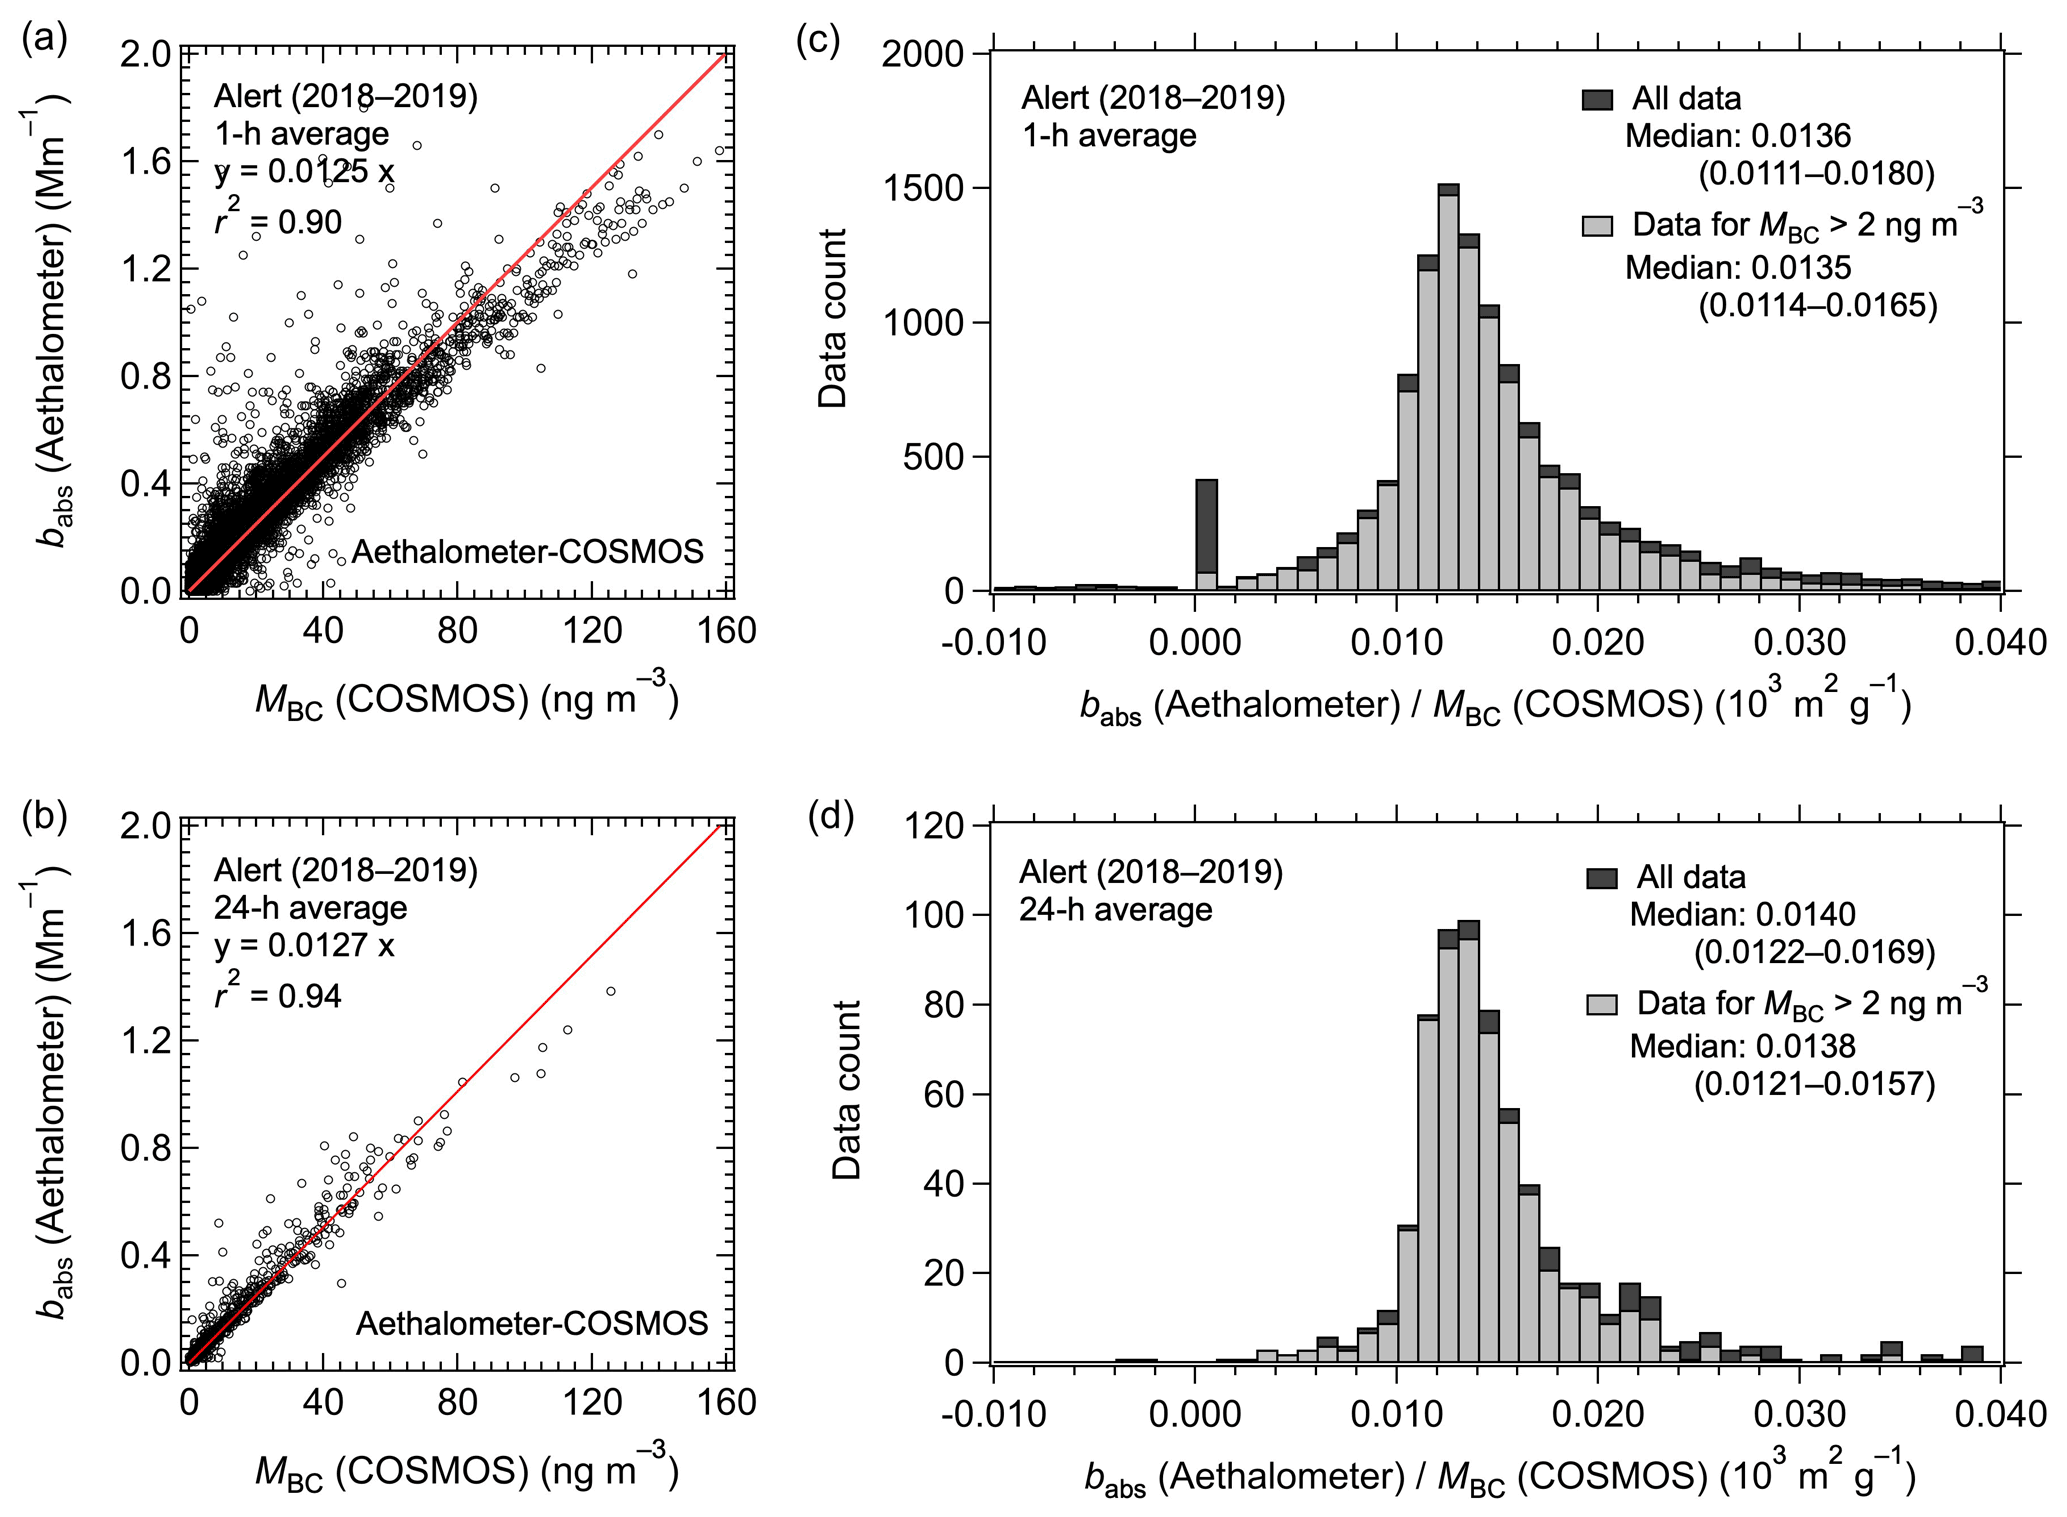
Figure 5Correlations of MBC (COSMOS) and babs (Aethalometer; λ= 590 nm) from January 2018 to December 2019 at Alert for (a) 1 h averaged and (b) 24 h averaged data. The solid red lines are the least-squares regressions forced through the origin. (c, d) Corresponding histograms of babs (Aethalometer) (COSMOS) ratios for all data and data with MBC (COSMOS) >2 ng m−3.
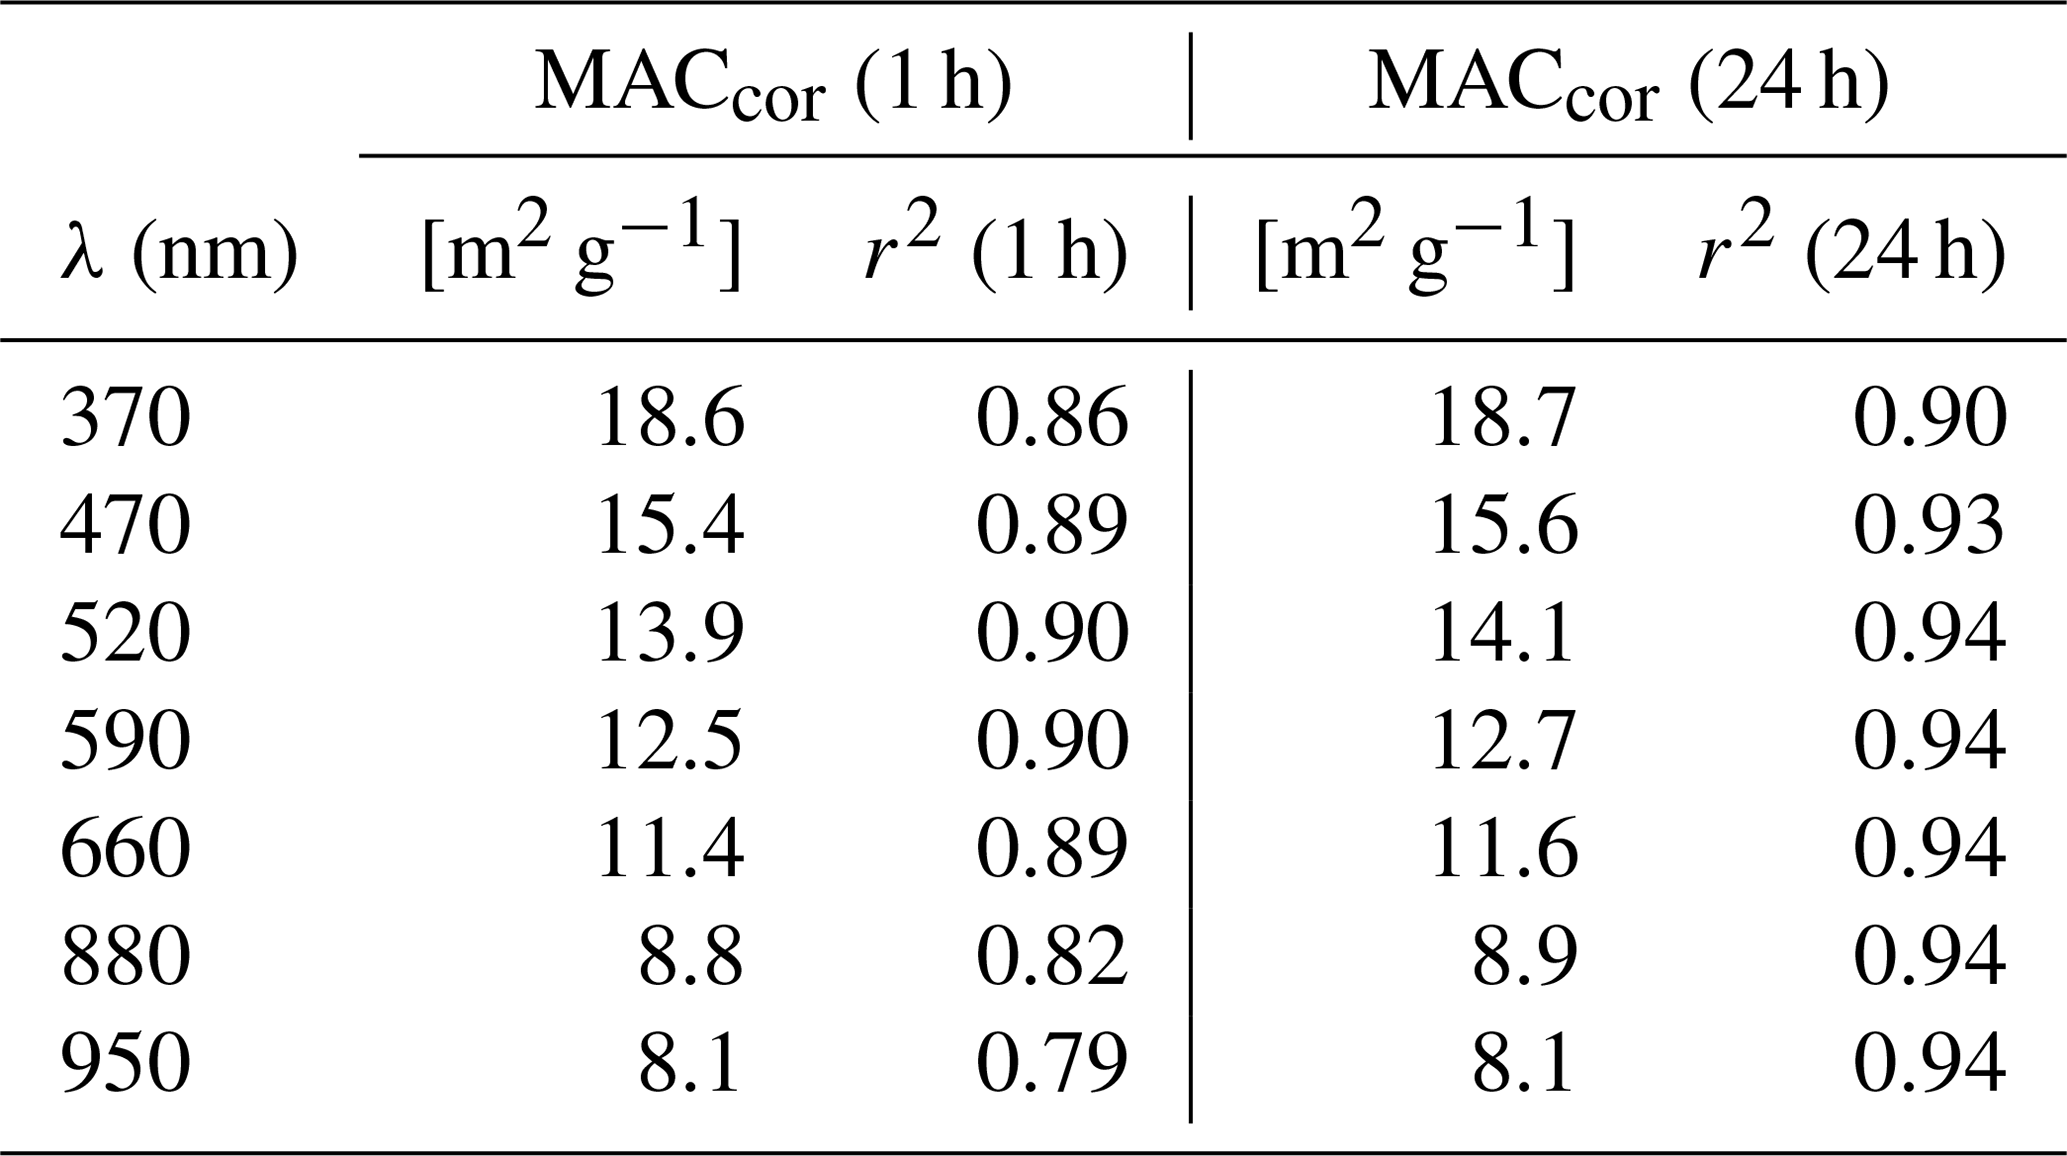
The MACcor (Aethalometer) values for each wavelength are summarized in Table 4. Note that these wavelength-dependent MACcor values should be interpreted as the simple conversion factors to obtain average MBC from babs (Aethalometer), which might have been contributed to by BC and also other light-absorbing aerosols. In other words, these MACcor values differ from MACBC, as discussed in Sect. 1. The r2 values were generally high for all wavelengths examined. This weak dependence on wavelength indicates that the contribution of other light-absorbing aerosols such as brown carbon (BrC) to babs (Aethalometer) is small or the BrC BC concentration ratio was rather stable at Alert during 2018–2019, because BrC should enhance light absorption in near-ultraviolet wavelengths.
The MACcor (Aethalometer) and MACcor (PSAP) are compared in Table 5. They agree within 10 % at three wavelengths, despite the different particle size cuts of the inlets for Aethalometer (total suspended particle) and PSAP (PM1). This agreement is consistent with the results by Backman et al. (2017), who showed that the correction factor Cf of 3.45 for Aethalometer harmonizes babs (Aethalometer) with babs (PSAP), babs (CLAP), and babs (MAAP) at Arctic sites.
Table 4MACcor (Aethalometer; λ) and r2 values at Alert during 2018–2019.
3.2 Ny-Ålesund
3.2.1 COSMOS–PSAP comparison
Simultaneous measurements of MBC (COSMOS) for PM1 and babs (PSAP) for PM10 began at Ny-Ålesund in 2012 (Sinha et al., 2017; Fig. S4a and b in the Supplement). The 1 h and 24 h averaged babs values (PSAP; λ= 550 nm) were well correlated (r2= 0.76–0.82) with MBC (COSMOS), and the MACcor (PSAP) value for the whole period was 14.4–15.2 m2 g−1 (Fig. 6a and b). Year-to-year variations in MACcor (PSAP) are also shown in Fig. 7a and Table 6. The correlation between babs (PSAP) and MBC (COSMOS) during April–December 2012 was weak for unknown reasons. Excluding this period, average MACcor (PSAP) during 2013–2016 was 15.2 ± 2.2 (1σ) and 16.6 ± 1.4 m2 g−1 for the 1 and 24 h data, respectively. Although the reason for the relatively large change in MACcor (PSAP) values during 2014–2015 (Fig. 7a and Table 6) is not clear, this may be partly because babs (PSAP) data from December 2014 to April 2015 (during an “Arctic haze” period) were not available (Fig. S4a and b in the Supplement).
Table 5MACcor (PSAP) and MACcor (Aethalometer) values derived from 24 h averaged data at Alert during 2018–2019.
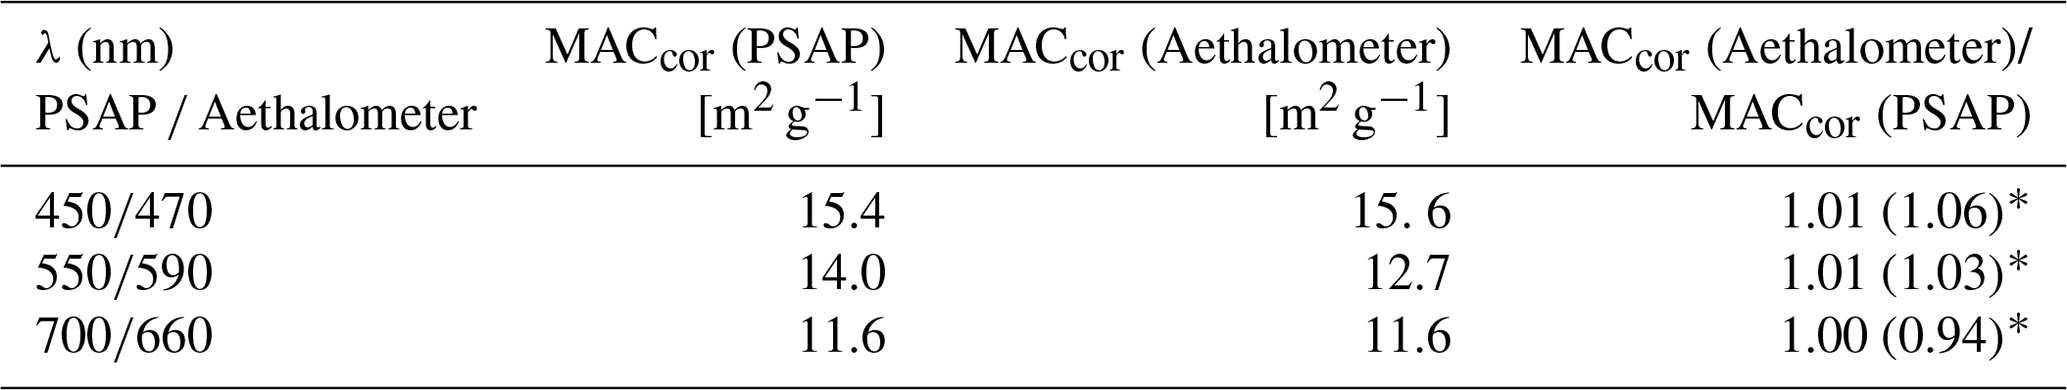
∗ MACcor (Aethalometer) values measured at λ= 470, 590, and 660 nm were adjusted to those at λ= 450, 550, and 700 nm (wavelengths used for PSAP) by assuming an absorption Ångström exponent of 1.0.
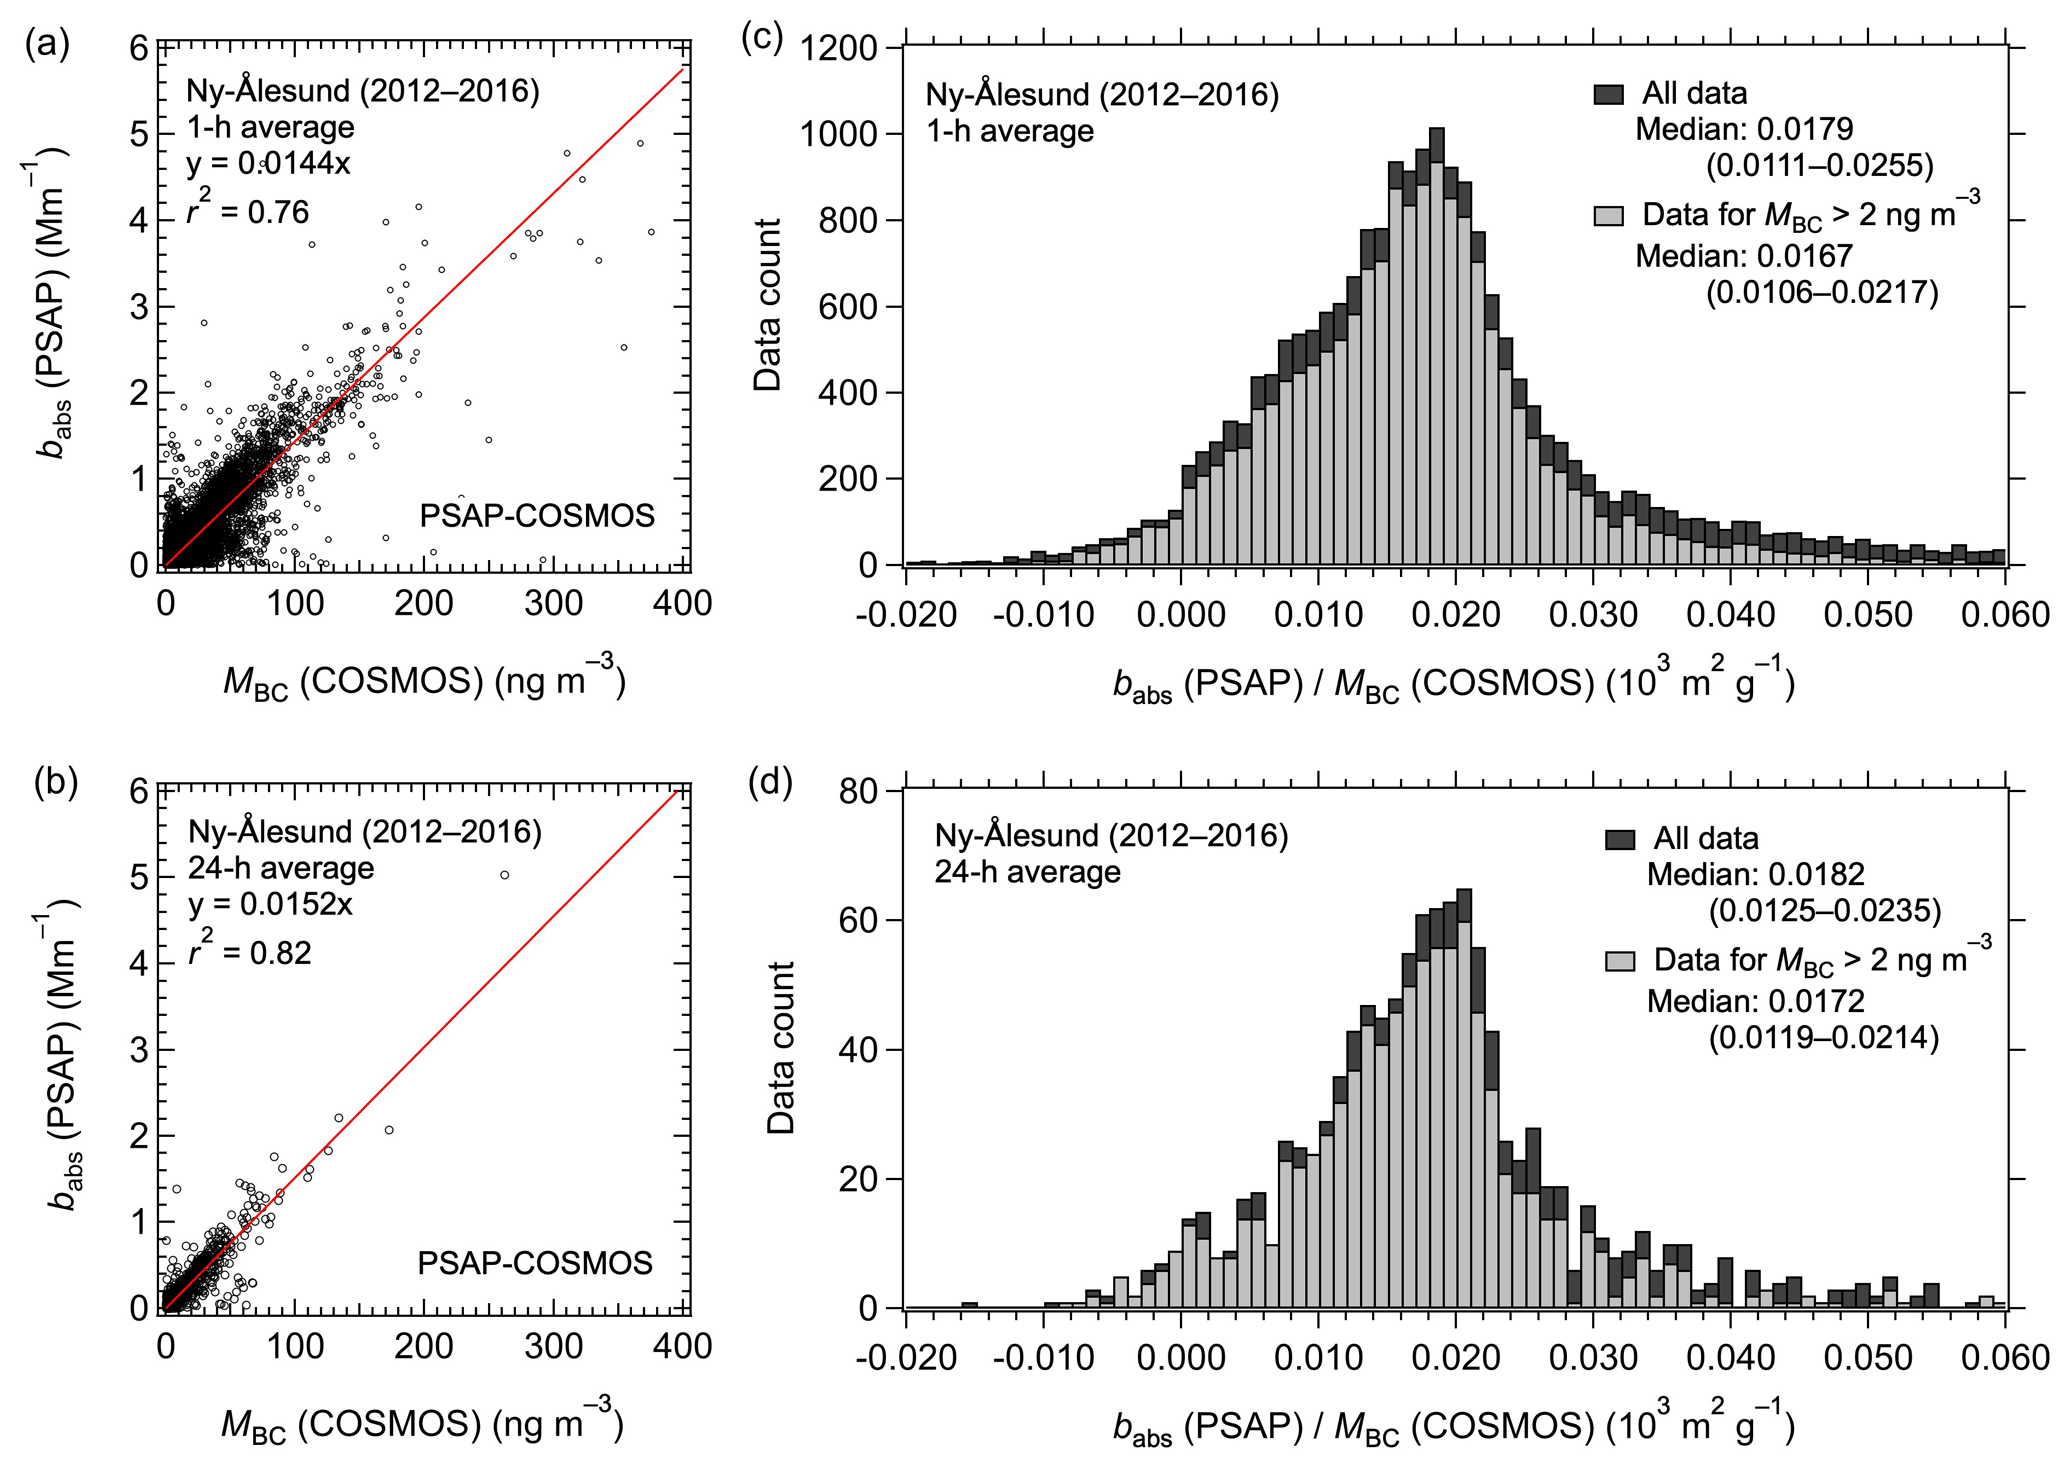
Figure 6Correlations of MBC (COSMOS) and babs (PSAP; λ= 550 nm) from April 2012 to September 2016 at Ny-Ålesund for (a) 1 h averaged and (b) 24 h averaged data. The solid red lines are the least-squares regressions forced through the origin. (c, d) Corresponding histograms of babs (PSAP) (COSMOS) ratios for all data and data with MBC (COSMOS) >2 ng m−3.
The MACmed values of the babs (PSAP) (COSMOS) ratios were 16.7 and 17.2 m2 g−1 for the 1 and 24 h data, respectively, when the MBC threshold of 2 ng m−3 was applied in the analysis (Fig. 6c and d). The MACmed values were higher by 16 % and 13 % than MACcor for 1 and 24 h data, respectively (Table 3). Therefore, conversion of babs (PSAP; λ= 550 nm) to MBC using a constant MACcor may result in a slightly biased MBC, especially for lower babs data. This is partly because the correlation of babs (PSAP) with MBC (COSMOS) is not very high, and scatter of the data, especially those with lower MBC values, contributes to large variations in the babs (PSAP) (COSMOS) ratios (Figs. 6 and S4c and d in the Supplement). The interquartile ranges of the ratios were 10.6–21.7 and 11.9–21.4 m2 g−1 for the 1 and 24 h data, respectively. Although these large variations might be partly attributed to actual variations in mixing states of BC, artifacts of babs measurements by PSAP at Ny-Ålesund may be a contributing factor, considering the higher correlations of babs (Aethalometer) and babs (MAAP) at Ny-Ålesund with MBC (COSMOS) (Sect. 3.2.2 and 3.2.3). Based on the interquartile ranges of the babs (PSAP) (COSMOS) ratios, VMAC was 37 % and 31 % for 1 and 24 h data, respectively (Table 3). The abovementioned bias leads to an additional uncertainty of about 15 % for the estimates of MBC, if the constant MACcor value is used.
Table 6Year-to-year variability of MACcor (PSAP; λ = 550 nm) and r2 at Ny-Ålesund.
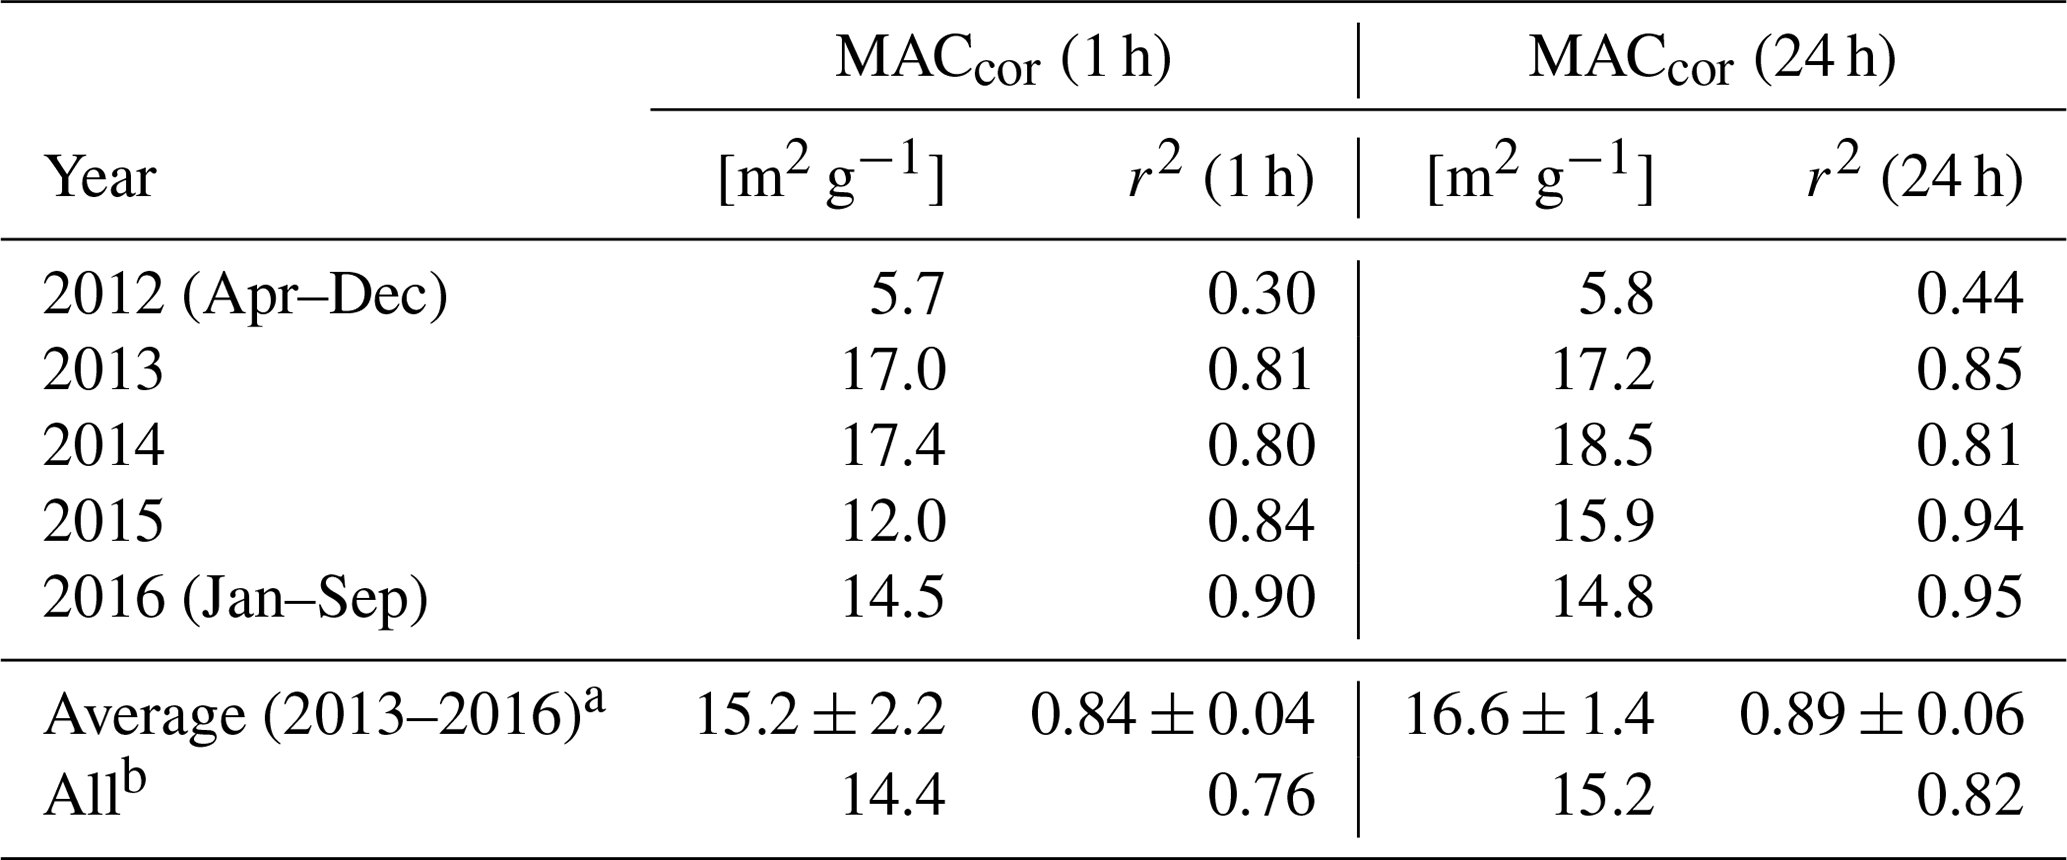
a Average and standard deviation for individual years. b Derived by regression slope for all data points.
Table 7Year-to-year variability of MACcor (Aethalometer; λ= 590 nm) and r2 at Ny-Ålesund.
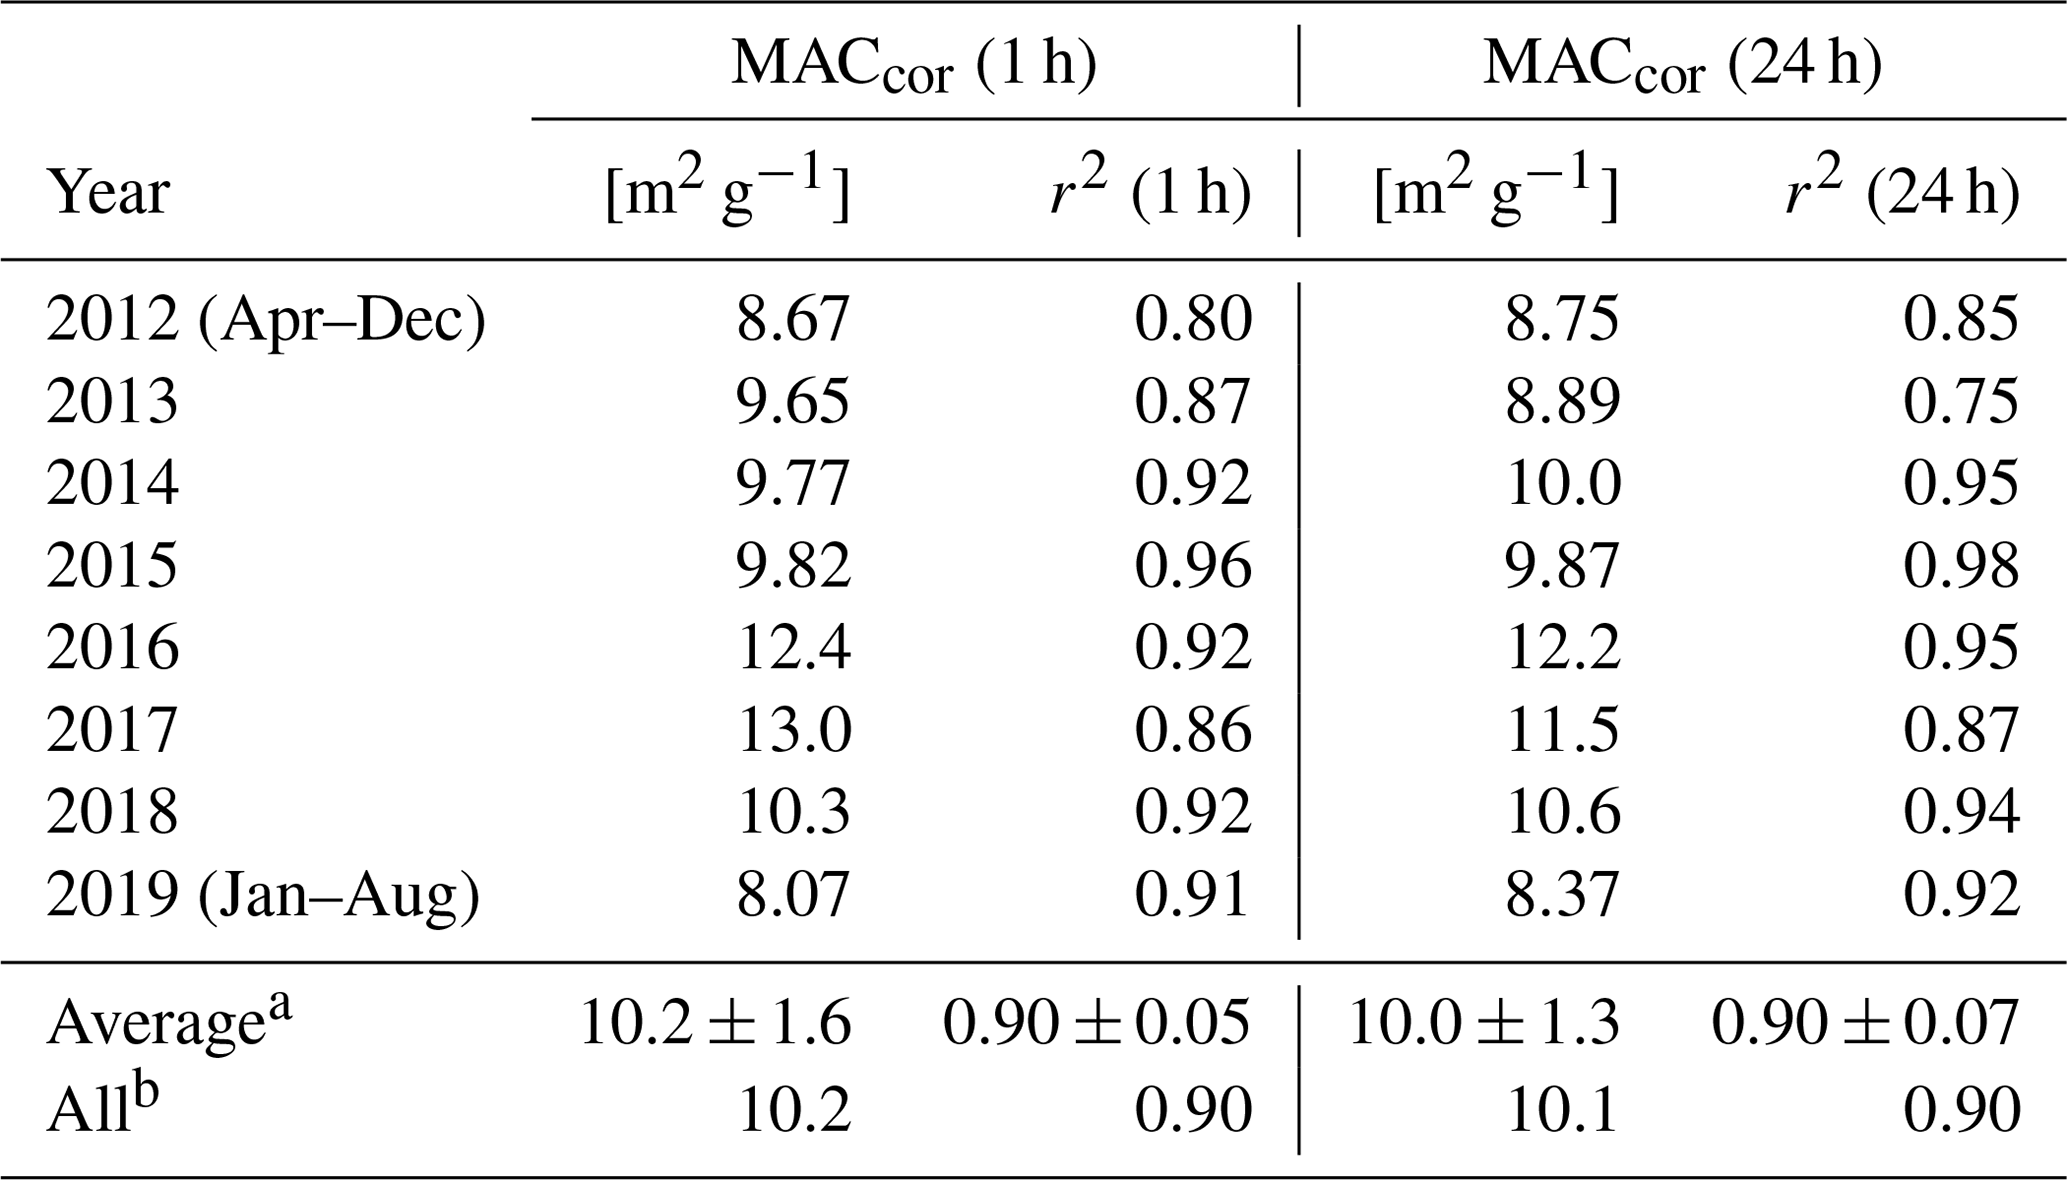
a Average and standard deviation for individual years. b Derived by regression slope for of all data points.
3.2.2 COSMOS–Aethalometer comparison
Measurements of babs (Aethalometer; λ= 590 nm) for PM10 were compared with measurements of MBC (COSMOS) for PM1 during 2012–2019. The time series data of babs (Aethalometer) were highly correlated with those for MBC (COSMOS) (Fig. S5a and b in the Supplement) (r2= 0.90 for both the 1 and 24 h data; Fig. 8a and b). The MACcor (Aethalometer) values were 10.2 and 10.1 m2 g−1 for the 1 and 24 h data, respectively. Year-to-year variations in MACcor (Aethalometer) are also shown in Fig. 7a and Table 7. The r2 values were generally high for each year, and the average MACcor (Aethalometer) during 2012–2019 was 10.2 ± 1.6 (1σ) and 10.0 ± 1.3 m2 g−1 for the 1 and 24 h data, respectively. The MACcor (Aethalometer) value for 2012 was 8.7 m2 g−1 at 590 nm (i.e., 9.3 m2 g−1 at 550 nm assuming the λ−1 relationship) for 24 h data, which is consistent with the MACcor of 9.8 m2 g−1 at 550 nm inferred from the SP2 and Aethalometer measurements in the spring of 2012 (Zanatta et al., 2018). At Ny-Ålesund, the MACcor (Aethalometer) values (10.2 and 10.1 m2 g−1 for the 1 and 24 h data, respectively) were systematically lower than the MACcor (PSAP) values (14.4 and 15.2 m2 g−1). This discrepancy is different than at Alert (Sect. 3.1.3), and the reason is unclear, but could be partly due to uncertainty in the absolute values of babs, as discussed in Sects. 1 and 2.2.3.

Figure 7(a) Time series of yearly MACcor (PSAP; λ = 550 nm), MACcor (Aethalometer; λ= 590 nm), MACcor (MAAP; λ= 637 nm), and MBC (COSMOS) at Ny-Ålesund. (b) Time series of yearly MACcor (PSAP–CLAP; λ= 550 nm) and MBC (COSMOS) at Barrow. (c) Time series of yearly MACcor (MAAP; λ= 639 nm) and MBC (COSMOS) at Fukue. In each panel, yearly MACcor and MBC (COSMOS) are calculated from 1 h data. The dashed lines show the averages of yearly MACcor for the entire time series.
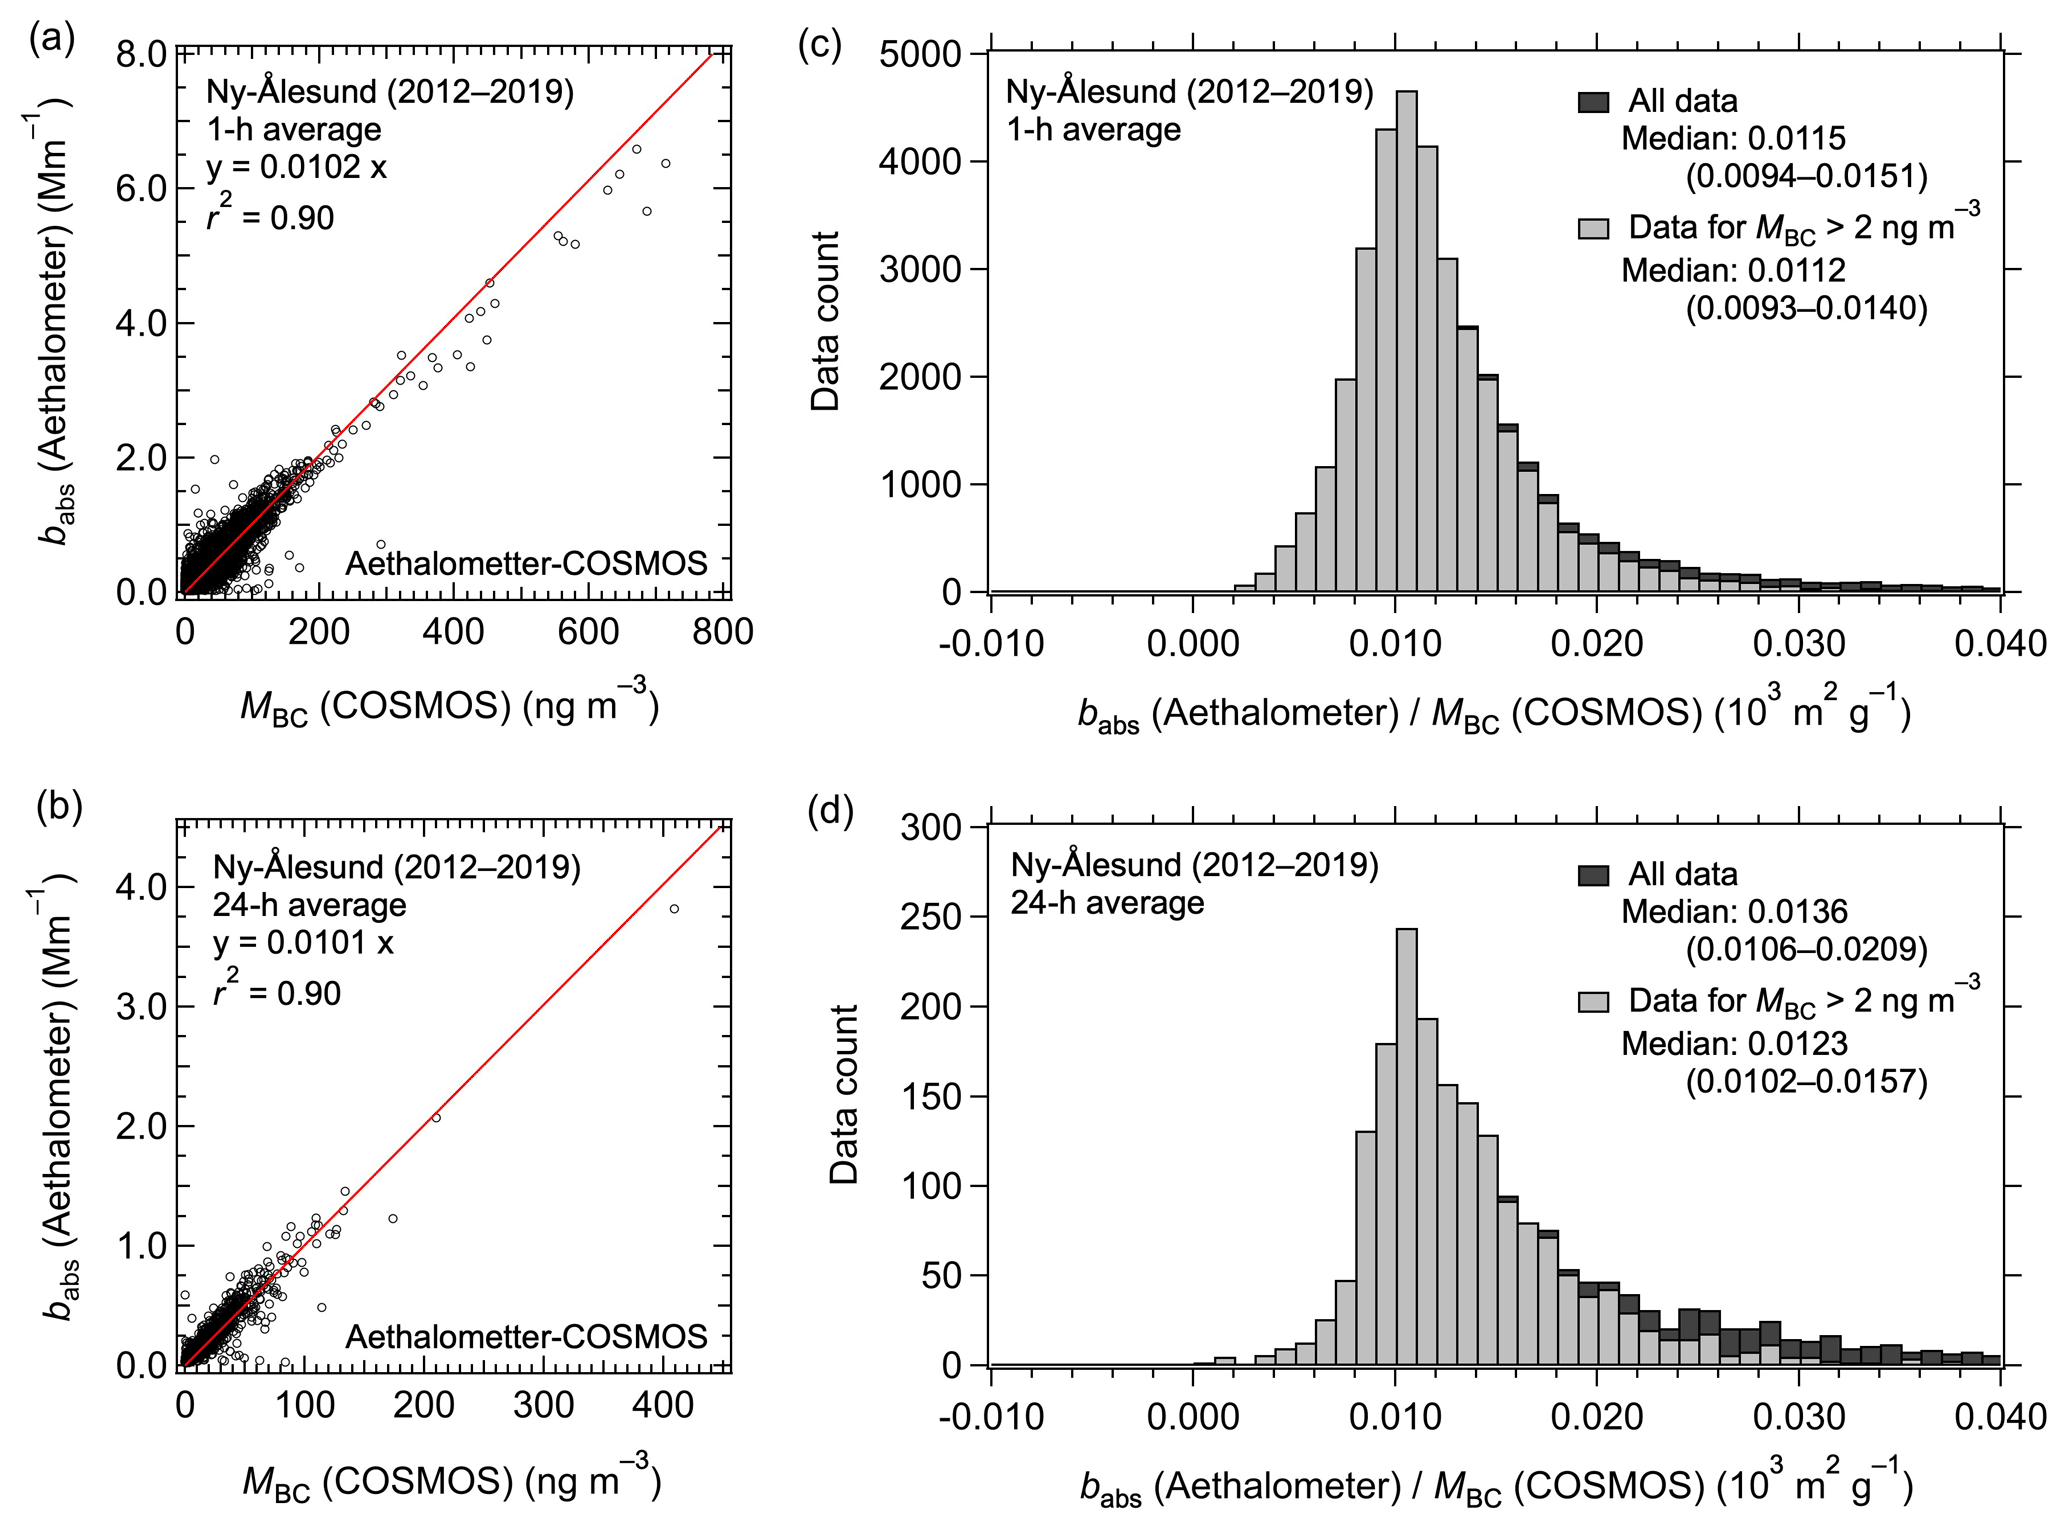
Figure 8Correlations of MBC (COSMOS) and babs (Aethalometer; λ= 590 nm) from April 2012 to August 2019 at Ny-Ålesund for (a) 1 h averaged and (b) 24 h averaged data. The solid red lines are the least-squares regressions forced through the origin. (c, d) Corresponding histograms of babs (Aethalometer) (COSMOS) ratios for all data and data with MBC (COSMOS) >2 ng m−3.
The MACmed values of the babs (Aethalometer) (COSMOS) ratios were 11.2 and 12.3 m2 g−1 for the 1 and 24 h data, respectively (Fig. 8c and d). While the MACmed values for the 1 h data agree with MACcor to within 10 %, there is a 22 % discrepancy for the 24 h data under the assumed threshold setting (2 ng m−3) of MBC (COSMOS) (Table 3). Therefore, conversion of 24 h averaged babs (Aethalometer; λ= 590 nm) to MBC using a constant MACcor may be somewhat biased, especially for lower babs values (Fig. S5c and d in the Supplement). At Ny-Ålesund, the VMAC was about 25 % for babs (Aethalometer; λ= 590 nm). The abovementioned bias leads to an additional uncertainty of about 20 % for conversion of 24 h averaged low babs data to MBC, if the constant MACcor value is assumed.
3.2.3 COSMOS–MAAP comparison
Measurements of babs (MAAP; λ= 637 nm) without any particle size cut were compared with measurements of MBC (COSMOS) for PM1 during 2017–2020. The time series of babs (MAAP) and MBC (COSMOS) tracked each other (Fig. S6a and b in the Supplement) and were highly correlated (r2= 0.90 for the 1 h data and r2= 0.83 for the 24 h data; Fig. 9a and b). The MACcor (MAAP) values were 10.6 and 10.9 m2 g−1 for the 1 and 24 h data, respectively. These MACcor values are about 60 % higher than the manufacturer's default setting (= 6.6 m2 g−1) of MAC (MAAP). One possible reason is the difference of the methods of MBC measurements to determine MACcor (MAAP) values, as mentioned in Sect. 2.2.3. Another reason could be that the difference in microphysical properties of BC (mixing states and size distribution) and properties of LSPs led to the difference in the MACcor (MAAP) values.
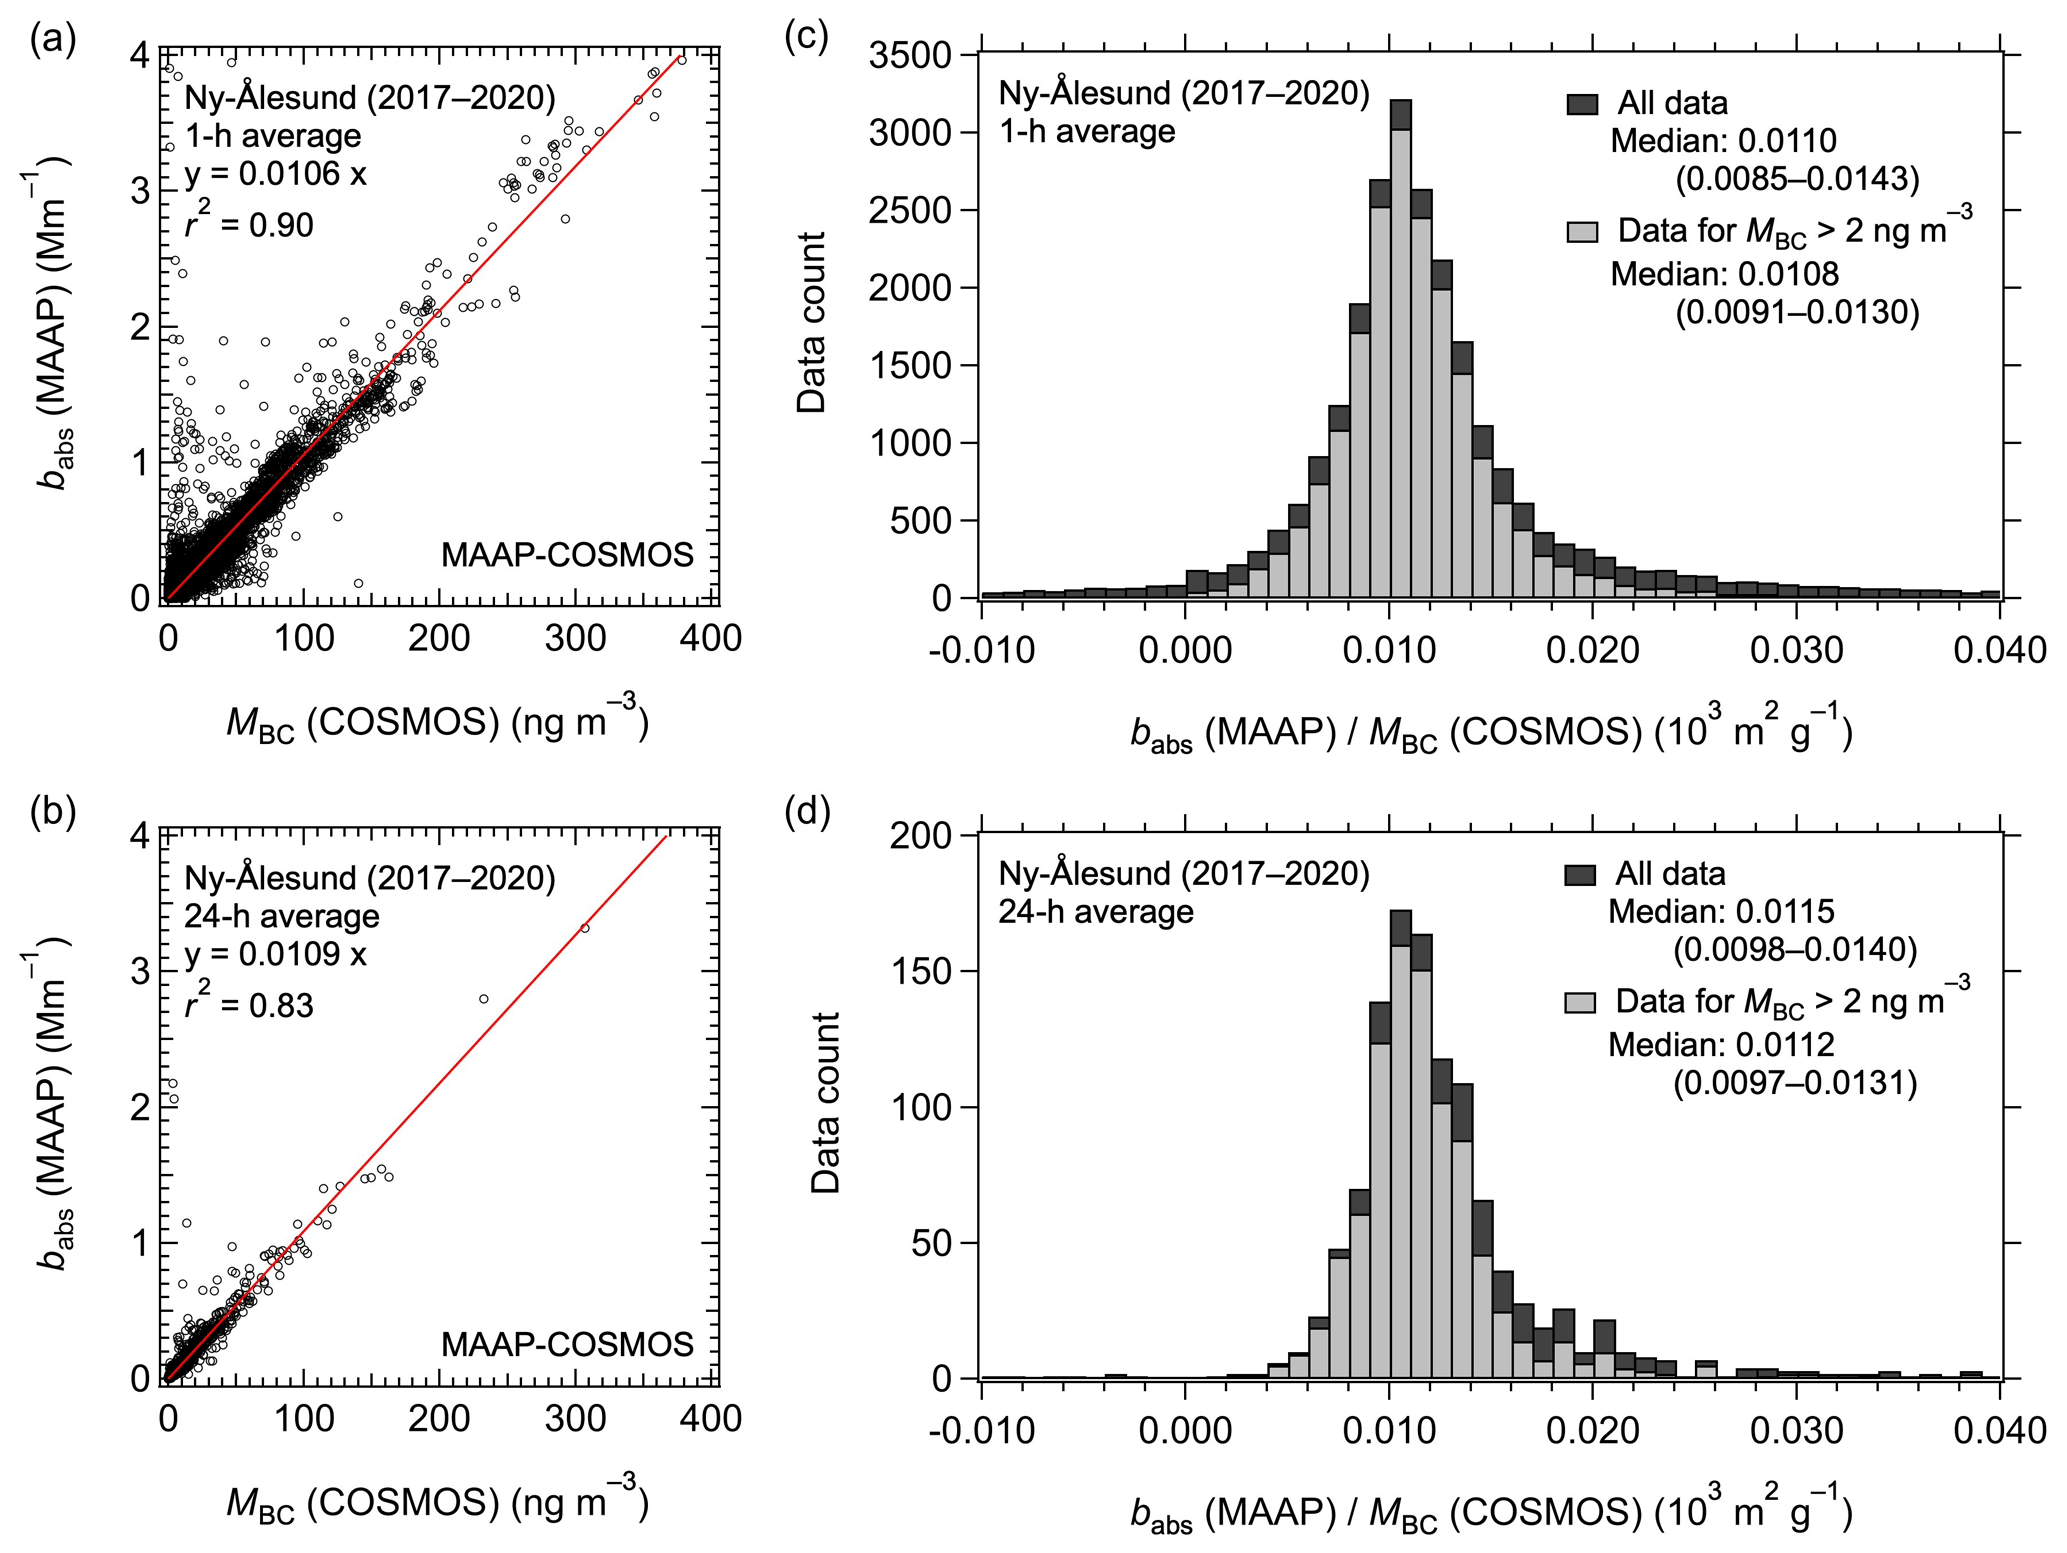
Figure 9Correlations of MBC (COSMOS) and babs (MAAP; λ= 637 nm) from January 2017 to December 2020 at Ny-Ålesund for (a) 1 h averaged and (b) 24 h averaged data. The solid red lines are the least-squares regressions forced through the origin. (c, d) Corresponding histograms of babs (MAAP) (COSMOS) ratios for all data and data with MBC (COSMOS) >2 ng m−3.
Year-to-year variations in MACcor (MAAP) are also shown in Fig. 7a and Table 8. The r2 values were generally high for each year, and the average MACcor (MAAP) during 2017–2020 was 11.1 ± 0.7 (1σ) and 11.7 ± 1.1 m2 g−1 for the 1 and 24 h data, respectively. The MACmed values of the babs (MAAP) (COSMOS) ratios were 10.8 and 11.2 m2 g−1 for the 1 and 24 h data, respectively (Fig. 9c and d). The difference between MACcor and MACmed was limited to 3 % (Table 3). As discussed for the PSAP and Aethalometer in the previous sections, the relative uncertainty becomes higher when the MBC values tend to be low (Fig. S6c and d in the Supplement).
Table 8Year-to-year variability of MACcor (MAAP; λ = 637 nm) and r2 at Ny-Ålesund.
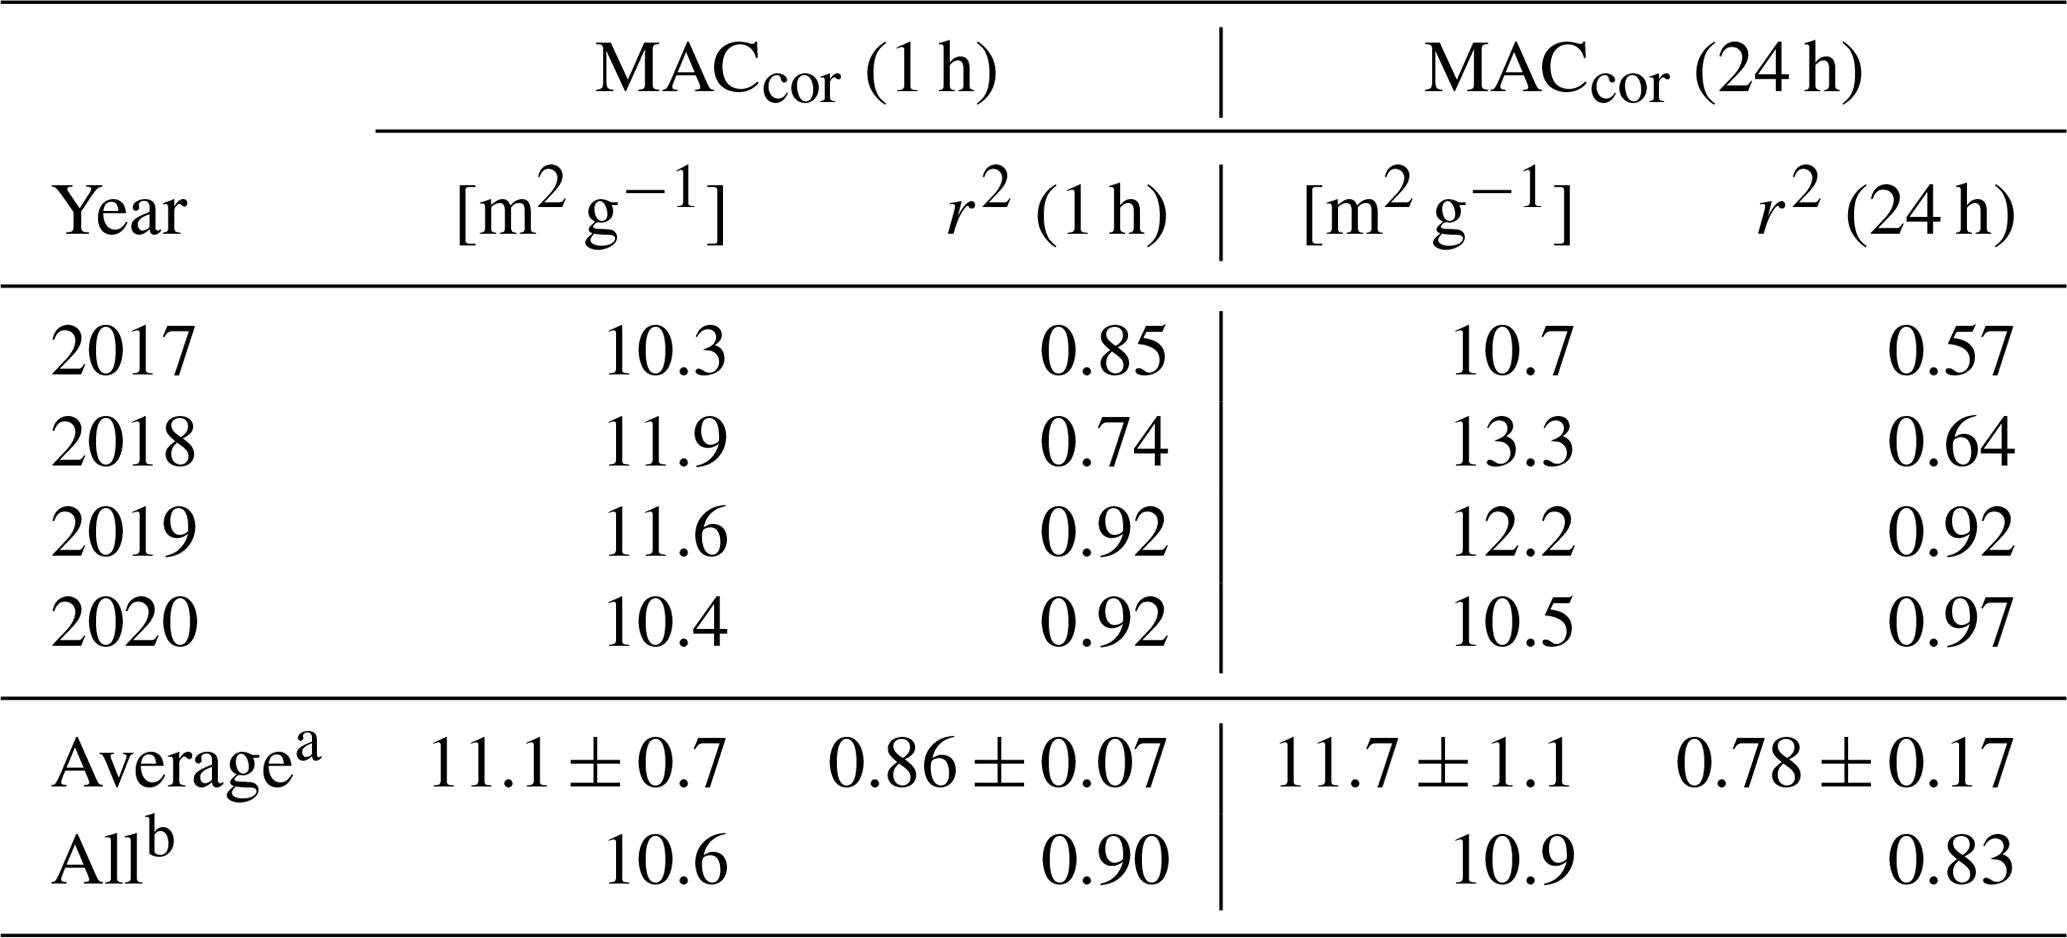
a Average and standard deviation for individual years. b Derived by regression slope for of all data points.
The MACcor (MAAP) and MACcor (PSAP) at Ny-Ålesund are compared in Table 11 in Sect. 3.6 after adjusting measurement wavelengths. MACcor (PSAP) values are 17 % and 20 % larger than MACcor (MAAP) values for 1 and 24 h data, respectively. A custom-built PSAP was used at Ny-Ålesund. The systematic difference of babs measured by the custom-built PSAP and MAAP was also observed at three European background sites (Zanatta et al., 2016), although the previously reported difference was much larger (more than 59 %) than that of our measurements at Ny-Ålesund.
3.3 Barrow
COSMOS and PSAP–CLAP comparison
Simultaneous measurements of PM1 for MBC (COSMOS) and babs (PSAP–CLAP) began at Barrow in 2012 (Sinha et al., 2017). At Barrow, both PSAP and CLAP aspired ambient air using PM1 and PM10 impactors alternately for 30 min of each hour. Here we used the data from PSAP–CLAP equipped with the PM1 impactor and data from PSAP in 2012–2015 and CLAP in 2016–2019 (Fig. S7 in the Supplement). Because the 24 h averaged babs (PSAP) and babs (CLAP) values agreed to within 2 % during 2012–2015 (Sinha et al., 2017) when the PSAP and CLAP overlapped, we consider the two instruments to be equivalent. The MBC (COSMOS) data from June 2018 to May 2019 were unavailable due to problems with the COSMOS instrument.
The babs (PSAP–CLAP; λ= 550 nm) data were strongly correlated with those for MBC (COSMOS) (r2= 0.88 and r2= 0.86; Fig. 10a and b), and the MACcor values (PSAP–CLAP) derived from 1 and 24 h averaged data for the whole period were 10.8 and 10.6 m2 g−1, respectively. Average MACcor (PSAP–CLAP) during 2012–2018 was stable at 11.0 ± 0.9 (1σ) m2 g−1 (Fig. 7b and Table 9). Yearly MBC (COSMOS) values did not exhibit large changes during this period (Fig. 7b). The babs (CLAP) data were weakly correlated with MBC (COSMOS) data during June–December 2019 (Table 9), indicating that either the CLAP or COSMOS results might not have been accurate during this period. Therefore, in Table 9 we calculated the average MACcor (PSAP–CLAP) by excluding the MAC value for 2019.
Table 9Year-to-year variability of MACcor (PSAP–CLAP; λ= 550 nm) and r2 at Barrow.
a Average and standard deviation for individual years. b Derived by regression slope for all data points.
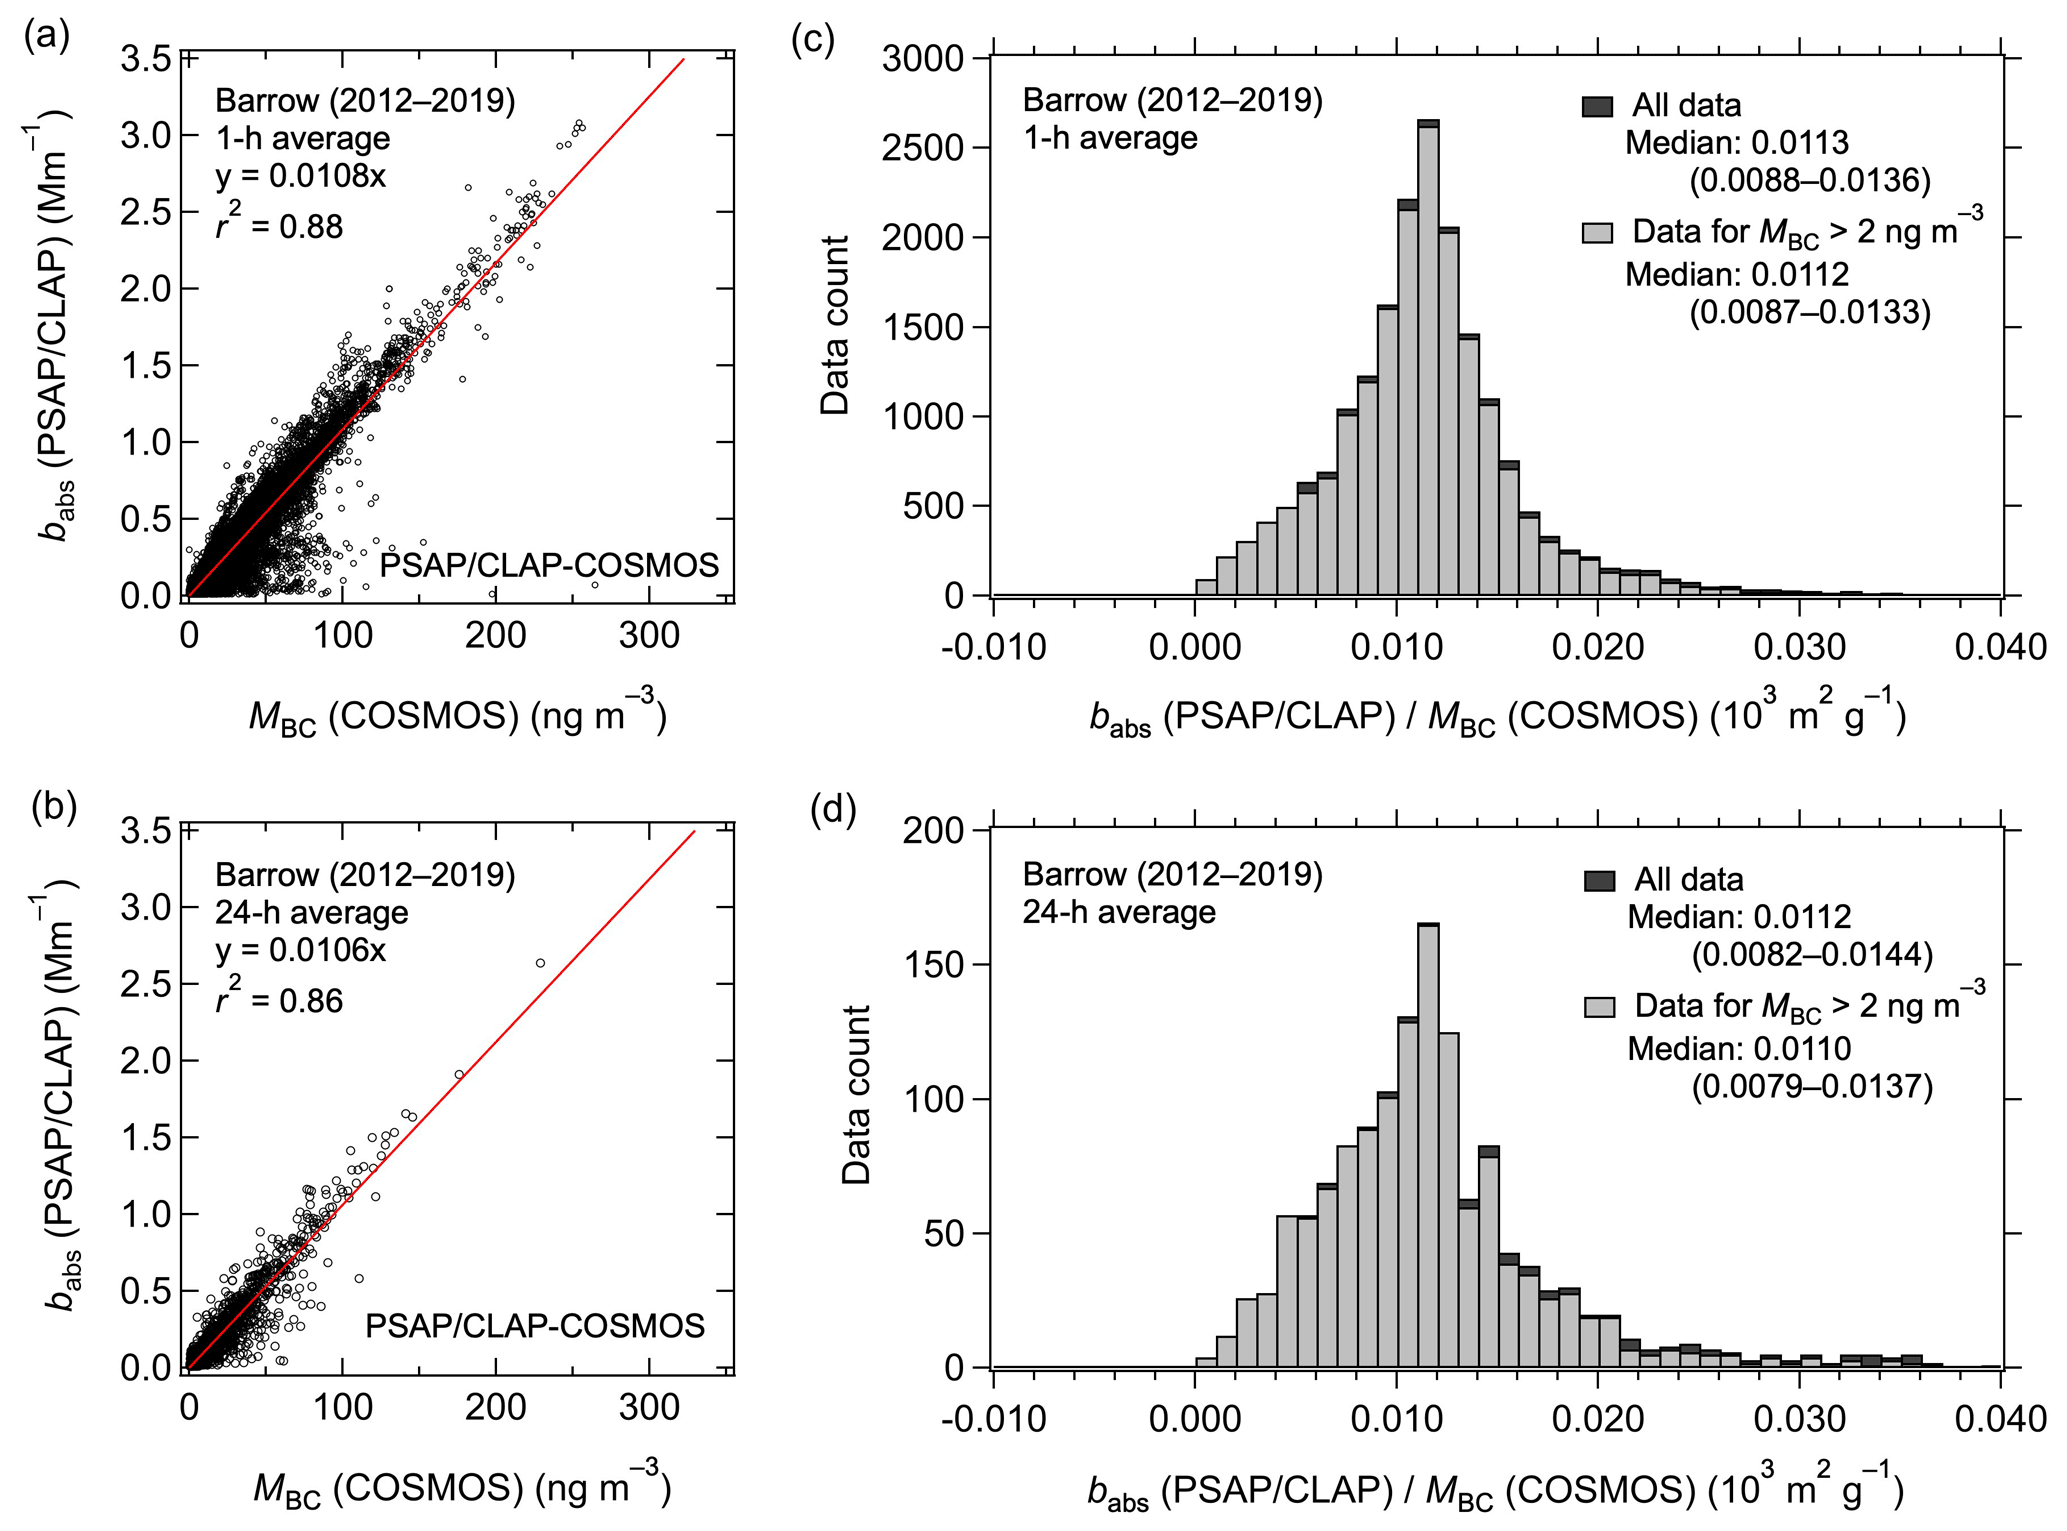
Figure 10Correlations of MBC (COSMOS) and babs (PSAP–CLAP; λ= 550 nm) from August 2012 to December 2019 at Barrow for (a) 1 h averaged and (b) 24 h averaged data. The solid red lines are the least-squares regressions forced through the origin. (c, d) Corresponding histograms of babs (PSAP–CLAP) (COSMOS) ratios for all data and data with MBC (COSMOS) >2 ng m−3.
The MACmed values of the babs (PSAP–CLAP) (COSMOS) ratios were 11.2 and 11.0 m2 g−1 for 1 and 24 h data (Fig. 10c and d), which are very close to the MACcor values of 10.8 and 10.6 m2 g−1, respectively (Table 3). Therefore, when either MACcor or MACmed is used for conversion of babs (PSAP–CLAP; λ= 550 nm) to MBC, the resulting MBC values differ by only about 4 %. The VMAC was about 25 % for babs (PSAP–CLAP; λ = 550 nm) at Barrow (Table 3). Because of scatter in the data, especially at lower MBC values (Fig. 10a and b), the interquartile ranges of the babs (PSAP) (COSMOS) ratios are much larger when MBC (COSMOS) is less than 10 ng m−3 (Fig. S7c and d).
3.4 Pallas
COSMOS–MAAP comparison
Measurements of babs (MAAP; λ= 637 nm) have been made since 2007 at the Global Atmospheric Watch (GAW) station at Pallas (Hyvärinen et al., 2011). PM10 and PM1 inlets were used for MAAP and COSMOS, respectively. MBC (COSMOS) measurements began in July 2019; we used the data collected up to July 2020 in this study. The MBC (COSMOS) data for about 3 months (February to April 2020) were unavailable due to an air sampling problem.
The babs (MAAP) 1 and 24 h values (Fig. S8 in the Supplement) were strongly correlated with those for MBC (COSMOS) with r2= 0.93 and r2= 0.95, respectively (Fig. 11a and b). MACcor (MAAP) was 13.0 m2 g−1 for both the 1 and 24 h data. This MACcor value is about twice the manufacturer's default setting (= 6.6 m2 g−1) of MAC (MAAP), possibly for the same reasons discussed in Sect. 3.2.3.

Figure 11Correlations of MBC (COSMOS) and babs (MAAP; λ= 637 nm) from July 2019 to July 2020 at Pallas for (a) 1 h averaged and (b) 24 h averaged data. The solid red lines are the least-squares regressions forced through the origin. (c, d) Corresponding histograms of babs (MAAP) (COSMOS) ratios for all data and data with MBC (COSMOS) >2 ng m−3.
The MACmed values of the babs (MAAP) (COSMOS) ratios for the 1 and 24 h data were 12.4 and 13.1 m2 g−1, respectively (Fig. 11c and d), which are very close to that for MACcor (13.0 m2 g−1 for both 1 and 24 h data, Table 3). Therefore, the difference between the estimated MBC values is less than 5 % when these MACcor or MACmed values are used for conversion of babs (MAAP) to MBC. The VMAC was about 25 % for babs (MAAP) at Pallas (Table 3). The MACmed values for low MBC data (MBC (COSMOS) <10 ng m−3) are very close to those for all datasets (Fig. S8c and d in the Supplement).
3.5 Fukue Island
3.5.1 COSMOS–SP2 comparison
The UT-SP2 was operated at Fukue for 3 weeks in April 2019 (Yoshida et al., 2020), as mentioned in Sect. 2.2.1. Figure 12a shows the number and mass size distributions of BC measured by the UT-SP2 averaged over the observation period. In addition to the MBC (SP2) derived by integrating the mass size distributions over the detectable diameter range (Dm= 70–850 nm), we also estimated MBC (SP2) in the Dm= 30–1000 nm range by fitting a lognormal function to the data. As the two sets of MBC (SP2) values deviated by less than 2 %, we used the former MBC (SP2) for comparison with MBC (COSMOS). The time series of hourly values of MBC (COSMOS) were strongly correlated (r2= 0.97) with MBC (SP2) (Fig. 12b), and the slope of the regression was 0.92 (Fig. 12c). This relationship agrees with those observed by Ohata et al. (2019) at Tokyo, Cape Hedo, and Ny-Ålesund and those observed at Alert (Sect. 3.1.1), thus confirming the clear and consistent relationship between MBC (COSMOS) and MBC (SP2). Miyakawa et al. (2017) also reported a strong correlation (r2= 0.92; regression slope 1.14) between MBC (COSMOS) and MBC (SP2) at Fukue in spring 2015 by using an SP2 maintained and calibrated by the Japan Agency for Marine-Earth Science and Technology.
The degree of agreement between MBC (COSMOS) and MBC (SP2) at Fukue was also examined on a logarithmic scale in Fig. S1b in the Supplement. When MBC (SP2) is lower than ∼ 70 ng m−3, MBC (COSMOS) tended to be slightly higher than MBC (SP2). A similar feature was previously reported at Cape Hedo in Japan (Ohata et al., 2019). The Cape Hedo site is located near the coast (i.e., the distance from this site to the coast is ∼ 0.2 km), and the interference of submicron sea salt particles might contribute to this feature (Ohata et al., 2019). At Fukue, when maritime air mass is transported to the site, the relative abundance of sea salt particles to BC might also be enhanced, possibly affecting the COSMOS measurements, although the distance from the site to the coast (∼ 1.5 km) is slightly farther than for Cape Hedo. This feature was not clearly observed by a previous study at Fukue (Miyakawa et al., 2017).
3.5.2 COSMOS–MAAP comparison
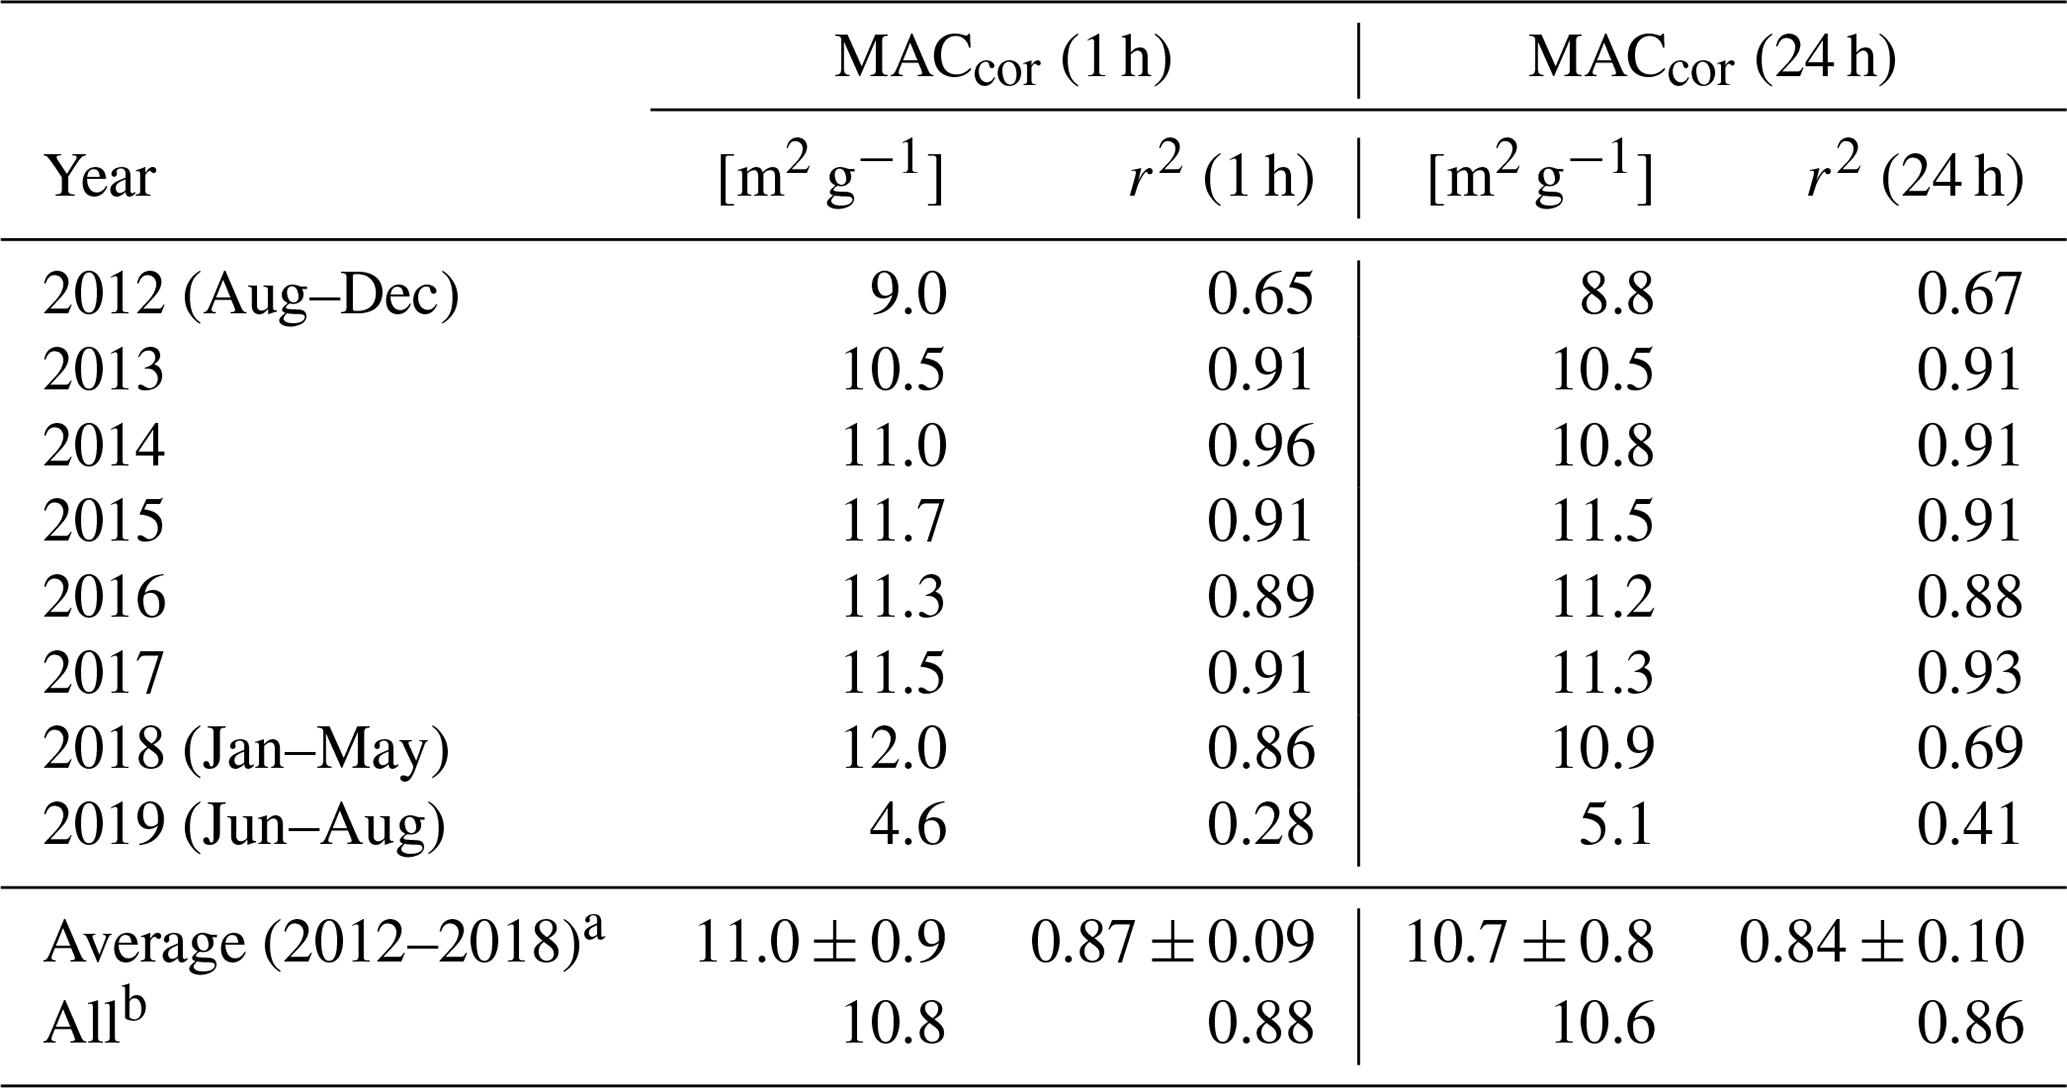
Kanaya et al. (2013, 2016, 2020) made simultaneous measurements of MBC (COSMOS) and babs (MAAP; λ= 639 nm) at Fukue for about 10 years (April 2009–May 2019; Fig. S9 in the Supplement). The air inlet for MAAP and COSMOS was equipped with a PM1 cyclone after November 2011. Before that a PM2.5 cyclone was used instead. babs (MAAP) was highly correlated (r2= 0.94) with MBC (COSMOS), and the MACcor (MAAP) for the entire period was found to be 10.8 and 10.9 m2 g−1 for the 1 and 24 h data (Fig. 13a and b), respectively. Because the correlation of babs (MAAP) with MBC (COSMOS) was also strong for individual years, MACcor (MAAP) for each year was also derived (Fig. 7c and Table 10). MBC (COSMOS) decreased by about 50 % during this period, owing to a large decrease in BC emissions in China (Kanaya et al., 2020). However, the yearly average MACcor (MAAP) values were stable at 11.1 ± 1.0 (1σ) m2 g−1 for both the 1 and 24 h data, despite the large change in MBC (COSMOS). This MACcor value is about 70 % higher than the manufacturer's default setting (= 6.6 m2 g−1), possibly for the same reasons discussed in Sect. 3.2.3.
Table 10Year-to-year variability of MACcor (MAAP; λ = 639 nm) and r2 at Fukue.
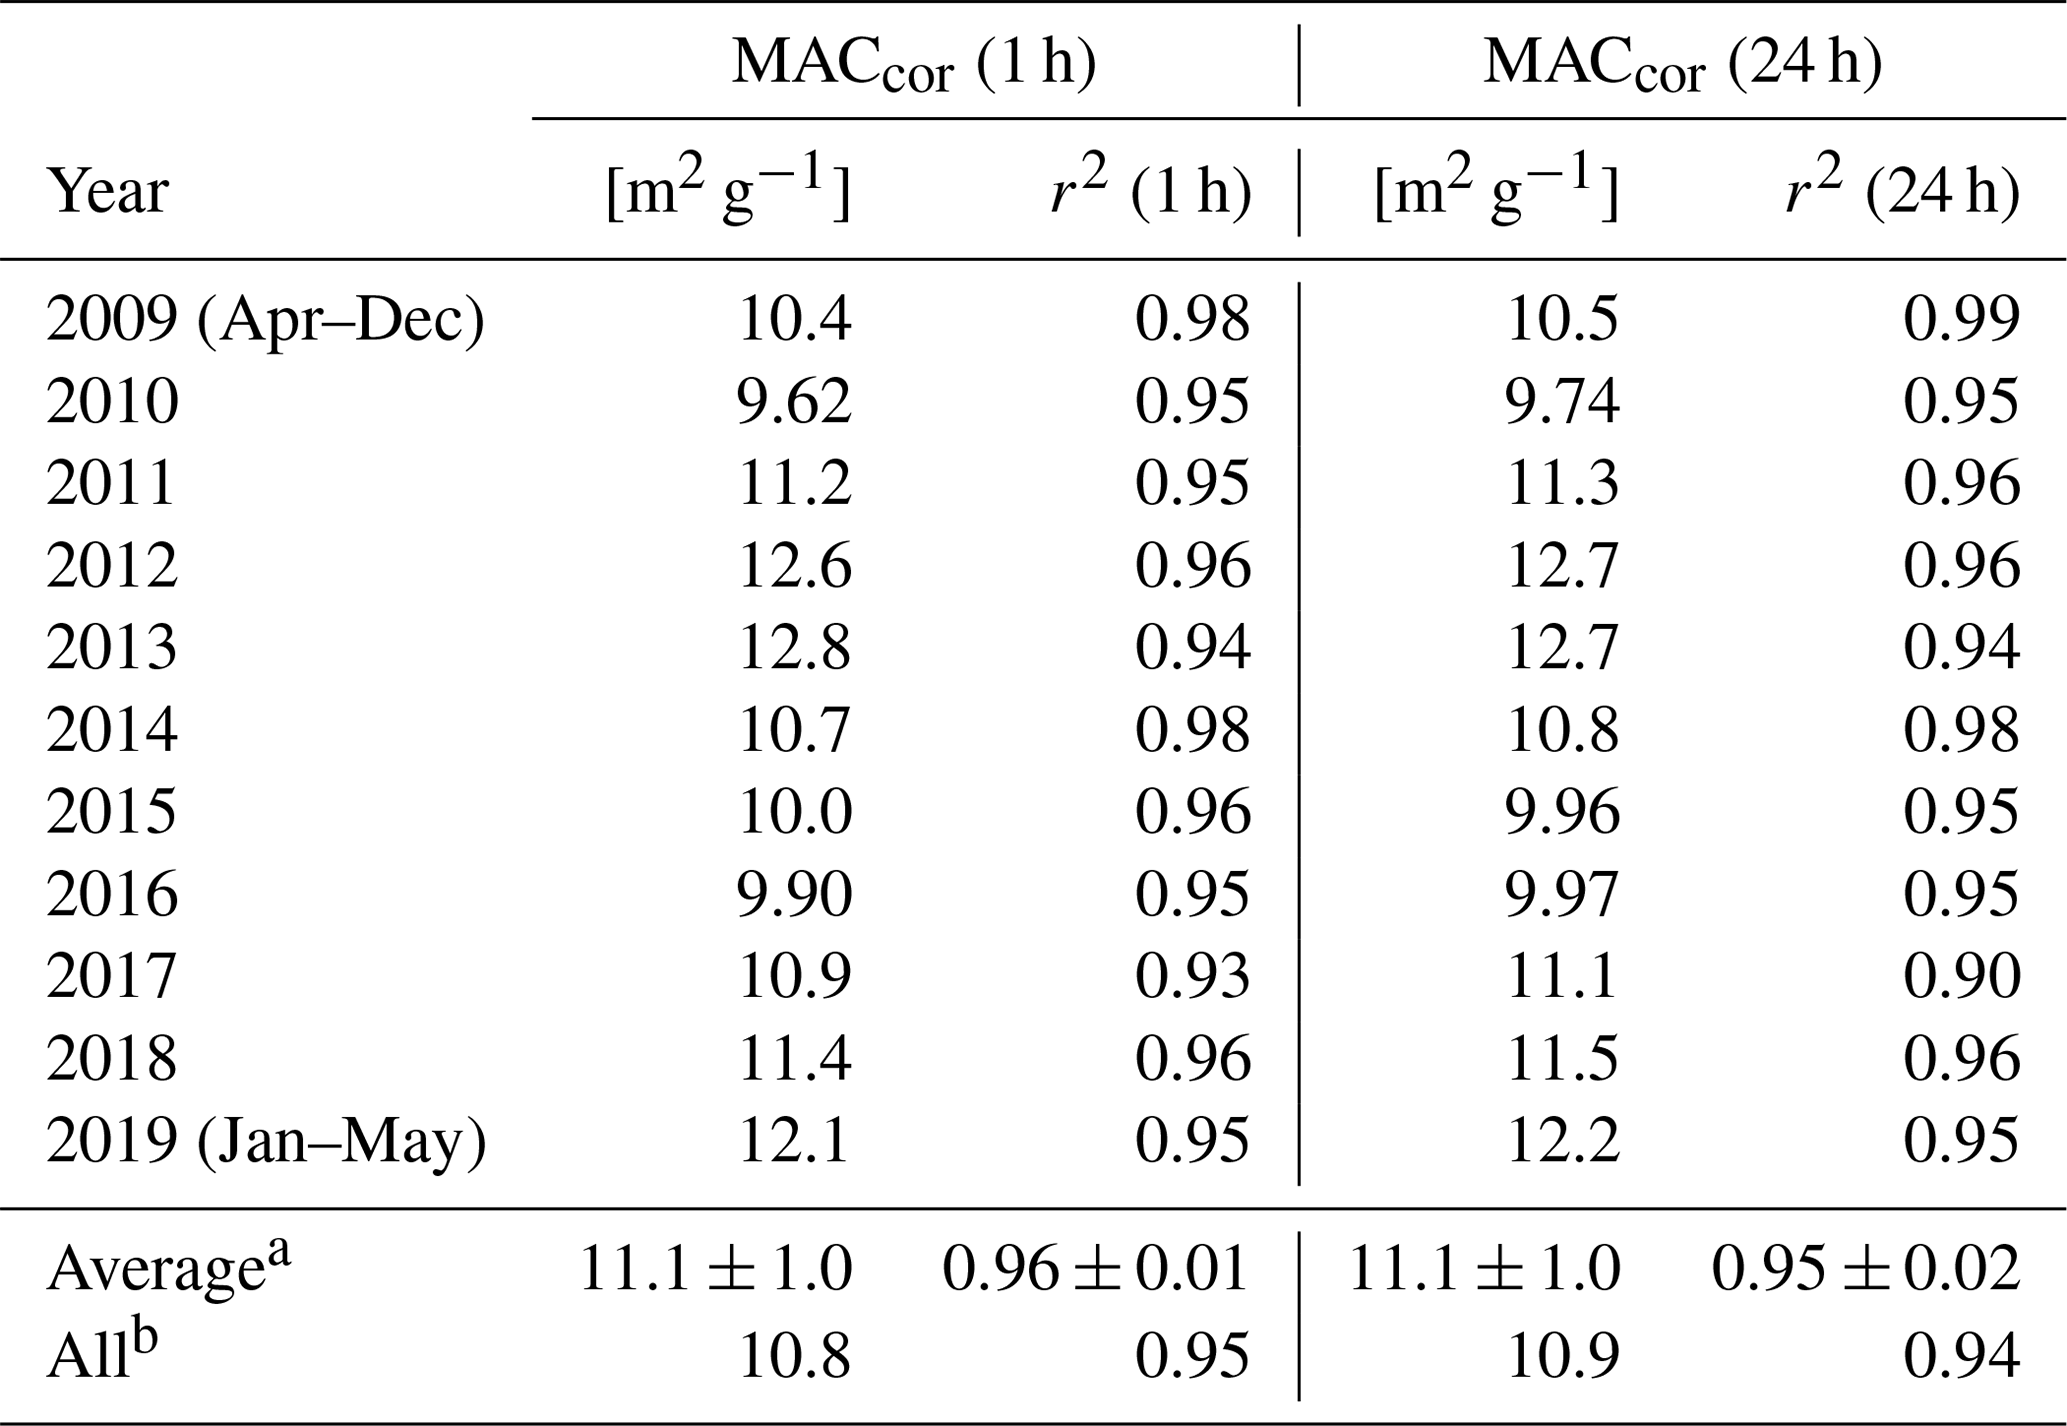
a Average and standard deviation for individual years. b Derived by regression slope for all data points.
Because the amount of data with MBC less than 2 ng m−3 was very small at Fukue, the MACmed values and the interquartile ranges of the babs (MAAP) (COSMOS) ratios were obtained for all data without applying any MBC threshold. The MACmed was 11.4 m2 g−1 for both 1 and 24 h data (Fig. 13c and d), which agrees well (within 6 %) with the MACcor values derived from correlation plots (10.8 and 10.9 m2 g−1 for 1 and 24 h data, respectively) (Table 3). Therefore, using either MACcor or MACmed for conversion of babs (MAAP) to MBC affects the resulting MBC values by less than 6 %. The VMAC was about 15 %, which is lower than those at Arctic sites (Table 3) partly because the higher MBC (COSMOS) values at Fukue make the calculated ratios more stable. Also, aerosol properties including mixing states of BC might be more stable at Fukue than those at the Arctic sites examined in this study.
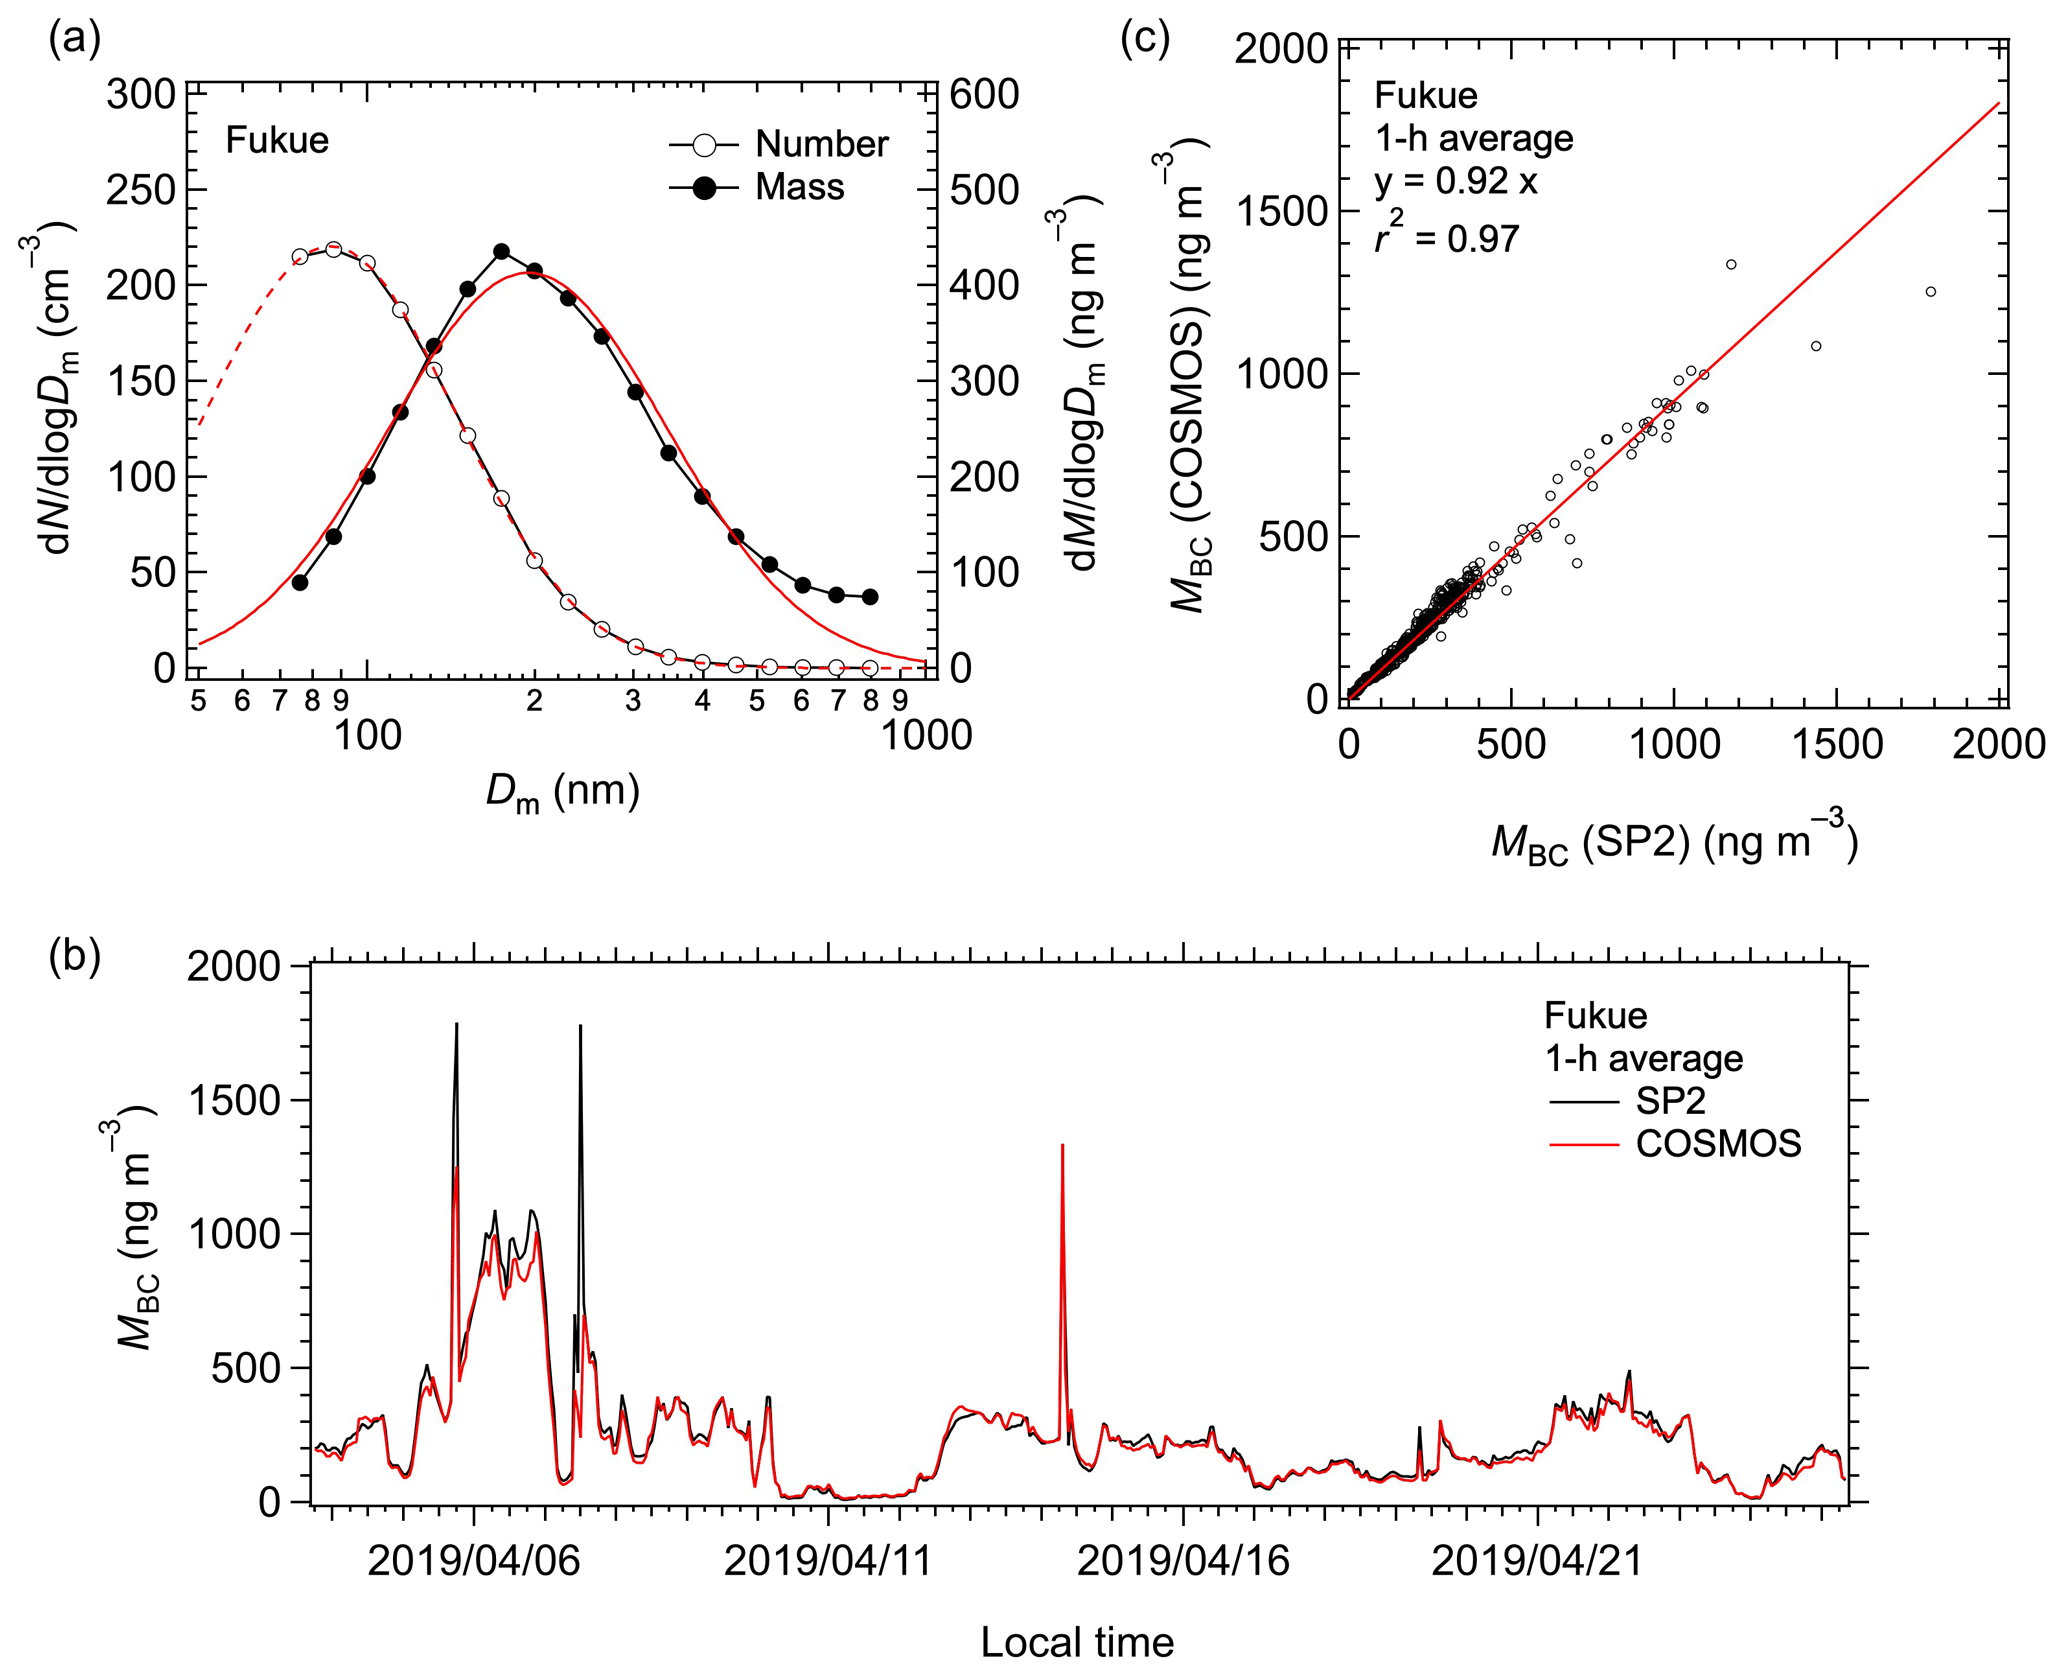
Figure 12(a) Number and mass size distributions of BC averaged over the observation period at Fukue in April 2019. The dashed (solid) red line is the lognormal fit to the number (mass) size distribution. (b) Time series (1 h data) and (c) correlation of MBC measured by COSMOS and SP2. The solid red line in the correlation plot is the least-squares regression forced through the origin.
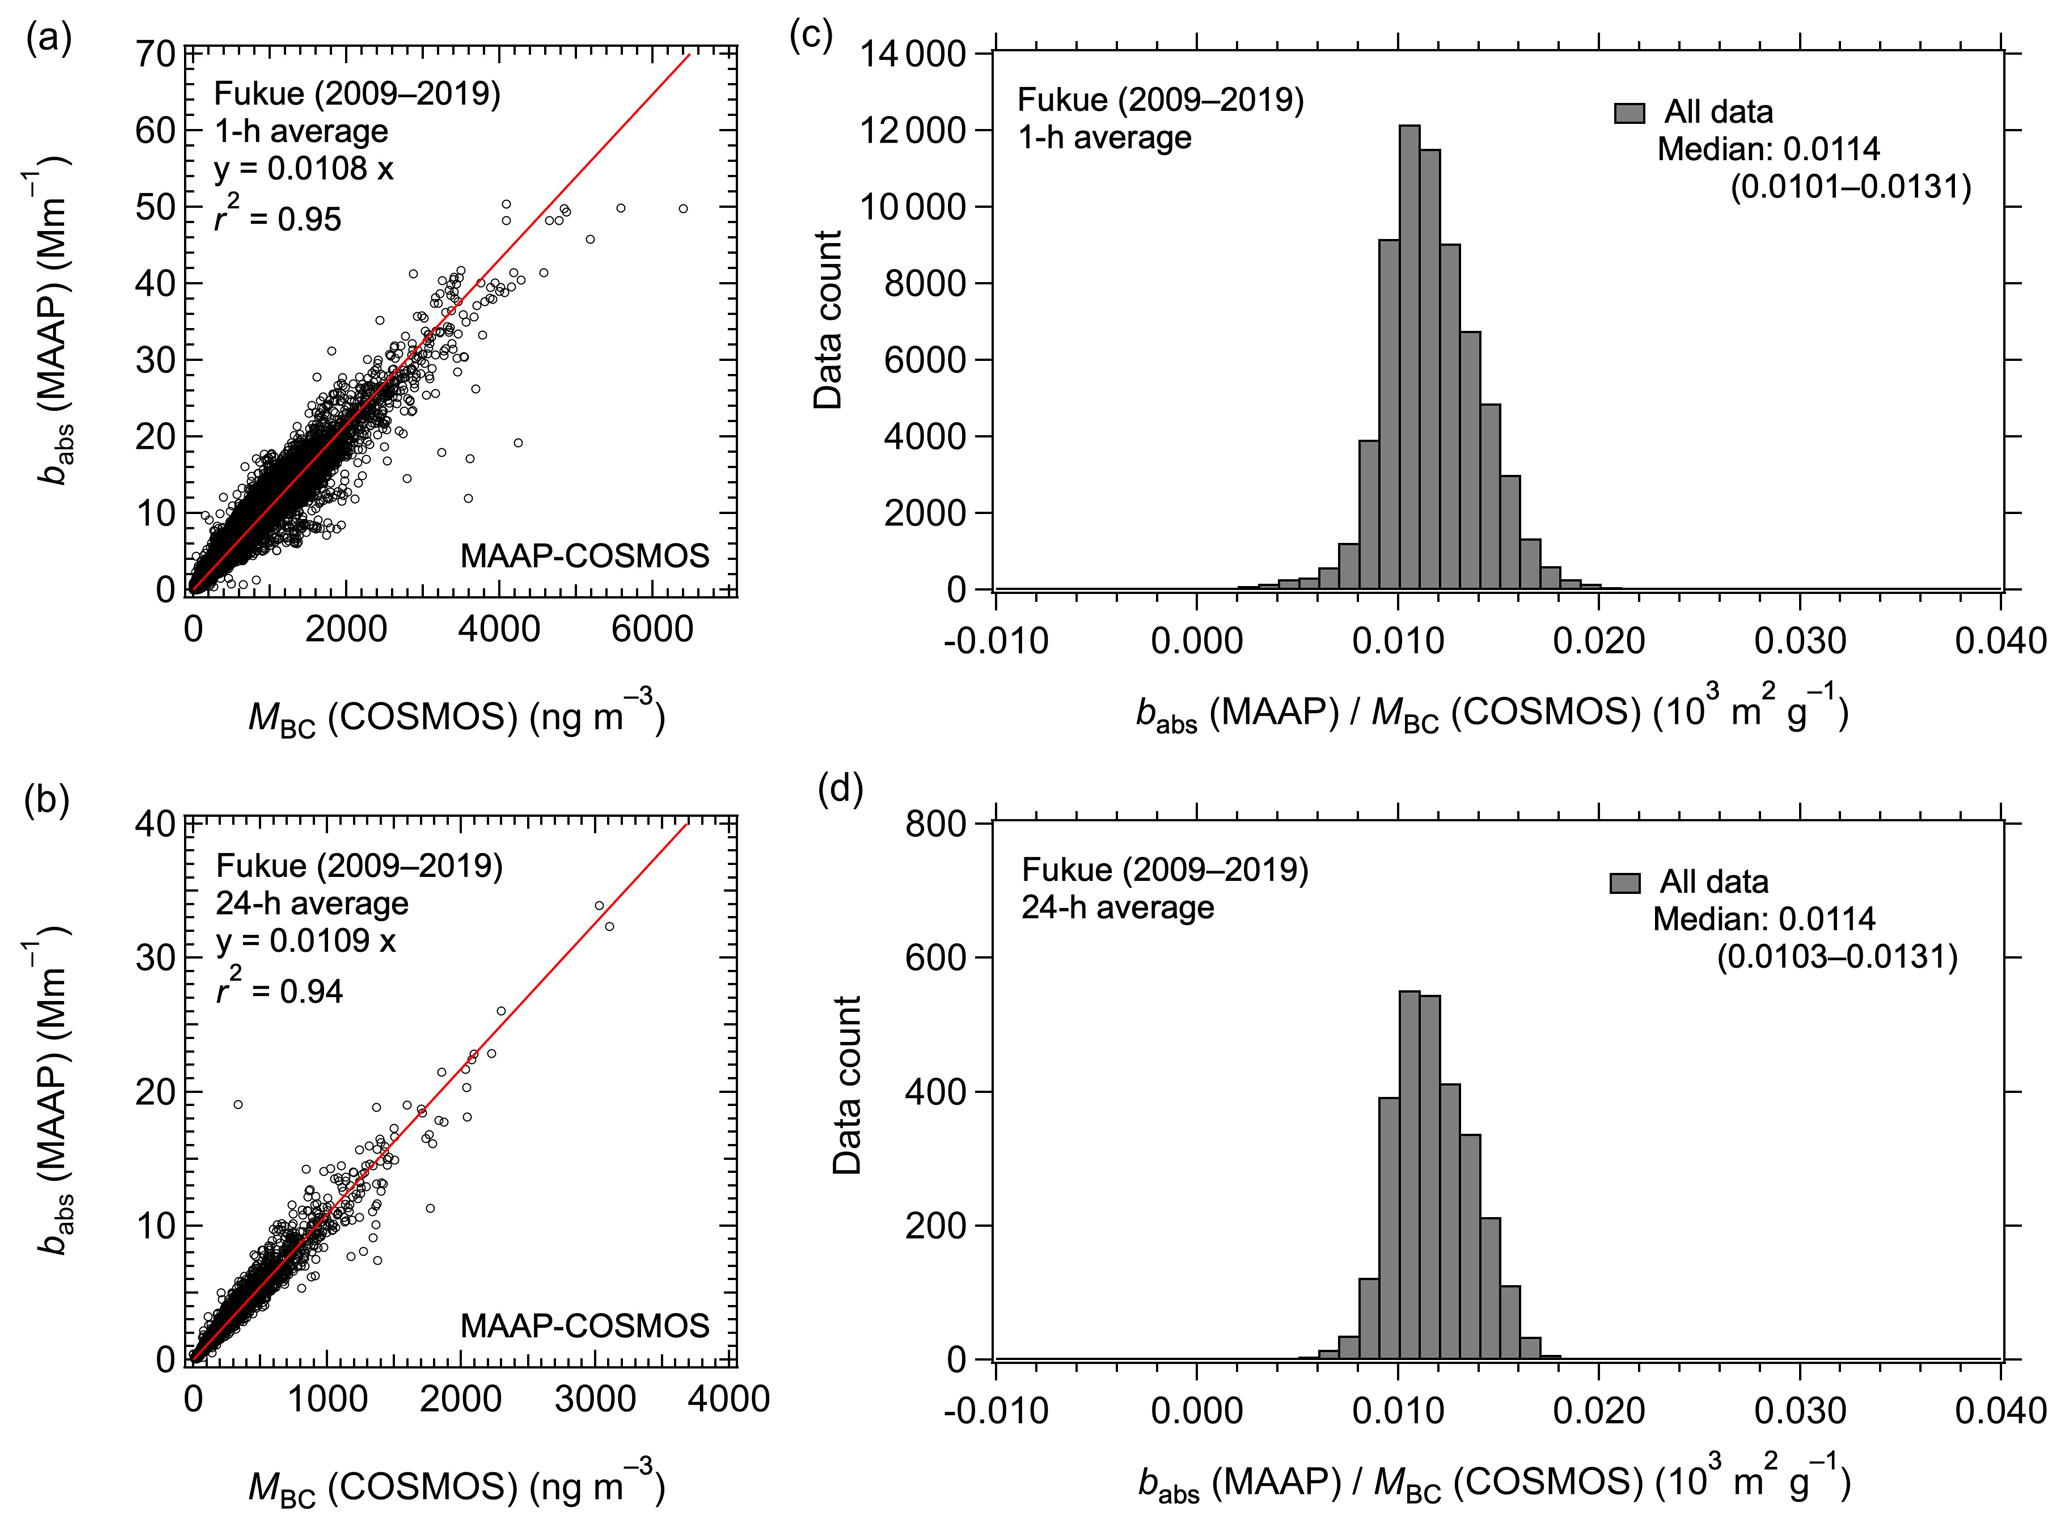
Figure 13Correlations of MBC (COSMOS) and babs (MAAP; λ= 639 nm) from April 2009 to May 2019 at Fukue for (a) 1 h averaged and (b) 24 h averaged data. The solid red lines are the least-squares regression forced through the origin. (c, d) Corresponding histograms of babs (MAAP) (COSMOS) ratios.
3.6 Spatial variability of MACcor and r2
In previous sections, we showed that the MACcor values depended on instrument and observation site. The values of MACcor (λ= 550 nm) and r2 are summarized in Table 11. Here, the MACcor (MAAP; λ ∼ 637 nm) and MACcor (Aethalometer; λ = 590 nm) values were adjusted to those at λ= 550 nm by assuming an absorption Ångström exponent of 1.0 (i.e., a λ−1 relationship). The unit-to-unit variations in babs measurements were reported to be within 5 % for MAAP (Müller et al., 2011), 6 % for PSAP (Bond et al.,1999), and 4 % for CLAP (Ogren et al., 2017), if the careful calibration of flows and filter sampling spot sizes of these instruments are made for individual units. Therefore, the spatial variations in MACcor values observed in this study likely reflect differences of aerosol properties at the observation sites.
Table 11MACcor and r2 for MAAP, PSAP–CLAP, and Aethalometer at λ= 550 nm at observation sites in this study.
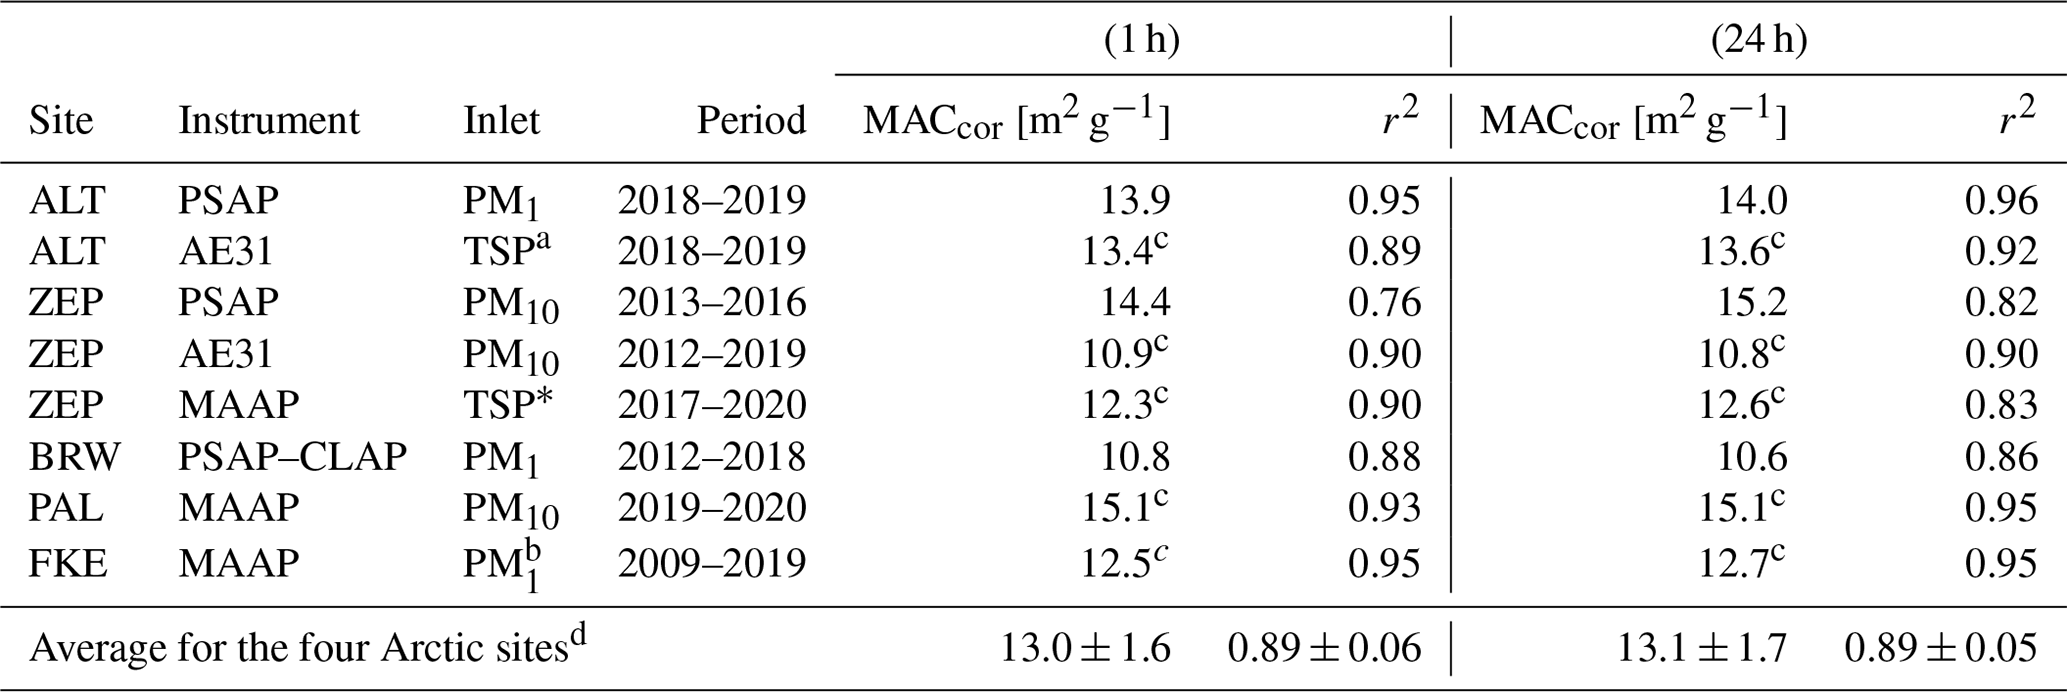
a Total suspended particles. b A PM2.5 cyclone was used before November 2011. c MACcor (MAAP; λ ∼ 637 nm) and MACcor (Aethalometer; λ= 590 nm) values were adjusted to λ= 550 nm by assuming an absorption Ångström exponent of 1.0. d Average and standard deviation values were calculated excluding MAAP data at Fukue.
The values of MACcor (PSAP) at Alert and MACcor (PSAP–CLAP) at Barrow were both determined with a PM1 size cut, and they differed by about 22 % for 1 h data. Differences in aerosol properties including mixing states of BC at these sites could contribute to the different MAC values, although this effect cannot be assessed quantitatively with only this dataset. The correlations of babs (PSAP) with MBC (COSMOS) at Alert were somewhat higher (r2= 0.95–0.96) than those of babs (PSAP–CLAP) at Barrow (r2= 0.86–0.88). The stronger correlation of babs (PSAP) with MBC (COSMOS) at Alert suggests that environmental conditions including LSP BC ratios and mixing states of BC were more stable at Alert. We found that, at Alert, babs (PSAP) data with loading and scattering corrections were strongly correlated with the uncorrected babs (PSAP) data, and the contribution of the loading and scattering corrections was about 35 %, on average. In contrast, at Barrow, the contribution of these corrections was about 63 %. This suggests that at Alert, the LSP BC ratio was small and stable, and the influence of LSPs on derived babs (PSAP) was small. The greater distance from continental sources of aerosols at Alert than at Barrow (Fig. 1) may contribute to these observed differences.
At Ny-Ålesund, where a PM10 inlet was used, the MACcor (PSAP) values were higher than those at Alert and Barrow. Also, the r2 values at Ny-Ålesund (r2= 0.76–0.82) were lower than those at Alert. Effects of particles larger than 1 µm including dust and sea salt may partly contribute to the larger MAC and lower r2 values at Ny-Ålesund.
The MACcor (PSAP) and MACcor (Aethalometer) agree to within 4 % for 1 h data at Alert, in spite of the different particle size cut of the inlets. However, they differed by about 24 % for 1 h data at Ny-Ålesund. Although the agreements were somewhat better for 2015–2016 at Ny-Ålesund (Fig. 7a), the reason for the overall discrepancy is unknown. Furthermore, while the MACcor (PSAP) at Ny-Ålesund was higher than that at Alert, the opposite result was obtained by Aethalometers, which is not easily interpreted.
The values of MACcor (MAAP) determined at Ny-Ålesund and Pallas differ by about 18 %. This difference may be attributed to the difference of average mixing states of BC and properties of other co-existing aerosols, which were affected by environmental conditions. Because these are the only available MACcor (MAAP) datasets derived from MBC (COSMOS) in the Arctic, it is difficult to further evaluate spatial variability.
We have shown that in general babs values obtained by PSAP, CLAP, Aethalometer, and MAAP were strongly correlated with MBC (COSMOS) at all four Arctic sites, although the strength of the correlations differed somewhat among the sites. Based on the analysis of variations among these sites, MACcor and MACmed were most stable for PSAP with a PM1 inlet at Alert and most variable for PSAP with a PM10 inlet at Ny-Ålesund (Table 3). The average MACcor (λ= 550 nm) values at these four Arctic sites were 13.0 ± 1.6 (1σ; 12 % of the average) and 13.1 ± 1.7 (1σ; 13 %) m2 g−1 for 1 and 24 h data, respectively (Table 11). However, these correlations and resulting MACcor values may not hold outside the Arctic, where environmental conditions can be very different, especially the mixing states of BC and amount of interference by LSPs.
Zanatta et al. (2016), using MEC measured by the thermal–optical transmittance method with the EUSAAR-2 protocol instead of MBC (COSMOS), reported the average MACcor value at λ= 637 nm for nine European background sites to be 10.0 m2 g−1. From this MACcor (λ= 637 nm) value, the value of MACcor at λ= 550 nm is calculated to be 11.6 m2 g−1 by assuming an absorption Ångström exponent of 1.0. Although their MACcor values were generally obtained using PM10 inlets or without particle size cuts, their average MACcor value (= 11.6 m2 g−1) is about 11 % lower than our average MACcor value (13.0–13.1 m2 g−1) at four Arctic sites determined in this study. This discrepancy may be partly due to the different methods used to determine absolute mass concentrations of BC.
Mason et al. (2018) derived the values of MACcor (PSAP) and MACcor (CLAP) for PM1 size range in biomass burning and agriculture fire plumes during the SEAC4RS aircraft observation campaign by using MBC (SP2) data. They reported the MACcor (PSAP; λ= 532 nm) and MACcor (CLAP; λ= 532 nm) values to be 21.0 and 26.5 m2 g−1, respectively, which are about 60 % larger than the average MACcor value (13.0–13.1 m2 g−1) determined in this study. Although the causes for their very high MACcor values are not clear, one possible explanation given by Mason et al. (2018) is the considerable amount of additional absorbers other than BC, including tar balls, that might have existed in their samples. Also, strong lensing effects by BC coatings could contribute to the high MACcor values. Thus, the MACcor values can be highly dependent on environmental conditions, and those reported in the present study are considered to be site-specific values, although the variability (1σ) of our MACcor values at the four Arctic sites was within 13 % of the average MACcor value for these four sites.
Long-term measurements of MBC by ground-based instruments are needed to investigate changes in the emission, transport, and deposition of BC. Various types of filter-based absorption photometers, including the particle absorption soot photometer (PSAP), the continuous light absorption photometer (CLAP), the Aethalometer, and the multi-angle absorption photometer (MAAP), have been used in the Arctic. To date, the accuracy of MBC estimated from absorption coefficients (babs) measured by these instruments has not been adequately assessed, mainly because of a lack of simultaneous and reliable MBC measurements.
In this paper, we introduced a systematic methodology to derive MBC from babs measured by these instruments. To obtain accurate values of MBC, we used a filter-based absorption photometer with a heated inlet (COSMOS), which we calibrated to within 10 % uncertainty with an SP2 deployed in Tokyo. Individual COSMOS instruments used for field observations were calibrated against the standard COSMOS to within about 10 %. The accuracy of MBC (COSMOS) has previously been demonstrated to be about 15 % by comparison with MBC (SP2) for sites in Asia and the Arctic. The effect on MBC (COSMOS) of interference by light-absorbing FeOx particles was estimated to be only a few percent, owing partly to the particle size cutoff of 1 µm by the PM1 cyclone used. This effect may be somewhat higher for the other filter-based absorption photometers equipped with larger particle size cuts. The two necessary conditions for application of our method are a high correlation of babs with independently measured MBC and long-term stability of the slope of the regression, which represents MACcor.
We compared babs (PSAP–CLAP) with MBC (COSMOS) at Alert (PM1) for 2 years, Ny-Ålesund (PM10) for 4 years, and Barrow (PM1) for 7 years. The babs (PSAP–CLAP) was highly correlated with MBC (COSMOS) at these sites. For 1 h data, the MACcor (PSAP–CLAP) at λ= 550 nm was 13.9 m2 g−1 at Alert, 14.4 m2 g−1 at Ny-Ålesund, and 10.8 m2 g−1 at Barrow. The VMAC was 19 % at Alert, 37 % at Ny-Ålesund, and 22 % at Barrow (Table 3).
We also compared babs (Aethalometer) with MBC (COSMOS) at Alert (total suspended particles) for 2 years and at Ny-Ålesund (PM10) for 8 years. They were highly correlated, and the MACcor (Aethalometer; λ= 590 nm) for 1 h data was 12.5 m2 g−1 at Alert and 10.2 m2 g−1 at Ny-Ålesund. One of the manufacturer's suggested MAC (Aethalometer) values is given by 14 625 (λ × C0), which corresponds to 7.1 m2 g−1 for λ= 590 nm and C0= 3.5 and which is considerably lower than the values obtained in our study. The VMAC was 22 % at Alert and 25 % at Ny-Ålesund (Table 3).
The babs (MAAP) and MBC (COSMOS) were also compared at Ny-Ålesund (total suspended particles) for 4 years, at Pallas (PM10) for about 1 year, and at Fukue (PM1) for about 10 years. babs (MAAP) was highly correlated with MBC (COSMOS) at these sites. For 1 h data, The MACcor (MAAP) at λ= 637 nm was 10.6 m2 g−1 at Ny-Ålesund and 13.0 m2 g−1 at Pallas. The MACmed (MAAP) at λ= 639 nm at Fukue was stable at 11.1 ± 1.0 m2 g−1, despite a 50 % decrease in MBC (COSMOS) during this period (Fig. 7c). The default setting of MAC (MAAP) by the manufacturer (6.6 m2 g−1) is about half the MACcor obtained in this study, indicating a similar overestimation of MBC if the default value is used to convert babs (MAAP) to MBC at these sites. For 1 h data, the VMAC was 20 % at Ny-Ålesund, 27 % at Pallas, and 15 % at Fukue.
Our results show that Arctic MBC can be derived from babs obtained from PSAP, CLAP, Aethalometer, and MAAP measurements with reasonable accuracy by using the MACcor obtained from the regression slope of the babs–MBC correlation, especially for long data-averaging times. However, scatter in babs–MBC (COSMOS) correlations indicate that the accuracy of this method will be somewhat lower than that achieved by direct measurement of MBC (COSMOS). We also caution that the reliability of the use of babs data to derive MBC at other locations, especially those outside the Arctic, is unknown. Rigorous comparisons with COSMOS or SP2 data, such as those of this study, are required if use of our method is to expand beyond the Arctic region. Moreover, long-term comparisons are desirable for accurate determination of the MACcor. Short-term comparisons will be of limited value for understanding the variability of MAC for each instrument and location.
The MBC and babs dataset used in this publication is available online (Ohata et al., 2020; https://ads.nipr.ac.jp/dataset/A20201120-001; last access: 14 October 2021).
The supplement related to this article is available online at: https://doi.org/10.5194/amt-14-6723-2021-supplement.
SO, TM, and YutK designed the study, conducted the analyses, and wrote the paper. SS and DV contributed to the field observations and data analysis of SP2, PSAP, CLAP, and Aethalometer at Alert. AH, EiA, JB, and HS contributed to the field observations and data analysis of MAAP at Pallas. ElA contributed to the field observations and data analysis of PSAP and CLAP at Barrow. PT obtained and analyzed PSAP data at Ny-Ålesund. KE and SV obtained and analyzed Aethalometer data at Ny-Ålesund. RK and PZ obtained and analyzed MAAP data at Ny-Ålesund. YugK contributed to the field observations and data analysis of MAAP and COSMOS at Fukue. AY and NM obtained and analyzed SP2 data at Fukue. SO, TM, YutK, MK, YZ, YT, JM, and NO contributed to instrument maintenance and data analysis of COSMOS.
The contact author has declared that neither they nor their co-authors have any competing interests.
Publisher’s note: Copernicus Publications remains neutral with regard to jurisdictional claims in published maps and institutional affiliations.
We thank Kevin Rawlings, Melody Fraser, and other technicians and contractors at Environment and Climate Change (Canada) and CFS Alert for operations and maintenance of the Alert site. We thank Bryan Thomas, Peter Detwiler, and Ross Peterson for supporting the measurements at Barrow. We thank the staff of the Norwegian Polar Institute for supporting the measurements at Ny-Ålesund (Zeppelin). This research was performed by the Environment Research and Technology Development Fund (JPMEERF20142003, JPMEERF20152005, JPMEERF20172003, JPMEERF20182003, JPMEERF20202003, and JPMEERF20205001) of the Environmental Restoration and Conservation Agency of Japan; the Japanese Ministry of Education, Culture, Sports, Science, and Technology; the Japan Society for the Promotion of Science KAKENHI grants (JP12J06736, JP1604452, JP18H04143, JP19H05699, JP23221001, JP25220101, JP26241003, JP26701004, JP16H01770, JP17H04709, JP18H03363, JP19K20437, JP19K20441, and JP20H00638); the Arctic Challenge for Sustainability (ArCS) project (JPMXD1300000000); the Arctic Challenge for Sustainability II (ArCS II) project (JPMXD1420318865); and a grant for the Global Environmental Research Coordination System from the Ministry of the Environment, Japan (MLIT1753). Pallas and Zeppelin measurements and/or analysis were conducted under the financial support of ACTRIS by the European Union's Horizon 2020 research and innovation program under grant agreement no. 654109, partly under the European Union's Horizon 2020 research and innovation program under grant agreement no. 689443 via project iCUPE (Integrative and Comprehensive Understanding on Polar Environments), and the 16ENV02 Black Carbon project of the European Union through the European Metrology Programme for Innovation and Research (EMPIR). The research was also supported by the Academy of Finland via project NABCEA (grant no. 29664) and Academy of Finland Flagship funding (grant no. 337552). MAAP measurements at Zeppelin were funded and supported by the Swedish Environmental Protection Agency (Naturvårdsverket). Elisabeth Andrews' contribution to this effort was supported in part by the Atmospheric Radiation Measurement (ARM) user facility, a US Department of Energy (DOE) Office of Science user facility managed by the Biological and Environmental Research program.
This research has been supported by the Environmental Restoration and Conservation Agency (grant nos. JPMEERF20142003, JPMEERF20152005, JPMEERF20172003, JPMEERF20182003, JPMEERF20202003, and JPMEERF20205001), the Japan Society for the Promotion of Science (grant nos. JP12J06736, JP1604452, JP18H04143, JP19H05699, JP23221001, JP25220101, JP26241003, JP26701004, JP16H01770, JP17H04709, JP18H03363, JP19K20437, JP19K20441, and JP20H00638), the Arctic Challenge for Sustainability (ArCS) (JPMXD1300000000) and ArCS II (JPMXD1420318865), the Ministry of the Environment, Japan (MLIT1753), Horizon 2020 (grant nos. ACTRIS-2 (654109) and ERA-PLANET (689443)), the European Metrology Programme for Innovation and Research (grant no. 16ENV02), and the Academy of Finland (grant nos. 29664 and 337552).
This paper was edited by Hendrik Fuchs and reviewed by two anonymous referees.
AMAP (Arctic Monitoring and Assessment Programme): AMAP Assessment 2015: Black carbon and ozone as Arctic climate forcers, Oslo, Norway, 1–116, 2015.
Asmi, E., Backman, J., Servomaa, H., Virkkula, A., Gini, M. I., Eleftheriadis, K., Müller, T., Ohata, S., Kondo, Y., and Hyvärinen, A.: Absorption instruments inter-comparison campaign at the Arctic Pallas station, Atmos. Meas. Tech., 14, 5397–5413, https://doi.org/10.5194/amt-14-5397-2021, 2021.
Backman, J., Schmeisser, L., Virkkula, A., Ogren, J. A., Asmi, E., Starkweather, S., Sharma, S., Eleftheriadis, K., Uttal, T., Jefferson, A., Bergin, M., Makshtas, A., Tunved, P., and Fiebig, M.: On Aethalometer measurement uncertainties and an instrument correction factor for the Arctic, Atmos. Meas. Tech., 10, 5039–5062, https://doi.org/10.5194/amt-10-5039-2017, 2017.
Baumgardner, D., Popovicheva, O., Allan, J., Bernardoni, V., Cao, J., Cavalli, F., Cozic, J., Diapouli, E., Eleftheriadis, K., Genberg, P. J., Gonzalez, C., Gysel, M., John, A., Kirchstetter, T. W., Kuhlbusch, T. A. J., Laborde, M., Lack, D., Müller, T., Niessner, R., Petzold, A., Piazzalunga, A., Putaud, J. P., Schwarz, J., Sheridan, P., Subramanian, R., Swietlicki, E., Valli, G., Vecchi, R., and Viana, M.: Soot reference materials for instrument calibration and intercomparisons: A workshop summary with recommendations, Atmos. Meas. Tech., 5, 1869–1887, https://doi.org/10.5194/amt-5-1869-2012, 2012.
Bellouin, N., Quaas, J., Gryspeerdt, E., Kinne, S., Stier, P., Watson-Parris, D., Boucher, O., Carslaw, K. S., Christensen, M., Daniau, A.-L., Dufresne, J.-L., Feinglod, G., Fiedler, S., Foster, P., Gettelman, A., Haywood, J. M., Lohmann, U., Malavelle, F., Mauritsen, T., McCoy, D. T., Myhre, G., Mülmenstädt, J., Neubauer, D., Possner, A., Rugenstein, M., Sato, Y., Schulz, M., Schwartz, S. E., Sourdeval, O., Storelvmo, T., Toll, V., Winker, D., and Stevens, B.: Bounding global aerosol radiative forcing of climate change, Rev. Geophys., 58, e2019RG000660, https://doi.org/10.1029/2019RG000660, 2020.
Bergstrom, R. W.: Predictions of the spectral absorption and extinction coefficients of an urban air pollution aerosol model, Atmos. Environ., 6, 247–258, https://doi.org/10.1016/0004-6981(72)90083-2, 1972.
Bond, T. C. and Bergstrom, R. W.: Light absorption by carbonaceous particles: An investigative review, Aerosol Sci. Tech., 40, 27–67, https://doi.org/10.1080/02786820500421521, 2006.
Bond, T. C., Anderson, T. L., and Campbell, D.: Calibration and Intercomparison of Filter-Based Measurements of Visible Light Absorption by Aerosols, Aerosol Sci. Tech., 30, 582–600, https://doi.org/10.1080/027868299304435, 1999.
Bond, T. C., Habib, G., and Bergstrom, R. W.: Limitations in the enhancement of visible light absorption due to mixing state, J. Geophys. Res.-Atmos., 111, D20211, https://doi.org/10.1029/2006JD007315, 2006.
Bond, T. C., Doherty, S. J., Fahey, D. W., Forster, P. M., Berntsen, T., Deangelo, B. J., Flanner, M. G., Ghan, S., Kärcher, B., Koch, D., Kinne, S., Kondo, Y., Quinn, P. K., Sarofim, M. C., Schultz, M. G., Schulz, M., Venkataraman, C., Zhang, H., Zhang, S., Bellouin, N., Guttikunda, S. K., Hopke, P. K., Jacobson, M. Z., Kaiser, J. W., Klimont, Z., Lohmann, U., Schwarz, J. P., Shindell, D., Storelvmo, T., Warren, S. G., and Zender, C. S.: Bounding the role of black carbon in the climate system: A scientific assessment, J. Geophys. Res.-Atmos., 118, 1–173, https://doi.org/10.1002/jgrd.50171, 2013.
Cho, C., Schwarz, J. P., Perring, A. E., Lamb, K. D., Kondo, Y., Park, J., Park, D., Shim, K., Park, J., Park, R. J., Lee, M., Song, C., and Kim, S.: Science of the Total Environment Light-absorption enhancement of black carbon in the Asian out flow inferred from airborne SP2 and in-situ measurements during KORUS-AQ, Sci. Total Environ., 773, 145531, https://doi.org/10.1016/j.scitotenv.2021.145531, 2021.
Eleftheriadis, K., Vratolis, S., and Nyeki, S.: Aerosol black carbon in the European Arctic: Measurements at Zeppelin station, Ny-Ålesund, Svalbard from 1998–2007, Geophys. Res. Lett., 36, L02809, https://doi.org/10.1029/2008GL035741, 2009.
Eyring, V., Bony, S., Meehl, G. A., Senior, C. A., Stevens, B., Stouffer, R. J., and Taylor, K. E.: Overview of the Coupled Model Intercomparison Project Phase 6 (CMIP6) experimental design and organization, Geosci. Model Dev., 9, 1937–1958, https://doi.org/10.5194/gmd-9-1937-2016, 2016.
Flanner, M. G., Zender, C. S., Hess, P. G., Mahowald, N. M., Painter, T. H., Ramanathan, V., and Rasch, P. J.: Springtime warming and reduced snow cover from carbonaceous particles, Atmos. Chem. Phys., 9, 2481–2497, https://doi.org/10.5194/acp-9-2481-2009, 2009.
Gysel, M., Laborde, M., Olfert, J. S., Subramanian, R., and Gréhn, A. J.: Effective density of Aquadag and fullerene soot black carbon reference materials used for SP2 calibration, Atmos. Meas. Tech., 4, 2851–2858, https://doi.org/10.5194/amt-4-2851-2011, 2011.
Hansen, A. D. A., Rosen, H., and Novakov, T.: The aethalometer – an instrument for the real-time measurement of optical absorption by aerosol particles, Sci. Total Environ., 36, 191–196, 1984.
Huffman, D. R. and Stapp, J. L.: Optical Measurements on Solids of Possible Interstellar Importance, in: Interstellar dust and related topics, edited by: Greenberg, J. M. and Van de Hulst, H. C., Reidel, Boston, 297–301, 1973.
Hyvärinen, A. P., Kolmonen, P., Kerminen, V. M., Virkkula, A., Leskinen, A., Komppula, M., Hatakka, J., Burkhart, J., Stohl, A., Aalto, P., Kulmala, M., Lehtinen, K. E. J., Viisanen, Y., and Lihavainen, H.: Aerosol black carbon at five background measurement sites over Finland, a gateway to the Arctic, Atmos. Environ., 45, 4042–4050, https://doi.org/10.1016/j.atmosenv.2011.04.026, 2011.
Irwin, M., Kondo, Y., and Moteki, N.: An empirical correction factor for filter-based photo-absorption black carbon measurements, J. Aerosol Sci., 80, 86–97, https://doi.org/10.1016/j.jaerosci.2014.11.001, 2015.
Kanaya, Y., Taketani, F., Komazaki, Y., Liu, X., Kondo, Y., Sahu, L. K., Irie, H., and Takashima, H.: Comparison of black carbon mass concentrations observed by multi-angle absorption photometer (MAAP) and continuous soot-monitoring system (COSMOS) on Fukue Island and in Tokyo, Japan, Aerosol Sci. Tech., 47, 1–10, https://doi.org/10.1080/02786826.2012.716551, 2013.
Kanaya, Y., Pan, X., Miyakawa, T., Komazaki, Y., Taketani, F., Uno, I., and Kondo, Y.: Long-term observations of black carbon mass concentrations at Fukue Island, western Japan, during 2009–2015: constraining wet removal rates and emission strengths from East Asia, Atmos. Chem. Phys., 16, 10689–10705, https://doi.org/10.5194/acp-16-10689-2016, 2016.
Kanaya, Y., Yamaji, K., Miyakawa, T., Taketani, F., Zhu, C., Choi, Y., Komazaki, Y., Ikeda, K., Kondo, Y., and Klimont, Z.: Rapid reduction in black carbon emissions from China: Evidence from 2009-2019 observations on Fukue Island, Japan, Atmos. Chem. Phys., 20, 6339–6356, https://doi.org/10.5194/acp-20-6339-2020, 2020.
Kondo, Y.: Effects of Black Carbon on Climate: Advances in Measurement and Modeling, Monogr. Environ. Earth Planets, 3, 1–85, https://doi.org/10.5047/meep.2015.00301.0001, 2015.
Kondo, Y., Sahu, L., Kuwata, M., Miyazaki, Y., Takegawa, N., Moteki, N., Imaru, J., Han, S., Nakayama, T., Oanh, N. T. K., Hu, M., Kim, Y. J., and Kita, K.: Stabilization of the mass absorption cross section of black carbon for filter-based absorption photometry by the use of a heated inlet, Aerosol Sci. Tech., 43, 741–756, https://doi.org/10.1080/02786820902889879, 2009.
Kondo, Y., Sahu, L., Moteki, N., Khan, F., Takegawa, N., Liu, X., Koike, M., and Miyakawa, T.: Consistency and traceability of black carbon measurements made by laser-induced incandescence, thermal-optical transmittance, and filter-based photo-absorption techniques, Aerosol Sci. Tech., 45, 295–312, https://doi.org/10.1080/02786826.2010.533215, 2011.
Krecl, P., Ström, J., and Johansson, C.: Carbon content of atmospheric aerosols in a residential area during the wood combustion season in Sweden, Atmos. Environ., 41, 6974–6985, https://doi.org/10.1016/j.atmosenv.2007.06.025, 2007.
Laborde, M., Mertes, P., Zieger, P., Dommen, J., Baltensperger, U., and Gysel, M.: Sensitivity of the Single Particle Soot Photometer to different black carbon types, Atmos. Meas. Tech., 5, 1031–1043, https://doi.org/10.5194/amt-5-1031-2012, 2012.
Lack, D. A., Cappa, C. D., Covert, D. S., Baynard, T., Massoli, P., Sierau, B., Bates, T. S., Quinn, P. K., Lovejoy, E. R., and Ravishankara, A. R.: Bias in filter-based aerosol light absorption measurements due to organic aerosol loading: Evidence from ambient measurements, Aerosol. Sci. Tech., 42, 1033–1041, https://doi.org/10.1080/02786820802389277, 2008.
Lamb, K. D.: Classification of iron oxide aerosols by a single particle soot photometer using supervised machine learning, Atmos. Meas. Tech., 12, 3885–3906, https://doi.org/10.5194/amt-12-3885-2019, 2019.
Lihavainen, H., Hyvärinen, A., Asmi, E., Hatakka, J., and Viisanen, Y.: Long-term variability of aerosol optical properties in northern Finland, Boreal Env. Res., 20, 526–541, 2015.
Mason, B., Wagner, N. L., Adler, G., Andrews, E., Brock, C. A., Gordon, T. D., Lack, D. A., Perring, A. E., Richardson, M. S., Schwarz, J. P., Shook, M. A., Thornhill, K. L., Ziemba, L. D., and Murphy, D. M.: An intercomparison of aerosol absorption measurements conducted during the SEAC4RS campaign, Aerosol Sci. Tech., 52, 1012–1027, https://doi.org/10.1080/02786826.2018.1500012, 2018.
Matsui, H., Mahowald, N. M., Moteki, N., Hamilton, D. S., Ohata, S., Yoshida, A., Koike, M., Scanza, R. A., and Flanner, M. G.: Anthropogenic combustion iron as a complex climate forcer, Nat. Commun., 9, 1593, https://doi.org/10.1038/s41467-018-03997-0, 2018.
Miyakawa, T., Oshima, N., Taketani, F., Komazaki, Y., Yoshino, A., Takami, A., Kondo, Y., and Kanaya, Y.: Alteration of the size distributions and mixing states of black carbon through transport in the boundary layer in east Asia, Atmos. Chem. Phys., 17, 5851–5864, https://doi.org/10.5194/acp-17-5851-2017, 2017.
Miyazaki, Y., Kondo, Y., Sahu, L. K., Imaru, J., Fukushima, N., and Kano, M.: Performance of a newly designed continuous soot monitoring system (COSMOS), J. Environ. Monitor., 10, 1195–1201, https://doi.org/10.1039/b806957c, 2008.
Moosmüller, H., Chakrabarty, R. K., and Arnott, W. P.: Aerosol light absorption and its measurement: A review, J. Quant. Spectrosc. Ra., 110, 844–878, https://doi.org/10.1016/j.jqsrt.2009.02.035, 2009.
Moteki, N. and Kondo, Y.: Dependence of laser-induced incandescence on physical properties of black carbon aerosols: Measurements and theoretical interpretation, Aerosol Sci. Technol., 44, 663–675, https://doi.org/10.1080/02786826.2010.484450, 2010.
Moteki, N., Adachi, K., Ohata, S., Yoshida, A., Harigaya, T., Koike, M., and Kondo, Y.: Anthropogenic iron oxide aerosols enhance atmospheric heating, Nat. Commun., 8, 15329, https://doi.org/10.1038/ncomms15329, 2017.
Müller, T., Henzing, J. S., De Leeuw, G., Wiedensohler, A., Alastuey, A., Angelov, H., Bizjak, M., Collaud Coen, M., Engström, J. E., Gruening, C., Hillamo, R., Hoffer, A., Imre, K., Ivanow, P., Jennings, G., Sun, J. Y., Kalivitis, N., Karlsson, H., Komppula, M., Laj, P., Li, S. M., Lunder, C., Marinoni, A., Martins Dos Santos, S., Moerman, M., Nowak, A., Ogren, J. A., Petzold, A., Pichon, J. M., Rodriquez, S., Sharma, S., Sheridan, P. J., Teinilä, K., Tuch, T., Viana, M., Virkkula, A., Weingartner, E., Wilhelm, R., and Wang, Y. Q.: Characterization and intercomparison of aerosol absorption photometers: result of two intercomparison workshops, Atmos. Meas. Tech., 4, 245–268, https://doi.org/10.5194/amt-4-245-2011, 2011.
Ogren, J. A.: Comment on “calibration and intercomparison of filter-based measurements of visible light absorption by aerosols”, Aerosol Sci. Tech., 44, 589–591, https://doi.org/10.1080/02786826.2010.482111, 2010.
Ogren, J. A., Wendell, J., Andrews, E., and Sheridan, P. J.: Continuous light absorption photometer for long-term studies, Atmos. Meas. Tech., 10, 4805–4818, https://doi.org/10.5194/amt-10-4805-2017, 2017.
Ohata, S., Yoshida, A., Moteki, N., Adachi, K., Takahashi, Y., Kurisu, M., and Koike, M.: Abundance of Light-Absorbing Anthropogenic Iron Oxide Aerosols in the Urban Atmosphere and Their Emission Sources, J. Geophys. Res. Atmos., 123, 8115–8134, https://doi.org/10.1029/2018JD028363, 2018.
Ohata, S., Kondo, Y., Moteki, N., Mori, T., Yoshida, A., Sinha, P. R., and Koike, M.: Accuracy of black carbon measurements by a filter-based absorption photometer with a heated inlet, Aerosol Sci. Tech., 53, 1079–1091, https://doi.org/10.1080/02786826.2019.1627283, 2019.
Ohata, S., Mori, T., Kondo, Y., Sharma, S., Hyvärinen, A., Andrews, E., Tunved, P., Asmi, E., Backman, J., Servomaa, H., Veber, D., Eleftheriadis, K., Vratolis, S., Krejci, R., Zieger, P., Koike, M., Kanaya, Y., Yoshida, A., Moteki, N., Zhao, Y., Tobo, Y., Matsushita, J., and Oshima, N.: Black carbon mass concentrations and aerosol light absorption coefficents measured at Arctic sites, 1.01, Arctic Data archive System (ADS), Japan [data set], https://doi.org/10.17592/001.2020112001, 2020.
Oshima, N., Yukimoto, S., Deushi, M., Koshiro, T., Kawai, H., Tanaka, T. Y., and Yoshida, K.: Global and Arctic Radiative Forcing of Anthropogenic Gases and Aerosols in MRI-ESM2.0, Prog. Earth Planet. Sci., 7, 38, https://doi.org/10.1186/s40645-020-00348-w, 2020.
Petzold, A. and Schönlinner, M.: Multi-angle absorption photometry – A new method for the measurement of aerosol light absorption and atmospheric black carbon, J. Aerosol Sci., 35, 421–441, https://doi.org/10.1016/j.jaerosci.2003.09.005, 2004.
Petzold, A., Kramer, H., and Schönlinner, M.: Continuous measurement of atmospheric black carbon using a multi-angle absorption photometer, Environ. Sci. Pollut. R. Special Issue 4, 78–82, 2002.
Petzold, A., Schloesser, H., Sheridan, P. J., Arnott, W. P., Ogren, J. A., and Virkkula, A.: Evaluation of multiangle absorption photometry for measuring aerosol light absorption, Aerosol Sci. Tech., 39, 40–51, https://doi.org/10.1080/027868290901945, 2005.
Petzold, A., Ogren, J. A., Fiebig, M., Laj, P., Li, S. M., Baltensperger, U., Holzer-Popp, T., Kinne, S., Pappalardo, G., Sugimoto, N., Wehrli, C., Wiedensohler, A., and Zhang, X.-Y.: Recommendations for reporting black carbon measurements, Atmos. Chem. Phys., 13, 8365–8379, https://doi.org/10.5194/acp-13-8365-2013, 2013.
Pileci, R. E., Modini, R. L., Bertò, M., Yuan, J., Corbin, J. C., Marinoni, A., Henzing, B., Moerman, M. M., Putaud, J. P., Spindler, G., Wehner, B., Müller, T., Tuch, T., Trentini, A., Zanatta, M., Baltensperger, U., and Gysel-Beer, M.: Comparison of co-located refractory black carbon (rBC) and elemental carbon (EC) mass concentration measurements during field campaigns at several European sites, Atmos. Meas. Tech., 14, 1379–1403, https://doi.org/10.5194/amt-14-1379-2021, 2021.
Sand, M., Berntsen, T. K., Von Salzen, K., Flanner, M. G., Langner, J., and Victor, D. G.: Response of Arctic temperature to changes in emissions of short-lived climate forcers, Nat. Clim. Change, 6, 286–289, https://doi.org/10.1038/nclimate2880, 2016.
Schmeisser, L., Andrews, E., Ogren, J. A., Sheridan, P., Jefferson, A., Sharma, S., Kim, J. E., Sherman, J. P., Sorribas, M., Kalapov, I., Arsov, T., Angelov, C., Mayol-Bracero, O. L., Labuschagne, C., Kim, S.-W., Hoffer, A., Lin, N.-H., Chia, H.-P., Bergin, M., Sun, J., Liu, P., and Wu, H.: Classifying aerosol type using in situ surface spectral aerosol optical properties, Atmos. Chem. Phys., 17, 12097–12120, https://doi.org/10.5194/acp-17-12097-2017, 2017.
Schmeisser, L., Backman, J., Ogren, J. A., Andrews, E., Asmi, E., Starkweather, S., Uttal, T., Fiebig, M., Sharma, S., Eleftheriadis, K., Vratolis, S, Bergin, M., Tunved, P., and Jefferson, A.: Seasonality of aerosol optical properties in the Arctic, Atmos. Chem. Phys., 18, 11599–11622, https://doi.org/10.5194/acp-18-11599-2018, 2018.
Schmid, H., Laskus, L., Jürgen Abraham, H., Baltensperger, U., Lavanchy, V., Bizjak, M., Burba, P., Cachier, H., Crow, D., Chow, J., Gnauk, T., Even, A., Ten Brink, H. M., Giesen, K. P., Hitzenberger, R., Hueglin, C., Maenhaut, W., Pio, C., Carvalho, A., Putaud, J. P., Toom-Sauntry, D., and Puxbaum, H.: Results of the “carbon conference” international aerosol carbon round robin test stage I, Atmos. Environ., 35, 2111–2121, https://doi.org/10.1016/S1352-2310(00)00493-3, 2001.
Schulz, H., Zanatta, M., Bozem, H., Richard Leaitch, W., Herber, A. B., Burkart, J., Willis, M. D., Kunkel, D., Hoor, P. M., Abbatt, J. P. D., and Gerdes, R.: High Arctic aircraft measurements characterising black carbon vertical variability in spring and summer, Atmos. Chem. Phys., 19, 2361–2384, https://doi.org/10.5194/acp-19-2361-2019, 2019.
Schwarz, J. P., Gao, R. S., Fahey, D. W., Thomson, D. S., Watts, L. A., Wilson, J. C., Reeves, J. M., Darbeheshti, M., Baumgardner, D. G., Kok, G. L., Chung, S. H., Schulz, M., Hendricks, J., Lauer, A., Kärcher, B., Slowik, J. G., Rosenlof, K. H., Thompson, T. L., Langford, A. O., Loewenstein, M., and Aikin, K. C.: Single-particle measurements of midlatitude black carbon and light-scattering aerosols from the boundary layer to the lower stratosphere, J. Geophys. Res.-Atmos., 111, D16207, https://doi.org/10.1029/2006JD007076, 2006.
Sharma, S., Lavoué, D., Chachier, H., Barrie, L. A., and Gong, S. L.: Long-term trends of the black carbon concentrations in the Canadian Arctic, J. Geophys. Res., 109, D15203, https://doi.org/10.1029/2003JD004331, 2004.
Sharma, S., Andrews, E., Barrie, L. A., Ogren, J. A., and Lavoué, D.: Variations and sources of the equivalent black carbon in the high Arctic revealed by long-term observations at Alert and Barrow: 1989–2003, J. Geophys. Res., 111, D14028, https://doi.org/10.1029/2005JD006581, 2006.
Sharma, S., Leaitch, W. R., Huang, L., Veber, D., Kolonjari, F., Zhang, W., Hanna, S. J., Bertram, A. K., and Ogren, J. A.: An evaluation of three methods for measuring black carbon in Alert, Canada, Atmos. Chem. Phys., 17, 15225–15243, https://doi.org/10.5194/acp-17-15225-2017, 2017.
Sinha, P. R., Kondo, Y., Koike, M., Ogren, J. A., Jefferson, A., Barrett, T. E., Sheesley, R. J., Ohata, S., Moteki, N., Coe, H., Liu, D., Irwin, M., Tunved, P., Quinn, P. K., and Zhao, Y.: Evaluation of ground-based black carbon measurements by filter-based photometers at two Arctic sites, J. Geophys. Res.-Atmos., 122, 3544–3572. https://doi.org/10.1002/2016JD025843, 2017.
WMO/GAW: World Meteorological Organization/Global Atmosphere Watch: WMO/GAW aerosol measurement procedures, guidelines, and recommendations, GAW Report No. 227, 2016.
Yoshida, A., Moteki, N., Ohata, S., Mori, T., Tada, R., Dagsson-Waldhauserová, P., and Kondo, Y.: Detection of light-absorbing iron oxide particles using a modified single-particle soot photometer, Aerosol Sci. Tech., 50, 1–4, https://doi.org/10.1080/02786826.2016.1146402, 2016.
Yoshida, A., Ohata, S., Moteki, N., Adachi, K., Mori, T., Koike, M., and Takami, A.: Abundance and Emission Flux of the Anthropogenic Iron Oxide Aerosols From the East Asian Continental Outflow, J. Geophys. Res.-Atmos., 123, 194–11, 209, https://doi.org/10.1029/2018JD028665, 2018.
Yoshida, A., Moteki, N., Ohata, S., Mori, T., Koike, M., Kondo, Y., Matsui, H., Oshima, N., Takami, A., and Kita, K.: Abundances and Microphysical Properties of Light-Absorbing Iron Oxide and Black Carbon Aerosols Over East Asia and the Arctic, J. Geophys. Res.-Atmos., 125, e2019JD032301, https://doi.org/10.1029/2019JD032301, 2020.
Yuan, J., Modini, R. L., Zanatta, M., Herber, A. B., Müller, T., Wehner, B., Poulain, L., Tuch, T., Baltensperger, U., and Gysel-beer, M.: Variability in the mass absorption cross section of black carbon (BC) aerosols is driven by BC internal mixing state at a central European background site (Melpitz, Germany) in winter, Atmos. Chem. Phys., 21, 635–655, https://doi.org/10.5194/acp-21-635-2021, 2021.
Zanatta, M., Gysel, M., Bukowiecki, N., Müller, T., Weingartner, E., Areskoug, H., Fiebig, M., Yttri, K. E., Mihalopoulos, N., Kouvarakis, G., Beddows, D., Harrison, R. M., Cavalli, F., Putaud, J. P., Spindler, G., Wiedensohler, A., Alastuey, A., Pandolfi, M., Sellegri, K., Swietlicki, E., Jaffrezo, J. L., Baltensperger, U., and Laj, P.: A European aerosol phenomenology-5: Climatology of black carbon optical properties at 9 regional background sites across Europe, Atmos. Environ., 145, 346–364, https://doi.org/10.1016/j.atmosenv.2016.09.035, 2016.
Zanatta, M., Laj, P., Gysel, M., Baltensperger, U., Vratolis, S., Eleftheriadis, K., Kondo, Y., Dubuisson, P., Winiarek, V., Kazadzis, S., Tunved, P., and Jacobi, H.-W.: Effects of mixing state on optical and radiative properties of black carbon in the European Arctic, Atmos. Chem. Phys., 18, 14037–14057, https://doi.org/10.5194/acp-18-14037-2018, 2018.